The Evaluation of Steady Red Stop Line Lights – Los … REPORT The Evaluation of Steady Red Stop...
14
INTERIM REPORT The Evaluation of Steady Red Stop Line Lights – Los Angeles (Official Ruling Number 4-341 (E)) Submitted to: Federal Highway Administration and California Traffic Control Device Committee Submitted by: City of Los Angeles Department of Transportation (LADOT) and Los Angeles County Metropolitan Transportation Authority (Metro) April 8, 2011
Transcript of The Evaluation of Steady Red Stop Line Lights – Los … REPORT The Evaluation of Steady Red Stop...

INTERIM REPORT
The Evaluation of Steady Red Stop Line Lights –
Los Angeles (Official Ruling Number 4-341 (E))
Submitted to: Federal Highway Administration and California Traffic Control Device Committee Submitted by: City of Los Angeles Department of Transportation (LADOT) and Los Angeles County Metropolitan Transportation Authority (Metro) April 8, 2011
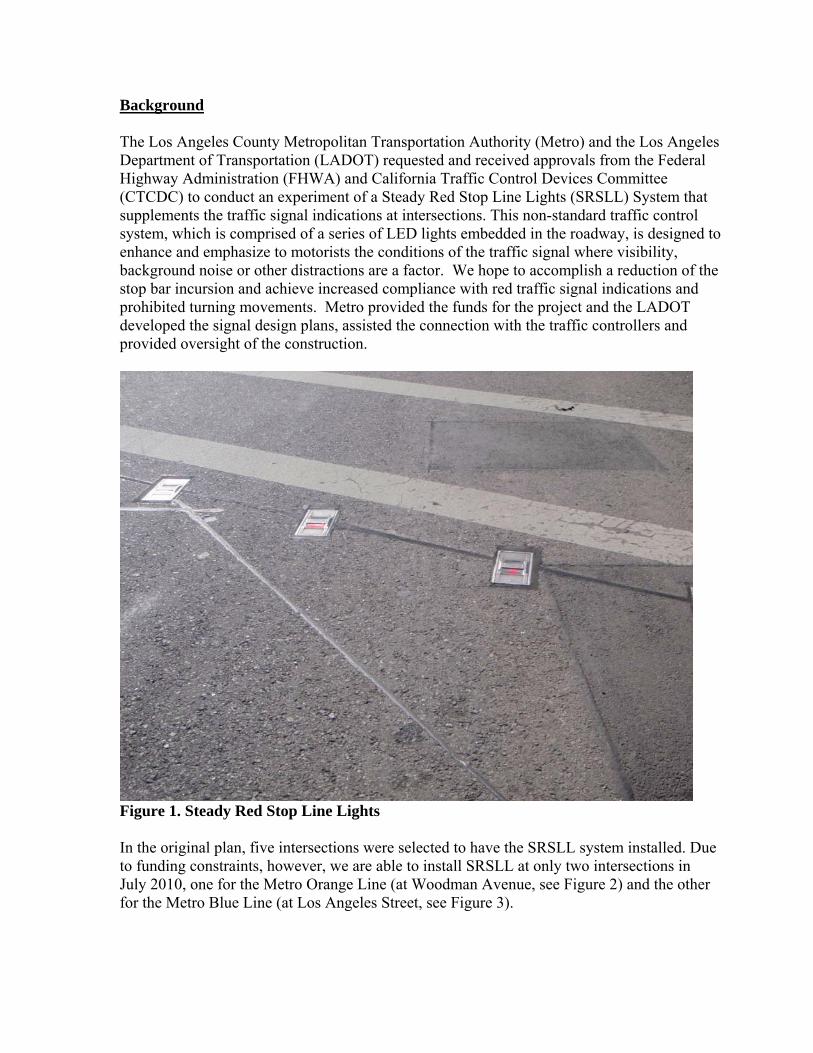
Background The Los Angeles County Metropolitan Transportation Authority (Metro) and the Los Angeles Department of Transportation (LADOT) requested and received approvals from the Federal Highway Administration (FHWA) and California Traffic Control Devices Committee (CTCDC) to conduct an experiment of a Steady Red Stop Line Lights (SRSLL) System that supplements the traffic signal indications at intersections. This non-standard traffic control system, which is comprised of a series of LED lights embedded in the roadway, is designed to enhance and emphasize to motorists the conditions of the traffic signal where visibility, background noise or other distractions are a factor. We hope to accomplish a reduction of the stop bar incursion and achieve increased compliance with red traffic signal indications and prohibited turning movements. Metro provided the funds for the project and the LADOT developed the signal design plans, assisted the connection with the traffic controllers and provided oversight of the construction.
Figure 1. Steady Red Stop Line Lights In the original plan, five intersections were selected to have the SRSLL system installed. Due to funding constraints, however, we are able to install SRSLL at only two intersections in July 2010, one for the Metro Orange Line (at Woodman Avenue, see Figure 2) and the other for the Metro Blue Line (at Los Angeles Street, see Figure 3).
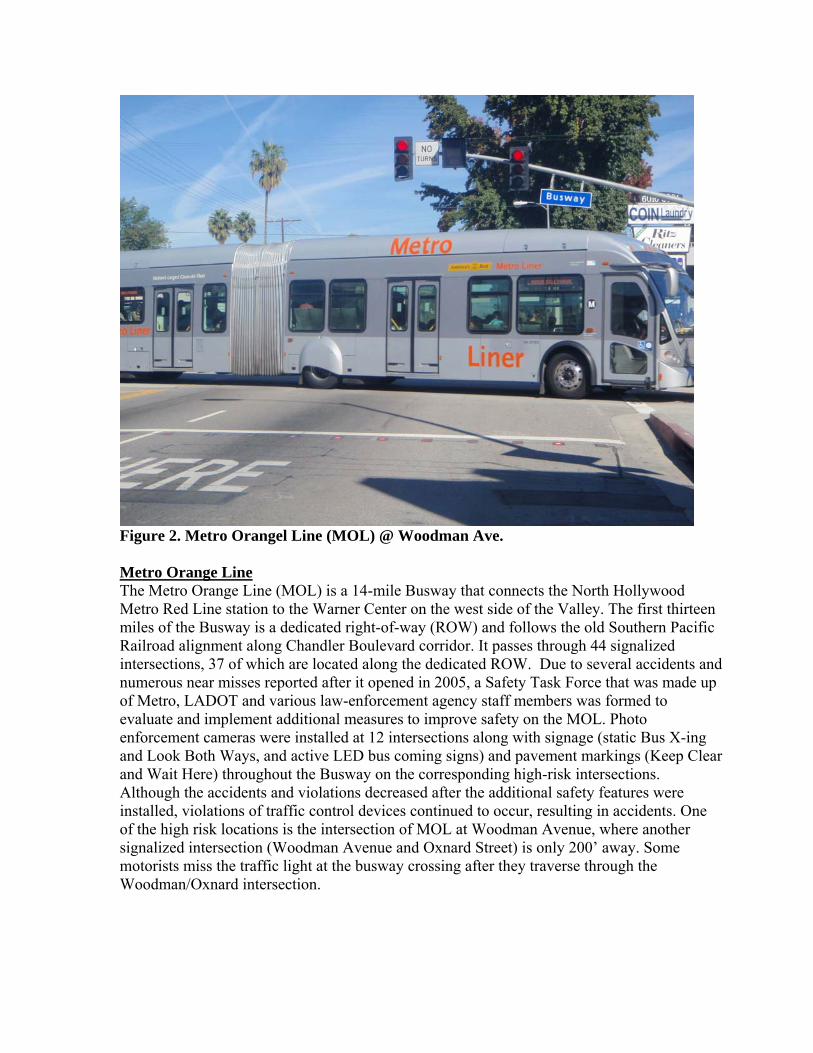
Figure 2. Metro Orangel Line (MOL) @ Woodman Ave. Metro Orange Line The Metro Orange Line (MOL) is a 14-mile Busway that connects the North Hollywood Metro Red Line station to the Warner Center on the west side of the Valley. The first thirteen miles of the Busway is a dedicated right-of-way (ROW) and follows the old Southern Pacific Railroad alignment along Chandler Boulevard corridor. It passes through 44 signalized intersections, 37 of which are located along the dedicated ROW. Due to several accidents and numerous near misses reported after it opened in 2005, a Safety Task Force that was made up of Metro, LADOT and various law-enforcement agency staff members was formed to evaluate and implement additional measures to improve safety on the MOL. Photo enforcement cameras were installed at 12 intersections along with signage (static Bus X-ing and Look Both Ways, and active LED bus coming signs) and pavement markings (Keep Clear and Wait Here) throughout the Busway on the corresponding high-risk intersections. Although the accidents and violations decreased after the additional safety features were installed, violations of traffic control devices continued to occur, resulting in accidents. One of the high risk locations is the intersection of MOL at Woodman Avenue, where another signalized intersection (Woodman Avenue and Oxnard Street) is only 200’ away. Some motorists miss the traffic light at the busway crossing after they traverse through the Woodman/Oxnard intersection.
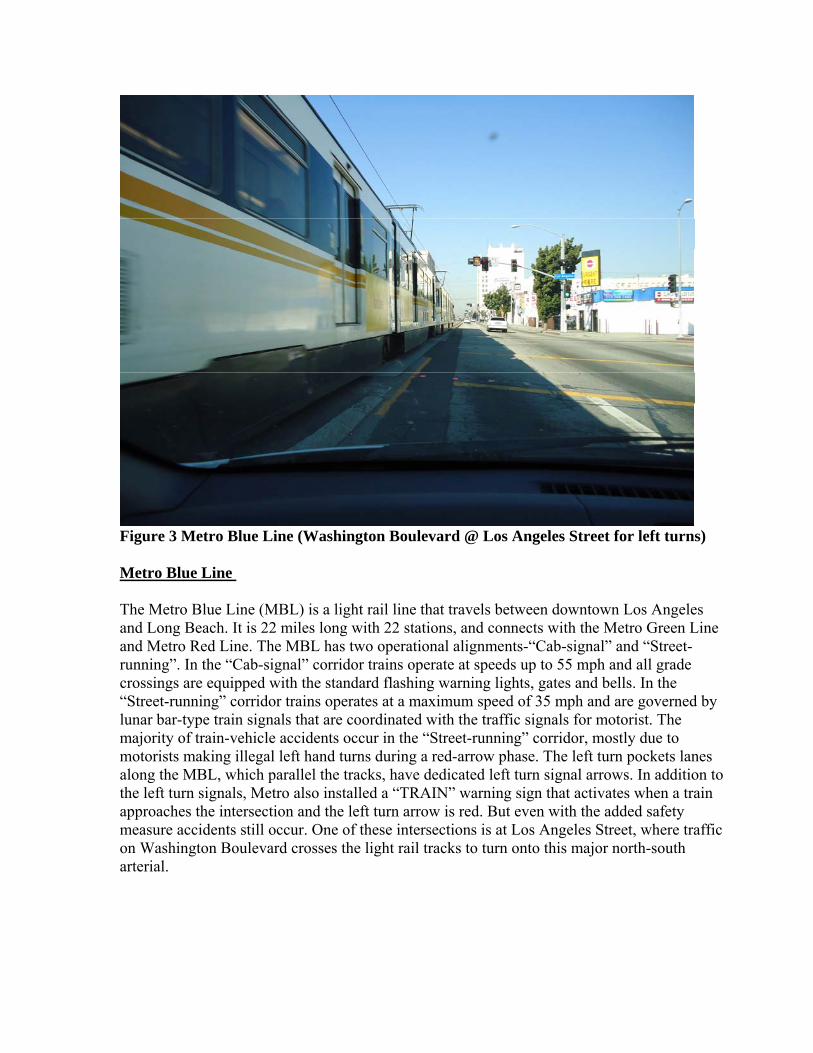
Figure 3 Metro Blue Line (Washington Boulevard @ Los Angeles Street for left turns) Metro Blue Line The Metro Blue Line (MBL) is a light rail line that travels between downtown Los Angeles and Long Beach. It is 22 miles long with 22 stations, and connects with the Metro Green Line and Metro Red Line. The MBL has two operational alignments-“Cab-signal” and “Street-running”. In the “Cab-signal” corridor trains operate at speeds up to 55 mph and all grade crossings are equipped with the standard flashing warning lights, gates and bells. In the “Street-running” corridor trains operates at a maximum speed of 35 mph and are governed by lunar bar-type train signals that are coordinated with the traffic signals for motorist. The majority of train-vehicle accidents occur in the “Street-running” corridor, mostly due to motorists making illegal left hand turns during a red-arrow phase. The left turn pockets lanes along the MBL, which parallel the tracks, have dedicated left turn signal arrows. In addition to the left turn signals, Metro also installed a “TRAIN” warning sign that activates when a train approaches the intersection and the left turn arrow is red. But even with the added safety measure accidents still occur. One of these intersections is at Los Angeles Street, where traffic on Washington Boulevard crosses the light rail tracks to turn onto this major north-south arterial.

Installation The Steady Red Stop Line Lights have been installed at the two intersections previously mentioned and shown in Figure #2 and #3. On MOL at Woodman Avenue, there are 15 LED lights for northbound direction and 16 LED lights for southbound direction installed near the stop lines spanning from the curb to the median with a 2’ spacing. On the MBL at Washington Boulevard @Los Angeles Street, five LED lights for both eastbound and westbound left turn pockets were installed slightly behind the limit line with a 2’ spacing and face the approaching left turn motorists. During the red phases the lights turn a steady red color and turn dark during the green and yellow phases. The installation was completed by June 30, 2010. It was replaced in January 2011 because couple of the lights malfunctioned. Methodology “Before” and “After” data was collected to evaluate the benefits of the SRSLL device. It was determined that Metro’s Photo Red Light Enforcement Cameras was the most effective way to collect the violation data and measure the effectiveness of the SRSLL. The before data was collected for one year between June 2009 and May 2010, while the after data was collected for a 5- month period from August 2010- December 2010 since the experiment has not been in service for the 12 month duration. The final report will incorporate 12 months. This interim report only includes 5 months. Other than the two test intersections, we also collected data during the same time frames for two comparable “control intersections”, where no experimental devices were installed. Tables 1 through 4 are month-to-month violation data and monthly traffic volumes for two test intersections and two control intersections. Table 5 is a summary of violation rates for the “Before” and “After” data.
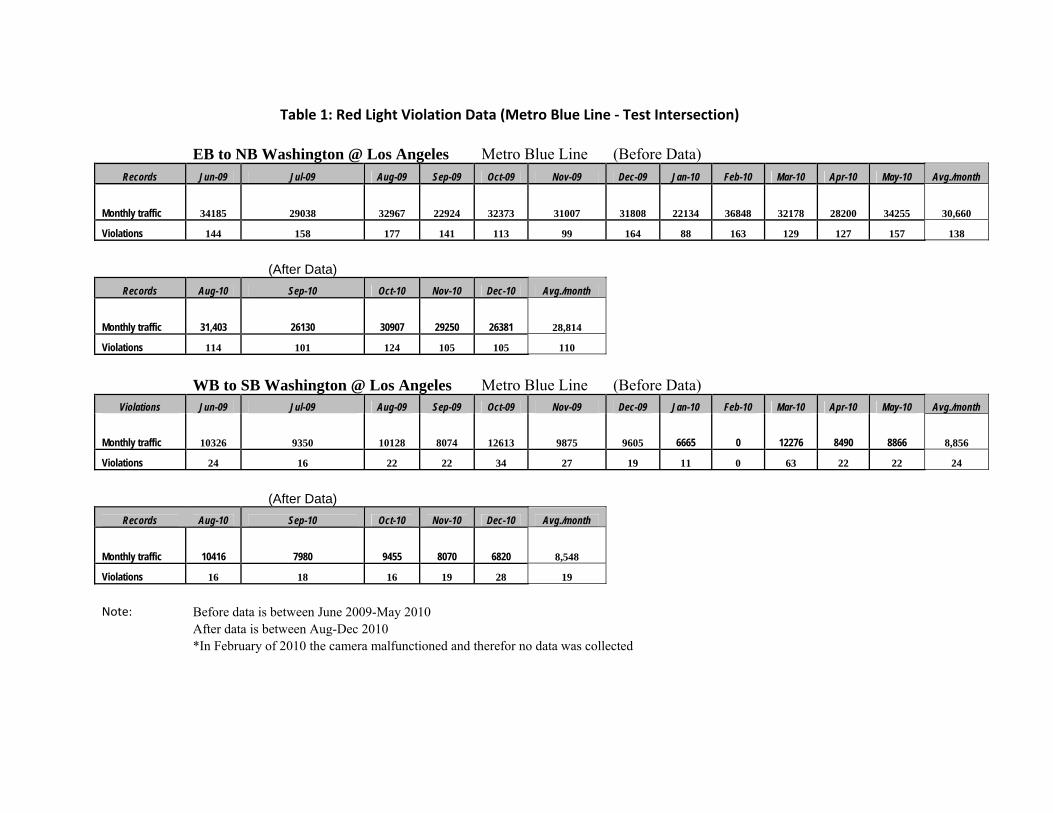
Table 1: Red Light Violation Data (Metro Blue Line ‐ Test Intersection)
EB to NB Washington @ Los Angeles Metro Blue Line (Before Data)
Records Jun-09 Jul-09 Aug-09 Sep-09 Oct-09 Nov-09 Dec-09 Jan-10 Feb-10 Mar-10 Apr-10 May-10 Avg./month
Monthly traffic 34185 29038 32967 22924 32373 31007 31808 22134 36848 32178 28200 34255 30,660
Violations 144 158 177 141 113 99 164 88 163 129 127 157 138
(After Data) Records Aug-10 Sep-10 Oct-10 Nov-10 Dec-10 Avg./month
Monthly traffic 31,403 26130 30907 29250 26381 28,814 Violations 114 101 124 105 105 110 WB to SB Washington @ Los Angeles Metro Blue Line (Before Data)
Violations Jun-09 Jul-09 Aug-09 Sep-09 Oct-09 Nov-09 Dec-09 Jan-10 Feb-10 Mar-10 Apr-10 May-10 Avg./month
Monthly traffic 10326 9350 10128 8074 12613 9875 9605 6665 0 12276 8490 8866 8,856
Violations 24 16 22 22 34 27 19 11 0 63 22 22 24
(After Data)
Records Aug-10 Sep-10 Oct-10 Nov-10 Dec-10 Avg./month
Monthly traffic 10416 7980 9455 8070 6820 8,548 Violations 16 18 16 19 28 19 Note: Before data is between June 2009-May 2010 After data is between Aug-Dec 2010 *In February of 2010 the camera malfunctioned and therefor no data was collected
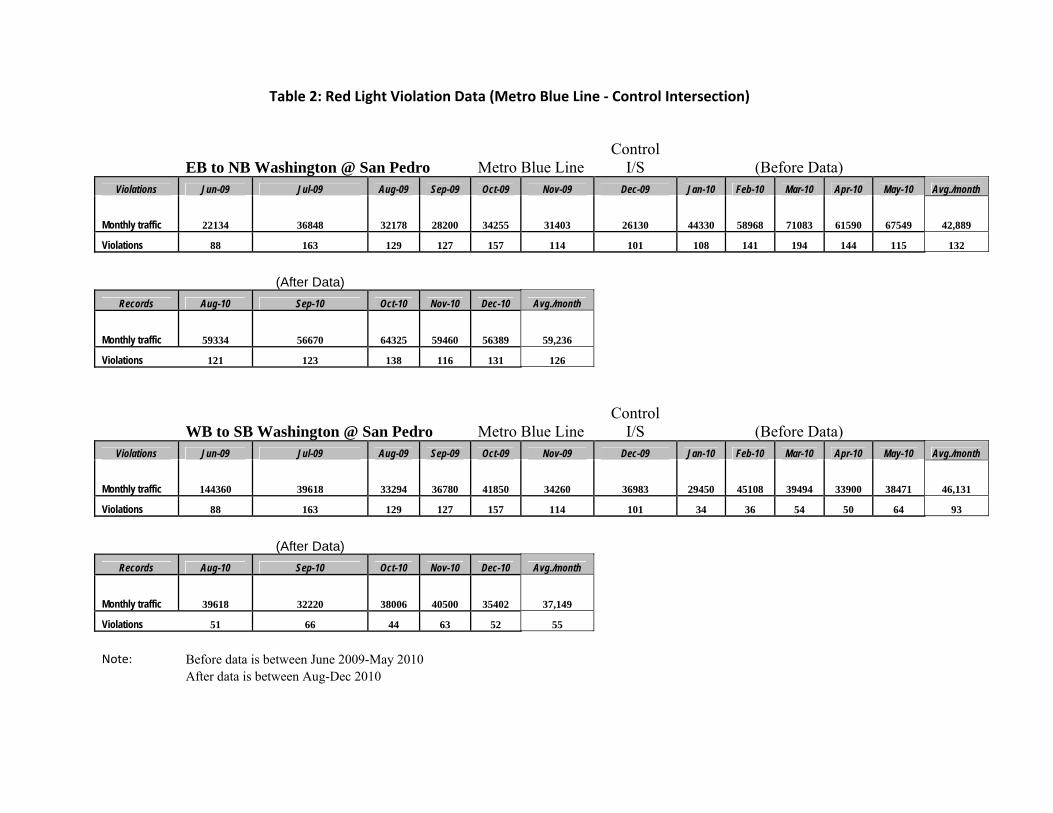
Table 2: Red Light Violation Data (Metro Blue Line ‐ Control Intersection)
EB to NB Washington @ San Pedro Metro Blue Line Control
I/S (Before Data)
Violations Jun-09 Jul-09 Aug-09 Sep-09 Oct-09 Nov-09 Dec-09 Jan-10 Feb-10 Mar-10 Apr-10 May-10 Avg./month
Monthly traffic 22134 36848 32178 28200 34255 31403 26130 44330 58968 71083 61590 67549 42,889
Violations 88 163 129 127 157 114 101 108 141 194 144 115 132
(After Data) Records Aug-10 Sep-10 Oct-10 Nov-10 Dec-10 Avg./month
Monthly traffic 59334 56670 64325 59460 56389 59,236 Violations 121 123 138 116 131 126
WB to SB Washington @ San Pedro Metro Blue Line Control
I/S (Before Data)
Violations Jun-09 Jul-09 Aug-09 Sep-09 Oct-09 Nov-09 Dec-09 Jan-10 Feb-10 Mar-10 Apr-10 May-10 Avg./month
Monthly traffic 144360 39618 33294 36780 41850 34260 36983 29450 45108 39494 33900 38471 46,131
Violations 88 163 129 127 157 114 101 34 36 54 50 64 93
(After Data) Records Aug-10 Sep-10 Oct-10 Nov-10 Dec-10 Avg./month
Monthly traffic 39618 32220 38006 40500 35402 37,149 Violations 51 66 44 63 52 55
Note: Before data is between June 2009-May 2010
After data is between Aug-Dec 2010
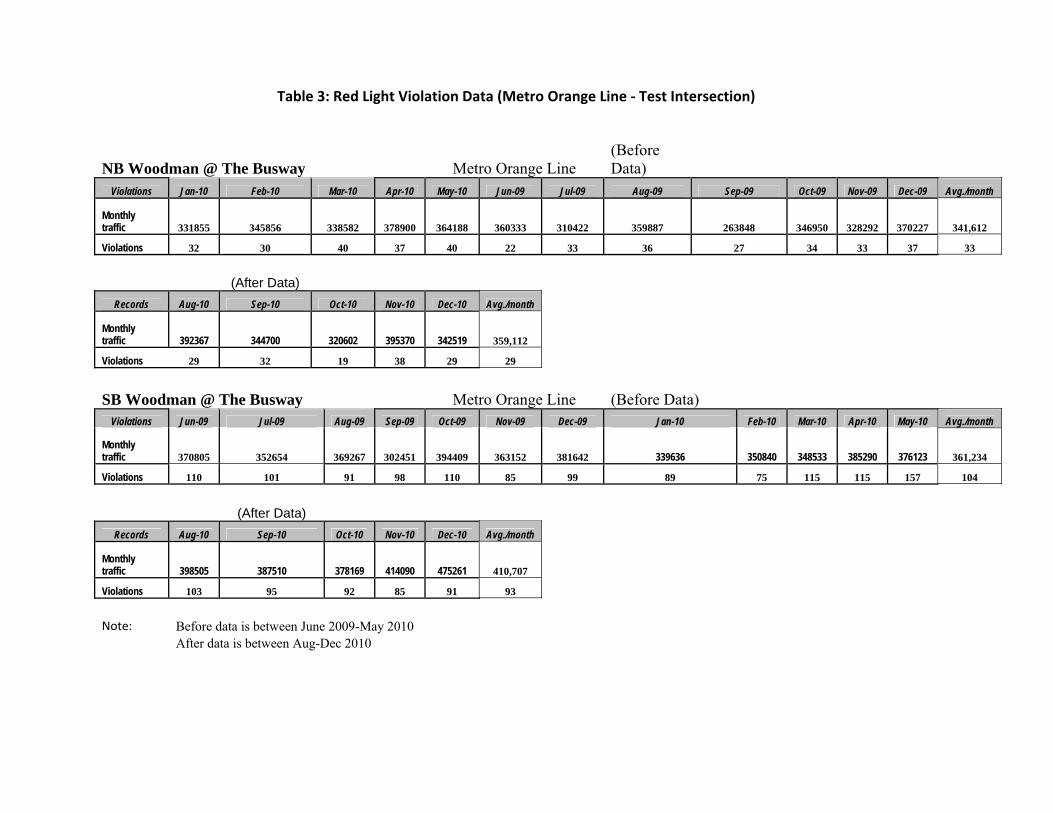
Table 3: Red Light Violation Data (Metro Orange Line ‐ Test Intersection)
NB Woodman @ The Busway Metro Orange Line (Before Data)
Violations Jan-10 Feb-10 Mar-10 Apr-10 May-10 Jun-09 Jul-09 Aug-09 Sep-09 Oct-09 Nov-09 Dec-09 Avg./month
Monthly traffic 331855 345856 338582 378900 364188 360333 310422 359887 263848 346950 328292 370227 341,612
Violations 32 30 40 37 40 22 33 36 27 34 33 37 33
(After Data)
Records Aug-10 Sep-10 Oct-10 Nov-10 Dec-10 Avg./month
Monthly traffic 392367 344700 320602 395370 342519 359,112 Violations 29 32 19 38 29 29 SB Woodman @ The Busway Metro Orange Line (Before Data)
Violations Jun-09 Jul-09 Aug-09 Sep-09 Oct-09 Nov-09 Dec-09 Jan-10 Feb-10 Mar-10 Apr-10 May-10 Avg./month
Monthly traffic 370805 352654 369267 302451 394409 363152 381642 339636 350840 348533 385290 376123 361,234
Violations 110 101 91 98 110 85 99 89 75 115 115 157 104
(After Data)
Records Aug-10 Sep-10 Oct-10 Nov-10 Dec-10 Avg./month
Monthly traffic 398505 387510 378169 414090 475261 410,707 Violations 103 95 92 85 91 93 Note: Before data is between June 2009-May 2010 After data is between Aug-Dec 2010

Table 4: Red Light Violation Data (Metro Orange Line ‐Control Intersection)
EB Oxnard @ The Busway Metro Orange Line Control
I/S (Before Data) Violations Jun-09 Jul-09 Aug-09 Sep-09 Oct-09 Nov-09 Dec-09 Jan-10 Feb-10 Mar-10 Apr-10 May-10 Avg./month
Monthly traffic 297183 274406 272446 234668 330424 302374 305188 268088 287392 284704 314070 312294 290,270
Violations 34 37 38 46 45 31 36 34 34 34 26 39 36
(After Data)
Records Aug-10 Sep-10 Oct-10 Nov-10 Dec-10 Avg./month
Monthly traffic 303769 283410 314557 329250 285417 303,281 Violations 43 45 41 37 40 41
WB Oxnard @ The Busway Metro Orange Line Control
I/S (Before Data) Violations Jun-09 Jul-09 Aug-09 Sep-09 Oct-09 Nov-09 Dec-09 Jan-10 Feb-10 Mar-10 Apr-10 May-10 Avg./month
Monthly traffic 308494 292284 304993 258306 321744 295376 306282 272707 299824 296329 320550 327391 300,357
Violations 42 62 55 54 56 65 36 39 47 48 50 44 50
(After Data)
Records Aug-10 Sep-10 Oct-10 Nov-10 Dec-10 Avg./month
Monthly traffic 319083 329970 318122 337860 293322 319,671 Violations 42 42 45 41 30 40
Note: Before data is between June 2009-May 2010 After data is between Aug-Dec 2010

Table 5: Summary of Violation Rate Test Intersections with Steady Red Stop Line Lights
Before After
# of # of Violation Rate # of # of Violation Rate Difference
Violations Vehicles /1000 veh Violations Vehicles /1000 veh Percent EB to NB Washington @ Los Angeles 1660 367,917 4.51 549 144,071 3.81 -16% WB to SB Washington @ Los Angeles 282 106,268 2.65 97 42,741 2.27 -14%
Intersection total 1942 474,185 4.095 646 186,812 3.458 Avg: -15.6% NB Woodman @ Busway 401 4,099,340 0.10 147 1,795,558 0.08 -16% SB Woodman @ Busway 1245 4,334,802 0.29 466 2,053,535 0.23 -21%
Intersection total 1646 8,434,142 0.195 613 3,849,093 0.159 Avg: -18.40%
Control Intersections with no Steady Red Stop Line Lights
Before After
# of # of Violation Rate # of # of Violation Rate Difference
Violations Vehicles /1000 veh Violations Vehicles /1000 veh Percent EB to NB Washington @ San Pedro 1581 514,668 3.07 629 296,178 2.12 -31% WB to SB Washington @ San Pedro 1117 553,568 2.02 276 185,746 1.49 -26%
Intersection total 2698 1,068,236 2.525 905 481,924 1.878 Avg: -28.5% EB Oxnard @ Busway 434 3,483,237 0.12 206 1,516,403 0.14 9%
WB Oxnard @ Busway 598 3,604,280 0.17 200 1,598,357 0.13 -25%
Intersection total 1,032 7,087,517 0.146 406 3,114,760 0.130 Avg: -10.5% Note: Before data is between June 2009-May 2010 After data is between Aug-Dec 2010
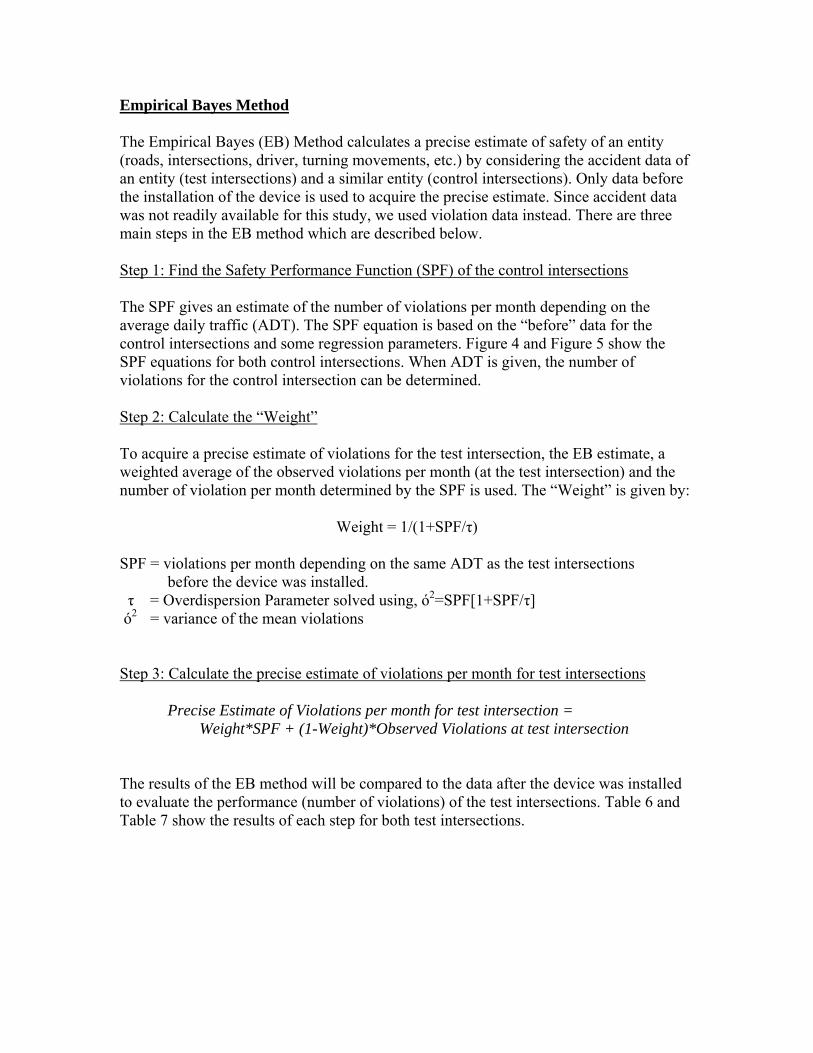
Empirical Bayes Method The Empirical Bayes (EB) Method calculates a precise estimate of safety of an entity (roads, intersections, driver, turning movements, etc.) by considering the accident data of an entity (test intersections) and a similar entity (control intersections). Only data before the installation of the device is used to acquire the precise estimate. Since accident data was not readily available for this study, we used violation data instead. There are three main steps in the EB method which are described below. Step 1: Find the Safety Performance Function (SPF) of the control intersections The SPF gives an estimate of the number of violations per month depending on the average daily traffic (ADT). The SPF equation is based on the “before” data for the control intersections and some regression parameters. Figure 4 and Figure 5 show the SPF equations for both control intersections. When ADT is given, the number of violations for the control intersection can be determined. Step 2: Calculate the “Weight” To acquire a precise estimate of violations for the test intersection, the EB estimate, a weighted average of the observed violations per month (at the test intersection) and the number of violation per month determined by the SPF is used. The “Weight” is given by:
Weight = 1/(1+SPF/τ) SPF = violations per month depending on the same ADT as the test intersections before the device was installed. τ = Overdispersion Parameter solved using, ό2=SPF[1+SPF/τ] ό2 = variance of the mean violations Step 3: Calculate the precise estimate of violations per month for test intersections
Precise Estimate of Violations per month for test intersection = Weight*SPF + (1-Weight)*Observed Violations at test intersection
The results of the EB method will be compared to the data after the device was installed to evaluate the performance (number of violations) of the test intersections. Table 6 and Table 7 show the results of each step for both test intersections.

x = average daily traffic (ADT) y = violations per month
Figure 4 - SPF for Washington Blvd. @ San Pedro St.
Figure 5 - SPF for Oxnard St. @ Busway

Table 6 - Before and After Results - Metro Blue Line
Washington Blvd. @ Los Angeles St. Violations Before (Jun 2009 – May 2010)
Average over 12 months ADT 1299 Observed violations per month without device 162 SPF (San Pedro, x = 1299) 93 Weight .049Overdispersion 4.8
Precise estimate of violations per month without device 158
STD ±12
Washington Blvd. @ Los Angeles St. Violations
After (Aug 2010 – Dec 2010)
Average over 5 months ADT 1221 Observed violations per month without device 126
Table 7 - Before and After Results - Metro Orange Line
Woodman Ave. @ Busway Violations Before (Jun 2009 – May 2010)
12 month Total Avg. ADT 23119 Observed violations per month without device 137 SPF (Oxnard, x=23119) 92 Weight 0.492 Overdispersion 89.1 Precise estimate of violations per month without device 115 STD ±8
Woodman Ave. @ Busway Violations After
(Aug 2010 – Dec 2010) Average over 5 months ADT 25160Observed violations per month with device 121
*ADT: Average Daily Traffic STD: Standard Deviation

6-Month Interim Results We collected one full year’s data for the before study, but the post-installation data is only available for 5 months because of insufficient time has elapsed after the SRSSL was installed in July 2010. The final report, which will be provided once we have at least 12 months of post-installation data, will have a full analysis to reach a conclusion as to the effectiveness of the devices. With the limited after data, it appears that the installation of the SRSSL across the stop lines and left turn pockets at two different intersections has resulted in positive improvements in the red light violation rates outlined for the test intersections. As shown in Table 5, the instances of vehicles running red lights have been significantly reduced from a rate of 4.095 violations per 1000 vehicles to 3.458 violations per 1,000 vehicles after the installation of the device at Washington Boulevard at Los Angeles Street, reflecting a 15.6% reduction in violation rate. The second location of Woodman and Busway also shows a 18.4% reduction in violation rate. Other locations also show a reduction of violation rates ranging from 14% to 21%. However, the two control intersections without the Steady Red Stop Line Lights also show similar improvements in terms of reduction of violation rates. Further investigation is needed to study the correlation between test intersections and control intersections. It should be noted that toward the end of the 2010, some of the LED lights were non-operational due to equipment malfunction. The reduction in violation rate could have been higher if all the LED lights were fully functional. In January of 2011, at the request of LADOT, the contractor replaced the LED lights with newer and more durable lights.
The Empirical Bayes Method was applied to develop a more precise estimate of the expected violations on the two test intersections (depending on ADT). The result of the EB Method is then compared to the observed violations after the device was installed, as shown in Table 6.
On Washington Blvd at Los Angeles, the observed violation 5 months after the device was installed is 126 vpm (violations per month), lower than the expected violation of 158 ±12 vpm determined by Empirical Bayes Method. This shows improvement in the expected amount of violations after the installation of the SRSSL.
On Woodman Ave at Busway, the observed violation 5 months after the device was installed is 121 vpm. The expected violation is calculated as 115±8 vpm. When comparing these two sets of data, it is inconclusive as whether this test intersection shows any improvements based on the Empirical Bayes Method.