THE EUROPEAN FAR-INFRARED SPACE ROADMAP
88
1 THE EUROPEAN FAR-INFRARED SPACE ROADMAP
Transcript of THE EUROPEAN FAR-INFRARED SPACE ROADMAP
1
THE EUROPEAN FAR-INFRARED SPACE ROADMAP

2
TheEuropeanFar-InfraredSpaceRoadmapwaspreparedbyD.Rigopoulou&F.Helmich(chairs)withcontributionsfrom:L.Hunt,J.Goicoechea,P.Hartogh,D.Fedele,M.Matsuura,L.Spinoglio,D.Elbaz,M.Griffin,G.L.Pilbratt,E.Chapillon
Frontpage:Urania,themuseofAstronomy(JeanRoux–1730) InGreekmythology,Urania(Greek:Ourania"Heavenly"of Ouranos,"Heaven")wastheMusewhopresidedoverAstronomyandGeometry.Urania is holding a globe with the constellations and a compass for hermeasurements.

3
1 Executivesummary
(Rosetta Nebula: ESA/PACS&SPIRE/HOBYS KeyProgram)Today we can see the effects of dust in our Galaxy through dark patches obscuring thestarlight in the night sky. Indeed, ultraviolet (UV) and optical light are absorbed andscattered by dust grains, while the mid-infrared (MIR) and far-infrared (FIR) spectralregimes capture dust emission because of the relatively low grain temperature, 20-60 K.Such emission is important within our Solar System, in proto-planetary disks where webelieveplanetary systems likeourownare forming, and throughout thediskof theMilkyWay.Because of the copious amounts of dust present, itisvirtuallyimpossibletostudythedetailsofhowstarsandplanetsformatUVoropticalwavelengths;itmustbedoneintheFIR.Space-borne observatories are necessary to probe the complete FIR regime. Previousmissions(IRAS,ISO,Spitzer,AKARI,Herschel,Planck)haveconvincinglyshownthatmostofthe star formation in the universe is enshrouded in dust. Over cosmic time, since the BigBang,halfoftheintegratedenergyandmostofthephotonsemergeintheFIR.Thus,tostudyprocessesrangingfromtheformationofplanetstostarformationinourGalaxyandindistantgalaxies,accesstotheFIRwavelengthregimeiscrucial.Theprocessofstarformationandthebuild-upofgalaxiesare intimately linked to theexchangeofenergywithin the ISM;gas isheatedbydiffusebackgroundradiation,stars,cosmicraysandshockswhichsubsequentlycoolsdownthroughradiativeprocesses.This“ISMenergycycle”maintainsordisruptsthestellar environment, thus enhancing or quenching star formation through “feedback”mechanisms.ThemaincoolantsoftheISMarevisibleonlyintheFIR.Thisdocumentdescribesfundamental,yetstillunresolved,astrophysicalquestionsthatcanonly be answered through a FIR spacemission, and gives an overview of the technologyrequiredtoanswerthem:essentiallya“roadmap”.Thesequeriesregard:
We live in a highly dynamic Universe. Smalldensity fluctuations after the Big Bang grewinto larger gravitational potential wells.Withinthewellsdarkmatterdecoupled fromgaseous matter, the latter condensed andformedthefirststarsandgalaxies.Thesefirstgalaxies transformed rapidly accreting gasand matter from the cosmic web. As timewent on the primordial pristine gas waspollutedwithheavymetals(elementsheavierthan hydrogen, helium and lithium)originating in stellar nucleosynthesis andejected into the interstellar gas at the end ofthe stellar cycle. The role of the interstellargas ispivotalas itprovidesboththematerialto form stars andmaintains the fossil recordofstarformationactivityintheformofmetalenrichment. These metals became locked upindustgrains,createdthroughcondensationsinthewindsofevolvedstarsandsupernovae(SNe)ejecta.
4
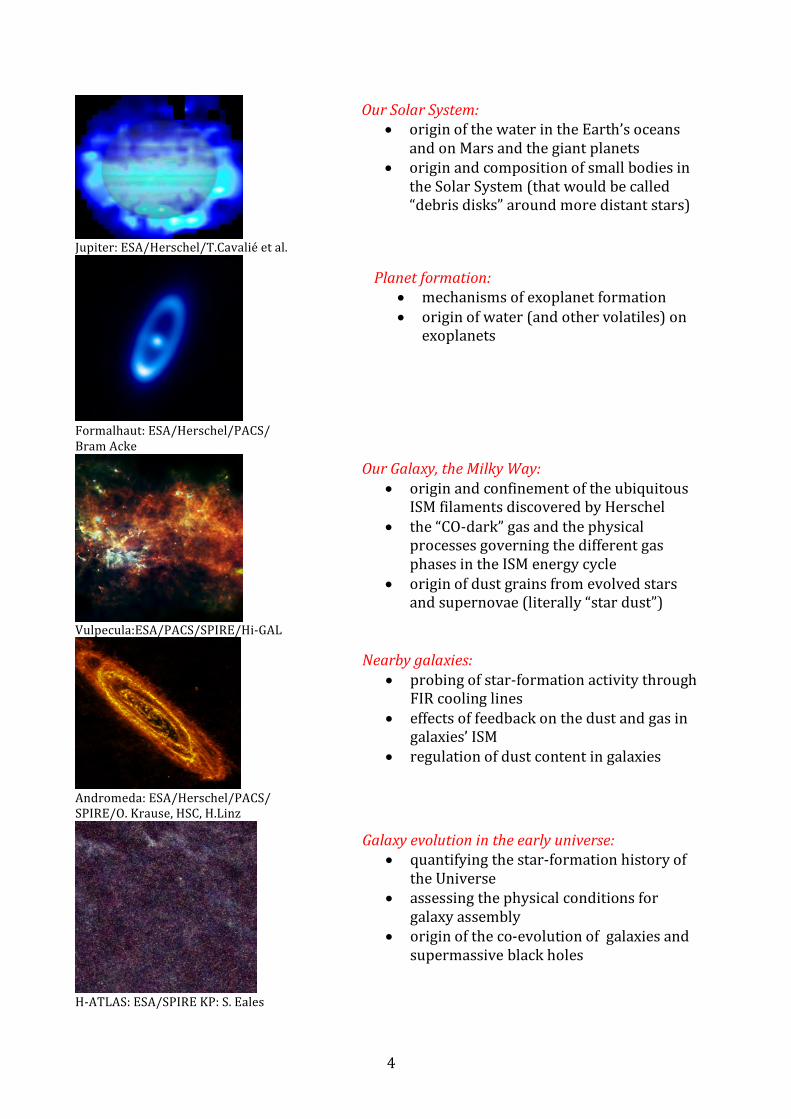
Jupiter:ESA/Herschel/T.Cavaliéetal.
Formalhaut:ESA/Herschel/PACS/BramAcke
Vulpecula:ESA/PACS/SPIRE/Hi-GAL
Andromeda:ESA/Herschel/PACS/SPIRE/O.Krause,HSC,H.Linz
H-ATLAS:ESA/SPIREKP:S.Eales
OurSolarSystem:• originofthewaterintheEarth’soceans
andonMarsandthegiantplanets• originandcompositionofsmallbodiesin
theSolarSystem(thatwouldbecalled“debrisdisks”aroundmoredistantstars)
Planetformation:• mechanismsofexoplanetformation• originofwater(andothervolatiles)on
exoplanets
OurGalaxy,theMilkyWay:• originandconfinementoftheubiquitous
ISMfilamentsdiscoveredbyHerschel• the“CO-dark”gasandthephysical
processesgoverningthedifferentgasphasesintheISMenergycycle
• originofdustgrainsfromevolvedstarsandsupernovae(literally“stardust”)
Nearbygalaxies:• probingofstar-formationactivitythrough
FIRcoolinglines• effectsoffeedbackonthedustandgasin
galaxies’ISM• regulationofdustcontentingalaxies
Galaxyevolutionintheearlyuniverse:• quantifyingthestar-formationhistoryof
theUniverse• assessingthephysicalconditionsfor
galaxyassembly• originoftheco-evolutionofgalaxiesand
supermassiveblackholes

5
ThequestionsareintimatelyrelatedtothreeofthefourgiveninESA’sCosmicVision2015-2025:
1. whataretheconditionsforplanetformationandtheemergenceoflife?2. howdoestheSolarSystemwork?3. whatarethefundamentalphysicallawsoftheUniverse?4. howdidtheUniverseoriginateandwhatisitmadeof?
Fortwoofthem(1.conditionsforplanetformationand4.theoriginoftheUniverse)aFar-InfraredObservatoryislistedexplicitlyasaCandidateProject.WebelievethatevenfortheSolarSystem(forwhichaFIRObservatoryisnotconsideredasaCandidateProject),aFIRspace mission would provide unique answers to the questions posed, because they aredirectly applicable to the workings of the Solar System especially in the context ofexoplanetsandplanetarysystems.Also described in this document are various options for a FIR Observatory, including aconsiderationoftheimportanceofangularresolutionandspectroscopiccapabilities.Large,but light,singlemirrorsarecontrastedagainst interferometricconcepts.Spectroscopyandimaging provide complementary views of the astrophysical processes under scrutiny, andwediscussthesometimesmutuallyexclusiveapproachesrequiredfortheirimplementation.PreviousFIRmissionshavealreadydemonstratedanimpressivetrackrecordandopenedaneweraofastronomy.ThediscoverywithIRASofanewclassofgalaxies,theIRluminousand ultra-luminous galaxies; ISO’s detailed characterization of the emission of smallinterstellardust grains (PolycyclicAromaticHydrocarbons); the resolution into individualgalaxiesofthecosmicIRbackgroundbySpitzerandHerschel;thediscoverywithHerscheloftenuous pc-wide filaments within which clouds condense to form stars, the discovery ofcopious amounts ofwater in the Universe have revolutionized our understanding of howgalaxiesformandevolveandhowplanetarysystemslikeourownmayoriginate.However,evenHerschel,themostadvancedFIRobservatorysofar,hadinsufficientspatialresolutionandsensitivitytoprobethedust-enshroudedgalaxiesintheearlyuniversewithouttheaidofcosmiclenses.Inaddition,spectroscopicobservationswithHerschelcoveredlessthan1%ofthesky!Webelievethatthetimeisrighttoremedythissituation,andtodefine,developandsupporta new advanced FIR Observatory. In subsequent chapters, we describe what has beenachievedsofarwithinthethemesofthesciencequestionsposedhere,butmostimportantlywediscussthenecessitytopursuetheanswerswithFIRspacemissions.Chapter2discussesthegoalsofaFIRobservatoryforSolarSystemscience;Chapter3forprotoplanetarydisksandplanetformation;Chapter4forourGalaxy;Chapter5fornearbygalaxies,andChapter6fordistantgalaxies intheearlyUniverse.Chapter7describesthetechnologydevelopmentalreadyunderwaytoachievethesegoalsandexamplesofFIRmissions.ConceptslikeSPICAandFIRSPEXwouldcomeearlierthanlargeprojectslikeTALC,CALISTOorinterferometricconceptslikeSPIRITorESPRIT.

6
2 SolarSystemScienceHerschel, with its unprecedented sensitivity in the far infrared wavelengths range, hasprovidedexcitingnewinsightsintosolarsystemscienceaddressingtopicssuchastheoriginand formation of the solar system, the water cycle of Mars, the source of water in thestratospheres of the outer planets, the isotopic ratios in cometary and planetaryatmospheres and a number of new detections (possibly related to cryo-volcanic activity)including the Enceladus water torus, water atmospheres and emissions of the GalileansatellitesandCeresandtheoceanlikewaterinaJupiterfamilycomet.FurthermoretogetherwithSpitzeralargenumberofalbedosofKuiperbeltobjectshavebeendetermined,helpingtoconstrainformationprocessingfromprotoplanetary/debrisdiskstosolarsystembodies.MostoftheseobservationscanonlybeperformedintheFIRandfromspace.Thefollowingchapterswilldescribethefindingsinmoredetailandaddress,theopensciencequestions
2.1 MarsThewatercycle isakeyaspectof theMartianatmosphere/surfacesystem.Temporalandspatial variationsof the column-integratedamountofwaterhavebeen characterizedbyanumber of space missions including Mars Global Viking, Mars Global Surveyor and MarsExpress.OnlythelatterprovidedverticalprofilesofwaterbysolaroccultationobservationsinthemiddleatmosphereofMars(Fedorova,2009).ComplementaryHIFIverticalprofilesofwater from ground into the middle atmosphere were scheduled to exactly constrain thevariablehygropause level,which issupposed tochange inaltitudebetween10and50kmover a martian season, however, the HIFI prime instrument failure short after launchresulted in only a small seasonal coverage around Northern summerwith the redundantHIFI instrument (Figure 2.1) showing a generally low hygropause level. Full seasonalcoverageandmonitoringobservationsarerequiredandcanthiscanonlybeachievedwithafutureFIRtelescope.Figure2.1:HIFIspectraofH2OandHDOandretrievedverticalprofileofwatervaporduringsolarlongitudeLS=78°(Hartoghetal.,A&A2017,inprep.)
Hydroxyl chemistry is tightly related to the water abundance and is essential forunderstandingthestabilityoftheMartianatmosphere.HIFIobservedH2O2,butthedetectedvolumemixingratiowasconsiderablysmallerthanpredictedbyphotochemicalmodelsandinfraredobservations.TheSNRoftheseobservationswasverylowsothatverticalprofilescould not be derived. Recent observations by SOFIA and the GREAT instrument onlyprovided upper limits. Higher sensitivity observations are required to understand the

7
discrepancybetweenmodels, andFIRobservations. Futureheterodyne receiverswill takeadvantage of the recent progress in Hot Electron Bolometer (HEB) technology, providinghighersensitivity.TogetherwithalargercollectingareacomparedtoHerschelobservationsof dedicated solar longitudes over a full martian year would provide for the first timeverticalH2O2profilesandinauniquewayconstrainphotochemicalmodels.OtherimportantspeciesareHO2andOHnotobservedbyHIFI,sinceMars’apparentdiameterwastoosmallduringtheHerschelobservationwindowssothat theplanetwasnotresolved.With largercollectionareaandhighersensitivityanewadvancedFIRtelescopewilleitherdetectthesemoleculesorprovide>1orderofmagnitudelowerupperlimits.Thisisthecasealsoforlinesurveys.HIFIperformedlinesurveysinbands1-5,howeverduetothelimitedSNRnonewspecies were detected and only some new upper limits were derived. HIFI detectedmolecularoxygen (Figure2.2) for the first time in the submmand for the first time since1972(Hartoghetal.2010).Whilethecolumndensityis(withintheerrorbars)compatiblewiththe1972observationsandshowsonlysmalldeviationstorecentground-basedinsitumeasurements of Curiosity, HIFI derived deviations from the constant vertical altitudeprofilenotpredictedbyphotochemicalmodelsandnotyetfullyunderstood.ObservationsofO2withSNR>100and,preferablyatdifferent locationson theMartiandiskarerequired.High SNR observations of hydrogen and oxygen isotopes (in H2O and CO) will constrainatmospheric escape processes and isotopic fractionation with altitude. During the Marsopposition in October 2020, for instance, Mars’ apparent diameter will be > 22 arcsec.ResolvedFIRobservationsof temperature (viaCO transitions) and the speciesmentionedabovewouldconstrainchemistryanddynamics(especiallythemeridionaltransport)ofthemartianatmosphere.
Figure2.2ObservedandfittedO2lineat774GHzandresidualsindicatingdeviationsfromconstantverticalprofile(Hartoghetal.2010)
8
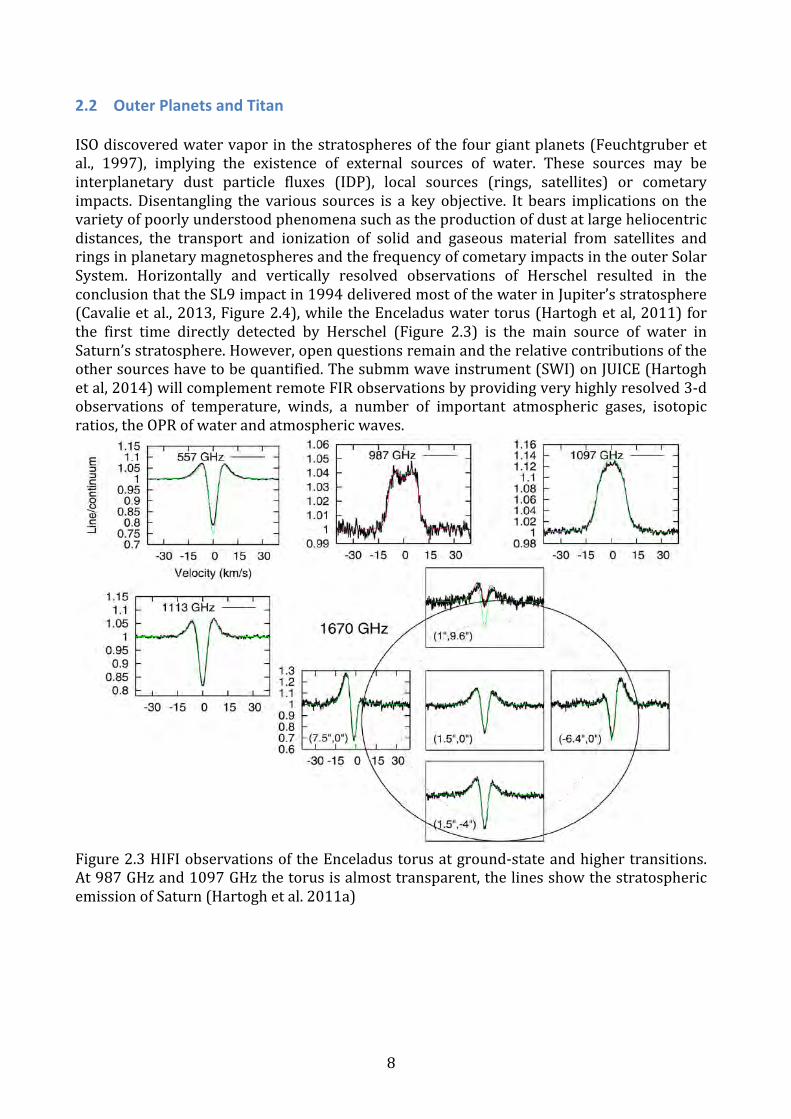
2.2 OuterPlanetsandTitanISOdiscoveredwatervaporinthestratospheresofthefourgiantplanets(Feuchtgruberetal., 1997), implying the existence of external sources of water. These sources may beinterplanetary dust particle fluxes (IDP), local sources (rings, satellites) or cometaryimpacts. Disentangling the various sources is a key objective. It bears implications on thevarietyofpoorlyunderstoodphenomenasuchastheproductionofdustatlargeheliocentricdistances, the transport and ionization of solid and gaseous material from satellites andringsinplanetarymagnetospheresandthefrequencyofcometaryimpactsintheouterSolarSystem. Horizontally and vertically resolved observations of Herschel resulted in theconclusionthattheSL9impactin1994deliveredmostofthewaterinJupiter’sstratosphere(Cavalieetal.,2013,Figure2.4),whiletheEnceladuswatertorus(Hartoghetal,2011)forthe first time directly detected by Herschel (Figure 2.3) is the main source of water inSaturn’sstratosphere.However,openquestionsremainandtherelativecontributionsoftheothersourceshavetobequantified.Thesubmmwaveinstrument(SWI)onJUICE(Hartoghetal,2014)willcomplementremoteFIRobservationsbyprovidingveryhighlyresolved3-dobservations of temperature, winds, a number of important atmospheric gases, isotopicratios,theOPRofwaterandatmosphericwaves.
Figure2.3HIFIobservationsoftheEnceladustorusatground-stateandhighertransitions.At987GHzand1097GHzthetorusisalmosttransparent,thelinesshowthestratosphericemissionofSaturn(Hartoghetal.2011a)

9
Figure2.4PACSmapofwatervaporcolumndensityofJupiter(Cavalieetal.2013)
HighSNRobservationswithanewFIRtelescopewithhigherspatialresolutionwillnotonlybetter constrain the sources, but also enable a deeper search for emission lines of newmolecules in the Enceladus torus. The higher spatial resolution will also reduce therotational smearing effect of the atmospheric spectral lines due to the rapid rotation ofJupiterandSaturn. Asaresulttheretrievalofverticalprofilesofallspecieswillextendtohigheraltitudes.BesideswateratleastPH3,NH3andCH4inJupiterandSaturnandHCNandCOinNeptuneareofhighinterest.HigherspatialresolutionthanthataffordedbyHerschelis needed to derive high SNR observation of Titan’s water transitions. Although HIFIobservedTitanwatertransitionsformorethan15h(Morenoatal.,2012),theSNRwasnotsufficient(Figure2.5)todirectlyretrieveaverticalprofile.Insteadaverticalprofilebasedonchemistry model calculation was proposed to fit HIFI and PACS data. A new heterodyneinstrumenthasthepotentialtoprovidewaterspectrawithanSNRof>100requiredforadirectretrievaloftheverticalprofileofwaterfromthemeasuredlineshape.HerschelSPIREand PACS observations confirmed the composition of Titan’s atmosphere as known fromformer Cassini-CIRS and ground-based observations (Courtin, 2011; Rengel, 2014). Aparticularly interesting resultwas the 16-O to 18-O isotopic ratio of only 380 ±60 in CO,about 24 % lower than the telluric value. Future line surveys with PACS or SPIRE-like

10
instrumentwouldprovidemorethanoneorderofmagnitudehighersensitivitycomparedtoHIFIandwilllikelydiscoveranumberofnewmoleculesinTitan’satmosphere.
Figure 2.5 HIFI observations of the 557 GHz and 1097 GHz water transitions on Titan(Morenoetal.2012)
2.3 EnceladusandtheGalileanSatellitesCryo-volcanic activity was discovered for the first time in Enceladus by the Cassinispacecraft in2006 (e.g.Porcoet al, 2006).Volcanicplumes feed theEnceladus toruswithabout 300 kg of water per second (Cassidy and Johnson, 2010). HST observations foundtransient water vapor at Europa’s south pole (Roth et al, 2013) pointing to cryovolcanicactivity or changing surface stresses based on Europa’s orbital phases. Herschel HIFIobservations found asymmetric water vapor atmospheres in Ganymede and Callisto(Hartogh et al, in preparation). Their potential sourcesmay include sputtering processes,sublimation or unknown surface processes. A new FIR heterodyne instrument has thecapability to monitor the spatiotemporal evolution of these water atmospheres/plumes,relatetheminmoredetailtoorbitalphasesandpossiblydeterminetheirsourcesandsinks.Broadband surface observations will add valuable information about the thermophysicalpropertiesoftheice/regolithlayerandthecompositionofices.
2.4 Ceresandtheasteroidbelt,mainbeltcometsHIFIobservationsofwaterplumesonCereswithaproductionrateofabout6kg/spointedtocryo-volcanism(Kueppersetal,2014).RecentobservationsofhazesbytheDAWNcamera

11
howeversuggestsublimationofwatericeovertheOccatorcrater(Figure2.6)thathasbeenprobablycollectedfromareasbeyondthesnowline(Nathuesetal,2015).
Figure 2.6 DAWN Framing Camera image of the Occator crater on Ceres from 4425 kmdistance. Under certain circumstances, hazes can be observed over the crater (Image:NASA/JPL-Caltech/UCLA/MPS/DLR/IDA)
Thepresenceandabundanceofwaterinasteroidsarerelevanttomanyareasofresearchonthe Solar System, ranging from the origin of water and life on Earth to the large-scalemigrationof giant planets such as Jupiter. The initialHIFI observations of Ceresprovidedambiguousresultswith4sigmadetectionsinonlyonepolarizationandnodetectionintheother. Their repetitions lead to similar results, indicating that the water emission wasrelated to a local source. Finally 10hour observations, covering the “light curve” of Ceresleadtothecrucialdetection.Thesensitivityoftheobservationwasaround1kg/sofwaterproductionrate.AfutureFIRheterodyneinstrumentmayreducethesensitivitytoabout100g/sorless,dependingontheobservedtransition.Thishighsensitivityopensanewfieldofasteroids research. Water emissions may be found in other asteroids, for instance incarbonaceouschondritesormainbeltcomets(MBCs).Watersublimationcouldbeonecauseexplaining the observed dust comas inMBCs, however all attempts to detectwaterwereunsuccessful thus far (de Val-Borro et al. 2012, O’Rourke et al. 2013) due to the limitedsensitivityofformerobservationsincludingHerschel/HIFI.
2.4.1 CometsandtheD/HrationsinthesolarsystemHaving retained and preserved pristinematerial from the SolarNebula at themoment oftheiraccretion,cometscontainuniquecluestothehistoryandevolutionoftheSolarSystem.Their studyassesses thenatural linkbetween interstellarmatterandSolarSystembodiesandtheirformation.Ironically,althoughbeingthemostabundantcometaryvolatile,waterisoneofthemostdifficultspeciestoobserve.Sincecometarygasiscold(10–100K)andwateris rotationally relaxed at fluorescence equilibrium, the rotational transitions between thelowestenergystatesarethemostintense.Thewaterlineat557GHzisexpectedtobeamongthe strongest lines of the radio spectrumof comets.Water plays an important role in the

12
thermalbalanceofcometaryatmospheres,asacoolingagentviaemission in itsrotationallines. This role is crucial in determining the expansion velocity and temperature of theatmosphere, which are two fundamental parameters for the physical description of thismedium. Indeed, cooling becomes effective only in the outer coma where the transitionsbecome optically thin. The observations of several water lines with Herschel providedinsightsintotheexcitationofthismoleculeandopticaldeptheffects(Hartoghetal,2010,deVal-Borroetal,2010).ObservationsofH3O+constraintheexcitationbyioniccollisions.Thiswillleadustomorerealisticmodelsofthethermodynamicsoftheatmosphere.AFIRSpacetelescopeisnecessarytocontinueresearchonwaterexcitation.StudyingwateranditsisotopologuesinSolarSystembodies(Hartoghetal,2009),provideskey informationabout their formationandevolution.A crucialparameter, inparticular, isthe deuterium/hydrogen (D/H) ratio measured in water. It is known from laboratoryexperiments, and confirmed by observations in the interstellar medium (ISM), thatdeuterium is enriched in ices, due to ion-molecule and grain-surface reactions at lowtemperature.TheD/H ratio in Solar Systemobjects (seeFigure2.7)provides informationabout the physico-chemical conditions under which the water formed and about mixingprocesses of equilibrated water with cometary ices with increasing D/H as function ofheliocentric distance. It may also provide information about formation processes of theouterplanetsandJeans-escapeoftheterrestrialplanets.Prior to the firstHerschel observations, theD/H-ratio in6Oort cloud comets (OCCs)wasdeterminedtobeinaveragetwiceashighasVSMOW(ViennaStandardMeanOceanWater~156 ppm), which ruled out comets as an external supply of Earth water. Herschel/HIFIdeterminedforthefirsttimetheD/H-ratioinaJupiterfamilycomet(JFC)(103P/Hartley2)toagreewithVSMOW(Hartoghetal,2011).ObservationsbyLisetal.2013of the Jupiterfamily comets 45P Honda-Mrkos-Pajdusakova confirmed the low D/H, however HIFIobservationsof theOort cloudcometC/2009P1Garraddwithabout200ppm(Bockelée-Morvan,etal,2012)relativizestheseeminglyD/HdichotomybetweenOCCsandJFCs.Gibbet al. 2012 provided another constraint for D/H in C/2007 N3 Lulin. The in-situmeasurementofthehighest-evermeasuredcometaryD/HratiointheJFC67P/Churyumov-Gerasimenkopointintothesamedirection(Altweggetal.2012).ForsometimeJFCswerethecometswiththelargestscatterinD/HratiosuntilthisfeaturewentbacktoOCCs.(Biveret al., 2016) determinedD/H ratios of ~ 140 and 650 ppm in 2 further OCCs by submmobservations (Odinand IRAM). D/H-ratios froma largersampleof comets (togetherwiththe14N/15Nratiowhichcurrentlyfavoursasteroidsastheagentsofwater)areessentialforabetterunderstandingofsolarsystemformationprocesses.WhiletheD/H-radiointhegasgiants,measuredinhydrogencorrespondstotheprotosolarvalue(Figure2.7),itshouldbeincreasedbyisotopicexchangereactionsbetweenwaterandhydrogen in the ice giants. Recent Herschel/PACS observations of HD confirmed a valueabouttwiceashighastheprotosolarvalue(Lellouchetal,2010;Feuchtgruberetal,2013).BasedonformationmodelsandmeasuredD/Hratios incometstheyconcludethat the icemassfractioninbothplanetsmaybesmallerthanpredictedbypreviousmodels.FutureFIRheterodyne observationsmay determine not only the D/H-radio in hydrogenwith highersensitivityandresolutionbutforthefirsttimealsoprovideD/H-ratiosinwaterinthegiantplanets’atmospheres,providinganadditionalconstrainttoexternalsourcesofwater.

13
Figure2.7:MeasuredD/Hdistributioninthesolarsystem(takenandadaptedfromHartoghetal.2011b)
Recently, the ROSINAmass spectrometer suite on board Rosetta discovered an abundantamountofmolecularoxygen,O2,inthecomaof67Pofnearly4%relativetowater(Bieleretal,2015),which is in contradiction to current solar system formationmodels. It couldbeshown that O2 is indeed a parent species and that the derived abundances point to aprimordial origin. Crucial questions are whether the O2 abundance is peculiar to comet67P/Churyumov-Gerasimenko or Jupiter family comets in general, and alsowhether Oortcloud comets such as comet 1P/Halley contain similar amounts ofmolecular oxygen. Re-analysis ofGiottodata showed indeeda similar amountofmolecularoxygen (Rubin et al,2015).Theseunexpected results raise thequestionwhether thishighO2 toH2O ratio is ageneralfeatureofcometsandwhetherplanetesimalscommonlycontainO2atalevelofafewpercent.Ifso,asubstantialpartofO2mayhavebeendeliveredtoEarthbyimpactsratherasign of biological activity. The close abundance despite very different dynamical historiesanderosionratesofbothcometsindicatesthattheobservedO2hasalreadybeenformedintheicesofthepre-andprotosolarnebula,beforethecometultimatelyformed.Thiswouldturn require that ice grains did not, or only partially, sublimate and reform during thecollapseoftheprotosolarnebula,perhapsduetoformationofplanetesimalsataveryearlystage.Becausethelargeamountofmolecularoxygenfoundin67Pand1Pwasunexpected,Herschel/HIFI observations ofO2in cometswere never scheduled. Future FIR heterodyneobservationsofO2foralargesetofJFCsandOCCsarerequiredinordertobetterconstraintherecentfindings.
2.5 KuiperBeltObjectsKuiper belt objects (KBOs) are the best-preserved remnants of the formationof our solarsystem.Theyretaininformationonthechemistryoftheprotoplanetary/debrisdiscandthephysicalprocessesthatledtotheformationoftheplanets.AfundamentalpropertyofKBOs,their size, is hard to measure from Earth. Due to their large distances, most KBOs areunresolvedand their apparentbrightness isdegeneratewith theuncertainties in size and

14
albedo.TheKBOsizedistributioncantellushowtheseobjectsformedandonhowcollisionshave eroded the initial. In solar system astronomy, the most fundamental application ofthermal observations is precisely the calculation of sizes and albedos of unresolved smallbodies.Butmuchmorecanbeachievedinthisunchartedwavelengthrange.A future FIR telescope may detect the Rayleigh-Jeans tail of the thermal emission ofhundredsofKBOs.Inthatregime,thefluxisnearlyproportionaltotheinstantaneouscross-section of the object,with a veryweak (1/4th power) dependence on poorly constrainedparameters suchas the IR emissivity and the temperaturedistributionacross the surface.Newobservationswill hence offer a reliable, unbiased estimate of the size distribution ofKBOs.Albedos, on the other hand, provide an important constraint on the surface chemistry ofKBOs.Of the~120KBOswith reliable Spitzer andHerschel albedo estimates appear verydark(albedos0.04 -0.25), the largestbodies (Pluto-scale)showhighlyreflectivesurfaces,probably indicating fresh, ice-rich surfaces. A family of objects associated to theKBO anddwarfplanetHaumeashowwater-icerich(Barkumeetal2006),highalbedosurfaces,andissuspected to have formed through a massive collision onto the proto-Haumea. AccuratealbedosarealsocrucialforspectralmodellingofKBOsurfaces(DeBerghetal2013).Cooleddownto5K,afutureFIRtelescopewillimproveonthesensitivityofHerschelbytwoordersofmagnitude.ThisisaverypromisingscientificenterprisegiventhesuccessofHerschelinthestudyofKBOs(e.g.Mülleretal2010).In addition, sensitive spectroscopic capabilitieswill yieldKBOSEDs.These canbe fitwithverydetailedthermo-physicalmodelsinwhichtheeffectsofspinstate,thermalinertiaandinfrared beaming are all taken into account. For example, high surface thermal inertiagenerally implies a porous, regolith-covered surface. High beaming parameter (FIR fluxenhancement)indicatesacrateredsurface(Lellouchetal2013).Itisinterestingtoseehowthesepropertiesvarywithsize.Thermal light curves are also particularly interesting. The phase difference between theopticalandthermallightcurvesofanobjectcanbeusedtodecideifthevariabilityismainlycausedbysurfacepatchesorbyashapecross-sectioneffect.Inaddition,theanglebetweenspinaxisandline-of-sightcanbeconstrainedfromtheaveragethermalflux(apole-onobjectwill be warmer than one closer to equinox). This is important as some models ofplanetesimalformationpredictthatthelargestKBOsshouldhavealignedspins(Johansen&Lacerda2010).Herschelthermallightcurvedataonthefastspinning(P=4hr)dwarfplanetHaumeaconfirmsitstriaxialshapeandhighdensity~2.5g/cc,andsupportsthepresenceofadarksurfacespotofunknownnature(Lacerdaetal2008,Lacerda2009).FuturespectroscopiccapabilitieswillletussearchthesurfacesofKBOsforlongwavelengthice and mineral features that are stronger and less ambiguous than those at shorterwavelengths. Currently, only thebrightest fewKBOs canbe studied in a usefulwayusingvisibleandNIRspectroscopy.ThelittleweknowaboutthesurfacecompositionofKBOsisbasedonbroadbandphotometry.Withthefuturetelescopewewillbeabletomapoutthecomposition of small body surfaces throughout the outer solar system. The relativeunexploredwavelengthregimehasalsothepotentialtoleadtonewdiscoveries.
2.6 Spectroscopicandtelescoperequirements
15
Achieving the science goals mentioned above requires a considerable progress in thetelescopeand instrumentperformance.This includes i)extensionof theheterodynebandsfrom400GHz to5THz(access tonewspecies likeHD,OIand tostronger transitions), ii)increase of the sensitivity in this range to < 3 hν/k (HIFI achieved this sensitivity only inband1.ManyHIFIobservationscouldhavebeendonemoreefficientathigherfrequencies,providedthesensitivitywasasgoodasinband1), iii) increaseofsensitivityof incoherentinstrumentsto1x10-20Wm-2(5s1hr/FOV),iv)spectralresolutionof100kHzforheterodyneand>5000forincoherentinstruments,v)increaseoftelescopediameterto10mormore(spatialresolutionofplanets,windmeasurements,pointsourceobservations).
2.7 ReferencesAltwegg,K.,Balsiger,H.Bar-Nun,A.,etal.,2015Science,Vol.347,6220,id1261952Barkume,K.M.,Brown,M.E.,&Schaller,E.L.2006,ApJ,640,L87Bieler,A.Altwegg,K.Balsiger,H.etal.,2015,Nature526,7575Biver,N.Moreno,R.,Bockelée-Morvan,D.,etal.,2016,A&A,589,A78.Bockelée-Morvan,D.Biver,N.,Swinyard,B.,etal.2012,A&A,544,L15.Cassidy,T.A.,&Johnson,R.E.2010,Icarus,209,696Cavalié,T.,Feuchtgruber,H.,Lellouch,E.,etal.2013,A&A,553,A21Courtin,R.,Swinyard,B.M.,Moreno,R.,etal.2011,A&A,536,L2deVal-Borro,M.,Hartogh,P.,Crovisier,J.,etal.2010,A&A,521,L50deVal-Borro,M.,Rezac,L.,Hartogh,P.,etal.2012,A&A,546,L4Fedorova,A.A.,Korablev,O.I.,Bertaux,J.-L.,etal.2009,Icarus,200,96Feuchtgruber,H.,Lellouch,E.,deGraauw,T.,etal.1997,Nature,389,159Feuchtgruber,H.,Lellouch,E.,Orton,G.,etal.2013,A&A,551,A126Gibb,E.L.,Bonev,B.P.,VillanuevaG.,etal.2012,Astrophys.J.750,102–115.Hartogh,P.,Lellouch,E.,Crovisier,J.,etal.2009,Planet.SpaceSci.,57,1596Hartogh,P.,Jarchow,C.,Lellouch,E.,etal.2010a,A&A,521,L49Hartogh,P.,Crovisier,J.,deVal-Borro,M.,etal.2010b,A&A,518,L150Hartogh,P.,Lellouch,E.,Moreno,R.,etal.2011a,A&A,532,L2Hartogh,P.,Lis,D.C.,Bockelée-Morvan,D.,etal.2011b,Nature,478,218Hartogh,P.etal2014,http://www.nrao.edu/meetings/isstt/papers/2014/2014091000.pdfHeyminck,S.,Güsten,R.,Hartogh,P.,etal.2008,inSocietyofPhoto-Optical
InstrumentationEngineers(SPIE)ConferenceSeries,Vol.7014Küppers,M.,O'Rourke,L.,Bockelé-Morvan,D.,etal.2014,Nature,505,525Lacerda,P.2009,AJ,137,3404Lacerda,P.,Jewitt,D.,&Peixinho,N.2008,AJ,135,1749Lellouch,E.,Hartogh,P.,Feuchtgruber,H.,etal.2010,A&A,518,L152Lellouch,E.,Santos-Sanz,P.,Lacerda,P.,etal.2013,A&A,557,A60Lis,D.C.,Biver,N.,Bockelee-Morvan,D.,etal.2013,ApJ,774,L3Mahaffy,P.R.,Webster,C.R.,Atreya,S.K.,etal.2013,Science,341,263Moreno,R.,Lellouch,E.,Lara,L.M.,etal.2012,Icarus,221,753Müller,T.G.,Lellouch,E.,Stansberry,J.,etal.2010,A&A,518,L146Nathues,A.Hoffmann,M.,Schaefer,M.,etal.2015,Nature,528,7581O'Rourke,L.,Snodgrass,C.,deVal-Borro,M.,etal.2013,ApJ,774,L13Porco,C.C.,Helfenstein,P.,Thomas,P.C.,etal.2006,Science,311,1393Rengel,M.,Sagawa,H.,Hartogh,P.,etal.2014,A&A,561,A4Roth,L.,Saur,J.,Retherford,K.D.,etal.2014,Science,343,171Rubin,M.,Altwegg,K.,vanDishoeck,E.F.,Schwehm.G.,2015,ApJL,815,1,L11

16
3 ProtoplanetaryanddebrisdisksTwodecadesafterthedetectionofthefirstexo-planetbyMayor&Queloz(1995,51PegB)thenumberofknownexoplanetsisover3000.Interestingly,noneoftheplanetarysystemsfound to date is similar to our own Solar System, instead a wide variety of planetaryarchitectures are found in termsofplanetarymass andorbitalproperties.As anexample,Figure 3.1 shows the planetary mass vs semi-major axis diagram. In spite of this largenumber of discoveries, our understanding of the planet formation process is still ratherlimited: how do planets form? what is the origin of the large heterogeneity of planetarysystems?howarevolatilesdeliveredtoplanets?Wheredotheasteroidsandcometsinthesesystemsreside?Our poor understanding of the planet formation process is largely due to our lack ofknowledgeof thephysical and chemical conditionsduring the formationphasewithin theopticallythickgas-richprotoplanetarydisksthatsurroundallyoungstars.Similarly,outsidethe Solar System we have little knowledge of processes that occur beyond this gas-richphase,suchas the finalgrowthofEarth-likeplanetsanddynamical instabilities thatcauseLate Heavy Bombardment-like events. Learning about such processes, and placing thearchitecture of the Solar System’s planets, asteroids, and comets in context will requiredetailed characterisation of the optically thin gas-poor debris disks that almost certainlysurroundallmain-sequencestars.
Figure3.1Exoplanetsdemography(fromexoplanet.eu)
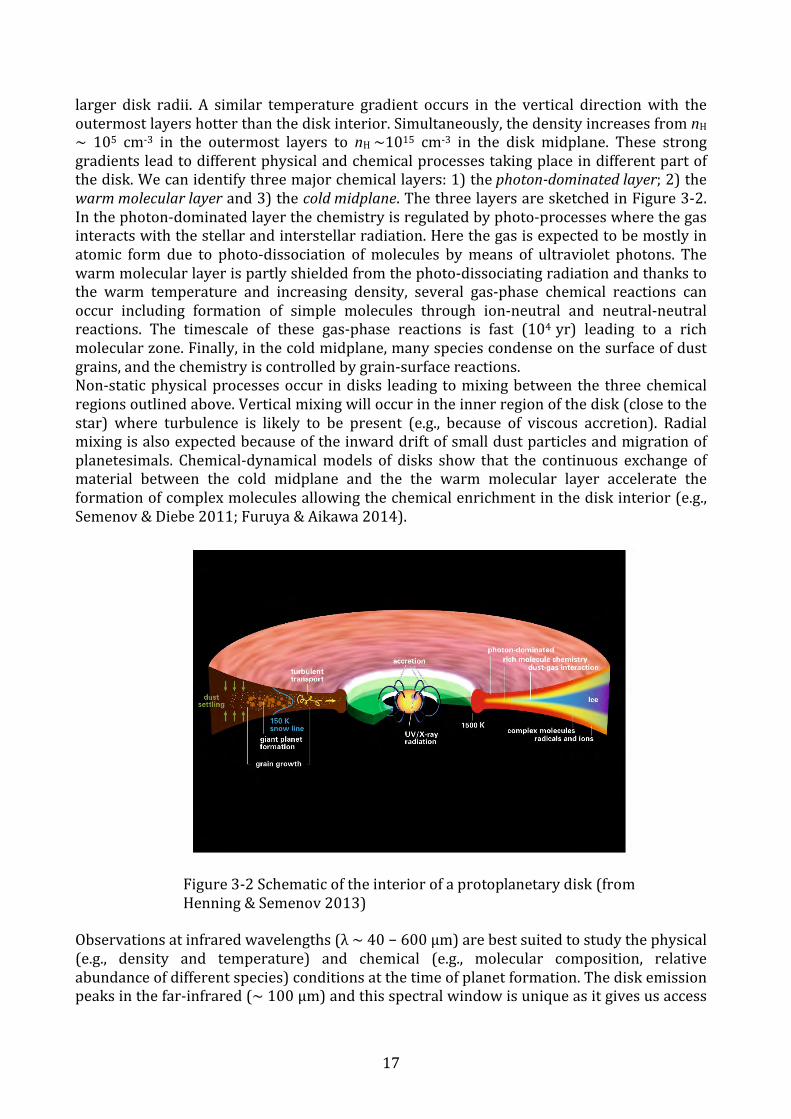
3.1 Observationsofprotoplanetarydisks:diskmolecularlayersThe interior of a protoplanetary disk is characterized by strong temperature and densitygradients both in the radial and vertical direction (Figure 3-2). Along the radial axis thetemperaturedrops froma few103K in the innerpart (close to the star) toa few10Kat
17
larger disk radii. A similar temperature gradient occurs in the vertical directionwith theoutermostlayershotterthanthediskinterior.Simultaneously,thedensityincreasesfromnH∼ 105 cm-3 in the outermost layers to nH~1015 cm-3 in the disk midplane. These stronggradientsleadtodifferentphysicalandchemicalprocessestakingplaceindifferentpartofthedisk.Wecanidentifythreemajorchemicallayers:1)thephoton-dominatedlayer;2)thewarmmolecularlayerand3)thecoldmidplane.ThethreelayersaresketchedinFigure3-2.Inthephoton-dominatedlayerthechemistryisregulatedbyphoto-processeswherethegasinteractswiththestellarandinterstellarradiation.Herethegasisexpectedtobemostlyinatomic form due to photo-dissociation ofmolecules bymeans of ultraviolet photons. Thewarmmolecularlayerispartlyshieldedfromthephoto-dissociatingradiationandthankstothe warm temperature and increasing density, several gas-phase chemical reactions canoccur including formation of simple molecules through ion-neutral and neutral-neutralreactions. The timescale of these gas-phase reactions is fast (104 yr) leading to a richmolecularzone.Finally,inthecoldmidplane,manyspeciescondenseonthesurfaceofdustgrains,andthechemistryiscontrolledbygrain-surfacereactions.Non-staticphysicalprocessesoccur indisks leading tomixingbetween the threechemicalregionsoutlinedabove.Verticalmixingwilloccurintheinnerregionofthedisk(closetothestar) where turbulence is likely to be present (e.g., because of viscous accretion). Radialmixingisalsoexpectedbecauseoftheinwarddriftofsmalldustparticlesandmigrationofplanetesimals. Chemical-dynamicalmodels of disks show that the continuous exchange ofmaterial between the cold midplane and the the warm molecular layer accelerate theformationofcomplexmoleculesallowingthechemicalenrichmentinthediskinterior(e.g.,Semenov&Diebe2011;Furuya&Aikawa2014).
Observationsatinfraredwavelengths(λ~40−600μm)arebestsuitedtostudythephysical(e.g., density and temperature) and chemical (e.g., molecular composition, relativeabundanceofdifferentspecies)conditionsatthetimeofplanetformation.Thediskemissionpeaksinthefar-infrared(∼100μm)andthisspectralwindowisuniqueasitgivesusaccess
Figure3-2Schematicoftheinteriorofaprotoplanetarydisk(fromHenning&Semenov2013)

18
to several gas- and solid-state features. Only at these wavelengths is instead possible tostudy:
• thegasmassanditstemporalevolution• thewaterreservoirs• theoriginofgasindebrisdisks• thediskthermalstructure• thedustcomposition• detectthetrueKuiperbeltanalogues
Alloftheseissuesaretightlyconnectedtotheformationofplanetsandtheiratmosphere.
3.2 ThegasmassanddiskevolutionMissions like Kepler have started tocharacterize themass distribution of exo-planets, and distinguish smaller rockyplanetsandlargericeandgasgiants.Inthestandard core-accretion planet formationmodel,planetsgrowfromslowcoagulationof dust grains into larger and largerentitiesandultimatelyplanets.Somegrowoutto10Earthmassesormore,enoughtostart capturing gas directly from thesurrounding disk and evolve into gasgiants.Inadditiontothedustmass,thegasmass of the disk is therefore of greatimportancetounderstandtheformationofplanets.
Figure3.3DetectionofHDinTWHya(Berginetal.2013)
Measuringthegasmassischallenging.Itsmainconstituent,H2,isverydifficulttodetectand,ifdetected,onlyprobesaverysmallsectionofthediskthatiswarmorstronglyirradiatedbyultravioletradiation.MeasurementsoftheCOmoleculeanditsisotopologuesareaffectedbyfreezeoutinthecoldanddensediskmidplaneaswellasisotope-selectivephotodissociationandchemicalprocessingofcarbonintolongercarbonchains(Best&Williams2014;Miotelloetal.in2014;Kamaetal.2016).Often, gas masses inferred from CO are lower by factors to 10-1000 compared to theexpectedvaluesextrapolatedfromthedustmass.Whilethismaybeduetogas-to-dustmassratiosthatdifferfromthestandardISMvalues,atleastinonecasethisdoesnotseemtobethe case. In TW Hya, the Herschel satellite detected emission from deuteratedmolecularhydrogen, HD (Figure 3.3; Bergin et al. 2013). Using simple chemical reasoning and theextensive knowledge about the structure of this particularlywell studied disk, a high gasmasswasinferred,consistentwiththevalueextrapolatedfromthedustmassandsuggestingCOfreezeout,photodissociation,andchemicalprocessing.TheHDlinesfromdisksarenotstrong,andHerschelonlymanagedtodetectittowardafewsingledisks(Berginetal.2013;McClureetal.2016).Itsinterpretationisaffectedbythefact
l(µm)
19
that the Herschel observations do not resolve the emission spatially or spectrally. Thismeans that the association of the emission with the disk cannot be directly proven: anycontribution from, forexample,awarmdiskwindcannotbeseparatedfromthat fromthediskitself.TheHDlinesat112and56m icrometercanonlybedetectedfromspace.Futurespace instrumentation can explore these lines with greater sensitivity and spectralresolution. Accessing both lines is important to constrain the excitation and removedependenciesonmodeledtemperaturestructures.
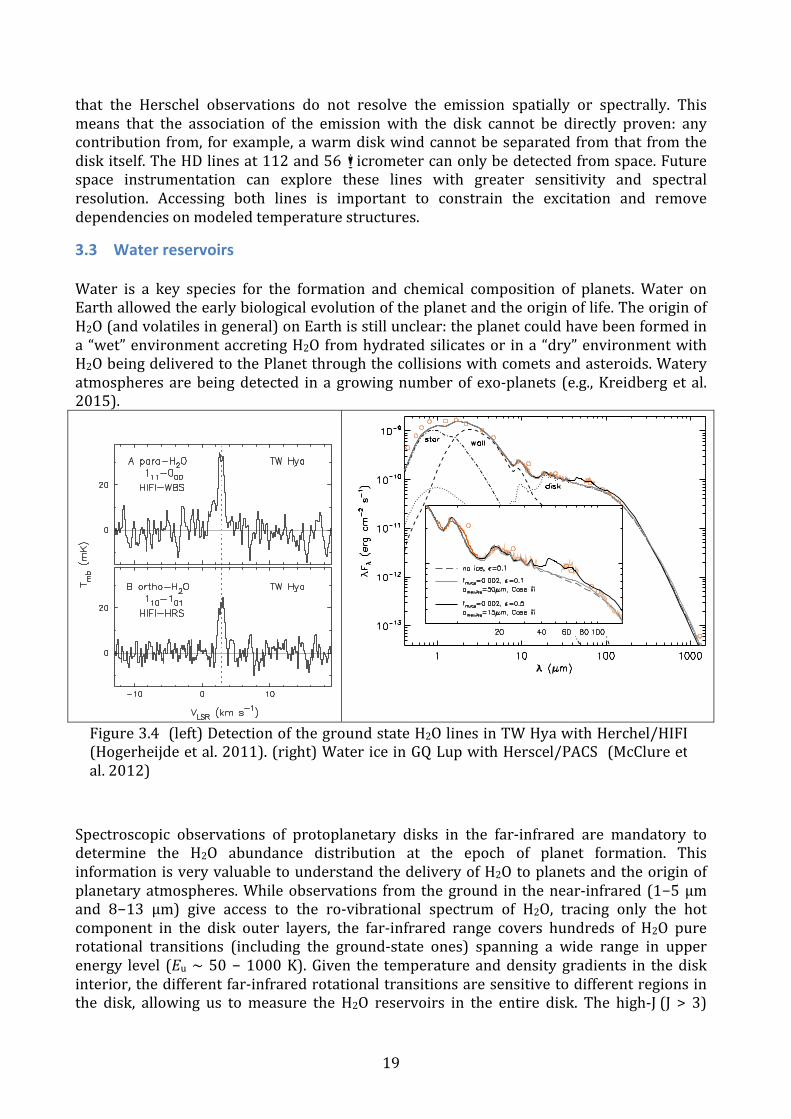
3.3 WaterreservoirsWater is a key species for the formation and chemical composition of planets. Water onEarthallowedtheearlybiologicalevolutionoftheplanetandtheoriginoflife.TheoriginofH2O(andvolatilesingeneral)onEarthisstillunclear:theplanetcouldhavebeenformedina“wet”environmentaccretingH2Ofromhydratedsilicatesor ina“dry”environmentwithH2ObeingdeliveredtothePlanetthroughthecollisionswithcometsandasteroids.Wateryatmospheresarebeingdetected ina growingnumberof exo-planets (e.g.,Kreidberget al.2015).
Spectroscopic observations of protoplanetary disks in the far-infrared are mandatory todetermine the H2O abundance distribution at the epoch of planet formation. ThisinformationisveryvaluabletounderstandthedeliveryofH2Otoplanetsandtheoriginofplanetaryatmospheres.Whileobservations from theground in thenear-infrared (1−5μmand 8−13 μm) give access to the ro-vibrational spectrum of H2O, tracing only the hotcomponent in the disk outer layers, the far-infrared range covers hundreds of H2O purerotational transitions (including the ground-state ones) spanning a wide range in upperenergy level (Eu∼50−1000K).Given the temperatureanddensitygradients in thediskinterior,thedifferentfar-infraredrotationaltransitionsaresensitivetodifferentregionsinthe disk, allowing us tomeasure the H2O reservoirs in the entire disk. The high-J(J > 3)
The Astrophysical Journal Letters, 759:L10 (6pp), 2012 November 1 McClure et al.
Figure 1. SED (orange lines and symbols) for GQ Lup. Photometry are from Covino et al. (1992), 2MASS, WISE, AKARI, IRAS, and Dai et al. (2010). Spectra arefrom the Spitzer Heritage Archive and this work. The best-fitting non-ice model is shown, along with two ice models. One fits everything but B2A (50 µm grains,solid gray) and the other fits everything except 120–140 µm (15 µm grains, solid black). The remaining model parameters are given in Table 1. The model does not fitthe optical data because we do not include emission from the accretion shock itself.(A color version of this figure is available in the online journal.)
PACS, we obtained 55–145 µm spectra of GQ Lup. To char-acterize simultaneously the distribution of silicates and waterice in relation to the disk structure, we combined these datawith archival Spitzer spectroscopy and ancillary photometry andused irradiated accretion disk models to fit the spectral energydistribution (SED) of GQ Lup.
2. OBSERVATIONS AND DATA REDUCTION
We observed GQ Lup using Herschel (Pilbratt et al. 2010)on 2012 January 8 (ObsID 1342238375) with PACS (Poglitschet al. 2010) range spectroscopy modes B2A (51–73 µm) andR1S (102–145 µm) at Nyquist sampling (R ∼ 1500) and atotal time of 7774 s. The data were reduced using the standarddata reduction pipeline in HIPE version 9.0 (Ott 2010). Weextracted the spectra from each spaxel, confirmed that thesource was point-like and well centered on the central spaxelwithin the pointing uncertainty of ∼2
′′, and applied the point-
spread function correction to the central spaxel spectrum. Theuncertainty in PACS absolute flux calibration can be up to 30%;however, GQ Lup was observed by both IRAS, at 60 and 100 µm,and AKARI, at 65 and 90 µm. We use this photometry to confirmthe absolute photometric accuracy of the PACS spectrum. Thepoint-to-point variation of the spectrum after rebinning by afactor of 10 is ∼15%; we assume this as our relative spectraluncertainty.
The Spitzer Infrared Spectrograph (IRS; Houck et al.2004) low (SL, 5–14 µm, λ/∆λ = 60–120, AORID 5644032)and high (SH, 10–19 µm, LH, 19–35 µm, λ/∆λ = 600,AORID 27064576) spectral resolution data were observed on2004 August 30 and 2008 September 2 as part of programs172 and 50641, respectively. We reduced them with SMART(Higdon et al. 2004) in the same way as in McClure et al.(2010), with the exception that the SH/LH data were sky sub-tracted from off-source frames included in that AORID. Weestimate the spectrophotometric uncertainty to be ∼5%.
3. ANALYSIS
The SED of GQ Lup is shown in Figure 1. It has a strongexcess at all infrared wavelengths, indicating the presence ofa dust sublimation wall and disk. However, the disk emissiondrops off rapidly with increasing wavelength, consistent with theconclusion by Dai et al. (2010) that it is outwardly truncated.The Herschel B2A spectrum shows a peaked triangular shapearound 63 µm suggestive of the water ice feature located there.We see no evidence for a forsterite feature at 69 µm. In theIRS spectrum, we identify the major crystalline features byfitting a non-parametric locally weighted scatterplot smoothingbaseline to the data, taking this as the “dust continuum” beneaththe molecular lines, and subtracting a linear fit to regionsbetween known crystalline silicate features to the IRS spectrum(Figure 2(a)). There are strong forsterite features at 23 and33 µm, blended forsterite–enstatite features at 18 and 28 µm,and weak enstatite features around 11 µm.
To determine the composition and structure of the disk,we construct temperature and density structures using theD’Alessio et al. (2006) irradiated accretion disk models, whichassume the disk is heated by stellar irradiation and viscousdissipation. Steady accretion and viscosity are parameterizedthrough constant M and α, respectively (Shakura & Sunyaev1973). The disk consists of gas and dust, the latter of which iscomprised of two grain populations mixed vertically. Settling isparameterized through ϵ = ξ/ξstandard, where the denominatoris the sum of the mass fraction of the different componentsrelative to gas and the numerator is the mass fraction in thesmall dust population.
The silicate and graphite grains have size distributions n(a) =n0a
−3.5, where a is the grain radius with limits of 0.005 µm andamax. To test whether the ice grains have grown larger than thesilicate grains, we consider three size distributions: (Case i)the same power-law dependence and amax as the silicate andgraphite grains; (Case ii) the same power-law dependence but
2
Detection of the Water Reservoir in aForming Planetary SystemMichiel R. Hogerheijde,1* Edwin A. Bergin,2 Christian Brinch,1 L. Ilsedore Cleeves,2
Jeffrey K. J. Fogel,2 Geoffrey A. Blake,3 Carsten Dominik,4 Dariusz C. Lis,5
Gary Melnick,6 David Neufeld,7 Olja Panić,8 John C. Pearson,9 Lars Kristensen,1
Umut A. Yıldız,1 Ewine F. van Dishoeck1,10
Icy bodies may have delivered the oceans to the early Earth, yet little is known about water inthe ice-dominated regions of extrasolar planet-forming disks. The Heterodyne Instrument for theFar-Infrared on board the Herschel Space Observatory has detected emission lines from both spinisomers of cold water vapor from the disk around the young star TW Hydrae. This water vaporlikely originates from ice-coated solids near the disk surface, hinting at a water ice reservoirequivalent to several thousand Earth oceans in mass. The water’s ortho-to-para ratio falls wellbelow that of solar system comets, suggesting that comets contain heterogeneous ice mixturescollected across the entire solar nebula during the early stages of planetary birth.
Water in the solar nebula is thought tohave been frozen out onto dust grainsoutside ∼3 astronomical units (AU)
(1, 2). Stored in icy bodies, this water provided areservoir for impact delivery of oceans to theEarth (3). In planet-forming disks, water vapor isthought to be abundant only in the hot (>250 K)inner regions, where ice sublimates and gas-phasechemistry locks up all oxygen in H2O. Emissionfrom hot (>250 K) water has been detected fromseveral disks around young stars (4, 5). In thecold (∼20 K) outer disk, water vapor freezes out,evidenced by spectral features of water ice in afew disks (6, 7). However, (inter)stellar ultravi-olet radiation penetrating the upper disk layersdesorbs a small fraction of water ice moleculesback into the gas phase (8), suggesting that cold(<100K)water vapor exists throughout the radialextent of the disk. The detection of this watervapor would signal the presence of a hidden icereservoir.
We report detection of ground-state rotation-al emission lines of both spin isomers of water(JKAKC110-101 from ortho-H2O and 111-000 frompara-H2O) from the disk around the pre–main-
sequence star TW Hydrae (TW Hya) using theHeterodyne Instrument for the Far-Infrared (HIFI)spectrometer (9) on board the Herschel SpaceObservatory (10) (Fig. 1) (11, 12). TW Hya isa 0.6 M⊙ (solar mass), 10-million-year-old TTauri star (13) 53.7 T 6.2 pc away from Earth. Its196-AU-radius disk is the closest protoplanetarydisk to Earth with strong gas emission lines. Thedisk’smass is estimated at 2× 10⁻⁴ to 6× 10⁻⁴M⊙in dust and, using different tracers and assump-tions, between 4×10⁻⁵ and 0.06M⊙ in gas (14–16).The velocity widths of the H2O lines (0.96 to1.17 km s−1) (table S1) exceed by ∼40% those ofcold CO (14). These correspond to CO emission
from the full 196-AU-radius rotating disk inclinedat∼7°with only little (<65m s−1) turbulence (17).The wider H2O lines suggest that the water emis-sion extends to ∼115 AU, where the gas orbitsthe star at higher velocities compared with196 AU.
To quantify the amount of water vapor tracedby the detected lines, we performed detailed sim-ulations of the water chemistry and line for-mation using a realistic disk model matchingprevious observations (12, 18). We adopted aconservatively low dust mass of 1.9 × 10⁻⁴ M⊙and, using a standard gas-to-dust mass ratio of100, a gas mass of 1.9 × 10⁻² M⊙. We exploredthe effects of much lower gas-to-dust ratios. Wefollowed the penetration of the stellar ultravioletand x-ray radiation into the disk; calculated theresulting photodesorption of water and ensuinggas-phase chemistry, including photodissociation;and solved the statistical-equilibrium excitationand line formation. The balance of photodesorptionof water ice and photodissociation of water vaporresults in an equilibrium column of water H2Ovapor throughout the disk (Fig. 2). Consistentwith other studies (19), we find a layer of max-imum water vapor abundance of 0.5 × 10⁻⁷ to2 × 10−7 relative to H2 at an intermediate height inthe disk. Above this layer, water is photodis-sociated; below it, little photodesorption occursandwater is frozen out, with an ice abundance, setby available oxygen, of 10−4 relative to H2.
In our model, the 100- to 196-AU regiondominates the line emission, which exceeds ob-servations in strength by factors of 5.3 T 0.2 forH2O 110-101 and 3.3 T 0.2 for H2O 111-000. Alower gas mass does not decrease the line in-tensities, if we assume that the water ice, from
1Leiden Observatory, Leiden University, Post Office Box 9513,2300 RA Leiden, Netherlands. 2Department of Astronomy, Uni-versity of Michigan, Ann Arbor, MI 48109, USA. 3Division ofGeological and Planetary Sciences, California Institute of Tech-nology, Pasadena, CA 91125, USA. 4Astronomical InstituteAnton Pannekoek, University of Amsterdam, 1098 XH Am-sterdam, Netherlands. 5Division of Physics, Mathematics, andAstronomy, California Institute of Technology, Pasadena, CA91125, USA. 6Harvard-Smithsonian Center for Astrophysics,Cambridge, MA 02138, USA. 7Department of Physics and As-tronomy, Johns Hopkins University, Baltimore, MD 21218,USA. 8European Southern Observatory, 85748 Garching, Ger-many. 9Jet Propulsion Laboratory, California Institute of Tech-nology, Pasadena, CA 91109, USA. 10Max-Planck-Institut fürExtraterrestrische Physik, 85748 Garching, Germany.
*To whom correspondence should be addressed. E-mail:[email protected]
Fig. 1. Spectra of para-H2O111-000 (A) and ortho-H2O 110-101 (B) obtained with HIFI onthe Herschel Space Observatorytoward the protoplanetary diskaround TWHya after subtractionof the continuum emission. Thevertical dotted lines show thesystem’s velocity of +2.8 km s−1
relative to the Sun’s local en-vironment (local standard ofrest).
REPORTS
21 OCTOBER 2011 VOL 334 SCIENCE www.sciencemag.org338
CORRECTED 23 DECEMBER 2011; SEE LAST PAGE
on
Sept
embe
r 16,
201
3w
ww
.sci
ence
mag
.org
Dow
nloa
ded
from
Figure3.4(left)DetectionofthegroundstateH2OlinesinTWHyawithHerchel/HIFI(Hogerheijdeetal.2011).(right)WatericeinGQLupwithHerscel/PACS(McClureetal.2012)
20
rotational transitionsaresensitive to thewarmmolecular layerofdisks (e.g., Fedeleet al.2013).The ground-stateH2O lines, (o-H2O 110 − 101 at 538.3 μm and p-H2O 111 − 000 at269.3μm,giveusaccesstothecoldH2Oreservoirsinthediskinterior.DeepintegrationwiththeHerschelSpaceObservatoryhavedetectedthesetransitionsin3disksonly,TWHya,HD100546 and DG Tau (Figure 3-4, Hogerheijde et al. 2011 and in prep, Podio et al 2013)suggestinganoverall lowabundanceofcoldH2O indisks.The lowabundanceofcoldH2OmaybeduewithmostoftheH2Obeinginsolidphase.Awide-bandfarinfraredspectrographisneededtodeterminetheabundanceofH2Oiceindisks.Thetwomostprominenticebandspeaks at λ∼40μmand60μm.The intensity, the shape and the flux ratio of the two icebandsprovidesuswith informationabout the iceabundance, its structure (amorphousorcrystalline)andformationtemperature.BothicebandshavebeenpreviouslydetectedinanhandfulofdiskswithISOandHerschelandtheH2Oicepropertiesremainstillunknownforthevastmajorityofprotoplanetarydisks.Inmain-sequencedebrisdisk systems, thewater contentof extrasolar comets canalsobeprobedusingfar-IRlines.Asdescribedbelow,gasreleasedincollisionsbetweencomets isdetectedinahandfulofdebrisdisksystems,whichprovidesawaytoprobethecomposition.Indeed,usingtheCII(157microns)andOI(63,145microns)finestructurelines,inadditiontoCOobservations,onecancomputetheH2O/COratio.Thiscalculationhasbeendoneforbeta Pic (Kral et al. 2016), so far the only mature planetary system with these 3 keyobservations. A far-IR instrumentwould be key to increase our sample of known atomiccarbon and oxygen gas disks and on-going ALMA observations are already increasing thenumber of systemswith CO detected every year. This would provide for the first time ataxonomy of exocomets aroundmain sequence stars. Thiswork is complementary to theabove studies of water during the protoplanetary disk phase, allowing us to “follow thewater”throughoutthelifetimeofaplanetarysystem.ThecontributionofinstrumentslikeJWST(MIRI)ortheE-ELT(METIS)willbeverylimitedfor this science case for several reasons. Both instruments can only observe high- energylevel transitions (ro-vibrational transitions and high-J rotational transitions) with upperenergylevelsEu~1000K.TheseH2Olinescomefromtheoutermostlayeroftheinnerdiskand are not a probe of the globalH2O budget. The 3 μm ice bands observablewith JWST(NIRSPEC)canonlybeobserved inabsorption(onlypossible fora fewsystemswherethediskisseenalmostedge-on)orinemissionthroughthescatteringofsmalldustgrains.Thusthe3μmbandisonlysensitivetotheicepresentintheoutermostlayers.
3.4 OriginofgasindebrisdisksThedetectionofgasindebrisdisksisarelativelynew,buthighlypromising,phenomenon.These observations detectmolecular gas (CO) and atomic species (such as CI, CII, OI andsomemetals).InmostcasesthelifetimeofCOisshortcomparedtothesystemage,soitisinterpreted as being produced in cometary collisions (i.e. is secondary) rather thanprimordial (e.g.Marinoet al. 2016).However, a fewsystemsappearmore likely tohost along-livedremnantoftheprimordialdisk(Mooretal.2013),anddetailedstudyofthesewillprovide new insight into the final dispersal of protoplanetary disks. Detailed study ofsecondarygascompositionwillyieldinsightintotheparentbodies,forexampleconstrainingthe composition of extrasolar comets and providing complementary information on theprotoplanetarydiskconditionsinwhichtheyformed.ThelifetimeofCOinanopticallythinenvironmentisshort,andthereforethebulkofthegasmassinsuchsystemsisexpectedtolie in the atomic species. These spread towards the star by as-yet unclear viscous

21
mechanisms,thuspervadingtheentiresystem(Kraletal.2016).Imagingandspectroscopycouldmapouttheatomicgasdistribution,andyieldinsightintofundamentaldiskprocessessuch as themagneto-rotational instabililty (Kral&Latter).With sufficient spectral and/orspatial resolution and S/N, differences between the observed and expected atomic gasdistributionmayrevealthegravitationalinfluenceofplanets.Anunderstandingoftheoriginofsecondarygasanditsevolutionwillbecriticaltofurtherourunderstandingofplanetarysystems.Whiledetectionsarerestrictedtojustafewyoungstars, these are limited by sensitivity and the known sample could be increased by 1-2ordersofmagnitudewithasensitivefar-IRmission.
3.5 DustcompositionDustplaysakeyroleinthediskevolutionandplanetformationprocess.Becauseofitslargeopacity, the dust grains: control the temperature and density structure; shield the diskinterior from the energetic radiation; regulate the ionization structure and helps theformationoficesandcomplexmolecularspecies.Thus, knowing the dust properties, and in particular its composition, is of fundamentalimportance to understand 1) planet formation and disk evolution processes and 2) theformationmaterialofstarsandplanets.Far-infraredspectroscopyisapowerfultooltocharacterizethedustcompositionindisks.Asshown in Figure 3-5, the 35 – 90µm spectral range provides a uniquewindow to studyseveral solid-state featuresofastrophysicalandastrobiological relevance, includingwater,forsterite(Mg2SiO4)andenstatite(MgSiO3)aswellascarbonbiomarkersascalcite(CaCO3)anddolomite (CaMg(CO3)2). The compositional and structural properties of dust in disks
canbepreciselydeterminedfromtheseresonances.The(wavelength)positionandwidthofthefar-infraredresonancesreflectthelatticestructureandcompositionofthematerials.Inparticular, far-infared observations allow us to accurately measure: the [Fe/Mg] ratio in
olivine ([Mg,Fe]2SiO4) and pyroxene ([Mg,Fe]SiO3); the lattice structure of pyroxene; theabundance and structure ofwater ice. The Fe/Mg ratio yields information about the dustalterationduringtheplanetformationandplanetevolutionphases,thereforeconstrainsthe
25/38
SPICA
The mineralogy of micron-sized dust particles in discs directly probes the composition of their parent bodies. SPICA will provide access to the far-IR resonances of several minerals (Figure 18), allowing a precise determination of their composition and structures, thanks to both their peak wavelength and width of the solid -state feature, which depend on relatively large-scale movements in the crystal. Of particular interest, the 69 Pm band of crystalline olivine (Mg2-2xFe2xSiO4) was studied with ISO and Herschel (e.g., Sturm et al. 2010, Mulders et al. 2011, de Vries et al 2012). The band is sensitive to grain temperature, size and composition, making it an invaluable probe of the physical and chemical properties of planetary systems. It reveals the composition at the inner wall of the disc and the radial mixing of refractory dust species in the disc (e.g., Mulders et al. 2011). These studies at 69 Pm are complementary to the 10 and 20 Pm features covered by previous Spitzer surveys and future JWST programs in tracing much colder larger grains further out in the disc. In E Pictoris, it was possible to study the composition of refractory dust in its exo-comets and make a direct comparison with our Solar System (de Vries et al. 2012). SPICA will further make the link with our Solar system’s zodiacal emission that shows evidence of 10 µm emission due to a mixture of amorphous and crystalline silicates, mainly of large (>10µm) size (e.g., Ootsubo et al. 1998; Reach et al. 2003). SPICA will also determine important properties of the minerals, such as i) the Fe/Mg ratio in olivine and pyroxene, which will answer how much alteration a mineral suffered during planet formation and evolution, and thus it will constrain the size and formation timescale of the parent body; ii) the lattice structure of pyroxene, which is determined by the amount of thermal processes, giving insight into the thermal history of the parent body; iii) search for carbon-bearing biomarkers such as calcite and dolomite, whose detections would strongly impact our current view on life and planetary systems. Herschel has only provided tentative detections of such biomarkers. SPICA will have the required sensitivity to detect them and to provide, with Spitzer and JWST, a complete picture of mineralogy in a large number of protoplanetary systems.
3.4.4 When does the gas supply cut-off during the planet forming phase? The gas content is key to establishing a generalised scenario for the formation of planetary systems. The evolution of the gas reservoir links directly to the fundamental mechanisms of planet formation, such as the build-up of gas giants, planetesimal collisions and the presence of volatiles in planetary atmospheres. SPICA will have unique access to atomic and molecular tracers of the gas reservoir. None of the facilities operating before or at the same time (JWST, ALMA,
Figure 18 Placeholder for Ben de Vries
(update).
Wavelength
Figure3.5Opacityofdustminerals(©B.deVries)

22
properties of themineral's parent-body, for example its formation timescale, size and theefficiencyofpossibleheatingsourcessuchasradioactivedecayofunstableelements.Far-infrared spectroscopic observations of protoplanetary and debris disks allow us tofollow the dust evolution from the early stage of planet formation to the later stage ofdynamical interactions, where a.o secondary gas-production occurs. Thesemeasurementswill put our own Solar system with its asteroids and Kuiper Belt into a much broadercontext.Previous observations with ISO (LWS), Spitzer (MIPS-SED) and Herschel (PACS) havedetectedonlythestrong69μmbandofcrystallineolivine(e.g.,Boweyetal.2002,Suetal.2015, DeVriesetal2012,Sturmetal.2013,Blommaertetal2014).Thisfeaturehasonlybeen detected towards two debris disks. The limited baseline stability of Herschel/PACSoverabroadwavelengthrangehashamperedthedetectionofothersolid-statefeatures.Far-infraredspectroscopicobservationsofprotoplanetaryanddebrisdiskswouldallowusto follow the dust evolution from the early stage of planet formation to the later stage ofdynamicalinteractions.
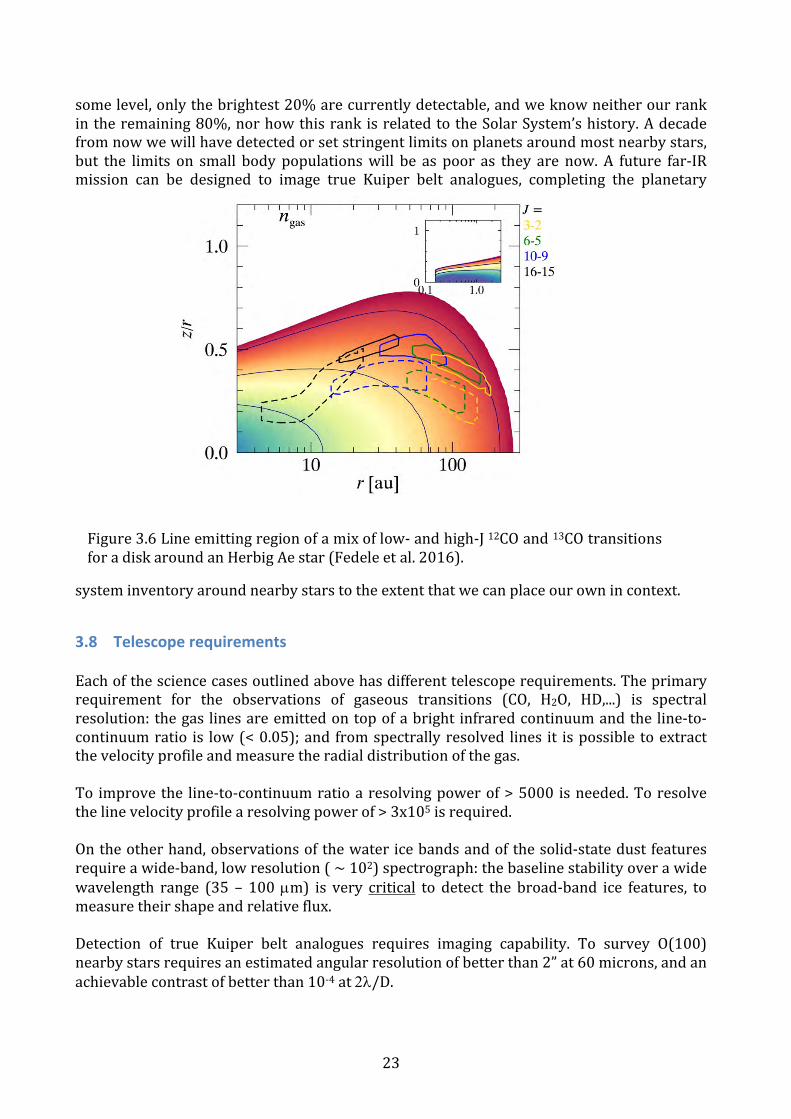
3.6 ThedisktemperaturestructureTheknowledgeoftheinitialdensityandtemperaturestructureinsideaprotoplanetarydiskisofmajor importance for the formationofplanets. Sub-millimeterobservations from thegroundarewellsuitedtodeterminethedensitystructurebecauseatthesewavelengthsthedust is optically thin allowing to study the cold disk midplane. The disk temperaturestructureinsteadisbetterinvestigatedinthefar-infraredandanideal“thermometer”istherotational ladderofCOand its rarer isotopologues (13COandC18O).CO isoneof themostabundantspeciesanditswellunderstoodchemistrymakesitanidealtracerofthegaspropertiesindisks.Thehigh-J(Ju>10)transitionsofCOemergefromthewarmmolecularlayerandthedifferentrotationallinescomesfromslightlydifferentorbitalradii.Thesameistrue for the other CO isotopologues with the main difference that, because of the loweropticaldepth(forthesameJ),12CO,13COandC18Oformsasequenceintheverticaldirection.Thus,far-infraredobservationsofmultipleCOisotopologueswillprovidedirectinsightsonthe vertical (different τ) and radial (different J) temperature structure of protoplanetarydisks.Asanexample,Figure3-6showstheemittingregionof4differentCOand13COtransitions(Fedeleetal.2016):thelow-Jtransitions(J=3−2&6−5,observablefromtheground) are mostly emerging from the outer, colder, part of the disk, while the high-Jtransitions provides information on the density and temperature structure down to theplanetformingregion.
3.7 Thefaintestdebrisdisks–trueKuiperbeltanaloguesThe locations and orbital structure of the Solar System’s asteroids and comets providestrong constraints on the Solar System’s history, a story that includesNeptune’s outwardmigration,captureofJupiter’sTrojans,andtheLateHeavyBombardmentoftheterrestrialplanets (e.g. Gomes et al. 2005). This story lacks context because true analogues of ourAsteroidandKuiperbelts remain invisible.Whileallother starsmusthostdebrisdisksat
23
somelevel,onlythebrightest20%arecurrentlydetectable,andweknowneitherourrankintheremaining80%,norhowthisrankisrelatedtotheSolarSystem’shistory.Adecadefromnowwewillhavedetectedorsetstringentlimitsonplanetsaroundmostnearbystars,but the limits on small body populationswill be as poor as they are now.A future far-IRmission can be designed to image true Kuiper belt analogues, completing the planetary
systeminventoryaroundnearbystarstotheextentthatwecanplaceourownincontext.
3.8 TelescoperequirementsEachofthesciencecasesoutlinedabovehasdifferenttelescoperequirements.Theprimaryrequirement for the observations of gaseous transitions (CO, H2O, HD,...) is spectralresolution:thegas linesareemittedontopofabright infraredcontinuumandthe line-to-continuumratio is low(<0.05);and fromspectrallyresolved lines it ispossible toextractthevelocityprofileandmeasuretheradialdistributionofthegas.To improvethe line-to-continuumratioaresolvingpowerof>5000 isneeded.Toresolvethelinevelocityprofilearesolvingpowerof>3x10⁵isrequired.Ontheotherhand,observationsofthewatericebandsandofthesolid-statedustfeaturesrequireawide-band,lowresolution(~102)spectrograph:thebaselinestabilityoverawidewavelength range (35 – 100µm) is very critical to detect the broad-band ice features, tomeasuretheirshapeandrelativeflux.Detection of true Kuiper belt analogues requires imaging capability. To survey O(100)nearbystarsrequiresanestimatedangularresolutionofbetterthan2”at60microns,andanachievablecontrastofbetterthan10-4at2l/D.
Figure3.6Lineemittingregionofamixoflow-andhigh-J12COand13COtransitionsforadiskaroundanHerbigAestar(Fedeleetal.2016).
24
3.9 ReferencesBergin,E.A.,Cleeves,L.I.,Gorti,U.etal.2013,Nature,493,644Williams&Best2014,ApJ,788,59Blommaert,J.A.D.L.,DeVries,B.L.,Waters,L.B.F.M.,etal2014,A&A,565,109Bowey,J.E.,Barlow,M.J.,Molster,F.J.,etal.2002,MNRAS,331,1deVries,B.L.,Acke,B.,Blommaert,J.A.D.L.,etal2012,Nature,490,74Fedele,D.,Bruderer,S.,VanDishoeck,E.F.,etal.2013,A&A,559,77Fedele,D.,VanDishoeck,E.F.,Kama,M.,etal.2016,A&Ainpress,2016arXiv160402055FFuruya,K.,&Aikawa,Y.,2014,ApJ,790,97Gomes,R.,Levison,H.F,Tsiganis,K.,Morbidelli,A.,2005,Nature435,466Henning,T.K.,&Semenov,D.,2013,ChRv,113,9016Hogerheijde,M.R.,Berwin,E.A.,Brinch,C.,etal.2011,Science,334,338Kama,M.,Bruderer,S.,Carney,M.,etal.2016,A&A,588,108Kral,Q.,&Latter,H.2016,MNRAS,461,1614Kral,Q.,Wyatt,M.,Carswell,R.F.,etal.2016,MNRAS,461,845Kreidberg,L.,Line,R.,Bean,J.,etal.2015,ApJ,814,66Maaskant,K.M.,DeVries,B.L.,Min,M.,etal2015,574,140Mayor,M.,&Queloz,D.,1995,Nature,378,355Marino,S.,Matrà,L.,Stark,C.,etal.2016,MNRAS,460,2933
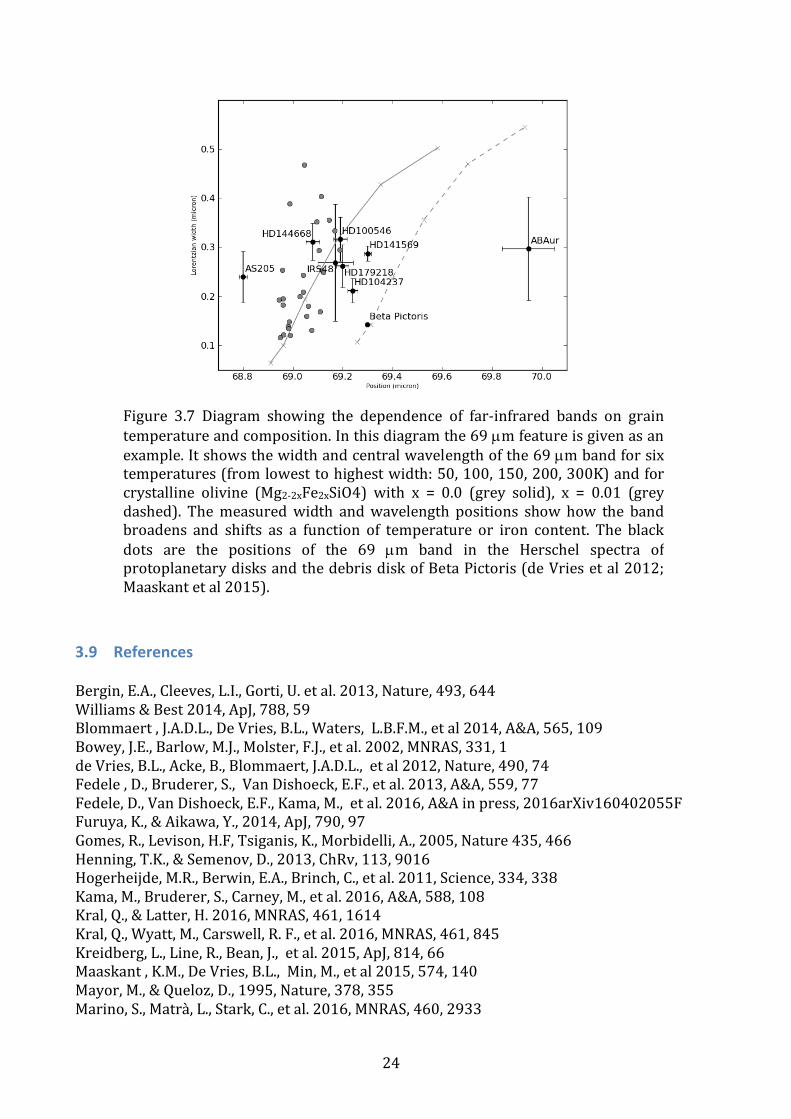
Figure 3.7 Diagram showing the dependence of far-infrared bands on graintemperatureandcomposition.Inthisdiagramthe69µmfeatureisgivenasanexample.Itshowsthewidthandcentralwavelengthofthe69µmbandforsixtemperatures(fromlowesttohighestwidth:50,100,150,200,300K)andforcrystalline olivine (Mg2-2xFe2xSiO4) with x = 0.0 (grey solid), x = 0.01 (greydashed). Themeasuredwidth andwavelength positions show how the bandbroadens and shifts as a function of temperature or iron content. The blackdots are the positions of the 69 µm band in the Herschel spectra ofprotoplanetarydisksandthedebrisdiskofBetaPictoris(deVriesetal2012;Maaskantetal2015).

25
McClure,M.K.,Manoj,P.,Calvet,N.,etal.2012,ApJ,759,10McClure,M.K.,Bergin,E.A.,Cleeves,L.I.,etal.2016,ApJ831,167Miotello,A.,Bruderer,S.,VanDishoeck,E.F.,2014,A&A,572,96Moor,A.,Juhasz,A.,Kospal,A.,etal.2013,ApJL,777,L25Podio,L.,Kamp,I.,Codella,C.,etal2013,ApJ,766,L5Semenov,D.,&Wiebe,D.,2011,ApJS196,25Su,K.Y.L.,Morrison,S.,Malhotra,R.,etal.2015,ApJ,799,146Sturm,B.,Henning,Th.,EvansII,N.J.,etal.2013,A&A,553,5

26
4 TheISMintheMilkyWayasapathfinderStars form inside themolecular cloudsof the interstellarmedium (ISM)butwe still don'tfullyunderstandwhatsetsthestellarbirthrateinagivengalaxy.FIRphotometricimagesofnearbygiantmolecular clouds (GMCs)of theMilkyWayhaveshown thatmostof the starformationwithin GMCs takes place along filaments (Evans et al. 2009; André et al. 2010;Molinarietal.2010).Thedensefilamentsareembeddedinamorediffusemediuminwhichturbulentdynamicsseemstobedrivenonlargerscales(Bruntetal.2009).TheseextendedregionsconstitutethebulkofthemassofGMCs,asmuchas90%(McKee&Ostriker2007),andthusmustplayacriticalroleintheirevolution.Themechanical(windsandsupernovaexplosions) and radiative (UV-radiation) feedback from stars themselves determines thepropertiesof the ISM(energybalance, turbulence, chemical composition).Bystudying thestructure,dynamics,andphysicalpropertiesoftheISMasawholewecanbegintounravelthedetailedprocessesthatultimatelyregulatethestarformationinourGalaxy.Evenbeforestar formation occurs, cold and dense molecular clouds need to assemble from diffuseatomicclouds.Manyquestionsstillremainaboutthisprocess.HowdoGMCsactuallyform?Which processes shape the diversity of observed structures? (halos, converging flows,filaments, cores, etc.). A new paradigm in which turbulence and magnetic fields areimportantactorsemerges(Hennebelle&Falgarone2012),but theirspecific role is largelyunknown. Spectroscopic observations of large areas of theMilkyWay at the appropriateangularandspectralresolutionarechallenging.ObservingintheFIRisessential,asmostoftheaboveradiativeandmechanicalprocessesproducestrongFIRlineandcontinuumemission.Theseincludethethermalemissionfromdustgrainsheatedbystellarradiation,theemissionfromthemostrelevantgascoolinglinesthat determine the energy balance, and a variety of atomic andmolecular lines that arisefrom shockedmaterial (e.g. vanDishoeck et al. 2011; Gerin et al. 2016). Because of theirspecificchemistry,somemoleculesemitting/absorbingintheFIRarealsoverysensitivetothe turbulence dissipation (e.g. Godard et al. 2012) and to the ionization sources (cosmicrays, X-rays, etc.). Thus, they can be used to constrain the ionization rate (Neufeld et al.2010; Indriolo et al. 2015). Velocity resolved observations can discriminate between thevariousheatingprocesses.Forinstance,turbulentdissipationandshoksleqavetheirimprinton the line profiles.With the exception of the cold gas in pre-stellar cores (a very smallvolumeoftheISM),mostoftheneutralinterstellargas(i.e.hydrogeninneutralform)intheMilkyWayisfoundatlowextinction(AV<10)levels.Therefore,alloftheneutralatomicandatleast90%ofthemoleculargasispermeatedbystellarUVandvisiblephotonsandemitsbackintheFIR(Hollenbach&Tielens1999).Atthescalesofanentiregalaxy,theinteractionbetweenstellarradiationandinterstellarmatterresultsinstrongFIRemission.Indeed,halfoftheluminosityoftheGalaxyoriginatesfromtheseFIRphotonsfromtheISM.
4.1 Bigquestions,FIRanswersThesuperbphotometriccapabilitiesofHerschelhaveprovidedpanoramicviewsof largeareasoftheGalaxybyimagingtheFIRdustemissionandshowingtheprojectedstructureoftheISM(e.g.Andréetal.2010;Molinarietal.2010;Schneideretal.2012). ThedominantgascoolantsofUV-irradiatedgasareemittedintheFIR.The[CII]158µmlineinparticularistypicallythebrightestemissionlineoftheISM(Dalgarno&McCray1972).TheseFIRlinesareuniquetracersofthephysicalconditionsprevailingindiffusecloudsandintheextendedcomponentofdenserGMCs(e.g.Hollenbach&Tielens1999),theenvironmentthatsetsthe

27
initialconditionsforstarformation.Theselinescanbeusedtomeasurestar-formingratesandconstrainfeedbackprocesses.Atmuchsmallerspatialscales,FIRlinescanalsobeusedtodeterminethecoolingprocessesinindividualprotostarsandprotoclusters.FIRlinesareespecially sensitive to the properties of the shocked gas in protostellar outflows (e.g.Herczeg et al. 2012;Karska et al. 2013).However, onlyhigh-spectral resolution (velocity-resolved)lineobservationsallowfordecomposingtheemissionintoitsdifferentphasesandconstituents (e.g. Langer et al. 2010;Pineda et al. 2013;Gerin et al. 2015), allowingus tocharacterizeandreconstructtheirpropertiesanddynamicsindividually.Suchobservationsare extremely limited (in particular for large-scale mapping). The power of velocity-resolvedFIRimaging-spectroscopy,willhelpustoaddresscrucialquestionsthatarelikelyto bring a paradigm shift in our understanding of molecular cloud formation, the role ofenvironment and feedback in star formation and its link to galaxy evolution; (1) Whichprocessestransformdiffuseatomiccloudsintodensermolecularclouds?(2)Whatfractionof giantmolecular clouds is converted into stars during their lifetime and how does thisdepend on local conditions? (Star formation efficiency and timescale); (3) What internalsourcesofenergydrivethedynamicsofmolecularcloudsaftertheirformation?Aswediscussbelow,onlybymappinglargeareasofdiverseenvironments(diffuseclouds,quiescent molecular clouds, triggered star-forming regions, galactic plane, high-latitudeclouds,etc.)inkeyFIRdiagnosticlinesandinFIRdustpolarizationemission(i.e.magneticfield orientation) will allow us to start answering these questions. SOFIA is nowmakingprogresswithquestions1and3throughheterodyne[CII]mapping,butit is limitedbythetotalofobservinghoursperflight,thusleavingquestion2completelyoutofreach.Tocomplicatemattersfurther,velocity-resolvedimagesofcoldmoleculargastracersinlow-mass star forming regions show that some of the filaments observed in the (dust)photometric images are indeed formed by velocity-coherent sub-filaments or fibers (e.g.Hacar&Tafalla, 2013).This exacerbates theneed forhigh-spectral resolutionmappingofFIRtracersofthecloudenvironment([CII],[CI],excitedCO,etc.).Whetherthesamescenarioscales to high-mass star forming regions is still uncertain. Together with the thermalinstability, themagnetic field is anothermissing component in this paradigm.Despite thefact thatmagneticenergy isa significant fractionof the ISMenergybudget, it remains toopoorly constrained observationally (e.g. Crutcher 2012). Planck’s low-angular resolutionimagesof themagnetic fieldorientation in the ISM(from thedustpolarizedemission, seeFigure 4-6) start to reveal the role ofmagnetic field at the large scales of theMilkyWay(both in star-forming and starless clouds). FIR dust polarization images at a few arcsec-resolutionareclearlyneededtomoveforward.WhileFIRphotometric imagesof thedust thermalemissionprovidea static “snapshot”oftheimpactofthestarformationprocessoverentiremolecularcloudcomplexes,itisonlybypursuing largescalemapsofkeyspectrallyresolved lines thatwecanprobe theextendedcloud/filament/coredynamicsandkinematicsindetail.Eachofthesephysicalstagesleavesa particular signature in the prevailing physical conditions and chemistry, and vice-versa,theparticularphysicalconditionsandchemistryinfluencesthecloudevolution(throughgascooling,ionizationfraction,couplingwiththemagneticfield,etc.).WISEMIR-andHerschelFIR-photometriccamerashaveimagedasignificantfractionoftheMilkyWaywithangularresolutionsdown to~35’’ (Herschel/SPIREat500µm).Dust SEDanalysishasallowed theconstruction of H2 integrated column density maps in many star-forming clouds.Unfortunately,similarmapsofthekeygastracersatsimilarangularresolutionandsizeasthose with Herschel/SPIRE, do not exist while Planck’s angular resolution is arcminutes
28
rather thanarc seconds (Figure4-6).Velocity-resolvedmaps in thebrightFIR [NII], [CII],[OI],and[CI]linesatcomparableangularresolutiontoHerschelphotometricmapswill:1)provideaccesstothekinematicsandturbulenceoftheemittinggasintheMilkyWay,2)constrainthethermalpropertiesofthegas(linkingwiththedifferentenergysources),3)enablethestudyofglobaldynamicsofthegaseousdisks.4)allowdetailedscaling-lawsofthesebrightFIRlinediagnosticswiththeFIRdust,PAH,andCO luminosities thatcan laterbeusedtounderstandandcharacterizetheiremission fromthedistantuniversewithALMA,oncetheexcitationisunderstood.Velocity-resolved,large-scalemapsoftheMilkyWayofthebrightFIRfinestructurelines,willadd the gas kinematics and turbulence piece of information needed to progress in ourunderstandingofISMcloudformationandevolution.
4.2 ThephysicalprocessesgoverningthedifferentgasphasesintheISMenergycycleTheISMisakeycomponentofgalaxiesandplaysapivotalrole intheirevolution.It isthereservoir of baryonic matter, and, as galaxies evolve, the constituents of the ISM aregraduallyconvertedintostars.AfractionoftheenrichedproductsofstellarevolutiongoesbacktotheISMthroughstellarwindsandsupernovaexplosions.Thus,thelifecycleof theinterstellarmatteritself(atoms,moleculesanddustgrains)iscloselyrelatedwiththatofthestars.Thisisanon-equilibriumsystemdissipatingalltypesofenergyforms(kinetic,thermal,stellarradiation,magnetic,self-gravityandcosmic-rayenergy) injected intheISM. It is farfrom understood how these different energy sources contribute to the dynamical andthermalpropertiesoftheISM,buteventually,alltheinjectedenergyisradiatedasphotonsemitted by dust grains and by specific gas constituents. The FIR is the key band tocharacterizethisradiativecooling(andindirectlytheenergysourcesandfeedback).
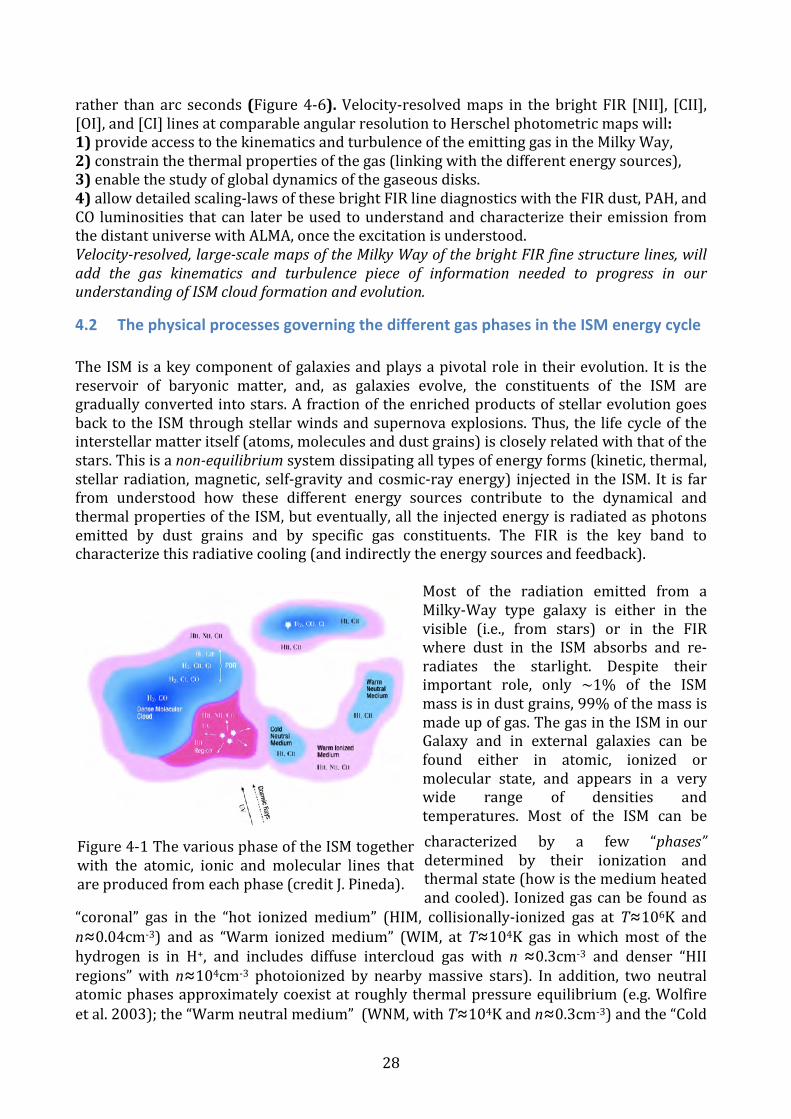
Most of the radiation emitted from aMilky-Way type galaxy is either in thevisible (i.e., from stars) or in the FIRwhere dust in the ISM absorbs and re-radiates the starlight. Despite theirimportant role, only ~1% of the ISMmassisindustgrains,99%ofthemassismadeupofgas.ThegasintheISMinourGalaxy and in external galaxies can befound either in atomic, ionized ormolecular state, and appears in a verywide range of densities andtemperatures. Most of the ISM can becharacterized by a few “phases”determined by their ionization andthermalstate(howisthemediumheatedandcooled). Ionizedgascanbefoundas
“coronal” gas in the “hot ionized medium” (HIM, collisionally-ionized gas at T≈106K andn≈0.04cm-3) and as “Warm ionizedmedium” (WIM, at T≈104K gas in whichmost of thehydrogen is in H+, and includes diffuse intercloud gas with n≈0.3cm-3 and denser “HIIregions”with n≈104cm-3 photoionized by nearbymassive stars). In addition, two neutralatomicphasesapproximatelycoexistatroughlythermalpressureequilibrium(e.g.Wolfireetal.2003);the“Warmneutralmedium”(WNM,withT≈104Kandn≈0.3cm-3)andthe“Cold
Figure4-1ThevariousphaseoftheISMtogetherwith the atomic, ionic and molecular lines thatareproducedfromeachphase(creditJ.Pineda).

29
neutralmedium”(CNM,T≈80Kandn≈40cm-3,seeFigure4-1).Asweshowbelow,thisisthedomain where key FIR cooling lines dominate the thermal state of the gas. Indeed, bymechanisms that arenot yet fullyunderstood, the very extended cold atomic clouds formhigh-pressure filamentarymolecular (most hydrogen is inH2) cloudswithT≈10-50K andn≈103-6cm-3.Densecoresinsidemolecularcloudsbecomegravitationallyunstable,andtheygradually collapse and form stars. Understanding the neutral phases of the ISM and theirdependence with the various energy forms and cooling mechanisms is a major step inunderstanding the formation of clouds themselves, and the global star formation rates ingalaxies.Inrecentyearshowever,ithasbecomeapparentthatthetraditionaldistinctionofthe ISM into thesewell-separated, thermallyandchemicallystablephasesdoesnot reflectthe dynamic nature of the ISM evolution. A large fraction of the gas can be found intransitional regions. To obtain a full inventory of the interstellar gas, observations of allphasesandthetransitionsbetweenthemareneeded.The ionized gas has been traditionally studied through radio continuum, radiorecombinationlinesandHaobservations(Haffneretal.2009),theneutralatomicgaswithobservationsoftheHI21cmline(e.g.Kalberla&Kerp2009),andtherotationaltransitionsoftheCOmoleculehavebeenusedtostudythecoldmoleculargas(e.g.Dameetal.2001).The volume occupied for the different phases scales inverselywith the gas density. Thus,mostofthebaryonicmassisintheneutralphases(therelevantmaterialforstarformation),whereasmostofthevolumeisinthehotandwarmphases.TheISMisverydynamic,changeof phases occur, and multiple interfaces (or boundaries between phases) appear along agiven line-of-sight(e.g. theHI lineat21cmtraces the totalhydrogenatomcolumndensitybutisnearlyimpossibletodistinguishbetweentheWNMandtheCNM).Unfortunately,evenforourgalaxy,mostoftherelevantprocessesandparametersdiscussedabovearestillverycontroversialanddebated.Inparticular,itiscrucialtoconstrainthemasses,fillingfactors,energy-balance,ionizationsources,dynamicsandtopologyofeachofthephasesthatmakeuptheISMthroughouttheMilkyWay.Inaddition,thiswillhelpusunderstandinghowandatwhichratetheISMisconvertedintostars.
4.2.1 CharacterizingandstudyingtheISMphasesandtheircommonboundariesTheneutralcarbonatomhasanionizationpotentialof11.3eV(belowthatofhydrogen),sothat the ion C+ traces the H+/H/H2 transition, the critical conversion from atomic tomolecular ISM. As a consequence, [CII] 158µm emission/absorption from different ISMphasesisexpectedalongagivensightline.The[CII]lineisthemostimportantgascoolantoftheCNM(Dalgarno&McCray1972).Itisalsoakeytracerofthesurfacesofthemuchdenser(star-forming)molecularcloudsilluminatedbyUVphotonsfromnearbymassivestars,theso-calledphotodissociationregionsorPDRs(cf.,HollenbachandTielens1999).The[CII]linedominatesthecoolingoflowdensity(<104cm-3)andlowfar-UVfieldPDRs(<104timesthefar-UV radiation field in the diffuse ISM). For the higher densities and FUV fields foundlocallyinPDRssurroundingHIIregionsaroundnewlyformedmassivestars,the[OI]63µmline ismore luminous (it has ahigher criticaldensity). In theseHII/cloud interfaces, both[OI]and[CII]linesarethedominantgascoolants.Atthelargerspatialscalesofawholestar-formingmolecularcloud(afewparsecsize),orevenofanentiregalaxy,the[CII]lineisagainthe dominant interstellar emission, carrying up to 1% of their total FIR luminosity(Crawfordetal.1985). Onaverylarge-scale(~7degreeangularresolution),FIRAS/COBEobservationsoftheMilkyWayhaveshownthatthe[CII]lineisthestrongestcoolinglineinthe ISM at about 0.3% of the infrared emission (Bennett et al 1994). These are very
30
importantresults,asbrightatomicFIRfinestructurelinesareeasilydetectableandprovideunique information on the stellar UV field, the gas density and temperature, and, ifspectrally-resolved(i.evelocity-resolved),theISMgasdynamics.There is a long debate on which of the ISMcomponents, includingtheWIM, theCNMandtheexternally illuminated surfaces of molecularclouds dominates the [CII] emission in any givengalaxy.Onlyhighspectral-resolutionobservationsof [CII] can tackle this problem. Recent velocity-resolvedlinesurveysintheMilkyWay,carriedoutwithHIFI,suggestthattheaveragecontributiontothe [CII]emission frommoleculargas illuminatedbyFUVphotonsis~55%–75%,thecoldatomicgas~20%–25%, and the HII ionized gas ~5%–20%(Pineda et al 2014, Figure 4-2). Unfortunately,Herschel surveys only sampled a very limitednumberof sightlines in theMilkyWay, soa largestatistical support is missing. In fact, thesefractions likely change from galaxy to galaxy asmetallicityandstarformationhistorieschange.
Nitrogen is themost abundantheavyelementafteroxygen and carbon. Nitrogen atoms have anionization potential of 14.5 eV, and owing to thetheir low critical densities (a few tens of electronscm-3),the[NII]122,205µmfinestructurelinestracethe extended, low-density WIM and also thelocalized and denser ionized gas in HII regionssurrounding massive stars. The [NII] 205µm finestructure line is an excellent probe to characterizethe ionized gas and is also very bright in star-formingregions(typicallya factor~10fainter than[CII]).Usedintandemwiththe[CII]158µmline,thepropertiesanddynamicsof the ionizedandneutralinterfaces can be constrained. In particular, a goodestimation of the C+ fraction in ionized gas, and amorepreciseestimationofthestellarUV-field(thusindirectlythestar-formationrate)canbeachievedifboth [NII] and [CII] lines are observedsimultaneously (e.g.Perssonet al. 2014, seeFigure4-3). Resolving their line profiles in the DopplervelocityspaceisneededtodistinguishthedifferentcomponentsandphasesproducingtheC+andN+emission/absorption.AlthoughHerscheldemonstratedthediagnosticpowerofvelocity-resolved[CII]and[NII]lineobservations towarda few sightlines (Figure 4-3, e.g.Perssonetal. 2014),Herschelwasnotdesignedtocarryoutlarge-scalespectral-mappingoftheselines.Thus,thespatialandvelocitydistribution of the key FIR cooling lines (at the relevant angular resolution forMilkyWay’sstudies)remainsunknown.
Figure4-3SpectraofN+205μmand C+158 μm towards W31C.The υLSR of the HII region ismarked in blue and the velocityof the LOS gas ismarked in red(fromPerssonetal2014).
Figure 4-2 C+ observations along anumber of lines of sight towards theGalactic Plane (figure taken fromPinedaetal.2014).

31
4.3 “CO-dark”moleculargasStarsarebornincloudswheremostofthemassisinmolecularform(H2).Molecularcloudsarethefuelforstarformationandthusit iscrucialtoconstrainthemassofagivengalaxycontainedinmoleculargas.Thishasbeentraditionallydonebymappingthelowestenergytransitions of CO in the millimeter domain, and by assuming a (admittedly uncertain)conversionfactorfromCOluminositiestoH2masses(the“Xfactor”).Thedetectionofanexcessγ-rayemission,producedbytheinteractionofcosmicraysandmolecularclouds,withrespecttopredictionsbasedontheISMcolumndensityastracedbyHIandCO,ledGrenieretal.(2005)totheexistenceofso-called"CO-darkmoleculargas"(seealsoAbdoetal.2010),justasearlier[CII]measurementsofIC10byMaddenetal.1997.Inthis view, molecular clouds are surrounded by large envelopes of atomic gas and by atransition regionwhereH2molecules start to form and survive as dust extinction andH2self-shielding attenuates the UV flux. This component where hydrogen is primarilymolecularbutmostcarbonisstillinC+andnotinCOisknownas“CO-faint”or“CO-darkH2
gas”,andbridges the localdensestar-formingclumpstothemuchmore extended cold diffuseatomic clouds. Although it maycontain a significant fraction ofthe baryonic matter in a galaxy,the “CO-dark” molecular gascomponent is difficult to traceobservationally (H2 is asymmetrical molecule andradiatesinefficiently).Herschel (pointed) observationsalong a very limited number ofsightlines in the galactic planesuggest thatC+ is thebest tracerof this CO-dark molecular gas,accounting for ³1/3 of the [CII]emission in the Milky Way (e.g.Langer et al. 2014, Pineda et al.2014).Note that only very high-spectral resolution lineobservations(R>105)canresolve
the C+ emission from the different gas phases (CNM, WNM, WIM). Unfortunately, whileHerschelobservationssuggestedtheimportanceofCO-darkmoleculargas,thedegree-scalespatialresolutionaccessibletoγ-rayobservatoriesaswellasthecoarsespatialsamplingoftheHerschelsurvey,donotallowtoquantitativelyaddressingtherelativebudgetofdarkgasin the molecular ISM component. The fine structure lines of neutral atomic carbon([CI]370,610µm), although weaker than the [CII] line, are unique tracers of the C/COtransitioninUV-illuminatedmolecularclouds.Hence,theyaddmoreconstraintstotheCO-darkgascharacterization.Many questions still remain after Herschel discoveries; what is the mass, filling factor andphysicalpropertiesoftheCO-darkgasinagivenGalaxy?Whatisthemoleculargasmassonemissesbyobservingthelow-JCOlinesalone?Obtaininglarge-scale,velocity-resolvedmapsoftheFIRfinestructurelines,combinedwithHIandCOobservations,isclearlyneeded.
Figure 4-4 High spectral resolution observations (<1km/s) allow resolving line profiles, studying the gaskinematics and characterising the C+ emission from thevarious ISM phases, including the CO-dark molecularclouds. Taken from Herschel/HIFI observations of theOrioncloud(Goicoecheaetal.2015a).
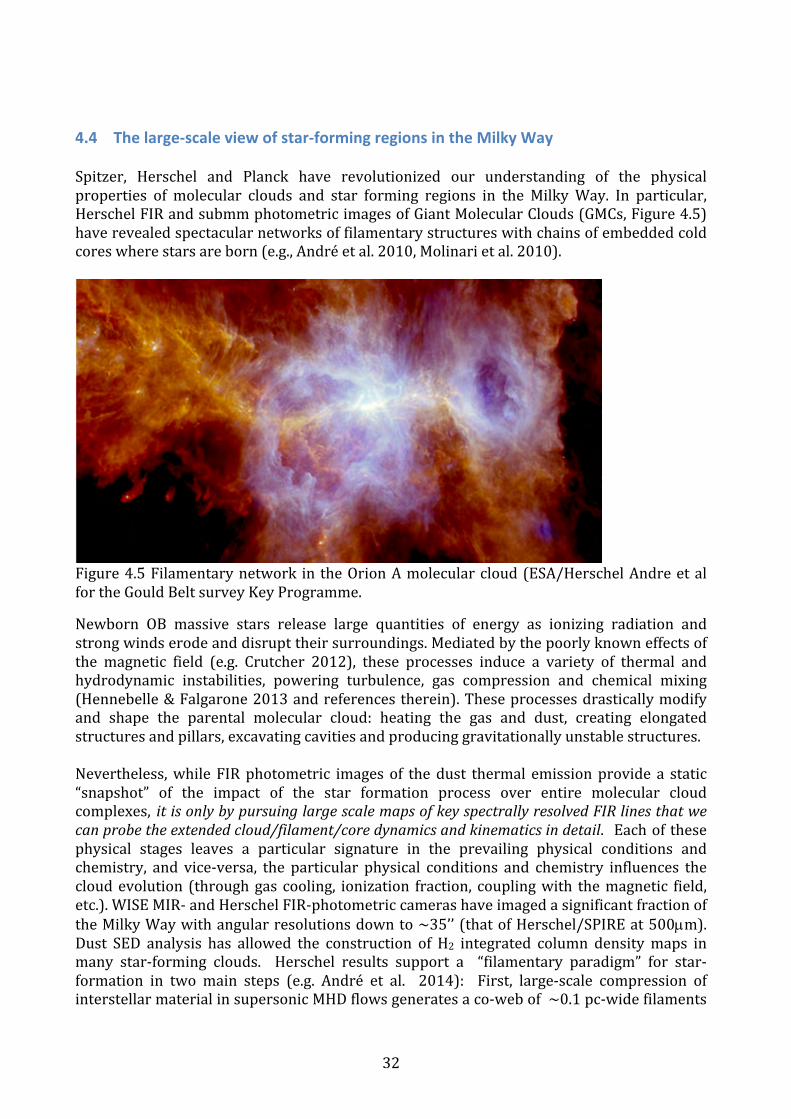
32
4.4 Thelarge-scaleviewofstar-formingregionsintheMilkyWaySpitzer, Herschel and Planck have revolutionized our understanding of the physicalproperties of molecular clouds and star forming regions in the MilkyWay. In particular,HerschelFIRandsubmmphotometricimagesofGiantMolecularClouds(GMCs,Figure4.5)haverevealedspectacularnetworksoffilamentarystructureswithchainsofembeddedcoldcoreswherestarsareborn(e.g.,Andreetal.2010,Molinarietal.2010).
Figure4.5Filamentarynetwork in theOrionAmolecularcloud(ESA/HerschelAndreetalfortheGouldBeltsurveyKeyProgramme.
Newborn OB massive stars release large quantities of energy as ionizing radiation andstrongwindserodeanddisrupttheirsurroundings.Mediatedbythepoorlyknowneffectsofthe magnetic field (e.g. Crutcher 2012), these processes induce a variety of thermal andhydrodynamic instabilities, powering turbulence, gas compression and chemical mixing(Hennebelle&Falgarone2013andreferencestherein).Theseprocessesdrasticallymodifyand shape the parental molecular cloud: heating the gas and dust, creating elongatedstructuresandpillars,excavatingcavitiesandproducinggravitationallyunstablestructures.Nevertheless,while FIRphotometric images of thedust thermal emissionprovide a static“snapshot” of the impact of the star formation process over entire molecular cloudcomplexes, itisonlybypursuinglargescalemapsofkeyspectrallyresolvedFIRlinesthatwecanprobetheextendedcloud/filament/coredynamicsandkinematicsindetail. Eachof thesephysical stages leaves a particular signature in the prevailing physical conditions andchemistry, and vice-versa, the particular physical conditions and chemistry influences thecloudevolution (throughgas cooling, ionization fraction, couplingwith themagnetic field,etc.).WISEMIR-andHerschelFIR-photometriccamerashaveimagedasignificantfractionoftheMilkyWaywithangularresolutionsdownto~35’’(thatofHerschel/SPIREat500µm).Dust SED analysis has allowed the construction of H2 integrated column densitymaps inmany star-forming clouds. Herschel results support a “filamentary paradigm” for star-formation in two main steps (e.g. Andre et al. 2014): First, large-scale compression ofinterstellarmaterialinsupersonicMHDflowsgeneratesaco-webof~0.1pc-widefilaments
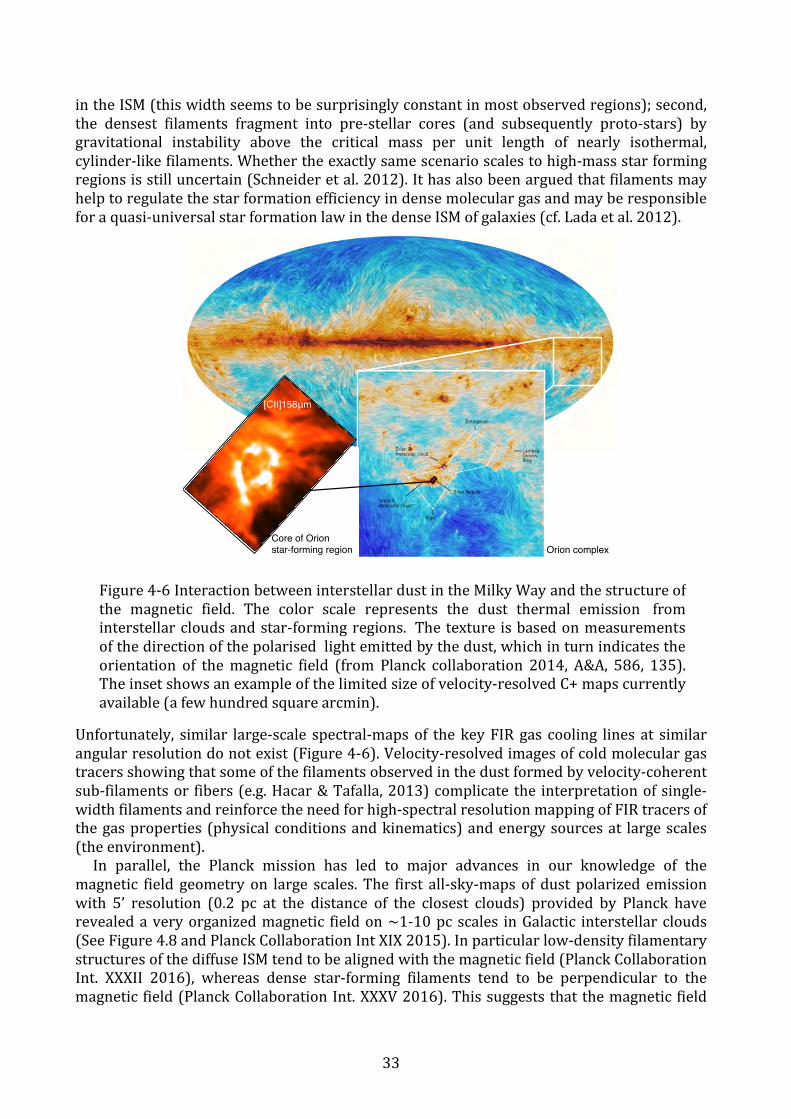
33
intheISM(thiswidthseemstobesurprisinglyconstantinmostobservedregions);second,the densest filaments fragment into pre-stellar cores (and subsequently proto-stars) bygravitational instability above the critical mass per unit length of nearly isothermal,cylinder-likefilaments.Whethertheexactlysamescenarioscalestohigh-massstarformingregionsisstilluncertain(Schneideretal.2012).Ithasalsobeenarguedthatfilamentsmayhelptoregulatethestarformationefficiencyindensemoleculargasandmayberesponsibleforaquasi-universalstarformationlawinthedenseISMofgalaxies(cf.Ladaetal.2012).
Unfortunately, similar large-scale spectral-mapsof thekeyFIRgas cooling lines at similarangularresolutiondonotexist(Figure4-6).Velocity-resolvedimagesofcoldmoleculargastracersshowingthatsomeofthefilamentsobservedinthedustformedbyvelocity-coherentsub-filamentsor fibers(e.g.Hacar&Tafalla,2013)complicate the interpretationofsingle-widthfilamentsandreinforcetheneedforhigh-spectralresolutionmappingofFIRtracersofthegasproperties (physicalconditionsandkinematics)andenergysourcesat largescales(theenvironment).In parallel, the Planck mission has led to major advances in our knowledge of themagnetic field geometry on large scales. The first all-sky-maps of dust polarized emissionwith 5’ resolution (0.2 pc at the distance of the closest clouds) provided by Planck haverevealedaveryorganizedmagnetic fieldon~1-10pcscales inGalactic interstellarclouds(SeeFigure4.8andPlanckCollaborationIntXIX2015).Inparticularlow-densityfilamentarystructuresofthediffuseISMtendtobealignedwiththemagneticfield(PlanckCollaborationInt. XXXII 2016), whereas dense star-forming filaments tend to be perpendicular to themagnetic field(PlanckCollaborationInt.XXXV2016).Thissuggeststhatthemagnetic field
Figure4-6InteractionbetweeninterstellardustintheMilkyWayandthestructureofthe magnetic field. The color scale represents the dust thermal emission frominterstellarcloudsandstar-formingregions. Thetexture isbasedonmeasurementsofthedirectionofthepolarisedlightemittedbythedust,whichinturnindicatestheorientation of themagnetic field (from Planck collaboration 2014, A&A, 586, 135).Theinsetshowsanexampleofthelimitedsizeofvelocity-resolvedC+mapscurrentlyavailable(afewhundredsquarearcmin).
[CII]158μm"
Orion complex"Core of Orion"star-forming region"

34
playsanimportantroleinthedynamicformationofstructuresintheISM.Unfortunately,theangularresolutionachievedbyPlanckisfarfromthatofHerschelphotometricimagesandthecomparisonisnotstraightforwards.Hence,bothvelocity-resolvedmapsofthebrightestFIR interstellar lines together with FIR dust polarization images at comparable angularresolution(£35’’)areneededto:1)ResolvethekinematicsandoftheISMgas(dynamicsandturbulence),2) Constrain the properties (and indirectly the energy and ionization sources) of the gascontainingmostofthemassininterstellarclouds.3)Determinethetopologyandroleofthemagneticfieldfromdiffusetostar-formingclouds.4)Allowdetailed scaling-lawsof thesebrightFIR linediagnosticswith theFIRdust,PAH,andCO luminosities that can latterbeused tounderstand their emission from thedistantuniverse(e.g.ALMAdetectionsof[CII]and[NII]linesatveryhighred-shift).Large-scale,velocity-resolvedmapsoftheMilkyWayinthebrightFIRfinestructurelineswilladd the gas kinematics and turbulence piece of information needed to progress in ourunderstanding of molecular cloud formation and evolution. Accessing the topology of themagnetic field will provide clues on how the ISM is structured and how the diffuse atomiccloudsareconvertedintodenserfilamentarymolecularclouds.ALMA cannot access the FIRline emission from theMilkyWay, and indeed ALMA is not designed to carry out all-skymaps of the extended interstellar emission. In addition, obtaining all-sky sensitive FIRpolarimetric imagesat thedustSEDpeakofdiffuseatomicandmolecular clouds (l~100-350µm)clearlyrequiresdedicatedspaceobservations.
4.5 Massivestarsandtheimpactontheirsurroundings
4.5.1 UnderstandingHighMassStarFormationHigh-massstarscontrolmostofthechemicalanddynamicalevolutionoftheISMingalaxies,how they form, however, remains largely unknown. Do they form following a scaled-upversion similar to that of low-mass star formationmechanisms involving turbulence andmonolithiccollapse(e.g.Zinnecker&Yorke2007)?Do they formbycompetitiveaccretion(e.g.Tan&McKee2002)?Massivestarsareindeedrareanddistant(afewkpcintheMilkyWay)andevolverapidlyastheystartnuclearfusion(thusradiatingstrongUVfields)whilestillaccretingmass.Therefore, inorder tounderstandtheir formationweneedtoobservesufficiently large samples. High-mass proto-stars and clusters are embedded in largequantities of gas and dust. Hence, they need to be observed at long-wavelengths whereextinction is not an issue. FIR images show thatmostmassive clusters lie at junctions offilaments(Schneideretal.2012),buthowthesefilamentsareformed,andwhatcontrolstheflow of material is debated. FIR spectroscopic observations are especially suited tounderstandtheUV-irradiatedgasdynamicsinhigh-massstar-formingregions.Herschelwasnot able to provide large-scale FIR spectral-images, and only a few pointed spectroscopicstudieswerecarriedout.The outflows and envelopes around individualmassive protostars and clusters also emitcopiouslyintheFIR.TogetherwiththeMIRH2lines(oftenobscuredbyextinction),theFIRrotationallyexcitedlinesofCO,H2OandOHarethemostimportantcoolantsoftheshockedgas,hence,theyareanexcellentfiltertodetectandcharacterizeprotostellaractivity(Karskaet al. 2014, Goicoechea et al 2015b). An example of the rich FIR spectrum from outflowsaroundmassiveprotostarsisshowninFigure4.7.Theselinesarealsoexpectedtoarisefromtheircircumstellardisks.Adetailedspectroscopiccharacterizationof individualprotostars

35
(disk and outflow cavitiy), however, would require reaching at least the challenging ~1’’angular-resolutionatFIRwavelengths(1’’≈500AUatthedistancetoOrion,but1’’≈5,000AUatthe~5kpctypicaldistanceofhigh-massstar-formingregionsintheMilkyWay).
Figure 4.7 Comparative far-IR spectra of three template environments in the MilkyWay:outflowsaroundmassiveprotostars(red),theGalacticCenter(black),andahighlyUV-irradiated PDR, the Orion Bar (blue). Observed by Herschel/PACS (Gerin, Neufeld,Goichoechea,ARAA2016,andJoblinetal.inprep.).
4.5.2 FeedbackfrommassivestarsOne of the fundamental issues in understandingmassive star formation is to quantify themagnitude and impact of the feedback processes induced by massive stars on theirenvironment,andonthestarformationrateingeneral.PreviouscontinuumandCOsurveysoftheGalacticPlanehaveprovidedacompletemapofthecoldmoleculargasinstarformingregions.Thefilamentarystructuretestifiesthestrongdynamicaleffects,fromthelarge-scaleGalacticstructure, thebarandspiralsarmsandtheassociatedconvergingflowsleadingtotheformationofmolecularclouds.Onsmallerscales,theformationofmassivestarsprovidesan important negative feedback both radiatively, through the intense UV radiation, anddynamically, through the stellarwinds, outflows and later the supernovae shocks. On theotherhand,theexpandingHIIregionsaroundyoungmassivestarscanalsoaccelerateandshock the neutral material in adjacent molecular clouds, compressing the gas to highdensities and triggering the formation of dense clumps that may ultimately form a newgeneration of stars (positive feedback, e.g. Hosokawa & Inutsuka 2006). Thanks to FIRphotometric observations with Herschel, statistics shows that the column densityprobabilitydistributionfunctions(PDF)aroundmassiveclustersandHIIregionsoftenshowlognormaldistributions(likelydominatedbyturbulenceeffects)andahigh-densitypower-lawtailataboutAv>8mag(likelydominatedbygravitationalcollapse).Insomeregions,the
36
PDFsareconsistentwiththegascompressionbeinginducedbytheeffectsoftheexpandingHIIregions(Schneideretal.2012,Tremblinetal.2014).DeterminingthegaskinematicsintheHII/cloudinterfacesisamissingrequisitetounderstandthetruedynamicsoftheseUV-irradiated regions. High resolution spectral-maps of the bright FIR [CII], [OI], [CI] androtationally excited CO lines, covering the same areas imaged by Herschel are needed toquantifytheradiativeandmechanicalfeedbackofmassivestarsontheirenvironment.Theknowledge of the line profile is mandatory to isolate the different excitation processes,determinetheroleofturbulenceandinteractionofmagneticfield.[CII] and [OI] emission in star-forming regions also arises from dense PDRs at theinterface between HII regions and their parentmolecular cloud (e.g., Stacey et al. 1993).Combinedwith the FIR continuum, both lines can be used to trace the UV radiation fieldfrommassivestarsand,indirectly,estimatethestarformationrate(e.g.,Staceyetal.2010;Pinedaetal.2014;Rigopoulouetal.2014,Magdisetal.2014,Herrera-Camusetal.2015).Oneofthetoofewexamplesinwhichthe[CII]linehasbeenmappedwithHerschel/HIFIathigh angular- and spectral-resolution at large scales (only about 10’x10’) is the regionsurrounding theTrapeziumstellarcluster in theOrionNebula. Velocity-resolvedimagesofthe [CII] and [13CII] lines (0.2 kms-1 resolution), combined with FIR dust thermal emissionimages, have provided an unprecedented view of the intricate small-scale kinematics of theionized/PDR/molecular gas interfaces and of the radiative feedback from massive stars(Goicoechea et al. 2015a, see their Figure 18). For most massive star-forming regions,however, only small-scale mapping in the vicinity of very bright massive protostars andclustershavebeencarriedoutsofarwithHIFIandSOFIA/GREAT(e.g.Perez-Beaupuitsetal.2012; Beuther et al. 2014; Gerin et al. 2015). However, most of the [CII] luminosity isexpected to arise from the extended cloud component. Indeed, this UV-illuminatedwidespreadgasinGMCsislikelytoresembletheunresolvedemissiondetectedfromdistantMilkyWay typegalaxies.Thephysics is expected tobe similar, but thepropertiesof suchregionshavelargelybeenunexploredmainlybecauseofthelackofsuitableinstrumentstomeasurelarge-scale[CII]emissionwiththerequiredsensitivity,angularresolution(tensofarcsecond)andspectralresolution(<1kms-1)intheMilkyWay.RecentSOFIAobservationsof[CII]andthetwo[OI]linesinprotostellarobjects(identifiedascold,deeplyembeddedsubmillimetercoreswithluminousSPIREemission)hasmadethesurprising discovery that sourceswith comparable dust temperatures have [CII] emissionstrengthsthatdifferbymorethana factorof ten,andequivalentwidthsdifferingbymorethanafactoroftwenty.Similarly,the[CII]/[OI]ratiovariesunpredictablybetweensources.Moreover, the results appear NOT to be correlated to the source luminosity, mass,temperature,dustcolumndensity,orotherreadilyidentifiablecharacteristic.Instead,thereare indications from submm spectroscopy that the [CII] emission is correlated to thechemicalevolutionoftheembeddedprotostar.Amissionwithhighspectroscopicresolutionandsensitivity togetherwithaproperunderstandingof theexcitationprocesses involved,enablesustousetheseabundantatomicspeciesasapowerfulnewdiagnosticoftheearliest,deeplyembeddedphasesofstarformationintheMilkyWayandbeyond.TheGalactic Center deserves special attention, as it is the closest galactic nucleus we canstudybelowthe~1pcscaleintheFIR(e.g.Molinarietal.2011).ThepropertiesoftheISMintheinner~100pcoftheMilkyWayaremarkedlydifferentfromthegalaxydisk.Widespreadshocks,high-energyradiation,enhancedmagneticfieldsandstrongtidalforces,allshapeavery singular interstellar environment. Despite its uniqueness and relevance in a broaderextragalactic context, thepropertiesof theGalacticCentergasanddust that survive theseharshconditionsandfuelstarformationtherearenotfullyunderstood.Owingtothelower

37
extinctioneffects in theFIRcompared toMIRobservations,andbecauseof thestrongFIRemission from the interstellar component related to AGN and star formation (atomic finestructure lines and excited lines from CO, H2O, OH, hydride ions…), the relevance of FIRspectroscopic observations to characterize extragalactic nuclei properties has greatlyimproved thanks to Herschel (see the low spectral resolution spectrum in Figure 4.7).Herschel/PACShasprovidedlow-resolutionspectral-mapsofthebrightestFIRlinesaroundSgrA*(e.g.Goicoecheaetal.2013).Velocity-resolvedlinemapsoftheentireGalacticCenterregionintheseFIRspectrallinediagnostics(a3Dsurvey),willunveiltheenergysourcesandtrue gas kinematic in this emblematic region and provide an unique template forextragalacticnucleistudies.
Figure4.8Spatiallyandvelocityresolvedobservationsofthe[CII]158µmlinefromionizedatomiccarbon,ofa~7.5x11.5arcminfieldtowardstheOrionnebulaobservedbyHerschel/HIFIat~11’’resolution.Theresultingdatacube(or'3Dview'),togetherwithancillaryFIRdustemissionandCOdataprovidesanewviewoftheiconicTrapeziumregion,ourclosesthigh-massstar-formingregion.a)Integrated[CII]emissionoveranimageofthevisible-lightobtainedbytheHubbleSpaceTelescope.b)Herschel-HIFImapofthetotal[CII]158micronsintegratedlineintensityinKkms-1fromvLSR-30to+30kms-1.(Goicoecheaetal.2015a)
4.6 Originofdustgrainsfromevolvedstarsandsupernovae(“stardust”)Despite its importance in thephysicsofgalaxyevolution,exactlyhowdustaccumulates intheir ISM is still not well understood. Asymptotic giant branch (AGB) stars, low- andintermediate-mass (1-8 M
�) evolved stars, have been confirmed to be the site of dust
formation(e.g.Habing1996;Blumetal.2006;Coxetal.2011;Venturaetal.2012;Kervellaet al. 2015). Dust grains formed via condensation within stellar winds of AGB stars areslowly expelled, and eventually incorporated into the ISM.Most recent studies of galaxiessuggestthatdustgrainsformedfromAGBsconstituteonlyafractionofthedustintheISM:nomorethan50%intheMilkyway(Dwek1998;Tielens2009),andonlyafewpercentintheMagellanicClouds(Matsuuraetal.2009;2013;Boyeretal.2012;Schneideretal.2014).
a)# b)#
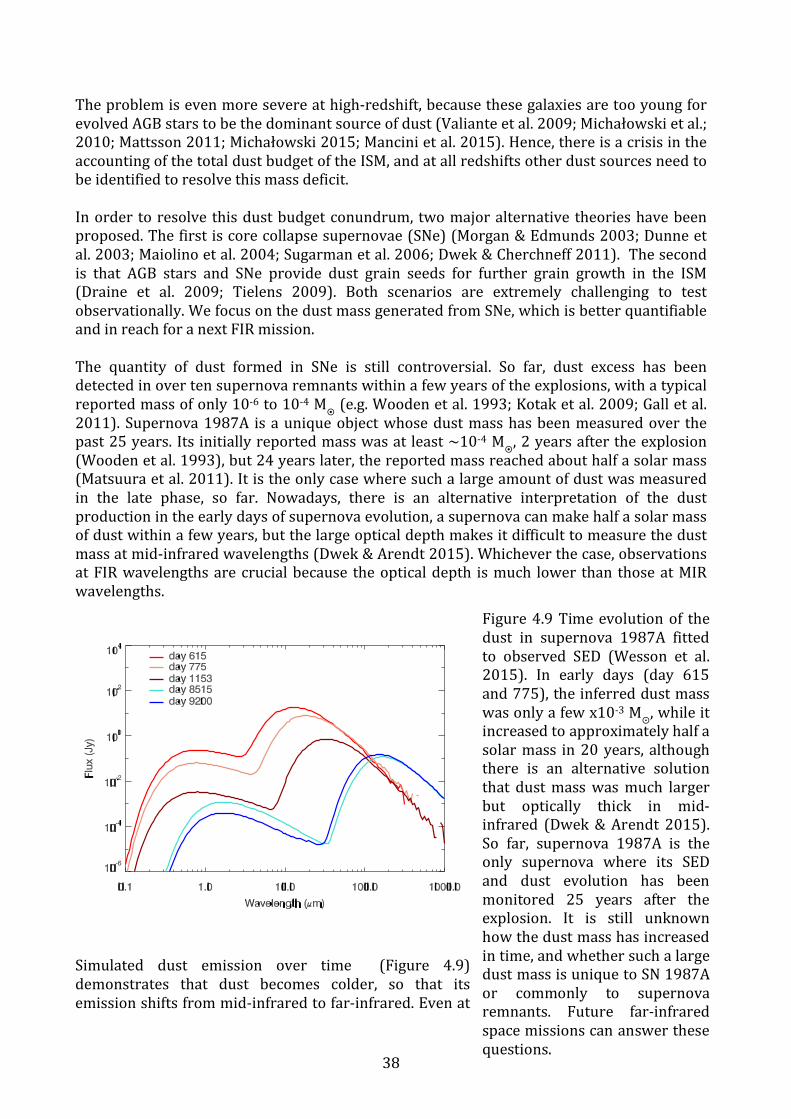
38
Theproblemisevenmoresevereathigh-redshift,becausethesegalaxiesaretooyoungforevolvedAGBstarstobethedominantsourceofdust(Valianteetal.2009;Michałowskietal.;2010;Mattsson2011;Michałowski2015;Mancinietal.2015).Hence,thereisacrisisintheaccountingofthetotaldustbudgetoftheISM,andatallredshiftsotherdustsourcesneedtobeidentifiedtoresolvethismassdeficit.Inorder toresolve thisdustbudgetconundrum, twomajoralternative theorieshavebeenproposed.Thefirstiscorecollapsesupernovae(SNe)(Morgan&Edmunds2003;Dunneetal.2003;Maiolinoetal.2004;Sugarmanetal.2006;Dwek&Cherchneff2011).Thesecondis that AGB stars and SNe provide dust grain seeds for further grain growth in the ISM(Draine et al. 2009; Tielens 2009). Both scenarios are extremely challenging to testobservationally.WefocusonthedustmassgeneratedfromSNe,whichisbetterquantifiableandinreachforanextFIRmission.The quantity of dust formed in SNe is still controversial. So far, dust excess has beendetectedinovertensupernovaremnantswithinafewyearsoftheexplosions,withatypicalreportedmassofonly10-6to10-4M
¤(e.g.Woodenetal.1993;Kotaketal.2009;Galletal.
2011).Supernova1987A isauniqueobjectwhosedustmasshasbeenmeasuredover thepast25years.Its initiallyreportedmasswasat least~10-4M
¤,2yearsaftertheexplosion
(Woodenetal.1993),but24yearslater,thereportedmassreachedabouthalfasolarmass(Matsuuraetal.2011).Itistheonlycasewheresuchalargeamountofdustwasmeasuredin the late phase, so far. Nowadays, there is an alternative interpretation of the dustproductionintheearlydaysofsupernovaevolution,asupernovacanmakehalfasolarmassofdustwithinafewyears,butthelargeopticaldepthmakesitdifficulttomeasurethedustmassatmid-infraredwavelengths(Dwek&Arendt2015).Whicheverthecase,observationsatFIRwavelengthsarecrucialbecause theopticaldepth ismuch lower than thoseatMIRwavelengths.
Simulated dust emission over time (Figure 4.9)demonstrates that dust becomes colder, so that itsemissionshiftsfrommid-infraredtofar-infrared.Evenat
Figure4.9Timeevolutionof thedust in supernova 1987A fittedto observed SED (Wesson et al.2015). In early days (day 615and775),theinferreddustmasswasonlyafewx10-3M
�,whileit
increasedtoapproximatelyhalfasolarmass in20years, althoughthere is an alternative solutionthat dustmasswasmuch largerbut optically thick in mid-infrared (Dwek&Arendt 2015).So far, supernova 1987A is theonly supernova where its SEDand dust evolution has beenmonitored 25 years after theexplosion. It is still unknownhowthedustmasshasincreasedintime,andwhethersuchalargedustmassisuniquetoSN1987Aor commonly to supernovaremnants. Future far-infraredspacemissionscananswerthesequestions.

39
thetimeofJWSTandtheSPICAera,dustmeasurementsinlatephaseofsupernovaewillbechallenging.ExceptforSN1987A,locatedat50kpc,themajorityofnearbysupernovaearefound beyond 1 Mpc (Smart 2009; Otsuka et al. 2011). The JWST can detect dust fromnearbynewlyexplodedSNe,but it cancoveronly themid-infrared range,beingunable todetect cold dust. Future high-sensitivity FIR space missions will therefore be vital foransweringthequestionofsupernovadustproduction.Analternativeistomeasuredustcontentinevolvedsupernovaremnants(SNRs).Sofar,thedustmasseshasbeenmeasuredinahandfulofGalacticSNRsandtheMagellanicClouds(e.g.Williamsetal.2006;Rhoetal.2008;Barlowetal.2010;Gomezetal.2011).Againthedustmassdiscrepancy,foundbetweenMIRandFIRmeasurements(Rhoetal.2008;Barlowetal.2010),couldimplythatstrongemissionfromthehotdustcomponentmighthideemissionfromcolderdust,whilethecolddusttendstodominatethetotaldustmass.Herscheldataofthe SNRs in the Large Magellanic Cloud, located only at 50 kpc, suffer from severe ISMcontamination problems (Lakicevic et al. 2015), hence high angular resolution and highsensitivity from future FIR space observatories are vital to resolve the origin of dust ingalaxies.
4.7 MasslossofAGBstarsAsmentionedabove,AGBstellarwindsarethoughttobeasignificantsourceofdustgrainsingalaxies.ThemasslossofAGBstarsisthoughttooriginatefromthermalpulsationsinthestellaratmosphereandradiationpressureondustgrainsformedinthecoolestlayers(e.g.,Wood1979;Caster1981).Assomematerialislevitatedfromtheatmospherebypulsations,radiation pressure on dust grains initiates outwards motion, the motion of dust grainscarrieswithitsurroundinggas,andmasslossstarts.Althoughthisisanattractiveconceptfor mass loss triggering, modelling of the AGB contribution requires observationalconstraintsoutofreachandscopeofcurrentsinstrumentation.
Figure4.10TheradialvelocitystructureoftheAGBstar,IKTau(Decinetal.2010).Thewindspeedisacceleratednearthedustformingregion,whereSiOisdepletedtodustgrains.Spatiallyresolvedimagingofmultiplemolecularimagesatfar-infraredwillresolvethisradialvelocitystructureprecisely.
1014 1015 1016 1017
radius [cm]
0
5
10
15
20
25
velo
city
[km
/s]
0.01 0.10 1.00 10.00 100.00angular distance [arcseconds]
SiO
H2O H2O
H2O
OHOH CO
model 3: beta-law with beta=1model 2: v(r) from CO + HCN
model 1: v(r) from CO

40
Early ISO observations of AGB stars helped our understanding of AGBmass loss throughdetections of silicates (in amorphous and crystalline form) and water (both gaseous andsolid (ice) phases) (e.g., Barlow 1998; Sylvester et al. 1999; Molster et al. 2002a, b).However, themass-lossbehaviourof oxygen-rich starsdiffers fromcarbon-rich stars, andmodelsarestillnotcompletelysuccessful(e.g.,Woitke2006;Decinetal.2010;Karovicovaetal.2013). TheHerschelSpaceObservatorydetectedfar-infraredrotationalmolecularlinesincludingH2OvapourandotherhydridestogetherwithCO(Decinetal.,2010;Lombaertetal. 2013;Matsuura et al. 2014; Khouri et al. 2014; Danilovich et al. 2015,Maercker et al.2016); these transitions originate from the gas at temperatures of about 1000 K. Thistemperaturecorrespondsapproximatelytodustcondensing,wherewindaccelerationstarts(Figure 4.10). Herschel also provided observational constraints for dust formationmechanisms in the stellar wind with the 69μm forsterite feature (de Vries et al. 2014;Blommaertetal.2014).Resolvingthesetransitionsonbothimageandvelocitywillprovideamuchclearerpicturehowdustisdistributed,andthushowthegasisaccelerated.ALMAcanresolvemolecularemission(seeFigure4-11,Ramstedtetal.2014,seealsoDecinetal.2015),andfree-freeemissioninAGBshasbeenidentifiedbycm-VLAobservations(e.g.,Matthews&Karovska2006),buttransitionscoveredbyALMAtendtobefromcoldgasfromtheouterpartofthecircumstellarenvelope.FIRtransitionsfrom50to500µmareidealfortracinghot/warm(100-1000K)gas,makingFIRthebestregimeforinvestigatingthewindacceleration region. The required angular resolution is about a few arcsec to 1 arcsec toresolvethedustaccelerationradiusfornearbyred-supergiantsandAGBstars.
4.8 ScientificRequirementsHere we assess the technical/observational requirements for each of the science casesdescribed above. A summary of the requirements is given in the table at the end of thesection.Therearetwokeyrequirementsthatarecommontomostofthesciencecaseswereviewed:highspectralresolutionandmappingoflargeareasoftheGalacticPlaneandHighGalacticlatitude.Thespectralresolution(0.5-1km/sec)iscrucialtodisentanglethevariouscomponents (ionized, neutral) of the ISM (Sections 4.2, 4.3 & 4.4) and in particular tomeasure the amountofCO-darkgas (4.3). Assessing feedback frommassive starswouldrequireresolutionofabout1-10km/secalbeitadequatesensitivityisalsoimportant.
Figure4-11CO(3-2)ALMAmapoftheAGBbinaryMiraAB,velocityaveragedaround43km/s(left)and50km/s(right).Thebubble(left)andspiralstructure(right)areclearlyvisible(takenfromRamstedtetal.2014).

41
Sciencecase Area
coverageSpectralResolution
SpatialResolution
Sensitivity5s1hr/FOV
PhasesoftheISM ~3600GalPlane
0.5-1km/s ~30” 1x10-19Wm-2
CO-darkclouds >3000GalPlaneHGLS
0.5-1km/s ~30” 1x10-19Wm-2
MWstarformation Large>5000sq.deg
10km/s ~30” 1x10-20Wm-2
HighMassstars >1000sq.deg
1-10km/s ~12” 1x10-20Wm-2
Originofdust N/A N/A 10” 3mJy
4.9 ReferencesAbdo,A.A.,Ackermann,M.,Ajello,M.,etal.2010,ApJS,188,405André,P.,Men'shchikov,A.,Bontemps,S.,etal.2010,A&A,518,L102André,P.,DiFrancesco,J.,Ward-Thompson,D.,etal.2014,ProtostarsandPlanetsVI,27Barlow,M.J.,Krause,O.,Swinyard,B.M.,etal.2010A&A518,L138Bennett,C.L.,Fixsen,D.J.,Hinshaw,G.,etal.1994,ApJ,434,587Beuther,H.,Ragan,S.E.,Ossenkopf,V.,etal.2014,A&A,571,A53Blommaert,J.A.D.L.,DeVries,B.L.,Waters,L.B.F.M.,etal.2014,A&A565,109Blum,R.D.,Mould,J.R.,Olsen,K.A.,etal.2006,AJ132,2034Boyer,M.L.,Srinivasan,S.,Riebel,D.,etal.,2012,ApJ748,40Brunt,C.M.,Heyer,M.H.,&MacLow,M.M.2009,A&A,504,883Capak,P.L.,Carilli,C.,Jones,G.,etal.2015,Nature,522,455Cox,N.L.J.,García-Hernández,D.A.,García-Laro,P.etal.2011,AJ141,111Crawford,M.K.,Genzel,R.,Townes,C.H.&Watson,D.M.1985,ApJ,291,755Crutcher,R.M.2012,ARAA,50,29Dalgarno,A.&McCray,R.A.1972,ARAA,10,375Dame,T.M.,Hartmann,Dap,Thadeus,P.,2001,ApJ547,792Dame,T.M.&Thaddeus,P.2011,ApJL,734,L24Danilovich,T.,Teyssier,D.,Justtanont,K.,etal.2015,A&A581,60Decin,L.,Justtanont,K.,DeBeck,E.,etal.2010,A&A521,L4Decin,L.,Richards,A.M.S.,Neufeld,D.,etal2015,A&A574,A5DeVries,B.L.,Blommaert,J.A.D.L.,Waters,L.B.F.M.,etal2014,A&A561,A75Draine,B.T.,2009,ASPC414,453Dunne,L.,Eales,S.,Ivison,R.,etal.2003,Nature424,285DwekE.,1998,ApJ501,643
42
Dwek,E.,&Cherchneff,I.,2011,ApJ727,63Dwek,E.,&Arendt,R.G.,2015,ApJ810,75Evans,N.J.,II,Dunham,M.M.,Jorgensen,J.K.,etal.2009,ApJS,181,321-350Gall,C.,Hjorth,J.,Andersen,A.C.,2011,A&ARv19,1Gerin,M.,Ruaud,M.,Goicoechea,J.R.,etal.2015,A&A,573,A30Gerin,M.,Neufeld,D.A.&Goicoechea,J.R.2016,ARAA,inpress.Grenier,I.A.,Casandjian,J.M.,&Terrier,R.2005,Science,307,1292Godard,B.,Falgarone,E.,Gerin,M.,etal.2012,A&A,540,A87Goicoechea,J.R.,Etxaluze,M.,Cernicharo,J.,etal.2013,ApJL,769,L13Goicoechea,J.R.,Teyssier,D.,Etxaluze,M.,etal.2015a,ApJ,812,75Goicoechea,J.R.,Chavarria,L.,Cernicharo,J.,etal.2015b,ApJ,799,102Gomez,F.A.,Coleman-Smith,C.E.,O’Shea,B.W.,etal.2012,ApJ760,96Habing,H.,1996,A&ARv7,97Hacar,A.,Tafalla,M.,Kauffmann,J.,&Kovacs,A.2013,A&A,554,A55Haffner,L.M.,Dettmar,R.J.,Beckman,J.E.,etal.2009,Rev.Mod.Phys.,81,969Hennebelle,P.&Falgarone,E.2012,AAPR,20,55Herrera-Camus,R.,Bolatto,A.D.,Wolfire,M.G.,etal.2015,ApJ,800,1Herczeg,G.J.,Karska,A.,Bruderer,S.,etal.2012,A&A,540,A84Hollenbach,D.J.&Tielens,A.G.G.M.1999,Rev.Mod.Phys.,71,173Hosokawa,T.&Inutsuka,S.-i.2006,ApJ,646,240Indriolo,N.,Neufeld,D.A.,Gerin,M.,etal.2015,ApJ,800,40Joblinetal.2016,inprepKalberla,P.M.W.,&Kerp,J.2009,ARAA,47,27Karovicova,I.,Wittkowsi,M.,Ohnaka,K.,etal.2013,A&A560,75Karska,A.,Herczeg,G.J.,vanDishoeck,E.F.,etal.2013,A&A,552,A141Karska,A.,Herpin,F.,Bruderer,S.etal.2014,A&A,562,A45Kervella,P.,Montarges,M.,Lagadec,E.,etal.2015,A&A578,A77Khouri,T.,DeKoter,A.,Decin,L.,etal2014,A&A570,A67Kotak,R.,Meikle,W.P.S.,Farrah,D.,etal.2009,ApJ704,306Lada,C.J.,Forbrich,J.,Lombardi,M.,&Alves,J.F.2012,ApJ,745,190Lakicevic,M.,VanLoon,J.Th.,Meixner,M.,etal.2015,ApJ799,50Langer,W.D.,Velusamy,T.,Pineda,J.L.,etal.2010,A&A,521,L17Langer,W.D.,Velusamy,T.,Pineda,J.L.,Willacy,K.,&Goldsmith,P.F.2014,A&A,561,A122Lombaert,R.,Decin,L.,DeKoter,A.,etal.2013,A&A554,142Madden,S.C.,Poglitsch,A.,Geis,N.,etal.1997,ApJ483,200Magdis,G.E.,Rigopoulou,D.,Hopwood,R.,etal.2014,ApJ,796,63MaerckerM.,Vlemmings,W.H.T.,Brunner,M.,etal.2016,A&A586,A5Maiolino,R.,Schneider,R.,Oliva,E.,etal.2004,Nature431,533Mancini,M.,Schneider,R.,Graziani,L.,etal.2015,MNRAS451,70Matthews,L.D.,&Karovska,M.,2006,ApJ637,49Mattsson,L.,Pilyugin,L.S.,Bergvall,N.,2011MNRAS414,781MatsuuraM.,Barlow,M.J.,Zijlstra,A.A.,etal.2009,MNRAS396,918MatsuuraM.,Dwek,E.,Meixner,M.,etal.2011,Science333,1258MatsuuraM.,Woods,P.M.,Owen,P.J.,2013,MNRAS429,2527MatsuuraM.,Yates,J.A.,Barlow,M.J.,etal.2014,MNRAS437,532McKee,C.F.,&Ostriker,E.C.2007,ARAA,45,565McKee,C.F.,&Tan,J.C.2002,Nature,416,59Michalowski,M.,Hjorth,J.,Watson,D.,2010A&A514,67Michalowski,M.,2015,A&A577,80
43
Molinari,S.,Swinyard,B.,Bally,J.etal.2010,A&A,518,L100Molinari,S.,Bally,J.,Noriega-Crespo,A.,etal.2011,ApJL,735,L33Morgan&Edmunds2003,MNRAS343,427Neufeld,D.A.,Goicoechea,J.R.,Sonnentrucker,P.,etal.2010,A&A,521,L10Otsuka,M.,Meixner,M.,Panagia,M.,etal.2012,ApJ744,26Perez-Beaupuits,J.P.,Wiesemeyer,H.,Ossenkopf,V.,etal.2012,A&A,542,L13Persson,C.M.,Gerin,M.,Mookerjea,B.,etal.2014,A&A,568,A37Pineda,J.L.,Langer,W.D.,Velusamy,T.,&Goldsmith,P.F.2013,A&A,554,A103Pineda,J.L.,Langer,W.D.,&Goldsmith,P.F.2014,A&A,570,A121PlanckCollaborationXIX,Ade,P.A.R.,Aghanim,N.,etal.2015,A&A,576,A104PlanckCollaborationXXXII,Adam,R.,Ade,P.A.R.,etal.2016,A&A,586,A135PlanckCollaborationXXXV,Ade,P.A.R.,Aghanim,N.,etal.2016,A&A,586,A138Ramstedt,S.,Mohamed,S.,Vlemmings,W.H.T.,etal.2014,A&A570,14Rho,J.,Kozasa,T.,Reach,W.T.,etal.2008,ApJ673,271Rigopoulou,D.,Hopwood,R.,Magdis,G.E.,etal.2014,ApJL,781,L15Schneider,N.,Csengeri,T.,Hennemann,M.,etal.2012,A&A,540,L11Schneider,R.,Valiante,R.,Ventura,P.,etal.2014,MNRAS442,1440Smart,S.,2009,ARA&A47,63Stacey,G.J.,Jaffe,D.T.,Geis,N.,etal.1993,ApJ,404,219Stacey,G.J.,Hailey-Dunsheath,S.,Ferkinhoff,C.,etal.2010,ApJ,724,957Sugerman,B.E.K.,Ercolano,B.,Barlow,M.J.,etal.2006,Science313,196Tan,J.,C.,&McKee,C.F.,2013,ASPC267,267Tielens,A.G.G.M.,2009,”ThePhysicsandchemistryoftheinterstellarmedium”CambridgeTremblin,P.,Schneider,N.,Minier,V.,etal.2014,A&A,564,A106Valiante,R.,Schneider,R.,Bianchi,S.,etal.2009,MNRAS397,1661vanDishoeck,E.F.,Kristensen,L.E.,Benz,A.O.,etal.2011,PASP,123,138Ventura,P.,Criscienzo,M.Di,Schneider,R.,etal.2012,MNRAS424,2345Wesson,R.,Barlow,M.J.,Matsuura,M.,etal.2015,MNRAS446,2089Williams,B.J.,Borzowski,K.J.,Reynolds,S.P.,etal.2006,ApJ652,L33Wolfire,M.G.,McKee,C.F.,Hollenbach,D.,&Tielens,A.G.G.M.2003,ApJ,587,278Wooden,D.H.,Rank,D.M.,Bregman,J.D.,etal.1993,ApJS88,477Zinnecker,H.,&Yorke,H.W.2007,ARAA,45,481

44
5 FeedbackanddustingalaxiesinthelocaluniverseTheproximityofgalaxiesintheLocalUniverseenablesustostudystar-formingregionswithaspatially-resolvedscrutinythatisnotpossibleathighredshift.ThisisimportantbecausephysicalconditionsofmanynearbygalaxiesaremoreextremethanthosefoundintheMilkyWay itself. Even within the Local Group, R136, the massive star cluster powering theTarantulaNebula(30Doradus)intheLargeMagellanicCloud(LMC)ismorethan10timesmoremassivethanthemostmassivestarcluster intheMilkyWay(McLaughlin&vanderMarel 2005). Beyond the Local Group, the Super Star Clusters (SSCs) in nearby (dwarf)galaxies NGC1569 and NGC1705 are more than 30 times brighter than R136, even aftercorrectingforagedifferences(O’Connelletal.1994);stellardensitiesarehigherbysimilaramounts.Thisimpliesthattostudythevastparameterspaceofstarformationovercosmictimes,wemustgobeyondtheMilkyWaytothestudyofnearbygalaxiesthatoffersaccesstoa wealth of details that high-z galaxies do not. Here we discuss three key questions fornearbygalaxiesthatarestilloutstandingandemphasizedbyrecentIRspacemissions,andthatcanonlybepursuedintheFIR.
5.1 FIRfine-structurelinesasprobesofstar-formationactivityWiththeadventofALMA,theuseoftheFIRfine-structure(FS)linessuchas[CII]158µmand[NII]205µmlinesasmeasuresofthestarformationrate(SFR)isnowroutinelyextendedtothe high-redshift universe (the lines shift from the FIR to submillimeterwavelengths). Infact, [CII] detections in redshift z~6 star-forming galaxies with ALMA are more commonthandetectionofmoleculargas(e.g.,Otaetal.2014;Capaketal.2015;Maiolinoetal.2015;Willottetal.2015).Yet, the validity of using FIR FS methods to estimate SFR still requires to be fullyobservationallyandtheoreticallyestablished.Thekeyassumptionisthedependenceofthedustgrainphoto-electricheatingrateonthespecificphysicalconditions.Modelshaveonlybeen really tested throughFIRobservations for conditions relevant fordense and intensePDRssuchastheOrionBar(Tielensetal1993)andforconditionsrelevanttodiffusecloudsusing UV absorption measurements (Pottasch et al 1979). Nevertheless, Herschelobservations of [CII] in the MilkyWay show that the [CII]-SFR relation extends over sixorders ofmagnitude, but onlyby considering that [CII] emissionoriginates fromdifferentISMphases(e.g.,densePDRs,coldHI,CO-darkH2,andionizedgas:Pinedaetal.2014). Asshown in Figure 5-1 the [CII]-SFR relation for the combined phases in our Galaxy isconsistentwith that found fordistantgalaxies(e.g.,Rigopoulouetal.2014,deLoozeetal.2011,2014;Herrera-Camusetal.2015;Ciganetal.2016).Recentmodelsarealsoimprovingourtheoreticalunderstandingofthisrelationship(e.g.,Vallinietal.2015).[NII] tracesthe ionizedgas,comingbothfromthecompactHII regionsandfromthemorediffusecomponent.HerschelobservationsofourGalaxy(e.g.Perssonetal.2014,Kirketal.2010) show that the [NII]205µm line emission is extended and presents broad lines. Indistant galaxies, because of its close relationwith SFR as a tracer of ionized gas, [NII] isgainingpopularity (Hugheset al. 2016;Zhaoet al. 2016;Luet al. 2015). [CII]158µmand[NII]205µm, shifted to (sub)mm wavelengths, are observable with ALMA and provideimportantconstraintsontheSFRathighz.OtherlinesarealsopotentiallyvaluabletracersofSFRasshowninFigure5-2.Indeed,thereissomeindicationthat[CII]maynotbethebestprobe,becauseofpossible contributions fromregionssuchasdensePDRsanddiffusegas
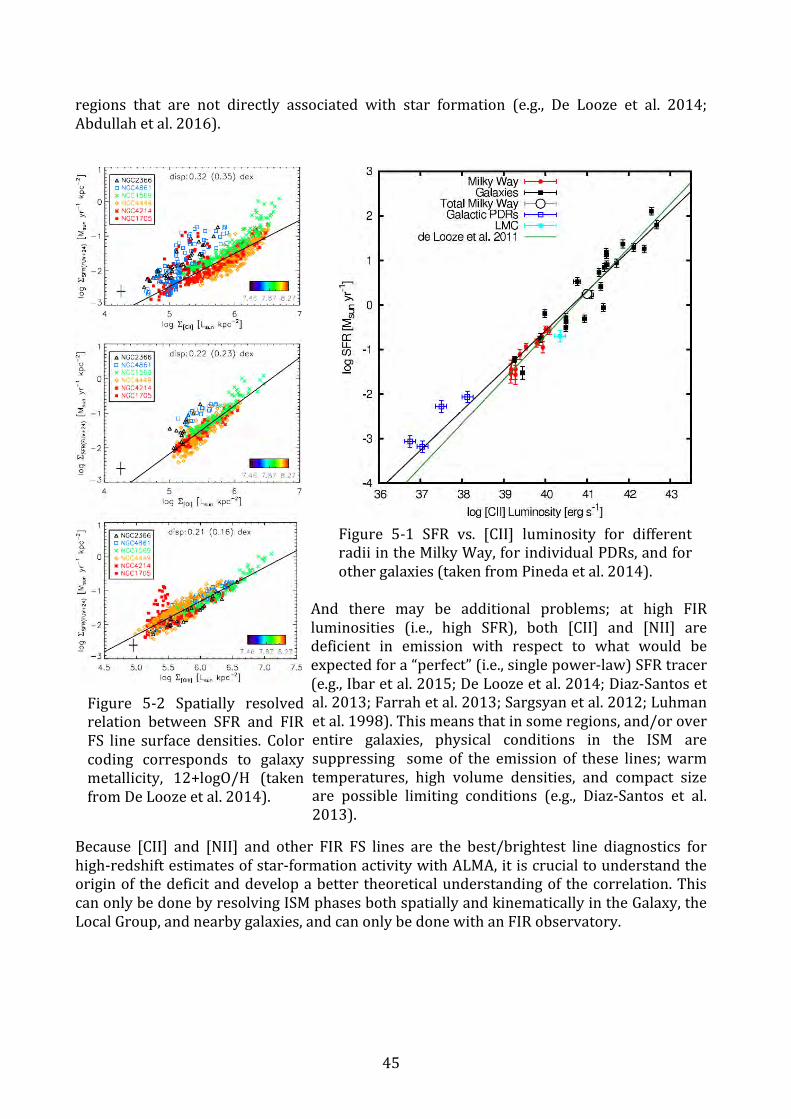
45
regions that are not directly associated with star formation (e.g., De Looze et al. 2014;Abdullahetal.2016).
And there may be additional problems; at high FIRluminosities (i.e., high SFR), both [CII] and [NII] aredeficient in emission with respect to what would beexpectedfora“perfect”(i.e.,singlepower-law)SFRtracer(e.g.,Ibaretal.2015;DeLoozeetal.2014;Diaz-Santosetal.2013;Farrahetal.2013;Sargsyanetal.2012;Luhmanetal.1998).Thismeansthatinsomeregions,and/oroverentire galaxies, physical conditions in the ISM aresuppressing some of the emission of these lines;warmtemperatures, high volume densities, and compact sizeare possible limiting conditions (e.g., Diaz-Santos et al.2013).
Because [CII] and [NII] and other FIR FS lines are the best/brightest line diagnostics forhigh-redshiftestimatesofstar-formationactivitywithALMA,itiscrucialtounderstandtheoriginof thedeficitanddevelopabettertheoreticalunderstandingof thecorrelation.ThiscanonlybedonebyresolvingISMphasesbothspatiallyandkinematicallyintheGalaxy,theLocalGroup,andnearbygalaxies,andcanonlybedonewithanFIRobservatory.
Figure 5-2 Spatially resolvedrelation between SFR and FIRFS line surface densities. Colorcoding corresponds to galaxymetallicity, 12+logO/H (takenfromDeLoozeetal.2014).
Figure 5-1 SFR vs. [CII] luminosity for differentradiiintheMilkyWay,forindividualPDRs,andforothergalaxies(takenfromPinedaetal.2014).
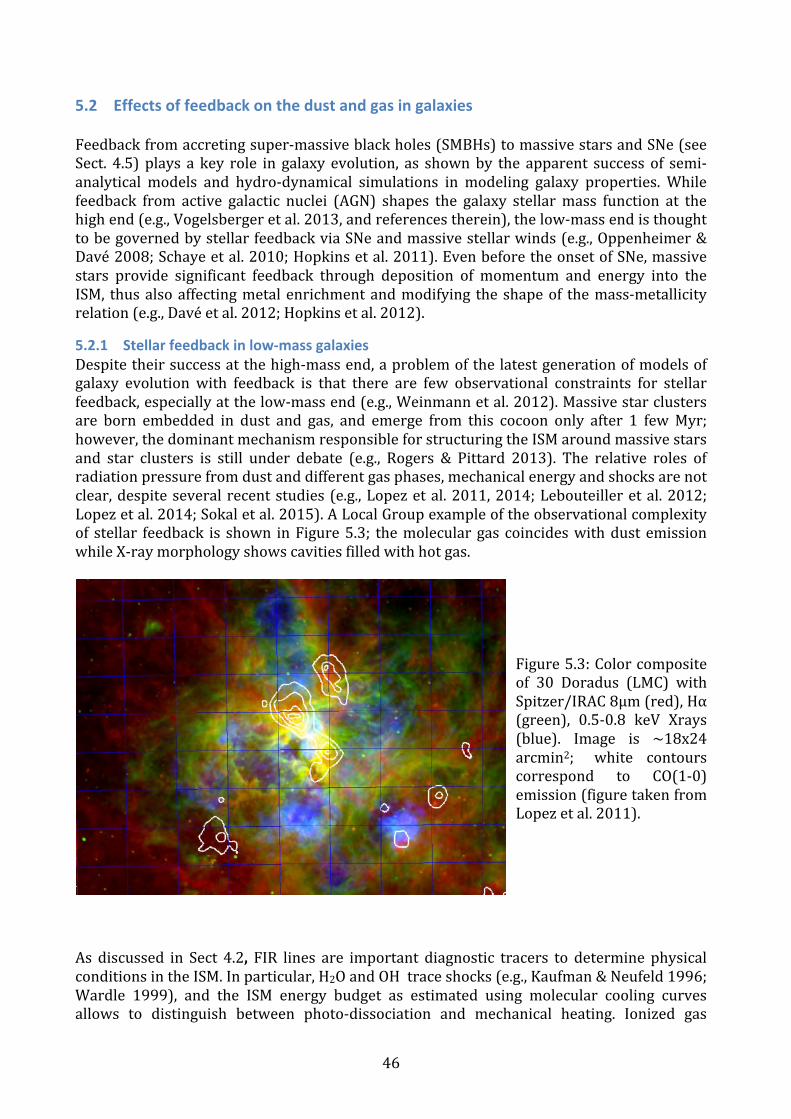
46
5.2 EffectsoffeedbackonthedustandgasingalaxiesFeedbackfromaccretingsuper-massiveblackholes(SMBHs)tomassivestarsandSNe(seeSect. 4.5) plays a key role in galaxy evolution, as shownby the apparent success of semi-analytical models and hydro-dynamical simulations in modeling galaxy properties. Whilefeedback from active galactic nuclei (AGN) shapes the galaxy stellarmass function at thehighend(e.g.,Vogelsbergeretal.2013,andreferencestherein),thelow-massendisthoughttobegovernedbystellarfeedbackviaSNeandmassivestellarwinds(e.g.,Oppenheimer&Davé2008;Schayeetal.2010;Hopkinsetal.2011).EvenbeforetheonsetofSNe,massivestars provide significant feedback through deposition of momentum and energy into theISM, thusalsoaffectingmetalenrichmentandmodifying theshapeof themass-metallicityrelation(e.g.,Davéetal.2012;Hopkinsetal.2012).
5.2.1 Stellarfeedbackinlow-massgalaxiesDespitetheirsuccessatthehigh-massend,aproblemofthelatestgenerationofmodelsofgalaxy evolution with feedback is that there are few observational constraints for stellarfeedback,especiallyatthelow-massend(e.g.,Weinmannetal.2012).Massivestarclustersare born embedded in dust and gas, and emerge from this cocoon only after 1 fewMyr;however,thedominantmechanismresponsibleforstructuringtheISMaroundmassivestarsand star clusters is still under debate (e.g., Rogers & Pittard 2013). The relative roles ofradiationpressurefromdustanddifferentgasphases,mechanicalenergyandshocksarenotclear,despiteseveralrecentstudies(e.g.,Lopezetal.2011,2014;Lebouteilleretal.2012;Lopezetal.2014;Sokaletal.2015).ALocalGroupexampleoftheobservationalcomplexityof stellar feedback is shown inFigure5.3; themoleculargas coincideswithdust emissionwhileX-raymorphologyshowscavitiesfilledwithhotgas.
Figure5.3:Colorcompositeof 30 Doradus (LMC) withSpitzer/IRAC8μm(red),Hα(green), 0.5-0.8 keV Xrays(blue). Image is ~18x24arcmin2; white contourscorrespond to CO(1-0)emission(figuretakenfromLopezetal.2011).
As discussed in Sect 4.2, FIR lines are important diagnostic tracers to determine physicalconditionsintheISM.Inparticular,H2OandOHtraceshocks(e.g.,Kaufman&Neufeld1996;Wardle 1999), and the ISM energy budget as estimated using molecular cooling curvesallows to distinguish between photo-dissociation and mechanical heating. Ionized gas

47
tracerssuch[OIII]λ88marerelatively insensitivetoelectrontemperatures,butvarywithdensity,whilethetwo[NII] lines(122,205μm)canbeusedtomeasureelectrondensities(e.g.Croxalletal.2013);thusthisspectralregionprovidesrobustdiagnosticsfortheionizedgas physical conditions including gas-phasemetallicity even in the presence of dust. Suchstudieshavealreadybeen conducted for specific regions inourGalaxy (see Sect. 4.4) andcosmological simulations at high spatial/spectral resolution at similar scales arefundamentalunderstandtheeffectsoffeedbackinlow-massgalaxies.Dwarf galaxies are themost numerous galaxy populations in the LocalUniverse, but theyalso suffermost from the effects of stellar feedback because of theirweaker gravitationalpotential. TheDwarfGalaxy Survey (Madden et al. 2013, 2014) observed [CII], [OIII], and[OI]in~50dwarfgalaxies.ThespectralandspatialresolutionwasinsufficientforanythingbutglobalmeasurementsbeyondtheLocalGroup.Like forourGalaxy(seeSect.4.4),highspectralresolution,coupledwithhighspatialresolutionismandatorytoassessdustcontent,heatingandcooling,and thealterationof theseprocesses through feedbackat thevariousgas interfaces. A sensitive FIR spacemission would be fundamental for dissecting stellarfeedback in the Local Universe, and informing theoretical models for sub-grid recipes intheoreticalmodelsapplicabletogalaxyevolutionathighredshift.
5.2.2 AGNfeedbackinmassivegalaxies:OHandH2Oastracersofenergeticoutflows
EarlysimulationssuggestedthatAGN-drivenoutflowsaremaindriversofgalaxyevolutioninmassivegalaxies,nowconfirmedbyobservations.Indicationsofbi-polarionizedoutflowswerefoundinz∼2radio-loudAGN(Nesvadbaetal.2008)andionized”ultra-fastoutflows”in local radio-quiet AGN (e.g., Tombesi et al. 2010), but the first systematic observationalevidenceforAGN-drivenmolecularoutflowswasprovidedbyHerschel.
Figure5.4:Spectral fits to theOHλ119μmprofilesof selectedobjects fromVeilleuxetal.(2013) Blue- dashed lines represent the absorption component(s), and the red-dashedcurves theemission.Vertical linesmarkpositionsof the 16OH (dashed)and 18OH (dotted)doublets,andtheCH+(dot-dashed)transitionat119.8μm.Formoredetails,seeVeilleuxetal.(2013).
The direct signature of amassive galactic outflow discovered byHerschel/PACS observa-tionswasaP-Cygni-likeprofileinOH(thehydroxylmolecule,Fischeretal.2010;Sturmetal.2011;Veilleuxetal.2013).AsshowninFigure5.4,themaximumoutflowvelocitiesoftheseIR-luminousAGNcanexceed1000kms-1.Inoneobject,Arp220,aparticularlywell-studiedULIRG,P-CygniprofileswerealsodetectedinothermoleculesincludingH2O(Rangwalaetal.2011; Gonzalez-Alfonso et al. 2012). Following up on these observations, the detailedspatiallyresolvedkinematicmapsinthemoleculargaswereobtainedusingCO(Feruglioet

48
al.2010;Ciconeetal.2014),showingoutflowratesofseveral100M�yr-1,farexceedingthe
SFR in these galaxies. Further ground-basedmm observations found evidence for similaroutflowsinthedensemoleculargastracedbyHCN(Aaltoetal.2012).
Inverse P-Cygni profiles in two luminous IR galaxies (LIRGs) NGC 4418 and Zw 049.057showedevidenceformolecularinfall(Falstadetal.2015;Gonzalez-Alfonsoetal.2012).Boththese galaxies belong to the class of “compact obscured nuclei” and show a wealth ofcomplexorganicmolecules(Costagliolaetal.2015).
The discovery of these molecular outflows/inflows was one of the key milestones ofHerschel, but their study is currently limited to ~40 of the brightest nearby ULIRGs andquasars.ApowerfulFIRobservatoryisneededtocapturethefulldemographicsoflocalAGNandquantifyhowAGNfeedbackregulatesstarformationinhigh-massgalaxies.
5.3 RegulationofthedustcontentingalaxiesAfterISO,Spitzer,andHerschel,ithasbecomeroutinetomeasuredustmassesinavarietyofgalaxies up to z≥2. Indeed, recent studies show that dust emission can be an importantmeasureoftotalISMmassbothlocally(e.g.,Ealesetal.2012;Grovesetal.2015)andathighredshift (Scoville et al. 2014, 2015). However, the dust mass is apparently only a smallfraction of the total ISM mass, so that dust-to-gas ratios and their variation with otherpropertiessuchasmetallicitygiveimportantinsightintothelimitationsofsuchestimationtechniques.
Dust-to-gasmass ratios (DGRs) in galaxies were thought to increase linearly withmetal-licity (as measured by nebular oxygen abundance: e.g., Draine et al. 2007), and such anassumptionisincorporatedinmany,ifnotmost,modelsofISMphysicalconditionsforstarformation(e.g.,Krumholzetal.2009;Wolfireetal.2010;Krumholzetal.2012).However,recentresultsfromHerschelhaveshownthatbelowathresholdmetallicity,of~0.25Z
�,the
DGRdependenceappearsmuchsteeperthanpreviouslythought(Remy-Ruyeretal.2014).Tofurthercomplicatethematter,carefulmeasurementsofdustmassatextremelylowmetalabundance indicate that thismaynot be a general rule (Hunt et al. 2014), and that otherparameterssuchasISMdensitycaninfluencetheformationofdustgrainsandthusthetotalamount of dust mass (e.g., Schneider et al. 2016). DGRs plotted against metallicities areshowninFigure5.5; it isevident(seetherightpanel) thatonlyahandfulofgalaxieshavemeasured dust masses below metallicities of 12+log(O/H)∼7.5 and the Herschel DwarfGalaxySurveyneedstobedramaticallyexpanded.
However,evenafterthe importantHerschelDwarfGalaxySurvey(Maddenetal.2013),asshowninFigure5.5therearestilltoofewgalaxieswithdustmassesmeasuredatextremelylowmetallicities(i.e.,12+log(O/H)≤7.7,∼0.1Z⊙).Suchmetallicitiesareimportantbecausethey characterize the transition between pristine metal-free star formation in the earlyuniverseandthemetal-richchemicallyevolvedgalaxiescommonatthecurrentepoch.Dustemissioninlow-metallicitygalaxiestendstobequitewarm(e.g.,Huntetal.2005;Galametzet al. 2010; Remy-Ruyer et al. 2013), signifying different physical conditions in the ISM,similar to those of galaxies at higher redshift (see Sect. 6.2). A new sensitive FIR spaceobservatory would help disentangle the current discrepancies in metal-poor local dwarfgalaxies, andpave theway for abetterunderstandingof large scale grain formation, dustevolution,andstarformationinhigh-zgalaxypopulations.
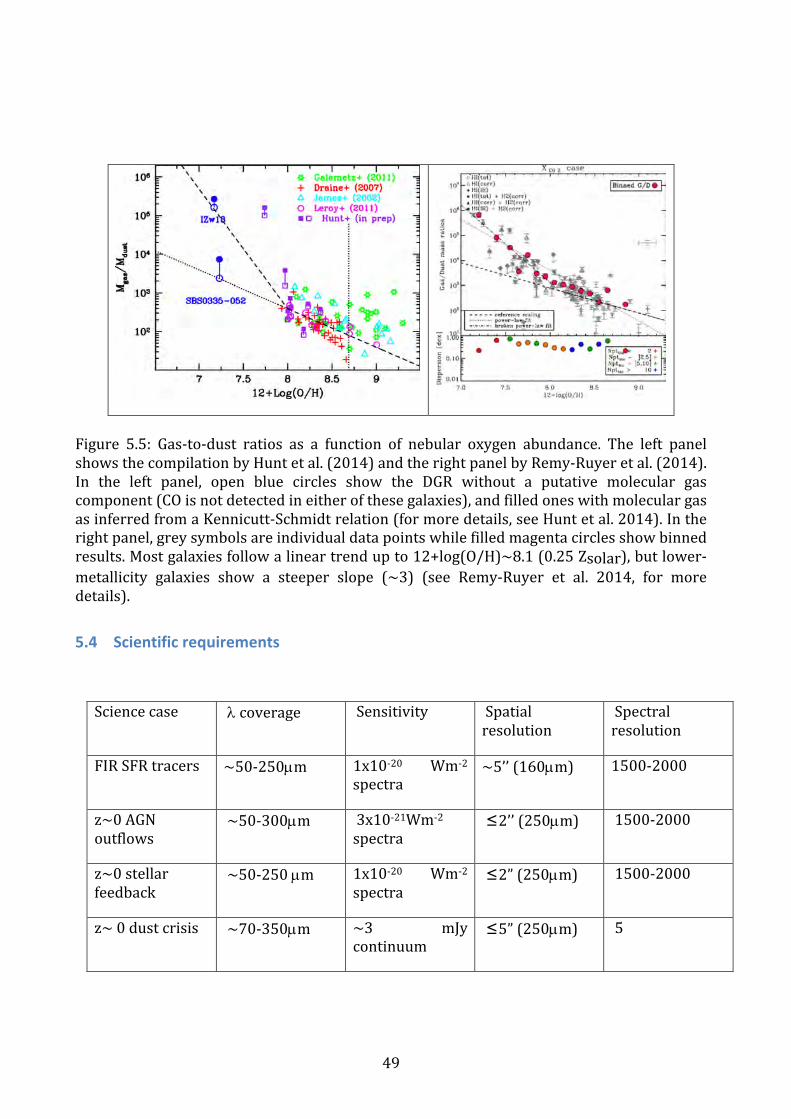
49
Figure 5.5: Gas-to-dust ratios as a function of nebular oxygen abundance. The left panelshowsthecompilationbyHuntetal.(2014)andtherightpanelbyRemy-Ruyeretal.(2014).In the left panel, open blue circles show the DGR without a putative molecular gascomponent(COisnotdetectedineitherofthesegalaxies),andfilledoneswithmoleculargasasinferredfromaKennicutt-Schmidtrelation(formoredetails,seeHuntetal.2014).Intherightpanel,greysymbolsareindividualdatapointswhilefilledmagentacirclesshowbinnedresults.Mostgalaxiesfollowalineartrendupto12+log(O/H)∼8.1(0.25Zsolar),butlower-metallicity galaxies show a steeper slope (~3) (see Remy-Ruyer et al. 2014, for moredetails).
5.4 Scientificrequirements
Sciencecase lcoverage Sensitivity Spatialresolution
Spectralresolution
FIRSFRtracers ~50-250µm 1x10-20 Wm-2spectra
~5’’(160µm) 1500-2000
z~0AGNoutflows
~50-300µm 3x10-21Wm-2spectra
≤2’’(250µm) 1500-2000
z~0stellarfeedback
~50-250µm 1x10-20 Wm-2spectra
≤2”(250µm) 1500-2000
z~0dustcrisis ~70-350µm ~3 mJycontinuum
≤5”(250µm) 5

50
5.5 ReferencesAalto,S.,Garcia-Burillo,S.,Muller,S.,etal.2012,A&A537,A44Abdullah,A.,Brandl,B.B.,Groves,B.,etal.2016,ApJ,submittedCapak,P.L.,Carilli,C.,Jones,G.,etal.2015,Nature,522,455Cicone,C.,Maiolino,R.,Sturm,E.,etal.2014,A&A,562,A21Cigan,P.,Young,L.,Cormier,D.,etal.2016,AJ,151,14Costagliola,F.,Sakamoto,K.,Muller,S.,etal.2015,A&A,582,A91Croxall,K.V.,Smith,J.D.,Brandl,B.R.,etal.2013,ApJ,777,96Davé,R.,Finlator,K.,&Oppenheimer,B.D.2012,MNRAS,421,98DeLooze,I.,Cormier,D.,Lebouteiller,V.,etal.2014,A&A,568,A62DeLooze,I.,Baes,M.,Bendo,G.J.,etal.2011,MNRAS,416,2712Díaz-Santos,T.,Armus,L.,Charmandaris,V.,etal.2013,ApJ,774,68Draine,B.T.,Dale,D.A.,Bendo,G.,etal.2007,ApJ,663,866Eales,S.,Smith,M.W.L.,Auld,R.,etal.2012,ApJ,761,168Falstad,N.,González-Alfonso,E.,Aalto,S.,etal.2015,A&A,580,A52Feruglio,C.,Maiolino,R.,Piconcelli,E.,etal.2010,A&A,518,L155Fischer,J.,Sturm,E.,González-Alfonso,E.,etal.2010,A&A,518,L41Galametz,M.,Madden,S.C.,Galliano,F.,etal.2010,A&A,518,L55González-Alfonso,E.,Fischer,J.,Graciá-Carpio,J.,etal.2012,A&A,541,A4Groves,B.A.,Schinnerer,E.,Leroy,A.,etal.2015,ApJ,799,96Herrera-Camus,R.,Bolatto,A.D.,Wolfire,M.G.,etal.2015,ApJ,800,1Hopkins,P.F.,Quataert,E.,&Murray,N.2012,MNRAS,417,950Hopkins,P.F.,Quataert,E.,&Murray,N.2012,MNRAS,421,3522Hughes,T.M:,Baes,M.,Schirm,M.R.P,etal.2016,A&A,587,A45Hunt,L.,Bianchi,S.,&Maiolino,R.2005,A&A,434,849Hunt,L.K.,Testi,L.,Casasola,V.,etal.2014,A&A,561,A49Ibar,E.,Lara-López,M.A.,Herrera-Camus,R.,etal.2015,MNRAS,449,2498Kaufman,M.J.,&Neufeld,D.A.1996,ApJ,456,611KirkJ.M.,Polehampton,E.,Anderson,L.D.,etal2010,A&A,518,L82Krumholz,M.R.,Dekel,A.,&McKee,C.F.2012,ApJ,745,69Krumholz,M.R.,McKee,C.F.,&Tumlinson,J.2009,ApJ,699,850Lebouteiller,V.,Cormier,D.,Madden,S.C.,etal.2012,A&A,548,AA91Lopez,L.A.,Krumholz,M.R.,Bolatto,A.D.,Prochaska,J.X.,&Ramirez-Ruiz,E.2011,ApJ,731,91Lopez,L.A.,Krumholz,M.R.,Bolatto,A.D.,etal.2014,ApJ,795,121Lu,N.,Zhao,Y.,Xu,C.K.,etal.2015,ApJL,802,L11Luhman,M.L.,Satyapal,S.,Fischer,J.,etal.1998,ApJL,504,L11Madden,S.C.,Rémy-Ruyer,A.,Galametz,M.,etal.2013,PASP125,600Madden,S.C.,Rémy-Ruyer,A.,Galametz,M.,etal.2014,PASP,126,1079Maiolino,R.,Carniani,S.,Fontana,A.,etal.2015,MNRAS,452,54McLaughlin,D.E.,&VanderMarel,R.P.,2005,ApJS,161,304Nesvadba,N.P.H.,Lehnert,M.D.,DeBreuck,C.,Gilbert,A.M.,&vanBreugel,W.2008,A&A,491,407O’Connell,R.W.,Gallagher,J.S.,III&Hunter,D.A.,1994,ApJ433,65Oppenheimer,B.D.,&Davé,R.2008,MNRAS,387,577Ota,K.,Walter,F.,Ohta,K.,etal.2014,ApJ,792,34Persson,C.M.,Gerin,M.,Mookerjea,B.,etal.2014,A&A,568,A37PottaschS.R.,Wesselius,P.R.,vanDuinen,R.J.etal.1979,A&A,74,L15
51
Rangwala,N.,Maloney,P.R.,Glenn,J.,etal.2011,ApJ,743,94Rémy-Ruyer,A.,Madden,S.C.,Galliano,F.,etal.2013,A&A,557,A95Rémy-Ruyer,A.,Madden,S.C.,Galliano,F.,etal.2014,A&A,563,A31RigopoulouD.,Hopwood,R.,Magdis,G.E.,etal.2014,ApJL,781,L15Rogers,H.,&Pittard,J.M.2013,MNRAS,431,1337Schaye,J.,DallaVecchia,C.,Booth,C.M.,etal.2010,MNRAS,402,1536Schneider,R.,Hunt,L.K.,&Valiante,R.2016,MNRAS,inpress,arXiv:1601.01686Scoville,N.,Aussel,H.,Sheth,K.,etal.2014,ApJ,783,84Scoville,N.,Sheth,K.,Aussel,H.,etal.2015,arXiv:1511.05149Sokal,K.R.,Johnson,K.E.,Indebetouw,R.,&Reines,A.E2015,AJ149,115Sturm,E.,González-Alfonso,E.,Veilleux,S.,etal.2011,ApJL,733,L16Tielens,A.G.G.M.,Meixner,M.M.,vanderWerf,P.P.,etal.1993,Science,262,86Tombesi,F.,Cappi,M.,Reeves,J.~N.,etal.2010,A&A,521,A57Vallini,L.,Gallerani,S.,Ferrara,A.,Pallottini,A.,&Yue,B.2015,ApJ,813,36Veilleux,S.,Meléndez,M.,Sturm,E.,etal.2013,ApJ,776,27Vogelsberger,M.,Genel,S.,Sijacki,D.,etal.2013,MNRAS,436,3031Wardle,M.1999,ApJL,525,L101Weinmann,S.M.,Pasquali,A.,Oppenheimer,B.D.,etal.2012,MNRAS,426,2797Willott,C.J.,Carilli,C.L.,Wagg,J.,&Wang,R.2015,ApJ,807,180Wolfire,M.G.,Hollenbach,D.,&McKee,C.F.2010,ApJ,716,1191Zhao,Y.,Lu,N.,Xu,C.K.,etal.2016,ApJ,819,69
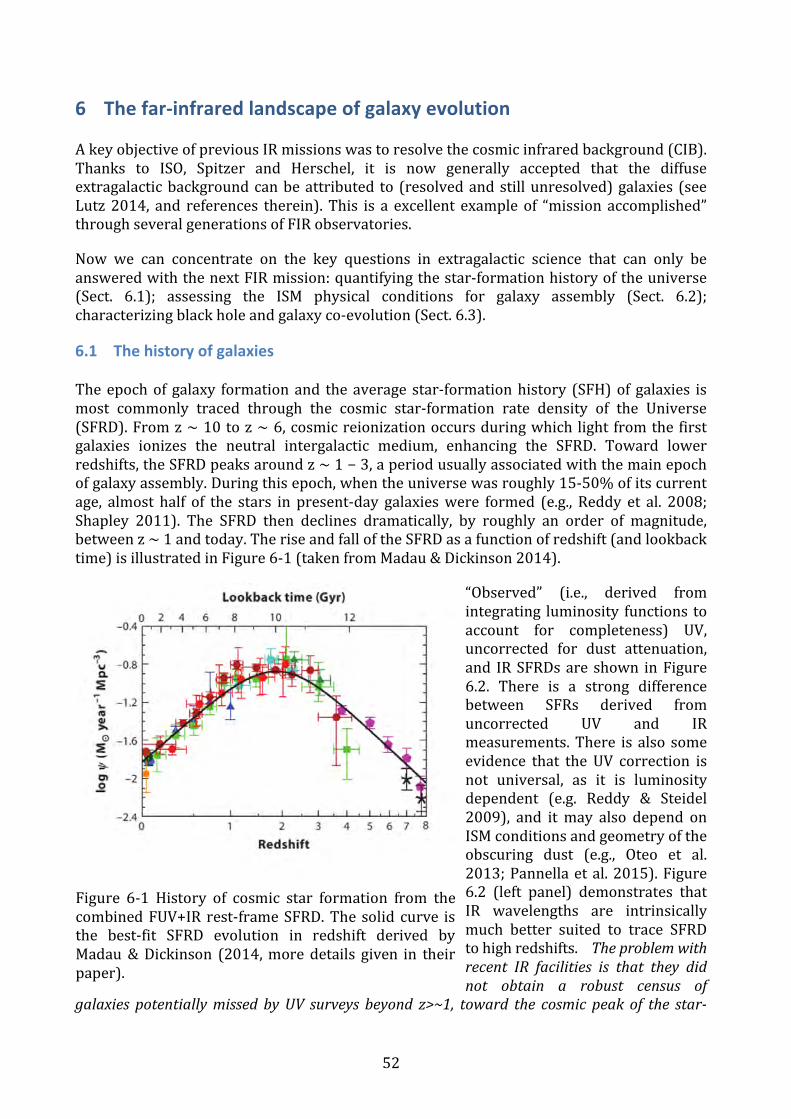
52
6 Thefar-infraredlandscapeofgalaxyevolutionAkeyobjectiveofpreviousIRmissionswastoresolvethecosmicinfraredbackground(CIB).Thanks to ISO, Spitzer and Herschel, it is now generally accepted that the diffuseextragalacticbackgroundcanbeattributed to (resolvedandstillunresolved)galaxies (seeLutz2014, and references therein).This is a excellent exampleof “mission accomplished”throughseveralgenerationsofFIRobservatories.
Now we can concentrate on the key questions in extragalactic science that can only beansweredwiththenextFIRmission:quantifyingthestar-formationhistoryoftheuniverse(Sect. 6.1); assessing the ISM physical conditions for galaxy assembly (Sect. 6.2);characterizingblackholeandgalaxyco-evolution(Sect.6.3).
6.1 ThehistoryofgalaxiesTheepochof galaxy formationand theaverage star-formationhistory (SFH)of galaxies ismost commonly traced through the cosmic star-formation rate density of the Universe(SFRD).Fromz∼10toz∼6,cosmicreionizationoccursduringwhich light fromthefirstgalaxies ionizes the neutral intergalactic medium, enhancing the SFRD. Toward lowerredshifts,theSFRDpeaksaroundz∼1−3,aperiodusuallyassociatedwiththemainepochofgalaxyassembly.Duringthisepoch,whentheuniversewasroughly15-50%ofitscurrentage, almost half of the stars in present-day galaxieswere formed (e.g., Reddy et al. 2008;Shapley 2011). The SFRD then declines dramatically, by roughly an order of magnitude,betweenz∼1andtoday.TheriseandfalloftheSFRDasafunctionofredshift(andlookbacktime)isillustratedinFigure6-1(takenfromMadau&Dickinson2014).
“Observed” (i.e., derived fromintegrating luminosity functions toaccount for completeness) UV,uncorrected for dust attenuation,and IRSFRDsare shown inFigure6.2. There is a strong differencebetween SFRs derived fromuncorrected UV and IRmeasurements.There is also someevidence that the UV correction isnot universal, as it is luminositydependent (e.g. Reddy & Steidel2009), and itmay also depend onISMconditionsandgeometryoftheobscuring dust (e.g., Oteo et al.2013;Pannellaetal.2015).Figure6.2 (left panel) demonstrates thatIR wavelengths are intrinsicallymuch better suited to trace SFRDtohighredshifts. Theproblemwithrecent IR facilities is that they didnot obtain a robust census of
galaxies potentiallymissed byUV surveys beyond z>~1, toward the cosmic peak of the star-
Figure 6-1 History of cosmic star formation from thecombinedFUV+IR rest-frameSFRD.The solid curve isthe best-fit SFRD evolution in redshift derived byMadau&Dickinson (2014,more details given in theirpaper).

53
formationactivityatz>~2.
Figure6.2:Rightpanel:acompilationfromtheliteratureofSFRDsintheFUV(uncorrectedfor dust attenuation) and in the far-IR; left panel: mean ratio of IR and UV luminositydensities as a function of redshift. The differences (integrated over galaxy luminosityfunctions)betweenobservedFUVandFIRSFRDscanbealmostanorderofmagnitude,andshowsthatmostoftheenergyfromstarformationforz~<2isreprocessedbydust.FiguresaretakenfromBurgarellaetal.(2013),moredetailsgiventhere.
Figure6.3showstwoattemptstodothisusingIR-selectedgalaxiesfromtheHerschel/PACSExtragalactic Probe survey (PEP: left panel, Gruppioni et al. 2013) and from theHerschelMulti-tieredExtragalacticSurvey(HerMES)withSPIRE(rightpanel,Caseyetal.2012,2014).TheSFRDsfrombothIR-selectedpopulationsareconsistent(peakingatz~1withSFRD~0.2M�yr-1
Mpc-3),andcomparabletothatfromtheoptical/UV-selectedgalaxypopulationsuptothehighestredshiftssampled(seeFigure6-1).However, thecontributionof IR-selecteddustygalaxiesevolvesstrongly(e.g.,LeFloc’hetal.2005;Caseyetal.2014);thecontributionofultra-LIRGs(ULIRGs)isinsignificantatz∼0,butincreasesupto∼50%atz>~2asshowninFigure6.3,butseealsoRowan-Robinsonetal.2016.ThereissomeindicationthattheIRselectedsamplecontainsdifferentgalaxypopulations than in theUVselectedsample(e.g.,Heinis et al. 2014;Bernhardet al. 2014), and that current theories cannotyet explain theSFRDsobtainedbycombiningUV-andIR-inferredSFRs(Heinisetal.2014).Ultimately,evenby stacking the most sensitive existing Herschel observations, we are probably missing asignificantfractionoffaintdustygalaxiesatthepeakofthecosmicstar-formationactivity.Toresolve this, and determine the importance of dust-obscured galaxies robustly and directly,morepowerfulIRfacilitiesareneeded.
6.2 Galaxyassembly,starformation,andphysicalconditionsintheISMThepeakof star-formationactivityat z~2-3coincideswith thepeakofblack-holegrowth(seeSect.6.1),but thecompleteanswertohowgalaxiesareassembled, formingSMBHsintheir nuclei and stars throughout their disks, remains elusive. The decline of the SFRD atz~<1impliesthatstar-formationactivityintheLocalUniversehasfaded.TheLocalUniversedoes not probe the dramatic differences in galaxy properties at earlier times. Indeed,observations have shown that high-z galaxies have different properties (size, mass, SFR,metal content, dust and gas temperature, density, etc.) than local ones. Nevertheless, the
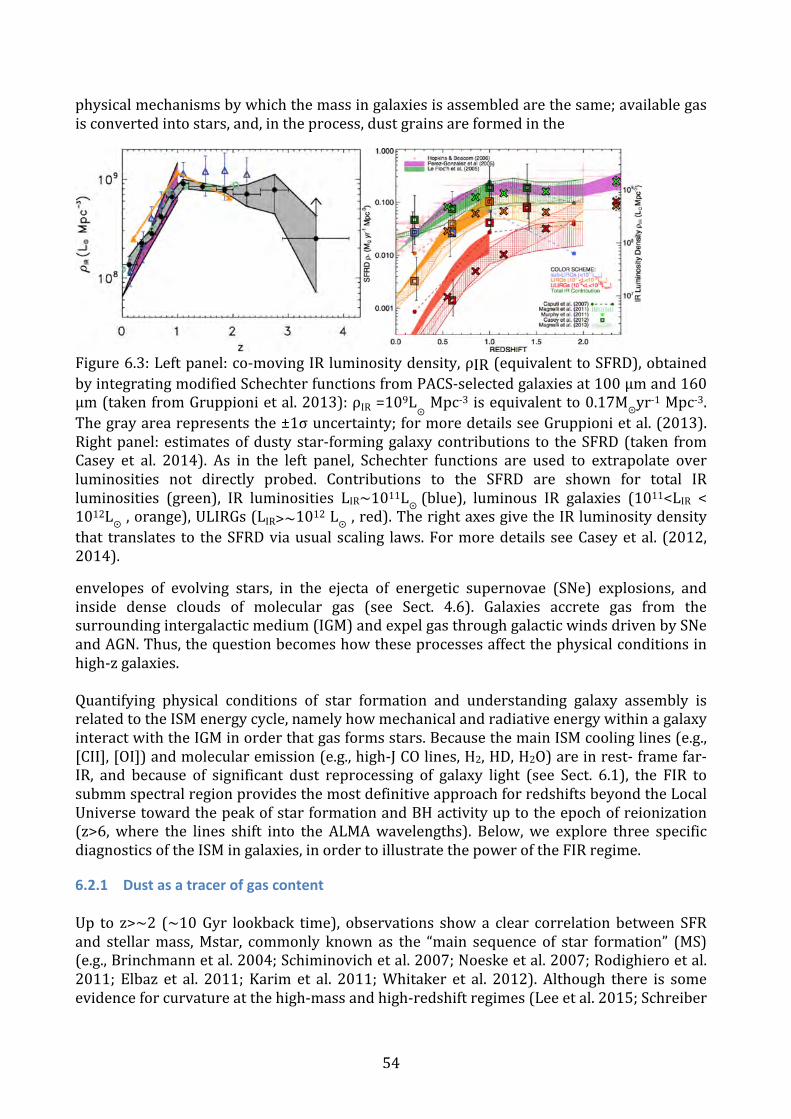
54
physicalmechanismsbywhichthemassingalaxiesisassembledarethesame;availablegasisconvertedintostars,and,intheprocess,dustgrainsareformedinthe
Figure6.3:Leftpanel:co-movingIRluminositydensity,ρIR(equivalenttoSFRD),obtainedbyintegratingmodifiedSchechterfunctionsfromPACS-selectedgalaxiesat100μmand160μm(takenfromGruppionietal.2013):ρIR=109L�
Mpc-3 isequivalentto0.17M�yr-1Mpc-3.
Thegrayarearepresentsthe±1σuncertainty;formoredetailsseeGruppionietal.(2013).Rightpanel:estimatesofdustystar-forminggalaxycontributions to theSFRD(taken fromCasey et al. 2014). As in the left panel, Schechter functions are used to extrapolate overluminosities not directly probed. Contributions to the SFRD are shown for total IRluminosities (green), IR luminosities LIR~1011L� (blue), luminous IR galaxies (1011<LIR <1012L
� ,orange),ULIRGs(LIR>~1012L
� ,red).TherightaxesgivetheIRluminositydensitythat translates to theSFRDviausual scaling laws.Formoredetails seeCaseyetal. (2012,2014).
envelopes of evolving stars, in the ejecta of energetic supernovae (SNe) explosions, andinside dense clouds of molecular gas (see Sect. 4.6). Galaxies accrete gas from thesurroundingintergalacticmedium(IGM)andexpelgasthroughgalacticwindsdrivenbySNeandAGN.Thus,thequestionbecomeshowtheseprocessesaffectthephysicalconditionsinhigh-zgalaxies.Quantifying physical conditions of star formation and understanding galaxy assembly isrelatedtotheISMenergycycle,namelyhowmechanicalandradiativeenergywithinagalaxyinteractwiththeIGMinorderthatgasformsstars.BecausethemainISMcoolinglines(e.g.,[CII],[OI])andmolecularemission(e.g.,high-JCOlines,H2,HD,H2O)areinrest-framefar-IR, and because of significant dust reprocessing of galaxy light (see Sect. 6.1), the FIR tosubmmspectralregionprovidesthemostdefinitiveapproachforredshiftsbeyondtheLocalUniversetowardthepeakofstarformationandBHactivityuptotheepochofreionization(z>6,where the lines shift into the ALMAwavelengths). Below,we explore three specificdiagnosticsoftheISMingalaxies,inordertoillustratethepoweroftheFIRregime.
6.2.1 DustasatracerofgascontentUp to z>~2 (~10Gyr lookback time), observations showa clear correlationbetween SFRand stellarmass,Mstar, commonly known as the “main sequence of star formation” (MS)(e.g.,Brinchmannetal.2004;Schiminovichetal.2007;Noeskeetal.2007;Rodighieroetal.2011; Elbaz et al. 2011; Karim et al. 2011;Whitaker et al. 2012). Although there is someevidenceforcurvatureatthehigh-massandhigh-redshiftregimes(Leeetal.2015;Schreiber

55
etal.2015),theslopeofthecorrelationisroughlyconstantwithredshiftbutthezeropointshifts(e.g.,Karimetal.2011;Speagleetal.2014).AtagivenMstar,high-zgalaxiesformstarsat ahigher rate thanat z∼0as illustrated inFigure6.4. The shift of theSFMSpositionimplies that the definition of “starburst” galaxies must change with redshift. In fact, thisnotionhasbeencorroboratedbyHerschelobservationsofcosmicdeepfields(e.g.,Magdisetal.2012;Schreiberetal.2015;Pannellaetal.2015).Atallcosmicepochs,galaxiesontheMShave cooler dust than starbursts, but the typical dust temperature Tdust of MS galaxiesincreaseswith increasing redshift (e.g.,Magnelli et al. 2014), togetherwith an increasingintensityoftheinterstellarradiationfield(Magdisetal.2012).Thus,thephysicalconditionsinalocalstarburstwouldcloselyresembleaMSgalaxyatz~1.5(e.g.,Pannellaetal.2015).SuchchangesalmostcertainlyaffectthemoleculargasandaltertheCOluminosity-H2massconversionfactor(Magnellietal.2012;Genzeletal.2015).TheyalsocomplicatetheuseofIR template schemes for high-z galaxieswhich rely on a correlationbetweenLIRandTdust,ratherthanonsSFR(e.g.,Chary&Elbaz2001;Dale&Helou2002;Daleetal.2014).
Figure6.4:Leftpanel:SpecificSFRvs.Mstar fordifferentredshiftbins.Rightpanel:SpecificSFRasafunctionofredshiftfordifferentMstarbins(takenfromSchreiberetal.2015,moredetailsgivenintheirpaper).TheshiftinSFRwithredshiftisclearlyevidentintheleftpanel.
One of the main drivers of the behavior of the SF MS is thought to be the larger gasreservoirsavailableathighredshift(e.g.,Lagosetal.2015;Genzeletal.2015;Bothwelletal.2016).Becausegas-to-dustratiosarewellbehaved,atleastlocally(e.g.,Draineetal.2007;Leroy et al. 2011), gasmass and its variation as functionof redshift canbederivedusingdustmassmeasurements (Santini et al. 2014; Bethermin et al. 2015; Genzel et al. 2015);such measurements can be obtained using deep (mostly stacked) Herschel observations(Magnelli et al. 2012; Saintonge et al. 2013; Santini et al. 2014;Dessauges-Zavadsky et al.2015;Genzeletal.2015;Betherminetal.2015).Figure6.5showsgasfractionsderivedfromdustmassesobtainedfromstackedHerschelobservations(Santinietal.2014;Betherminetal. 2015) compared to gas mass measured from CO observations (Magnelli et al. 2012;Saintongeetal.2013;Dessauges-Zavadskyetal.2015).IntheabsenceofCOmeasurements,thegasmassisobtainedbyusingthemetallicity-dependentrecipeforgas-to-dustratiosinthe Local Universe determined by Leroy et al. (2011) coupled with metallicities derivedusingthescalingrelations(Mstar,SFR,andoxygenabundance)whichareaccurateto~0.15dex(e.g.,Mannuccietal.2010,2011;Huntetal.2012,2016).Despiteseveralassumptions,sofartheresultsareencouraging;asseeninFigure6.5,theCO-basedestimatesofH2masses

56
arewithinthesamerangeofthedust-basedestimatesfortotalgasmass.Moreover,highergas-massfractionsatagivenredshiftareassociatedwithgalaxieswellabovetheSFMS(e.g.,starbursts), and increase with decreasing stellar mass (see also Magdis et al. 2012).Currently only using stacking we can sample high stellar masses (Mstar>1011M�
) beyondz>~2,thepeakofthecosmicSFRD.Togobeyondthe“tipoftheiceberg”andmeasuredustmassesthatcoverarangeofstellarmassestogetherwithgalaxypopulationsonandoffthemainsequencerequiresnewIRfacilitiesthatprobethelong-wavelengthdustemission.
Figure 6.5 Gas fractions in different galaxy populations as a function of redshift. SamplesfromSantinietal.(2014)andBetherminetal.(2015)relyondust-massmeasurements,con-vertedtogasmassaccordingtothedustmetallicityfunctioncalibratedatz~0(Leroyetal.2011).Theremainingsamplesincludesub-millimetergalaxies(SMGs,Magnellietal.2012)and lensedgalaxies (Saintongeetal.2013;Dessauges-Zavadskyetal.2015)withH2massestimated from CO observations converted to H2 masses using a metallicity-dependentconversionfactor(takenfromGinolfietal.2016,inprep.).
6.2.2 Molecules,ISMcooling,andstarformationMolecular gas ultimately provides the fuel for star formation, so molecular tracers arearguably the best diagnostics to assess heating and cooling of the ISM in galaxies andunderstand at a physical level how gas is converted into stars. After H2, CO is the mostabundantmolecule in the ISM, followed by H2O1(e.g. Omont et al. 2013; Carilli &Walter2013;Yangetal.2013).
Duetothelackofapermanentdipolemomentandhighexcitationenergies,H2emissionisdifficulttoobservedirectly(lowestrotationaltransitionliesat∼28μm);thus,COhasbeenhistoricallyadoptedasaproxyfortracingcoolmoleculargas.Althoughlow-JCOtransitionstracethebulkofthecoolgasmass,theygivevirtuallynoinsightintohowtheISMcools.Forthispurpose,COcoolingcurves (or spectral-lineenergydistributions,SLEDs,orexcitationladders) including higher-J transitions are necessary. While low-J CO transitions can
1Herewerefertowatervapour,ratherthaneitherwatermasersorwatericeingrainmantles,thelatterofwhichismoreeasilyobservedatnear-andmid-infraredwavelengths(e.g.Boogertetal.2015).

57
effectivelybestudiedfromtheground,H2Oandhigher-J(J>6)COtransitionsatz~<0.1canonly be studied from space. Combining different CO transitions is important because COexcitationdistinguisheswhetherornotahigh-redshiftgalaxyisontheSFMS(e.g.,Carilli&Walter2013,andreferencestherein).TheCOcontentinmassivestar-formingdisksatz~1-2is lessexcited than in turbulentstarbursts (e.g.,Narayanan&Krumholz2014;Daddietal.2015;Liuetal.2015),butit isdifficulttodistinguishbetweenthetwoscenarioswithonlyhigh-Jorlow-Jtransitions(e.g.,Rigopoulouetal.,2013,Kamenetzkyetal.2014).Figure6-6illustratesthediagnosticpowerofhigh-JCOlines,andhowtemperatureanddensityintheISMchangeCOexcitation.
Inadditionusingmodelsofsingle-componentphoton-dominatedregions(PDRs)areusuallyinsufficient to explain ISM energetics. In nearby starbursts, luminous IR galaxies (LIRGs),andgalaxieshostingAGN,morePDRcomponentsareneededtoexplainthehigh-Jemission,andfrequentlyphotonexcitationisnotenough;mechanicalheatingthroughshocksand/orturbulence is needed aswell (e.g., Greve et al. 2014; Kazandjian et al. 2015) as shown inFigure6-6 (Rosenberget al. 2014,2015).Understanding ISMheatingandcooling throughmolecularexcitationwillconstraintheprocessofstarformation.HerschelmadeitpossibletostudytheISMcoolingmechanismsthroughCOspectrallineenergydistributions(SLEDs)atlowredshift,buttomeasuremolecularexcitationforgalaxieswithz>0.1andtowardthepeakofthecosmicSFRD,moresensitivefacilitiesareneeded.
Figure 6-6 Normalized CO cooling curves as a function oftemperature and density up to J=9 (taken from Carilli &Walter2013).
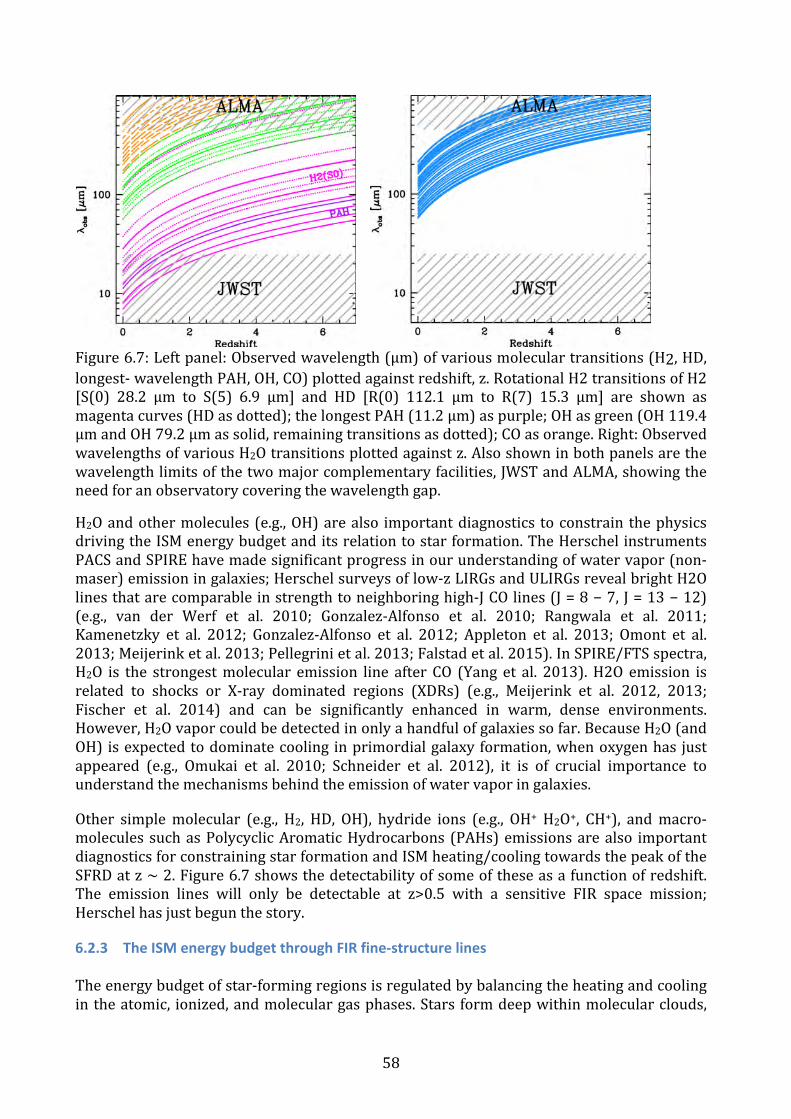
58
Figure6.7:Leftpanel:Observedwavelength(μm)ofvariousmoleculartransitions(H2,HD,longest-wavelengthPAH,OH,CO)plottedagainstredshift,z.RotationalH2transitionsofH2[S(0) 28.2 μm to S(5) 6.9 μm] and HD [R(0) 112.1 μm to R(7) 15.3 μm] are shown asmagentacurves(HDasdotted);thelongestPAH(11.2μm)aspurple;OHasgreen(OH119.4μmandOH79.2μmassolid,remainingtransitionsasdotted);COasorange.Right:ObservedwavelengthsofvariousH2Otransitionsplottedagainstz.Alsoshowninbothpanelsarethewavelengthlimitsofthetwomajorcomplementaryfacilities,JWSTandALMA,showingtheneedforanobservatorycoveringthewavelengthgap.
H2Oandothermolecules(e.g.,OH)arealso importantdiagnostics toconstrain thephysicsdrivingtheISMenergybudgetanditsrelationtostarformation.TheHerschelinstrumentsPACSandSPIREhavemadesignificantprogressinourunderstandingofwatervapor(non-maser)emissioningalaxies;Herschelsurveysoflow-zLIRGsandULIRGsrevealbrightH2Olinesthatarecomparableinstrengthtoneighboringhigh-JCOlines(J=8−7,J=13−12)(e.g., van der Werf et al. 2010; Gonzalez-Alfonso et al. 2010; Rangwala et al. 2011;Kamenetzky et al. 2012; Gonzalez-Alfonso et al. 2012; Appleton et al. 2013; Omont et al.2013;Meijerinketal.2013;Pellegrinietal.2013;Falstadetal.2015).InSPIRE/FTSspectra,H2O is the strongestmolecular emission line after CO (Yang et al. 2013).H2Oemission isrelated to shocks or X-ray dominated regions (XDRs) (e.g., Meijerink et al. 2012, 2013;Fischer et al. 2014) and can be significantly enhanced in warm, dense environments.However,H2Ovaporcouldbedetectedinonlyahandfulofgalaxiessofar.BecauseH2O(andOH) isexpectedtodominatecooling inprimordialgalaxyformation,whenoxygenhas justappeared (e.g., Omukai et al. 2010; Schneider et al. 2012), it is of crucial importance tounderstandthemechanismsbehindtheemissionofwatervaporingalaxies.
Other simplemolecular (e.g., H2, HD, OH), hydride ions (e.g., OH+ H2O+, CH+), andmacro-moleculessuchasPolycyclicAromaticHydrocarbons (PAHs)emissionsarealso importantdiagnosticsforconstrainingstarformationandISMheating/coolingtowardsthepeakoftheSFRDatz∼2.Figure6.7showsthedetectabilityofsomeoftheseasafunctionofredshift.The emission lines will only be detectable at z>0.5 with a sensitive FIR space mission;Herschelhasjustbegunthestory.
6.2.3 TheISMenergybudgetthroughFIRfine-structurelinesTheenergybudgetofstar-formingregionsisregulatedbybalancingtheheatingandcoolingintheatomic, ionized,andmoleculargasphases.Starsformdeepwithinmolecularclouds,

59
where dust and dense gas shield CO from photodissociation. On the other hand, at thesurfaceoftheclouds,theextinctionislow,dust-andself-shieldingarelesseffective,andUVradiationheatsthegas,dissociatingCO.Thus,therearechemicallydistincttransitionregionswithin a star-forming region defined by relative abundances of various gas phases: fromH+/H/H2onthecloudinnersurface(visualextinctionAV~0)anintermediatedepth(AV~3-5)where[CII], [CI],andCOcoexist, toverydeepwithintheclouds(AV>10)whereH2andCOarethedominantgascomponents(e.g.,Hollenbach&Tielens1999;Hollenbachetal.2009).Sinceatlowextinction(orlowmetallicity,seeBolattoetal.2013),COessentiallydisappearsbecauseofphoto-dissociation,[CII]canbeusedasaneffectivetracerof“CO-dark”moleculargas(e.g.,Wolfireetal.2010;Leroyetal.2011;PlanckCollaborationetal.2011;Lebouteilleretal.2012;Pinedaetal.2014;seealsoSect.4.3).
FIR fine-structure (FS) lines are fundamental tools to understand the balance and energybudgetofthedifferentISMgasphasesandstarformation;inthepresenceofdustextinction,they are virtually the only tools available. CO-dark gas can only be probed through FIRtransitions. Neutral gas heating is thought to be governed mainly through photo-electricheatingofthedust,namelyelectronsejectedfromthesurfaceofthegrainsbyimpingingUVradiation(e.g.,Tielens&Hollenbach1985).Thecoolingoftheneutralgas isdominatedbyFIRFSlineswithexcitationpotentials<13.6eV,mainly[OI]λ63,146μmand[CII]λ158μm.Suchlines,inparticular[CII],canemituptoafewpercentoftheFUVenergy,reprocessedbydust, fromstar formation.UVradiation fromstar formationalso ionizesgas,which in thepresence of dust is best traced by FIR FS lines including [OIII]λ52, 88μm and [NII]λ122,205μm;[CII]alsotracestosomeextentionizedgas,makingitsinterpretationmorecomplexthantheotherpurelyionizedtracers(e.g.,Cormieretal.2015;Croxalletal.2015).FirstISOand now Herschel observations have enabled us to make great progress in ourunderstandingof [CII]emission ingalaxies (e.g.,Malhotraetal.1997;Luhmanetal.1998,2003;Gracia-Carpioetal.2011;Sargsyanetal.2012;Diaz-Santosetal.2013;Farrahetal.2013;DeLoozeetal.2014;Rigopoulouetal.2014;Magdisetal.2014;Sargsyanetal.2014;Ibar et al. 2015; Cormier et al. 2015; Herrera-Camus et al. 2015; Rosenberg et al. 2015;Spinoglioetal.2015),andhavepavedthewayto[CII]detectionswithALMAingalaxiesatveryhighredshift,closetotheEpochofReionization(e.g.,Maiolinoetal.2015;Capaketal.2015;Willottetal.2015).
[CII] emission, and to some extent [OI] and [NII], seem to correlate with other galaxyproperties includingLIR, sSFR,Tdust, IR surfacebrightnessΣIR,OHabsorptiondepth, andother parameters (e.g., Luhman et al. 1998, 2003; Gracia-Carpio et al. 2011; Coppin et al.2012;Sargsyanetal.2012;Diaz-Santosetal.2013;Farrahetal.2013;Ibaretal.2015;Gonzalez-Alfonso et al. 2015). Because of this, as discussed in Sect. 5.1, [CII] is also commonlyusedtotracetheSFR(e.g.,DeLoozeetal.2014;Sargsyanetal.2014;Herrera-Camusetal.2015).However,thesecorrelationsbreakdown(thereisanemission-linedeficit)athighLIRhighspecificSFR,warmdust temperature,highΣIRanddeepOHabsorption.Thiscausesadeficit that is attributed to strong far-UV radiation fields impeding the efficiency of gasheatingbycreatinganexcessofchargeddustgrains(e.g.,Tielensetal.1999;Croxalletal.2012), although other mechanisms may play a role (e.g., Abel et al. 2009). Ultimately,because of the breakdown in the correlations, at some level the viability of using [CII] totraceSFRneedtobefullycalibrated.Inthisrespectformetal-poorhigh-zgalaxies,[OI]maybeabettertracerofSFRatlowmetallicitiesinnearbydwarfgalaxies(DeLoozeetal.2014),and is insomecasesbrighterthanthe[CII] line(Cormieretal.2015). [OI] isalsobrighterthan[CII]indensegas(Meijerinketal.2007),andmayultimatelyprovetobeabettertracer
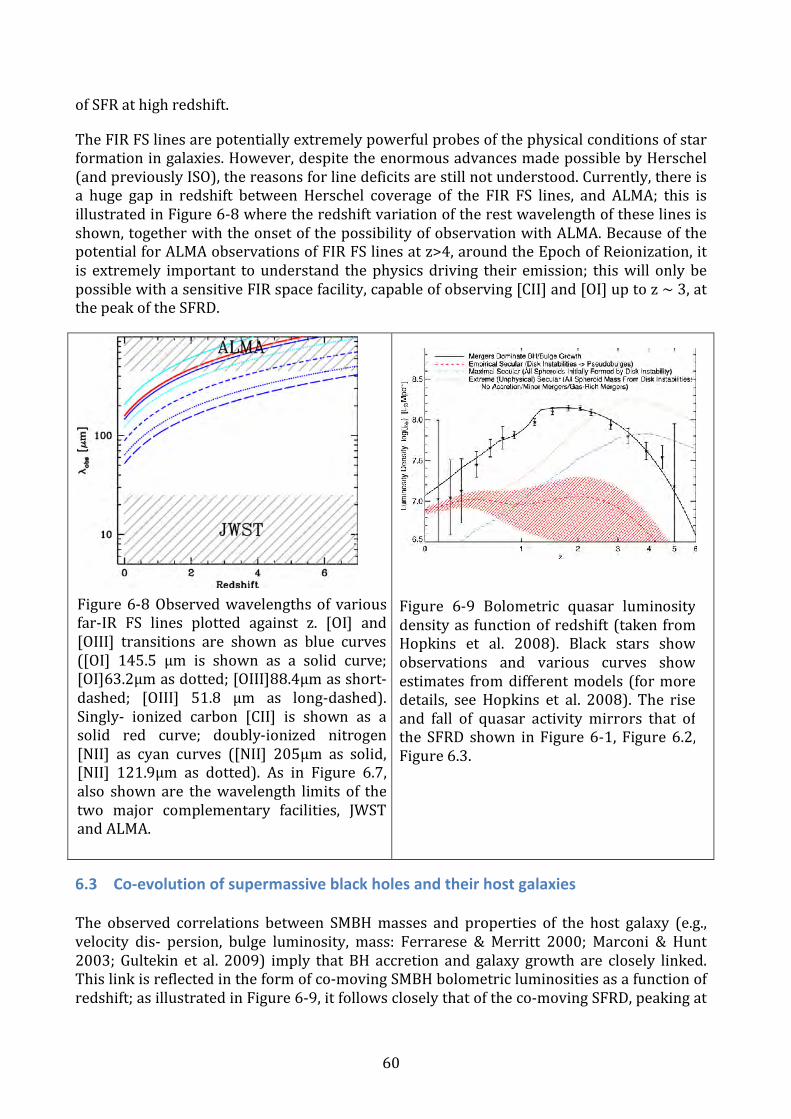
60
ofSFRathighredshift.
TheFIRFSlinesarepotentiallyextremelypowerfulprobesofthephysicalconditionsofstarformationingalaxies.However,despitetheenormousadvancesmadepossiblebyHerschel(andpreviouslyISO),thereasonsforlinedeficitsarestillnotunderstood.Currently,thereisa huge gap in redshift between Herschel coverage of the FIR FS lines, and ALMA; this isillustratedinFigure6-8wheretheredshiftvariationoftherestwavelengthoftheselinesisshown,togetherwiththeonsetofthepossibilityofobservationwithALMA.BecauseofthepotentialforALMAobservationsofFIRFSlinesatz>4,aroundtheEpochofReionization,itis extremely important tounderstand thephysicsdriving their emission; thiswill onlybepossiblewithasensitiveFIRspacefacility,capableofobserving[CII]and[OI]uptoz∼3,atthepeakoftheSFRD.
6.3 Co-evolutionofsupermassiveblackholesandtheirhostgalaxiesThe observed correlations between SMBHmasses and properties of the host galaxy (e.g.,velocity dis- persion, bulge luminosity, mass: Ferrarese & Merritt 2000; Marconi & Hunt2003;Gultekin et al. 2009) imply thatBH accretion and galaxy growth are closely linked.Thislinkisreflectedintheformofco-movingSMBHbolometricluminositiesasafunctionofredshift;asillustratedinFigure6-9,itfollowscloselythatoftheco-movingSFRD,peakingat
Figure6-8Observedwavelengthsof variousfar-IR FS lines plotted against z. [OI] and[OIII] transitions are shown as blue curves([OI] 145.5 μm is shown as a solid curve;[OI]63.2μmasdotted;[OIII]88.4μmasshort-dashed; [OIII] 51.8 μm as long-dashed).Singly- ionized carbon [CII] is shown as asolid red curve; doubly-ionized nitrogen[NII] as cyan curves ([NII] 205μm as solid,[NII] 121.9μm as dotted). As in Figure 6.7,also shown are thewavelength limits of thetwo major complementary facilities, JWSTandALMA.
Figure 6-9 Bolometric quasar luminositydensityas functionofredshift (takenfromHopkins et al. 2008). Black stars showobservations and various curves showestimates fromdifferentmodels (formoredetails, see Hopkins et al. 2008). The riseand fall of quasar activity mirrors that ofthe SFRD shown inFigure 6-1, Figure 6.2,Figure6.3.

61
z∼2(seeFigure6-1,Figure6.2,Figure6.3).Theoreticalmodelssuggestthatthegrowthofblack holes also regulates star formation, effectively quenching it in high-mass galaxiesthrough powerful galaxy-scale outflows driven by AGN feedback (e.g., Croton et al. 2006;Hopkinsetal.2006,2008;Somervilleetal.2008).
6.3.1 IdentifyingAGNfeedbackathighredshiftMolecularoutflowsarethoughttobethe“smokinggun”ofAGNfeedbackbecausetheyclearthe circumnuclear environment of gas that could have fueled subsequent episodes starformation. Herschel identified significant numbers of molecular outflows in LIRGs andULIRGs in the Local Universe (see Sect. 5.2), but because of limited sensitivity, it wasimpossible to carry out similar observations at cosmological redshifts. Because of the co-dependenciesbetweentheoutflowrates,theSMBHaccretionrates(e.g.,Ciconeetal.2014),andAGNgasaccretionrates,thefrequencyofoutflowsandtheirpropertiesareexpectedtoevolve.Indeed,accordingtoVeilleuxetal.(2013),“thereissomeindicationthatmolecularoutflowssubsideoncethequasarhasclearedapaththroughtheobscuringmaterial”.Thus,powerfulAGN-drivenmolecularoutflowsareprobablyonlyaphaseof theAGNdutycycle,andtheiroccurrencealmostcertainlychangeswithredshift,andmayberelatedtothegrowthofSMBHsandtotheevolutionoftheSFRD(seeSect.6.1).OHoutflowsat119μmcanbetraceduptoz~3withanFIRobservatorythatcoverswavelengthsto500μm,andtoz~5using the79μmOH transition (e.g., Sturmetal.2011). InordertocharacterizetheriseandfalloftheeffectsofAGNactivitydirectlythroughsystematicobservationsofoutflowtracers,asensitivespace-borneFIRfacilityisneeded.
6.3.2 FIRfine-structurelinesastracersofblack-holeaccretionAGN activity can also be traced using MIR/FIR FS lines that are excited by the hard UVcontinuum, i.e., at high-ionization potential; the brightest of these lines is [OIV]λ25.9μm(Sturmetal.2002;Schweitzeretal.2006;Armusetal.2007;Diamond-Stanic&Rieke2012;Shipley et al. 2013). Thus the [OIV] line is considered an important diagnostic to identifyAGNs, and separate its contribution to the IR luminosity from that of star formation.Moreover,black-holeaccretionratesarefoundtobeproportionalto[OIV]luminosities(e.g.,Melendezet al. 2008),making [OIV] an important tool formeasuringaccretion ratesontoSMBHinthepresenceofdust.The[NeV]14.3/24.3µmlinesarealsoefficientAGNtracers,astheir high ionization potential (~100eV) can only be excited by an extremely hard UVradiationfield.These linesaregenerallyweakerthan[OIV],butcanbeextremelyeffectiveprobes of AGN in FIR surveys (e.g., Bonato et al. 2015). Blind surveys with planned FIRspace-bornemissionsinthe[OIV]and[NeV]lineswillprovetobeanimportantdiagnosticforthecoevolutionofstarformationandAGNouttothepeakofSFRDatz∼2(e.g.,Spinoglioetal.2012a,2014;Bonatoetal.2014b).
6.4 ScientificrequirementsHereweexaminethetechnicalrequirements,evaluatedasafunctionofthesciencedriversdescribed above. A summary of the requirements is given in the table at the end of thesection.
Inordertosamplethepeak(50−160μm)ofdustemissioningalaxiesuptoredshiftz≤6,500μm is theminimum longwavelength required; suchwavelength coveragewill enable theverification of the trend of increasing dust temperatures with increasing redshift andconstraindust(andgas)massandISMphysicalconditionsingalaxieswithin∼1Gyrofthe
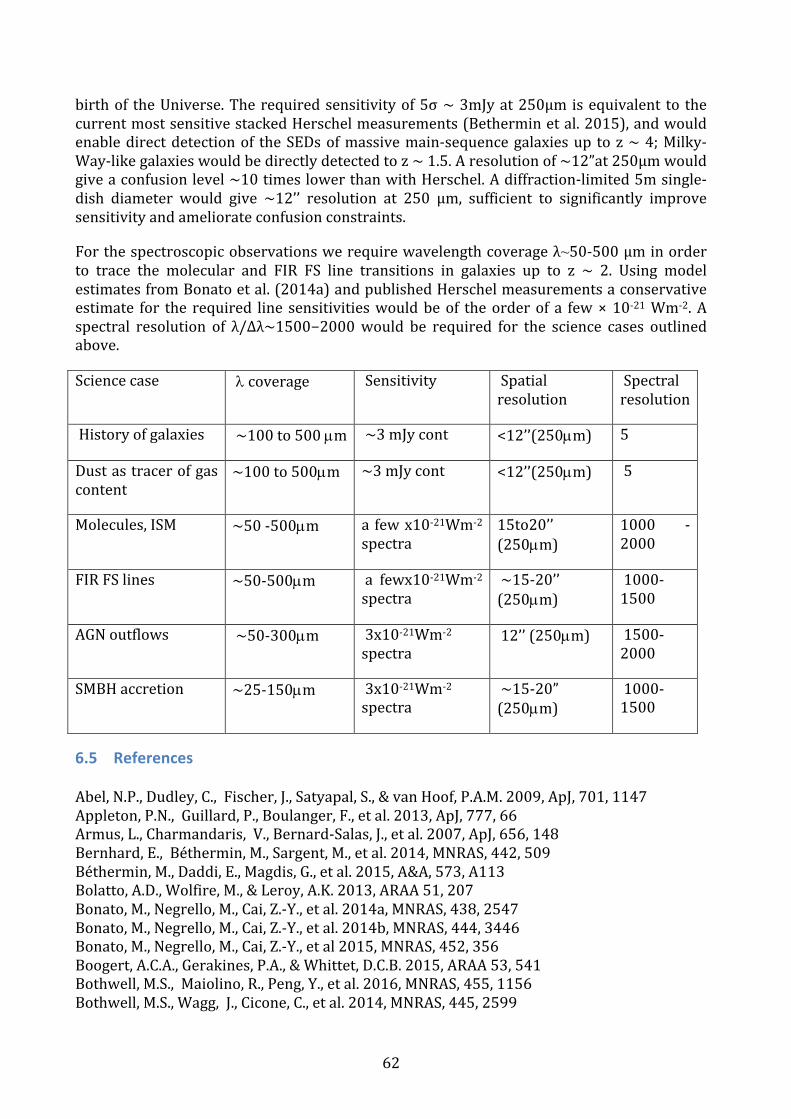
62
birthof theUniverse.Therequiredsensitivityof5σ∼3mJyat250μmisequivalent to thecurrentmostsensitivestackedHerschelmeasurements(Betherminetal.2015),andwouldenabledirectdetectionof theSEDsofmassivemain-sequencegalaxiesup toz∼4;Milky-Way-likegalaxieswouldbedirectlydetectedtoz∼1.5.Aresolutionof∼12”at250μmwouldgiveaconfusionlevel∼10timeslowerthanwithHerschel.Adiffraction-limited5msingle-dish diameter would give ∼12’’ resolution at 250 μm, sufficient to significantly improvesensitivityandameliorateconfusionconstraints.
Forthespectroscopicobservationswerequirewavelengthcoverageλ~50-500μminorderto trace the molecular and FIR FS line transitions in galaxies up to z ∼ 2. Using modelestimatesfromBonatoetal.(2014a)andpublishedHerschelmeasurementsaconservativeestimate for the required line sensitivitieswouldbeof theorderof a few×10-21Wm-2.Aspectral resolution of λ/∆λ~1500−2000would be required for the science cases outlinedabove.
Sciencecase lcoverage Sensitivity Spatialresolution
Spectralresolution
Historyofgalaxies ~100to500µm ~3mJycont <12’’(250µm) 5
Dustastracerofgascontent
~100to500µm ~3mJycont <12’’(250µm) 5
Molecules,ISM ~50-500µm a fewx10-21Wm-2
spectra15to20’’(250µm)
1000 -2000
FIRFSlines ~50-500µm a fewx10-21Wm-2
spectra~15-20’’(250µm)
1000-1500
AGNoutflows ~50-300µm 3x10-21Wm-2spectra
12’’(250µm) 1500-2000
SMBHaccretion ~25-150µm 3x10-21Wm-2spectra
~15-20”(250µm)
1000-1500
6.5 ReferencesAbel,N.P.,Dudley,C.,Fischer,J.,Satyapal,S.,&vanHoof,P.A.M.2009,ApJ,701,1147Appleton,P.N.,Guillard,P.,Boulanger,F.,etal.2013,ApJ,777,66Armus,L.,Charmandaris,V.,Bernard-Salas,J.,etal.2007,ApJ,656,148Bernhard,E.,Béthermin,M.,Sargent,M.,etal.2014,MNRAS,442,509Béthermin,M.,Daddi,E.,Magdis,G.,etal.2015,A&A,573,A113Bolatto,A.D.,Wolfire,M.,&Leroy,A.K.2013,ARAA51,207Bonato,M.,Negrello,M.,Cai,Z.-Y.,etal.2014a,MNRAS,438,2547Bonato,M.,Negrello,M.,Cai,Z.-Y.,etal.2014b,MNRAS,444,3446Bonato,M.,Negrello,M.,Cai,Z.-Y.,etal2015,MNRAS,452,356Boogert,A.C.A.,Gerakines,P.A.,&Whittet,D.C.B.2015,ARAA53,541Bothwell,M.S.,Maiolino,R.,Peng,Y.,etal.2016,MNRAS,455,1156Bothwell,M.S.,Wagg,J.,Cicone,C.,etal.2014,MNRAS,445,2599

63
Brinchmann,J.,Charlot,S.,White,S.D.M.,etal.2004,MNRAS,351,1151Burgarella,D.,Buat,V.,Gruppioni,C.,etal.2013,A&A,554,A70Capak,P.L.,Carilli,C.,Jones,G.,etal2015,Nature,522,455Carilli,C.L.,&Walter,F.2013,ARAA,51,105Casey,C.M.,Berta,S.,Béthermin,M.,etal.2012,ApJ,761,140Casey,C.M.,Narayanan,D.,&Cooray,A.2014,PhysicsReports,541,45Casey,C.M.,Bradford,M.,Cooray,A.etal.2015,``DustinDistantGalaxies:OvercomingConfusionNoisewitha5mFIRFacility'',FIRSurveyorworkshop,PasadenaChary,R.,&Elbaz,D.2001,ApJ,556,562Cicone,C.,Maiolino,R.,Sturm,E.,etal.2014,A&A,562,A21Comastri,A.,Gilli,R.,Marconi,A.,etal2015,A&A,574,L10Coppin,K.E.K.,Danielson,A.L.R.,Geach,J.E.,etal.2012,MNRAS,427,520Cormier,D.,Madden,S.C.,Lebouteiller,V.,etal.2015,A&A,578,A53Croton,D.J.,Springel,V.,White,S.D.M.,etal.2006,MNRAS,365,11Croxall,K.V.,Smith,J.D.,Wolfire,M.G.,etal.2012,ApJ,747,81Croxall,K.V.,Smith,J.D.,Pellegrini,E.,etal.2015,ApJ,submittedDaddi,E.,Dannerbauer,H.,Liu,D.,etal.2015,A&A,577,A46Dale,D.A.,&Helou,G.2002,ApJ,576,159Dale,D.A.,Helou,G.,Magdis,G.E.,etal.2014,ApJ,784,83DeLooze,I.,Cormier,D.,Lebouteiller,V.,etal.2014,A&A,568,A62Dessauges-Zavadsky,M.,Zamojski,M.,Schaerer,D.,etal.2015,A&A,577,A50Diamond-Stanic,A.M.,&Rieke,G.H.2012,ApJ,746,168Díaz-Santos,T.,Armus,L.,Charmandaris,V.,etal.2013,ApJ,774,68Dunne,L.,Eales,S.,Ivison,R.,Morgan,H.,&Edmunds,M.2003,Nature,424,285Elbaz,D.,Dickinson,M.,Hwang,H.S.,etal.2011,A&A,533,A119Falstad,N.,González-Alfonso,E.,Aalto,S.,etal.2015,A&A,580,A52Farrah,D.,Lebouteiller,V.,Spoon,H.W.W.,etal.2013,ApJ,776,38Ferrarese,L.,&Merritt,D.2000,ApJL,539,L9Feruglio,C.,Maiolino,R.,Piconcelli,E.,etal.2010,A&A,518,L155Fischer,J.,Abel,N.P.,González-Alfonso,E.,etal.2014,ApJ,795,117Fischer,J.,Sturm,E.,González-Alfonso,E.,etal.2010,A&A,518,L41Galametz,M.,Madden,S.C.,Galliano,F.,etal.2010,A&A,518,L55Genzel,R.,Tacconi,L.J.,Lutz,D.,etal.2015,ApJ,800,20Ginol_,M.,Schneider,R.,Hunt,L.K.,etal.,inpreparationGonzález-Alfonso,E.,Fischer,J.,Graciá-Carpio,J.,etal.2012,A&A,541,A4González-Alfonso,E.,Fischer,J.,Isaak,K.,etal.2010,A&A,518,L43González-Alfonso,E.,Fischer,J.,Sturm,E.,etal.2015,ApJ,800,69Graciá-Carpio,J.,Sturm,E.,Hailey-Dunsheath,S.,etal.2011,ApJL,728,L7Greve,T.R.,Leonidaki,I.,Xilouris,E.M.,etal.2014,ApJ,794,142Gruppioni,C.,Pozzi,F.,Rodighiero,G.,etal.2013,MNRAS,432,23Gültekin,K.,Richstone,D.O.,Gebhardt,K.,etal.2009,ApJ,698,198Heinis,S.,Buat,V.,Béthermin,M.,etal.2014,MNRAS,437,1268Herrera-Camus,R.,Bolatto,A.D.,Wolfire,M.G.,etal.2015,ApJ,800,1Hollenbach,D.,Kaufman,M.J.,Bergin,E.A.,&Melnick,G.J.2009,ApJ,690,1497Hollenbach,D.J.,&Tielens,A.G.G.M.1999,ReviewsofModernPhysics,71,173Hopkins,P.F.,Hernquist,L.,Cox,T.J.,etal.2006,ApJS,163,1Hopkins,P.F.,Hernquist,L.,Cox,T.J.,&Kereš,D.2008,ApJS,175,356Hunt,L.,Dayal,P.Magrini,L.,Ferrara,A.2016,MNRAS,submittedHunt,L.,Magrini,L.,Galli,D.,etal.2012,MNRAS,427,906
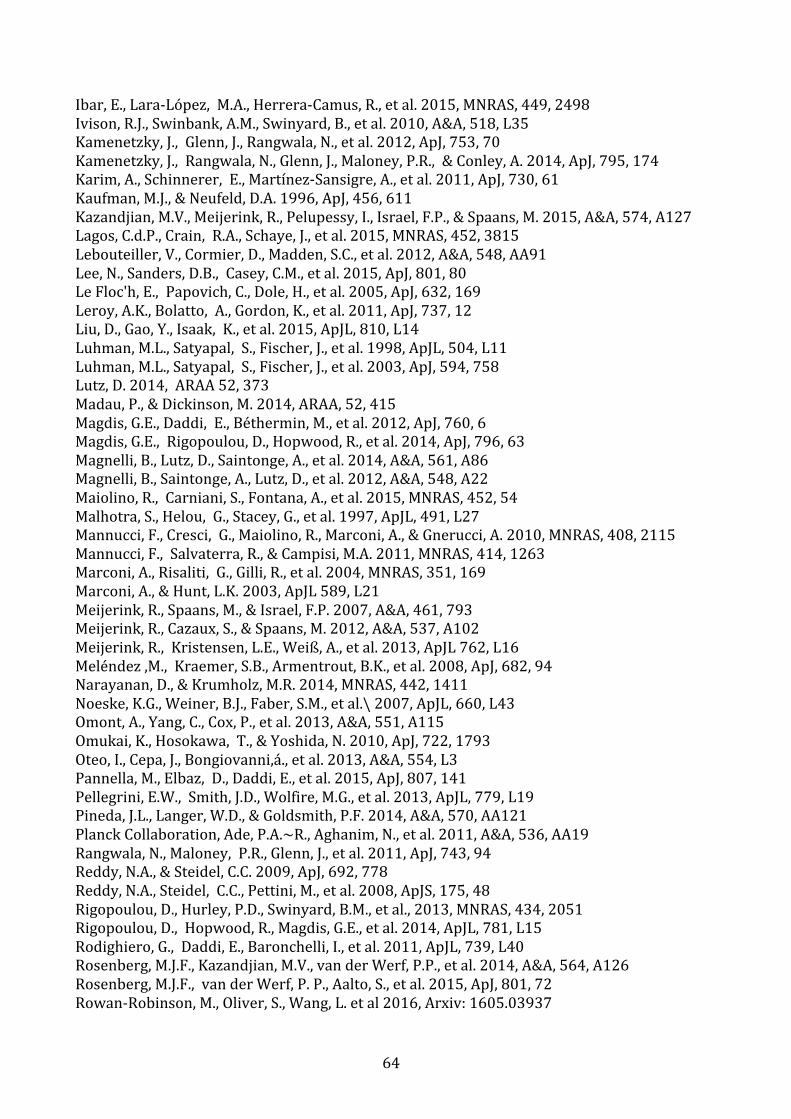
64
Ibar,E.,Lara-López,M.A.,Herrera-Camus,R.,etal.2015,MNRAS,449,2498Ivison,R.J.,Swinbank,A.M.,Swinyard,B.,etal.2010,A&A,518,L35Kamenetzky,J.,Glenn,J.,Rangwala,N.,etal.2012,ApJ,753,70Kamenetzky,J.,Rangwala,N.,Glenn,J.,Maloney,P.R.,&Conley,A.2014,ApJ,795,174Karim,A.,Schinnerer,E.,Martínez-Sansigre,A.,etal.2011,ApJ,730,61Kaufman,M.J.,&Neufeld,D.A.1996,ApJ,456,611Kazandjian,M.V.,Meijerink,R.,Pelupessy,I.,Israel,F.P.,&Spaans,M.2015,A&A,574,A127Lagos,C.d.P.,Crain,R.A.,Schaye,J.,etal.2015,MNRAS,452,3815Lebouteiller,V.,Cormier,D.,Madden,S.C.,etal.2012,A&A,548,AA91Lee,N.,Sanders,D.B.,Casey,C.M.,etal.2015,ApJ,801,80LeFloc'h,E.,Papovich,C.,Dole,H.,etal.2005,ApJ,632,169Leroy,A.K.,Bolatto,A.,Gordon,K.,etal.2011,ApJ,737,12Liu,D.,Gao,Y.,Isaak,K.,etal.2015,ApJL,810,L14Luhman,M.L.,Satyapal,S.,Fischer,J.,etal.1998,ApJL,504,L11Luhman,M.L.,Satyapal,S.,Fischer,J.,etal.2003,ApJ,594,758Lutz,D.2014,ARAA52,373Madau,P.,&Dickinson,M.2014,ARAA,52,415Magdis,G.E.,Daddi,E.,Béthermin,M.,etal.2012,ApJ,760,6Magdis,G.E.,Rigopoulou,D.,Hopwood,R.,etal.2014,ApJ,796,63Magnelli,B.,Lutz,D.,Saintonge,A.,etal.2014,A&A,561,A86Magnelli,B.,Saintonge,A.,Lutz,D.,etal.2012,A&A,548,A22Maiolino,R.,Carniani,S.,Fontana,A.,etal.2015,MNRAS,452,54Malhotra,S.,Helou,G.,Stacey,G.,etal.1997,ApJL,491,L27Mannucci,F.,Cresci,G.,Maiolino,R.,Marconi,A.,&Gnerucci,A.2010,MNRAS,408,2115Mannucci,F.,Salvaterra,R.,&Campisi,M.A.2011,MNRAS,414,1263Marconi,A.,Risaliti,G.,Gilli,R.,etal.2004,MNRAS,351,169Marconi,A.,&Hunt,L.K.2003,ApJL589,L21Meijerink,R.,Spaans,M.,&Israel,F.P.2007,A&A,461,793Meijerink,R.,Cazaux,S.,&Spaans,M.2012,A&A,537,A102Meijerink,R.,Kristensen,L.E.,Weiß,A.,etal.2013,ApJL762,L16Meléndez,M.,Kraemer,S.B.,Armentrout,B.K.,etal.2008,ApJ,682,94Narayanan,D.,&Krumholz,M.R.2014,MNRAS,442,1411Noeske,K.G.,Weiner,B.J.,Faber,S.M.,etal.\2007,ApJL,660,L43Omont,A.,Yang,C.,Cox,P.,etal.2013,A&A,551,A115Omukai,K.,Hosokawa,T.,&Yoshida,N.2010,ApJ,722,1793Oteo,I.,Cepa,J.,Bongiovanni,á.,etal.2013,A&A,554,L3Pannella,M.,Elbaz,D.,Daddi,E.,etal.2015,ApJ,807,141Pellegrini,E.W.,Smith,J.D.,Wolfire,M.G.,etal.2013,ApJL,779,L19Pineda,J.L.,Langer,W.D.,&Goldsmith,P.F.2014,A&A,570,AA121PlanckCollaboration,Ade,P.A.~R.,Aghanim,N.,etal.2011,A&A,536,AA19Rangwala,N.,Maloney,P.R.,Glenn,J.,etal.2011,ApJ,743,94Reddy,N.A.,&Steidel,C.C.2009,ApJ,692,778Reddy,N.A.,Steidel,C.C.,Pettini,M.,etal.2008,ApJS,175,48Rigopoulou,D.,Hurley,P.D.,Swinyard,B.M.,etal.,2013,MNRAS,434,2051Rigopoulou,D.,Hopwood,R.,Magdis,G.E.,etal.2014,ApJL,781,L15Rodighiero,G.,Daddi,E.,Baronchelli,I.,etal.2011,ApJL,739,L40Rosenberg,M.J.F.,Kazandjian,M.V.,vanderWerf,P.P.,etal.2014,A&A,564,A126Rosenberg,M.J.F.,vanderWerf,P.P.,Aalto,S.,etal.2015,ApJ,801,72Rowan-Robinson,M.,Oliver,S.,Wang,L.etal2016,Arxiv:1605.03937
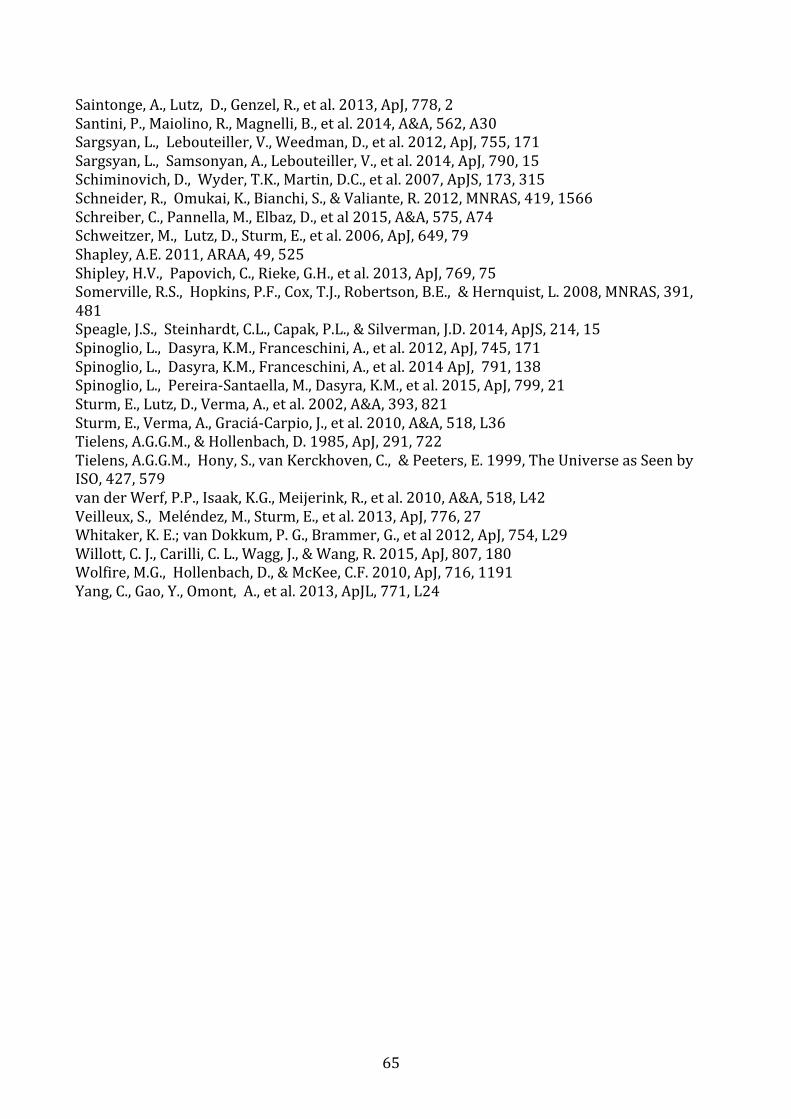
65
Saintonge,A.,Lutz,D.,Genzel,R.,etal.2013,ApJ,778,2Santini,P.,Maiolino,R.,Magnelli,B.,etal.2014,A&A,562,A30Sargsyan,L.,Lebouteiller,V.,Weedman,D.,etal.2012,ApJ,755,171Sargsyan,L.,Samsonyan,A.,Lebouteiller,V.,etal.2014,ApJ,790,15Schiminovich,D.,Wyder,T.K.,Martin,D.C.,etal.2007,ApJS,173,315Schneider,R.,Omukai,K.,Bianchi,S.,&Valiante,R.2012,MNRAS,419,1566Schreiber,C.,Pannella,M.,Elbaz,D.,etal2015,A&A,575,A74Schweitzer,M.,Lutz,D.,Sturm,E.,etal.2006,ApJ,649,79Shapley,A.E.2011,ARAA,49,525Shipley,H.V.,Papovich,C.,Rieke,G.H.,etal.2013,ApJ,769,75Somerville,R.S.,Hopkins,P.F.,Cox,T.J.,Robertson,B.E.,&Hernquist,L.2008,MNRAS,391,481Speagle,J.S.,Steinhardt,C.L.,Capak,P.L.,&Silverman,J.D.2014,ApJS,214,15Spinoglio,L.,Dasyra,K.M.,Franceschini,A.,etal.2012,ApJ,745,171Spinoglio,L.,Dasyra,K.M.,Franceschini,A.,etal.2014ApJ,791,138Spinoglio,L.,Pereira-Santaella,M.,Dasyra,K.M.,etal.2015,ApJ,799,21Sturm,E.,Lutz,D.,Verma,A.,etal.2002,A&A,393,821Sturm,E.,Verma,A.,Graciá-Carpio,J.,etal.2010,A&A,518,L36Tielens,A.G.G.M.,&Hollenbach,D.1985,ApJ,291,722Tielens,A.G.G.M.,Hony,S.,vanKerckhoven,C.,&Peeters,E.1999,TheUniverseasSeenbyISO,427,579vanderWerf,P.P.,Isaak,K.G.,Meijerink,R.,etal.2010,A&A,518,L42Veilleux,S.,Meléndez,M.,Sturm,E.,etal.2013,ApJ,776,27Whitaker,K.E.;vanDokkum,P.G.,Brammer,G.,etal2012,ApJ,754,L29Willott,C.J.,Carilli,C.L.,Wagg,J.,&Wang,R.2015,ApJ,807,180Wolfire,M.G.,Hollenbach,D.,&McKee,C.F.2010,ApJ,716,1191Yang,C.,Gao,Y.,Omont,A.,etal.2013,ApJL,771,L24

66
7 Technologyandtechniques2,3
7.1 CapabilityandsummaryofsciencedriverrequirementsIn order to achieve the challenging science goals described in the previous chapters,substantial technological developments will be necessary. In many cases ultra-highsensitivityisneeded,oftenincombinationwithmediumtohighspectralresolutionandfastmappingspeed.Inthefar-infraredthisrequiresdeepcooling(20-50KforSchottkymixers,4KforHEBmixers,100mKorlessforTES/KIDorQCDdetectors).Mostscienceapplicationswillbenefitfromlargearrays,whichputheavydemandsonallsystemaspects. Toavoidphotonnoise fromself-emission, telescopesalsoneed tobecooled.Forconceptssuch as CALISTO and SPICA, active cooling to 4-6 K is needed, challenging cryo-coolertechnology and system design. Last but not least, high angular resolution can only beachievedthrough light-weigthed largesingledishes,orbycombiningaperturesto formaninterferometer.Weshouldnotunderestimatetheimportanceofearlydevelopment.Ittooknearly15yearsbefore 1 THz mixers for Herschel/HIFI could be made. For the TES detectors ofAthena/XIFU,almosttwodecadeswereneeded.ButevenmoreimportantisthatselectionofscienceconceptsbytheSpaceAgenciesensuresthatthedevelopmentisacceleratedandwellfunded.
7.1.1 SensitivityTo achieve sensitivity limited by astrophysical backgrounds rather than the thermalemissionofthetelescopeitself,far-infraredtelescopesneedtobecooledtotemperaturesofa fewK (Figure7.1), and in addition theirdirectdetection instrumentsmust involve sub-kelvincoolingofthedetectors.Toachievethis,Herschelwasequippedwithalargecryostatfor the instruments and the telescope itself was passively (radiatively) cooled to atemperatureof~85K,withrecyclable3Herefrigeratorscoolingbolometerarraysto0.3KinthePACSandSPIREinstruments.ThePlancktelescopeusedadesignwithseveralV-groovesthatradiateawaytheheatandmaintaineachshieldatastabletemperature.BystackingtheV-grooves, the Planck telescope was passively cooled down to 40 K. Because cooling thetelescope to a fewK reduces thebackgroundphotonnoisebyordersofmagnitude, hugegainsinsensitivitycanbeachieved.Studiesshowthat4Kcanbereachedforapproximatelya 2–3-m class telescopewithin anM-class budget (ESA CDF studyNext Generation far-IRTelescope 2014/2015 http://sci.esa.int/trs/56108-next-generation-cryogenic-cooled-infrared-telescope/).Largerapertureswillneedacombinationofactiveandpassivecooling.Therequirementsofheterodynesystemsontelescopetemperaturearemuchlessstringent
2ThissectionisbasedoninputsfromBrianEllison,Jian-rongGao,SPACEKIDSconsortium,JuanBueno,ColinCunningham,MattGriffin,MattBradford,MarcSauvage,DimitraRigopoulou,BruceSwinyard,PeterRoelfsema,FabianThomeandGillesDurand3ATHzroadmapalsoexists(Dhillonetal.2017),butthisonlyhasasmallsectiononspaceapplications.

67
than for direct detection instruments, and passive cooling of the aperture is all that isrequired.Herschelwaspossiblythelastsatellitetocarryalargeliquidheliumcryostatintospace.Inthefuturecryocoolers,whicharenowspacequalified,willbetheobviouschoice.Sinceitisimpossible to cool down from ambient (either room temperature or 70 K for passivelycooledsystems)to4Kwithasinglecooler,chainsofcoolersneedtobeused,eachprovidingenoughheat lift for the level below. Inboth SPICAandFIRSPEX theproblem is solvedbyusingachaininvolving20-Kclasstwo-stageStirlingcoolers,andadditionalJoule-Thomsoncoolersproviding4-Kand1-Kstages(ESACDFstudy).
Figure 7.1: Comparison of natural backgrounds (zodiacal emission, galactic cirrus, andcosmicmicrowavebackgroundradiation)withthoseofthermalradiationfromtelescopesasafunctionoftemperature.Credit:SPICAconsortium.
7.1.2 SpectrometersInthefar-infraredonecanusebothcoherentandincoherentsystemsasspectrometers.Thechoiceofsystemshouldbedeterminedbythescienceobjectives;thatis,itmustpossessthenecessarysensitivity,spatialandtemporalresolution,andspectralresolvingpower. Whenmoderate spectral resolution (R < a few 1000) is adequate (for instance, tomeasure lineintensities) then the best sensitivity can be achieved using a direct detection system (inwhich thephaseof the incident radiation is notmeasured),which,with suitably sensitivedetectors,issubjectonlytophotonnoisefromtheincidentradiation.Ifhighresolution(R>around 104) is needed, for instance to resolve narrow line profiles, then heterodynedetection (in which both phase and amplitude aremeasured) is necessary. Simultaneousmeasurementofamplitudeandphaseintroduces,viatheuncertaintyprinciple,acomponentof quantum noise that imposes an ultimate limit on sensitivity. Heterodyne systems thusprioritise spectral resolution over sensitivity whilst direct detection systems do theopposite.
Incoherent(directdetection)systemsClassical direct-detection spectrometer concepts, which have been implemented in spaceastronomymissions,includetheFourierTransformSpectrometer(e.g.Herschel/SPIRE)andthe grating spectrometer (e.g. Herschel/PACS; SPICA/SAFARI) and Fabry-Perot
68
spectrometer (e.g. ISO/LWS). All of these have their own advantages and disadvantageswhen it comes to spectral resolution, mapping speed and instantaneous wavelengthcoverage,whichcanbeoptimised for thesciencegoal.AnFTS is compactandsuitable forimaging, and provides instantaneous coverage of its complete wavelength range, whichmakesitverysuitableforsurveyspectroscopy.Adisadvantageisthatthedetectorsseethebackgroundfromskyand/orthetelescopeoverthefullwavelengthrangeandsothephotonnoise contribution is higher than for amonochromator system such as a grating. For theEuropean instrument on SPICA the original choice was first to have an imaging FTS, buthigher sensitivity for point sources pushed the design to a grating spectrometer with aMartin-Puplett interferometer added for higher spectral resolution for bright sources. Apricepaidforthisadditionalsensitivityisthattheimagingcapabilityofthesystemwillbeverylimited.Alternativeschemeshavebeenstudiedaswell.IntheBLISSconcept(Bradfordetal.2010)theclassicgratingspectrometerismorphedintoasetofwaveguide/gratingslices,togetherforminga low-to-mediumresolutionspectrometer. Conceptsdesigned toprovidespectralsensitivity at pixel level in a detector array using superconducting transmission linetechnology are also being developed. µ-Spec (Cataldo et al. 2014) proposes the use ofsuperconducting microstrip transmission lines on a single 4-inch silicon wafer. µ-Spec isequivalent to a grating spectrometer, in which the phase changes introduced by gratinggroovesare insteadproducedbypropagationalongtransmissionlinesofdifferent lengths.Superspec (Hailey-Dunsheath et al. JLTP) uses half-wave resonators to implement amoderate-resolution (R~ 500) filter-bank coupled to lumped element kinetic inductancedetectors(KIDs),allintegratedonasinglesiliconchip.Aprototypehasbeenoperatedinthe180–280 GHz range. DESHIMA (Endo et al. 2012) is based on a similar concept usingmicrowaveKIDS(MKIDs).
Heterodyne(coherent)systems
FIR direct detection instrumentation, whilst offering broad spectral coverage and highsensitivity, is typically limited to a resolving power < 104,which is insufficient to resolvenarrowspectral lines.Manyapplicationswillneedhighspectralresolvingpower(λ/Δλ)oforder 106 in the FIR. This requirement is necessary to avoid spectral line confusion, todiscriminatebetweenemissionandabsorption,andtoprobethekinematicsof interstellargas. For highest spectral resolving power the heterodyning techniquemust be used, inwhich the phase of the incident radiation is preserved. The sky signal is mixed with anextremely pure local oscillator (LO) signal. The resultant output is a down-convertedintermediate frequency (IF) signal that contains the same spectral information as theoriginal,buttypicallyintheGHzfrequencyrangewhereitcanbeelectricallyamplifiedandmoreeasilyprocessed.Although possessing limited spectral bandwidth, the heterodyne technique provides aspectralresolutioncapabilitythatislimitedbythespectralpurity,oftheLO,andresolutionorders of 107 are achievable. Additionally, in preserving signal phase, the heterodynetechniqueprovidesanother importantadvantageof interferometricobservation. With thelatter,multiple individual telescopes (antennas) can be united to formphased arrays, e.g.NOEMA and ALMA, that synthesize a large single dish aperture and provide ultra-highspatialresolution.HeterodyneradiometryhasbeenverysuccessfullyusedinavarietyofspacebornemissionsinsupportofbothEarthobservationandastronomyremotesoundingexperiments(Gaidis

69
et al., 2000, Waters et al., 2006, and de Graauw et al, 2010). The sensitivity of a THzradiometerisusuallydominatedbythemixerwhich,incombinationwiththeLO,performsthenecessaryfrequencytranslation.Efficientcouplingofthefree-spacesignaltothemixerisimportant.Itimportantthattheresistivelossesinthefore-opticscomponentsareminimisedinordertoavoidexcessiveincreaseinsystemnoise.Couplingofthefocusedenergytothemixer diode is achieved through use of a miniature antenna structure or feedhorn.Fabrication of feedhorns suitable for operation in the THz region is highly demanding.Corrugated feeds produce excellent antenna patterns and are relativelywide-band, but atthe higher frequencies they are difficult to manufacture due to the small feature sizesinvolved. Smoothwalled feedhorns, whilst beingmechanically easier to construct, have asmallerbandwidth,buttheirantennapatternscanapproachthequalityofcorrugatedfeedswithcarefuldesign.ExamplesofbothfeedhorntypesareshowninFigure7.2.
Figure7.2:THzscalecorrugatedandsmoothwallfeedhornexamples.
TheTHznoiseperformanceofthenon-linearmixingelementhasbeensubstantiallyenhancedinrecentyearsdue,primarily,toatransitionfromtheuseofsemiconductor(Schottkydiode)technologytothatofsuperconductingthinfilmtechnology.Superconductingmixersrequirecoolingtotemperaturesof4Korless.AlthoughSchottkymixerscanoperate~80K,offeringconsiderableadvantagesintermsofmissionviability,costandlifetime,thisisattheexpenseofsignificantlyreducedsensitivity.
7.1.3 AngularresolutionAngular resolution is proportional to telescope size and inversely proportional towavelength. The long wavelengths of the far infrared waveband therefore require largetelescope size. Sauvage et al. (2013) write: “Science exploiting the FIR domain is thusrelatively young, yet already demonstrates an impressive track record: a succession offacilities(KAO,IRAS,COBE,ISO,Spitzer,AKARI,PlanckandHerschel)allowedustogazeintothe obscured Universe, advancing our understanding of cosmology, star and galaxyformation, and the origin of planetary systems. Despite these developments, FIRobservationalcapabilitiesremainprimitiveincomparisonwiththeoptical/NIRregion.Ourmost advanced facility, Herschel, delivered an angular resolution no better than Galileo'stelescope and was operated against a blinding thermal background.” While the Herscheltelescoperepresentedhighlyadvancedtechnologyatthetime(~300kgmassforalmost10m2area -a factorof five lighter thanaclassicalglassmirror), largerareamirrorsarestillprohibitively heavy and alternatives are needed, either by light-weighting the dishes,steppingawayfromfilledaperturesoracombinationofthetwo.Wenotethatthereisonlyone exception to the need for larger apertures - mapping the ISM of theMilkyWay and
70
beyond in the far-IR fine-structure lines, of which the 1.9 THz [CII] line is the mostprominent. In this case a telescope diameter of 1 - 2 m is sufficient, because the ISM isconsideredasawholerather thanas individualsourcesandbecausethisallows fordirectcomparisonbetween[CII]andHerschel/SPIRE500-µmphotometricimages.In2007SauvageandcolleaguesproposedTALC,asegmentedannularmirrorof20mouterdiameter and3mwidth. Thiswouldprovide20 times the collecting area of theHerscheltelescope. Theringconfigurationismaintainedwithcablesattachedtoadeployablemast,whichprovidestructuralrigiditythroughcompression.WithinESA,large-aperturetelescopetechnology has been studied (e.g. Gambicorti et al. 2012 and references therein), with aconcept involvingsurfacedensityof lessthan18kgm-2 includingbackplaneandactuatorsforgettingtherightshape.Alternativeswerealsoinvestigatedoveradecadeago.TheDualAnamorphicReflectorTelescope,whichwas studied for the far-IRbyNASA(Morganetal.2004), is an architecture for large aperture space telescopes that uses membranes. Amembrane can be shaped in one direction of curvature using a combination of boundarycontrol and tensioning, yielding a cylindrical reflector. Two orthogonal and confocalcylindricalreflectorsconstitutetheunobstructed'primarymirror'ofthesystem.Keepingmembranesinshapewithelectrostaticpressurewasalsostudied(e.g.Erricoetal.2002). More recently Ball Aerospace and DARPA studied large Fresnel lens-like etchedmembranes in theMOIREprogram(MembraneOptical Images forRealTimeExploitation,press release Ball May 2014) yielding very large mirrors suitable for spying fromgeostationaryorbitintheoptical.Inthesameareaofspysatellites,photonsieveshavealsobeen studied (Andersen 2005). The same technique could be scaled to far-infraredwavelengths, but large focal length and wavelength-dependent focus may be difficult toavoid. IntheUSA,theATLASTprogramstudiedsegmenteddeployablemirrorsuptoalimitof16mas successors to JWST in the UV/optical. The expected capabilities of the Ares V launchsystem are such that heritage of JWST is preferred over completely new developments.ATLAST is technology for a HighDefinition Space Telescope. . Because of the start of thestudy for a far-infrared observatory for the next decadal plan, new impetus is given tofindingnewmaterialsforlightweightmirrors.P.Stahl(privatecommunication)showedtestblanksoflaser-sinteredAluminiumwhichcanbepolishedtotheaccuracyneededforthefar-IR. The Active Structures Laboratory has, on its website, information on lightweighttelescopes: http://scmero.ulb.ac.be/project.php?id=8&page=index.htmlThefar-infraredislessaffectedbywavefronterrorsthantheoptical.However,ifmirrorsgetbigger and thinner, the incoming wavefronts will need to be actively controlled. Onepossibility is correction using free-form optics along the optical train (e.g.http://www.nasa.gov/feature/goddard/out-with-the-old-in-with-the-new-telescope-mirrors-get-new-shape or http://www.astro-opticon.org/fp7-2/jra/wp5_active_freeform_mirrors.html), but large-aperture telescopes will also need anactivesecondaryortertiarytocompensateforstaticanddynamic(e.g.thermaldrift)errors.If flatnessorshapeof largemembranes isaproblem,actuationwillalsobeneededontheprimary.Ingeneral,largedeployablemirrorstructuresinherentlyrequireactiveadjustment,alignment,andcontrolinspace;and,becauseoftheirlongfocallengths,theyalsoneedotherdeployable structures like masts and booms in a deploy-and-lock situation. This isrecognizedbyESAwhowriteinESAITT8248:“Largeapertures(antennasandtelescopes)

71
and long baselines and focal lengths in space have applications for telecommunications,Earthobservationandscientificmissions.Astrophysicsmissionsneeddeployablestructuresmostlyforthecreationoflongbaselinesofinterferometersandlargefocallengths,e.g.forX-ray telescopes. Missions currently in early phases may require for instance deployableboomsofup to100mdeployed lengthandpositioningaccuracywithinasphereof1mmradiusorbetterandrotationslowerthan0.005degree.”Structurelesstelescopeshavealsobeenconsidered, inspiredbyLabeyrie’shyper-telescope(seealsoBekey2003).Theseconceptsarebasedonfree-flying,atechniquediscussedunderinterferometry, although a hyper-telescope has extra challenges for station keeping, sincelargedistancesandlargenumbersofelementsareinvolved.
7.1.4 PolarimetryTodate,mostdustemissionpolarisationmeasurementshavebeendonefromEarth-basedobservatories. An exception was the Planck satellite, which has revealed the large scalemagneticfieldsinourMilkyWay,basedonitspolarimetriccapabilities.However,nowthatHerschelhasmappedthe intensityofdustemissionfromlargestar-formingregions intheGalaxy, it is important to investigatepolarimetric imaging concepts enabling the interplaybetweenmagneticfields,turbulenceandkinematicstobestudiedasanimportantaspectofISM and star-formation research. Numerous ground-based, balloon- and aircraft-bornepolarimeterinstrumentswillbeavailableinthecomingdecadeforsuchstudies.Whilethesefacilitieswill havepowerful capabilities over a rangeof angular resolutions, a spaceborneimaging polarimeter on a cold-aperture telescopewould have far superior sensitivity andcouldachievehigh-fidelitypolarimetric imagingoverarangeofangularscalesasHerschelwasabletodoinintensity.
7.1.5 InterferometryTheTALCconceptshowsthatalargetelescopecanbebuiltwithrelativelysimplebuildingblocksandinascalablefashion.However,therewillbeapointwheninterferometerswillbeeasier to handle than large dishes, because of the sun-shield/V-grooves scaling withtelescopesize.In the last decade two interferometer concepts have been proposed, based on differentdetectionschemes:coherent,orheterodyne,detectionand incoherent,ordirect,detection.ThefirsttechniqueissimilartothatusedbyALMA,thesecondtoVLTI.Ininterferometryafewmain concepts/parameters drive the design: collecting area, baseline length, uv-planefillingandimagequality. A comprehensive study of a direct detection interferometer, using the double Fouriertechnique toachievesimultaneousspectralandspatial interferometry,wasundertakenbySavini and collaborators in the EU FP7 project FISICA (http://www.fp7-fisica.eu/). TheEuropeanconceptwasverymuchliketheSPIRITconceptintheNASAstudies(Leisawitzetal. 2007a) and the earlier SPECS study (Leisawitz et al. 2007b). NRAO (Condon andcollaborators)hasdoneadetailedstudyalsooftheheterodyneinterferometerin2014,butthereportisnotfreelyavailable.The sensitivity of an interferometer depends on the total collecting area of the apertures.Themaximumbaselinedeterminestheangularresolutiononthesky,solargebaselinesare

72
neededforhighangularresolutionscience:toreachanangularresolutionof0.1”at100µmrequiresabaselineof~200m. Combiningtwoelementsininterferometricmodedoesnotprovide an image but a so-called visibility function, which can be compared with thevisibilityfunctionofthemodeloftheastronomicalsource.Formanyapplications,imagingismuch preferred over fitting the visibility function. This can be achieved by moving thetelescopesinsuchawaythattheFourierplaneofthebaselines(alsocalledtheuv-plane)issampled as homogeneously as possible. In space, the telescopes could bemoved throughelectricpropulsion in free-flying configurations, bymeansof tethers,whichare shortenedand lengthened,orbymovementalonga spinning rail to achieve theuv-plane filling. It isimportant to note that none of these methods provides instantaneous imaging and thatprecisemetrologyisneededbetweentheopticalelementsandthelocationatwhichphotonsarecombinedforthe incoherentsystemandthatcompletephaseknowledge isneededforthe coherent system. Full restoration of an imagewith structure larger than the primarybeam(e.g.nearbygalaxies,outflows,evolvedstarsetc.)alsorequiresaccesstothezeroandshortspacings.Free-flyershavebeenconsideredbyseveralspaceagenciesasrisky,butinthelastfiveyearsNASA’sEarthgravityGRACEmissionandinthenearfutureESA’sPROBA-3missionwillhaveshown that precise free-flying is achievable, and future distributed space systems havestandard collision avoidance. American studies have shown that tethers are a viablealternative for free-flying, but repointing is likelymore difficult in a tethered system. Forshorterbaselines,uptoatleast50m,deployableboomswithrailsforthetelescopescanalsobeused.StudiesforthegravitationalwaveinterferometermissioneLISAshowthatstationkeepingcanbedonewithhighprecisionmetrology.Far-infraredinterferometricimagingisconceptually much easier than operation of eLISA to detect gravitational waves, sincedistancesinvolvedareoforderhundredsofmeterinsteadofmillionsofkm.
7.2 Ultrasensitivedetectors
7.2.1 IncoherentdetectorsFuturespacescienceandEarthobservationmissionswillrelyontheavailabilityofimagingdetector array technology for the mm-FIR wavelength range (3 mm to 30 μm). For thewavelengthrange28-45μmthereiscurrentlynohighperformancetechnologywithspaceheritage. For longer wavelengths, 45-2000 μm, there is European expertise in a range ofdetector technologies, including photoconductors, semiconductor and transition edgesuperconducting(TES)bolometers,andkineticinductancedetectors(KIDs).ExceptforKIDs,these technologies present significant fabrication difficulties, and lead to a high degree ofcomplexity of system integration and readout electronics for the large format arraysdemandedbythenextgenerationofastronomicalmissionssuchasSPICA,FIRSPEX,CoRE+,LiteBIRD,TALCorFIRI.Largeformatarraysarealsoneededforlow-to-mediumresolutionspectroscopy,whereconfusionislessofaproblembecauseofthespectraldimension.Thereareanumberofapproachestofar-IRandsub-mmphotodetectionusinglarge-formatsuperconductingdetectorarrayswhicharebeingexploredaspossibletechnologiestoobtaintheverylownoiseequivalentpowers(NEPs),aslowas10-20W/Hz1/2,requiredforoptimalexploitation of the cold-aperture telescopes in space. One such technology, the kineticinductance detector (KID), relies on the sensitivity of the surface inductance of asuperconducting film to the absorbed electromagnetic power through the phenomenon of
73
Cooper pair breaking. Two others, the transition edge sensor (TES) and the nano-hotelectron bolometer (nano-HEB), make use of the sharpness of the superconductingtransition.Theapproachofthequantumcapacitancedetector(QCD)(e.g.Shawetal.2009,Bueno et al., 2010, 2011) is based on the extreme susceptibility of the single Cooper-pairbox,amesoscopicsuperconductingdevice,topair-breakingradiation.Of these detectors the TES aremostmature because of their use in submm camera’s formeasuring the CosmicMicrowave Background and general astrophysics from dry sites onEarth (PolarBear (Hattori et al. 2016), BICEP-2 (Ade et al. 2015), etc., etc.). For space,without the atmosphere as photon noise source, the required sensitivity is at least twoordersofmagnitudebetterposingnewproblems,justasmultiplexingthousandsofpixelsinspace:problemswhichcurrentlyarebeingsolvedundertheSPICA/SAFARIumbrella(seee.g.VanderKuuretal2015andreferencestherein).
KineticInductanceDetectorsMicrowave Kinetic Inductance Detectors (MKIDs) are pair breaking detectors, in whichradiation isabsorbed inasmallsuperconducting filmatvery lowtemperaturesT<<Tc (Tcbeing the critical temperature of the film). Photons at an energyhn > 2Δ (n > 80GHz foraluminium) can break Cooper pairs, paired electrons that form the ground state of thesuperconductingfilm,intosingleparticleexcitations(quasiparticles).Theresultisachangeinthecomplexsurfaceimpedanceofthesuperconductingfilm.InaKIDthissuperconductingfilm isplaced insideahighquality factormicrowaveresonancecircuit that iscoupled toamicrowavefeed-line.Absorptionofaphotoninthefilmmodifiestheresonantfrequencyf0and quality factor, Q, of the circuit due to the changes in the complex impedance of thesuperconductor. As a consequence photon absorption alters the transmitted phase andamplitude of a microwave readout signal at the resonance frequency. By coupling manyKIDs,eachwithaslightlydifferentresonancefrequencytoasinglefeed-line,onecanread-outalargenumber(severalthousand)ofKIDsinabandwidthofafewGHzusingastandardHEMT amplifier. KID arrays are now being deployed on a number of balloon-borne andground-based telescopes. Figure7.3 showsKIDarraysmanufactured for theAPEXAMKIDinstrument.In the FP7 SPACEKIDS project, an extensive studywas done of the different kind of KIDs(antenna or absorber coupled devices), new materials, optimization of the radiationcoupling,methods of reducing susceptibility to cosmic rays, KIDmultiplexing,minimizingcrosstalk, and the development of the necessary readout electronics. Other KID studiescurrentlybeingcarriedoutincludespectrometers-on-a-chipandmulti-objectspectrographs.TheSPACEKIDSprojecthasmade significant strides inmanyareasofKID technologyandhas also shown that a CMB satellite experiment has very different requirements thanastrophysics mission. As a follow-up to SPACEKIDS, further work remains be done onreachinghighsensitivity,especially inwavelengthbandsotherthanthesubmillimeter.Forinterferometrythespeedofresponseneedsbesubstantiallyreduced.

74
Figure7.3MKIDarraysfortheAMKIDlowband,readyforshipmenttotheAPEXtelescope
QuantumCapacitanceDetectors(QCDs)InaQCD,radiationcouplingviatheantennabreaksCooperpairsintheabsorber,generatingquasiparticles thatcantunnel inandoutofaso-called“island”.Therateof tunnelling in isproportionaltothequasiparticlepopulationintheabsorber,buttherateoftunnellingoutislargelyindependentofthequasiparticlepopulationintheabsorber.Whenthegatevoltageisswept,oneobservesaseriesofpeaksinthecapacitanceoftheisland(Dutyetal.2005)withamplitudeproportional totheopticalsignalpower.Thechange incapacitance ismeasuredbythephaseshiftofanRFsignaltransmittedthroughthefeedlinecausedbythechangeinthe resonant frequency of the resonator. One can think of the QCD as a KIDwith a qubitcapacitivelycoupledtoit.Therefore,QCDsarenaturallyaseasytomultiplexasKIDs.QCDshave demonstrated photon shot noise-limited performance with respect to the absorbedpower (Echternach et al. 2013) for optical loadings between 10-20 and 10-18 W,correspondingtoanNEPbelow10-20WHz-1/2at1.5THz.QCDfabricationismorecomplicatedthanforKIDssinceaJosephsonjunctionisrequired.Sofar, small arrays (25pixels)havebeen fabricatedat JPL/NASA.Scalability to largerarraysmay be an issue because it is difficult to control the quality of hundreds or thousands ofjunctionsoverawholefour-inchwafer.TheopticalloadingrangeinwhichQCDsarephotonnoise limited is only 0.01 – 1 aW, although it is possible to increase it at the expense ofreducingthedetectorsensitivitybymakinglargerabsorbers.
7.2.2 Coherentsystemsandcomponents
SISmixersDuringthelast20yearsmostastronomicalheterodynereceivershaveusedSuperconductor-Insulator-Superconductor (SIS)devices inwhichquantumtunnelling is themechanism formixing. SIS devices provide large bandwidths and high sensitivity (close to the quantumlimit). They can only operate up to twice the superconducting gapwidth of thematerials

75
used,sothemostcommonlyusedniobium-basedmixersareonlyusablebelow1.5THz.SISdevicesarestilltheprimechoiceforfrequenciesbelow1THz.
HEBmixersA hot electron bolometer mixer consists of a thin film superconducting bridge that iscontactedwith an Au antenna structure. Themost suitablematerial is a niobiumnitridefilm,whichrequiresatypicaloperatingtemperatureof4-5K.Low-noiseHEBmixers(Zhangetal.2010)havebeendemonstratedupto5.3THz.Forexample,aDSBnoisetemperatureof800Kwasmeasuredat4.7THz(Kloostermanetal.2013).HEBmixers,dependingontheirvolumeandcriticaltemperature(Tc),requireLOpoweraslowas~100nWand,unlikeSISmixers,don’tneedamagneticfield,makingthemexcellentcandidatesfor largefocalplaneunitarrays.Asmallarrayoffourpixelshasbeendemonstratedat1.4THzinthelabusingaFourierPhasereflectivegratingtodistributethesingleLOintomultiplebeamsforthearray,whichconsistsofquasi-opticaltwinslotantennacoupledHEBmixers.Arrayswithupto16pixelsatfrequenciesupto4.7THzarecurrentlyinconstructionforSOFIA.Thedevelopmentof array receivers was stimulated by programs within the EU 6th and 7th FrameworkProgramundertheumbrellaofRadioNet.TypicalIFbandwidthsare<4GHz,andanoutstandingquestioninthefieldofHEBmixersishow to increase the IF bandwidth without compromising sensitivity to serve for extra-galacticastrophysicswherelargerbandwidthsareneeded.
TheSchottkyBarrierDiodeMixerThe Schottky barrier diode (see Figure 7.4 for an example picture), can achieve goodsensitivity over awide input signal and IF bandwidth, andwide operational temperaturerange.Forinstance,previousdevelopmentworkatboththeUniversityofVirginia,RALandthe Jet Propulsion Laboratory demonstrated, between over 15 years ago, a roomtemperature system noise performance at 2.5 THz suitable for detection of atmosphericconstituents(Crowe1996,Ellison1996,Gaidis2000).
Figure7.4:ExamplepicturesofRALfabricatedair-bridgeplanarSchottkydiodes–balanceddiode(left)andfullyintegratedstructure,i.e.includingfiltering,(right).Anodesizesareintheregionof1to2µmdiameter.Subsequent developments in diode fabrication, mixer embedding circuit design and postmixing low noise amplifier performance, have produced increasingly impressive results.Fromthisitisclearthatalthoughthereissignificantimprovementstilltobeachievedinthe3–5THzrange,between0.8THzand1.1THzheterodynesystemsofferareasonablelevelof technical maturity and with mixer noise performance typically about 2,000K in DSBoperationandforroomtemperatureoperation.
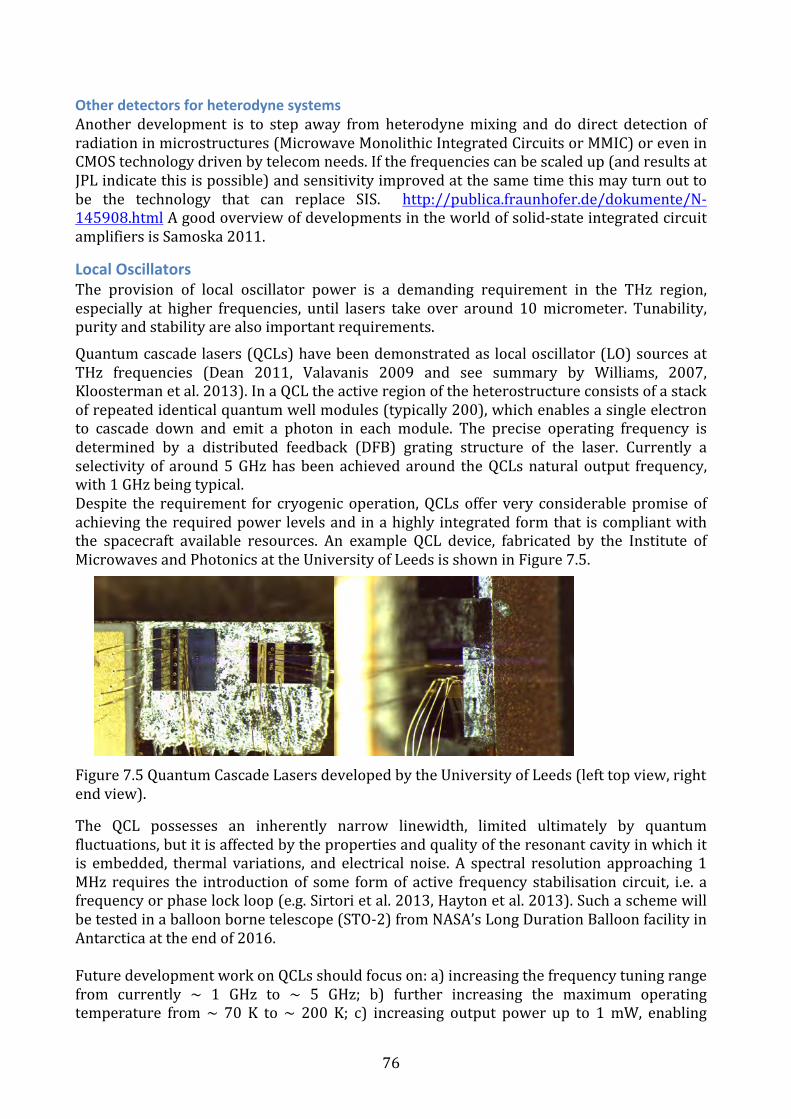
76
OtherdetectorsforheterodynesystemsAnother development is to step away from heterodynemixing and do direct detection ofradiationinmicrostructures(MicrowaveMonolithicIntegratedCircuitsorMMIC)oreveninCMOStechnologydrivenbytelecomneeds.Ifthefrequenciescanbescaledup(andresultsatJPLindicatethisispossible)andsensitivityimprovedatthesametimethismayturnouttobe the technology that can replace SIS. http://publica.fraunhofer.de/dokumente/N-145908.htmlAgoodoverviewofdevelopmentsintheworldofsolid-stateintegratedcircuitamplifiersisSamoska2011.
LocalOscillatorsThe provision of local oscillator power is a demanding requirement in the THz region,especially at higher frequencies, until lasers take over around 10micrometer. Tunability,purityandstabilityarealsoimportantrequirements.Quantumcascadelasers(QCLs)havebeendemonstratedaslocaloscillator(LO)sourcesatTHz frequencies (Dean 2011, Valavanis 2009 and see summary by Williams, 2007,Kloostermanetal.2013).InaQCLtheactiveregionoftheheterostructureconsistsofastackofrepeatedidenticalquantumwellmodules(typically200),whichenablesasingleelectronto cascade down and emit a photon in each module. The precise operating frequency isdetermined by a distributed feedback (DFB) grating structure of the laser. Currently aselectivityof around5GHzhasbeenachievedaround theQCLsnatural output frequency,with1GHzbeingtypical.Despite the requirement for cryogenicoperation,QCLsoffer very considerablepromiseofachievingtherequiredpower levelsandinahighly integratedformthat iscompliantwiththe spacecraft available resources. An example QCL device, fabricated by the Institute ofMicrowavesandPhotonicsattheUniversityofLeedsisshowninFigure7.5.
Figure7.5QuantumCascadeLasersdevelopedbytheUniversityofLeeds(lefttopview,rightendview).
The QCL possesses an inherently narrow linewidth, limited ultimately by quantumfluctuations,butitisaffectedbythepropertiesandqualityoftheresonantcavityinwhichitis embedded, thermal variations, and electrical noise. A spectral resolution approaching1MHz requires the introductionof some formof active frequency stabilisation circuit, i.e. afrequencyorphaselockloop(e.g.Sirtorietal.2013,Haytonetal.2013).Suchaschemewillbetestedinaballoonbornetelescope(STO-2)fromNASA’sLongDurationBalloonfacilityinAntarcticaattheendof2016.FuturedevelopmentworkonQCLsshouldfocuson:a)increasingthefrequencytuningrangefrom currently ~ 1 GHz to ~ 5 GHz; b) further increasing the maximum operatingtemperature from~ 70 K to ~ 200 K; c) increasing output power up to 1mW, enabling
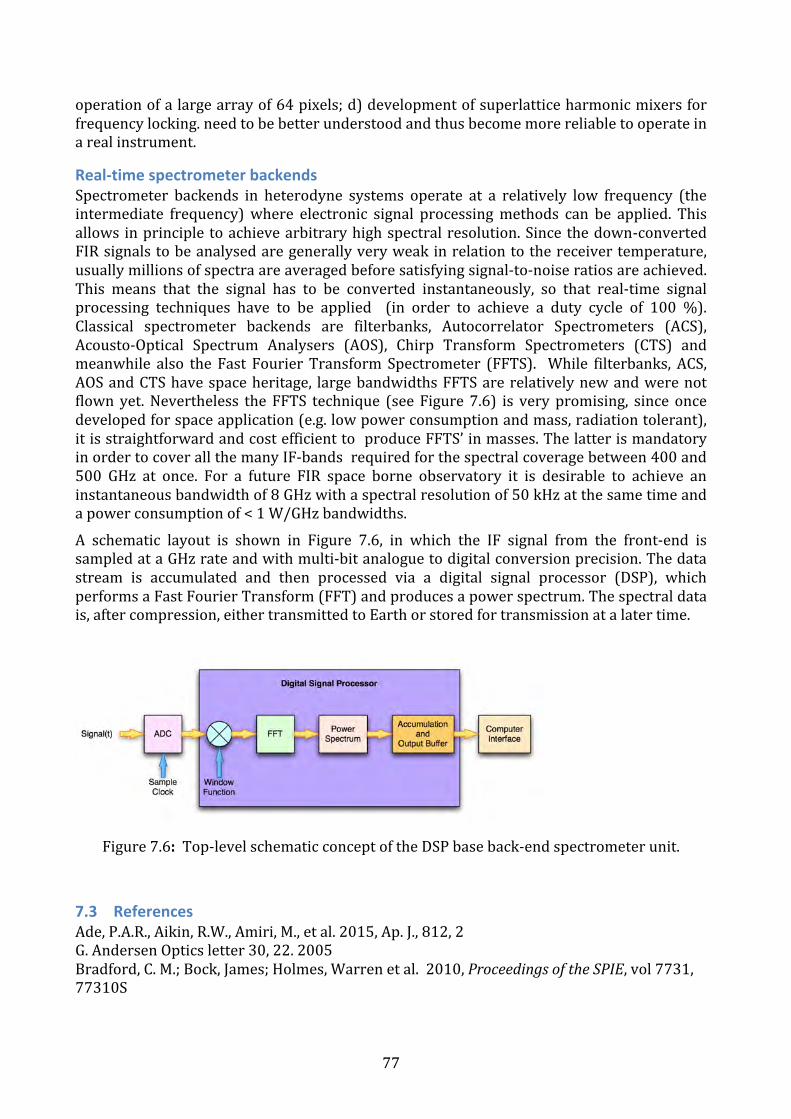
77
operationofalargearrayof64pixels;d)developmentofsuperlatticeharmonicmixersforfrequencylocking.needtobebetterunderstoodandthusbecomemorereliabletooperateinarealinstrument.
Real-timespectrometerbackendsSpectrometer backends in heterodyne systems operate at a relatively low frequency (theintermediate frequency)where electronic signal processingmethods can be applied. Thisallows inprinciple toachievearbitraryhighspectralresolution.Sincethedown-convertedFIRsignalstobeanalysedaregenerallyveryweakinrelationtothereceivertemperature,usuallymillionsofspectraareaveragedbeforesatisfyingsignal-to-noiseratiosareachieved.This means that the signal has to be converted instantaneously, so that real-time signalprocessing techniques have to be applied (in order to achieve a duty cycle of 100 %).Classical spectrometer backends are filterbanks, Autocorrelator Spectrometers (ACS),Acousto-Optical Spectrum Analysers (AOS), Chirp Transform Spectrometers (CTS) andmeanwhile also the Fast Fourier Transform Spectrometer (FFTS). While filterbanks, ACS,AOSandCTShavespaceheritage, largebandwidthsFFTSarerelativelynewandwerenotflownyet.Nevertheless the FFTS technique (see Figure7.6) is verypromising, since oncedevelopedforspaceapplication(e.g.lowpowerconsumptionandmass,radiationtolerant),itisstraightforwardandcostefficienttoproduceFFTS’inmasses.ThelatterismandatoryinordertocoverallthemanyIF-bandsrequiredforthespectralcoveragebetween400and500 GHz at once. For a future FIR space borne observatory it is desirable to achieve aninstantaneousbandwidthof8GHzwithaspectralresolutionof50kHzatthesametimeandapowerconsumptionof<1W/GHzbandwidths.A schematic layout is shown in Figure 7.6, in which the IF signal from the front-end issampledataGHzrateandwithmulti-bitanaloguetodigitalconversionprecision.Thedatastream is accumulated and then processed via a digital signal processor (DSP), whichperformsaFastFourierTransform(FFT)andproducesapowerspectrum.Thespectraldatais,aftercompression,eithertransmittedtoEarthorstoredfortransmissionatalatertime.
Figure7.6:Top-levelschematicconceptoftheDSPbaseback-endspectrometerunit.
7.3 ReferencesAde,P.A.R.,Aikin,R.W.,Amiri,M.,etal.2015,Ap.J.,812,2G.AndersenOpticsletter30,22.2005Bradford,C.M.;Bock,James;Holmes,Warrenetal.2010,ProceedingsoftheSPIE,vol7731,77310S
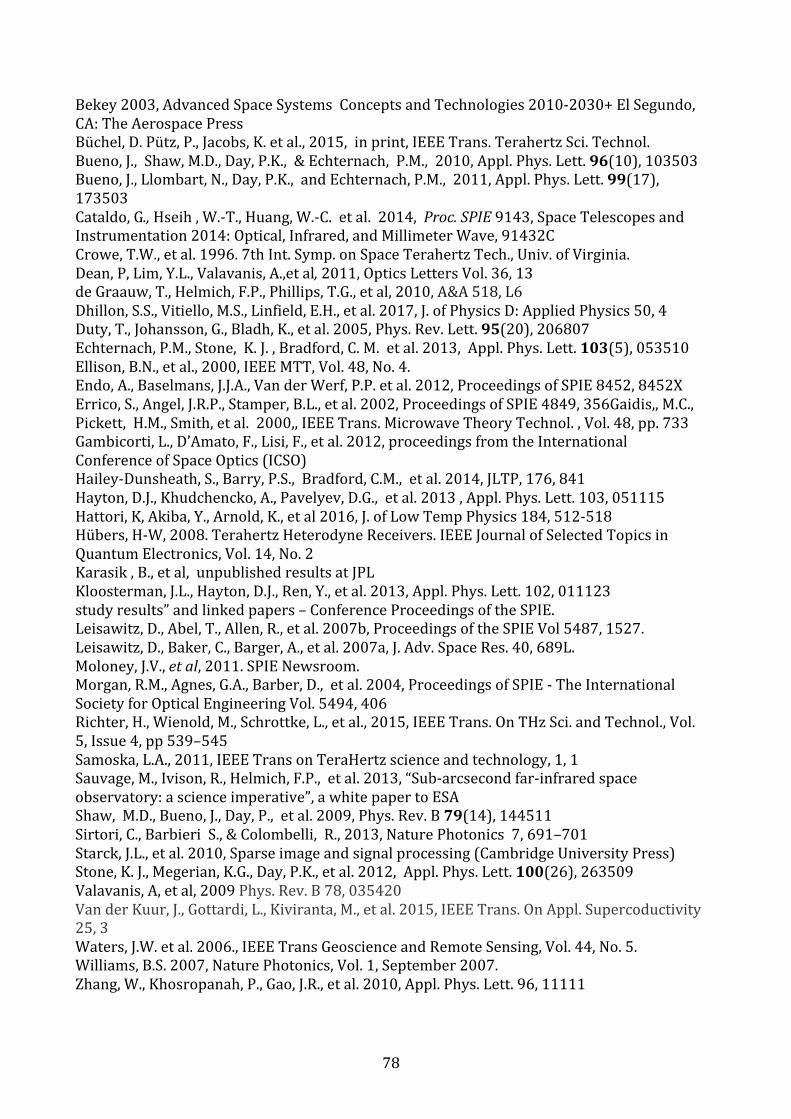
78
Bekey2003,AdvancedSpaceSystemsConceptsandTechnologies2010-2030+ElSegundo,CA:TheAerospacePressBüchel,D.Pütz,P.,Jacobs,K.etal.,2015,inprint,IEEETrans.TerahertzSci.Technol.Bueno,J.,Shaw,M.D.,Day,P.K.,&Echternach,P.M.,2010,Appl.Phys.Lett.96(10),103503Bueno,J.,Llombart,N.,Day,P.K.,andEchternach,P.M.,2011,Appl.Phys.Lett.99(17),173503Cataldo,G.,Hseih,W.-T.,Huang,W.-C.etal.2014,Proc.SPIE9143,SpaceTelescopesandInstrumentation2014:Optical,Infrared,andMillimeterWave,91432CCrowe,T.W.,etal.1996.7thInt.Symp.onSpaceTerahertzTech.,Univ.ofVirginia.Dean,P,Lim,Y.L.,Valavanis,A.,etal,2011,OpticsLettersVol.36,13deGraauw,T.,Helmich,F.P.,Phillips,T.G.,etal,2010,A&A518,L6Dhillon,S.S.,Vitiello,M.S.,Linfield,E.H.,etal.2017,J.ofPhysicsD:AppliedPhysics50,4Duty,T.,Johansson,G.,Bladh,K.,etal.2005,Phys.Rev.Lett.95(20),206807Echternach,P.M.,Stone,K.J.,Bradford,C.M.etal.2013,Appl.Phys.Lett.103(5),053510Ellison,B.N.,etal.,2000,IEEEMTT,Vol.48,No.4.Endo,A.,Baselmans,J.J.A.,VanderWerf,P.P.etal.2012,ProceedingsofSPIE8452,8452XErrico,S.,Angel,J.R.P.,Stamper,B.L.,etal.2002,ProceedingsofSPIE4849,356Gaidis,,M.C.,Pickett,H.M.,Smith,etal.2000,,IEEETrans.MicrowaveTheoryTechnol.,Vol.48,pp.733Gambicorti,L.,D’Amato,F.,Lisi,F.,etal.2012,proceedingsfromtheInternationalConferenceofSpaceOptics(ICSO)Hailey-Dunsheath,S.,Barry,P.S.,Bradford,C.M.,etal.2014,JLTP,176,841Hayton,D.J.,Khudchencko,A.,Pavelyev,D.G.,etal.2013,Appl.Phys.Lett.103,051115Hattori,K,Akiba,Y.,Arnold,K.,etal2016,J.ofLowTempPhysics184,512-518Hübers,H-W,2008.TerahertzHeterodyneReceivers.IEEEJournalofSelectedTopicsinQuantumElectronics,Vol.14,No.2Karasik,B.,etal,unpublishedresultsatJPLKloosterman,J.L.,Hayton,D.J.,Ren,Y.,etal.2013,Appl.Phys.Lett.102,011123studyresults”andlinkedpapers–ConferenceProceedingsoftheSPIE.Leisawitz,D.,Abel,T.,Allen,R.,etal.2007b,ProceedingsoftheSPIEVol5487,1527.Leisawitz,D.,Baker,C.,Barger,A.,etal.2007a,J.Adv.SpaceRes.40,689L.Moloney,J.V.,etal,2011.SPIENewsroom.Morgan,R.M.,Agnes,G.A.,Barber,D.,etal.2004,ProceedingsofSPIE-TheInternationalSocietyforOpticalEngineeringVol.5494,406Richter,H.,Wienold,M.,Schrottke,L.,etal.,2015,IEEETrans.OnTHzSci.andTechnol.,Vol.5,Issue4,pp539–545Samoska,L.A.,2011,IEEETransonTeraHertzscienceandtechnology,1,1Sauvage,M.,Ivison,R.,Helmich,F.P.,etal.2013,“Sub-arcsecondfar-infraredspaceobservatory:ascienceimperative”,awhitepapertoESAShaw,M.D.,Bueno,J.,Day,P.,etal.2009,Phys.Rev.B79(14),144511Sirtori,C.,BarbieriS.,&Colombelli,R.,2013,NaturePhotonics7,691–701Starck,J.L.,etal.2010,Sparseimageandsignalprocessing(CambridgeUniversityPress)Stone,K.J.,Megerian,K.G.,Day,P.K.,etal.2012,Appl.Phys.Lett.100(26),263509Valavanis,A,etal,2009Phys.Rev.B78,035420VanderKuur,J.,Gottardi,L.,Kiviranta,M.,etal.2015,IEEETrans.OnAppl.Supercoductivity25,3Waters,J.W.etal.2006.,IEEETransGeoscienceandRemoteSensing,Vol.44,No.5.Williams,B.S.2007,NaturePhotonics,Vol.1,September2007.Zhang,W.,Khosropanah,P.,Gao,J.R.,etal.2010,Appl.Phys.Lett.96,11111

79
8 MissionDescriptions
8.1 FIRSPEX(proposedforM5CosmicVision)TheFar-InfraredSpectroscopicExplorer(FIRSPEX)isaEuropean-ledmissiondevelopedtoenablesensitivelargearea,highspectralresolution(>106)surveysoftheIRskyintheTHzregime. FIRSPEX uses superconducting mixers configured as tunnel junctions and hotelectron bolometers in conjunction with frequency stable local oscillators (LOs) andadvanced digital sampling and analysistechniques.FIRSPEXcomprisesaheterodynepayloadcooledto4Kanda1.2mprimaryantenna to scan largeareasofskyfromL2(Figure7.7).Therearefourparallel receiver channels that can operatesimultaneously and therefore independentlysample neighbouring regions of the far-IR sky.Eachreceiverchannel is locatedwithin the focalplane of the 1.2m primary and offers angularresolution of the order of 1 arcmin. Theinstrument ispassively cooled to50K (L2orbit)and,withactivecoolertechnologyprovidingsub-stageswithnecessaryheatliftat4Kand15K.The4Kstagecools thesensitivemixersand the firststages of low noise amplification. Each receiveroperatesinadoublesidebandconfiguration.Intotalthereare7samplingpixelsonthesky.The frequency band allocations are described in the Table along with estimated systemsensitivities. Bands 1 through 3 use two independent mixers per frequency band givingmultiplepixelsamplingtocompensateforthesmallerbeams.Couplingtotheprimaryquasi-opticalfocalplaneisaccomplishedviarelayopticscomprisingaseriesofre-imagingmirrors.For Band 1, 2 and 3, conventional harmonic frequency up-convertors provide suitablesourcesofLOpowerinjectedintothemixerusingsimplebeamsplitter.Forband4,theLOsourceisprovidedbyaquantumcascadelaser(QCL)cooledto~50K.EachmixerisfollowedbyacooledLNAandafurtherstageofambienttemperatureamplification,whiletheIFfinaloutputisprocessedbyadedicatedfastFourierTransformspectrometer(FFTS).
Designation Frequency (THz) Primary Species Secondary Species No of Pixels System Noise (K)
Band 1 0.81 CI CO(7-6) 1 180
Band 2 1.45 NII SH+,SO,CF+,H2O+ 2 350
Band 3 1.9 CII 13C+ 2 500
Band 4 4.7 OI - 2 800
FIRSPEXopensup apreviouslyunexplored spectral and spatial parameter space thatwillproduce an enormously significant scientific legacy by focusing on the properties of themulti-phase ISM, the assembly of molecular clouds in our Galaxy and the onset of starformation;topicswhicharefundamentaltoourunderstandingofgalaxyevolution.
Figure8.1:FIRSPEXmissionconcept
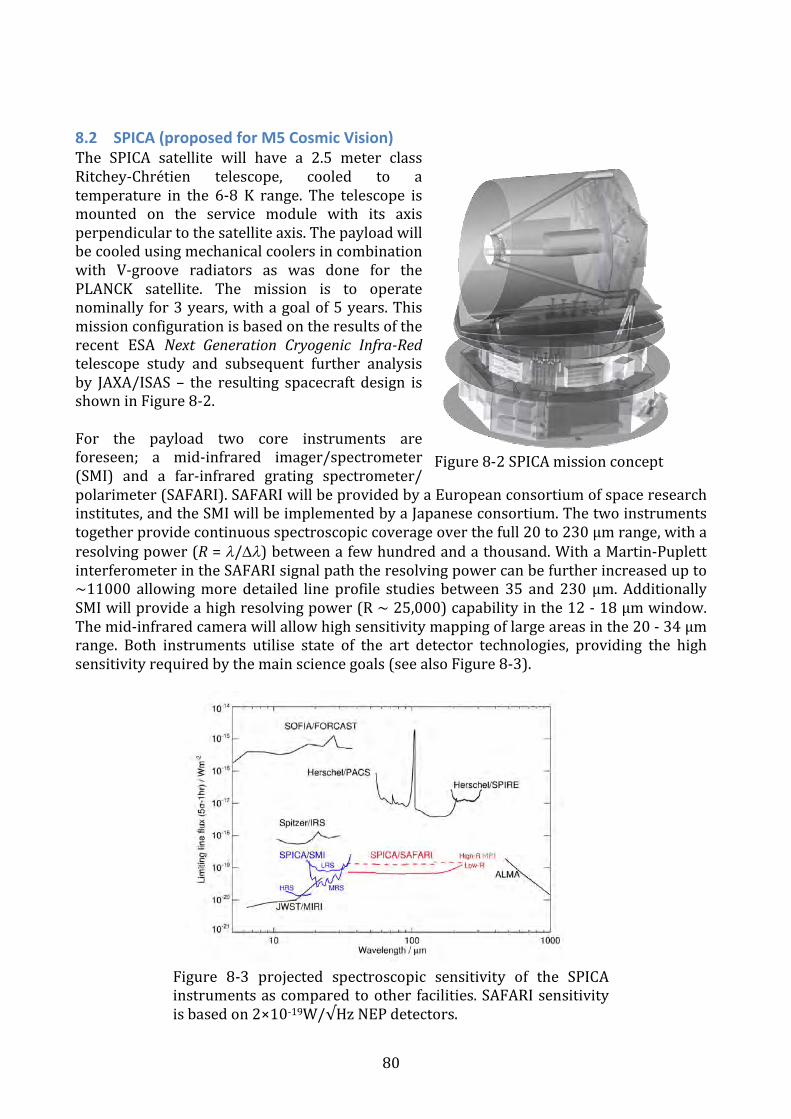
80
8.2 SPICA(proposedforM5CosmicVision)The SPICA satellite will have a 2.5 meter classRitchey-Chrétien telescope, cooled to atemperature in the 6-8 K range. The telescope ismounted on the service module with its axisperpendiculartothesatelliteaxis.Thepayloadwillbecooledusingmechanicalcoolersincombinationwith V-groove radiators as was done for thePLANCK satellite. The mission is to operatenominally for3years,withagoalof5years.Thismissionconfigurationisbasedontheresultsoftherecent ESA Next Generation Cryogenic Infra-Redtelescope study and subsequent further analysisby JAXA/ISAS – the resulting spacecraft design isshowninFigure8-2.For the payload two core instruments areforeseen; a mid-infrared imager/spectrometer(SMI) and a far-infrared grating spectrometer/polarimeter(SAFARI).SAFARIwillbeprovidedbyaEuropeanconsortiumofspaceresearchinstitutes,andtheSMIwillbeimplementedbyaJapaneseconsortium.Thetwoinstrumentstogetherprovidecontinuousspectroscopiccoverageoverthefull20to230μmrange,witharesolvingpower(R=l/Dl)betweenafewhundredandathousand.WithaMartin-PuplettinterferometerintheSAFARIsignalpaththeresolvingpowercanbefurtherincreasedupto~11000 allowingmore detailed line profile studies between35 and 230 μm.AdditionallySMIwillprovideahighresolvingpower(R~25,000)capabilityinthe12-18μmwindow.Themid-infraredcamerawillallowhighsensitivitymappingoflargeareasinthe20-34μmrange. Both instruments utilise state of the art detector technologies, providing the highsensitivityrequiredbythemainsciencegoals(seealsoFigure8-3).
Figure8-2SPICAmissionconcept
Figure 8-3 projected spectroscopic sensitivity of the SPICAinstrumentsascomparedtoother facilities.SAFARIsensitivityisbasedon2×10-19W/√HzNEPdetectors.
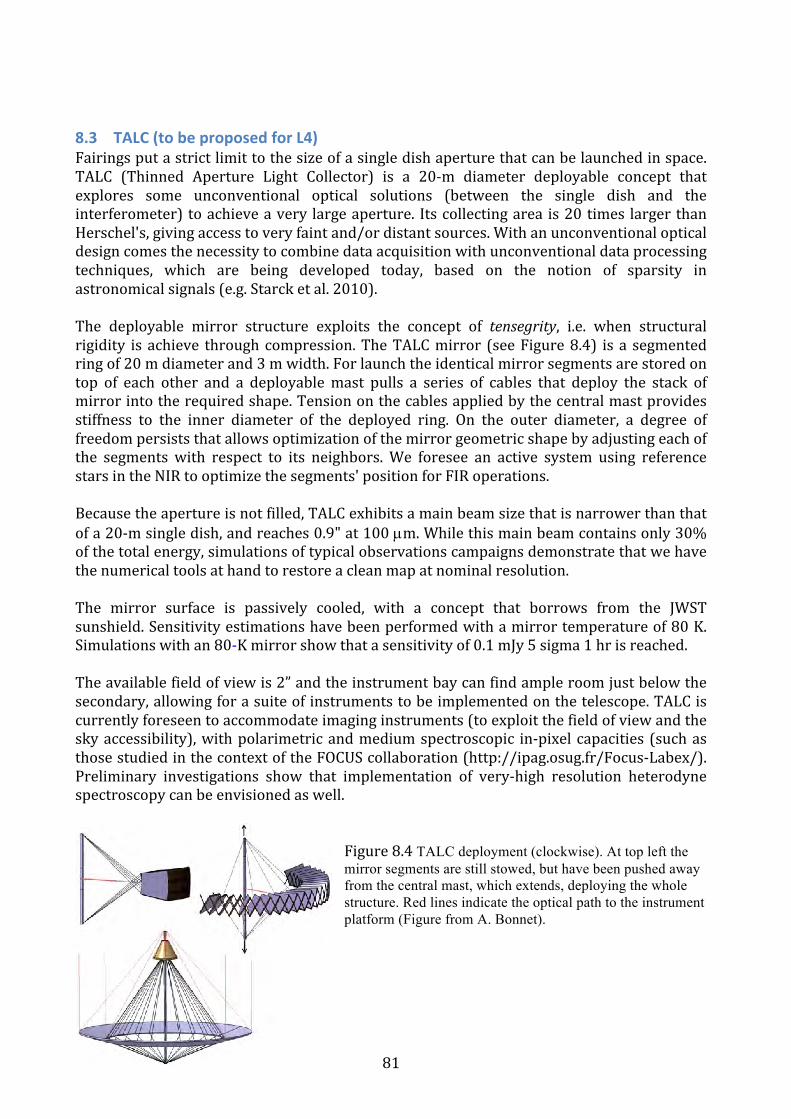
81
8.3 TALC(tobeproposedforL4)Fairingsputastrictlimittothesizeofasingledishaperturethatcanbelaunchedinspace.TALC (Thinned Aperture Light Collector) is a 20-m diameter deployable concept thatexplores some unconventional optical solutions (between the single dish and theinterferometer)toachieveavery largeaperture. Itscollectingarea is20times largerthanHerschel's,givingaccesstoveryfaintand/ordistantsources.Withanunconventionalopticaldesigncomesthenecessitytocombinedataacquisitionwithunconventionaldataprocessingtechniques, which are being developed today, based on the notion of sparsity inastronomicalsignals(e.g.Starcketal.2010).The deployable mirror structure exploits the concept of tensegrity, i.e. when structuralrigidity is achieve throughcompression.TheTALCmirror (seeFigure8.4) is a segmentedringof20mdiameterand3mwidth.Forlaunchtheidenticalmirrorsegmentsarestoredontop of each other and a deployablemast pulls a series of cables that deploy the stack ofmirrorintotherequiredshape.Tensiononthecablesappliedbythecentralmastprovidesstiffness to the inner diameter of the deployed ring. On the outer diameter, a degree offreedompersiststhatallowsoptimizationofthemirrorgeometricshapebyadjustingeachofthe segments with respect to its neighbors.We foresee an active system using referencestarsintheNIRtooptimizethesegments'positionforFIRoperations.Becausetheapertureisnotfilled,TALCexhibitsamainbeamsizethatisnarrowerthanthatofa20-msingledish,andreaches0.9"at100µm.Whilethismainbeamcontainsonly30%ofthetotalenergy,simulationsoftypicalobservationscampaignsdemonstratethatwehavethenumericaltoolsathandtorestoreacleanmapatnominalresolution.The mirror surface is passively cooled, with a concept that borrows from the JWSTsunshield.Sensitivityestimationshavebeenperformedwithamirrortemperatureof80K.Simulationswithan80-Kmirrorshowthatasensitivityof0.1mJy5sigma1hrisreached.Theavailablefieldofviewis2”andtheinstrumentbaycanfindampleroomjustbelowthesecondary,allowingforasuiteofinstrumentstobeimplementedonthetelescope.TALCiscurrentlyforeseentoaccommodateimaginginstruments(toexploitthefieldofviewandtheskyaccessibility),withpolarimetricandmediumspectroscopic in-pixelcapacities (suchasthosestudiedinthecontextoftheFOCUScollaboration(http://ipag.osug.fr/Focus-Labex/).Preliminary investigations show that implementation of very-high resolution heterodynespectroscopycanbeenvisionedaswell.
Figure8.4 TALC deployment (clockwise). At top left the mirror segments are still stowed, but have been pushed away from the central mast, which extends, deploying the whole structure. Red lines indicate the optical path to the instrument platform (Figure from A. Bonnet).

82
8.4 OriginsSpaceTelescope(candidatemissionfornextdecadalplan,afterWFIRST)TheOriginsSpaceTelescopeisunderstudyrightnowandtheexactconfigurationisnotyetknown.Thelargestconceptisa9.4mtelescope(Figure8.5)cooleddowntoapproximately4K andoperatingbetween30 (or lower) and600µm. It hasbeen chosenby theAmericansciencecommunityasthemaincandidatefortheFIRsurveyorstudythathasstartedearly2016.In order to bring down the telescope and instruments to 4 K, a systemwith sun-shields,stackedV-groovesandclosedcyclecoolers.Theprimary instrumentation forCALISTO isasuiteof5–8moderateresolution(R~500)widebandspectrometers,whichcombinetospanthefull30to600µmrangeinstantaneouslywithnotuning.Thedetailedarrangementofthemodulesinthefocalplaneandthedegreetowhichmultiplemodulescancoupletothesamesky position simultaneously is a subject for the detailed study, but any given frequencychannelwillcoupleatleasttensandupto200spatialpixelsonthesky.Fouriertransformmoduleswillprovidehigherresolutioninthegratingorders.Broadbandimagers(cameras)arealsostudied,andthiscouldbeparticularlypowerfulfortheshortwavelengthswherethebeamissmallandtheconfusionlimitisthusdeep.Finally,wenotethepotentialforheterodynespectrometerarrays(studiedinEurope).Whilenotbenefittingfromthecryogenicaperture,phase-preservingspectrometersoffertheonlymeansofobtainingvelocityinformationanddetailedlineprofilesforGalacticISMstudiesaswellasprotostarsandprotoplanetarydisks.Asaguidetothesensitivity,themagentacurveincreasingwithfrequencyinFigure8.6showsthesensitivityofaquantum-limitedreceivertoat10-km/swideline.Ifthelineprofileitselfisnotofinterest,andlineconfusionandline-to-continuumconcernsarenotaconcern,thenthedirectdetectionsystemismoresensitiveevenatverynarrowlinewidths.Figure8.5OSTwilllookverysimilartoJWSTwithlarge,activelycooledsegmentedmirrorandshieldsFigure8.6Mappingspeedfordifferentfacilities
83
8.5 VisionInterferometryMissionsInadditiontothepreviouslydescribedmissionswhichhaveadefinitecollocationinanear-tomid-futuretimeframe,therehavebeenmorethanafewstudiesrelatingtowhatisperceivedtobetheinevitablepost-singledishEraforFar-Infraredastrophysics(Blandfordetal.2010).Interferometryisperformedpreferentiallyintwowayswhichdefinedistinctlythenatureoftheinterferometerandthetechnologyitmakesuseof(alreadyaddressedinmostofthetechnologysection):heterodyneanddirectdetection.Missionconceptshavebeenproposedforbothcasesandarereportedhere.Thecommonadvantageinpursuinginterferometryinspaceisthehugeincreaseinangularresolutionwhichresultsfromtheverylargebaselineswhichtheseconceptsproposeandtheonlywaytoguaranteethesoughtaftersub-arcsecondangularresolution.Themaindisadvantagewhichthenensuesistherelativelysmallcollectionaperturewhencomparedtolargesingledishesinbothcases.Tothisdatewehavenorecordofcombinedlargebaselinespaceinterferometersproposedwhichpresentbothoftheabovetechnologiescombined.
8.5.1 HeterodyneSpaceInterferometersTheESPRITconceptwasproposedin2008(Wildetal.2008)featuringfree-flyingformationofsatellitespresentinganumberofdishes(4ormore)of3.5mdiameterwithbaselinesoftheorderof(butwithapotentialofanorderofmagnitudelarger)50mwiththeneedforprecisepositionalmetrologyandtiming(butrelaxedwithregardstopositionalcontrol).Thelatteristhemainadvantageofsuchaconceptinadditiontotheinherenthigh-resolutionspectroscopyavailabletotheheterodyneback-endspectrometers.Aconsequenceofthelowersensitivityistheadditionaladvantageonreducedrequirementsforacooledtelescope.
8.5.2 Directdetection(VLBI)SpaceInterferometersTheSPECSconcept(anditspathfinderSPIRIT)proposedin2002(Leisawitzetal.2001)werestudiedthoroughlybetween2004and2007(papersinLeisawitzetal.2006)andproposedadoubleFouriermodulationtechniquewhichallowsMichelsoninterferometrytoachievespectroscopymodulateddynamicallywiththechangeofbaselinestoyieldspectraldatacubes.Theseconceptspresentedatwo-dishsinglevariableconnectedbaseline(100-classmtetherand2x18mextendableboomrespectively).ThistechniquewasalsofurtherexploredinanESACDFstudy(FIRI,Lyngvietal.2007)andlaterwiththeFISICA-FP7activity(www.fp7-fisica.eu)whichproducedapubliclyavailableopensourceinstrumentsimulatorPyFIInS(Rinehartetal.2007)toexplorethepotentialofthisconcept.Whilethesensitivitylimitationfromtherelativelysmalldiscaperture(2mand1mrespectively)iscompensatedbyhighsensitivitydetectors,disadvantagesincludethelimitationinspectralresolution(<10^4)andrequirementforcryogenicmirrors(<4K).Inaddition,theVLBInatureoftheinterferometerimpliesaconnectedstructurewithstrongemphasisonthefractionalwavelengthlevelpositioningofthetwoantennas.
8.5.3 ExistingproposalsforSpaceInterferometersatthetimeofsubmissionAtthetimeofsubmission,theonlyknownexistingproposalofaspaceinterferometeristheSHARP-IRconcept(submittedtotheNASA-ProbeClasscallandintendedasasmallerincarnationoftheSPIRITconcept,Rinehartetal.2007).Withtwo0.8mclasscooledtelescopesandamaxbaselineof12m,SHARP-IRisthecurrentvisionforanallconnecteddeployableinterferometer.www.fp7-fisica.euandhttp://cordis.europa.eu/project/rcn/106557_en.html-(2015)
84
8.6 ReferencesBlandford,R.etal.2010,TheDecadalreportNewWorlds,NewHorizonsinAstronomyandAstrophysicsisavailableathttp://www.nap.edu/catalog.php?record_id=12951Leisawitz,D.etal.2001,IEEEProceedingsoftheAerospaceconferenceNo.01TH8542.Leisawitz,D.etal2006,TheSpaceInfraredInterferometricTelescope(SPIRIT):Missionstudyresults”andlinkedpapers–ConferenceProceedingsoftheSPIE.Lyngvi,A.,2006,FIRI-ESACDFStudyReport.Rinehart,S.2016,“SHARP-IR:TheSpaceHighAngularResolutionProbefortheInfraRed”,ProposalsubmittedtoNASAinresponsetoNRANNH16ZDA001N-APROBES.Wild,W.etal.2008,inSPIEConferenceSeries,v.7013.

85
9 AcknowledgementsThetechnologysectionisbasedoninputsfromBrianEllison,Jian-rongGao,SPACEKIDSconsortium,JuanBueno,ColinCunningham,GiorgioSavini,MattGriffin,MattBradford,MarcSauvage,DimitraRigopoulou,BruceSwinyard,PeterRoelfsema,FabianThomeandGillesDurandSpecialthanksgotoVanessaDoublierforaverycarefulreadingofthedocument.

86
10 ListofAcronymsAGB-asymptoticgiantbranchAGN-activegalacticnucleusALMA-AtacamaLargeMillimeterArrayA-MKIDcamera–APEXMicrowaveKidInductanceDetectorcameraAPEX-AtacamaPathfinderExperimentATLAST-AdvancedTechnologyLargeApertureSpaceTelescopeACS-AutocorrelatorSpectrometerAOS-Acousto-OpticalSpectrometerBH-blackholeBICEP-BackgroundImagingofCosmicExtragalacticPolarizationBLISS-Background-LimitedInfrared-SubmillimeterSpectroscopyCALISTO-CryogenicApertureLargeInfraredSpaceTelescopeObservatoryCIB-CosmicInfraredBackgroundCIRS-CompositeInfraredSpectrometerCMB-CosmicMicrowaveBackgroundCNM-coldneutralmediumCOBE-CosmicBackgroundExplorerCOrE+-CosmicOriginsExplorerCTS-ChirpTransformSpectrometersD/H-deuterium/hydrogenDARPA-DefenseAdvancedResearchProjectsAgencyDGR-Dust-to-gasmassratioDART-DualAnamorphicReflectorTelescopeDFB-distributedfeedbackHEB-HotElectronBolometerIR-infraredISM-interstellarmediumE-ELT-EuropeanExtremelyLargeTelescopeFFTS-FastFourierTransformSpectrometerFIR-far-infraredFIRAS-FarInfraredAbsoluteSpectrophotometerFIRSPEX-Far-InfraredSpectroscopicExplorerFISICA-FarInfraredSpaceInterferometerCriticalAssessmentFS-fine-structureFTS-FourierTransformSpectrometerFUV-far-ultraviolet

87
GMC-giantmolecularcloudGRACE-GravityRecoveryandClimateExperimentGREAT-GermanReceiverforAstronomyatTerahertzFrequenciesHD–DeuteratedHydrogenHDO–DeuteraredwaterHEB-HotElectronBolometerHerMES-HerschelMulti-tieredExtragalacticSurveyHEMT-High-electron-mobilitytransistorHIFI-HeterodyneInstrumentfortheFar-Infrared(Herschel)HIM-hotionizedmediumHST-HubbleSpaceTelescopeIDP-interplanetarydustparticlesIGM-intergalacticmediumIF-intermediatefrequencyIRAS-InfraredAstronomicalSatelliteISAS-InstituteofSpaceandAstronauticalScience(Japan)ISM-interstellarmediumISO-InfraredSpaceObservatoryJUICE-JUpiterICymoonsExplorerJFC-JupiterfamilycometJLTP-JournalofLowTemperaturePhysicsJPL-JetPropulsionLaboratoryJWST-JamesWebbSpaceTelescopeKAO-KuiperAirborneObservatoryKBO-KuiperbeltobjectKID-KineticInductanceDetectorLIRG-luminousinfraredgalaxiesLiteBIRD-LightsatelliteforthestudiesofB-modepolarizationandInflationfromcosmicbackgroundRadiationDetectionLMC–LargeMagellanicCloudLNA-low-noiseamplifierLO-localoscillatorLWS-LongwaveSpectrographMBC-mainbeltcometMETIS-Mid-infraredE-ELTImagerandSpectrographMHD-MagnetohydrodynamicsMIPS–MultibandImagingPhotometerMIR-mid-infraredMIRI-MidInfraredInstrumentMKID-MicrowaveKineticInductanceDetectorMMIC-MicrowaveMonolithicIntegratedCircuitsMOIRE-MembraneOpticalImagesforRealTimeExploitationMS-mainsequenceNEP-noiseequivalentpowerNIR-near-infraredNIRSPEC-NearInfraredSpectrographNOEMA-NorthernExtendedMillimeterArrayNRAO-NationalRadioAstronomyObservatoryOCC-Oortcloudcomet

88
OPR–ortho-to-pararatioOST-OriginsSpaceTelescopePACS–PhotodetectorArrayCameraandSpectrometerPAH-PolycyclicAromaticHydrocarbonPDF-probablydistributionfunctionPDR-photodissociationregionPDR-photon-dominatedregionPEP-PACSExtragalacticProbePROBA-ProjectforOn-BoardAutonomyQCD-QuantumCapacitanceDevicesQCL-QuantumcascadelaserRAL-RutherfordAppletonLaboratoryRF-radiofrequencyROSINA-RosettaOrbiterSpectrometerforIonandNeutralAnalysisSAFARI-SpicAFAR-infraredInstrumentSED-SpectralenergydistributionSFH-star-formationhistorySFR-starformationrateSFRD-star-formationratedensitySIS-Superconductor-Insulator-SuperconductorSLED-spectral-lineenergydistributionSMBH's-super-massiveBlackHolesSNe-supernovaeSNR-SignaltonoiseratioSNR-supernovaremnantSOFIA-StratosphericObservatoryforInfraredAstronomySMI-SpicaMid-infraredInstrumentSPICA-SpaceInfra-RedTelescopeforCosmologyandAstrophysicsSPIRE-SpectralandPhotometricImagingReceiverSTO-StratosphericTerahertzObservatorySWI-SubmmWaveInstrumentTALC-ThinApertureLightCollectorTES-TransitionEdgeSensorULIRG-ultraluminousinfraredgalaxyUV-ultravioletVLTI-VeryLargeTelescopeInterferometerVSMOW-ViennaStandardMeanOceanWaterWFIRST-WideFieldInfraredSurveyTelescopeWIM-warmionizedmediumWISE-Wide-fieldInfraredSurveyExplorerWNM-warmneutralmediumXIFU-X-rayIntegralFieldUnit