The Euro as a Reserve Currency for Global … Euro as a Reserve Currency for Global Investors Luis...
35
The Euro as a Reserve Currency for Global Investors Luis M. Viceira 1 and Ricardo Gimeno April 2010 1 Viceira: Harvard Business School, Boston MA 02163, CEPR and NBER. Email [email protected]. We are very grateful to Johnny Kang for extremely valuable research asistance, and to Rafael Repullo, Jaume Ventura, and participants in the Spain in the EMU Conference organized by the Banco de España for helpful comments and suggestions.
Transcript of The Euro as a Reserve Currency for Global … Euro as a Reserve Currency for Global Investors Luis...

The Euro as a Reserve Currency for Global
Investors
Luis M. Viceira1 and Ricardo Gimeno
April 2010
1Viceira: Harvard Business School, Boston MA 02163, CEPR and NBER. Email [email protected].
We are very grateful to Johnny Kang for extremely valuable research asistance, and to Rafael
Repullo, Jaume Ventura, and participants in the Spain in the EMU Conference organized by the
Banco de España for helpful comments and suggestions.

1 Introduction
Reserve currencies are traditionally defined as currencies held in significant quanti-
ties by central banks and other major financial institutions as part of their foreign
exchange reserves. Under this definition, the euro has become one of the main re-
serve currencies in the world since its introduction in 1999, second only to the U.S.
dollar. The euro represented 25.9% of worldwide official foreign exchange reserves
in the first quarter of 2009, up from 18.3% in the last quarter of 2000. This growth
has become mainly at the expense of the U.S. dollar which, although still represented
64.9% of worldwide official foreign exchange reserves in the first quarter of 2009, has
seen its share of global reserves decline significantly from 71% in the last quarter of
year 2000.2
The holding of certain currencies in significant quantities by central banks and
major financial institutions reflects to a large extent a desire by households and firms
to hold them. Accordingly, understanding the factors driving household demand
for currencies can help explain what makes a currency into a reserve currency. One
important driver of currency demand is transactions. Many goods and services traded
at a global scale such as oil are typically priced in certain currencies, particularly the
U.S. dollar. This results in a desire by households and firms to hold those currencies to
facilitate their current and future transactions of these goods. This article argues that
financial considerations can also be an important driver of the demand for currencies.
As financial assets, currencies are essentially investments in cash instruments. The
return to a local investor from holding a foreign currency is equal to the short-term
interest rate paid on that currency plus the change in the exchange rate between
that currency and his own local currency. As with any other financial asset, investors
demand foreign currencies must be driven by either speculative reasons or hedging–or
risk management–reasons.
Speculative demand for specific currencies arises when investors expect high re-
turns on those currencies in excess to the interest paid on their own currency. Spec-
ulative reasons are unlikely to be a main driver of stable demand for currencies.
The empirical evidence about the long-term returns on the currencies of developed
economies suggests that unconditional expected excess currency returns are close to
zero; this makes them unattractive assets to hold for speculative reasons, at least on
2IMF Statistics Department COFER database and International Financial Statistics.
1

a long-term basis (Campbell, Serfaty-de Medeiros, and Viceira, 2010). The existing
evidence that the currencies of developed economies with high short-term interest
rates tend to appreciate, while the currencies of developed economies with low short-
term interest rates tend to depreciate,3 provides some basis for holding currencies for
speculative reasons, but only on a short-term basis. The currency trading strategy
implied by this empirical phenomenon known as “carry trade ”calls not for holding
stable long positions in certain currencies, but rather for holding actively managed
currency portfolios whose long positions vary with interest rates (Burnside, Eichen-
baum, and Rebelo (2007), Brunnermeier, Nagel, and Pedersen (2009)). The recent
financial crisis has also provided a painful reminder that this is a risky strategy whose
returns can reverse very quickly, causing important losses to investors.
A more promising venue for generating stable long-term demand for currencies
is risk management. Currencies can help investors manage portfolio risk. First,
currencies can help conservative investors seeking to minimize overall portfolio risk or
consumption risk. A well-known result in dynamic portfolio choice is that the optimal
portfolio that minimizes risk is composed of local-currency inflation-indexed bonds
matching the investor’s consumption horizon. Inflation-indexed bonds help investors
minimize risk because they help investors hedge real interest rate risk and inflation
risk (Campbell and Viceira 2001, 2002; Brennan and Xia 2002; Campbell, Chan, and
Viceira 2003; Wachter 2003). However, local-currency inflation-indexed bonds are
not always available to investors. An important question then is which assets best
approximate the hedging properties of inflation-indexed bonds.
Nominal bonds denominated in local currency will be effective substitutes of
inflation-indexed bonds only to the extent that local real interest rates and expected
inflation are stable at the investor’s horizon. Otherwise, they might not be good sub-
stitutes, and bonds denominated in foreign currencies might help investors hedge real
interest rate risk and inflation. For example, the presence of short-term inflation un-
certainty makes short-term nominal bonds risky; in that case Adler and Dumas (1983)
argue that portfolios of short-term bonds denominated in foreign currencies can help
short-term investors minimize risk. However, this argument for holding foreign cur-
rencies is not likely to have significant practical relevance for investors in developed
economies, as short-term inflation risk is generally small in these economies.
If real interest rates are not stable, local-currency short-term nominal bonds are
3This is known as the “forward premium puzzle” (Hansen and Hodrick (1980), Fama (1984),
Hodrick (1987), Engel (1996)).
2

risky at long horizons, even if short-term inflation expectations are stable. They are
risky because they expose investors to real interest rate risk–or reinvestment risk.
Local-currency long-term nominal bonds can help investors hedge this risk, because
they experiment capital gains when real interests fall. However, these bonds expose
investors to long-term inflation risk, which can be significant in practice (Campbell
and Viceira 2005). In that case, Campbell, Viceira and White (2003, CVW hence-
forth) argue that bonds denominated in foreign currencies with stable real interest
rates can help long-term investors hedge real interest rate risk and inflation risk.
Second, currencies can also help less conservative investors who optimally hold
portfolios of risky assets such as stocks or bonds to manage risk when the excess re-
turns on certain currencies are negatively correlated with the returns on other assets.
Campbell, Serfaty-de Medeiros, and Viceira (2010, CSV henceforth) argue that in-
vestors can reduce the overall volatility of their portfolios by investing in self-financing
currency portfolios that effectively transform the currency exposure implicit in their
portfolios of assets into exposure to the currencies whose returns are negatively cor-
related with the returns on those assets. Of course, if currency returns are largely
uncorrelated with the returns on other assets, investors holding internationally di-
versified portfolios of equities and bonds should optimally avoid investing in foreign
currencies by fully hedging the currency exposure implicit in their portfolios (Solnik
1974).
These arguments suggest a definition of a reserve currency from a risk management
perspective. A reserve currency is one that investors demand either because it helps
them hedge real interest rate risk and inflation risk, or because it helps them reduce
the volatility of their portfolios of stocks and bonds because its return is negatively
correlated with the returns on those assets. CVW find that empirically the U.S.
dollar and the deutschemark and its successor the euro have been reserve currencies
in the first sense. Interestingly, CSV find that these two currencies are also reserve
currencies in the second sense. The evidence in CVW about the euro is limited
because their sample period is mostly dominated by the deutschemark, while the
evidence in CSV is more robust, because their sample period includes most of the
existence of euro as a currency. This article re-examines the role of the euro as a
reserve currency in the sense of CVW by revising and updating their evidence for
the most recent period, and reviews the evidence in CSV in detail. Of course, this
raises the important question of why in equilibrium certain currencies become reserve
currencies in the risk management sense of CVW or CSV, while others do not. Hassan
(2008) examines this question, and provides a rationale based on consumption risk.
3
This article also reviews these general equilibrium arguments.
Another area of focus of this article is the exploration of the role of the euro
as a currency that promotes the integration of segmented capital markets and thus
risk sharing among investors in the countries that have joined the European Monetary
Union (EMU). In particular, it explores if stock markets in these countries have ceased
to be priced locally, instead becoming priced at the level of the new currency area.
Prior research has already provided some evidence that the adoption of the euro
has been conducive to capital market integration. De Santis and Gerard (2006) and
Schoenmaker and Bosch (2008) document a strong decline in equity home bias after
the introduction of the euro in 1999, and attribute this reduction to the emergence
of institutional investors–such as mutual funds, pension funds, and life insurance
companies–in Europe, whose assets tripled from 44% of GDP in 1985, to 122% of
GDP in 2004. Interestingly, they also document a parallel increase in regional bias, or
in the preference for euro stocks in detriment of stocks from other regions in the world.
Consistent with this evidence, Ferreira and Ferreira (2006) document an increase in
the relative importance of industry factors over country factors in euro markets over
the period 1999-2001.
Hardouvelis, Malliaropulos, and Priestley (2006, HMP henceforth) estimate the
conditional probability that the expected return on a member country stock market
is priced by a euro zone CAPM. They model this probability as a function of forward
interest rate differentials with Germany. They find evidence that the integration of
national stock markets in the Euro zone was already occurring in the second half of
the 1990s, as measured by an increase in the conditional probability over time that
parallels the reduction in forward rate differentials. Cappiello, Hördahl, Kadareja, and
Manganelli (2006, CHKM henceforth) also examine the empirical evidence on capital
markets integration using the Dynamic Conditional Correlation-GARCH model of
Engle (2002). They find that the cross-sectional average of conditional correlations
among euro capital markets increased over time during the period 1987-2005. They
find strong evidence of integration of government bond markets but, in contrast to
HMP, much weaker evidence of stock market integration.
This article also investigates if national stock markets in the euro area have become
more integrated after the introduction of the euro. Our analysis adds to the existing
evidence about stock market integration in two dimensions. First, we investigate
whether stocks in the euro zone have moved from a regime in which national stock
markets were priced with discount rates that were predominantly country specific, to
4

a regime in which national stock markets are predominantly priced by a EMU-wide
common discount rate. Second, our sample period extends through late 2008; thus
we consider almost nine years of existence of a common currency.
If expected stock excess returns are time varying, stock prices will move in re-
sponse to either news about cash flows, or news about discount rates (Campbell
1991). As capital markets become integrated, we should expect discount rates to
exhibit increased co-movement with a common EMU discount rate, while cash flows
may or may not exhibit increased common variation, since they will be subject not
only to common aggregate macroeconomic shocks, but also to regional, industry, and
company specific shocks. We test this hypothesis by adapting the beta decompo-
sition methodology of Campbell and Vuolteenaho (2004) and Campbell, Polk, and
Vuolteenaho (2010) to an examination of capital integration.
This article is structured as follows. Section 2 examines the role of the euro as
a reserve currency for conservative global investors. Section 3 examines the role of
the euro for global equity investors. Section 4 examines whether the euro has pro-
moted increased capital market integration among EMU members. Finally, Section
5 concludes.
2 The Euro As A Safe Currency
The conventional view on currencies states that holding foreign currencies is a risky
investment. This view is rooted in the perception that real exchange rates are volatile
and largely uncorrelated with the returns on other assets. In that case, investors
should optimally hedge all foreign currency exposure implicit in their internationally
diversified portfolios (Solnik, 1974). Indeed, Perold and Schulman (1988) and others
find that full hedging of currency exposure can substantially reduce the short-term
return volatility of internationally diversified portfolios of bonds and equities of US
investors. However, recent research in Finance has challenged this view on both
empirical and theoretical grounds.
A first challenge to the conventional view on currency hedge comes from examining
empirically whether ex-ante real interest rates are constant over time as Fama (1975)
famously asserted and, if they are not, whether currencies can play a role in helping
investors hedge against unfavorable changes in future real interest rates. Recent em-
5

pirical research has estimated that real interest rates have been subject to persistent
shocks since the 1970’s in the U.S., which has resulted in statistically and econom-
ically significant real interest rate variation (Campbell and Viceira 2001, Campbell,
Sunderan, and Viceira 2009). Inflation-indexed bonds, which several countries around
the world have been issuing during the last two decades, provide direct evidence that
ex-ante real interest rates move considerably over time (Campbell, Shiller, and Viceira
2009).
Time variation in real interest rates has important implications about what con-
stitutes the minimum risk asset or portfolio of assets across investment horizons. Real
interest rate risk makes investing in default-free short-term government bonds risky
at long horizons, as the future rates of reinvestment of these bonds are uncertain.4
Long-term investors can avoid this risk by investing instead in a portfolio of long-
dated inflation-indexed bonds matching the timing and horizon of their consumption
plans (Campbell and Viceira 2001, 2002, Brennan and Xia 2002, Campbell, Chan,
and Viceira 2003, Wachter 2003).
In the absence of inflation-indexed bonds available for investment, long-term
conservative investors will seek to replicate the payoffs on the optimal portfolio of
inflation-indexed bonds as best as they can out of existing assets available for invest-
ment. Campbell, Viceira, and White (2003) argue that currencies with historically
low volatile real interest rates might help investors in countries with volatile real in-
terest rates hedge real interest rate risk at home. Of course, this is only possible if
real exchange rate risk between the home currency and the foreign currency does not
overwhelm the lower real interest rate volatility of the foreign currency.
CVW explore this hypothesis using the long-term portfolio choice theory of Camp-
bell, Chan, and Viceira (2003, CCV henceforth). This theory is itself an empirical
implementation of Merton’s (1969, 1971, 1973) portfolio choice theory with time-
varying investment opportunities that assumes that the dynamics of asset returns
and the state variables driving variation in risk premia, real interest rates, and infla-
tion are described by a first-order vector autoregressive (VAR) structure. Under this
assumption, CCV derive the optimal dynamic portfolio and consumption rules of an
infinitely-lived investor with Epstein-Zin (1989, 1991) recursive preferences who lives
4These bonds can also be risky at short horizons when they are nominal, as it is typically the
case. As such they are subject to short-run inflation risk. While this riks is typically very small in
developed economies, it can be important in developing economies with highly volatile short-term
inflation.
6

off financial wealth. CCV show that the optimal portfolio rule is linear in the VAR
state vector.
Adapting CCV’s model to the case in which risk premia are constant and only
real interest rate varies over time, Campbell and Viceira (2002) show that the optimal
portfolio rule α takes the following form:
α =1
Σ−1(Ex+1 + σ22) +
µ1− 1
¶Σ−1σ1 +
µ1− 1
¶Σ−1σ (1)
In equation (1) denotes the coefficient of relative risk aversion, x+1 denotes thevector of log returns in excess of the short-term interest rate, Σ denotes the variance-
covariance matrix of excess returns, σ2 denotes the vector of excess-return variances,the main diagonal of Σ, and σ1 denotes the vector of covariances of each riskyasset’s excess return with the short-term interest rate. The vector σ contains the
covariances of each excess return with revisions in expectations of future real interest
rates:
σ ≡ Cov(x+1−(E+1 − E)∞X=1
1+1+) (2)
Equation (1) shows that the optimal portfolio rule for the long-term investor
has three components. The first two components describe an instantaneously mean-
variance efficient portfolio demand, common to both long-term and short-term in-
vestors. This demand includes a speculative component based on the expected excess
simple return on risky assets (or equivalently, expected excess log returns plus one-half
their variance), and a global minimum variance component based on the short-term
volatility of the optimal portfolio. Total short-term portfolio demand is a weighted
average of these two components, with weights given by 1–risk tolerance–and1− 1.The third component in (1) is specific to long-term investors. This is Merton’s
intertemporal hedging demand, which is proportional to 1 − 1. This demand
measures to what extent intertemporal considerations lead long-horizon investors to
optimally choose portfolios that deviate from the portfolios that are optimal for short-
term investors. In this particular case, long-term conservative investors with 1 optimally tilt their portfolios toward assets whose returns covary positively withdeclines in revisions of expected future real interest rates.
CVW use the CCV model to explore the role of currencies in helping investors
7

hedge real interest rate risk. They consider four currencies–the US dollar, the British
pound, the Japanese yen, and the euro and its predecessor the deutschemark–for
the period going from the first quarter of 1973 through the fourth quarter of 2001.
Specifically, they consider the problem of a long-term U.S. investor who is deciding
how to allocate his wealth between US dollars and one of the other three currencies–
i.e., between U.S. short-term government bonds and government bonds denominated
in one of the other three currencies–. For symmetry, they also consider the problem
of a long-term investor in each one of the other three currency areas who is deciding
how to allocate his wealth between his domestic currency and US dollars.
For each pairing of the US dollar with the other three currencies, CVW estimate
a VAR system that includes each currency’s ex post real interest rate and the real
exchange rate, both of which are assumed to follow stationary processes. The real
interest rate is the log three-month nominal short rate, less log realized inflation
over the period, measured by the log change in the CPI. The log real exchange rate
level is the log real foreign currency price of domestic currency, the sum of the log
nominal exchange rate and the log domestic CPI, less the log foreign CPI. This system
characterizes the dynamics of real interest rates and inflation for each currency pair.
The VAR estimates are then used to compute and compare the optimal portfolio of
the long-term US investor and the optimal portfolio of the long-term foreign investor.
This section develops an exercise similar to CVW, but taking the euro–and its
predecessor the deutschemark–instead of the US dollar as the anchor currency. Thus
we estimate three VAR systems, one that includes the US dollar and the euro, a second
one that includes the pound and the euro, and a third one that includes the yen and
the euro. The euro is always an investment in German short-term government bonds.
We also extend CVW’s sample period, bringing our sample period from the first
quarter of 1973 through the fourth quarter of 2005.
Table 1 reports optimal portfolio allocations to short-term bonds in each currency
pair for Epstein-Zin investors with relative risk aversion coefficients of 1, 5, and 2000,
and unit elasticity of intertemporal substitution.5 A value of 2000 for the coefficient
or relative risk aversion effectively captures the case of an infinitely risk averse long-
term investor. This investor seeks to minimize long-run risk regardless of expected
5Campbell and Viceira (1999) and Chacko and Viceira (2005) show that the optimal asset allo-
cation is relatively insensitive to the choice of value for the elasticity of intertemporal substitution.
We also set the subjective discount rate to 8% at an annual rate. The portfolio solutions are also
not highly sensitive to this assumption.
8

portfolio return. For comparison, the rightmost column of the table reports the
portfolio held by an infinitely risk averse investor with a short-term horizon. This is
the portfolio with minimum short-term variance.
The unit relative risk aversion investor allocates 50% of his portfolio to each
currency, regardless of his home currency area. This result is not driven by the
data, but rather from imposing that the expected log return on the domestic and
on the foreign currency are equal.6 We follow CVW in adopting this convention
because it allows us to focus on the demand for currencies driven by real interest rate
risk hedging considerations. As the investor becomes more risk averse, the optimal
allocation starts diverging from the 50-50 allocation towards the currency that the
investor perceives to be less risky at his investment horizon.
As risk aversion increases, long-term EMU investors place greater weight on the
euro, to the extent that highly risk averse long-term EMU investors are either fully
invested or overinvested in the euro regardless of which other currency they have avail-
able for investment. By contrast, long-term US investors, long-term British investors
and long-term Japanese investors decrease the allocation to their own currencies as
risk aversion increases, and accordingly increase their allocation to the euro. Highly
risk averse long-term investors all allocate more than 50% of their wealth to the euro
regardless of their home currency, with British investors allocating more than 75%
of their wealth. Clearly, these investors consider the euro to be a safe currency that
helps them hedge real interest risk at home. This is in sharp contrast with the op-
timal minimum-risk currency allocations for conservative short-term investors shown
in the rightmost column of Table 1. This column shows that conservative short-term
investors are always fully or almost fully invested in their home currency regardless
of their home currency.
Figure 1 provides intuition about why short-term conservative investors prefer
their home currency, but long-term conservative investors optimally allocate a highly
significant fraction of their savings to the euro. Each panel in Figure 1 shows the
annualized standard deviation of the real returns on the short-term bonds included
in each of the currency pairs at different horizons, ranging from 1 to 100 quarters.
The standard deviations are those implied by our estimated VAR models from the
6The unit relative risk aversion investor is fully invested in the instantaneous speculative portfolio,
which maximizes the average log portfolio return, The result that this portfolio places equal weight
on domestic and foreign currency when their expected log return are identical follows from the
relation between log portfolio return and log returns on individual assets. See Campbell and Viceira
(2002), equation (2.21).
9

perspective of a non-euro investor.
This figure shows that foreign investors see the euro as exhibiting considerably
more volatility than their own domestic currency at short horizons. For example,
the US dollar exhibits a 1-quarter standard deviation of about 1% per annum and
the euro exhibits a standard deviation of 12% p.a. from the perspective of a short-
term US investor. Of course, the larger variability of the euro reflects the short-term
volatility of the US dollar-euro exchange rate. This helps explain why a short-horizon
conservative US investor will choose to invest only in his home currency.
However, as the horizon increases the standard deviation of the euro declines
rapidly, while the standard deviation of each of the other currencies increase. In the
case of the British investor, the standard deviation of the euro even falls slightly below
the standard deviation of the pound at long horizons. At long horizons, fluctuations
in the real return on a euro investment appear to be as volatile or even less volatile
than fluctuations in domestic real interest rates in each of the other currencies, even
after accounting for real exchange rate long-run variability. Thus long-horizon conser-
vative investors do not view the euro as being much riskier than their home currency.
Instead, they view holding short-term bonds denominated in euros as not being riskier
than holding short-term bonds denominated in their own home currency.
Both Table 1 and Figure 1 are based on estimates from a sample period that
extends far back before the introduction of the euro. To isolate the effect of the
introduction of the euro, Figure 2 reproduces Figure 1 using VAR estimates based
on the sample period (1999.Q1-2005.Q4). The plots in this figure show that real
interest rate volatility has declined in all currencies in the latter period. However,
this reduction has been roughly proportional, making the euro still an attractive
currency to hold by US, Japanese, and British long-term conservative investors.
Figure 3 helps calibrate the magnitude of the reduction in real interest volatility
in the euro period. Similar to Figure 1 and Figure, each panel in Figure 3 plots the
annualized standard deviation of the real return on German short-term bonds from
the perspective of either a US investor, a British investor, or a Japanese investor.
Each panel in the figure plots the standard deviation generated by a VAR estimated
for the full sample period 1973-2005 (blue line), the pre-euro sample period 1973-
1998 (green line), and the post-euro sample period 1999-2005 (red line). Figure 3
shows that the introduction of the euro has coincided with a period of significant
decline in the long-term volatility of real interest rates and exchange rates in euro-
denominated short-term bonds, relative to the period that preceded the introduction
10

of the common currency. This decline has been most significant from the perspective
of British investors, although it is also important from the perspective of US investors.
If the euro has provided investors with a reserve currency in the sense that it
provides a vehicle for investors to hedge real interest rate risk around the world, a
natural question to ask is whether this has resulted in lower average real interest
rates in the EMU. In equilibrium, one might expect that investors who have a desire
to hold a currency will be willing to receive lower compensation from holding it. In
recent work, Hassan (2008) explores this question, and finds that excess returns to US
investors on EMU member bonds fell by 1.5 percentage points after the introduction
of the euro. The magnitude of this reduction is both economically and statistically
significant.
Hassan (2008) shows that, more generally, there appears to be a robust negative
relation between interest rate differentials with respect to the US and the economic
size of a currency area, as measured by its share of total O.E.C.D. output. In the
period 1980-2007, bonds from a currency with a 10% share of total O.E.C.D. output
returned to US investors between 2 and 3 percentage points less than bonds from a
currency area with a very small share of total output.
Of course, an interesting question is why in equilibrium larger economic areas enjoy
lower interest rates, and currency unions result in further reductions in interest rates
for participating countries. Hassan (2008) argues that consumption risk insurance is
the mechanism that explains this phenomenon. Larger economic areas represent a
larger share of global consumption of both tradable goods and non-tradable goods.
This means that adverse shocks to a large economic area are more likely to represent
an adverse shock to global consumption, against which risk averse investors around
the world want to protect themselves.
But the assets providing the hedge are precisely bonds from this area–as well
as stocks representing ownership of production of the area non-tradable goods. The
reason is that when the supply of non-tradable goods in a particular area experiments
an adverse shock, its currency tends to appreciate, as non-tradable goods become
relatively more expensive. This appreciation in turn results in positive returns for
the bonds issued in the area, thus making these bonds attractive assets to hold for
risk averse investors around the globe.
11
3 The Euro as a Reserve Currency for Aggressive
Investors
Section 2 has shown empirical evidence suggesting that the euro provides global in-
vestors with a stable currency that helps them hedge real interest rate risk–or rein-
vestment risk. Equation (1) shows that this is the risk which concerns conservative
long-term investors the most, as these investors avoid holding risky assets in their
portfolios.
By contrast, equation (1) shows that aggressive andmoderately risk averse investors–
whose risk tolerance (1) is non-zero–are willing to hold risky assets such as equitiesin their portfolios. For example, many investors, particularly institutional investors,
hold internationally diversified equity portfolios. These investors face the important
decision of deciding how much of the currency exposure implied by their portfolio
holdings they want to hedge.
An unhedged position in international equity corresponds to a long position in for-
eign currency equal to the equity holding. Investors can alter this position, enhancing
it or offsetting it, by taking simultaneous long or short positions in short-term bonds
denominated in the foreign currency.7 A fully hedged position corresponds to a zero
net position in foreign currency, which the investor achieves by effectively shorting
bonds in the foreign currency one-for-one with the currency position implicit in the
equity position, and using the proceeds to invest in bonds denominated in the in-
vestor’s home currency. This results in pure exposure to stock market risk from the
foreign currency area, with zero net exposure to the foreign currency. A fully hedged
currency position is equivalent to a zero net demand for the currency.
An unhedged foreign equity position is one in which the investor does not take any
positions in foreign and domestic bonds to offset the currency exposure implied by the
equity position. This is equivalent to having a net demand for the foreign currency
equal to the amount invested in the foreign stock. Of course, zero or full hedging are
not the only possible choices for investors. They may choose exposures, or net foreign
currency demands, along a continuum of values that include overhedging–effectively
holding a short net exposure to the currency–and underhedging.
7This can be done cheaply and efficiently through appropriate positions in forward currency
contracts.
12

CSV study optimal currency demand–or equivalently, optimal currency hedging–
from the perspective of an investor who is already invested in a portfolio of interna-
tional assets, and chooses the vector of currency exposures that minimizes the short-
term volatility of his overall portfolio. They label the resulting vector of optimal
risk-minimizing net currency demands as “risk management net currency demands.”
Formally, CSV estimate the second term Σ−1σ1 in equation (1) when the bench-mark asset 1 is an internationally diversified portfolio of equities or bonds, and the
choice variable is a vector of net currency demands. In that case, Σ−1σ1 takes theform
−Var (f+1)−1Cov¡+1 f+1
¢(3)
where +1 denotes the currency hedged log return on the portfolio of internationalrisky assets in excess of the investor’s domestic short-term nominal interest rate, and
f+1 denotes the vector of log excess currency returns.8
Equation (3) shows that the vector of risk management net currency demands is
proportional to the negative of the covariance between the returns on the assets held
in the portfolio (say, stocks) and exchange rates.
Risk management currency demands are positive when stock returns and exchange
rates are negatively correlated. To understand why risk management currency de-
mands are proportional to the negative of the correlation between stock returns and
exchange rates, note that a negative correlation implies that the domestic currency
tends to depreciate with respect to the foreign currency when stocks fall. Equivalently,
the returns from holding foreign currency tend to be positive when the returns from
holding stocks fall. Thus equity investors can reduce portfolio volatility by holding
positive net foreign currency positions or, equivalently, by underhedging the currency
exposure implied by their foreign equity positions.
If stock returns and exchange rates are uncorrelated, risk management currency
demand is zero. In this case, holding currency exposure adds volatility to investors
portfolios and, unless this volatility is compensated, investors are better off holding
no currency exposure at all or, equivalently, by engaging in full currency hedging.
8Note that the log excess return on currency is equal to
+1 = ∆+1 + −
where ∆+1 is the change in the log exchange rate, is the log short-term nominal interest rate
in currency c, and is the domestic counterpart of the latter.
13

If stock returns and exchange rates are positively correlated, investors can reduce
portfolio volatility by overhedging, that is, by shorting foreign currency in excess of
what would be required to fully hedge the currency exposure implicit in the stock
portfolio.
CSV estimate risk management net currency demands for investors holding both
an equally-weighted portfolio and a value-weighted portfolio of global stocks com-
prising the EMU area (or “Euroland”), plus Australia, Canada, Japan, Switzerland,
the UK, and the US. They also consider investors who are fully invested in each
of these markets individually. Their estimates consider the 30-year period between
July 1975 and December 2005, as well as the subsamples running from 1975 through
1989 (“Subsample I”), and from 1990 through 2005 (“Subsample II”). They define
Euroland as a value-weighted stock basket that includes Germany, France, Italy, and
the Netherlands; these are the EMU countries with the longest history of stock re-
turns, interest rates, and exchange rates available. Prior to the introduction of the
euro, they consider a basket of national currencies. Their results are robust to re-
stricting the study to include only the German stock market and the deustchemark
prior to the introduction of the euro.
Table 2, which reproduces Table IV in their paper, reports the vector of estimated
optimal risk management currency demands generated by the equally-weighted global
stock portfolio, for both the full sample and the two subsamples. Panel A considers the
case in which investors have access to all seven currencies from the countries included
in the portfolio. Panel B excludes Canada and Switzerland from the analysis, as the
currency and stock market of each are highly correlated with those in the US and
Euroland markets, respectively.9
The estimated optimal currency exposures reported in the table reflect the amounts
optimally invested in each currency per euro of exposure to the global equity portfo-
lio. By construction, these exposures add up to zero; that is, the optimal currency
portfolio is a zero net investment portfolio. These exposures can be easily restated in
terms of hedging demands by noting that zero net currency demand is equivalent to
fully hedging the currency position implied by the stock portfolio, which is invested
about 14% in the equities of each currency area.
9CSV show that the vector of optimal currency demands generated by a given global portfolio is
the same regardless of the currency base when investors from each currency have access to all other
currencies. Accordingly, the table reports only one set of currency demands, which add up to zero.
14

Panel A shows that the risk management currency portfolio includes statistically
and economically significant exposures to the euro and the Swiss franc in the full
sample, at 32% and 27% respectively. These are the largest long optimal risk man-
agement net currency demands after the optimal 40% exposure to the US dollar.
The 32% exposure to the euro means that, say, a British investor holding the equally
weighted global equity portfolio would optimally choose not to hedge his 14% expo-
sure to Euroland stock markets by shorting short-term Euroland government bonds
(say, German or French) worth 14 pounds per 100 pounds invested in the equity port-
folio; instead, he would buy euro bonds worth 18 pounds, for a total euro exposure
of 32 pounds per 100-pound equity investment. Additionally, the investor would also
hold long exposures of 27 pounds and 40 pounds to the Swiss franc and the US dollar
respectively. He would then finance the long euro, Swiss franc, and US dollar posi-
tions with the proceeds from short positions worth 11, 61, 17, and 11 pounds in the
Australian dollar, the Canadian dollar, the Japanese yen and the British pound itself.
Equivalently, the optimal risk management currency portfolio implies underhedging
the euro, Swiss franc, and US dollar exposures implied by the equally-weighted global
equity portfolio, and overhedging the exposures to all other four currencies.
The optimal risk management net currency demand for the euro increases dramat-
ically when we exclude the Swiss franc from the menu of currencies. Panel B shows
that in that case the net demand for euro increases to 56% and becomes statistically
significant at the 1% significance level, suggesting that the euro and the Swiss franc
are very close substitutes. Strikingly, Panel B also shows that the demand for the
euro becomes even stronger in the second subperiod, when at 79% is at least twice
as large as the demand estimated for the first subperiod. Figure 4, which reproduces
Figure 2 in CSV, provides visual intuition of what drives this result. This figure plots
the 3-month annualized return of the euro against an equally weighted basket of other
currencies, together with the currency-hedged excess global equity return. It shows
a markedly increase in the negative comovement of the euro with the global equity
portfolio in the second subsample.
Panel B in Table 2 also shows that the exclusion of the Canadian dollar from the
menu of currencies results in a very small and statistically insignificant demand for
the US dollar. Thus the optimal exposures to the US dollar and the Canadian dollar
are not independent of each other: It is a long-short US dollar-Canadian dollar what
helps global equity investors reduce portfolio risk. The subsample analysis in Table
2 also suggests a diminishing role of the dollar in the second subperiod as a currency
that helps investors hedge adverse movements in global equity markets.
15

The empirical analysis of risk management currency demands of CSV suggests
that the euro, together with the Swiss franc, and the US dollar, has become a re-
serve currency for global equity investors. By holding exposure to the euro, these
investors can reduce the volatility of their internationally diversified equity portfo-
lios, because the euro, like its close substitute the Swiss franc, and the US dollar,
tend to strengthen when global stock markets fall. CSV show that the reductions in
portfolio volatility that investors can achieve by following optimal risk management
currency exposure policies are important, both in economic and statistical terms, rel-
ative to conventional policies of either no hedging or fully hedging currency exposures.
These gains are particularly substantial for investors whose domestic currencies are
not reserve currencies. Currency movements during the financial crisis of 2008, when
reserve currencies have tended to strengthen against other currencies, have confirmed
the attractiveness of holding reserve currencies as hedges for equity investors.
4 The Euro and Capital Market Integration in the
EMU
Sections 2 and 3 have discussed empirical evidence suggesting that the adoption of the
euro has resulted in a reserve currency that benefits investors around the world. This
section explores whether the creation of the common currency has also resulted in
additional benefits for EMU investors, by promoting better risk sharing. Specifically,
we look for empirical evidence of an increasing importance of a euro-wide discount
factor pricing the national stock markets in the EMU area in the period subsequent
to the creation of the euro. If national stock markets are priced at the EMU level,
this would suggest improved integration of the national stock markets in the euro
zone.
Our empirical analysis starts from the asset return decomposition of Campbell
and Shiller (1988) and Campbell (1991). This decomposition writes unexpected stock
returns as a linear combination of revisions in expected future dividends (cash flow
news) and returns (discount rate news):
+1 − E +1 ≈ (E+1−E)∞X=0
4+1+ − (E+1−E)∞X=0
+1+
≡ +1 −+1 (4)
16

where denotes log (or continuously compounded) stock returns, denotes netpayouts (or cash flows) on the stock, 4 denotes the first-difference operator, and isa loglinearization constant equal to 1(1 + exp (− )), where (− ) is the averagelog dividend-price ratio. The stock return decomposition shown in equation (4) says
that stock returns respond positively to changes in investors’ expectations of future
cash flows, and negatively to changes in required discount rates.
In an integrated capital market, there is no reason to expect that cash flow news
will be highly correlated across stocks. Cash flow news reflects changes in dividend
policies and earnings, which in turn reflect the economic realities of individual firms
and sectors.
However, required returns are set by investors, not firms. An integrated capital
market is by definition one in which securities are priced by a common discount
factor. In the context of our empirical exercise, one should expect that as national
stock markets become more integrated, the returns of national stock markets will
exhibit increasing covariation, or beta, with EMU-wide discount rate news.
To test this hypothesis we adapt the CAPM beta decomposition of Campbell and
Vuolteenaho (2004) and Campbell, Polk, and Vuolteenaho (2010) to test for capital
market integration. The conditional CAPM beta of any asset with respect to the
market is given by
=Cov (+1 +1)
Var (+1) (5)
Simple substitution of the asset return decomposition (4) for the case = in the
numerator of (5) allows us to write the CAPM beta of any asset as
= +
where
≡Cov (+1+1)
Var (+1)(6)
and
≡Cov (+1−+1)
Var (+1) (7)
If stock markets have become more integrated with the adoption of the euro, we
should expect the discount rate news CAPM beta of national stock markets
to be larger after the adoption of the euro.
17

Following this intuition, we estimate sample counterparts of the total CAPM beta
(5), the cash flow beta (6) and the discount rate beta (7) for the pre-euro and post-
euro periods, and test whether those betas have changed significantly between both
periods. We expect discount rate betas (7) to have increased in the post-euro period.
Of course, the integration process might have been dynamic, occurring not at a single
date but rather during the years surrounding the adoption of the euro. In that case,
our tests will be biased against finding evidence of increased market integration.
Our estimates of betas are based on time series of monthly unexpected stock re-
turns, cash flow news and discount rates for each national stock market and for a
value-weighted basket of stock markets in the EMU area. Of course, the compo-
nents of stock returns are not directly observable, and must be estimated. Following
Campbell (1991) and Campbell and Mei (1993), we estimate a first-order vector au-
toregressive (VAR) system for each market, and use the estimates to obtain estimates
of unexpected stock returns, cash-flow news, and discount rate news.
The VAR system for each market includes the log return on the market in excess
of the local short-term interest rate, the log dividend-price ratio on the local mar-
ket, the local nominal short-term log interest rate, and the log real return on local
short-term government bonds–i.e., the ex-post local real interest rate. We estimate
a VAR system for each of the countries that joined the EMU, for the EMU-wide stock
market,10 and for several non-euro developed markets–specifically, Japan, Norway,
Sweden, Switzerland, the United Kingdom, and the United States. The source for
stock market returns and dividend price ratios is Morgan Stanley Capital Interna-
tional (MSCI). The source for exchange rates, short-term interest rates, and inflation
is the International Financial Statistics database published by the International Mon-
etary Fund. Our sample period extends from July 1975 through November 2008.
Table 3 reports the full sample, the pre-euro, and the post-euro estimates of the
total CAPM beta (5) of each market with respect to the EMU-wide stock market. The
last column in the table also reports the results from testing whether the pre- and post-
euro betas are statistically significant. The table shows an increase in the average beta
for euro-zone markets. However, this change is not uniform and it is not statistically
significant in most cases. Some markets like Austria or Belgium have experimented
large, statistically significant increases, but most other markets have experienced
10The VAR system for the EMU-wide stock market uses German nomimal interest rates and
inflation as proxies for the EMU area nominal interest rates and inflation. The EMU-wide stock
market returns are measured in deutschemarks in the pre-euro period.
18

only small increases or no increases at all–with one market, Ireland, experimenting
a decrease. The average beta for non-euro markets is only slightly larger in the
post-euro period, although this average hides large cross-sectional variation in both
directions.
The results shown in Table 3 might lead to conclude that there is little evidence
that the adoption of the euro is correlated with an increase in stock market integration
across EMU economies. However, we have noted that total beta reflects the covaria-
tion of stock returns with both aggregate cash-flow news and discount rate news. It
could well be the case that stock market integration has occurred simultaneously with
offsetting changes in the covariation of stock returns with aggregate cash flow news,
perhaps because of increased sector specialization of EMU economies. Accordingly,
one might want to isolate the discount rate news component of the aggregate EMU
stock market, and test whether national stock markets in the euro area have changed
their covariance with respect to aggregate discount rate news.
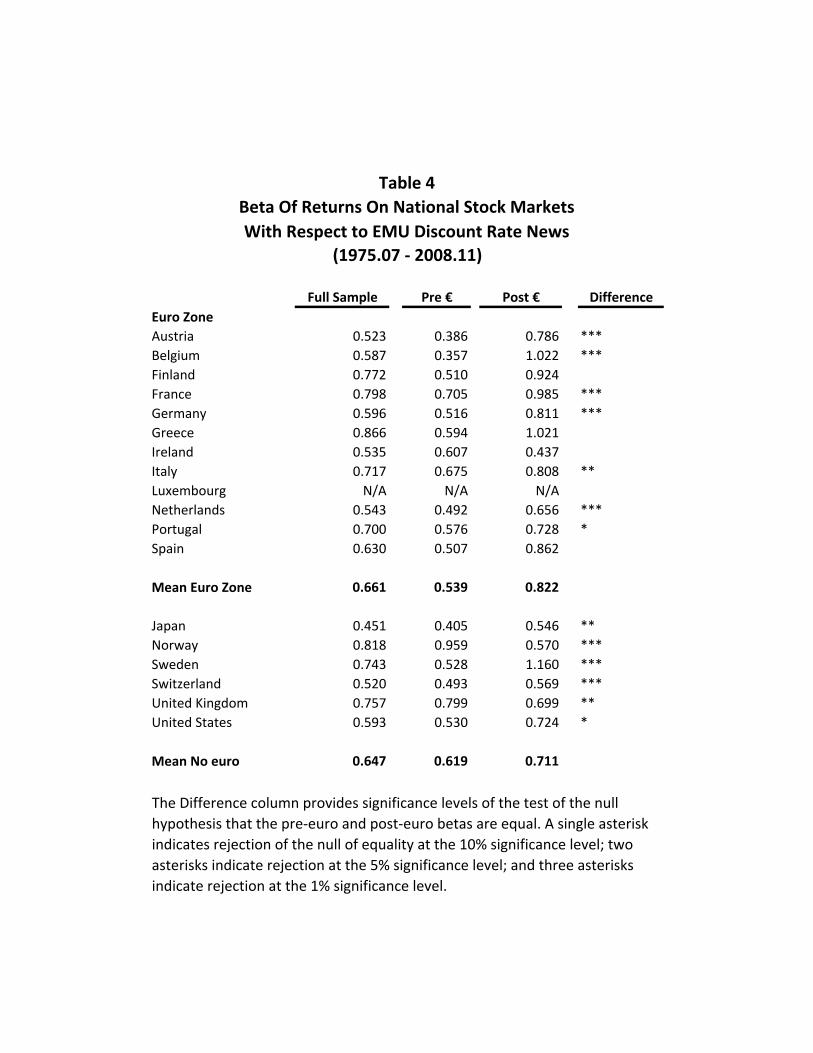
Table 4 shows the discount rate beta (7) of national stock markets with respect to
discount-rate news in the EMU-wide stock market. The results shown in this table
are remarkably different from those shown in Table 3. Table 4 shows that, except
for the Greek stock market, all post-euro betas in the euro zone are larger than the
pre-euro betas. This differences are economically large in most cases, and statistically
significant at the 1% level in five of the euro zone markets–and statistically significant
at the 10% level or lower in seven of the euro zone markets. The average discount
rate beta has increased from about 0.54 to 0.82.
The betas of non-euro zone markets also show statistically significant changes.
However, these changes go in all directions. The Swedish stock market has experi-
mented an economically and statistically significant increase in its discount rate beta
with respect to the EMU stock market, while other markets like the Norwegian stock
market and the U.K. stock market have seen their discount rate betas decrease sub-
stantially. The Swiss market has seen an economically small but statistically signifi-
cant increase in its discount rate beta. One possible interpretation of these results is
that some non-euro markets like the Swedish market have effectively become priced
at the euro level even though they are not part of the euro, perhaps through increased
economic integration with the euro area, while others have experimented a decline in
the importance of euro factors in their pricing.
Table 5 furthers this analysis by looking at the covariation of innovations to the log
dividend-price ratio of each national market with the innovations to the log dividend-
19

price ratio of the aggregate EMU-wide stock basket. This table uses the innovations to
the log dividend-price ratio as a direct measure of discount-rate news. Campbell, Lo,
and Mackinlay (1997) note that simple manipulation of the log linear decomposition
of log returns (4) implies that
− = −
1− − E
" ∞X=0
4+1+
#+ E
" ∞X=0
+1+
#
where ≡ − log()− (1− ) log(1− 1). If expected dividend growth is constant orapproximately constant (Cochrane 2007), the dividend-price ratio should be a direct
measure of expected future discount rates and its innovations a direct measure of
discount-rate news. In fact, the dividend-price ratio has been shown to be the most
successful forecasting variable for stock returns (Campbell and Shiller 1988, Fama
and French 1988, Campbell and Thompson 2008, Cochrane 2007). In fact, it is the
main predictor of stock returns in our estimated VAR systems.
Table 5 reports the regression coefficient that obtains from regressing shocks to the
log dividend-price ratio of each national stock market onto shocks to the log dividend-
price ratio of the EMU-wide stock basket. This table provides strong evidence of an
economically large increase in the covariation of national discount rate news in the
euro area with EMU-wide discount rate news. By contrast, there is not much evidence
of an increase in the covariation of discount rate news in non-euro stock markets with
EMU-wide discount rate news, with the exception of Sweden. These findings suggest
that the results shown in Table 4 are driven by increased covariation of discount rate
news in the euro area which has not happened outside the area. As such, they are
consistent with an interpretation that there has been increased integration of the
national stock markets in the euro area after the adoption of the euro.
5 Concluding Remarks
This article has examined whether the adoption of the euro has brought benefits to
investors around the world. We have provided new empirical evidence and summa-
rized recent empirical findings suggesting that the euro has become a reserve currency
for global investors, both conservative and risk tolerant. Our extension of the work
of Campbell, Viceira and White (2003) suggests that, in the absence of domestic
inflation-indexed bonds, the euro can help conservative long-term investors to hedge
20
real interest rate risk. While the optimal portfolios of short-term conservative in-
vestors remain heavily biased toward domestic short-term government bonds, the
optimal portfolios of long-term conservative investors allocate a significant fraction of
holdings to euro-denominated short-term government bonds. Long-term conservative
investors optimally invest in euros because their currency returns appear to be nega-
tively correlated with revisions in expected future real interest rates. Essentially, real
interest rates appear to be more stable in the euro area. At short-horizons, short-term
exchange rate volatility makes currency returns on the euro highly volatile relative
to returns on domestic short-term government bonds. However, this volatility ap-
pears to subside significantly at long horizons, making euro-denominated short-term
government bonds attractive assets to long-term conservative investors worlwide.
We have also summarized the recent findings in Campbell, Serfaty-de Medeiros,
and Viceira (2010) about the benefits of holding euros for global equity investors.
They show robust empirical evidence that excess currency returns on the euro exhibit
a negative correlation with global stock market returns. Global equity investors can
achieve statistical and economically significant reductions in the volatility of their
portfolios by not hedging their exposure to the euro.
We have also provided new empirical evidence about increased market integra-
tion of national stock markets in the EMU. Consistent with the intuition that an
integrated capital market is one in which there is a common discount factor pricing
securities, we have explored if stocks in the euro area have moved from a regime in
which national stock markets were priced with discount rates that were predominantly
country-specific, to a regime in which national stock markets are predominantly priced
by an euro-wide common discount rate. Our empirical examination of this question
builds on the CAPM beta decomposition of Campbell and Vuolteenaho (2004) and
Campbell, Polk, and Vuolteenaho (2010). We have provided evidence of increased
covariation of unexpected returns and revisions in expectations of discount rates of
national stock markets in the euro area with revisions in expectations of EMU-wide
discount rates. This evidence suggests improved capital market integration in the
euro zone, and consequently improved risk sharing among EMU economies.
Therefore, the evidence suggests that the adoption of the euro has benefited in-
vestors around the world, by providing them with a reserve currency. Investors in
the countries that joined the euro have also benefited from increased capital market
integration of their national stock markets, thus improving risk sharing in the euro
zone.
21

6 References
Adler, M. and B. Dumas (1983), “International portfolio choice and corporation
finance: A synthesis,” Journal of Finance, vol. 38 (3), pp. 925-984.
Brennan, M.J. and Y. Xia (2002), “Dynamic asset allocation under inflation,” Jour-
nal of Finance, vol. 57 (3) pp. 1201-1238.
Brunnermeier, M., S. Nagel and L. Pedersen (2009),“Carry Trades and Currency
Crashes,” NBER Macroeconomics Annual, vol. 23, pp. 313-348.
Burnside, C., M. Eichenbaum and S. Rebelo (2007), “The returns to currency spec-
ulation in emerging markets,” The American Economic Review, vol. 97 (2),
pp.333-338.
Campbell, J. Y. (1991), “A Variance Decomposition for Stock Returns,” The Eco-
nomic Journal, vol. 101 (405), pp. 157-179.
Campbell, J. Y., Y. Chan and L. M. Viceira (2003), “A multivariate model of strate-
gic asset allocation,” Journal of Financial Economics, vol. 67 (1), pp. 41-80.
Campbell, J. Y., A. Lo, and A. MacKinlay (1997), The Econometrics of Financial
Markets, Princeton University Press, Princeton, NJ.
Campbell, J. and J. Mei (1993), “Where Do Betas Come From? Asset Price Dy-
namics and the Sources of Systematic Risk,” Review of Financial Studies, vol.
6 (3), pp. 567-592.
Campbell, J. Y., C. Polk and T. Vuolteenaho (2010), “Growth or Glamour? Fun-
damentals and Systematic Risk in Stock Returns,”Review of Financial Studies,
vol. 23, pp. 305-344.
Campbell, J. Y., K. Serfaty-de Medeiros and L. M. Viceira (2010), “Global Currency
Hedging,”Journal of Finance, vol. 65(1), pp.87-121.
Campbell, J. Y. and R. Shiller (1988), “Stock Prices, Earnings, and Expected Divi-
dends,” Journal of Finance, vol.43 (3), pp. 661-676.
Campbell, J. Y., R. Shiller and L. M. Viceira (2009), “Understanding Inflation-
Indexed Bond Markets,” Brookings Papers on Economic Activity 79-120, Spring
2009.
22

Campbell, J. Y., A. Sunderan and L. M. Viceira (2009),“Inflation Bets or Defaltion
Hedges? The Changing Risks of Nominal Bolds,” NBER Working Paper no.
14701, February 2009.
Campbell, J. Y. and S. Thompson (2008), “Predicting the Equity Premium out
of sample: Can Anything Beat the Historical Average?,” Review of Financial
Studies 21:1509-1531.
Campbell, J. Y. and L. M. Viceira (1999), “Consumption and portfolio decisions
when expected returns are time varying,” Quarterly Journal of Economics, vol.
114, pp. 433-495.
Campbell, J. Y. and L. M. Viceira (2001),“Who should buy long-term bonds?,”
American Economic Review, vol. 91, pp. 99-127.
Campbell, J. Y. and L. M. Viceira (2002), Strategic Asset Allocation: Portfolio
Choice for Long-Term Investors, Oxford University Press, Oxford.
Campbell, J. Y. and L. M. Viceira (2005), “The Term Structure of the Risk: Return
Trade-Off,” Financial Analysts Journal, vol. 61 (1), pp. 34-44.
Campbell, J. Y. , L. M. Viceira and J. White (2003), “Foreign Currency for Long-
Term Investors,” The Economic Journal, Vo. 113 (486), pp. 1-25.
Campbell, J. Y. and T. Vuolteenaho (2004), “Bad Beta, Good Beta,” American
Economic Review, vol. 94 (5), pp. 1249-1275.
Cappiello, L., P. Hördahl, A. Kadareja and S. Manganelli (2006), “The impact of
the euro on financial markets,” ECB Working Paper n.598.
Chacko, G. and L. M. Viceira (2005),“Dynamic Consumption and Portfolio Choice
with Stochastic Volatility in Incomplete Markets” Review of Financial Studies,
vol. 18 (4), pp. 1369-1402.
Cochrane, J. (2007), “The Dog That Did Not Bark: A Defense of Return Predictabil-
ity,” Review of Financial Studies, vol. 21(4), pp. 1533-1575.
Engel, C. (1996), “The Forward Discount Anomaly and the Risk Premium: A Survey
of Recent Evidence,” Journal of Empirical Finance, vol. 3 (2), pp. 123-192.
23

Engle, R. (2002), “Dynamic Conditional Correlation: A Simple Class of Multivariate
Generalized Autoregressive Conditional Heteroskedasticity Models,” Journal of
Business & Economic Statistics, vol. 20 (3), pp. 339-350.
Epstein, L. and S. Zin (1989), “Substitution, risk aversion, and the temporal behav-
ior of consumption and asset returns: a theoretical framework,” Econometrica,
vol. 57, pp. 937-969.
Epstein, L. and S. Zin (1991), “Substitution, risk aversion, and the temporal behav-
ior of consumption and asset returns: an empirical investigation,” Journal of
Political Economy, vol. 99, pp. 263-286.
Fama, E. (1975), “Short-Term Interest Rates as Predictors of Inflation,” American
Economic Review, vol. 65, pp. 269-282.
Fama, E. (1984), “The information in the term structure,” Journal of Financial
Economics, vol. 13, pp. 509-528.
Fama, E. and K. French (1988), “Dividend Yields and Expected Stock Returns,”
Journal of Financial Economics, vol. 22, pp. 3-25.
Ferreira, M.A. and M.A. Ferreira (2006), “The Importance of Industry and Country
Effects in the EMU Equity Markets,” European Financial Management, vol. 12
(3), pp. 341-373.
Hansen, L. and R. Hodrick (1980),“Forward Exchange Rates as Optimal Predictors
of Future Spot Rates: An Econometric Analysis,” Journal of Political Economy,
vol. 88(5), pp. 829-853.
Hardouvelis, G., D. Malliaropulos and R. Priestley (2006), “EMU and European
Stock Market Integration,” Journal of Business, vol. 79 (1), pp. 365-392.
Hassan, T. (2008),“Country Size, Currency Unions, and International Asset Re-
turns,” unpublished manuscript, Harvard University.
Hodrick, R. (1987), The Empirical Evidence on the Efficiency of Forward and Futures
Foreign Exchange Markets, Harwood Academic Publishers.
Merton, R. (1969),“Lifetime portfolio selection under uncertainty: the continuous
time case,” Review of Economics and Statistics, vol. 51, pp. 247-257.
24

Merton, R. (1971), “Optimum consumption and portfolio rules in a continuous-time
model,” Journal of Economic Theory, vol. 3, pp. 373-413.
Merton, R. (1973), “An Intertemporal Capital Asset Pricing Model,” Econometrica,
vol 41, pp. 867-887.
Perold, A. and E. Schulman (1988), “The free lunch in currency hedging: Impli-
cations for investment policy and performance standards,” Financial Analysts
Journal, vol. 44 (3), pp.45-50.
de Santis, R. and B. Gerard (2006), “Financial Integration, International Portfolio
Choice and the European Monetary Union,” ECB Working Paper No. 626.
Schoenmaker, D. and T. Bosch (2008), “Is the Home Bias in Equities and Bonds
Declining in Europe?,” Investment Management and Financial Innovations, vol.
5(4), pp. 90-102.
Solnik, B. (1974), “An equilibrium model of the interantional capital market,” Jour-
nal of Economic Theory, vol. 8, pp. 500-524.
Wachter, J. (2003), “Risk Aversion and Allocation to Long-Term Bonds,” Journal
of Economic Theory, vol. 112, pp. 325-333.
25

Currency Min ST
1 5 2000 VarianceDomestic: US Dollar 50.0 41.2 35.1 98.8
Euro 50.0 58.8 64.9 1.2
Domestic: Euro Euro 50.0 88.5 111.3 100.6
Dollar 50.0 11.5 ‐11.3 ‐0.6
Domestic: UK Pound 50.0 30.0 23.4 97.3
Euro 50.0 70.0 76.6 2.7
Domestic: Euro Euro 50.0 95.8 110.9 100.2
Pound 50.0 4.2 ‐10.9 ‐0.2
Domestic: Japan Yen 50.0 49.9 47.5 98.2
Euro 50.0 50.1 52.5 1.8
Domestic: Euro Euro 50.0 88.3 111.2 101.3
Yen 50.0 11.7 ‐11.2 ‐1.3
This table reports optimal portfolio allocations to short‐term bonds in each currency pair for
Epstein‐Zin investors. The allocations are based on VAR estimates for the period 1973.Q1‐
2005.Q4. The VAR includes the real interest rate for each currency included in the pair, and
the real exchange rate between the two currencies. The allocations impose equality of the
expected log return on the currencies in the pair.
Optimal Currency Allocation
Table 1
Relative Risk Aversion

Euroland Australia Canada Japan Switzerland U.K. U.S.
Full period 0.32* -0.11 -0.61*** -0.17* 0.27* -0.10 0.40**
(0.17) (0.09) (0.16) (0.09) (0.15) (0.11) (0.18)
Subperiod I 0.14 -0.05 -0.63** -0.20 0.22 -0.09 0.62*
(0.21) (0.12) (0.26) (0.14) (0.18) (0.15) (0.35)
Subperiod II 0.44 -0.17 -0.65*** -0.08 0.37 -0.12 0.22
(0.28) (0.14) (0.21) (0.10) (0.23) (0.14) (0.19)
Full period 0.56*** -0.27*** -0.14* -0.09 -0.06
(0.11) (0.10) (0.08) (0.11) (0.14)
Subperiod I 0.35** -0.15 -0.15 -0.10 0.05
(0.17) (0.11) (0.11) (0.15) (0.20)
Subperiod II 0.79*** -0.47*** -0.06 -0.11 -0.15
(0.13) (0.12) (0.11) (0.13) (0.17)
Panel B : 5 country optimization
Table 2 Optimal Currency Exposure for an Equally Weighted Global Equity Portfolio:
Multiple Currency Case
Source: Campbell, Serfaty-de Medeiros, and Viceira (2010). This table considers an investor holding a portfolio composed of stocks from all countries, with equal weights, who chooses a vector of positionsin all available foreign currencies to minimize the variance of his portfolio. In this case, the optimalcurrency positions do not depend on the investor's base country. Panel A considers a case where allseven currencies are available, whereas Panel B excludes the Canadian dollar and the Swiss franc.Within each panel, rows indicate the time period over which the optimization is computed, columnsthe currencies used to manage risk. The full period runs from 1975 to 2005, the first subperiod coversthe years 1975 through 1989, and the second subperiod covers the rest of the sample. Reportedcurrency positions are the amount of dollars invested in foreign currency per dollar in the portfolio. Werun monthly regressions on overlapping three-month returns. Standard errors are corrected forautocorrelation due to overlapping intervals using the Newey-West procedure.
Time PeriodCurrency
Panel A : 7 country optimization

Full Sample Pre € Post € Difference
Euro Zone
Austria 0.861 0.772 1.036 **
Belgium 0.956 0.827 1.200 ***
Finland 1.089 0.869 1.189
France 1.074 1.072 1.085
Germany 0.993 1.005 1.017 ***
Greece 0.730 0.542 0.945
Ireland 0.765 0.870 0.621
Italy 0.901 0.863 0.982
Luxembourg N/A N/A N/A
Netherlands 0.843 0.860 0.826 ***
Portugal 0.721 0.629 0.711
Spain 0.916 0.859 1.018
Mean Euro Zone 0.895 0.833 0.967
Japan 0.387 0.472 0.582
Norway 0.949 1.005 0.873
Sweden 1.028 0.833 1.405 ***
Switzerland 0.836 0.913 0.688 ***
United Kingdom 0.993 1.090 0.835 ***
United States 0.578 0.508 0.720 ***
Mean No euro 0.795 0.804 0.851
CAPM Beta with Respect to EMU Basket(1975.07 ‐ 2008.11)
Table 3
The Difference column provides significance levels of the test of the null
hypothesis that the pre‐euro and post‐euro betas are equal. A single asterisk
indicates rejection of the null of equality at the 10% significance level; two
asterisks indicate rejection at the 5% significance level; and three asterisks
indicate rejection at the 1% significance level.
Full Sample Pre € Post € Difference
Euro Zone
Austria 0.523 0.386 0.786 ***
Belgium 0.587 0.357 1.022 ***
Finland 0.772 0.510 0.924
France 0.798 0.705 0.985 ***
Germany 0.596 0.516 0.811 ***
Greece 0.866 0.594 1.021
Ireland 0.535 0.607 0.437
Italy 0.717 0.675 0.808 **
Luxembourg N/A N/A N/A
Netherlands 0.543 0.492 0.656 ***
Portugal 0.700 0.576 0.728 *
Spain 0.630 0.507 0.862
Mean Euro Zone 0.661 0.539 0.822
Japan 0.451 0.405 0.546 **
Norway 0.818 0.959 0.570 ***
Sweden 0.743 0.528 1.160 ***
Switzerland 0.520 0.493 0.569 ***
United Kingdom 0.757 0.799 0.699 **
United States 0.593 0.530 0.724 *
Mean No euro 0.647 0.619 0.711
The Difference column provides significance levels of the test of the null
hypothesis that the pre‐euro and post‐euro betas are equal. A single asterisk
indicates rejection of the null of equality at the 10% significance level; two
asterisks indicate rejection at the 5% significance level; and three asterisks
indicate rejection at the 1% significance level.
Table 4
Beta Of Returns On National Stock Markets
With Respect to EMU Discount Rate News
(1975.07 ‐ 2008.11)

Full Sample Pre € Post € Difference
Euro Zone
Austria 0.356 0.197 0.853 ***
Belgium 1.471 1.257 2.156 ***
Finland 0.913 0.734 1.119 **
France 1.002 0.932 1.243 **
Germany 0.846 0.767 1.299 ***
Greece 0.248 ‐0.126 0.618
Ireland 0.334 0.010 0.739 ***
Italy 0.747 0.541 1.392 ***
Luxembourg N/A N/A N/A
Netherlands 1.177 1.142 1.342
Portugal 0.274 0.065 0.442
Spain 0.827 0.748 1.060
Mean Euro Zone 0.745 0.570 1.115
Japan 0.152 0.166 0.103
Norway 0.724 0.665 0.986 *
Sweden 0.756 0.609 1.237 ***
Switzerland 0.389 0.416 0.308
United Kingdom 1.172 1.255 0.939 ***
United States 0.525 0.558 0.438
Mean No euro 0.620 0.612 0.669
Beta Of Discount Rate News On National Markets
With Respect to EMU‐Wide Discount Rate News
(Proxied by D/P Ratio, 1975.07 ‐ 2008.11)
The Difference column provides significance levels of the test of the null
hypothesis that the pre‐euro and post‐euro betas are equal. A single asterisk
indicates rejection of the null of equality at the 10% significance level; two
asterisks indicate rejection at the 5% significance level; and three asterisks
indicate rejection at the 1% significance level.
Table 5

Figure 1. Real Interest Rate Risk Across Investment Horizons (1973.Q1‐2005.Q4)
0 20 40 60 80 1000
0.05
0.1
0.15
0.2
holding period, k, in quarters
ann
std
dev
of k
-per
iod
retu
rn
Domestic:US Foreign:Euro
short bondforeign short bond
0.05
0.1
0.15
0.2
std
dev
of k
-per
iod
retu
rn
Domestic:UK Foreign:Euro
short bondforeign short bond
Each panel in this figure reports annualized standard deviation of returns on
domestic and euro‐denominated short‐term bonds at different horizons.
Estimates implied by VAR (1) of domestic ex‐post real interest rate, euro ex‐
post real interest rate, and real exchange rate with respect to the euro for the
period 1973.Q1‐2005.Q4.
0 20 40 60 80 1000
0.05
0.1
0.15
0.2
holding period, k, in quarters
ann
std
dev
of k
-per
iod
retu
rn
Domestic:US Foreign:Euro
short bondforeign short bond
0 20 40 60 80 1000
0.05
0.1
0.15
0.2
holding period, k, in quarters
ann
std
dev
of k
-per
iod
retu
rn
Domestic:UK Foreign:Euro
short bondforeign short bond
0 20 40 60 80 1000
0.05
0.1
0.15
0.2
holding period, k, in quarters
ann
std
dev
of k
-per
iod
retu
rn
Domestic:Japan Foreign:Euro
short bondforeign short bond

Figure 2. Real Interest Rate Risk Across Investment Horizons (1999.Q1‐2005.Q4)
0 20 40 60 80 1000
0.05
0.1
0.15
0.2
holding period, k, in quarters
ann
std
dev
of k
-per
iod
retu
rn
Domestic:US Foreign:Euro
short bondforeign short bond
0.05
0.1
0.15
0.2
std
dev
of k
-per
iod
retu
rn
Domestic:UK Foreign:Euro
short bondforeign short bond
Each panel in this figure reports annualized standard deviation of returns on
domestic and euro‐denominated short‐term bonds at different horizons.
Estimates implied by VAR (1) of domestic ex‐post real interest rate, euro ex‐
post real interest rate, and real exchange rate with respect to the euro for the
period 1999.Q1‐2005.Q4.
0 20 40 60 80 1000
0.05
0.1
0.15
0.2
holding period, k, in quarters
ann
std
dev
of k
-per
iod
retu
rn
Domestic:US Foreign:Euro
short bondforeign short bond
0 20 40 60 80 1000
0.05
0.1
0.15
0.2
holding period, k, in quarters
ann
std
dev
of k
-per
iod
retu
rn
Domestic:UK Foreign:Euro
short bondforeign short bond
0 20 40 60 80 1000
0.05
0.1
0.15
0.2
holding period, k, in quarters
ann
std
dev
of k
-per
iod
retu
rn
Domestic:Japan Foreign:Euro
short bondforeign short bond

Figure 3. Real Interest Rate Risk Across Investment Horizons
0 20 40 60 80 1000
0.05
0.1
0.15
0.2
holding period, k, in quarters
ann
std
dev
of k
-per
iod
retu
rn
Domestic:US Foreign:Euro
1973-20051973-19981999-2005
0.05
0.1
0.15
0.2
std
dev
of k
-per
iod
retu
rn
Domestic:UK Foreign:Euro
1973-20051973-19981999-2005
Each panel in this figure reports annualized standard deviation of returns on
euro‐denominated short‐term bonds at different horizons. Estimates implied
by VAR (1) of domestic ex‐post real interest rate, euro ex‐post real interest
rate, and real exchange rate with respect to the euro for three different
periods.
0 20 40 60 80 1000
0.05
0.1
0.15
0.2
holding period, k, in quarters
ann
std
dev
of k
-per
iod
retu
rn
Domestic:US Foreign:Euro
1973-20051973-19981999-2005
0 20 40 60 80 1000
0.05
0.1
0.15
0.2
holding period, k, in quarters
ann
std
dev
of k
-per
iod
retu
rn
Domestic:UK Foreign:Euro
1973-20051973-19981999-2005
0 20 40 60 80 1000
0.05
0.1
0.15
0.2
holding period, k, in quarters
ann
std
dev
of k
-per
iod
retu
rn
Domestic:Japan Foreign:Euro
1973-20051973-19981999-2005

Figure 4. Excess Returns on the Euro
and the Hedged World Stock Market Portfolio
50
-50
0
50
-150
-100
-50
0
50
1975m1 1980m1 1985m1 1990m1 1995m1 2000m1 2005m1date
Source: Campbell, Serfaty‐de‐Medeiros, and Viceira (2010).
-150
-100
-50
0
50
1975m1 1980m1 1985m1 1990m1 1995m1 2000m1 2005m1date
euro World stock market