The EU Economy 2001 Review. Chapter 5. Reforms of pension ...
52
REFORMS OF PENSION SYSTEMS IN THE EU : AN ANALYSIS OF THE POLICY OPTIONS - 171 - CHAPTER 5 REFORMS OF PENSION SYSTEMS IN THE EU - AN ANALYSIS OF THE POLICY OPTIONS -
Transcript of The EU Economy 2001 Review. Chapter 5. Reforms of pension ...

REFORMS OF PENSION SYSTEMS IN THE EU : AN ANALYSIS OF THE POLICY OPTIONS
- 171 -
CHAPTER 5
REFORMS OF PENSION SYSTEMS IN THE EU
- AN ANALYSIS OF THE POLICY OPTIONS -
REFORMS OF PENSION SYSTEMS IN THE EU : AN ANALYSIS OF THE POLICY OPTIONS
- 172 -
TABLE OF CONTENTS
1. INTRODUCTION..........................................................................................................174
2. CHALLENGES FOR PENSION REFORM ........................................................................174
3. ADVANTAGES AND DISADVANTAGES OF PARAMETRIC AND
SYSTEMIC REFORMS ...................................................................................................177
3.1 Parametric reforms............................................................................................................................177
3.2 Systemic reforms................................................................................................................................182
3.3 Arguments for a more funded and more diversified pension system.......................................188
4. EMPIRICAL ASSESSMENT OF SELECTED PENSION REFORM OPTIONS ........................189
4.1 Ageing model : description of baseline growth and pension expenditure scenariofor 2000-50 .........................................................................................................................................190
4.2 Assessment of the economic and budgetary impact of the labour market and pensiongenerosity assumptions underpinning the recent pension expenditure projections of theEU’s Economic Policy Committee (EPC) ....................................................................................192
4.3 Empirical assessment of individual pension reform options using the ageing model............196
5. SUMMARY AND CONCLUSIONS ....................................................................................213
6. REFERENCES ..............................................................................................................216
ANNEX : OVERVIEW OF KEY FEATURES OF AGEING MODEL ............................................. 220

REFORMS OF PENSION SYSTEMS IN THE EU : AN ANALYSIS OF THE POLICY OPTIONS
- 173 -
TABLES
1. Main indicators of pension reform challenges..............................................................................175
2. The ratio of direct taxes to gross benefit spending in 1997........................................................180
3. Overview of taxation arrangements of occupational pensions ..................................................180
4. Average annual real returns on capital and real wage growth in selected countries1971-90................................................................................................................................................186
5. Baseline scenario................................................................................................................................191
6. “EPC” scenario..................................................................................................................................195
7. Cut in pension generosity.................................................................................................................198
8. Increase in effective retirement age to 65......................................................................................199
9. Broad based parametric reforms (“EPC” scenario + increase in retirement age) ..................201
10. Systemic reforms : mixed systems ..................................................................................................210
GRAPHS
1. Baseline scenario 2000-50 ................................................................................................................192
2. EPC pension projections 2000-50 ..................................................................................................193
3. Pension expenditure impact of ageing in EU-15 (2000-50) .......................................................194
4. GDP impact of ageing in EU (2000-50)........................................................................................195
5. Cut in pension generosity.................................................................................................................197
6. Retirement scenario – increase in the effective retirement age to the statutory level of 65 ..200
7. Stabilising the PAYG pension system through a broad package of parametric reforms.......201
8. Internal rate of return (IRR) of PAYG and funded systems......................................................203
9. Change in transition burden: 2000-50 (baseline scenario) ..........................................................203
10. Transition burden (impact of broad package of parametric reforms) ......................................205
11. Immediate switch to fully funded system in 2000 + transition burden....................................206
12. Preferred pension reform scenario : PAYG in equilibrum + 25% funding ............................212
REFORMS OF PENSION SYSTEMS IN THE EU : AN ANALYSIS OF THE POLICY OPTIONS
- 174 -
1. INTRODUCTION
There is widespread consensus on the extent of the ageing problem in Europe, which is a result of thebaby-boom in the early post-war period, the subsequent fall in fertility rates from the end of the 1960s andincreasing life expectancy. This will begin to affect public finances significantly as the baby-boomgeneration reaches retirement age over the next few decades. The impact of these developments on publicfinances and pension systems is a particular issue of concern and debate in all Member States, but theeffects of ageing will be far more widespread in the economy and society generally. Ageing will posechallenges for budgetary, labour and financial market policies as well as for overall economic performance.The need for a comprehensive reform strategy to cope with all these challenges is largely acknowledged.
Ageing and pension systems are high on the political agenda in the EU. In particular, the EuropeanCouncil in Santa Maria da Feira in June 2000 stressed that “particular attention should be given to thesustainability of pension schemes through defining two action lines aimed at improving forecasting of future trends and atobtaining in-depth knowledge of recent, actual and expected national pension reform strategies”. All the subsequentEuropean Council meetings have addressed the ageing problem with regard to the issues of thesustainability of pension systems and public finances as well as the future evolution of social protection.The Commission has provided to the Council a progress report on the impact of ageing populations onpublic pension systems as well as Communications on how Member States should report on their reformstrategies in the field of pensions.
This chapter aims to address issues related to reforming current pension systems. It focuses, in particular,on the policy choices within the pension system itself. First, it discusses in broad terms the advantages anddisadvantages of the various reform options. A basic distinction is made between parametric and systemicreforms, in other words, whether the reforms are undertaken within the existing pension systems orwhether they involve a switch from a current system to a new one. The relative merits of these optionsregarding a number of issues and challenges facing pension systems and the ageing problem are discussed.Second, it presents some empirical simulations of selected reforms, which further illustrate the effects ofreform options. These simulations focus on the effects on some key economic variables, namely,economic growth, the sustainability of public finances and the income distribution between the working-age population and pensioners.
The remainder of this chapter is structured as follows. Section 2 outlines the challenges for future pensionreforms, generally. Section 3 provides a review of parametric and systemic reforms with reference to theadvantages and disadvantages related to public and private pension schemes. Section 4 presents the resultsof some empirical estimations of the likely effects of the selected policy choices. Section 5 draws the keyconclusions to be retained from the analysis.
2. CHALLENGES FOR PENSION REFORM
Awareness of the problems associated with demographic developments and the current pension systemshas been growing in the EU. Member States have already launched reform processes in order to meetthese challenges. The main driving force for reforms undertaken until now has been the fiscalconsolidation, which has also led to major changes in policies affecting the structure of retirement incomefinancing through the promotion of private pension schemes and improving the operation of financialmarkets. Another pronounced direction of reforms is that the policy tide has clearly shifted as regards thetransition from work to retirement. Unambiguously, the policy is now to encourage a later and more
REFORMS OF PENSION SYSTEMS IN THE EU : AN ANALYSIS OF THE POLICY OPTIONS
- 175 -
gradual transition. In particular, reforms have been introduced which aim to support the employability ofolder workers and to respond to the future health and long-term care needs of old people.1
Despite the efforts made to reform pension systems, there is little evidence yet of a firm trend towardslater and more flexible retirement. Many countries also face problems of over-use of invalidity anddisability pensions and alternative pathways to retirement. Meanwhile, the time spent in retirement is stillincreasing due to growing life expectancy.
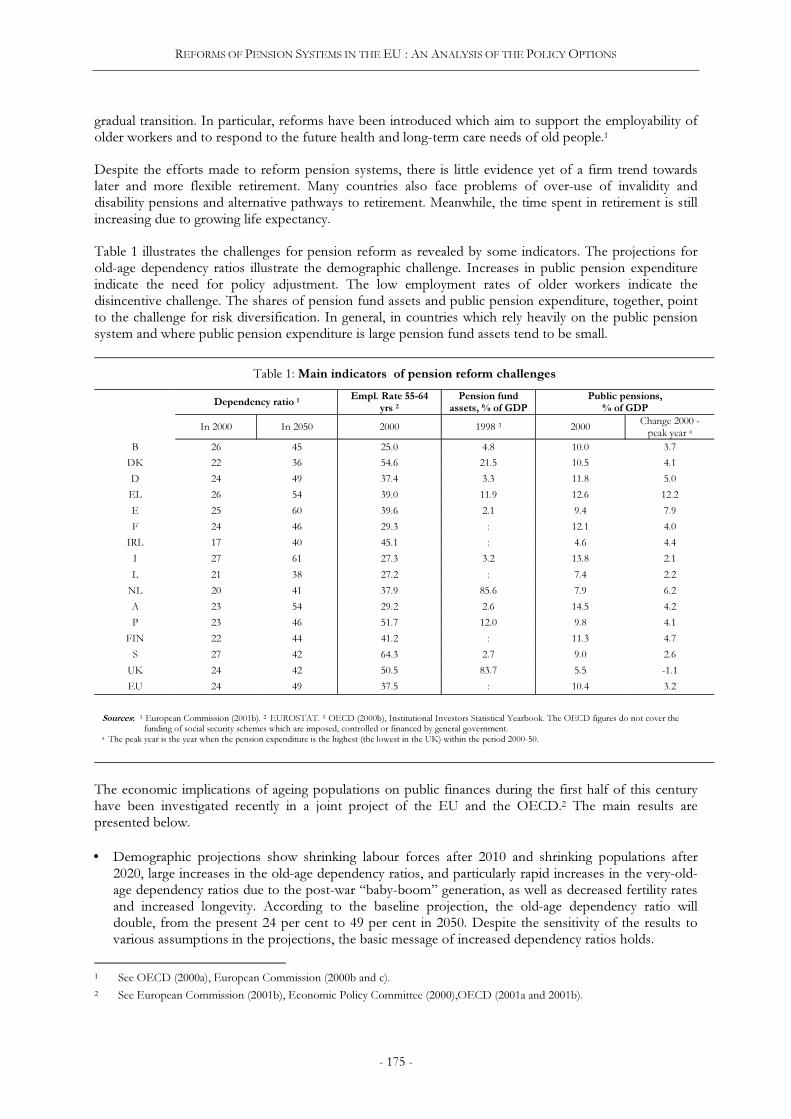
Table 1 illustrates the challenges for pension reform as revealed by some indicators. The projections forold-age dependency ratios illustrate the demographic challenge. Increases in public pension expenditureindicate the need for policy adjustment. The low employment rates of older workers indicate thedisincentive challenge. The shares of pension fund assets and public pension expenditure, together, pointto the challenge for risk diversification. In general, in countries which rely heavily on the public pensionsystem and where public pension expenditure is large pension fund assets tend to be small.
Table 1: Main indicators of pension reform challenges
Dependency ratio 1Empl. Rate 55-64
yrs 2Pension fund
assets, % of GDP
Public pensions,
% of GDP
In 2000 In 2050 2000 1998 3 2000Change 2000 -peak year a
B 26 45 25.0 4.8 10.0 3.7
DK 22 36 54.6 21.5 10.5 4.1
D 24 49 37.4 3.3 11.8 5.0
EL 26 54 39.0 11.9 12.6 12.2
E 25 60 39.6 2.1 9.4 7.9
F 24 46 29.3 : 12.1 4.0
IRL 17 40 45.1 : 4.6 4.4
I 27 61 27.3 3.2 13.8 2.1
L 21 38 27.2 : 7.4 2.2
NL 20 41 37.9 85.6 7.9 6.2
A 23 54 29.2 2.6 14.5 4.2
P 23 46 51.7 12.0 9.8 4.1
FIN 22 44 41.2 : 11.3 4.7
S 27 42 64.3 2.7 9.0 2.6
UK 24 42 50.5 83.7 5.5 -1.1
EU 24 49 37.5 : 10.4 3.2
Sources: 1 European Commission (2001b). 2 EUROSTAT. 3 OECD (2000b), Institutional Investors Statistical Yearbook. The OECD figures do not cover the funding of social security schemes which are imposed, controlled or financed by general government.a The peak year is the year when the pension expenditure is the highest (the lowest in the UK) within the period 2000-50.
The economic implications of ageing populations on public finances during the first half of this centuryhave been investigated recently in a joint project of the EU and the OECD.2 The main results arepresented below.
• Demographic projections show shrinking labour forces after 2010 and shrinking populations after2020, large increases in the old-age dependency ratios, and particularly rapid increases in the very-old-age dependency ratios due to the post-war “baby-boom” generation, as well as decreased fertility ratesand increased longevity. According to the baseline projection, the old-age dependency ratio willdouble, from the present 24 per cent to 49 per cent in 2050. Despite the sensitivity of the results tovarious assumptions in the projections, the basic message of increased dependency ratios holds.
1 See OECD (2000a), European Commission (2000b and c).2 See European Commission (2001b), Economic Policy Committee (2000),OECD (2001a and 2001b).

REFORMS OF PENSION SYSTEMS IN THE EU : AN ANALYSIS OF THE POLICY OPTIONS
- 176 -
• Currently, pension provision in the EU relies heavily on public pension systems. Only in theNetherlands and the UK is the private component of pension provision well developed. Under thecurrent structure of pension provision in most Member States, demographic developments willinevitably increase the burden of pensions on public finances.
• Under a “current policy” scenario,3 public pension expenditure as percentage of GDP will rise in allMember States, except the UK. In the majority of countries, the effects of ageing will increase pensionexpenditure by 3-5 percentage points, with the highest upward pressure occurring in Greece (12.2percentage points) and in Spain (7.9 percentage points).
• Average effective retirement ages are far below the statutory old-age retirement age in all countries,thus increasing the portion of life spent in retirement, decreasing the period in employment, andmaking the economic dependency ratios significantly higher than the old-age dependency ratios.Policies aimed at increasing employment rates, if successful, can partially alleviate the problem. Agradual 5-percentage-point increase in the employment rate would, on average, reduce the rise inpension expenditure by about 0.5 percentage points of GDP with respect to the baseline scenario.
The above findings clearly indicate that the implications of ageing are deep and pervasive. They posemajor challenges for policies in many areas, notably in labour markets, financial markets and publicfinances, all of which are interlinked. Labour market reforms need to address incentives for laterretirement, employability of older workers and their job opportunities. Financial market infrastructureneeds to be strengthened in order to provide a safe framework for private pension schemes and betterpossibilities for diversified and flexible retirement income provision. The challenges for public financesrange from fiscal consolidation to restructuring of expenditure and improving the cost-effectiveness ofcare services.4
The Commission and Council in a joint report to the Stockholm European Council on the quality andsustainability of public finances outlines a three-pronged strategy to tackle the budgetary implications ofageing populations:5
• Member States should reduce public debt levels in order to pre-empt the budgetary consequences ofageing populations.
• Member States should undertake comprehensive labour market reforms, including tax and benefitsystems, in order to reach higher employment rates, in particular among older workers and women.
• Member States should undertake ambitious reforms of pension systems in order to contain pressureson public finances, to place pension systems on a sound financial footing and ensure a fairintergenerational balance.
In addition to the economic challenges posed by ageing populations, the design of pension systems alsoposes problems. These have been identified as follows: (i) there are distortive elements in pension systemsthat affect labour market behaviour and the retirement decision; (ii) all risks, particularly the demographic(increased longevity and shrinking labour force due to decreased fertility) and public debt risks, are notadequately covered in the present systems; and (iii) funding poses the risk of the future value of assets, andrisk diversification related to funding requires institutional improvements, especially in the area of financialmarket infrastructure.
3 The scenario assumed no further reforms but included the effects of the reforms legislated by the end of 1999.4 See OECD (1998).5 Council of the EU (2001) and European Commission (2000d).

REFORMS OF PENSION SYSTEMS IN THE EU : AN ANALYSIS OF THE POLICY OPTIONS
- 177 -
3. ADVANTAGES AND DISADVANTAGES OF PARAMETRIC ANDSYSTEMIC REFORMS
Solutions to the challenges identified above are being sought from: (i) within the present pension schemesthrough parametric reforms (sub-section 3.1), (i.e. changes in the key parameters such as the replacementratio, the retirement age, the contribution rate and taxation of pensions); and (ii) more radical systemicreforms of the various types of pension schemes (sub-section 3.2). While parametric reforms can help toput future pension expenditure on a sustainable footing and reduce labour market distortions within theexisting systems, systemic reforms respond to the need for risk diversification across several systems, andthe need to investigate the whole retirement income provision framework with a view to finding a fairbalance between different types of retirement income sources. As the great majority of existing pensionsystems in the EU are defined benefit and pay-as-you-go schemes, the discussion of parametric reforms islargely associated with reforms of these schemes.
3.1 PARAMETRIC REFORMS
The essential feature of parametric reforms is that they aim to maintain the basic structure of the existingsystem while attempting, through changes in parameters, to influence the costs, financing or incentivestructures of the scheme in order to adjust it to foreseen circumstances. Sometimes, however, the linebetween parametric and systemic reforms is rather ambiguous. In particular, this is the case when reformsare implemented within an existing scheme but they involve elements, which do not inherently belong tothe system. An example of such a reform is the placing of greater weight on advance funding withinessentially pay-as-you-go (PAYG) schemes.6
Despite such ambiguities, the categorisation of pension reforms into parametric and systemic reforms ishelpful for the purpose of describing how the present challenges can be addressed by various types ofreforms. As far as parametric reforms are concerned, they can be classified according to the basicparameters through which any pension scheme is defined, that is, the retirement age, the replacement ratioand the contribution rate. In addition, taxation is a factor that intervenes in many ways, including partialfinancing of PAYG schemes. In the following sections, a range of parametric changes is described underthese headings. The channel through which they influence human behaviour, and the cost or financing ofthe scheme is also discussed.
Retirement age – Retirement age covers both the statutory old-age retirement age and the effectiveretirement age. Some countries have taken steps to increase the statutory retirement age, or at least to raisethe retirement age of women to that of men. In most EU countries, the general statutory retirement age isnow 65 years.7 However, taking into account increased and ever-increasing life expectancy8 and improvedhealth status, a case can be made for an even higher statutory age and for upward flexibility in theapplication of this age limit. This could be achieved, for instance, by promoting a more gradual transitionto retirement and allowing for bonuses for those working after the age which would allow a retirement.
The effective retirement age, i.e. the age at which people retire de facto, is below the statutory retirementage in all European countries; in many countries the gap is as much as 6-7 years. This is because pension
6 In particular, these mixed elements are to be found at present in the recent Italian and Swedish pension reforms, which bothintroduced a notional defined contribution principle into the existing public PAYG schemes. This involves individualaccounting of lifetime contributions, which define the total amount of benefit to be paid for the expected time to be spent inretirement. Then, at the time of retirement, the annual benefit is adjusted to the lifetime expectancy.
7 In France it is 60 and in Denmark it is 67, to be reduced to 65 from 2004.8 Since 1960, in the OECD area, life expectancy of the population at retirement age has risen by 4 years, from 79 to 83 years.
During the same period, the age of retirement has decreased by about 3 years, leading to an increase in the average durationof receipt of pensions by some 7 years, from 13 to 20 years (Visco (2001)).
REFORMS OF PENSION SYSTEMS IN THE EU : AN ANALYSIS OF THE POLICY OPTIONS
- 178 -
schemes provide alternative pathways to retirement, through schemes other than the old-age scheme, suchas early retirement, pre-retirement and disability pension schemes. Such schemes, or relaxation of theireligibility rules, were often introduced in order to facilitate the exit of older workers in firms affected byindustrial restructuring. In addition, these schemes tend to offer substantial incentives for early retirement.For instance, once the eligibility conditions for retirement have been met, there may be very little, if any,incentives to continue to work, because the pension rights may not continue to accrue althoughcontributions would continue to be paid if the individual continued to work. With ageing populations,however, pension systems will no longer be able to support the cost of shedding older workers. Mostcountries have already moved in the direction of restricting, or even closing, supplementary pathways toretirement and also increasing the age limits for these schemes.
Reforms aimed at delaying retirement are beneficial in many ways. Firstly, the number of years inemployment rises, which, simultaneously, increases the number of contribution years.9 Secondly, thenumber of years spent in retirement decreases and, hence, also the pension costs (although this is partiallyoffset through a higher benefit owing to an increased accrual of pension rights). Several simulationssuggest that delaying retirement is a more efficient way to improve the financing situation of pensionsthan reductions in benefit levels.10
Gross replacement ratio – The gross replacement ratio of pensions is the level of pensions relative toearnings. In Member States, the target replacement ratio for a full pension is generally 60-70 per cent,while the maximum rates are allowed to reach as high as 80-90 per cent in some countries and, for somegroups of employees, even 100 per cent. However, the average gross replacement rates are generallylower. According to the report of the Ageing Working Group of the Economic Policy Committee (EPC),the average gross replacement ratios for old age pensions ranged from 33 per cent to 85+ per cent in the10 Member States that provided this information.11 Apart from direct reductions in pension benefits orthe introduction of ceilings for maximum pensions, the replacement ratio can also be reduced, de facto,through changes to the indexation rules for pensions and changes in the reference earnings or in theaccrual rate for calculating pensions.
The indexation of pensions determines how pensions evolve relative to wages over time, but it does notaffect the initial pension level. If pensions rise less than wages over time, the effective replacement ratiowill decline. Reforms that aim at reducing the replacement ratio tend to encourage a switch from wageindexation towards price indexation. Such reforms are supported by the argument that the primarypurpose of pensions is to preserve the purchasing power of pensions and not to compensate pensionersfor future productivity improvements. On the other hand, from the equity perspective, a redistribution ofincreased economic prosperity to pensioners would be better ensured if pensions were indexed to wages.Many countries have taken steps to reduce the indexation of pensions to wages. However, in most cases,they have not shifted completely to price indexation but to a variety of mixed indices in which the weightand form of the wage index vary and the former has been reduced.
Reductions in the reference earnings used for calculating pensions affect the initial level of pensions, andhence the effective replacement rate. They can be achieved, for instance, by increasing the number ofyears used to define the reference earnings or attempting to define the average earnings over the wholeemployment career instead of taking into account only the “best” or most recent years. Moreover, thereference earnings can be modified through deducting certain items from the wages, notably pensioncontributions. The motivation for such reforms is to make benefits commensurate with lifetime earningsand to improve incentives to stay longer in the labour force, through reducing overly generous benefits.The level of pensions and incentives to work can also be improved through the differentiation of the
9 In addition, there is the advantage that it raises the living standard of the elderly, both through greater earnings during theyears spent in employment and through increased pensions when retired.
10 See OECD (2001), Börsch-Supan and Winter (2000), Gruber and Wise (2000).11 The reported gross ratios in 1998 were: Germany 33, Belgium 35.5, Finland 50, Italy 53, Denmark 56, Spain, Austria and
Sweden 65, the Netherlands 70 (with a range 54-109), and France 85+.

REFORMS OF PENSION SYSTEMS IN THE EU : AN ANALYSIS OF THE POLICY OPTIONS
- 179 -
accrual rate of pension rights. For instance, some countries have introduced lower accrual rates forperiods spent on disability pensions compared to those in employment, or higher accrual rates for theyears in employment after a certain age limit, as well as increasing the minimum number of years inemployment for entitlement to a full pension.
The replacement rate can also be used as a means to respond to the challenge of increased life expectancyby establishing a close link between lifetime earnings and lifetime pensions. In this case, the actualreplacement rate for the initial pension level would be defined only at the time of retirement, when theannual benefit would be adjusted to the expected lifetime in retirement.
Contribution rate – Contributions are defined in order to cover benefit payments from a particularscheme. In a PAYG scheme, there is no direct link between contributions and benefits at the individuallevel because, primarily, the contributions are defined to cover the concurrent payment of benefits.Sometimes, additional adjustments in contribution rates can be made in order to partially pre-fund futurepension spending and to improve the link between contributions and benefits at the individual level and,thus, to improve intergenerational fairness. In general, reforms aimed at increasing actuarial fairness, i.e.bringing lifetime contributions closer to lifetime benefits, are deemed to improve the financial reward forworking longer. Tightening the contribution rules, for example by increasing the number of contributionyears required for a full pension, works in the same direction.
Taxation – Taxation provides governments with additional means to finance pension systems. Asignificant part of public pensions can be financed directly from tax funds. In addition, taxation of publicpensions alters the picture concerning the projections of pension expenditure, when considered from thepoint of view of the sustainability of public finances. If public pensions are taxed, part of thegovernment’s gross pension expenditure and liabilities will be returned to the government through taxespaid from pensions. Thus, taxation provides additional means to manage public pension payments andpension liabilities.12 It is recognised, however, that taxation may create disincentives or incentives forlabour mobility across countries, or may lead to an unbalanced sharing of taxes and concessions betweenMember States.
Where private pension schemes are concerned, taxation rules can play an important role in creatingincentives to participate in these schemes, by allowing for a more favourable taxation of the investmentincome from pension funds compared with that of other investment income. This can be particularlyimportant where governments promote a shift from public to private schemes. Hence, this question isclosely related to systemic reforms.
Pensions are broadly subject to income taxation in all Member States, although tax concessions areallowed to various degrees, including tax-exemptions for minimum (or small) benefits or for certain typesof benefits or for social security contributions.13 An indication of differences in the level of the taxation ofpensions between Member States is provided by the OECD (2001c). In general, the tax rules applied topensions are favourable compared to those applied to earnings. Among the countries investigated, taxespaid on public pensions varied from 1-2 per cent (Ireland, UK) to 26 per cent (Denmark, Sweden). Theratio of taxes to gross benefit spending for private pensions was higher than for public pensions in mostcountries.14
12 A further question concerning public pensions is whether the taxation of pensions is appropriate relative to other types ofincome, notably wages.
13 See EPC (2000), OECD (2001e).14 An alternative way of estimating the magnitude of tax allowances for social purposes is provided by the calculations of tax
expenditure, i.e. the revenue foregone due to reductions, exemptions, deductions or postponements of taxes granted withthe aim of pursuing certain policy objectives through the tax system. Some countries provide estimates of such tax breaks forpensions, for instance, 0.1 per cent of GDP in Germany, 2.7 per cent in Ireland, 1.2 per cent in the Netherlands and 2.7 percent in the United Kingdom in 1997 (OECD, 2001c). When interpreting these results, especially those which appear to beconflicting at first glance, one has to bear in mind the normative tax system of the country. For instance, in Germany, both

REFORMS OF PENSION SYSTEMS IN THE EU : AN ANALYSIS OF THE POLICY OPTIONS
- 180 -
Table 2: The ratio of direct taxes to gross
benefit spending in 1997, %
All public
transfers
Public
pensions1Private
pensions
B 9.0 : :
DK 23.9 25.8 36.8
D 7.6 : 17.1
IRL 2.5 0.9 10.1
I 12.8 13.3 16.0
NL 23.0 22.6 25.4
A 12.4 15.4 15.4
FIN 19.5 22.3 22.3
S 22.1 26.5 29.7
UK 2.8 2.1 11.4
Source: OECD (2001c).1 Covers public spending on old-age cash benefits, survivors, disability cash benefits and occupational injury and diseases.
Table 3: Overview of taxation arrangements of
occupational pensions1
EET ETT TEE
B X
DK X
D X2 X
EL X
E X
F X
IRL X
I X
L X
NL X
A X
P X
FIN X
S X
UK X
Source: European Commission (2001a).1 EET: contributions and investment income exempted, benefits taxed. ETT: contributions exempted, investment income and benefits taxed. TEE: contributions taxed, investment income and benefits exempted.2 The German government's proposal for a pension reform indicates ashift to an EET tax regime.
Arrangements for the taxation of occupationalpensions vary across the EU. Table 3 provides anoverview of the taxation arrangements foroccupational pensions (the second pillar schemes) inMember States. However, it should be noted thatmuch of this applies also to social security pensions(the first pillar schemes), especially to those based onoccupational activity. There are three elements ofpension systems, according to which the taxation ofpensions may differ: (i) the contributions to a pensionscheme, (ii) the investment income of the pensioninstitution, and (iii) the benefits paid by the institution.Each of these elements can be either exempted fromtaxation or taxed. The tax treatment is described bygiving each of these elements a symbol E or T,depending on whether the contribution/incomeconcerned is exempted (E) or taxed (T). Thus, anEET treatment means that contributions areexempted, investment income is exempted andbenefits are taxed.
Different levels and systems of taxation of pensionshave implications for labour mobility acrosscountries.15 In addition, from the point of view ofMember States’ tax revenues, the mobility of labourand retired people poses the question of the fair shareof tax revenues among countries concerned, becausepersons may draw a pension in a country other thanthe one in which it has been earned. Even in the caseof similar tax treatment of pensions, where theindividual would not face distortive effects whenmoving from one country to another, the countrywhich would receive the tax revenues would differfrom that which had allowed exemption fromcontributions.
In order to reduce the double taxation and non-taxation that may occur as a result of diverging taxarrangements in Member States, a recent CommissionCommunication investigated differences in thetaxation of pensions from the point of view of singlecapital and labour markets.16 To make progress inreducing the differences in tax arrangements, theCommunication calls for a broader acceptance of theEET principle, on a voluntary basis, since it is themost widely applied tax system.
the taxation of pensions and tax subsidies to pensions are low because the norm (until now) is that the contributions aretaxed and pensions are exempt.
15 Where diverging systems of pension taxation are applied to the same individual during the periods in employment andretirement, there can be problems of double taxation or no taxation for migrant workers and persons retiring to anotherMember State. “Double taxation” could occur, for example, if someone pays contributions in Luxembourg and draws apension in Belgium, while “no taxation” could occur if the move is in the opposite direction.
16 See European Commission (2001a).
REFORMS OF PENSION SYSTEMS IN THE EU : AN ANALYSIS OF THE POLICY OPTIONS
- 181 -
Tax incentives for funding – Taxation affects incentives associated with different kinds of pensionsystems. Theoretically, the question of how private pension schemes should be taxed is an important one:should the returns of the funds be taxed as they accrue, or should taxation apply to benefits? The mostcommon model is that in which pensions are taxed when the benefits are paid and, correspondingly, thecontributions are exempt from taxes on wages. On one hand, this arrangement can be seen as helping tocope with demographic ageing, as it reduces tax revenues today in exchange for increased tax revenues atthe time when the demographic dependency ratio will be more unfavourable. However, one should bearin mind that this is only a shift of tax revenues into the future, not an increase in the net present value oftax revenues. Another issue is that funding, if it is assumed that funding in pension funds creates increasedsaving (not a shift from other savings to funds), also shifts consumption in the future and, thus, changesthe spread of indirect tax revenues over time.
On the other hand, the EET tax treatment of pensions implies significant tax subsidies in favour of suchpension schemes and, hence, for retirement savings. The tax subsidies occur because, firstly, there is a taxshift into the future and, secondly, in a progressive tax system it implies a lower tax rate because thepension is smaller than the wage from which the contribution is paid. Thirdly, if the investment incomeon the pension fund is not taxed, it implies an additional tax subsidy in comparison with other investmentincome. However, neutrality vis-à-vis public pension schemes would support a tax exemption for thissource of income. One should also take into consideration the counter-arguments that the absence of asubsidy might mean inadequate investment in private pension funds or that the subsidy, finally, haswelfare enhancing effects.17
The question of whether the build-up of funded pension schemes can contribute to financing the long-term increase in old-age public expenditure and, hence, help to cope with demographic ageing has beenillustrated by a numerical example provided by the Danish Ministry of Finance.18 A simulation, whichassumes that the same tax rate is applied to deductions of contributions and to taxation of pensions,shows that the deferred income tax in an EET system would have no effect on the net present value oftax receipts, but it would have consequences for fiscal consolidation. A longer period of consolidationwould be required, because the reduction in government debt would be lower during the period ofaccumulation of funds owing to the reduced tax revenues, as a result of deductions granted tocontributions.
Another simulation covered the case of applying higher tax rates to deductions of contributions than topension benefits (i.e. a progressive tax system) and a more favourable taxation of institutional savings ofpension funds, assuming no revision in the public pension provision. This simulation shows that thepresent net value of tax receipts would be reduced and strong incentives for asset diversion would becreated. These subsidies would negatively affect fiscal sustainability and, if the asset relocation werestrong, tax concessions to funded pensions would have the potential to seriously undermine long-runfiscal solvency. Thus, in fact, the creation of tax subsidies for private pension provision would necessitateeither tax increases or expenditure cuts. The latter could be achieved, for instance, through a reduction ofpublic pension provision. Thus, the simulation suggests that such a reform in favour of private pensionsshould be accompanied by a reform of public pension provision. The conclusion of this exercise is thatthe establishment of funded pension schemes cannot alleviate the fiscal impact of population ageing,unless it is combined with reductions in public pensions.
17 See Bohn (2001).18 See Fredriksen (2001).

REFORMS OF PENSION SYSTEMS IN THE EU : AN ANALYSIS OF THE POLICY OPTIONS
- 182 -
3.2 SYSTEMIC REFORMS
Systemic reforms concern the diversification of retirement income provision and risks involved in varioustypes of schemes. These reforms try to respond to questions such as the weights to be given to basicincome security, retirement income based on occupational activity (in mandatory and voluntary schemes)and income from own sources such as capital income, savings and private pensions. A specific question ishow systemic reform can help resolve problems stemming from the existing pension system andpopulation ageing and whether it has relative merits over parametric reforms regarding the challengesfaced by pension systems.
Systemic reforms are much related to pension provision and its financing by different types of schemeswhich can be described using the following categorisation of pension pillars:
• Pillar I: Social security pension schemes, which imply public compulsory schemes.
• Pillar II: Occupational pension schemes, which involve privately-run pension schemes, based oncollective agreements or (voluntary) contracts between employers and employees or on unilateralpromises by employers.
• Pillar III: Private pension schemes, which cover individual pension plans.19
It is not easy to define these pillars in terms of characteristics that are common to all schemes in a singlepillar. Pension schemes can combine different characteristics in many flexible ways. For instance, firstpillar schemes, with the key characteristics of being “publicly managed” and “mandatory”, are oftenerroneously confused with certain features of implementation of some of the schemes, such as financingthrough a pay-as you-go (PAYG) system and having a defined benefit formula. Even though first pillarschemes may be associated with these features in most cases, there is, in practice, a far broader spectrumof choices. In particular, many schemes have moved from unfunded in the direction of pre-funding andpartial funding. In addition, it is important to note that the pensions can be either flat-rate basic socialpensions (minimum pensions) or earnings-related pensions based on occupational activity. In the lattercase, they need to be mandatory and part of the social security system. Although the first pillar is regardedas public, while the second and third pillars cover the private component of the pension system, thedivision is not so clear cut. In some cases, privately-run pension institutes can manage both social securityand voluntary pension schemes.
In the general debate, the method of financing has been used as the crucial differentiation between thevarious schemes. However, this discussion is often blurred by interrelated aspects of the schemes underdifferent pillars, such as public vs. private, unfunded vs. funded, mandatory vs. voluntary, defined benefitvs. defined contribution. In particular, the discussion of increased funding too often leads to an inferencebeing drawn that a switch from a public (social security) scheme to a private (voluntary occupational orprivate pension) scheme should follow.
The discussion on the relative merits of PAYG and funded schemes deals mainly with the following issuesand challenges of pension systems:
• Universal coverage
• Minimum pension and redistribution
19 The terminology relating to different pension schemes and pillars can be ambiguous. For instance, the term ‘occupationalpensions’ is sometimes used to cover, in addition to schemes based on collective agreements or contracts between employersand employees (II pillar), compulsory schemes based on occupational activity and run by social security institutions. Also theterm ‘supplementary pensions’ is used in a specific and general sense. Where pension pillars are concerned, such pensionschemes cover those included in the second and third pillars, i.e. occupational and private pension schemes (EuropeanCommission (1999a and 2000a)).

REFORMS OF PENSION SYSTEMS IN THE EU : AN ANALYSIS OF THE POLICY OPTIONS
- 183 -
• Fairness across generations
• Transparency and actuarial fairness
• Demographic challenge
• Labour market effects
• Financial market risks
• Higher returns on funded schemes
• Rule changes and political risks
• Administration costs
• Transition costs
Compared with private (funded) systems, public (PAYG) systems offer a number of advantages, such asuniversal coverage, minimum pension, redistribution and solidarity goals and coping with financial marketrisks, while the funded system is seen to have advantages in dealing with the goals of transparency andactuarial fairness, as well as fairness between generations. For these reasons it is often claimed that thelatter copes better with demographic risks and distorts labour market behaviour less. However, in anumber of areas, the economic literature is not conclusive. These issues are discussed in more detailbelow.
Bohn (2001) argues that an important question in designing pension reforms is how they share theaggregate risks related to pensions between the working-age population and pensioners. The main sourcesof the aggregate risk related to pensions are the uncertainties about future productivity growth, populationgrowth, longevity and the valuation of capital assets. Government policy can reallocate these risks acrossgenerations, either through taxes and transfers or by changing the market portfolio, i.e. the capital stockand the government debt, through debt management. Bohn asserts that different types of reforms sharethe risks between generations in different ways, and hence, they involve different outcomes in terms ofincentives and distortive effects for various groups of people. Therefore, according to Bohn, an optimalpension policy should seek for reforms that share the financial risks of aggregate productivity, assetvaluation and demographic shocks in the most equal way across generations.
As a point of departure, it is recognised that the initial choice between various pension systems has alreadybeen made in all Member States. No country can start from a tabula rasa. Therefore, it is assumed that weare dealing with questions related to transformation, such as a partial shift from public into private orfrom unfunded to funded schemes. However, one should bear in mind that much of the theoreticalconsiderations on the relative merits of different systems are based on a pure comparison between thesystems in a hypothetical situation, where a choice could be made in a tabula rasa situation. In practice,countries face the question of whether a shift from one particular system to another would be beneficial.In addition, it is recognised that achievements and common values related to present pension systems areimportant. In the following analysis, we assume, for instance, that the goals of having a universalminimum pension and combating poverty among old people will be retained and that these objectives willbe preserved in publicly managed, social security schemes.
Demographic challenge – Demographic challenge20 stems from decreased fertility and increasedlongevity. Much of the literature does not make a distinction between the different sources of
20 Some economists make a distinction between ‘demographic challenge (or change)’ and ‘demographic risk’. According tothem, strictly speaking, risk is associated with uncertainty, while a challenge or a future change implies that a great part of theexpected value is already known. The expected changes in demographic development – baby-boom generation, increased lifeexpectancy and decreased fertility – are largely known, although there is some degree of uncertainty regarding the magnitudeof changes.

REFORMS OF PENSION SYSTEMS IN THE EU : AN ANALYSIS OF THE POLICY OPTIONS
- 184 -
demographic changes. Some economists, however, argue that these sources have different implications forthe economy. Decreased fertility affects primarily the working-age population through the change in thesize of the labour force and, hence, has more direct effects on production and labour income, whereasincreased longevity affects mainly retirees. Through these different influence channels, differentgovernment policies share the risks of shocks between workers and retirees in different ways.21
It is often claimed that funded schemes cope better with demographic changes. The argument is that fully-funded schemes usually provide benefits which are contribution defined and there is an explicit linkbetween contributions paid in advance and benefits received in retirement, while such a link is missingfrom defined benefit systems.
Some economists argue that this is true only in nominal terms, whereas in real terms, the funded schemesare also affected by demographic changes, because the crucial underlying problem caused by ademographic change is a fall in output, which affects both types of pension schemes. In a PAYG system,a demographic change affects output by reducing the size of the contribution base, i.e. the wage bill. If thePAYG system were balanced, it would correspondingly reduce the pensions bill which could be supportedby a given contribution rate. In a funded system, the mechanism is more subtle and less transparent, butequally inescapable. It operates through a mismatch between demand and supply in the assets market.Excess supply reduces asset prices and the return on funds, thereby reducing pension accumulations andhence the resulting annuity. In both systems, the reduction in pensions can be avoided if output grows.Barr (2000) concludes that: (i) in the face of demographic problems the key variable is output; (ii) thepolicy choice should consider all policies which promote output growth; and (iii) from a macroeconomicperspective the choice between PAYG and funding is secondary.
Some simulations provide support for the above conclusion and state that as ageing affects savings, it alsoaffects interest rates. Brooks (2000) has produced simulations showing that the “baby-boom” generationloses out significantly in the funded system due to a fall in interest rates owing to population ageing. TheMerrill Lynch scenario (2000) also produces the same result.
However, in the real world, PAYG systems may not be balanced since they are usually benefit-definedsystems, including promises of future pensions. If future pension contributions or taxes cannot be raisedsufficiently to pay for pensions and the pension levels cannot be reduced, the system may appear to beunsustainable. Thus, PAYG systems may be more vulnerable to demographic changes than fundedschemes. The key issue is, however, the sustainability of PAYG schemes. This suggests that the pensionsand the public debt should be considered together, since demographic shocks can affect either one ofthese. In addition, they are the two main instruments for intergenerational transfer schemes and,therefore, are central in making future liabilities sustainable.
Labour market effects – Labour market distortions related to pension systems are manifested inretirement decisions and the individual’s labour market responses during working life, e.g. how an increasein earnings affects future pensions. As PAYG schemes usually have a defined benefit pension formula inwhich the link between contributions and benefits is weak, the distortive elements for labour marketbehaviour are more apparent than in a funded scheme. In the latter, the actuarial link betweencontributions and benefits inherently reduces distortive effects. A strong relationship betweencontributions and benefits is regarded as reducing these distortions. However, achieving a full actuarialrelationship between contributions and benefits is not possible if we accept a universal minimum pensionprovision irrespective of labour force participation.
Studies provide strong evidence that there is a relationship between the design of public pensions andearly retirement.22 In general terms, people tend to leave the labour force at the age at which their pensionwealth is maximised, i.e. when delaying their exit from the labour market is not rewarded by an actuarial
21 See Bohn (2001).22 See e.g. Blöndal and Scarpetta (1999), Gruber and Wise (1999), Börsch-Supan and Winter (2001).

REFORMS OF PENSION SYSTEMS IN THE EU : AN ANALYSIS OF THE POLICY OPTIONS
- 185 -
amount. However, private pension schemes may also include an incentive to retire early, or certain kindsof disincentives, e.g. pension penalties for leaving the company to work for another employer. In fact, themethod of financing the pension system, per se, is not crucial for incentives to work; what matters is theincentive structure that is built into the pension system.23 Both the PAYG and funded schemes mayinvolve disincentive effects. Notwithstanding this, in practice, PAYG schemes may involve moredisincentives, not only due to the deficiencies in the design of pension benefits, but also due to theperception that a contribution to a public scheme is a tax, whereas a contribution to a scheme based onactuarial principles is more likely to be regarded as saving. This argument, however, is controversial,especially in the case of private occupational schemes, which may include almost mandatory elements inthe form of collective agreements, and in which the contributions are largely similar to contributions to ortax financing of public PAYG schemes.
Financial market risk – Pure public PAYG schemes do not operate in the financial market, while privatefunded schemes operate fully there. Thus, financial market risk is primarily an additional risk componentfor funded schemes. It arises from the fact that in a defined contribution pension scheme, the retirementincome is derived from the value of the fund emerging at the time of retirement, and hence, the retireebears the risk of the rate of return for pension fund investments.
In general, diversification of investments should produce higher financial returns over long periods oftime. However, if the capital markets are functioning perfectly, the higher return should correspond to ahigher risk on investment. In addition, the rates of return can vary substantially from year to year. Indeed,some ex post studies of the yield of investments in stock index funds in the USA show significantdifferences over different time periods. One study examined the replacement rates that workers wouldhave achieved if they had invested 2 per cent of their earnings in stock index funds each year over a 40-year work career and converted the accumulated balance to a retirement annuity upon reaching theretirement age. It found that workers retiring in 1968 would have enjoyed a 39 per cent replacement rate,but those retiring in 1974 – only six years later – would have received only 17 per cent.24
Notwithstanding the above, in reality, the risk of diversification can also be met in a PAYG scheme, if it ispartially funded and invests its funds in risky assets. However, such an investment undertaken through apublic defined benefit system involves less financial risk for any single individual than the investmentundertaken through a private defined contribution system. This is because a public defined benefit systemcan spread risk across generations in a way that is not possible under a private defined contributionsystem.
The issue of managing financial market risk is an important one, not least because there are already a greatnumber of private pension funds operating in the market, and in addition, public schemes are collectingreserves and investing them in different kinds of assets. The issue is one of adequate consumer protection,especially in the case of a defined contribution system. The question is how to minimise the risk of a lowreturn on pension funds and, ultimately, the risk of bankruptcy of a pension fund. This depends onpension fund management and its investment policy, on the particular features of long-term investments,as well as on financial market regulation and the creation of proper infrastructure for the effective andsustainable functioning of financial markets.
Higher returns on funded schemes – The advocates of funded schemes tend to claim that the rates ofreturn on pension funding are higher and, hence, accumulated funds allow lower pension contributionsthan in PAYG schemes. Moreover, the evidence that rates of return from equities have been higher thanthose on government bonds has been used to provide support for the superiority of private pension fundsover funds run by the government under strict rules.
23 See Orszag and Stiglitz (2000).24 See Orszag and Stiglitz (1999).
REFORMS OF PENSION SYSTEMS IN THE EU : AN ANALYSIS OF THE POLICY OPTIONS
- 186 -
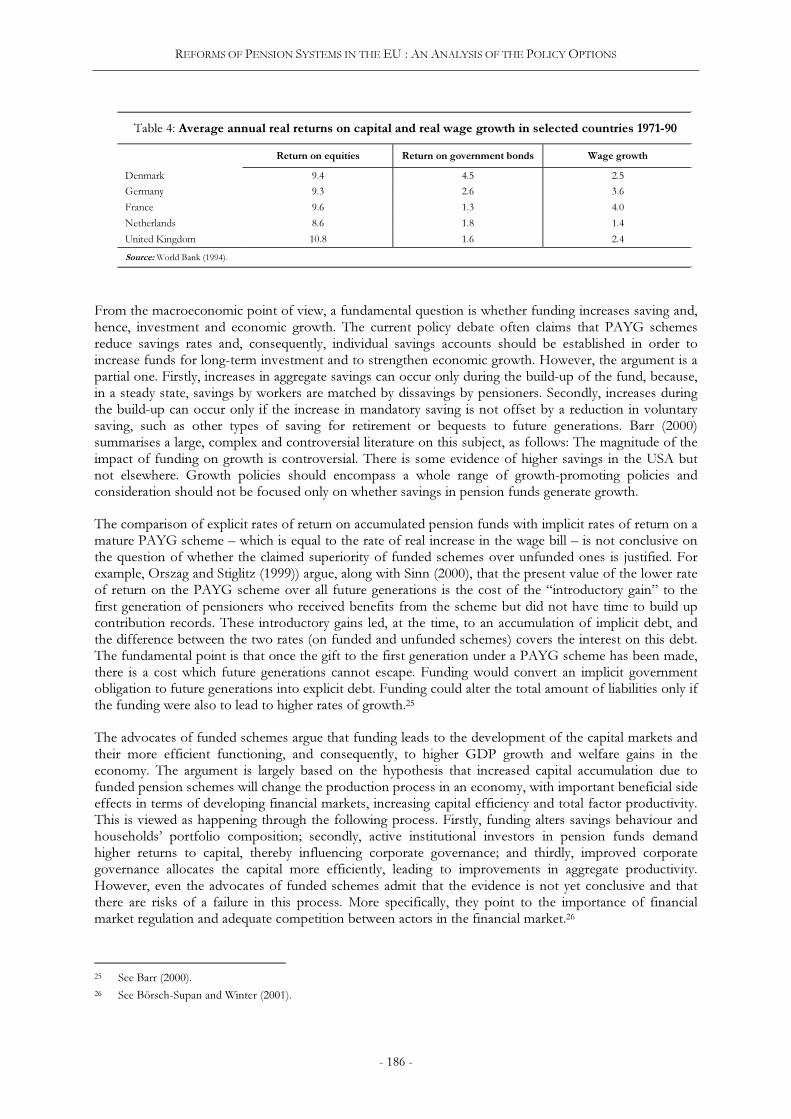
Table 4: Average annual real returns on capital and real wage growth in selected countries 1971-90
Return on equities Return on government bonds Wage growth
Denmark 9.4 4.5 2.5
Germany 9.3 2.6 3.6
France 9.6 1.3 4.0
Netherlands 8.6 1.8 1.4
United Kingdom 10.8 1.6 2.4
Source: World Bank (1994).
From the macroeconomic point of view, a fundamental question is whether funding increases saving and,hence, investment and economic growth. The current policy debate often claims that PAYG schemesreduce savings rates and, consequently, individual savings accounts should be established in order toincrease funds for long-term investment and to strengthen economic growth. However, the argument is apartial one. Firstly, increases in aggregate savings can occur only during the build-up of the fund, because,in a steady state, savings by workers are matched by dissavings by pensioners. Secondly, increases duringthe build-up can occur only if the increase in mandatory saving is not offset by a reduction in voluntarysaving, such as other types of saving for retirement or bequests to future generations. Barr (2000)summarises a large, complex and controversial literature on this subject, as follows: The magnitude of theimpact of funding on growth is controversial. There is some evidence of higher savings in the USA butnot elsewhere. Growth policies should encompass a whole range of growth-promoting policies andconsideration should not be focused only on whether savings in pension funds generate growth.
The comparison of explicit rates of return on accumulated pension funds with implicit rates of return on amature PAYG scheme – which is equal to the rate of real increase in the wage bill – is not conclusive onthe question of whether the claimed superiority of funded schemes over unfunded ones is justified. Forexample, Orszag and Stiglitz (1999)) argue, along with Sinn (2000), that the present value of the lower rateof return on the PAYG scheme over all future generations is the cost of the “introductory gain” to thefirst generation of pensioners who received benefits from the scheme but did not have time to build upcontribution records. These introductory gains led, at the time, to an accumulation of implicit debt, andthe difference between the two rates (on funded and unfunded schemes) covers the interest on this debt.The fundamental point is that once the gift to the first generation under a PAYG scheme has been made,there is a cost which future generations cannot escape. Funding would convert an implicit governmentobligation to future generations into explicit debt. Funding could alter the total amount of liabilities only ifthe funding were also to lead to higher rates of growth.25
The advocates of funded schemes argue that funding leads to the development of the capital markets andtheir more efficient functioning, and consequently, to higher GDP growth and welfare gains in theeconomy. The argument is largely based on the hypothesis that increased capital accumulation due tofunded pension schemes will change the production process in an economy, with important beneficial sideeffects in terms of developing financial markets, increasing capital efficiency and total factor productivity.This is viewed as happening through the following process. Firstly, funding alters savings behaviour andhouseholds’ portfolio composition; secondly, active institutional investors in pension funds demandhigher returns to capital, thereby influencing corporate governance; and thirdly, improved corporategovernance allocates the capital more efficiently, leading to improvements in aggregate productivity.However, even the advocates of funded schemes admit that the evidence is not yet conclusive and thatthere are risks of a failure in this process. More specifically, they point to the importance of financialmarket regulation and adequate competition between actors in the financial market.26
25 See Barr (2000).26 See Börsch-Supan and Winter (2001).

REFORMS OF PENSION SYSTEMS IN THE EU : AN ANALYSIS OF THE POLICY OPTIONS
- 187 -
Rule changes and political risk – Public pensions are subject to many sources of political risk. The firstis that relatively high benefits have been granted to the first generation of retirees from a pension systemat the time when the system was created and when the contribution revenue easily covered expenditures.The second is the excessive responsiveness of benefits to short-term conditions of government budgets,for example, long-term promises in benefit schemes on the basis of short-term economic developments.The third source of political risk could be their excessive responsiveness to long-term conditions. Thefourth is that many schemes that have been funded to some degree have been depleted of accumulatedassets through outright diversion or a low rate of return, making the originally promised benefitsunsustainable.27
It is claimed that the benefits of PAYG schemes are more vulnerable to rule changes in case of economiccrisis and, once this is done, there is an adverse impact on the credibility of politicians and of thedemocratic system. In contrast, in a funded scheme, both liabilities and assets are explicit and,consequently, rules such as those on accrual and indexation cannot be changed. In this sense, they are saidto provide more stable rules for pension provision and more protection against government involvement.On the other hand, the ability of governments to change rules is not only a risk for pensioners but canalso be seen as an advantage of the PAYG scheme, which provides leeway to adapt to unforeseenchanges. Through a number of rule changes, such as indexation rules, retirement age, eligibility rules andreplacement rates, governments can change their future liabilities and, hence, make the pension systemmore sustainable in the long run.
Finally, the effects of possible government failures and economic crisis would not be limited to publicpension schemes but would also be harmful to private pension funds, probably leading to lower returnsand a depreciation in the value of the funds. Therefore, effective government is essential both for publicand private schemes for two strategic reasons: (i) to ensure macroeconomic stability, which underpinswell-run PAYG schemes and which is also necessary to protect pension accumulations that are sensitiveto unanticipated inflation; and (ii) to ensure appropriate regulation of financial markets for reasons ofconsumer protection.28
Administrative costs – No pension system can work for free. However, the management task is differentin PAYG and funded schemes. In addition to the collection of contributions and the payment ofpensions, a funded scheme has to take care of the investment of contributions and management of funds.In a competitive market with a large number of actors, there are also marketing costs associated withpension insurance policies. For these reasons, assuming equal administrative efficiency, the administrativecosts are higher in a funded than in a PAYG scheme.29
An OECD study on administrative costs of private pension schemes shows significant differences incharge levels and in the method of levying charges on pensions, often subject to claims of intransparency.The estimated charge ratio, i.e. the ratio of charges to contributions, varied between 10 and 35 per cent.This converts into administrative costs of 0.5-2 per cent of assets. Clearly, charges of this magnitude havea major impact on the net returns to savings. Even a seemingly innocuous charge of one per cent of assetsreduces the pension benefit by 20 per cent. The study also established that the relationship betweencharges and retirement benefits is approximately linear, so that a 2 percentage charge equals to a drop ofaround 40 per cent in the pension benefit.30
Transition costs – A straightforward comparison of the relative merits, notably the rate of return,between PAYG and funded schemes is not sufficient to advocate switching from one system to the other.Once a system is already in place, a change to another one inevitably involves transition costs. Morespecifically, once a PAYG system is in place and the payments to the first generation under a PAYG
27 See Holzmann (1999).28 See Holzmann (1999).29 See Orszag and Stiglitz (1999).30 See OECD (2001d).
REFORMS OF PENSION SYSTEMS IN THE EU : AN ANALYSIS OF THE POLICY OPTIONS
- 188 -
scheme have been made, there is a cost for future generations to be paid. It is possible only to alter thetime path of this burden, by either (a) transferring it to the current (second) generation through a defaulton promises, i.e. reduced pension benefits, (b) transferring it to the following (third) generation throughincreased contributions or taxes in order to finance the pensions of the current generation, or (c)transferring it to several successive future generations by financing the transition through publicborrowing. Thus, the cost of financing the transition is one essential element in a comparison of PAYGand funded schemes. In other words, the benefits of the switch should exceed the transition costs.
We therefore come back to the question of what justifies a switch from a PAYG scheme to a fundedscheme. A basic motivation seems to be rooted in the inefficiencies of a PAYG scheme, such as its over-generosity, leading to unsustainable financial consequences and adverse labour market effects, and itsunfairness across generations. As already discussed above, these features are not inherently related to themethod of financing and can exist in both types of schemes. Also, these drawbacks can be tackled withinthe PAYG system. The link between contributions and benefits can be strengthened, incentives for earlyretirement and other adverse labour market effects can be reduced, the funding element can be enhancedthrough pre-funding, and the financial position of the government can be strengthened by reducing publicdebt. However, the question remains as to whether a funded scheme provides a better framework foravoiding or reducing these inefficiencies.
3.3 ARGUMENTS FOR A MORE FUNDED AND MORE DIVERSIFIED PENSIONSYSTEM
There is general agreement that measures to address the ageing problem should include amortisation ofcurrent public debt, pre-funding of future expenditure in the form of collecting a surplus in special reservefunds or partial funding in pension funds.31
Funding vs. pre-funding – Funding, through better transparency and actuarial fairness, has been seen asa useful way to address the problems of sustainability and intergenerational fairness. However, asdiscussed above, a switch into funded schemes is not a guarantee of better performance. An additionalquestion is whether pre-funding, for example in the form of amortising public debt or collecting reservefunds for future financing of pensions, has advantages over funding. Under the circumstances of equallyefficient management of the funds, this question is reduced to the rate of returns on funds. Sceptics alsoask what guarantees can be given, in the case of public funds, that these funds will be used for the purposeof financing future pensions.
Increased partial funding – Regarding the issue of intergenerational fairness stemming from populationageing, it is true that as the generation size diminishes, ceteris paribus, in a PAYG scheme the workinggenerations pay more than they will receive when retired. One way to improve equity across generations ispartial funding, i.e. contributions exceed the concurrent pension payments, in order to balance thechanges in the size of generations. Sinn (2000) argues that it is only fair that the generation that choosesnot to raise as many children as the previous generation, pays part of its own pensions by saving when atwork and uses these savings when retired, in exchange for lower child rearing and education costs. In theoverall generation balance, one should take into account the fact that the previous generation has made asignificant voluntary transfer to the current generation in the form of child rearing and educationexpenditure. Oksanen (2001b) has demonstrated with a simplified numerical simulation that, underdeclining fertility, a PAYG system would require increased contribution rates and funding in order to keepthe contribution rates fair across generations, that is, each generation with the same fertility shouldcontribute to pensions at the same rate of their wages.
31 E.g. OECD (1998), European Commission (2000c), Group of Ten (1998), The World Bank (1994), Orszag and Stiglitz(1999).

REFORMS OF PENSION SYSTEMS IN THE EU : AN ANALYSIS OF THE POLICY OPTIONS
- 189 -
A further general argument in favour of increased funding is that policies that increase flexibility regardingthe response to future events should be promoted.32 Funding is seen to increase risk diversificationbecause part of implicit government liabilities will be converted to explicit pension fund liabilities. Hence,a more balanced portfolio of pension claims can be achieved than under any single type of scheme alone.Some economists point out that this argument only justifies partial funding. They argue that diversificationbetween the unfunded component, the yield of which is tied to the growth of wages, and the fundedcomponent, the return on which is defined in the market, provides further diversification relative to theset of assets available on financial markets.33 Some other economists feel that a partial shift into fundedschemes will increase flexibility and contribute to a more equal income distribution across generations,34
while the advocates of funded schemes consider the risk diversification as an essential advantage to begained from a more radical change in pension schemes.
In the face of population ageing, due to the shocks of decreased fertility and increased longevity, both ofwhich involve large financial implications across generations, government policies managing publicpensions, public debt and taxation are of crucial importance. Bohn (2001) argues that these changes aretriggering a policy change where most households will participate in financial markets. The governmentsupply of savings instruments will then play a critical role in allocating risks. Optimal public debtmanagement should supply securities to savers that reflect the aggregate risk exposure of productivity,population growth and longevity. According to Bohn, government bonds indexed to wages anddemographic variables offer a flexible set of instruments to share risk.
A complete switch to funded schemes remains controversial. As discussed above, the risks faced underdifferent types of schemes are partly different, partly common. All pension systems face macroeconomic,demographic and political shocks, although the degree of vulnerability may be different. In addition,funded schemes are more liable to fund-management and financial market risks. These considerationshave to be balanced against the advantages to be gained from the funded scheme.
4. EMPIRICAL ASSESSMENT OF SELECTED PENSION REFORM
OPTIONS: SERIES OF ILLUSTRATIVE SIMULATIONS
In sections 2 and 3 the essential background details have been provided in terms of the advantages anddisadvantages of the different pension reform strategies. Given the conflicting signals coming from theliterature review, it is clear that the final choice in terms of the actual pension reforms to be implementedrests to a large extent on the empirical supporting evidence. Using a new ageing model which has beenconstructed for this analysis (see the Annex for an overview of the key features of the model), this presentsection will describe the models baseline growth and pension expenditure projections for the EU-15 as awhole to 2050, in order to underline the size of the demographic challenge to be faced over the period,and will in addition summarise the results of a number of simulations which systematically address the keyquestions underlying the pension reform debate.
Furthermore, in order to show that the model is calibrated on realistic parameter values and to ensure thatthe simulations themselves are as realistic and policy relevant as possible, the model is used to assess theeconomic and budgetary implications of the key assumptions underlying the pension scenarios recentlyprepared by the EPC’s ageing working group. Finally, it is important to stress at the outset that all thesimulations in this section refer to the EU-15 as a whole and consequently, as with all averages, some ofthe assumptions / results may appear substantially at odds with the specific circumstances of individual
32 See Orszag and Orszag (2000).33 See Orszag and Stiglitz (1999).34 E.g. Lindbeck (2000), Oksanen (2001a).
REFORMS OF PENSION SYSTEMS IN THE EU : AN ANALYSIS OF THE POLICY OPTIONS
- 190 -
EU Member States. In fact, given the marked differences between the pension systems of the 15 EUcountries, these simulations can only be associated with a “stylised” EU Member State.
This section is sub-divided as follows: (4.1) ageing model, description of baseline growth and pensionexpenditure scenario for EU-15 for the period 2000-50; (4.2) models assessment of EPC’s pensionexpenditure projections for 2000-50; and (4.3) empirical assessment of individual pension reform optionsusing the ageing model.
4.1 AGEING MODEL : DESCRIPTION OF BASELINE GROWTH AND PENSIONEXPENDITURE SCENARIO FOR 2000-50
In order to be able to show the basic mechanisms at work in the ageing model and to provide anappropriate reference framework for the pension reform simulations, it is important to describe the keyassumptions on which the models baseline scenario is based and the impact of these assumptions in termsof the overall growth, pension expenditure and income distribution effects of ageing populations.
In terms of the assumptions used, the demographic context for the baseline scenario is provided byEurostat's population projections to 2050, which were specially prepared in 2000 for the EPC for theirageing analysis. In terms of future labour force developments, the baseline assumes that participation rateswill stay at their 2000 levels over the next 50 years and that there are no further reductions in the effectiveretirement age, which is consequently predicted to remain at close to 60 over the period.
The model also makes important assumptions regarding the generosity of the pension system. In thisregard, in calculating pension expenditure as a per cent of GDP, it is well known that the key determinantsare the old age dependency ratio and the generosity of the pension system, as measured by the pensionincome replacement ratio relative to wages in employment. Because of the many difficulties in calculatingthis replacement ratio it was decided to work back from the pension expenditure figures for 2000provided by the Member States in the EPC’s Working Group. Using the EPC’s expenditure to GDP ratiofor the EU as a whole of around 10 ½ per cent in 200035 and using the models old age dependency ratiowould imply a net replacement ratio (NRR) for the EU of about 74 per cent in 2000 which is equivalent toa gross replacement ratio of 54 per cent. This 20 percentage points difference between the gross and netconcepts reflects the much higher taxation levels on workers compared with pensioners, with the NRR ofthe EU as a whole assumed in the baseline to stay at its 2000 level of 74 per cent for the next 50 years.
What are the economic and budgetary implications of these demographic and pension generosityassumptions over the simulation period. As shown in Graph 1, the models baseline scenario assumes a fallin the level of GDP in the EU over this period of 19 per cent,36 with pension expenditure as a percentageof GDP rising by 7 percentage points to 17 ½ per cent of GDP. This rise in pension expenditure is dueuniquely to the rise in the old age dependency ratio since the generosity of the system is kept constant atits 2000 level. In terms of the burden of ageing on workers, the doubling in the old age dependency ratiois forecast to increase the taxation burden significantly, with social security contributions (as a percentage
35 It should be noted that the EPC expenditure to GDP ratio projections not only cover old-age pensions but also otherreplacement income to people aged 55 and over, i.e. early retirement pensions, disability and survivors pensions and othertransfers to the elderly. Entitlement to this additional replacement income is not determined on the same basis as for old-age pensions. Moreover, it should be mentioned that most, though not all, of these government expenditures are financed ona PAYG basis. A proportion of these expenditures in some Member States may be financed on a funded basis and/orthrough transfers from the general government (i.e. not directly from social security contributions).
36 This result is very similar to that reported in the “1999 Review” based on Eurostat's 1996 population projections for theperiod 2000-50. This similarity in terms of the GDP loss associated with ageing is not that surprising however given that,while individual EU country population projections have in some cases changed quite significantly between the 1996 and2000 Eurostat exercises, the population projections for the EU-15 as a whole have remained very similar, in terms of boththe overall population total and its decomposition into the various age cohorts.

REFORMS OF PENSION SYSTEMS IN THE EU : AN ANALYSIS OF THE POLICY OPTIONS
- 191 -
of wages) needing to rise from 16 per cent in 2000 to nearly 27 per cent in 2050 in order to meet thepension expenditure obligations operating under the PAYG system. Given the dramatic deterioration inthe financing costs of the public pension system, as represented by the nearly 70 per cent increase in therate of SSC’s paid by workers and the equivalent hike in pension expenditure commitments ofgovernments to 17 ½ per cent of GDP, it is not surprising to find that the overall implicit debt of thePAYG system rises dramatically over the period from a figure of about 180 per cent in 2000 to 280 percent in 2050.
Table 5: Baseline scenario1
Growth Budgetary Impact Income Distribution
GDP per
capita
Social
security
contributions
(% of Wages)
Public pension
expenditure
(% of GDP)
Working age
population
consumption
Pensioners
consumption
2000 0 16.1 10.5 0 0
2030 -12.0 22.9 15.0 -11.9 -15.5
2050 -19.0 26.9 17.6 -19.6 -19.5
Source: Commission services.1 Compared with a technical scenario where no “ageing” is assumed i.e. the population trends evident in the most recent decadesare simply extrapolated forward.
As well as the growth and budgetary implications of ageing, the baseline also contains importantinformation in terms of the evolution of the internal rates of returns of both the PAYG and fundedsystems over the coming decades (this is discussed in more detail later on in the section) :
• With regard to the PAYG system, while real wages are expected to rise slightly, reflecting changes inrelative factor endowments, the growth in the wage bill is expected to decline due to thedemographically induced fall in the number of people employed.
• As regards the return on funded schemes, the real interest rate is expected to decline over the periodbut not significantly, with rates of return only falling from 5 ½ per cent to 5 ¼ per cent. With regardto the real interest rate, it is important to underline that movements in the latter reflect developmentsin terms of both the supply and demand for funds, with overall national savings as a percentage of
GDP forecast to decline in the baseline due to falls in private savings,37 but with the demand for
savings also falling due to the expected decline in GDP growth rates. In overall terms therefore it isprojected that the rate of return differential enjoyed by funded schemes compared with the PAYGsystem over the last number of decades is likely to persist over the simulation horizon to 2050, with adifferential in favour of funding of the order of 3 ¼ to 3 ½ percentage points predicted by the modelover the coming decades.
Finally in terms of income distribution, the baseline scenario to 2050 assumes that the working agepopulation and pensioners will both be affected to the same extent by the ageing phenomenon.
37 The consumption to GDP ratio rises in the baseline due to the higher marginal propensity to consume (MPC) of retirees,with the share of retirees in the overall population rising steadily throughout the period.

REFORMS OF PENSION SYSTEMS IN THE EU : AN ANALYSIS OF THE POLICY OPTIONS
- 192 -
A: Baseline scenario: GDP impact of ageing in theEU
-20
-15
-10
-5
0
2000 2010 2020 2030 2040 2050
B: Baseline scenario: Public pension expenditureimpact of ageing in the EU
0
5
10
15
20
2000 2010 2020 2030 2040 2050
%
Graph 1: Baseline scenario 2000-50
Source: Commission services.
%
4.2 ASSESSMENT OF THE ECONOMIC AND BUDGETARY IMPACT OF THELABOUR MARKET AND PENSION GENEROSITY ASSUMPTIONS
UNDERPINNING THE RECENT PENSION EXPENDITURE PROJECTIONS OF
THE EU’S ECONOMIC POLICY COMMITTEE (EPC)
EPC pension projections 2000-50 – As explained earlier, new projections for the EU’s Member Stateshave been recently published by the EPC’s ageing working group regarding the pension expenditureimplications of ageing populations over the period 2000 to 2050. As shown in Graph 2, these projectionssuggest that expenditure on pensions in the EU will rise by about 3 percentage points of GDP over theperiod 2000-50 to reach 13 ½ per cent of GDP in 2050. This increase is much lower than the 7percentage points of GDP increase in pensions expenditure estimated under the baseline scenario in sub-section 4.1. The much lower EPC pension projections largely result from the fact that although the EPCforecasts are based on the assumption that pension policies remain unchanged over the next 50 years (i.e.the forecasts are based on legislation in force in 2000), key underlying parameters will nevertheless changeover the forecast period since :
• Firstly, the EPC projections are based on the assumption of a large increase in labour forceparticipation rates over the forecast period (due to higher participation rates amongst younger, female,age-cohorts compared with earlier generations) and on reductions in structural unemployment.
• Secondly, the parameters of the pension system itself are not static but incorporate to some extent thelagged effects of recently introduced reforms. In particular, many reforms incorporate a transitionperiod of several years to a new less “generous” pension regime. Over time, increasing numbers ofpension entitlements will be calculated on this less generous basis. As an example of the latterchanges, many countries have already altered the rules relating to the indexation of pension benefitsfrom wages towards prices, and consequently, on the assumption that wages will continue to growfaster than prices, this will inevitably lead to a decline in the real value of the average pension receivedby pensioners relative to the average real wage received by workers.
The above factors go a long way towards explaining the differences between the EPC pension projectionsand those contained in the baseline scenario of the ageing model described in sub-section 4.1. However, in

REFORMS OF PENSION SYSTEMS IN THE EU : AN ANALYSIS OF THE POLICY OPTIONS
- 193 -
addition to these clarifications, given the need to be able to assess the effectiveness of individual pensionreforms, a quantification of where the pension expenditure changes in the EPC’s scenario are emanatingfrom would be particularly useful. In this regard, in the report of the EPC’s ageing working group, afurther breakdown of the EPC’s pension projections were provided for the EU Member States.
Graph 2: EPC pension projections 2000-50 (EU-15)
- contributions to change in pension expenditure-
-6
-4
-2
0
2
4
6
8
Dependency ratio Employment ratio Benefit ratio Eligibility ratio Total change
Source: EPC Ageing Working Group.
Percentage points
Graph 2 shows a weighted average of the EPC’s figures for the EU as a whole (although there were largedifferences between individual Member States), broken down into their various contributing components,namely changes in the old age dependency, employment, benefit and eligibility ratios. This breakdownallows one to quantify the relative importance of the labour market and generosity changes that areexpected to take place in EU countries and provide a useful backdrop for an empirical assessment of theindividual reform options in sub-section 4.3. Graph 2 shows that governments intend to implement asignificant package of labour market reforms, with changes in the employment and eligibility ratioshighlighting the labour force participation rate and structural unemployment improvements referred toearlier. Unfortunately, from the point of view of pension expenditure, one can see that the employmentand eligibility ratios tend to offset each other to a certain extent. It is also clear from Graph 2 that the twobig driving factors in determining the overall change in pension expenditure over the next 50 years will bethe old age dependency ratio and the benefit ratio (i.e. defined by the EPC as the average pension relativeto GDP per worker)38.
EPC Scenario: Budgetary and economic implications of the EPC’s labour market and pensiongenerosity forecasts for 2000-50 – In order to show the simulation properties of the model before usingit to assess the various pension reform options in sub-section 4.3, it was decided to analyse the impact ofintroducing into the model the assumptions used by the EPC for their own pension expenditure exercise.While the same population projections from Eurostat are used in this “EPC” scenario as in the EPCwork, using the EPC assumptions for participation rates, structural unemployment and pension generosityensures that there are a number of key differences between the “EPC” scenario and the baselinesimulation :
38 It should be noted that while the EPC definition of the benefit ratio (average pension/GDP per worker) can over particularperiods of time deviate markedly from the more commonly-used replacement rate definition (average pension/averagewage), nevertheless the evolution should be broadly similar over a period of 50 years if one assumes, as is the case with theageing model, that real wages and productivity grow in line with each other over the long run.

REFORMS OF PENSION SYSTEMS IN THE EU : AN ANALYSIS OF THE POLICY OPTIONS
- 194 -
• With regard to the labour market, as against an assumption of no change in participation rates in thebaseline, the “EPC” scenario assumes an increase in EU participation rates of 4 percentage points andthat structural unemployment in the EU will fall by 2 percentage points compared with 2000.
• On the question of replacement rates, as referred to earlier, the EPC projects a significant fall in thegenerosity of the pension system over the next 50 years, with the benefit ratio expected to reduce theincrease in EU pension expenditure by 2 ¾ percentage points. It should also be reiterated that thisdecline in generosity in the EPC scenario does not appear to be due to new policy reform decisionsbut reflects more the current policy situation that most countries apply pension indexationmechanisms which amount to less than full real wage indexation. In terms of the ageing model, thisEPC assumption regarding generosity would be equivalent to a drop in the net replacement ratio forEU-15 from 74 per cent in 2000 to about 58 per cent in 2050.
Graph 3: Pension expenditure impact of ageing in EU-15 (2000-50)
8
10
12
14
16
18
20
2000 2010 2020 2030 2040 2050
Source: Commission services.
Baseline scenario EPC scenario
%
When the above labour market and benefit changes were introduced in the model the change in pensionexpenditure over the period to 2050 was reduced from an increase of 7 percentage points in the baselineto 3 ¾ percentage points and the overall loss in terms of living standards (GDP per capita) due to ageingpopulations was cut to 9 per cent compared with a decline of 19 per cent in the baseline (see Graphs 3and 4). While it is not possible to compare the GDP loss produced by the model with anything equivalentfrom the EPC’s work, it is feasible to get a rough indication of the budgetary impact of the respectivelabour market and pension generosity assumptions. In this regard, the budgetary gain from running theEPC changes through the ageing model works out at approximately a halving of the pension expenditurecosts of ageing, with this estimate of the fiscal gain being very similar to the estimates produced by theEPC using the national models of the individual Member States.39 Consequently, in terms of pension
39 Using Eurostat’s latest demographic forecasts there is a sharp upward movement in the old age dependency ratio over theperiod 2000-2050. On the basis of the national models used for the EPC’s analysis, this rise in the dependency ratio isforecast to increase pension expenditure by nearly 6 ½ percentage points over the next 50 years. Using a slightly differentdefinition of the old age dependency ratio but one which nevertheless produces a similar absolute change in the ratio overthe period 2000-50 to that used by the EPC, the ageing model forecasts an increase in pension expenditure of 7 percentagepoints over the same period. These increases are expected to be reduced significantly on the assumption that the EPC’slabour market changes and pension generosity reductions are introduced, with the national models used by the EPCpredicting that the pension expenditure increase will be roughly halved to an increase of about 3 percentage points and with

REFORMS OF PENSION SYSTEMS IN THE EU : AN ANALYSIS OF THE POLICY OPTIONS
- 195 -
expenditure projections, the model’s parameter settings would appear to be realistic, with the modelthereby constituting a credible framework for pension reform analysis, at least at the aggregate EU level.
Table 6: “EPC” scenario1
Growth Budgetary Impact Income Distribution
GDP per
capita
Social
security
contributions
(% of Wages)
Public pension
expenditure
(% of GDP)
Working age
population
consumption
Pensioners
consumption
2000 0 16.1 10.5 0 0
2030 -4.6 19.8 12.9 -2.0 -16.6
2050 -9.2 21.7 14.2 -5.1 -21.2
Source: Commission services.1 Compared with a technical scenario where no “ageing” is assumed i.e. the population trends evident in the most recent decadesare simply extrapolated forward.
Finally, while it is clear that the EPC scenario, which in effect summarises the labour market and pensiongenerosity assumptions already introduced or in the pipeline in the Member States, will have largebudgetary and growth consequences over the coming decades, it is important to understand the specificnature of the effects. In this regard, the impact of the individual reforms are very different, with thereduction in the generosity of the pension system providing 80 per cent of the gain in terms of the publicfinances but only about 20 per cent of the improvement in growth whereas the opposite is discernible forthe labour market reforms. The budgetary impact of the latter reforms is small with any gains in terms of alarger taxable base being offset by increases in the pension eligibility ratio. On the basis of the EPC’s owndecomposition of the source of the budgetary gain it is clear that the net effect of the labour marketreforms will be equivalent to only about half a percentage point off the increase in pension expenditure,with the ageing model suggesting a slightly higher reduction of ¾ of a percentage point. However, withregard to the growth impact, the participation and structural unemployment improvements will deliver 80per cent of the gain in living standards relative to the baseline scenario.
Graph 4: GDP impact of ageing in EU (2000-50)
-20
-15
-10
-5
0
5
10
2000 2010 2020 2030 2040 2050
Source: Commission services.
Baseline scenario
"EPC" scenario
%Positive over the next decade due to labour market reforms.
ECFIN’s ageing model suggesting an increase of 3 ¾ percentage points compared with the dependency ratio-inducedincrease of 7 percentage points if none of the EPC changes are introduced.

REFORMS OF PENSION SYSTEMS IN THE EU : AN ANALYSIS OF THE POLICY OPTIONS
- 196 -
4.3 EMPIRICAL ASSESSMENT OF INDIVIDUAL PENSION REFORM OPTIONS
USING THE AGEING MODEL
The simulation results in sub-section 4.2 suggest the possibility of a substantial degree of success forpolicy makers in terms of easing future fiscal and growth concerns if all the “EPC” labour market reformsand generosity changes are successfully introduced. In addition, this last sub-section succinctly underlinedthe difficulty of introducing pension related reforms, which simultaneously ease the budgetary andeconomic consequences of ageing populations. Sub-section 4.3 will examine in more detail the variouspension reform options available to governments as they struggle to cope with shrinking labour forces andthe growing number of elderly in the total population.
Amongst the questions to be addressed are the following :
• Should Member States consider further “parametric” reforms, in addition to those referred to in the“EPC” scenario, such as increases in the effective retirement age, or go for more ambitious systemicreforms?
• What criteria should be adopted by policy makers in deciding which of the reform options should beultimately introduced?
This present section will try to answer these questions by assessing the individual reforms referred toearlier in the paper in the context of a range of policy objectives, thereby establishing the relative potencyof the various options. In this way it is hoped to have a more complete evaluation of the implications ofthe various pension reform choices available to governments, avoiding a narrow focus on just one singleobjective such as, for example, the budgetary gain. In fact, all of the various pension reforms presented inthis section will be assessed from the perspective of the following policy objectives:
• economic growth;
• budgetary sustainability; and finally,
• distributional fairness (as measured by changes in income distribution between the working agepopulation and pensioners - in effect a measure of the political sustainability of any reformmeasures).
By using this multi-faceted assessment approach and in particular by extending the analysis to beyond thenormal measuring rod of budgetary issues, it is hoped to provide policy makers with a more completepicture of the implications of the different parametric and systemic pension reforms, with the variousscenarios being grouped under the following broad headings:
• Parametric reforms of the PAYG pension system: (1) reduction in generosity, (2) increase inthe effective retirement age, (3) a broad package of parametric reforms.
• Systemic reforms: (1) a complete shift from PAYG to a funded (i.e. accumulated assets) pensionsystem (2) mixed pension system - involving a partial shift to funding combined with a stabilisedPAYG system (i.e. 25 per cent Funded / 75 per cent PAYG).
4.3.1 Parametric reforms of the PAYG pension system to bring it back into equilibrium
In addition to labour market reforms which impact on the underlying fundamentals of a country’s pensionsystem, a large number of parametric reforms of the PAYG system itself are possible, with the followingparagraphs confining themselves to an examination of firstly the implications of a reduction in thegenerosity of the pension system and secondly the effects of an increase in the effective retirement age upto the statutory age of 65. At the end of this section an attempt is also made to summarise the overall
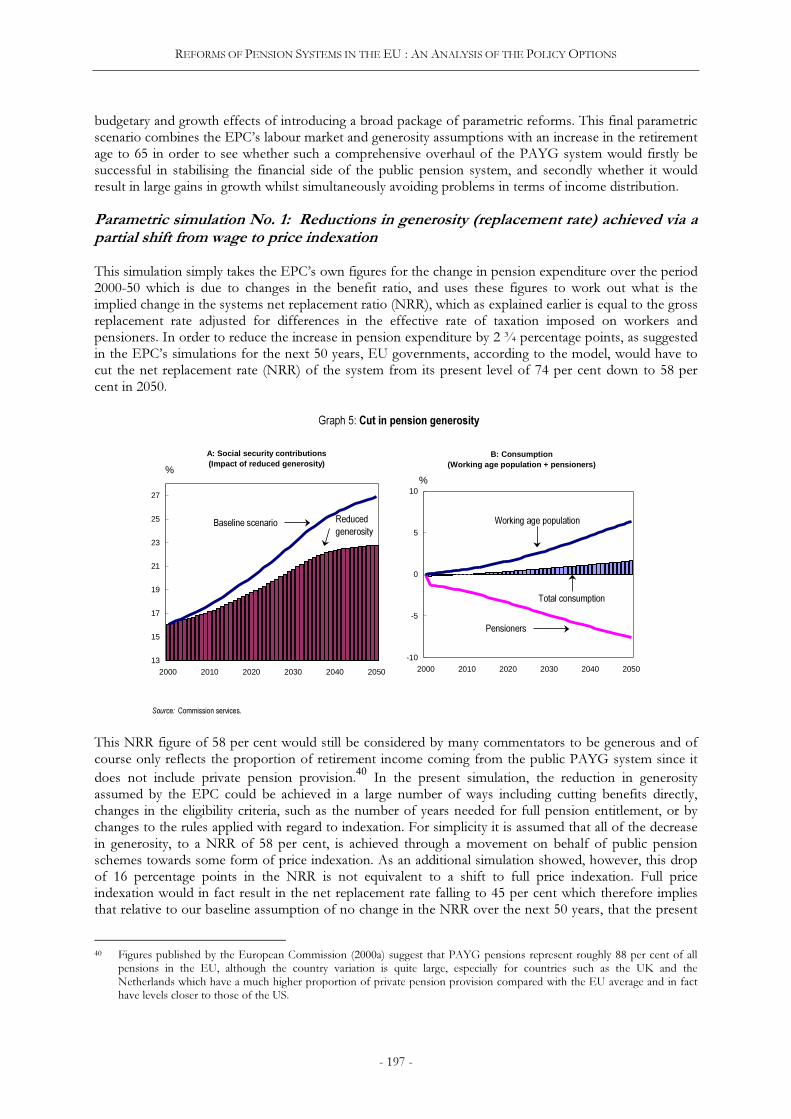
REFORMS OF PENSION SYSTEMS IN THE EU : AN ANALYSIS OF THE POLICY OPTIONS
- 197 -
budgetary and growth effects of introducing a broad package of parametric reforms. This final parametricscenario combines the EPC’s labour market and generosity assumptions with an increase in the retirementage to 65 in order to see whether such a comprehensive overhaul of the PAYG system would firstly besuccessful in stabilising the financial side of the public pension system, and secondly whether it wouldresult in large gains in growth whilst simultaneously avoiding problems in terms of income distribution.
Parametric simulation No. 1: Reductions in generosity (replacement rate) achieved via apartial shift from wage to price indexation
This simulation simply takes the EPC’s own figures for the change in pension expenditure over the period2000-50 which is due to changes in the benefit ratio, and uses these figures to work out what is theimplied change in the systems net replacement ratio (NRR), which as explained earlier is equal to the grossreplacement rate adjusted for differences in the effective rate of taxation imposed on workers andpensioners. In order to reduce the increase in pension expenditure by 2 ¾ percentage points, as suggestedin the EPC’s simulations for the next 50 years, EU governments, according to the model, would have tocut the net replacement rate (NRR) of the system from its present level of 74 per cent down to 58 percent in 2050.
Graph 5: Cut in pension generosity
A: Social security contributions(Impact of reduced generosity)
13
15
17
19
21
23
25
27
2000 2010 2020 2030 2040 2050
B: Consumption(Working age population + pensioners)
-10
-5
0
5
10
2000 2010 2020 2030 2040 2050
Pensioners
%
Working age population
Total consumption
%
Source: Commission services.
Baseline scenario Reduced
generosity
This NRR figure of 58 per cent would still be considered by many commentators to be generous and ofcourse only reflects the proportion of retirement income coming from the public PAYG system since it
does not include private pension provision.40 In the present simulation, the reduction in generosity
assumed by the EPC could be achieved in a large number of ways including cutting benefits directly,changes in the eligibility criteria, such as the number of years needed for full pension entitlement, or bychanges to the rules applied with regard to indexation. For simplicity it is assumed that all of the decreasein generosity, to a NRR of 58 per cent, is achieved through a movement on behalf of public pensionschemes towards some form of price indexation. As an additional simulation showed, however, this dropof 16 percentage points in the NRR is not equivalent to a shift to full price indexation. Full priceindexation would in fact result in the net replacement rate falling to 45 per cent which therefore impliesthat relative to our baseline assumption of no change in the NRR over the next 50 years, that the present
40 Figures published by the European Commission (2000a) suggest that PAYG pensions represent roughly 88 per cent of allpensions in the EU, although the country variation is quite large, especially for countries such as the UK and theNetherlands which have a much higher proportion of private pension provision compared with the EU average and in facthave levels closer to those of the US.
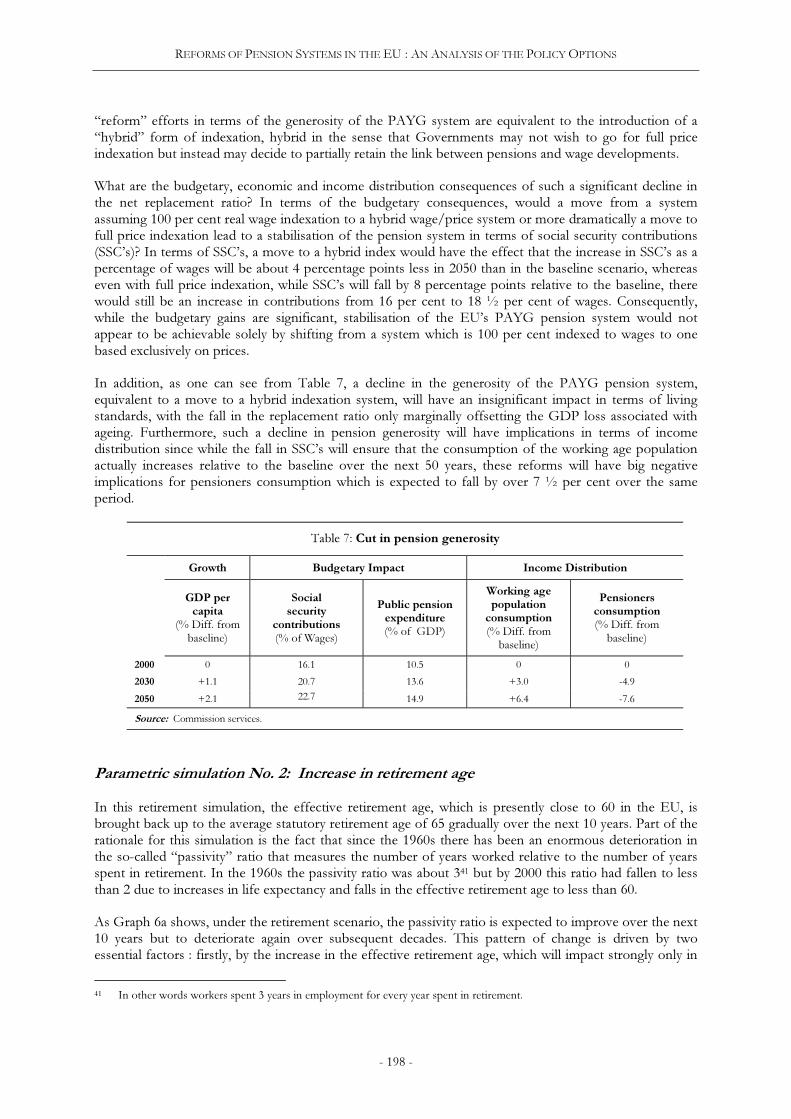
REFORMS OF PENSION SYSTEMS IN THE EU : AN ANALYSIS OF THE POLICY OPTIONS
- 198 -
“reform” efforts in terms of the generosity of the PAYG system are equivalent to the introduction of a“hybrid” form of indexation, hybrid in the sense that Governments may not wish to go for full priceindexation but instead may decide to partially retain the link between pensions and wage developments.
What are the budgetary, economic and income distribution consequences of such a significant decline inthe net replacement ratio? In terms of the budgetary consequences, would a move from a systemassuming 100 per cent real wage indexation to a hybrid wage/price system or more dramatically a move tofull price indexation lead to a stabilisation of the pension system in terms of social security contributions(SSC’s)? In terms of SSC’s, a move to a hybrid index would have the effect that the increase in SSC’s as apercentage of wages will be about 4 percentage points less in 2050 than in the baseline scenario, whereaseven with full price indexation, while SSC’s will fall by 8 percentage points relative to the baseline, therewould still be an increase in contributions from 16 per cent to 18 ½ per cent of wages. Consequently,while the budgetary gains are significant, stabilisation of the EU’s PAYG pension system would notappear to be achievable solely by shifting from a system which is 100 per cent indexed to wages to onebased exclusively on prices.
In addition, as one can see from Table 7, a decline in the generosity of the PAYG pension system,equivalent to a move to a hybrid indexation system, will have an insignificant impact in terms of livingstandards, with the fall in the replacement ratio only marginally offsetting the GDP loss associated withageing. Furthermore, such a decline in pension generosity will have implications in terms of incomedistribution since while the fall in SSC’s will ensure that the consumption of the working age populationactually increases relative to the baseline over the next 50 years, these reforms will have big negativeimplications for pensioners consumption which is expected to fall by over 7 ½ per cent over the sameperiod.
Table 7: Cut in pension generosity
Growth Budgetary Impact Income Distribution
GDP per
capita
(% Diff. frombaseline)
Social
security
contributions
(% of Wages)
Public pension
expenditure
(% of GDP)
Working age
population
consumption
(% Diff. frombaseline)
Pensioners
consumption
(% Diff. frombaseline)
2000 0 16.1 10.5 0 0
2030 +1.1 20.7 13.6 +3.0 -4.9
2050 +2.1 22.7 14.9 +6.4 -7.6
Source: Commission services.
Parametric simulation No. 2: Increase in retirement age
In this retirement simulation, the effective retirement age, which is presently close to 60 in the EU, isbrought back up to the average statutory retirement age of 65 gradually over the next 10 years. Part of therationale for this simulation is the fact that since the 1960s there has been an enormous deterioration inthe so-called “passivity” ratio that measures the number of years worked relative to the number of yearsspent in retirement. In the 1960s the passivity ratio was about 341 but by 2000 this ratio had fallen to lessthan 2 due to increases in life expectancy and falls in the effective retirement age to less than 60.
As Graph 6a shows, under the retirement scenario, the passivity ratio is expected to improve over the next10 years but to deteriorate again over subsequent decades. This pattern of change is driven by twoessential factors : firstly, by the increase in the effective retirement age, which will impact strongly only in
41 In other words workers spent 3 years in employment for every year spent in retirement.
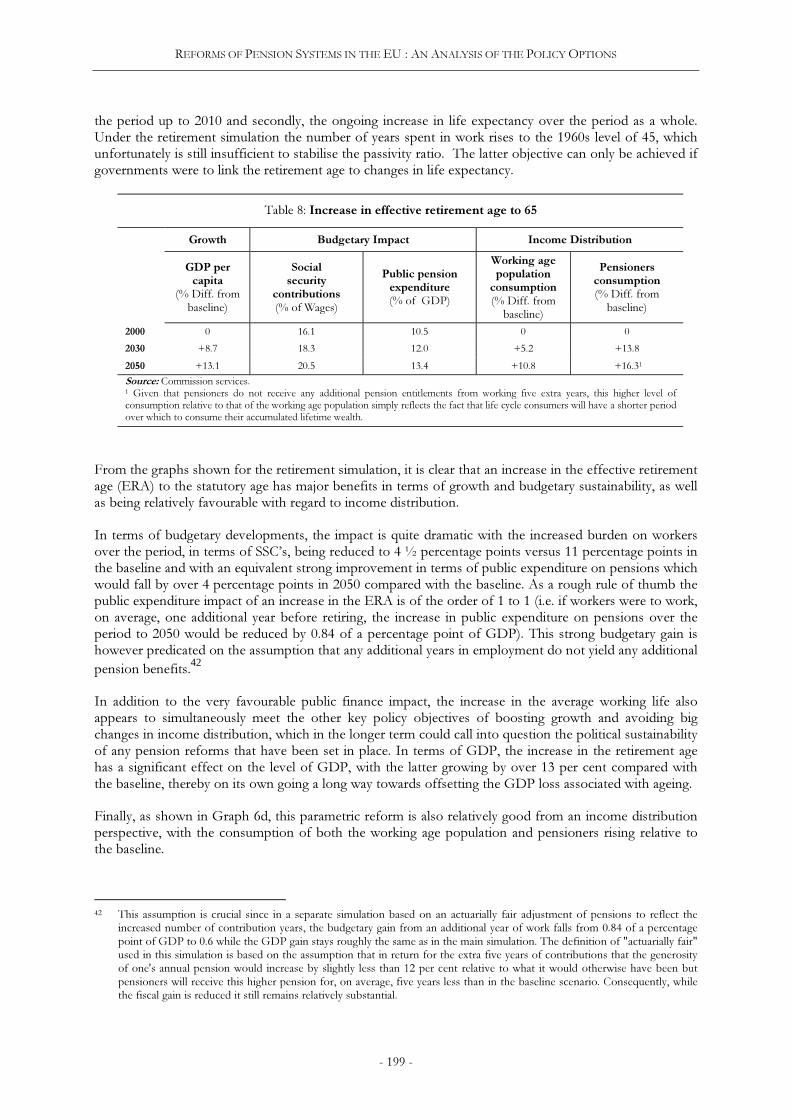
REFORMS OF PENSION SYSTEMS IN THE EU : AN ANALYSIS OF THE POLICY OPTIONS
- 199 -
the period up to 2010 and secondly, the ongoing increase in life expectancy over the period as a whole.Under the retirement simulation the number of years spent in work rises to the 1960s level of 45, whichunfortunately is still insufficient to stabilise the passivity ratio. The latter objective can only be achieved ifgovernments were to link the retirement age to changes in life expectancy.
Table 8: Increase in effective retirement age to 65
Growth Budgetary Impact Income Distribution
GDP per
capita
(% Diff. frombaseline)
Social
security
contributions
(% of Wages)
Public pension
expenditure
(% of GDP)
Working age
population
consumption
(% Diff. frombaseline)
Pensioners
consumption
(% Diff. frombaseline)
2000 0 16.1 10.5 0 0
2030 +8.7 18.3 12.0 +5.2 +13.8
2050 +13.1 20.5 13.4 +10.8 +16.31
Source: Commission services.1 Given that pensioners do not receive any additional pension entitlements from working five extra years, this higher level ofconsumption relative to that of the working age population simply reflects the fact that life cycle consumers will have a shorter periodover which to consume their accumulated lifetime wealth.
From the graphs shown for the retirement simulation, it is clear that an increase in the effective retirementage (ERA) to the statutory age has major benefits in terms of growth and budgetary sustainability, as wellas being relatively favourable with regard to income distribution.
In terms of budgetary developments, the impact is quite dramatic with the increased burden on workersover the period, in terms of SSC’s, being reduced to 4 ½ percentage points versus 11 percentage points inthe baseline and with an equivalent strong improvement in terms of public expenditure on pensions whichwould fall by over 4 percentage points in 2050 compared with the baseline. As a rough rule of thumb thepublic expenditure impact of an increase in the ERA is of the order of 1 to 1 (i.e. if workers were to work,on average, one additional year before retiring, the increase in public expenditure on pensions over theperiod to 2050 would be reduced by 0.84 of a percentage point of GDP). This strong budgetary gain ishowever predicated on the assumption that any additional years in employment do not yield any additional
pension benefits.42
In addition to the very favourable public finance impact, the increase in the average working life alsoappears to simultaneously meet the other key policy objectives of boosting growth and avoiding bigchanges in income distribution, which in the longer term could call into question the political sustainabilityof any pension reforms that have been set in place. In terms of GDP, the increase in the retirement agehas a significant effect on the level of GDP, with the latter growing by over 13 per cent compared withthe baseline, thereby on its own going a long way towards offsetting the GDP loss associated with ageing.
Finally, as shown in Graph 6d, this parametric reform is also relatively good from an income distributionperspective, with the consumption of both the working age population and pensioners rising relative tothe baseline.
42 This assumption is crucial since in a separate simulation based on an actuarially fair adjustment of pensions to reflect theincreased number of contribution years, the budgetary gain from an additional year of work falls from 0.84 of a percentagepoint of GDP to 0.6 while the GDP gain stays roughly the same as in the main simulation. The definition of "actuarially fair"used in this simulation is based on the assumption that in return for the extra five years of contributions that the generosityof one's annual pension would increase by slightly less than 12 per cent relative to what it would otherwise have been butpensioners will receive this higher pension for, on average, five years less than in the baseline scenario. Consequently, whilethe fiscal gain is reduced it still remains relatively substantial.

REFORMS OF PENSION SYSTEMS IN THE EU : AN ANALYSIS OF THE POLICY OPTIONS
- 200 -
Graph 6: Retirement scenario - increase in the effective retirement
age to the statutory level of 65
A: Passivity ratio: Number of years spent
working versus spent in retirement
1.0
1.5
2.0
2.5
3.0
3.5
4.0
4.5
5.0
2000 2010 2020 2030 2040 2050
Baseline scenario
Retirement simulation
B: Public pension expenditure
(% of GDP)
0
2
4
6
8
10
12
14
2000 2010 2020 2030 2040 2050
%
C: GDP effect of increasing the effective
retirement age
(relative to the baseline scenario)
0
2
4
6
8
10
12
14
2000 2010 2020 2030 2040 2050
%
D: Retirement scenario - Consumption
(relative to baseline scenario)
-5
0
5
10
15
20
2000 2010 2020 2030 2040 2050
%
Pensioners
Working age population
Total consumption
Source: Commission services.
Average passivity ratio in 1960's
Ratio
Parametric simulation No 3: Stabilising the PAYG pension system through a broad
package of parametric reforms : (“EPC” Scenario + an increase in the retirement age)
What is required to restore equilibrium to the PAYG system? There are many possible ways to measureequilibrium in the PAYG system but one of the most commonly adopted in the literature and also one ofthe most intuitive is a stable contribution rate (i.e. SSC’s as a percentage of wages do not change overtime). As discussed earlier, the equilibrium PAYG contribution rate under the “EPC” scenario of labourmarket reforms and reductions in pension generosity will not be stabilised, with SSC’s expected to growby about 5 ½ percentage points, from around 16 per cent to 21 ½ per cent over the next 50 years. Asmentioned previously, while the labour market reforms will undoubtedly ease the decline in livingstandards, such reforms unfortunately do relatively little in terms of reducing the budgetary impact ofageing. On the other hand, while it is clear that the reduction of more than 20 per cent in the netreplacement rate of the PAYG system, which underpins the EPC’s pension expenditure projections, willdo little to ease the GDP loss associated with ageing, it will significantly help the financial position of thePAYG system. Nevertheless, this reduction in the generosity of the system is still not sufficient to bringthe system back into financial equilibrium. Consequently, it is clear that additional reforms are necessary to
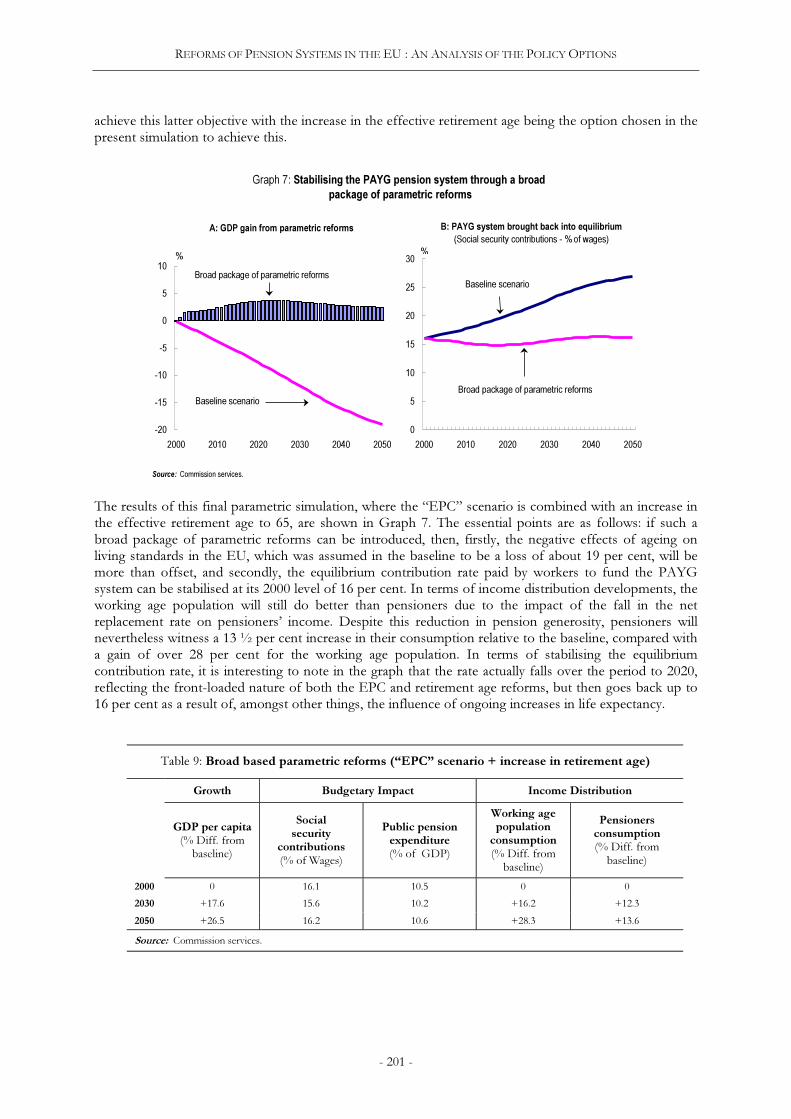
REFORMS OF PENSION SYSTEMS IN THE EU : AN ANALYSIS OF THE POLICY OPTIONS
- 201 -
achieve this latter objective with the increase in the effective retirement age being the option chosen in thepresent simulation to achieve this.
A: GDP gain from parametric reforms
-20
-15
-10
-5
0
5
10
2000 2010 2020 2030 2040 2050
%
B: PAYG system brought back into equilibrium
(Social security contributions - % of wages)
0
5
10
15
20
25
30
2000 2010 2020 2030 2040 2050
Baseline scenario
Broad package of parametric reforms
%
Graph 7: Stabilising the PAYG pension system through a broad
package of parametric reforms
Source: Commission services.
Broad package of parametric reforms
Baseline scenario
The results of this final parametric simulation, where the “EPC” scenario is combined with an increase inthe effective retirement age to 65, are shown in Graph 7. The essential points are as follows: if such abroad package of parametric reforms can be introduced, then, firstly, the negative effects of ageing onliving standards in the EU, which was assumed in the baseline to be a loss of about 19 per cent, will bemore than offset, and secondly, the equilibrium contribution rate paid by workers to fund the PAYGsystem can be stabilised at its 2000 level of 16 per cent. In terms of income distribution developments, theworking age population will still do better than pensioners due to the impact of the fall in the netreplacement rate on pensioners’ income. Despite this reduction in pension generosity, pensioners willnevertheless witness a 13 ½ per cent increase in their consumption relative to the baseline, compared witha gain of over 28 per cent for the working age population. In terms of stabilising the equilibriumcontribution rate, it is interesting to note in the graph that the rate actually falls over the period to 2020,reflecting the front-loaded nature of both the EPC and retirement age reforms, but then goes back up to16 per cent as a result of, amongst other things, the influence of ongoing increases in life expectancy.
Table 9: Broad based parametric reforms (“EPC” scenario + increase in retirement age)
Growth Budgetary Impact Income Distribution
GDP per capita
(% Diff. frombaseline)
Social
security
contributions
(% of Wages)
Public pension
expenditure
(% of GDP)
Working age
population
consumption
(% Diff. frombaseline)
Pensioners
consumption
(% Diff. frombaseline)
2000 0 16.1 10.5 0 0
2030 +17.6 15.6 10.2 +16.2 +12.3
2050 +26.5 16.2 10.6 +28.3 +13.6
Source: Commission services.

REFORMS OF PENSION SYSTEMS IN THE EU : AN ANALYSIS OF THE POLICY OPTIONS
- 202 -
4.3.2 Systemic reforms : Complete shift from PAYG to a funded pension system VMixed System (25 per cent Funding/75 per cent PAYG)
Before going on to present the specific systemic reform simulations, it is important to briefly discuss twocrucial factors in determining the desirability and extent of any systemic reforms to be implemented,namely what will happen to the internal rates of return (IRR) of both the PAYG and funded systems overthe next 50 years and secondly what is the likely size of the transition burden associated with a scrappingor significant shift away from the PAYG system in favour of a funded alternative.
Forecasts for the internal rates of return of the PAYG and funded systems 2000-50
Evolution of the Internal Rate of Return (IRR) of a funded system 2000-50 – The effect of ageingon the real interest rate is difficult to predict a priori, since while the direction of change for some of thekey determining factors can be predicted, this is clearly not the case with all of the concerned variables,thereby introducing a large element of uncertainty regarding the future evolution of real returns. However,while accepting the high degree of uncertainty surrounding the direction of change for real interest ratesdue to ageing, the baseline scenario for the EU produced by the model predicts that the real return onpension fund assets over the next fifty years will fall but not dramatically so. Real interest rates decline byonly a ¼ of a percentage point between 2000 and 2050, with this estimate being consistent with similarestimates produced by Brooks (2000) and Borsch-Supan (2001).
In the baseline simulation, while the overall supply of savings does decline due to ageing, this does notlead to an increase in the real interest rate since the demand for savings, in the form of investment, falls byeven more, reflecting the fact that less capital is required for a declining population. The low interest rateeffect emanating from the OLG (i.e. overlapping generations) model used for this chapter’s simulationsessentially reflects the fact that ageing is increasingly been driven by steady increases in life expectancyrather than ongoing falls in the birth rate. These demographic changes ensure that the interest rate effectis muted since the group of pensioners is growing relative to the working age population and consequentlythe savings pool is falling since the fraction of dissavers (pensioners) to savers (working age population) isrising. At a wider level this real interest rate result is also credible if one believes in the benefits ofinvestment portfolio diversification at the global level in terms of its effects in maintaining relatively highreal returns over the coming decades.
Evolution of the Internal Rate of Return (IRR) of the PAYG system 2000-50 – The IRR of thePAYG system is often proxied by real wage growth or real GDP growth although the most correctmeasure is the growth of the real wage bill (i.e. the taxable base). With regard to real wages, the modelexpects the latter to grow at an annual average rate of a little over 2 per cent over the period, which issomewhat higher than in the past, in order to reflect a premium for the growing scarcity of labour overthe simulation horizon. This result is also of course consistent with the assumption that ageing will lead tocapital deepening (i.e. more capital per worker), which in turn leads to higher labour productivity andconsequently to higher real wages. As can be seen from Graph 8, in terms of the real wage bill, while realwages will grow at a slightly faster rate compared with the last 10-20 years, this rate of increase will not besufficient to stop the growth of the real wage bill declining in relative terms since overall employment isdue to fall over the next 50 years.
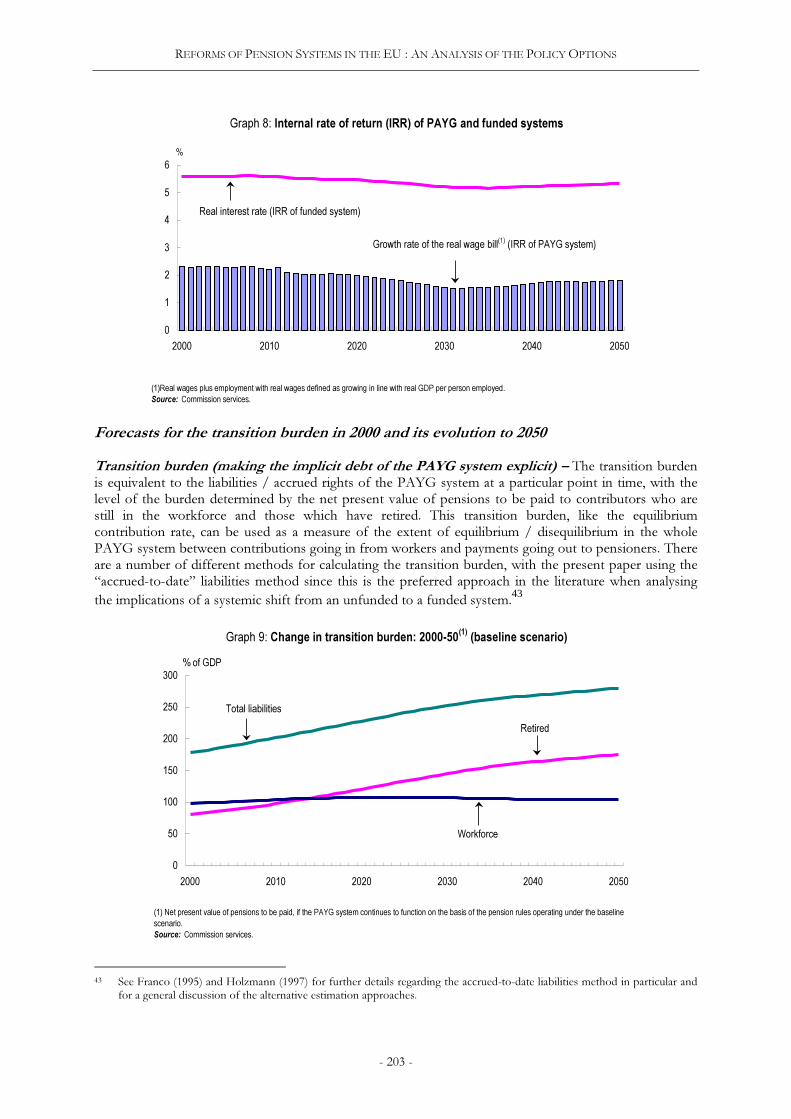
REFORMS OF PENSION SYSTEMS IN THE EU : AN ANALYSIS OF THE POLICY OPTIONS
- 203 -
0
1
2
3
4
5
6
2000 2010 2020 2030 2040 2050
%
Growth rate of the real wage bill(1) (IRR of PAYG system)
Graph 8: Internal rate of return (IRR) of PAYG and funded systems
(1)Real wages plus employment with real wages defined as growing in line with real GDP per person employed.
Source: Commission services.
Real interest rate (IRR of funded system)
Forecasts for the transition burden in 2000 and its evolution to 2050
Transition burden (making the implicit debt of the PAYG system explicit) – The transition burdenis equivalent to the liabilities / accrued rights of the PAYG system at a particular point in time, with thelevel of the burden determined by the net present value of pensions to be paid to contributors who arestill in the workforce and those which have retired. This transition burden, like the equilibriumcontribution rate, can be used as a measure of the extent of equilibrium / disequilibrium in the wholePAYG system between contributions going in from workers and payments going out to pensioners. Thereare a number of different methods for calculating the transition burden, with the present paper using the“accrued-to-date” liabilities method since this is the preferred approach in the literature when analysing
the implications of a systemic shift from an unfunded to a funded system.43
0
50
100
150
200
250
300
2000 2010 2020 2030 2040 2050
% of GDP
Workforce
Graph 9: Change in transition burden: 2000-50(1) (baseline scenario)
(1) Net present value of pensions to be paid, if the PAYG system continues to function on the basis of the pension rules operating under the baseline
scenario.
Source: Commission services.
Total liabilities
Retired
43 See Franco (1995) and Holzmann (1997) for further details regarding the accrued-to-date liabilities method in particular andfor a general discussion of the alternative estimation approaches.
REFORMS OF PENSION SYSTEMS IN THE EU : AN ANALYSIS OF THE POLICY OPTIONS
- 204 -
Transition burden (indicator of equilibrium in the PAYG system) – To show how this concept ofthe transition burden can be used as an equilibrium indicator for the PAYG system as a whole, Graphs 9and 10 show the change in the transition burden under both the baseline and under the alternativescenario of a broad package of parametric reforms (i.e. parametric simulation No. 3), where the EPCreforms have been introduced and the effective retirement age has been increased to the statutory age of65. A number of points are evident from the graphs :
• The EU-15 as a whole has a large implicit debt burden in its PAYG system with the baseline assuminga figure of the order of 180 per cent of GDP in 2000. While comparable estimates of the EU’s PAYGdebt burden do not exist, van den Noord and Herd (1993) produced estimates for the pensionliabilities of the four largest EU Member States, with estimates for the year 1990 ranging from 156 percent for the UK to 242 per cent for Italy. A simple average for these four EU countries (used as aproxy for the average of the EU-15 as a whole) suggests an overall burden of around 190 per cent in1990, with equivalent figures for the same year using the methodology adopted in the present paperpointing to a figure of 160 per cent. Such differences are not surprising however since a directcomparison between the two sets of results is not possible given differences in terms of a number ofcrucial assumptions between the present study and the van den Noord and Herd analysis, includingdifferences regarding the effective retirement age, the level of the replacement ratio, the pensionindexation method and finally the discount rate. While a number of other studies have addressed thisissue of the implicit pension debt of the PAYG system, such as Kane and Palacios (1996) andHolzmann (1997), unfortunately in terms of providing alternative estimates for the level of the EU’simplicit debt, both of the latter papers mainly use the 1993 figures from van den Noord and Herd asthe basis for their analysis.
• As Graph 9 clearly indicates, the transition burden in the baseline scenario continues to rise from 180per cent of GDP in 2000 to 280 per cent in 2050. As against this, however, if one examines the“EPC” scenario, while the present set of EPC reforms do not result in a stabilisation of the transitionburden, the reforms have at least the effect of slowing down the degree of financial deterioration inthe PAYG system, when one compares the model results from 2000 up to 2050 compared with thedeterioration experienced over the 1970-2000 period. Part of the reason for the failure of thesereforms to stabilise the situation reflects the fact that while the economic gains from increasing theemployment ratio through increases in participation rates and falls in structural unemployment aresignificant, the budgetary benefits of increasing the employment ratio are not as striking since, asdiscussed earlier, these are partially offset by increases in the eligibility ratio.
• Finally, from Graph 10 it can be discerned that the “EPC” reforms, allied to an increase in theeffective retirement age up to the statutory age, does result in an effective stabilisation of thetransition burden and consequently a prolongation of the average working life appears to be anecessary complement to the EPC reforms in order to bring the PAYG system back into equilibrium.In addition, even with such a large package of parametric reforms one can see clearly from the graphthat the transition burden is displaying a small, yet clear, upward momentum in the period up to 2050reflecting the effects of ongoing increases in life expectancy. Consequently, if policy makers wish tokeep the PAYG system in equilibrium over time then the retirement age will have to be adjustedperiodically for changes in life expectancy.

REFORMS OF PENSION SYSTEMS IN THE EU : AN ANALYSIS OF THE POLICY OPTIONS
- 205 -
0
50
100
150
200
250
300
2000 2010 2020 2030 2040 2050
% of GDP
Total liabilities
(Broad package of parametric reforms)
Graph 10: Transition burden
(impact of broad package of parametric reforms)
Source: Commission services.
Total liabilities (Baseline scenario)
Systemic simulation No. 1: Immediate 100 per cent switch to a fully funded pensionsystem in 2000 + allowance for transition costs to a funded approach
In this first systemic scenario, the impact of an immediate 100 per cent switch to a fully funded pensionsystem is simulated, with the PAYG system abolished completely in the year 2000, and with the accruedrights (i.e. the transition burden) built up under the latter system fully taken into account. While it couldbe argued that it would be more realistic to abolish the PAYG system over a period of decades rather thanimmediately, the underlying explanatory variables would not change. Consequently, the purpose of thepresent simulation is simply to illustrate the main mechanisms at work using as simplified a framework aspossible.
There are a number of alternative approaches to present such an illustrative scenario but the one preferredhere is in terms of the costs to workers of making the transition since it is the latter group which will befaced with the so-called “double” burden. This “double” burden is imposed on the generation that decidesto make the switch to a fully-funded system, with workers having to fund not only their own pensionsunder the new system but also having to continue to finance, through some form of taxation or socialsecurity contributions, the pensions of those who retired under the PAYG system as well as part of thefuture pensions of existing workers who had built up rights in the previous system.
As can be seen from Graph 11a the overall pension contribution rate for workers is therefore made up oftwo separate components:
• firstly, a component which is essentially a mandatorily imposed form of savings, with the latter savingsbeing placed by workers in a private or government controlled pension fund,44 and
44 Since this simulation is purely illustrative, there are a number of simplifications introduced. Firstly, while such a mandatorilyimposed form of retirement savings would, in practice, undoubtedly be implemented with the help of government taxincentives or subsidies, this extra cost is not allowed for here. Secondly, the contentious issues of both the relatively highadministration costs associated with funded pension schemes and the issue of replacing a defined benefit (DB) PAYGsystem with a defined contribution (DC) funded approach is to a certain extent avoided in this simulation exercise. Boththese latter concerns can be excluded from the explanation, for ease of exposition, by modelling this shift to funding throughthe use of a perfectly competitive annuities market where the contributor and the pension fund operator basically enter intoa formal contract where a net replacement rate is agreed and the required annual contribution rates (as a percentage of
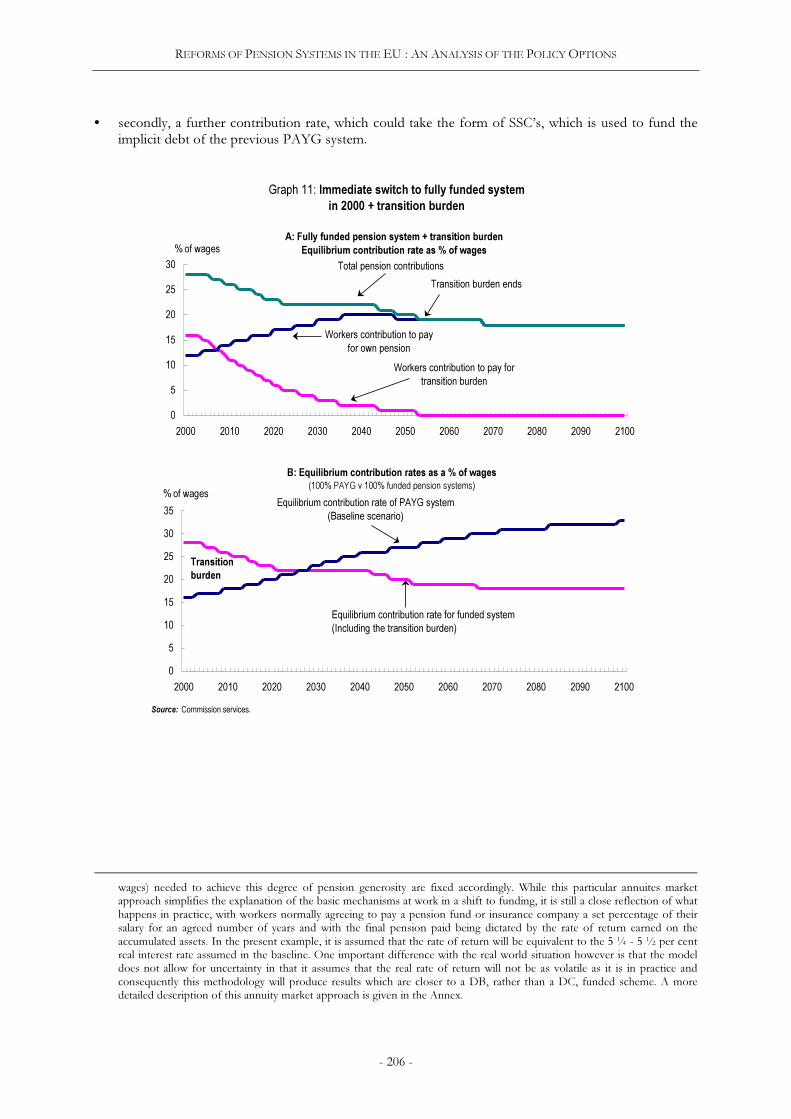
REFORMS OF PENSION SYSTEMS IN THE EU : AN ANALYSIS OF THE POLICY OPTIONS
- 206 -
• secondly, a further contribution rate, which could take the form of SSC’s, which is used to fund theimplicit debt of the previous PAYG system.
A: Fully funded pension system + transition burden
Equilibrium contribution rate as % of wages
0
5
10
15
20
25
30
2000 2010 2020 2030 2040 2050 2060 2070 2080 2090 2100
Workers contribution to pay for
transition burden
Workers contribution to pay
for own pension
B: Equilibrium contribution rates as a % of wages
(100% PAYG v 100% funded pension systems)
0
5
10
15
20
25
30
35
2000 2010 2020 2030 2040 2050 2060 2070 2080 2090 2100
Equilibrium contribution rate of PAYG system
(Baseline scenario)
% of wages
Graph 11: Immediate switch to fully funded system
in 2000 + transition burden
Total pension contributions
Transition burden ends
Equilibrium contribution rate for funded system
(Including the transition burden)
Source: Commission services.
Transition
burden
% of wages
wages) needed to achieve this degree of pension generosity are fixed accordingly. While this particular annuites marketapproach simplifies the explanation of the basic mechanisms at work in a shift to funding, it is still a close reflection of whathappens in practice, with workers normally agreeing to pay a pension fund or insurance company a set percentage of theirsalary for an agreed number of years and with the final pension paid being dictated by the rate of return earned on theaccumulated assets. In the present example, it is assumed that the rate of return will be equivalent to the 5 ¼ - 5 ½ per centreal interest rate assumed in the baseline. One important difference with the real world situation however is that the modeldoes not allow for uncertainty in that it assumes that the real rate of return will not be as volatile as it is in practice andconsequently this methodology will produce results which are closer to a DB, rather than a DC, funded scheme. A moredetailed description of this annuity market approach is given in the Annex.
REFORMS OF PENSION SYSTEMS IN THE EU : AN ANALYSIS OF THE POLICY OPTIONS
- 207 -
As can be seen from the graph, the “savings” contribution rate for workers to fund their own pensionrises over the next number of decades before falling slightly and stabilising. This is a pattern which oneshould not find that surprising since it is based on a typical worker, making 40 years of contributions, at acontribution rate relative to wages which would give him a defined net replacement rate when he retireswhich is broadly equal to that of the PAYG system in 2000 (i.e. 74 per cent). Of course to be able to fixthe contribution rate the pension fund must assume a certain average real return / GDP growth rate overthe period of years to be covered. In the model this real return is set equal to the real interest rate which infact is very similar to the average pension fund returns achieved in a number of EU countries over the last35 years.45 However, the real rate of interest declines substantially over the transition period due to theabolition of the PAYG system and this decline in the rate of return, coupled with the ongoing increase inlife expectancy, is reflected in the upward movement in the equilibrium contribution rate for the fundedsystem over the initial 40 years of the 100 year period shown in the graph. It is interesting to remark thatfollowing 2050, the real interest rate starts to rise again reflecting the fact that the additional savingsgenerated over the transition period to a funded system start to be gradually unwound. This increase inthe real interest rate after the end of the transition period is shown in Graph 11a as a fall in theequilibrium contribution rate for the funded system. Finally, it should also be clear from the graph that ifboth life expectancy and the real interest rate remain constant then the ECR of the funded system alsoremains unchanged over the period in question.
As regards the contribution rate to cover the implicit debt of the PAYG system, as the graph shows, thisburden on workers declines gradually over the period until the last person under the previous system dies.This transition burden could of course be financed by instruments such as “recognition” bonds etc butgiven the magnitude of the implicit debt which would have to be made explicit in 2000 (i.e. of the order of180 per cent of GDP), efforts to simulate such a financing option proved impractical and consequentlyfinancing is assumed to occur through labour taxation i.e. SSC’s.
In broad terms what this simulation is saying, and as shown graphically in Graph 11b, is that the overallpension contribution burden on workers over the next number of decades under a funded pension systemwould initially (because of the “double” burden) be close to 12 percentage points higher, as a proportionof wages, than in the baseline PAYG system, with the burden easing gradually over the subsequent 25-30years until the combined contribution rate for the funded system, in other words the cost of the newpension system, would finally fall below that of the PAYG system. It is only when this cross-over pointoccurs that workers would see a gain from moving to a funded scheme, with the space in Graph 11bbetween the two lines which represent the 100 per cent PAYG and 100 per cent funded systems providinga clear graphical representation of the cost of moving to a fully funded approach, as measured by theadditional costs imposed on workers of the transition generation.
Furthermore, it should be underlined that the above scenario only allows for the transition burden ofmoving from the PAYG to a funded system. For some commentators this is not a sufficiently “realistic”scenario since in order to ensure that the comparison with the PAYG approach is a fair one, allowancemust also be made for additional costs often linked with the move to funding, namely the budgetary costsassociated with the government tax incentives or subsidies needed to boost the take up of fundedschemes, the high level of administration costs associated with such schemes relative to those of a
centralised system such as PAYG,46 and finally for the cost of an insurance scheme to underwrite the
defined contribution (DC) pension schemes since in this reform proposal one is replacing a definedretirement income under the PAYG system with a system which historically has returned higher, butmuch more volatile, returns. Consequently most DC schemes around the world have a system ofinsurance in operation to recognise the greater risk associated with DC schemes, with these insurance
45 According to research quoted in Miles and Timmermann (1999), the average return on a diversified portfolio of equities andbonds was of the order of 5 ¼ per cent in Europe over the 30 year period up to 1995 and the real interest rate in the modelis also of the order of 5 ¼ - 5 ½ per cent and consequently represents a good proxy for expected pension fund returns overthe next 50 years.
46 See for example Murthi, Orszag and Orszag (2001).

REFORMS OF PENSION SYSTEMS IN THE EU : AN ANALYSIS OF THE POLICY OPTIONS
- 208 -
instruments having the effect of smoothing out the volatility of returns, thereby limiting the potentiallosses which any individual could be faced with in a funded scheme. If one was to allow for the impact ofall these additional costs in terms of further reducing the internal rate of return differential in favour offunded schemes relative to the PAYG system, the transition burden or cost imposed on workers would besignificantly higher than that indicated in Graph 11b.47
In overall terms, therefore, while funded (i.e. investment based) schemes have a favourable returndifferential relative to the PAYG system,48 the size of the transition burden, in the form of the implicitdebt of the old PAYG system, coupled with any additional budgetary, administration and insuranceexpenses associated with the move to funding, is so high that even if the EU wished to completely scrapthe PAYG system it would not be feasible to do so given the unrealistically heavy burden placed on thegeneration of workers on which the transition is imposed. In addition, the gains in terms of GDP arerelatively limited - with a full shift to funding giving only an increase of a little over 5 per cent in levelterms relative to the baseline, thereby boosting the EU’s potential growth rate over the next 50 years by asmall, but nevertheless very welcome, 0.1 of a percentage point on an annual average basis. Bycomparison, the return from parametric reforms is substantially greater, with a GDP gain of over 26 percent relative to the baseline, which is equivalent to a boost to annual growth rates of ½ a percentage pointover the period 2000-50.
The growth implications of different types of pension reforms depend crucially on the following factors:
• Change in the effective labour force.
• Change in aggregate savings.
• Output elasticity of capital and labour.
The parametric reform package scores particularly high when one takes the first factor into account interms of the growth impact. Due to increases in both the retirement age and the labour force participationrate, coupled with a decline in the rate of structural unemployment, the effective labour force increasessignificantly under the broad based parametric reforms simulation. For the systemic reform simulationinvolving a 100 per cent move to funding, it is assumed that there is no change both with respect tolabour force participation, structural unemployment or the retirement age (i.e. no real economy reformsare introduced into the system).
With regard to the second growth promoting factor (i.e. savings), since the fraction of low saving retireesis reduced and that of the relatively high saving working age population is increased, aggregate nationalsaving increases under the broad based parametric reform option relative to the baseline. In the firstsystemic simulation the effects on aggregate savings are not as significant as one would imagine given thelarge increase in mandatory savings imposed on the wages of workers. This somewhat surprising savingseffect is due to a number of factors, including the fact that both existing and “new” pensioners (with high
47 Even if one accepts, after taking account of the additional costs mentioned in the text, that the positive return differential infavour of funded systems will persist over time, which is in fact a necessary condition for a dynamically efficient long rungrowth path, systemic reform in the EU aimed at exploiting this cost advantage will be complicated politically by the factthat allowing for the large transition debt burden inevitably means that at least one generation of workers must lose in anytransition process. In addition, the mechanics of any shift to funding need to be carefully examined in order to ensure thatthe natural benefits of funding are not partially or, in some cases, completely eroded.
48 It can be argued that the return differential is the only intrinsic difference between the PAYG and funded systems in an EUcontext since many of the other, often quoted, advantages of funded systems in terms of greater labour supply incentives etccan essentially be provided by the PAYG system by addressing existing design flaws such as the lack of a clear actuarial basislinking contributions to benefits. Reforms along these latter lines in countries such as Sweden and Italy, with their “notional”DC schemes underline the fact that it is the incentives built into the pension system which is important rather than thefinancing method per se. Such reforms will also hopefully help dispel the notion that social security contributions (SSC's)paid into a PAYG scheme are simply another form of taxation, compared with similar pension fund contributions which areclearly seen by workers as savings for retirement. Other suggested benefits of funded schemes such as aiding thedevelopment of financial markets are more difficult to assess and while benefits have been found in certain south americancountries it can be argued that any gains for a highly developed financial system, such as that which operates in the EU,would be of a substantially smaller order of magnitude.
REFORMS OF PENSION SYSTEMS IN THE EU : AN ANALYSIS OF THE POLICY OPTIONS
- 209 -
marginal propensities to consume) are not suffering any income loss in the shift to funding. Furthermore,there is no reduction in the share of pensioners in the overall population equivalent to that which occursin the broad based parametric reforms scenario (i.e. due to the increase in the effective retirement age). Asagainst this, the aggregate savings rate for the population as a whole clearly increases in the transitionphase to the creation of a funded system due to the sharp increase in the savings rate of workers whichboosts the overall savings of the population of working age.49
Finally, regarding the third growth factor mentioned earlier, the GDP effect of any additional capitalaccumulation depends crucially on its output elasticity and the effect of new investment on the rate oftechnical progress. While the growth effects emanating from the increase in the capital stock are takeninto account in both the parametric and systemic simulations, the possibility that this increase in thetechnical capacity of the economy would in turn impact on economy-wide productivity growth throughembodiment effects is excluded in these simulations. Allowing for this latter channel of“vintage”/efficiency effects would of course boost the growth effects from both the parametric reformsand from the move to funding.
Systemic simulation No. 2 : Mixed pension system (25 per cent shift to funding +parametric reforms to bring the PAYG system back into equilibrium)
Following on from the first systemic simulation and due to the transition problems with a full shift tofunding and the low GDP gain associated with such a move, an alternative systemic approach is describedin the final simulation which examines the possibility of a less radical partial move to funding, combinedwith a broad range of parametric reforms of the PAYG system itself. In this second systemic scenariotherefore a two-pronged pension reform strategy is tested, with firstly the PAYG system being broughtback into equilibrium through the introduction of the broad package of parametric reforms described inSimulation No. 3 in sub-section 4.3.1 (i.e. the “EPC” scenario + an increase in the retirement age) andsecondly, a partial move to funding is introduced in the model in order to avail of the higher historicalreturns which have been achieved by funding and which, on the basis of the simulations in this paper, arelikely to persist over the next 50 years. In simple terms therefore this simulation assesses the case forpension reforms, which try to retain or to exploit the natural advantages of both the PAYG and fundedpension systems.
In terms of bringing the PAYG system back into equilibrium, in operational terms this can be achieved bystabilising the transition burden (or equivalently the contribution rate), with a clear preference expressed inSimulation No.3 (sub-section 4.3.1) that this should be achieved through supplementing the EPC reformsby bringing the effective retirement age (ERA) back up to the statutory level. Indeed, an even boldermove should not be ruled out, namely to reduce the transition burden by delaying retirement until evenlater through, for example, linking the effective age of retirement to future changes in life expectancy.
49 It is important to be aware that there could be an additional factor at play in terms of reducing the savings and growthimpact from a move to funding which is linked to the way consumption is modelled. Consumers in the model are forwardlooking and find it optimal to smooth consumption over time. Once the decision is taken to set up the funded system andonce households realise that they are in effect building up a future stock of financial assets, their behaviour will changebecause of the associated wealth effects. These wealth effects are triggered by the fact that consumers perceive the createdfund as an increase in their permanent income and consequently households will start to spend a share of this futurefinancial wealth, with this additional consumption being financed from reduced levels of savings out of current income oreven by liquidating certain financial assets which they hold, other than of course the pension fund assets. While this wealtheffect is theoretically plausible the size of the effect is essentially an empirical issue. Other simulations which were carried outwith the model to see the sensitivity of the savings effects from varying the relative proportions in the model of wealth andliquidity constrained households (i.e. the proportion of consumers which base their consumption decisions on calculationsof lifetime wealth -human and financial wealth-versus those which essentially consume out of current income) suggest thatthe savings and growth effects could be increased significantly if a large share of households were deemed to be liquidityconstrained. In the case of a 100 per cent shift to funding, for example, plausible parameter settings suggest that the annualaverage growth rate effects could be increased from the 0.1 predicted in this study to as high as 0.2.
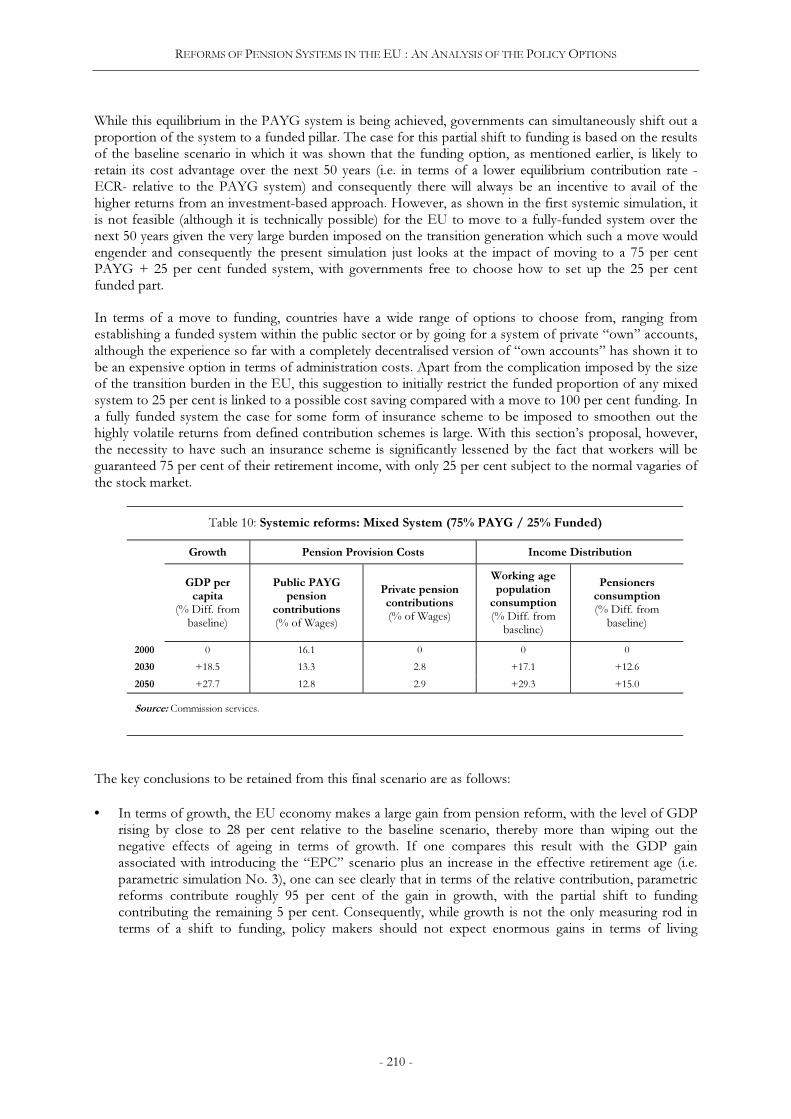
REFORMS OF PENSION SYSTEMS IN THE EU : AN ANALYSIS OF THE POLICY OPTIONS
- 210 -
While this equilibrium in the PAYG system is being achieved, governments can simultaneously shift out aproportion of the system to a funded pillar. The case for this partial shift to funding is based on the resultsof the baseline scenario in which it was shown that the funding option, as mentioned earlier, is likely toretain its cost advantage over the next 50 years (i.e. in terms of a lower equilibrium contribution rate -ECR- relative to the PAYG system) and consequently there will always be an incentive to avail of thehigher returns from an investment-based approach. However, as shown in the first systemic simulation, itis not feasible (although it is technically possible) for the EU to move to a fully-funded system over thenext 50 years given the very large burden imposed on the transition generation which such a move wouldengender and consequently the present simulation just looks at the impact of moving to a 75 per centPAYG + 25 per cent funded system, with governments free to choose how to set up the 25 per centfunded part.
In terms of a move to funding, countries have a wide range of options to choose from, ranging fromestablishing a funded system within the public sector or by going for a system of private “own” accounts,although the experience so far with a completely decentralised version of “own accounts” has shown it tobe an expensive option in terms of administration costs. Apart from the complication imposed by the sizeof the transition burden in the EU, this suggestion to initially restrict the funded proportion of any mixedsystem to 25 per cent is linked to a possible cost saving compared with a move to 100 per cent funding. Ina fully funded system the case for some form of insurance scheme to be imposed to smoothen out thehighly volatile returns from defined contribution schemes is large. With this section’s proposal, however,the necessity to have such an insurance scheme is significantly lessened by the fact that workers will beguaranteed 75 per cent of their retirement income, with only 25 per cent subject to the normal vagaries ofthe stock market.
Table 10: Systemic reforms: Mixed System (75% PAYG / 25% Funded)
Growth Pension Provision Costs Income Distribution
GDP per
capita
(% Diff. frombaseline)
Public PAYG
pension
contributions
(% of Wages)
Private pension
contributions
(% of Wages)
Working age
population
consumption
(% Diff. frombaseline)
Pensioners
consumption
(% Diff. frombaseline)
2000 0 16.1 0 0 0
2030 +18.5 13.3 2.8 +17.1 +12.6
2050 +27.7 12.8 2.9 +29.3 +15.0
Source: Commission services.
The key conclusions to be retained from this final scenario are as follows:
• In terms of growth, the EU economy makes a large gain from pension reform, with the level of GDPrising by close to 28 per cent relative to the baseline scenario, thereby more than wiping out thenegative effects of ageing in terms of growth. If one compares this result with the GDP gainassociated with introducing the “EPC” scenario plus an increase in the effective retirement age (i.e.parametric simulation No. 3), one can see clearly that in terms of the relative contribution, parametricreforms contribute roughly 95 per cent of the gain in growth, with the partial shift to fundingcontributing the remaining 5 per cent. Consequently, while growth is not the only measuring rod interms of a shift to funding, policy makers should not expect enormous gains in terms of living

REFORMS OF PENSION SYSTEMS IN THE EU : AN ANALYSIS OF THE POLICY OPTIONS
- 211 -
standards from simply adopting a different pension financing strategy since the final growth impact isessentially dictated by the increase achieved in terms of national savings.50
• In terms of the real interest rate, while this second systemic scenario experiences a decline in thereturns for pension funds, the reduction in the yield is not as severe as under the previous simulationinvolving a complete shift to funding.
• As the graph showing the total net replacement ratio indicates, the overall generosity of the system isassumed to fall over the period, with pension income under this final scenario coming from twosources, with the largest proportion, by definition, still coming through the PAYG system. In terms ofthe equilibrium contribution rates (ECR's) of the PAYG and funded systems, the latter are set at thelevels needed to maintain the 75/25 per cent distribution, on average, over the time horizon coveredby the simulation.
• In terms of the fiscal impact, this scenario is also very favourable, with reductions in both SSC’s andgovernment pension expenditure to levels well below those assumed under the baseline scenario.
• Finally, in terms of income distribution, this scenario can also be recommended, with pensionersincome as well as that of the working age population both showing significant increases over thesimulation horizon.
50 The importance of keeping the savings issue to the forefront of discussions needs to be underlined since this is the factorwhich will ultimately decide the success of a funded approach. While credible arguments can be made in favour of fundedschemes in terms of their potential benefits in terms of savings, unfortunately a review of the empirical literature in this areapoints to no conclusive evidence to this effect. In this regard the systemic simulations in this chapter have been carried out onthe assumption of a mandatory increase in the savings of workers to fund their own pensions with, unrealistically, noprovision for tax or interest rate incentives from governments which should of course be taken into account. An additionalsimulation with the model where savings is voluntary shows clearly that without making part of the savings mandatory insome way, the boost to overall savings will be muted and could in fact lead to serious underfunding problems in terms offuture retirement income provision.

REFORMS OF PENSION SYSTEMS IN THE EU : AN ANALYSIS OF THE POLICY OPTIONS
- 212 -
Graph 12: Preferred pension reform scenario: PAYG in equilibrium + 25% funding
A: GDP effect
-20
-15
-10
-5
0
5
10
2000 2025 2050
Preferred pension reform scenario
B: Contributions to public and private
pension schemes
0
5
10
15
20
2000 2025 2050
Contributions to private pension system
Social security contributions to
PAYG system
% of wages
Source: Commission services.
C: Total net replacement ratio
(Proportion of pension income coming from PAYG
system and pension funds)
0
20
40
60
80
100
2000 2025 2050
Pension income from
PAYG system Pension income from funded system
D: Income distribution consequences
-5
5
15
25
35
2000 2025 2050
Working age population
%
% of final salary
Baseline
Total replacement ratio
Pensioners
%

REFORMS OF PENSION SYSTEMS IN THE EU : AN ANALYSIS OF THE POLICY OPTIONS
- 213 -
5. SUMMARY AND CONCLUSIONS
Member States have already launched a wide range of reforms with the aim of tackling the ageing problemwhich they collectively face. Notwithstanding the reforms undertaken up until the end of the 1990s, thelatest estimates of the effect on growth and on public expenditure on pensions confirm that the impact ofageing will be so significant and widespread that additional reforms will still be needed in order to addressthe associated growth loss and to put the public finances on a sounder footing. In this regard, the designand structure of public pension systems play a crucial role in determining the scale of the budgetary andgrowth impact of ageing and consequently a discussion on the relative merits of individual pensionsystems is of the utmost importance.
As stressed in this chapter, the effects of ageing are not confined simply to the public finance and growtharenas and therefore any discussion on reform needs to be extended to a broad range of economic andsocial considerations. On the economic front, it is widely acknowledged that any reform strategy needs tobe as comprehensive as possible and that it should in particular aim at: (i) increasing economic growth, (ii)containing future pension expenditure, and (iii) strengthening the financial basis of pension systems. Inthis context the present study has focused on the policy choices within the pension system itself, with therange of options being plentiful and with no single “best” approach being possible. Amongst the manypolicy courses which could be followed, current public pension systems can be made more sustainablethrough undertaking parametric reforms with a view to improving incentives to work and to strengtheningthe actuarial link between contributions and benefits. This latter approach would help to create a cleardemographic link in public pension systems. Fairness between generations and strengthening the financialbasis of pension systems inherently broadens the question of the sustainability of pension systems to thewider issue of public debt management. This, in turn, suggests a need to consider issues such as increasedpre-funding both within the existing systems and through the establishment of specific pension funds.Opting for more radical systemic reforms involves questions other than funding. This leads one toconsider the objective of diversification in terms of retirement income provision and the risks involved indifferent systems. In addition, it includes the difficult question of balancing the possible beneficial side-effects on the economy with the inevitable costs of the transition process.
The empirical part of the chapter provides a quantitative assessment of many of the key issues which wereraised in essentially normative terms in sections 2 and 3. Simulations for the EU-15 as a whole give an ideaof the magnitude of the impact of some selected pension reforms as well as their simultaneous impact ona range of economic variables. In particular, the simulations focused on the effects on economic growth;the sustainability of public finances; and the income distribution consequences of changing pensionsystems in terms of the differential impact of the various pension reforms on the working-age populationand on pensioners.
In terms of parametric reforms, a number of individual and combined reform scenarios were assessed.Regarding the individual reforms, the impact of two options were analysed: namely (i) a reduction in thegenerosity of the PAYG pension system brought about through changes in the systems replacement ratioand (ii) an increase in the retirement age. With regard to reductions in generosity, while such a reformoption provides clear budgetary gains, less success is discernible in terms of easing the growth lossassociated with ageing and income distribution difficulties are evident. No such problems exist with theretirement age simulation which suggests large gains in terms of growth (i.e. a gain of over 13 per centrelative to the baseline), budgetary sustainability and income distribution. With regard to the fiscal gain,the retirement simulation suggests that the public expenditure impact of an increase in the effectiveretirement age is of the order of 1 for 1 (i.e. for each additional year worked before retiring, the publicexpenditure impact on pensions is reduced by close to 1 percentage point of GDP).
In addition to the individual parametric reform simulations, the paper also assessed the impact of 2 sets ofcombined parametric reforms, firstly the “EPC“ scenario which provided an assessment of the impact ofthe labour market and pension generosity assumptions underlying the EPC’s recent ageing work, andsecondly a set of parametric reforms which included the EPC assumptions plus an increase in the effective

REFORMS OF PENSION SYSTEMS IN THE EU : AN ANALYSIS OF THE POLICY OPTIONS
- 214 -
retirement age. The reforms outlined in the “EPC“ scenario are clearly significant and constitute awelcome step in the right direction but according to the simulations do not go far enough either in termsof bringing the PAYG pension system back into equilibrium or in terms of overcoming the negativeconsequences of ageing in terms of economic growth. Both of the latter objectives could however beachieved if, in addition to the EPC reforms, the effective retirement age was brought back up to thestatutory age. In fact, such a comprehensive package of parametric reforms has, on its own (i.e. withoutrecourse to any systemic changes), the potential to more than fully offset the negative effects of ageing interms of standards of living and in terms of ensuring that government expenditure on pensions will bestabilised at its 2000 level of 10 ½ per cent of GDP over the next 50 years rather than increasing by 7percentage points as predicted in the baseline scenario.
In addition to the parametric reform simulations, the ageing model was also used to assess the possibilityof a shift to funding, with two specific options for systemic reforms being analysed: namely (i) a 100 percent switch into a funded system and (ii) a partial (25 per cent) move. While the models baselinesimulation suggests that the present return differential in favour of funding would broadly persist over thenext 50 years, this differential would contract considerably if there was to be a 100 per cent shift intofunding. From a baseline differential of around 3 ½ percentage points, the differential would fall toroughly 2 ¾ percentage points if there was to be an immediate abolition of the PAYG system, with smallchanges in the differential provoking large changes in terms of the respective costs of the individualpension systems. In addition, the simulations show clearly that it would be politically difficult, at the EUlevel at least, to go for a complete move to funding since the transition burden from the PAYG system isso high. The first systemic simulation suggests that the burden on workers would be considerable, withthe social security contributions (SSC’s) needed to finance the transition burden only falling slowly overthe next number of decades and with workers forced to save an additional 12-20 per cent of their wages toprovide for their own pensions outside the PAYG system. Finally, in terms of growth rates, a full shift tofunding would only boost the EU's potential growth rate by a small, but nevertheless very welcome, 0.1 ofa percentage point on an annual average basis over the next 50 years, compared with an annual averagegrowth rate gain of 0.5 of a percentage point emanating from the scenario involving a comprehensivepackage of parametric reforms.
Notwithstanding the above, however, while a complete shift to funding would appear difficult in terms ofthe fall in returns for pension funds, the relatively low growth rate gain and the size of the transitionburden to be serviced by EU workers, a smaller shift of, for example, 25 per cent appears feasible,especially when combined with a broad range of parametric reforms aimed at bringing the PAYG systemback into equilibrium and thereby both reducing the transition burden imposed on workers and boostingthe growth rate gains considerably. Such a scenario is assessed in the final simulation with, notsurprisingly, strong gains for all the key policy variables which are targetted, namely a 28 per cent increasein the level of GDP compared with the baseline, a substantial reduction in the transition burden imposedon workers and overall gains in terms of the consumption of both the working age population andpensioners.
This final scenario may in fact constitute an “optimal” policy path to be followed by the EU at the presenttime as it strives to find a workable balance between the cost advantage apparently offered by fundedschemes and the income security and other advantages provided by the PAYG system. Furthermore, interms of a risk diversification strategy for retirement income provision, a mixed approach may be moreappropriate as it allows individuals to draw on both the returns to human capital investment, in the formof the real wage growth which underpins the PAYG system, and returns to physical capital investment ina funded system (i.e. the real interest rate).
Finally, while a politically feasible shift to partial funding over the next 50 years will bring significant gainsin terms of budgetary sustainability, the size of the growth gains, as mentioned earlier, should not beexaggerated, especially when compared with a broad based parametric reforms scenario which alsoprovides impressive budgetary relief. In this context, regarding the overall GDP gain of 28 per cent fromthe final systemic simulation, by far the largest proportion of the gain clearly emanates from the

REFORMS OF PENSION SYSTEMS IN THE EU : AN ANALYSIS OF THE POLICY OPTIONS
- 215 -
parametric reforms (with the increase in the effective retirement age being the single most potent pensionreform option), with the partial shift to funding accounting for only about 5 per cent of the overall gain inliving standards.
Consequently, while the growth gains from funding are not insignificant, on the basis of the simulationresults it appears that what is even more important from a growth perspective is that governmentsintroduce the fundamental real economy measures which are necessary for economies to adjust to thechanges brought about by ageing populations. In terms of pension reform, ageing has significantly alteredthe underlying economics of the pension system and it is incumbent on policy makers to bring the systemback into a new equilibrium which reflects the twin “certainties” of ongoing increases in life expectancyand lower birth rates compared with previous decades. In this regard, action is necessary to firstly bringthe relationship between the number of years spent in employment relative to the years spent inretirement (i.e. the passivity ratio) back to the levels witnessed when the PAYG system was in its infancyand secondly at the level of economic policy to recognise that whilst budgetary sustainability is animportant measuring rod for pension reform measures, policy makers must retain economic growthconsiderations as their central objective.51
51 It should be stressed that the simulation results presented in section 4 of this paper endorse the findings of the empiricalresearch referred to in sections 2 and 3, especially with regard to the large gains to be achieved from an increase in theeffective retirement age and also with regard to pension policy reforms which focus on the need to sustain and promoteeconomic growth. In addition, the policy course suggested in section 4 of a partial shift to funding is also a position which iswidely shared in the literature. In this regard, despite the initial transition burden, funding is still an attractive method ofpension financing given the longer run cost advantage which it provides. Finally, this favourable return differential is likely topersist over time as long as the practical operational details of any shift to funding are carefully scrutinized.
REFORMS OF PENSION SYSTEMS IN THE EU : AN ANALYSIS OF THE POLICY OPTIONS
- 216 -
6. REFERENCES
ABEL, A. (1999), “The social security trust fund, the riskless interest rate and capital accumulation”,
NBER Working Paper No 6991.
ABEL, A. (2000), “The effects of investing social security funds in the stockmarket when fixed costs
prevent some households from holding stocks”, NBER Working Paper No 7739.
BARR, N. (2000), “Reforming pensions: myths, truths, and policy choices”, IMF Working Paper No 139.
BLÖNDAL, S. AND S. SCARPETTA (1999), “Early retirement in OECD countries: the role of social security
systems”, OECD Economic Studies No 29.
BOHN, H (2001), “Retirement savings in an ageing society: a case for innovative government debt
management”, CESifo Working Paper No 494, Munich, www.CESifo.de.
BROOKS, R. (2000), “What will happen to financial markets when the baby boomers retire?”, IMF Working
Paper No 18.
BROOKS, R. (2001), “Population ageing and global capital flows in a parallel universe”, IMF Working Paper
No 151.
BÖRSCH-SUPAN, A. H. (2001), Capital and labor productivity in an ageing world, presentation at the third
plenary of the Commission on global ageing, Tokyo - Japan, August.
BÖRSCH-SUPAN, A. H. AND J. K. WINTER (2001), “Pension reform, savings behaviour, and corporate
governance”, Mannheim discussion paper (forthcoming).
BÖRSCH-SUPAN, A. H. AND R. SCHNABEL (1997), “Social security and retirement in Germany”, NBER
Working Paper No 6153.
Council of the European Union (2001), “The Contribution of Public Finances to Growth and
Employment: Improving Quality and Sustainability”, Report of the Commission and the (ECOFIN)
Council to the European Council (Stockholm 23/24 March 2001), 6997/01.
DANG, T., P. ANTOLIN AND H. OXLEY (2001), “Fiscal implications of ageing: projections of age-related
spending”, OECD Working Paper No 305.
DAVIS, E.P. (1995), Pension funds: retirement, income security and capital markets, an international perspective,
Clarendon Press, Oxford.
Economic Policy Committee (2000), “Progress Report to the Ecofin Council on the Impact of Ageing Populations on
Public Pension Systems”, EPC/ECFIN/581/00-Rev.1. Available at web-site
http://europa.eu.int/comm/economy_finance/publications/european_economy/reportsandstudi
es0401_en.htm
EUROPEAN COMMISSION (1999a), Towards a single market for supplementary pensions, COM (1999)134.
EUROPEAN COMMISSION (1999b), “The EU economy: 1999 review”, European Economy, No 69.

REFORMS OF PENSION SYSTEMS IN THE EU : AN ANALYSIS OF THE POLICY OPTIONS
- 217 -
EUROPEAN COMMISSION (2000a), Pension schemes of the Member States of the European Union, May 2000.
EUROPEAN COMMISSION (2000b), Communication on the future evolution of social protection from a long-term point of
view: safe and sustainable pensions, COM (2000)622.
EUROPEAN COMMISSION (2000c), Communication on the contribution of public finances to growth and employment:
improving quality and sustainability, COM (2000)846.
EUROPEAN COMMISSION (2001a), Communication on the elimination of tax obstacles to the cross-border provision of
occupational pensions, COM(2001)214.
EUROPEAN COMMISSION (2001b), “Budgetary challenges posed by ageing populations: the impact on
public spending on pensions, health care for the elderly and possible indicators of the long-term
sustainability of public finances. Report of the working group on ageing populations to the
Economic Policy Committee”, (forthcoming).
FELDSTEIN, M. AND J.B. LIEBMAN (2001), “Social security”, chapter for forthcoming “Handbook of
public economics”, NBER Working Paper No 8451.
FRANCO, D. (1995), “Pension liabilities - their use and misuse in the assessment of fiscal policies”, EC
DG ECFIN Economic Papers No 110.
FRANCO, D. AND T. MUNZI (1997), “Demography and the welfare state”, European Economy, Reports and
Studies, No 4.
FREDERIKSEN, N. K. (2001), Pension funding, fiscal sustainability and government debt, Danish Ministry of
Finance (a mimeo).
GERTLER, M. (1999), “Government debt and social security in a life-cycle economy”, Carnegie-Rochester
Conference Series on Public Policy Vol. 50. pp. 61-110.
GROUP OF TEN (1998), The macroeconomic and financial implications of ageing populations, Bank for International
Settlements, the BIS web-site.
GRUBER J. AND D. A. WISE (1999), Different approaches to pension reform from an economic point of view, a paper
presented at the NBER conference on “Social security pension reform in Europe”, 20-21.3.2000,
the NBER web-site.
HOLZMANN, R. (1997), “On economic benefits and fiscal requirements of moving from unfunded to
funded pensions”, European Economy, Reports and Studies, No 4.
HOLZMANN, R. (1999), The World Bank approach to pension reform, the World Bank web-site.
KANE, C. AND R. PALACIOS (1996), “The implicit pension debt”, Finance and Development, June.
KOPITS, G. (1997), “Are Europe’s social security finances compatible with EMU?”, IMF paper on policy
analysis and assessment.
KOTLIKOFF, L., K. SMETTERS AND J. WALLISER (2001), “Finding a way out of America’s demographic
dilemma”, NBER Working Paper No 8258.

REFORMS OF PENSION SYSTEMS IN THE EU : AN ANALYSIS OF THE POLICY OPTIONS
- 218 -
LATULIPPE, D. (1996), “Effective retirement age and duration of retirement in the industrial countries
between 1950 and 1990”, ILO Discussion Paper on Issues in Social Protection No 2.
LINDBECK, A. (2000), Pensions and contemporary socioeconomic change, A paper presented at the NBER
conference on “Social security pension reform in Europe”, 20-21.3.2000, the NBER web-site.
MC MORROW, K. AND W. ROEGER (1999), “The economic consequences of ageing populations - a
comparison of the EU, US and Japan”, EC DG ECFIN Economic Papers No 138.
MC MORROW, K. (2001), Economic impact of pension reform, presentation at the third plenary of the
Commission on global aging, Tokyo - Japan, August.
MILES, D. AND A. TIMMERMANN (1999), “Risk sharing and transition costs in the reform of pension
systems in Europe”, Economic Policy No 29.
MODIGLIANI, F., M.L. CEPRINI AND A.S. MURALIDHAR (2000), “A solution to the social security crisis”,
Sloan Working Paper No 4051.
MERRILL LYNCH (2000), Demographics and the funded pension system.
MERRILL LYNCH (2001), Progress report on European pension reforms.
MURTHI, M., J. M. ORSZAG AND P. R. ORSZAG (2001), “Administration costs under a decentralised
approach to individual accounts: lessons from the United Kingdom”, in Holzmann R. and J.
Stiglitz (eds.), New ideas about old age security, the World Bank.
OECD (1998), Maintaining prosperity in an ageing world, Paris.
OECD (2000a), Reforms for an ageing society, Paris.
OECD (2000b), Institutional investors statistical yearbook, Paris.
OECD (2001a), Economic outlook 2001, Paris.
OECD (2001b), Fiscal implications of ageing: projections of age-related spending, a working document for the
Working Party No. 1 on macroeconomic and structural policy analysis, ECO/CPE/WP1(2001)1.
OECD (2001c), Net social expenditure, DEELSA/ELSA/WD(2001)5.
OECD (2001d), “Private pension systems: administrative costs and reforms”, Private Pensions Series No 2,
Paris.
OECD (2001e), Taxing pensioners: a study of nine OECD member countries, a working document for the
Working Party No 2 on tax policy analysis and tax statistics, DAFFE/CFA/WP2(2001)9
OKSANEN, H. (2001a), “A case for partial funding of pensions with an application to the EU candidate
countries”, EC DG ECFIN Economic Papers No 149.
OKSANEN, H (2001b), Pension reforms for sustainability and fairness, CESifo Forum (forthcoming).
REFORMS OF PENSION SYSTEMS IN THE EU : AN ANALYSIS OF THE POLICY OPTIONS
- 219 -
ORSZAG J. M. AND P. R. ORSZAG (2000), The benefits of flexible funding: implications for pension reform in an
uncertain world, a paper presented at the World Bank conference on 20.4.2000, the World Bank
web-site.
ORSZAG P. R. AND J. E. STIGLITZ (1999), “Rethinking pension reform: ten myths about social security
systems”, in Holzmann R. and J. Stiglitz (eds.), New ideas about old age security, the World Bank.
PISSARIDES, C. A. (1998). “The impact of unemployment cuts on employment and wages: the role of
unemployment benefits and tax structure”, European Economic Review No 42, pp. 155-84.
ROEGER, W. AND J. IN'T VELD (1997), “Quest II - A multi country business cycle and growth model”,
EC DG ECFIN Economic Papers No 123.
ROEGER, W. (2000) “Ageing and fiscal sustainability in Europe”, Fiscal sustainability, pp. 255-286, Banca
d’Italia.
ROEGER, W. (2001) “Ageing in Europe: A quantitative assessment of some reform options”, paper
presented at the Groningen economics workshop, November.
SINN H-W. (2000), “Why a funded pension system is useful and why it is not useful”, International tax and
public finance No 7, p. 389-410.
VAN DEN NOORD, P. AND R. HERD (1993), “Pension liabilities in the seven major economies”, OECD
Working Paper No 142.
VISCO, I. (2001), “Paying for pensions: how important is economic growth?”, Banca Nazionale del Lavoro
Quaterly Review No 214, March.
WORLD BANK (1994), Averting the old age crisis, policies to protect the old and promote growth.

REFORMS OF PENSION SYSTEMS IN THE EU : AN ANALYSIS OF THE POLICY OPTIONS
- 220 -
ANNEX : OVERVIEW OF KEY FEATURES OF AGEING MODEL
An EU-15 aggregate version of DG ECFINs QUEST Model has been used for the scenarios. The modelcan be characterised as a neo-classical growth model with short run Keynesian features arising fromadjustment costs and nominal rigidities. Details of the model specification can be found in Roeger (2000).One important modification has been made for the purpose of the ageing scenarios: in order to captureintergenerational issues the private household sector of the model has been disaggregated into workingage population and retiree households, along the lines suggested by Gertler (1999). This is a generalisationto the Blanchard/Yaari life cycle framework, which constitutes the standard specification in QUEST. TheGertler model can also be interpreted as a generalisation of a simple overlapping generations (OLG)model by allowing for realistic average lengths of life, work and retirement. This Annex discusses inparticular the OLG modifications to the household sector
Population dynamics - In the model individuals have finite lives and they go through three distinctstages of life: youth (0 - 20 years), work (21 years - retirement age), and retirement (retirement age+1 -
expected end of life). The number of children in period t is given by yN . Each period
ybN children are
born and average duration in childhood is 1/(1-yλ ) where
yλ is the fraction of young people turning age21. Child population dynamics is given by :
(1)y
tyt
yt
yt NbNN )1(1 λ−+=+ .
The working age population in period t is given by wN . Each period
yyNλ children enter the working
age population cohort. The mean duration of staying in this cohort is 1/(1-wλ ) where
wλ is the fractionof the population in working age which goes into retirement within the current period. Thus thepopulation of working age evolves over time as follows :
(2)wt
wt
yt
yt
wt NNN )1(1 λλ −+=+ .
There are rN pensioners at date t. and they are joined by
wwNλ new retirees, while a fraction (1-rλ )
incumbent retirees survive to the next period. This gives the following law of motion for the retireepopulation
(3)rt
rt
wt
wt
rt NNN )1(1 λλ −+=+
Households- Consumption of retirees and workers is proportional (up to variations in real interestrates) to financial and human wealth as implied by an intertemporal CES utility function. Retireeconsumption is given by:
(4) )( rt
rt
rt SAarC +=
Where rA is financial wealth held by pensioners and rS represents the present discounted value of
pensions :
REFORMS OF PENSION SYSTEMS IN THE EU : AN ANALYSIS OF THE POLICY OPTIONS
- 221 -
rjt
rjt
jjtjtjtjt
jrjtjt
rt NpartssctlwreprS ++
∞
=++++
−++� −−++=
0
)1()1( λ Notice that the finiteness of a
pensioner’s life is taken care of by including the probability of death in the discount rate. Pensions are
proportional to net wages at rate trep , where tl is the labour tax rate and ssc is the rate of social securitycontributions. Only those retirees who have participated in the labour force are entitled to a pension,
where the average participation rate of retirees is given by (rtpart )
Each member of the working age population52 also consumes a fraction of financial ( wA ) and humanwealth (H) net of labour taxes and pension contributions. A third element entering the consumption andsavings decision of workers is the value of social security payments workers can expect once they retire
(wS ).
)( wtt
wt
wt SHAawC ++=
with r
jtj
jtjw
t Saw
arretfrS +
∞
=+
−� += ˆ)()1(
0
wS is the capitalised value of future pensions the worker can expect after retiring. This expression is
composed of two terms, namely )( jtretprob + which represents the probability that the worker retires in
t+j and rjtS+
ˆ , the present discounted value of pensions of the average worker which he can expect when
he retires in t+j. Worker households evaluate future pensions with the ratio of the marginal propensity toconsume in retirement and in work.53 This reflects the value to a worker of being able to consume todayfrom wealth to be received in retirement.
At each moment in time the sum of rS and
wS 54 constitutes the unfunded liabilities of the PAYGsystem. They are endogenously calculated by the model together with time paths for the interest rate andwages, given the future evolution of the retirement age, life expectancy, the participation rate and thereplacement ratio.
The transition to funding is modelled by phasing out the replacement rate of new retirees over theworking life of the youngest worker cohorts, starting at the date of transition, while keeping thereplacement rate of incumbent retirees at the historical level. A funded scheme for the current workingage population is introduced by setting up an annuities market where each worker contributes a certainpercentage of his wage income to a mutual fund which invests the proceeds. After switching intoretirement the fund pays a pension to the worker. In order to allow comparisons with the PAYG systemthe funded scheme is set up as a defined benefit scheme guaranteeing the same net replacement rate topensioners as under the previous PAYG scheme. Given the replacement rate under the funded scheme
and the evolution of average duration in retirement, the contribution rate ( jtco + ) is determined by
equalising at each date, the present discounted value of pension contributions
�∞
=++
−++ ++=
0
)1(j
jtjtjw
jtjtt wcorCL λ .
52 This includes the consumption of children.
53 This ratio is close to 2.
54 Corrected for the marginal propensity to consume differential in order to obtain the pure financial burden without utilityevaluation.
REFORMS OF PENSION SYSTEMS IN THE EU : AN ANALYSIS OF THE POLICY OPTIONS
- 222 -
to the present discounted value of the funded pension ( tSLPDV )( ) the worker can expect in the future
�∞
=++
−++=
0
)()1()(j
jtjtj
jtt SLretprobrSLPDV .
where jtSL+ is the present discounted value of the pension from the mutual fund.
Firms - Firms operate in a monopolistically competitive environment. GDP is produced via a CobbDouglas production function with capital, energy and employment as inputs. Technical progress growswith an exogenous rate. Capital stock changes according to the rate of fixed capital formation and the rateof geometric depreciation. Furthermore, it is assumed that the investment process is subject to risingmarginal costs of installation. Total real investment expenditures are equal to investment purchases plusthe costs of installation. The objective of the firm is to maximise the present value of its cash flow. Asdecision rules for investment and employment the standard neo-classical relations emerge linking factordemand to the level of output and real factor prices.
Labour market - Market clearing for goods and financial markets is assumed in this specification sincethe focus is on medium to long run results. Persistently high unemployment rates in Europe make itnecessary to depart from the neo-classical specification of labour supply. Instead a standard bargainingand search framework (see, for example Pissarides (1998)) is used to model the labour market. By allowingfor market power of workers/trade unions, persistent involuntary unemployment can be modelled withinthis framework, since net wages are set as a mark-up over the reservation wage. The wage mark-updepends positively on labour market tightness. The reservation wage itself is determined by the level ofunemployment benefits. The extent to which social security contributions are shifted onto wages dependscrucially on how benefits are indexed to social security contributions. To the extent to which they are notindexed workers try to shift contributions onto wages in order to preserve a mark-up. With full indexationof benefits, social security contributions would not distort wages. In the simulations a 50 per centindexation of benefits to wages is assumed thus mitigating negative labour market effects from risingpension contributions. In effect this 50 per cent indexation rule means that workers regard only 50 percent of their SSC’s as savings, with the remaining 50 per cent perceived as simply another form of labourtaxation. Labour force participation is kept exogenous.
Government - The government pays unemployment benefits and purchases goods and services. Theseexpenditures are financed by taxes on capital, labour and consumption as well as deficits. A debt rulewhich adjusts transfers to households such that a long run debt to GDP target is met guarantees theintertemporal solvency of the government. The government also manages a PAYG pension system wherepension contributions are set in each period in such a way as to finance total pension expenditures for agiven replacement rate.