The EU Debate - British Social Attitudes Surveych 36 The EU Debate 2Overview Differences in support...
40
The National Centre for Social Research British Social Attitudes 36 | The EU Debate 1 It is often claimed that attitudes towards Brexit have ‘polarised’. But what might be meant by that claim? It could simply mean that few people think that leaving the EU will not make much difference either way to Britain’s future. But it could also mean that support for leaving varies markedly by social background, sense of identity, or underlying values, as well as people’s perceptions of the consequences of Brexit. Or it could be that the country has divided into strongly committed ‘Remainers’ and strongly committed ‘Leavers’. This chapter assesses the evidence for each of these possibilities. Spotlight After increasing between 2015 and 2016, support for leaving the EU has subsequently fallen among Labour supporters. In contrast it has continued to rise among those who back the Conservative Party. The EU Debate Has Brexit Polarised Britain? Support for leaving the EU by party identification 0 10 20 30 40 50 % 60 2015 2016 2017 Conservatives Labour 2018
Transcript of The EU Debate - British Social Attitudes Surveych 36 The EU Debate 2Overview Differences in support...
The National Centre for Social Research
British Social Attitudes 36 | The EU Debate 1
It is often claimed that attitudes towards Brexit have ‘polarised’. But what might be meant by that claim? It could simply mean that few people think that leaving the EU will not make much difference either way to Britain’s future. But it could also mean that support for leaving varies markedly by social background, sense of identity, or underlying values, as well as people’s perceptions of the consequences of Brexit. Or it could be that the country has divided into strongly committed ‘Remainers’ and strongly committed ‘Leavers’. This chapter assesses the evidence for each of these possibilities.
Spotlight After increasing between 2015 and 2016, support for leaving the EU has subsequently fallen among Labour supporters. In contrast it has continued to rise among those who back the Conservative Party.
The EU Debate Has Brexit Polarised Britain?
Support for leaving the EU by party identification
0
10
20
30
40
50
%
60
2015 2016 2017
Conservatives
Labour
2018
Support for leaving the EU by party identification
The National Centre for Social Research
British Social Attitudes 36 | The EU Debate 2
Overview
Differences in support for Brexit have widenedBritain is more divided in its attitudes towards leaving the EU than it was before the EU referendum.
• Among those aged 55 and over, support for leaving the EU is 21 points higher now than it was in 2015; among those aged under 35 there has only been a 7-point increase.
• Over the same period support for leaving the EU has risen by 18 points among those with a weak European identity, but by only 2 points among those with a strong European identity.
Many people feel more strongly about Brexit than they feel about any political party Far more people identify strongly as a ‘Remainer’ or a ‘Leaver’ nowadays than do so as a strong supporter of a political party.
• Only 8% say that they are a ‘very strong’ supporter of a political party.
• As many as 40% say that they are either a ‘very strong Remainer’ or a ‘very strong Leaver’.
Strong Brexit identifiers have very different expectations of post-Brexit Britain Strong Remainers and strong Leavers have diametrically opposed views about the consequences of leaving the EU.
• 85% of ‘very strong Remainers’ think that Britain’s economy will be worse off as a result of Brexit. 71% of ‘very strong Leavers’ believe it will be better off.
• 74% of ‘very strong Remainers’ reckon that Britain will have less influence in the world as a result of leaving the EU. Only 6% of ‘very strong Leavers’ agree with them.
The National Centre for Social Research
British Social Attitudes 36 | The EU Debate 3
Authors
John Curtice Senior Research Fellow, National Centre for Social Research, and Professor of Politics, University of Strathclyde
Ian MontaguSenior Researcher, Scottish Centre for Social Research
IntroductionIt has now become a common observation that attitudes towards Brexit have become ‘polarised’. But what is meant by that term is less commonly specified. Perhaps the most obvious meaning is that the public is sharply divided between those who think that leaving the EU will be beneficial and those who think it will be damaging, leaving relatively few who think that it will not make much difference either way. However, what could also be meant is not that the distribution of attitudes has polarised but that different sections of society have come to have diametrically opposed views about the merits of leaving the EU, leading the country to look fragmented and divided. But if there is a sharp social division about Brexit, then we might reckon that it is likely to be underpinned by attitudinal differences too. We might anticipate that people’s differences of opinion about Brexit reflect differences of outlook not only about what they think the consequences of Brexit might be, but also, given the prominence of debates about the implications of EU membership for immigration and sovereignty (Clarke et al., 2017), in terms of people’s sense of identity and the values that they uphold. Indeed, the Brexit debate might have even come to reflect broader disagreements about what kind of country Britain is and should be, and what role it can and should seek to occupy in the world – a debate in which the participants reflect and articulate very different world views to which they feel strongly committed and attached.
In this chapter, we assess the extent to which Brexit has polarised Britain. In so doing, we bear in mind that holding a referendum about an issue can usually be expected to raise its salience in people’s minds and, as they think through how they should vote, sharpen voters’ understanding of the issues at stake (Curtice and Tipping, 2018). However, that should be no more than a temporary effect, whose ripples disappear as soon as the referendum has been held and the issue fallen away from the media headlines. Yet the Brexit referendum was not a one-off event. The majority decision to leave the EU instigated a round of talks with the European Union about the terms and conditions under which the UK would leave, and created a need to reach an agreement on what the UK’s future relationship with the EU should be. That requirement has ensured that, in practice, far from disappearing from the headlines, Brexit has been the subject of continuing discussion and debate, with many of the issues that were first raised during the referendum being regularly revisited. As a result, rather than diminishing, the divisions that emerged among voters during the referendum might have been maintained and reinforced – and perhaps even exacerbated. This chapter is particularly concerned with what might have happened after the referendum, focusing on the period of the first phase of the negotiations that were undertaken with a view to securing the UK’s exit from the EU at the end of March 2019.
The National Centre for Social Research
British Social Attitudes 36 | The EU Debate 4
We begin by looking at how the overall distribution of attitudes towards EU membership and the perceived consequences of leaving has evolved before and since the EU referendum. We then look at the extent to which those in different demographic groups differ in their level of support for Brexit. Thereafter we examine the extent to which supporters and opponents of Britain’s departure from the EU differ not only in their views about the anticipated consequences of Brexit, but also more broadly in their sense of identity and values. Finally, we assess the strength of voters’ commitment and attachment to the views that they hold.
Long-term trends in attitudes towards the EUSince 1992, British Social Attitudes (BSA) has ascertained attitudes towards Britain’s relationship with the EU on a regular basis by asking the following question:1
Do you think Britain’s long-term policy should be...
...to leave the European Union,
to stay in the EU and try to reduce the EU’s powers,
to leave things as they are,
to stay in the EU and try to increase the EU’s powers,
or, to work for the formation of a single European government?
1 From 2016 onwards, the introduction to the question has read: ‘Leaving aside the result of the referendum on Britain’s membership of the European Union, what do you think Britain’s policy should be..’. The wording of the third answer option was also amended to ‘stay in the EU and try to keep the EU’s powers as they are’.
The National Centre for Social Research
British Social Attitudes 36 | The EU Debate 5
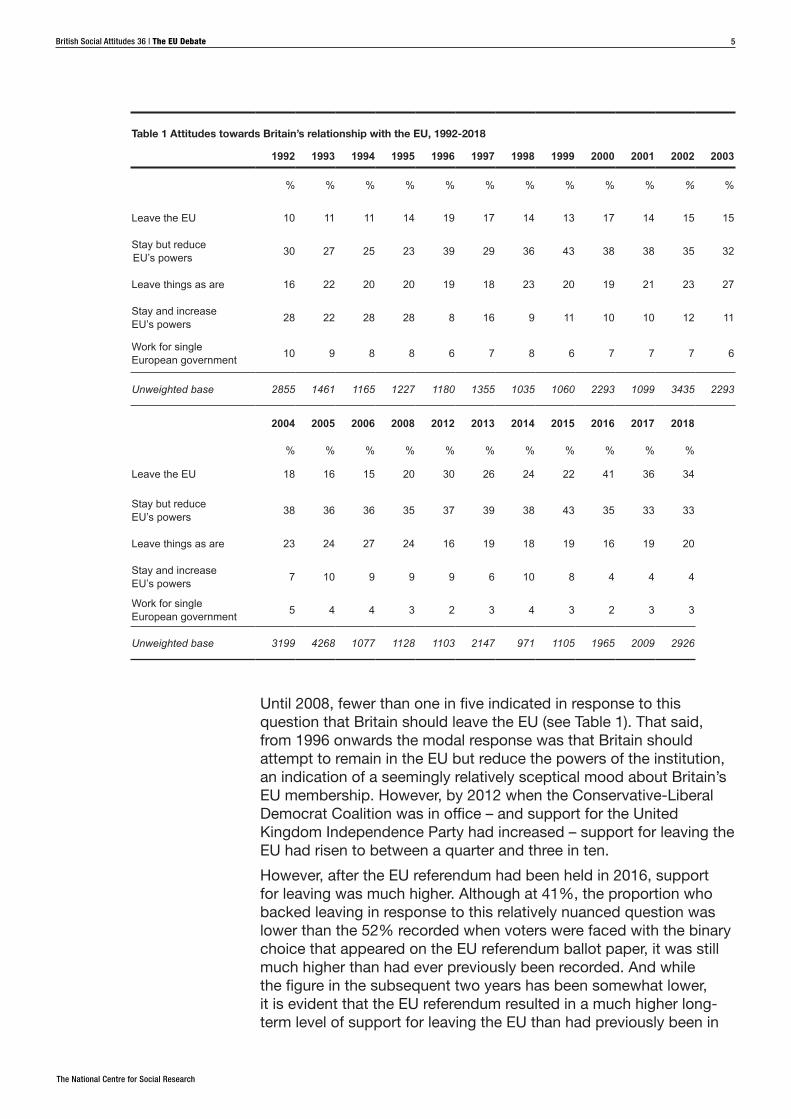
Until 2008, fewer than one in five indicated in response to this question that Britain should leave the EU (see Table 1). That said, from 1996 onwards the modal response was that Britain should attempt to remain in the EU but reduce the powers of the institution, an indication of a seemingly relatively sceptical mood about Britain’s EU membership. However, by 2012 when the Conservative-Liberal Democrat Coalition was in office – and support for the United Kingdom Independence Party had increased – support for leaving the EU had risen to between a quarter and three in ten.
However, after the EU referendum had been held in 2016, support for leaving was much higher. Although at 41%, the proportion who backed leaving in response to this relatively nuanced question was lower than the 52% recorded when voters were faced with the binary choice that appeared on the EU referendum ballot paper, it was still much higher than had ever previously been recorded. And while the figure in the subsequent two years has been somewhat lower, it is evident that the EU referendum resulted in a much higher long-term level of support for leaving the EU than had previously been in
Table 1 Attitudes towards Britain’s relationship with the EU, 1992-2018
1992 1993 1994 1995 1996 1997 1998 1999 2000 2001 2002 2003
% % % % % % % % % % % %
Leave the EU 10 11 11 14 19 17 14 13 17 14 15 15
Stay but reduce EU’s powers 30 27 25 23 39 29 36 43 38 38 35 32
Leave things as are 16 22 20 20 19 18 23 20 19 21 23 27
Stay and increase EU’s powers 28 22 28 28 8 16 9 11 10 10 12 11
Work for single European government 10 9 8 8 6 7 8 6 7 7 7 6
Unweighted base 2855 1461 1165 1227 1180 1355 1035 1060 2293 1099 3435 2293
2004 2005 2006 2008 2012 2013 2014 2015 2016 2017 2018
% % % % % % % % % % %
Leave the EU 18 16 15 20 30 26 24 22 41 36 34
Stay but reduce EU’s powers 38 36 36 35 37 39 38 43 35 33 33
Leave things as are 23 24 27 24 16 19 18 19 16 19 20
Stay and increase EU’s powers 7 10 9 9 9 6 10 8 4 4 4
Work for single European government 5 4 4 3 2 3 4 3 2 3 3
Unweighted base 3199 4268 1077 1128 1103 2147 971 1105 1965 2009 2926
The National Centre for Social Research
British Social Attitudes 36 | The EU Debate 6
evidence in our surveys. Britain has certainly emerged from the Brexit process much more doubtful about being part of the EU than it had been just 10 years previously.
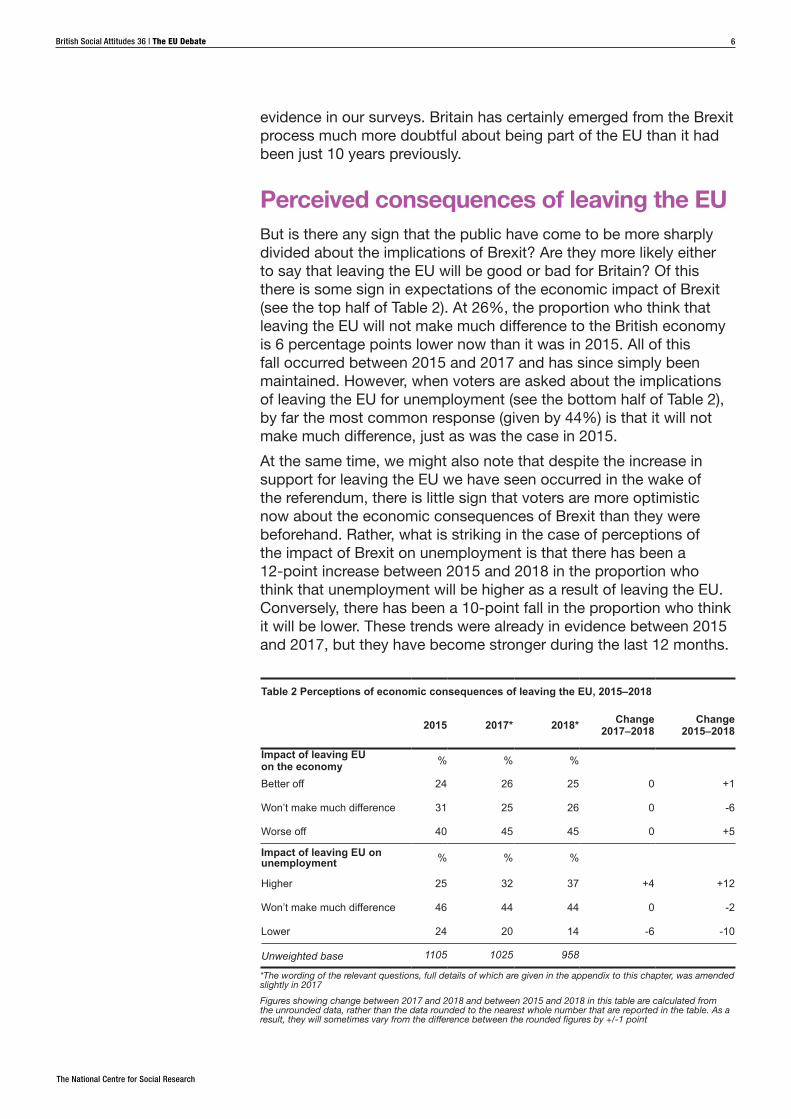
Perceived consequences of leaving the EUBut is there any sign that the public have come to be more sharply divided about the implications of Brexit? Are they more likely either to say that leaving the EU will be good or bad for Britain? Of this there is some sign in expectations of the economic impact of Brexit (see the top half of Table 2). At 26%, the proportion who think that leaving the EU will not make much difference to the British economy is 6 percentage points lower now than it was in 2015. All of this fall occurred between 2015 and 2017 and has since simply been maintained. However, when voters are asked about the implications of leaving the EU for unemployment (see the bottom half of Table 2), by far the most common response (given by 44%) is that it will not make much difference, just as was the case in 2015.
At the same time, we might also note that despite the increase in support for leaving the EU we have seen occurred in the wake of the referendum, there is little sign that voters are more optimistic now about the economic consequences of Brexit than they were beforehand. Rather, what is striking in the case of perceptions of the impact of Brexit on unemployment is that there has been a 12-point increase between 2015 and 2018 in the proportion who think that unemployment will be higher as a result of leaving the EU. Conversely, there has been a 10-point fall in the proportion who think it will be lower. These trends were already in evidence between 2015 and 2017, but they have become stronger during the last 12 months.
Table 2 Perceptions of economic consequences of leaving the EU, 2015–2018
2015 2017* 2018* Change 2017–2018
Change 2015–2018
Impact of leaving EU on the economy % % %
Better off 24 26 25 0 +1
Won’t make much difference 31 25 26 0 -6
Worse off 40 45 45 0 +5
Impact of leaving EU on unemployment % % %
Higher 25 32 37 +4 +12
Won’t make much difference 46 44 44 0 -2
Lower 24 20 14 -6 -10
Unweighted base 1105 1025 958
*The wording of the relevant questions, full details of which are given in the appendix to this chapter, was amended slightly in 2017Figures showing change between 2017 and 2018 and between 2015 and 2018 in this table are calculated from the unrounded data, rather than the data rounded to the nearest whole number that are reported in the table. As a result, they will sometimes vary from the difference between the rounded figures by +/-1 point
The National Centre for Social Research
British Social Attitudes 36 | The EU Debate 7
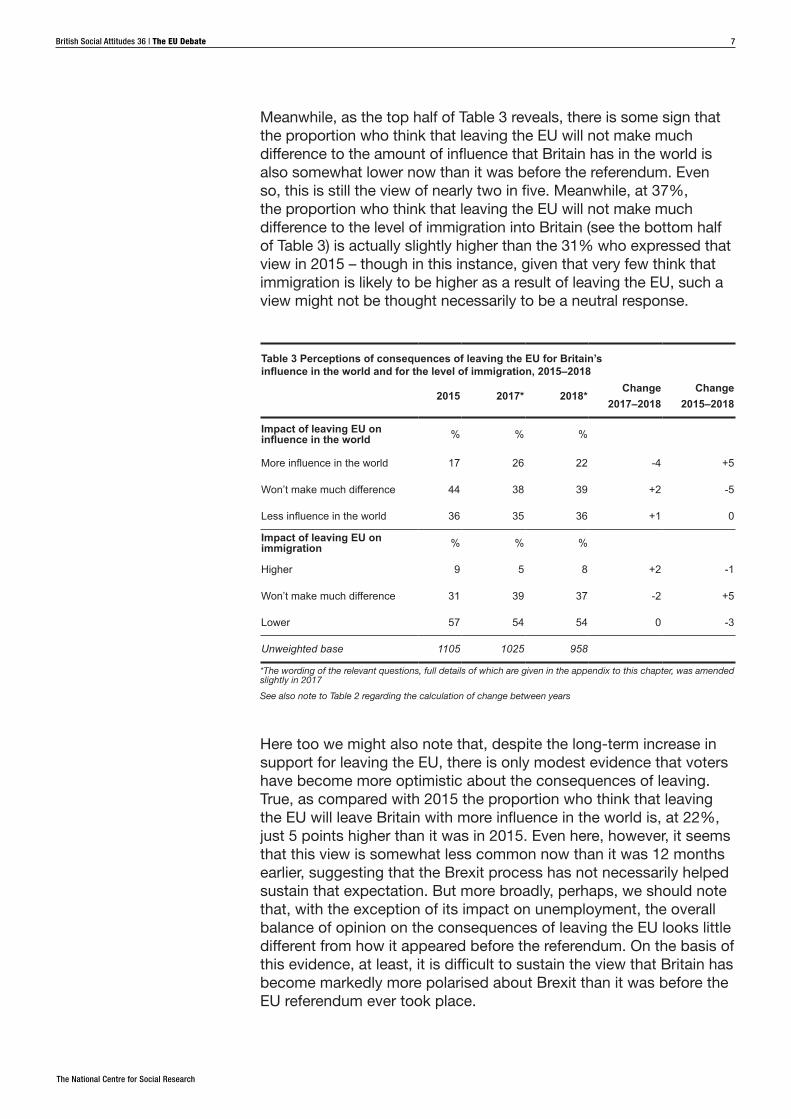
Meanwhile, as the top half of Table 3 reveals, there is some sign that the proportion who think that leaving the EU will not make much difference to the amount of influence that Britain has in the world is also somewhat lower now than it was before the referendum. Even so, this is still the view of nearly two in five. Meanwhile, at 37%, the proportion who think that leaving the EU will not make much difference to the level of immigration into Britain (see the bottom half of Table 3) is actually slightly higher than the 31% who expressed that view in 2015 – though in this instance, given that very few think that immigration is likely to be higher as a result of leaving the EU, such a view might not be thought necessarily to be a neutral response.
Table 3 Perceptions of consequences of leaving the EU for Britain’s influence in the world and for the level of immigration, 2015–2018
2015 2017* 2018*Change
2017–2018Change
2015–2018
Impact of leaving EU on influence in the world % % %
More influence in the world 17 26 22 -4 +5
Won’t make much difference 44 38 39 +2 -5
Less influence in the world 36 35 36 +1 0
Impact of leaving EU on immigration % % %
Higher 9 5 8 +2 -1
Won’t make much difference 31 39 37 -2 +5
Lower 57 54 54 0 -3
Unweighted base 1105 1025 958
*The wording of the relevant questions, full details of which are given in the appendix to this chapter, was amended slightly in 2017See also note to Table 2 regarding the calculation of change between years
Here too we might also note that, despite the long-term increase in support for leaving the EU, there is only modest evidence that voters have become more optimistic about the consequences of leaving. True, as compared with 2015 the proportion who think that leaving the EU will leave Britain with more influence in the world is, at 22%, just 5 points higher than it was in 2015. Even here, however, it seems that this view is somewhat less common now than it was 12 months earlier, suggesting that the Brexit process has not necessarily helped sustain that expectation. But more broadly, perhaps, we should note that, with the exception of its impact on unemployment, the overall balance of opinion on the consequences of leaving the EU looks little different from how it appeared before the referendum. On the basis of this evidence, at least, it is difficult to sustain the view that Britain has become markedly more polarised about Brexit than it was before the EU referendum ever took place.
The National Centre for Social Research
British Social Attitudes 36 | The EU Debate 8
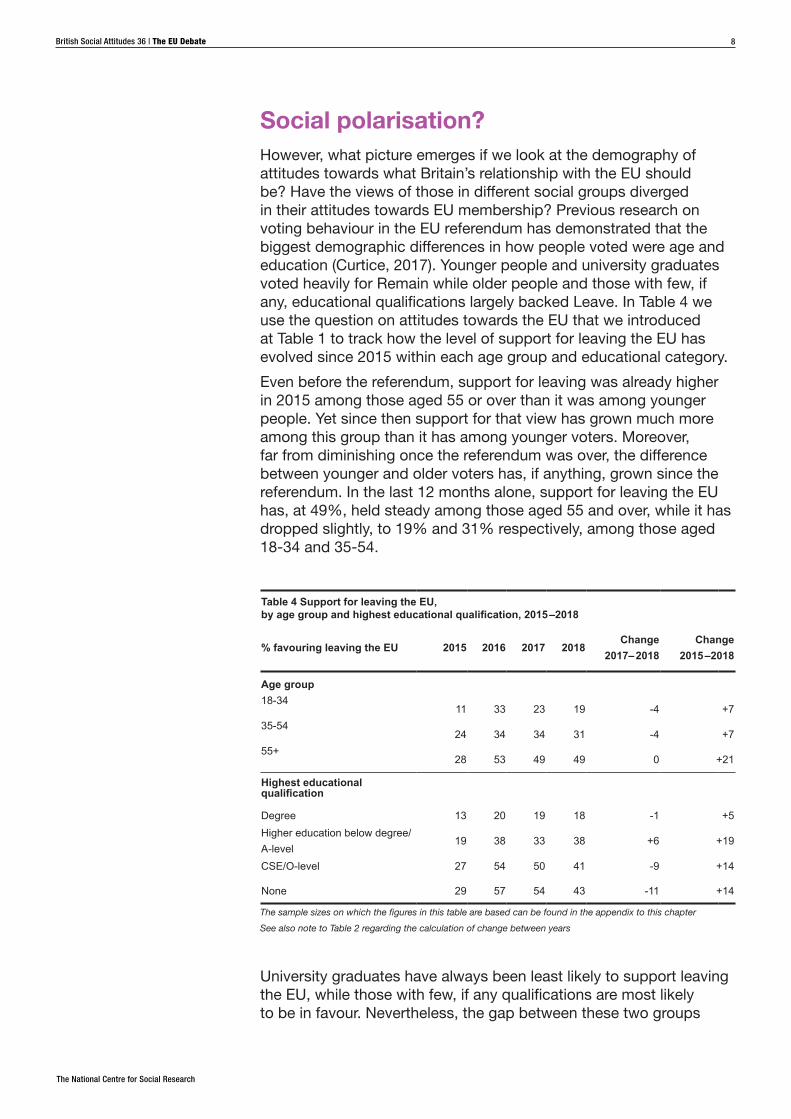
Social polarisation?However, what picture emerges if we look at the demography of attitudes towards what Britain’s relationship with the EU should be? Have the views of those in different social groups diverged in their attitudes towards EU membership? Previous research on voting behaviour in the EU referendum has demonstrated that the biggest demographic differences in how people voted were age and education (Curtice, 2017). Younger people and university graduates voted heavily for Remain while older people and those with few, if any, educational qualifications largely backed Leave. In Table 4 we use the question on attitudes towards the EU that we introduced at Table 1 to track how the level of support for leaving the EU has evolved since 2015 within each age group and educational category.
Even before the referendum, support for leaving was already higher in 2015 among those aged 55 or over than it was among younger people. Yet since then support for that view has grown much more among this group than it has among younger voters. Moreover, far from diminishing once the referendum was over, the difference between younger and older voters has, if anything, grown since the referendum. In the last 12 months alone, support for leaving the EU has, at 49%, held steady among those aged 55 and over, while it has dropped slightly, to 19% and 31% respectively, among those aged 18-34 and 35-54.
Table 4 Support for leaving the EU, by age group and highest educational qualification, 2015 –2018
% favouring leaving the EU 2015 2016 2017 2018Change
2017– 2018Change
2015 –2018
Age group18-34
11 33 23 19 -4 +735-54
24 34 34 31 -4 +755+
28 53 49 49 0 +21
Highest educational qualification
Degree 13 20 19 18 -1 +5Higher education below degree/A-level
19 38 33 38 +6 +19
CSE/O-level 27 54 50 41 -9 +14
None 29 57 54 43 -11 +14
The sample sizes on which the figures in this table are based can be found in the appendix to this chapterSee also note to Table 2 regarding the calculation of change between years
University graduates have always been least likely to support leaving the EU, while those with few, if any qualifications are most likely to be in favour. Nevertheless, the gap between these two groups
The National Centre for Social Research
British Social Attitudes 36 | The EU Debate 9
is wider now than it was before the referendum. As many as 43% of those without any qualifications now support leaving the EU, whereas only 18% of graduates do so, a difference of 25 points. In contrast, in 2015 the equivalent gap was just 16 points. That said, after widening by the time of the referendum to as much as 37 points, and despite remaining almost as high (35 points) in 2017, the gap has now narrowed somewhat (to 25 points). So, although the degree of polarisation by age is as strong as it ever has been, there is some evidence that the division by educational background may have diminished somewhat during the course of the Brexit negotiations.
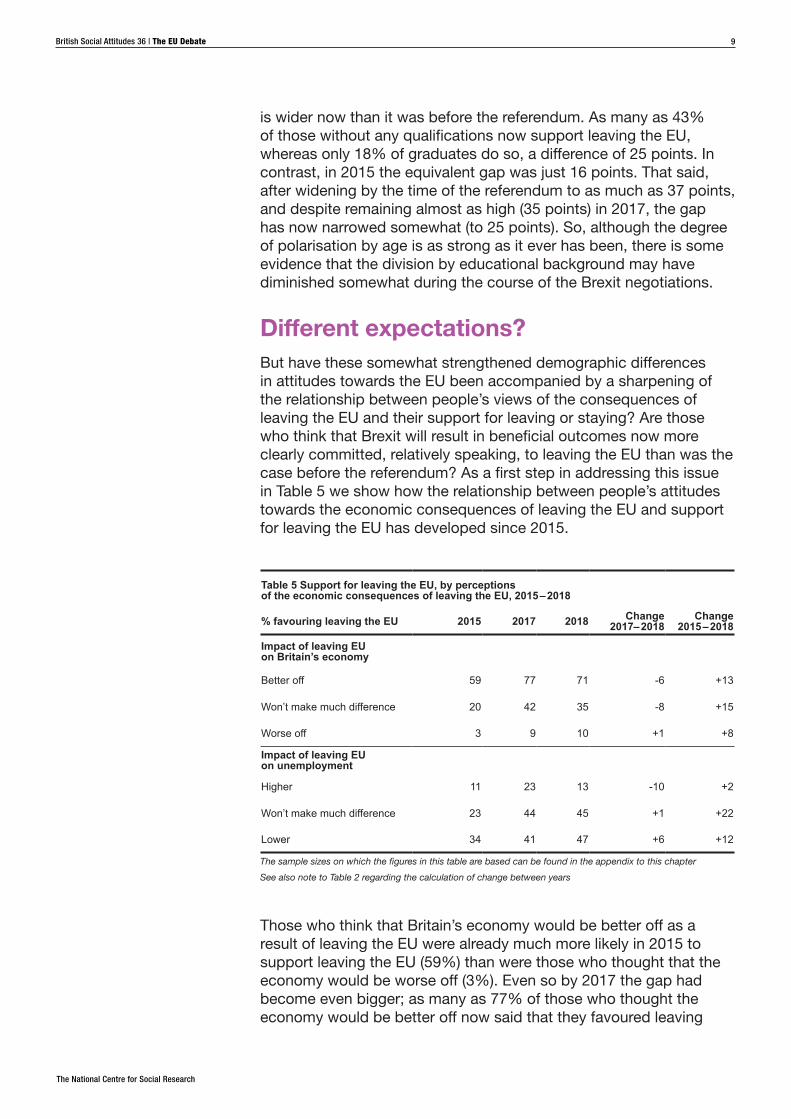
Different expectations?But have these somewhat strengthened demographic differences in attitudes towards the EU been accompanied by a sharpening of the relationship between people’s views of the consequences of leaving the EU and their support for leaving or staying? Are those who think that Brexit will result in beneficial outcomes now more clearly committed, relatively speaking, to leaving the EU than was the case before the referendum? As a first step in addressing this issue in Table 5 we show how the relationship between people’s attitudes towards the economic consequences of leaving the EU and support for leaving the EU has developed since 2015.
Table 5 Support for leaving the EU, by perceptions of the economic consequences of leaving the EU, 2015 – 2018
% favouring leaving the EU 2015 2017 2018 Change 2017– 2018
Change 2015 – 2018
Impact of leaving EU on Britain’s economy
Better off 59 77 71 -6 +13
Won’t make much difference 20 42 35 -8 +15
Worse off 3 9 10 +1 +8
Impact of leaving EU on unemployment
Higher 11 23 13 -10 +2
Won’t make much difference 23 44 45 +1 +22
Lower 34 41 47 +6 +12
The sample sizes on which the figures in this table are based can be found in the appendix to this chapter See also note to Table 2 regarding the calculation of change between years
Those who think that Britain’s economy would be better off as a result of leaving the EU were already much more likely in 2015 to support leaving the EU (59%) than were those who thought that the economy would be worse off (3%). Even so by 2017 the gap had become even bigger; as many as 77% of those who thought the economy would be better off now said that they favoured leaving
The National Centre for Social Research
British Social Attitudes 36 | The EU Debate 10
the EU, compared with just 9% of those who thought we would be worse off. However, some of that increased divergence has not been sustained in the last 12 months, during which period support for leaving has fallen somewhat among those who think leaving the EU will be economically beneficial, while holding steady among those who believe it will bring adverse consequences. Overall, it would seem safest to conclude that even before the referendum support for leaving the EU was already quite heavily polarised on the basis of what people reckoned the economic consequences of Brexit would be, and that this still remains the case even though more than two years have passed since the referendum was held.
However, in the case of the anticipated consequences of leaving the EU for unemployment, the link with people’s attitudes towards EU membership does seem to have strengthened somewhat. Support for leaving the EU among those who think that unemployment will be higher as a result of leaving is now little different from what it was in 2015. In contrast, support for leaving among those who think that unemployment will be lower has grown by as much as 12 points since then. Moreover, around half of that increase has occurred in the last 12 months. That said, the largest increase in support for leaving the EU (a rise of 22 points) has occurred among those who think that leaving the EU will not make much difference to unemployment. Thus, in effect the divergence on this subject has come to be one simply between those who think that unemployment will go up and those who do not. Meanwhile, we should also bear in mind that the relationship between support for leaving and expectations of the implications of leaving for unemployment was weaker before the referendum than the equivalent relationship with the perceived consequences for the economy generally, and thus there was perhaps more scope in the first place for attitudes to diverge further during the course of the Brexit process.
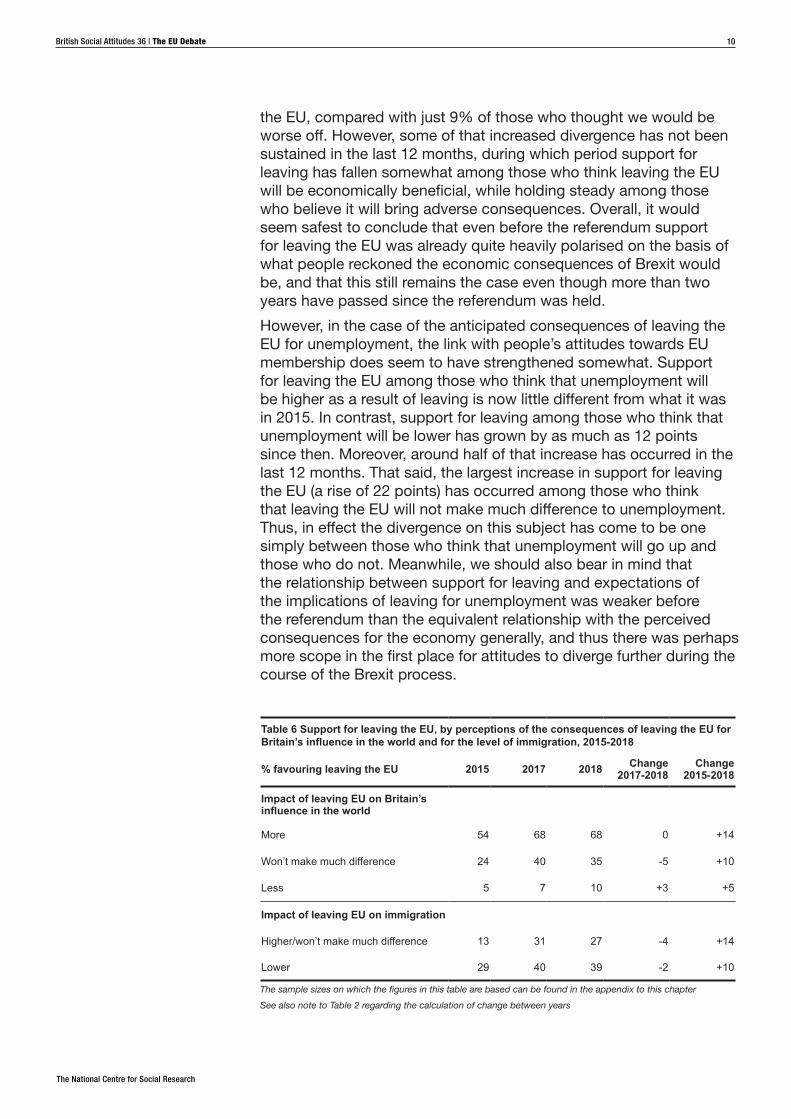
Table 6 Support for leaving the EU, by perceptions of the consequences of leaving the EU for Britain’s influence in the world and for the level of immigration, 2015-2018
% favouring leaving the EU 2015 2017 2018 Change 2017-2018
Change 2015-2018
Impact of leaving EU on Britain’s influence in the world
More 54 68 68 0 +14
Won’t make much difference 24 40 35 -5 +10
Less 5 7 10 +3 +5
Impact of leaving EU on immigration
Higher/won’t make much difference 13 31 27 -4 +14
Lower 29 40 39 -2 +10
The sample sizes on which the figures in this table are based can be found in the appendix to this chapterSee also note to Table 2 regarding the calculation of change between years
The National Centre for Social Research
British Social Attitudes 36 | The EU Debate 11
Support for leaving the EU was already quite strongly related to perceptions of the consequences of leaving the EU for Britain’s influence in the world in 2015, albeit not to the same extent as expectations of the impact on the economy in general (see the top half of Table 6). Thus, given what we have seen so far, it is perhaps not surprising to discover that in this case attitudes may have subsequently diverged somewhat, but not to any great degree. Support for leaving the EU is now 14 points higher among those who think that Britain will have more influence in the world as a result of leaving, compared with 5 points higher among those who think the country’s influence will be diminished. However, in so far as attitudes may have polarised, it also looks as though any such pattern has been reversed somewhat during the last 12 months.
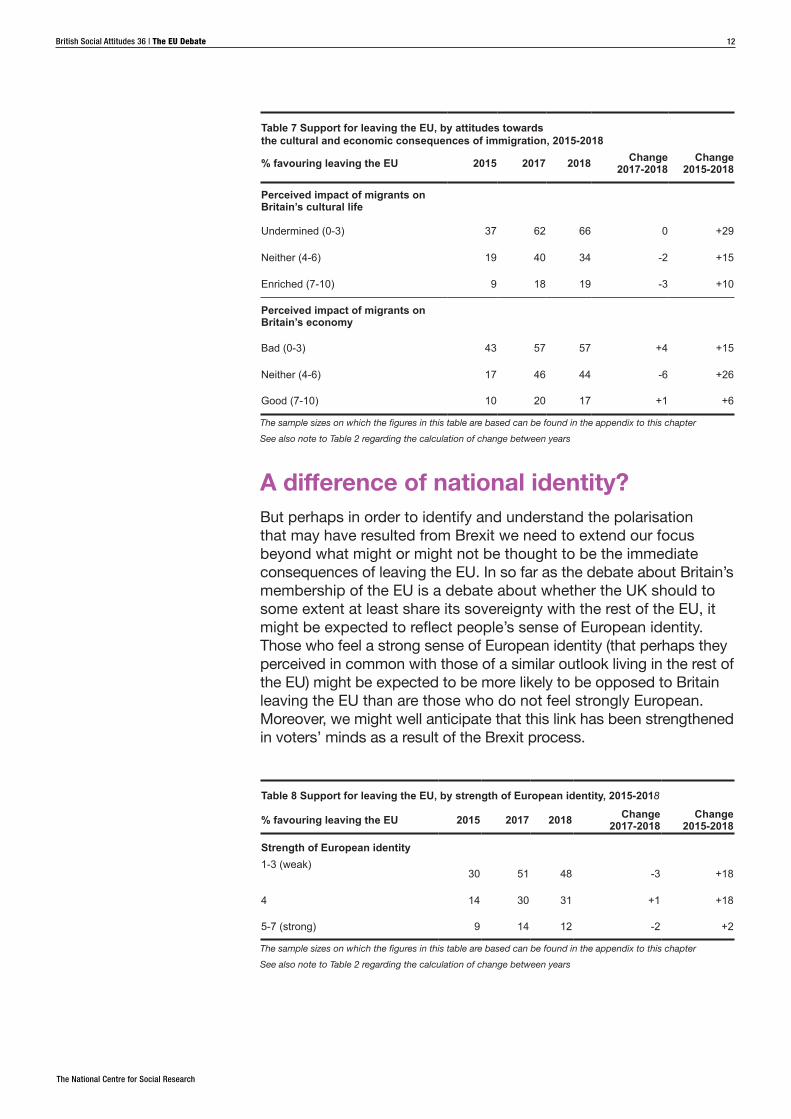
Even though in 2015 support for leaving the EU varied relatively little according to people’s expectations of what leaving would mean for immigration, there is no sign that this relationship has subsequently strengthened (see the bottom half of Table 6). Support for leaving the EU has increased more or less regardless of where people stand on immigration. But here the debate is not so much about whether or not immigration will fall if Britain leaves the EU but rather about whether such a development is desirable or not. That this is indeed the case is evident in Table 7. In this table, we divide voters into three groups according to the answer they gave when they were asked to use a zero to ten scale to indicate whether they thought migrants who come to Britain from other countries (a) “undermine or enrich Britain’s cultural life”, and (b) are “good or bad for Britain’s economy”.
Even in 2015, those who thought that migration undermined Britain’s cultural life were already markedly more likely to back leaving the EU (see the top half of Table 7). As many as 37% of this group were in favour of leaving the EU, compared with just 9% of those who reckoned the country’s cultural life has been enriched by migration. Yet, even though support for leaving is now 10 points higher among the latter set of voters, the gap between the two groups is now sharper, thanks to the fact that the equivalent increase among those who think that Britain’s cultural life is undermined has been as much as 29 points. In the case of the economic consequences of migration, however, the evidence of divergence is less strong, though, at 15 points, the increase in support for leaving since 2015 has been rather greater among those who think that migration has been bad for the economy than it has been among those who think it has been good (6 points). In both cases, however, the strengthening of the link between people’s views about migration and their attitude towards leaving the EU occurred wholly in the period between 2015 and 2017. In the last 12 months, the heightened level of polarisation has simply been maintained.
The National Centre for Social Research
British Social Attitudes 36 | The EU Debate 12
Table 7 Support for leaving the EU, by attitudes towards the cultural and economic consequences of immigration, 2015-2018
% favouring leaving the EU 2015 2017 2018 Change 2017-2018
Change 2015-2018
Perceived impact of migrants on Britain’s cultural life
Undermined (0-3) 37 62 66 0 +29
Neither (4-6) 19 40 34 -2 +15
Enriched (7-10) 9 18 19 -3 +10
Perceived impact of migrants on Britain’s economy
Bad (0-3) 43 57 57 +4 +15
Neither (4-6) 17 46 44 -6 +26
Good (7-10) 10 20 17 +1 +6
The sample sizes on which the figures in this table are based can be found in the appendix to this chapterSee also note to Table 2 regarding the calculation of change between years
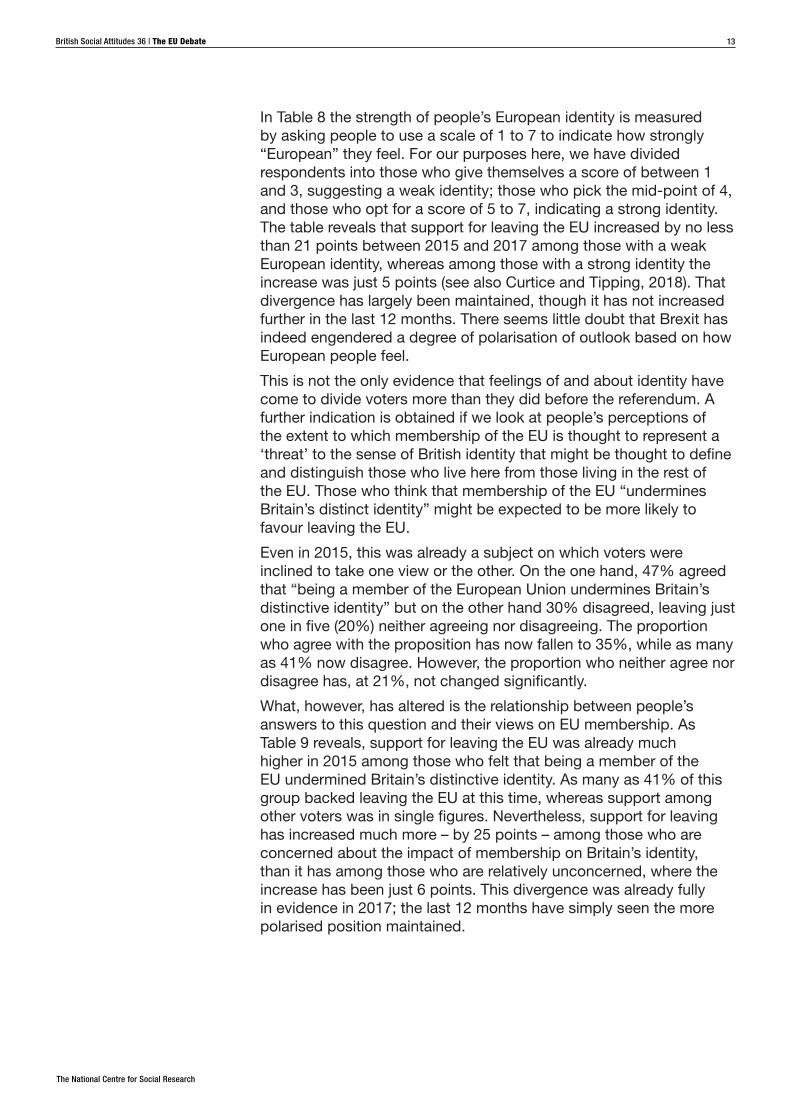
A difference of national identity?But perhaps in order to identify and understand the polarisation that may have resulted from Brexit we need to extend our focus beyond what might or might not be thought to be the immediate consequences of leaving the EU. In so far as the debate about Britain’s membership of the EU is a debate about whether the UK should to some extent at least share its sovereignty with the rest of the EU, it might be expected to reflect people’s sense of European identity. Those who feel a strong sense of European identity (that perhaps they perceived in common with those of a similar outlook living in the rest of the EU) might be expected to be more likely to be opposed to Britain leaving the EU than are those who do not feel strongly European. Moreover, we might well anticipate that this link has been strengthened in voters’ minds as a result of the Brexit process.
Table 8 Support for leaving the EU, by strength of European identity, 2015-2018
% favouring leaving the EU 2015 2017 2018 Change 2017-2018
Change 2015-2018
Strength of European identity1-3 (weak)
30 51 48 -3 +18
4 14 30 31 +1 +18
5-7 (strong) 9 14 12 -2 +2
The sample sizes on which the figures in this table are based can be found in the appendix to this chapterSee also note to Table 2 regarding the calculation of change between years
The National Centre for Social Research
British Social Attitudes 36 | The EU Debate 13
In Table 8 the strength of people’s European identity is measured by asking people to use a scale of 1 to 7 to indicate how strongly “European” they feel. For our purposes here, we have divided respondents into those who give themselves a score of between 1 and 3, suggesting a weak identity; those who pick the mid-point of 4, and those who opt for a score of 5 to 7, indicating a strong identity. The table reveals that support for leaving the EU increased by no less than 21 points between 2015 and 2017 among those with a weak European identity, whereas among those with a strong identity the increase was just 5 points (see also Curtice and Tipping, 2018). That divergence has largely been maintained, though it has not increased further in the last 12 months. There seems little doubt that Brexit has indeed engendered a degree of polarisation of outlook based on how European people feel.
This is not the only evidence that feelings of and about identity have come to divide voters more than they did before the referendum. A further indication is obtained if we look at people’s perceptions of the extent to which membership of the EU is thought to represent a ‘threat’ to the sense of British identity that might be thought to define and distinguish those who live here from those living in the rest of the EU. Those who think that membership of the EU “undermines Britain’s distinct identity” might be expected to be more likely to favour leaving the EU.
Even in 2015, this was already a subject on which voters were inclined to take one view or the other. On the one hand, 47% agreed that “being a member of the European Union undermines Britain’s distinctive identity” but on the other hand 30% disagreed, leaving just one in five (20%) neither agreeing nor disagreeing. The proportion who agree with the proposition has now fallen to 35%, while as many as 41% now disagree. However, the proportion who neither agree nor disagree has, at 21%, not changed significantly.
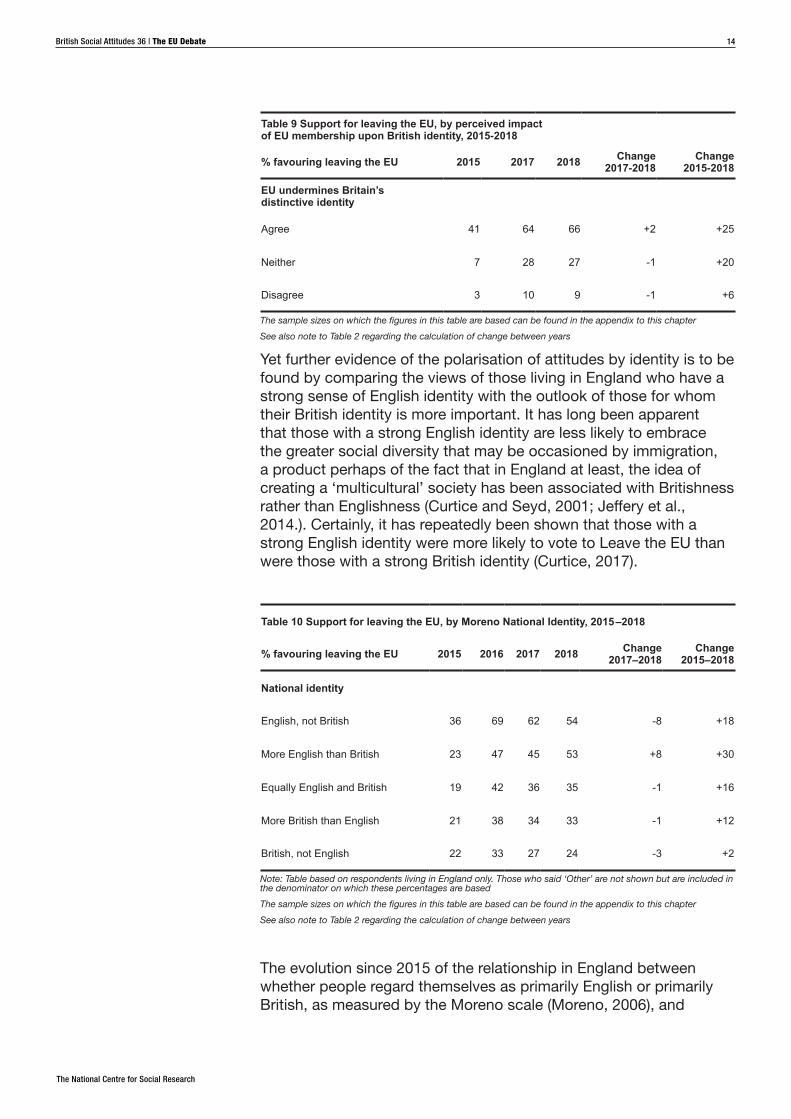
What, however, has altered is the relationship between people’s answers to this question and their views on EU membership. As Table 9 reveals, support for leaving the EU was already much higher in 2015 among those who felt that being a member of the EU undermined Britain’s distinctive identity. As many as 41% of this group backed leaving the EU at this time, whereas support among other voters was in single figures. Nevertheless, support for leaving has increased much more – by 25 points – among those who are concerned about the impact of membership on Britain’s identity, than it has among those who are relatively unconcerned, where the increase has been just 6 points. This divergence was already fully in evidence in 2017; the last 12 months have simply seen the more polarised position maintained.
The National Centre for Social Research
British Social Attitudes 36 | The EU Debate 14
Table 9 Support for leaving the EU, by perceived impact of EU membership upon British identity, 2015-2018
% favouring leaving the EU 2015 2017 2018 Change 2017-2018
Change 2015-2018
EU undermines Britain’s distinctive identity
Agree 41 64 66 +2 +25
Neither 7 28 27 -1 +20
Disagree 3 10 9 -1 +6
The sample sizes on which the figures in this table are based can be found in the appendix to this chapter See also note to Table 2 regarding the calculation of change between years
Yet further evidence of the polarisation of attitudes by identity is to be found by comparing the views of those living in England who have a strong sense of English identity with the outlook of those for whom their British identity is more important. It has long been apparent that those with a strong English identity are less likely to embrace the greater social diversity that may be occasioned by immigration, a product perhaps of the fact that in England at least, the idea of creating a ‘multicultural’ society has been associated with Britishness rather than Englishness (Curtice and Seyd, 2001; Jeffery et al., 2014.). Certainly, it has repeatedly been shown that those with a strong English identity were more likely to vote to Leave the EU than were those with a strong British identity (Curtice, 2017).
Table 10 Support for leaving the EU, by Moreno National Identity, 2015 –2018
% favouring leaving the EU 2015 2016 2017 2018 Change 2017–2018
Change 2015–2018
National identity
English, not British 36 69 62 54 -8 +18
More English than British 23 47 45 53 +8 +30
Equally English and British 19 42 36 35 -1 +16
More British than English 21 38 34 33 -1 +12
British, not English 22 33 27 24 -3 +2
Note: Table based on respondents living in England only. Those who said ‘Other’ are not shown but are included in the denominator on which these percentages are basedThe sample sizes on which the figures in this table are based can be found in the appendix to this chapterSee also note to Table 2 regarding the calculation of change between years
The evolution since 2015 of the relationship in England between whether people regard themselves as primarily English or primarily British, as measured by the Moreno scale (Moreno, 2006), and
The National Centre for Social Research
British Social Attitudes 36 | The EU Debate 15
support for leaving the EU is shown in Table 102. Support for leaving has increased most among those who regard themselves are either “English, not British” (by 18 points) or “More English than British” (by 30 points), whereas it has hardly grown at all among those who regard themselves are “British, not English”. As a result, what in 2015 was still a relatively weak relationship is now much stronger. Over half of those who feel primarily English support leaving the EU, whereas among those who say they are “British, not English”, only around a quarter (24%) do so. Here too, however, it appears that the polarisation of views occurred between 2015 and 2017 and since then has simply been maintained at its heightened level.
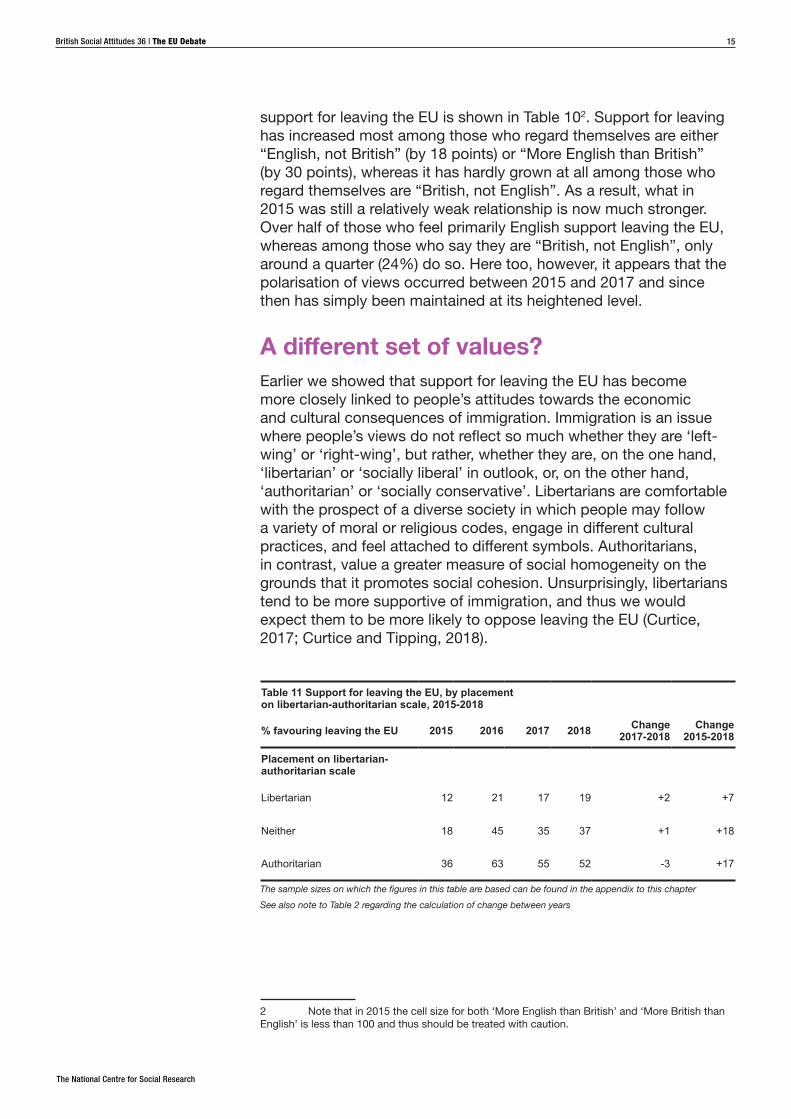
A different set of values?Earlier we showed that support for leaving the EU has become more closely linked to people’s attitudes towards the economic and cultural consequences of immigration. Immigration is an issue where people’s views do not reflect so much whether they are ‘left-wing’ or ‘right-wing’, but rather, whether they are, on the one hand, ‘libertarian’ or ‘socially liberal’ in outlook, or, on the other hand, ‘authoritarian’ or ‘socially conservative’. Libertarians are comfortable with the prospect of a diverse society in which people may follow a variety of moral or religious codes, engage in different cultural practices, and feel attached to different symbols. Authoritarians, in contrast, value a greater measure of social homogeneity on the grounds that it promotes social cohesion. Unsurprisingly, libertarians tend to be more supportive of immigration, and thus we would expect them to be more likely to oppose leaving the EU (Curtice, 2017; Curtice and Tipping, 2018).
Table 11 Support for leaving the EU, by placement on libertarian-authoritarian scale, 2015-2018
% favouring leaving the EU 2015 2016 2017 2018 Change 2017-2018
Change 2015-2018
Placement on libertarian-authoritarian scale
Libertarian 12 21 17 19 +2 +7
Neither 18 45 35 37 +1 +18
Authoritarian 36 63 55 52 -3 +17
The sample sizes on which the figures in this table are based can be found in the appendix to this chapter See also note to Table 2 regarding the calculation of change between years
2 Note that in 2015 the cell size for both ‘More English than British’ and ‘More British than English’ is less than 100 and thus should be treated with caution.
The National Centre for Social Research
British Social Attitudes 36 | The EU Debate 16
Each year, BSA asks its respondents a series of six questions designed to assess where they stand on the ‘libertarian’/’authoritarian’ dimension (see Appendix for more details). In Table 11 we divide respondents into the third most ‘liberal’ on the resulting scale, the third most ‘authoritarian’, and the third who sit in the middle. We can see that, even in 2015, support for leaving the EU was, at 36%, markedly higher among ‘authoritarians’ than it was among ‘libertarians’ (12%). However, by 2017 the gap had widened somewhat. So, once again, there is evidence of a degree of polarisation, albeit one that has simply been maintained rather than increased further during the last year.
A more polarised Britain?We have, then, uncovered considerable evidence that the Brexit process has served to polarise attitudes towards the EU. The link between social background and attitudes towards membership of the EU is stronger than it was before the referendum. Attitudes towards immigration and some of the consequences of leaving the EU now identify more accurately who is more likely to support leaving than was previously the case – and where that has not been the case then sometimes (for example, perceptions of the economic consequences of leaving) there was already a strong relationship in place. Meanwhile, there are strengthened relationships too between support for leaving the EU and both people’s sense of identity and their broader libertarian or authoritarian values. True, for the most part, there is little evidence that this polarisation has increased further during the last 12 months as the Brexit negotiations have continued, but equally, there is little sign either that it has eased. If the referendum served initially to polarise attitudes towards the EU, the subsequent Brexit process has served to ensure that the legacy of the referendum is still in evidence even though polling day has long since come and gone.
The consequences of polarisation: a new sense of Brexit identity?We have, then, uncovered a picture whereby people from different social backgrounds, and people with different attitudes, values and identities now disagree more sharply with each other about whether or not Britain should leave the EU. Yet we have also found that this does not necessarily mean that the overall balance of expectations of the consequences of leaving the EU has changed markedly. This picture of sharp division but apparent relative stability of attitudes is very different from the portrayal of the British electorate that has become commonplace in recent years. Ever since the 1970s, academic research into voting behaviour in Britain has identified three key developments. First, the traditional link between someone’s
The National Centre for Social Research
British Social Attitudes 36 | The EU Debate 17
social class and the way that they vote has weakened (Evans and Tilley, 2017). Being middle class or working class has become less likely to mean that someone votes Conservative or Labour respectively. Second, voters appear to have become more volatile in their views – they are less likely to vote the same way from one election to the next (Fieldhouse et al., forthcoming), not least perhaps because they think there is not necessarily a great deal of difference between the parties (Curtice and Simpson, 2018) and, consequently, elections have simply come to be about choosing which party can best manage the country (Clarke et al., 2009). Third, in tandem with the above developments fewer and fewer voters seem to feel strongly committed to any one political party, and thus identify themselves as being a ‘Conservative’ or a ‘Labour supporter’ (Sanders, 2017). In short, the electorate is portrayed as not being sharply divided, not being strongly committed to any one party, and thus as potentially volatile in the choices they make at the ballot box.
The prevalence and strength of partisan identity (often known as ‘party identification’) has been tracked continuously by BSA since 1987. In order to ascertain whether someone does or does not identify with a political party, the survey asks first:
Generally speaking, do you think of yourself as a supporter of any one political party?
If someone does not say ‘Yes’ in response to this question, they are then also asked:
Do you think of yourself as a little closer to one political party than to the others?
If someone says ‘Yes’ in response to either of these two questions they are asked to state with which party they identify – and then with reference to the party that they name:
Would you call yourself very strong (party), fairly strong, or not very strong?
Table 12 shows the pattern of response to the last of these questions for selected years (mostly election years) since 1987, together with the proportion who in each year did not respond positively to either of our initial two questions. Even 30 years ago, only around one in ten regarded themselves as a very strong identifier with a political party, while just one in three considered themselves to be a fairly strong identifier – a combined tally of 44%. Nevertheless, by 2001 that total had fallen to just 33%, and has not shown any consistent

The National Centre for Social Research
British Social Attitudes 36 | The EU Debate 18
sign of increasing since. Meanwhile, whereas in 1987 only around a quarter (26%) indicated that they neither supported nor were closer to any political party, by 2010 this figure had reached 41%, and it still stands as high as 39% in our most recent survey. In short, very strong identifiers have long been a relative rarity, yet the prevalence and strength of party identification have fallen yet further during the course of the last 30 years.
Table 12 Prevalence and strength of party identification, 1987-2018
1987 1991 1997 2001 2005 2010 2015 2016 2017 2018
Strength of party identification % % % % % % % % % %
Very strong 11 8 10 7 7 7 9 8 10 8
Fairly strong 33 33 26 26 26 26 28 27 29 27
Not very strong 29 32 32 34 31 41 26 28 25 26
None 26 26 32 31 37 41 37 37 36 39
Unweighted base 2847 2918 1355 3287 4268 3297 4328 2942 3988 3879
But what might we expect to happen if we pose a similar set of questions about whether someone is a ‘Remainer’ or a ‘Leaver’? On the one hand, there seems very little reason to anticipate that many voters should think of themselves in that way. Neither label existed before the EU referendum, and, unlike party identity, neither refers to a permanent political organisation whose activities and utterances can help sustain someone’s sense of identity. On the other hand, if the low level of party identification to be found nowadays in the British electorate has been occasioned by the absence of sharp ideological and demographic differences between the parties, then the fact that the electorate do appear to have been polarised by the Brexit referendum – and remain so some two years after the original ballot – might have created the conditions for people to form a bond and identify with one side or the other in the continuing Brexit debate.
In order to ascertain which expectation is closer to the truth, in our most recent survey we asked a series of questions that mimic as closely as possible the questions asked on BSA about party identity. We ask first:
Thinking about Britain’s relationship with the European Union, do you think of yourself as a ‘Remainer’, a ‘Leaver’, or do you not think of yourself in that way?
If someone says they do not think of themselves in that way we then ask:
The National Centre for Social Research
British Social Attitudes 36 | The EU Debate 19
Do you think of yourself as a little closer to one side or the other?
After which, if someone declares themselves to be a ‘Remainer’ or a ‘Leaver’, we ask:
Would you call yourself a very strong (Remainer/Leaver), fairly strong or not very strong?
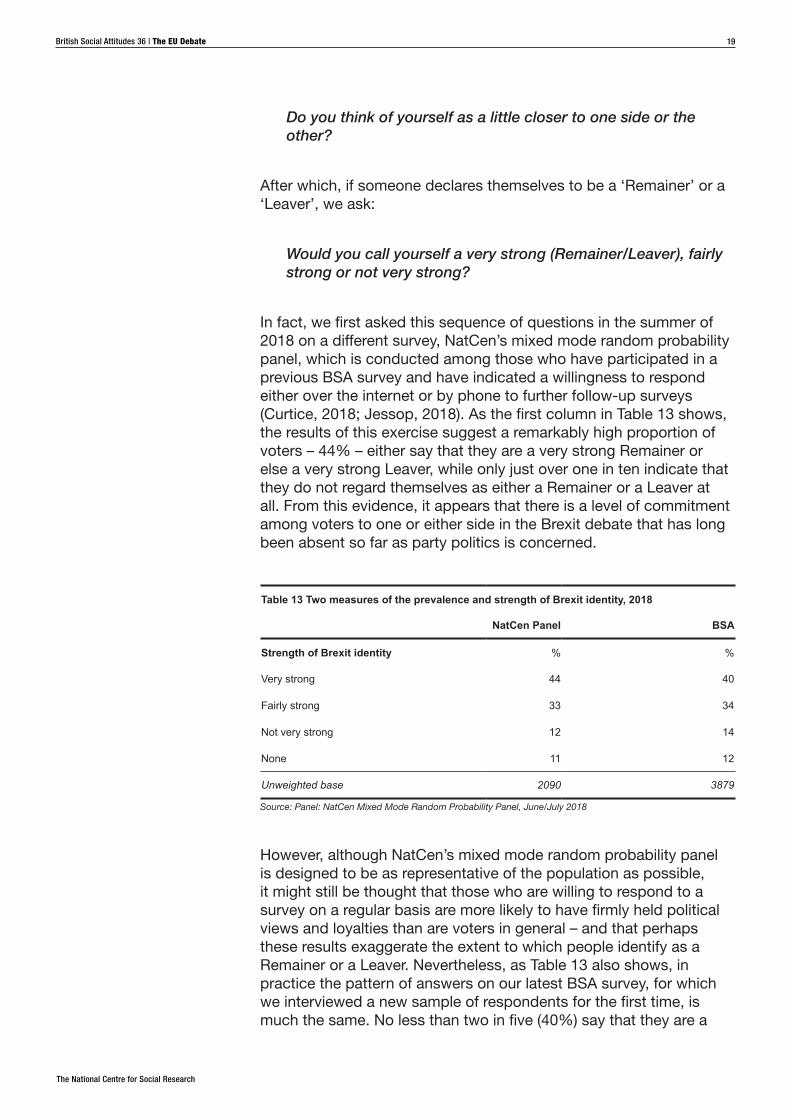
In fact, we first asked this sequence of questions in the summer of 2018 on a different survey, NatCen’s mixed mode random probability panel, which is conducted among those who have participated in a previous BSA survey and have indicated a willingness to respond either over the internet or by phone to further follow-up surveys (Curtice, 2018; Jessop, 2018). As the first column in Table 13 shows, the results of this exercise suggest a remarkably high proportion of voters – 44% – either say that they are a very strong Remainer or else a very strong Leaver, while only just over one in ten indicate that they do not regard themselves as either a Remainer or a Leaver at all. From this evidence, it appears that there is a level of commitment among voters to one or either side in the Brexit debate that has long been absent so far as party politics is concerned.
Table 13 Two measures of the prevalence and strength of Brexit identity, 2018
NatCen Panel BSA
Strength of Brexit identity % %
Very strong 44 40
Fairly strong 33 34
Not very strong 12 14
None 11 12
Unweighted base 2090 3879
Source: Panel: NatCen Mixed Mode Random Probability Panel, June/July 2018
However, although NatCen’s mixed mode random probability panel is designed to be as representative of the population as possible, it might still be thought that those who are willing to respond to a survey on a regular basis are more likely to have firmly held political views and loyalties than are voters in general – and that perhaps these results exaggerate the extent to which people identify as a Remainer or a Leaver. Nevertheless, as Table 13 also shows, in practice the pattern of answers on our latest BSA survey, for which we interviewed a new sample of respondents for the first time, is much the same. No less than two in five (40%) say that they are a
The National Centre for Social Research
British Social Attitudes 36 | The EU Debate 20
very strong Remainer or a very strong Leaver, only slightly below the 44% who gave such a response on the panel. It now seems that there is little doubt that the Brexit process has elicited a strength of commitment and identity that has hitherto long been absent among the British electorate so far as party politics is concerned. Indeed, according to the British Election Study, which has tracked the prevalence and strength of party identification over an even longer period than BSA, the proportion of voters who say they identify very strongly with one or other of the political parties has not been as high as 40% since the 1960s (Sanders, 2017).
This sense of Brexit identity is in evidence on both sides of the debate about the UK’s membership of the EU, though it is somewhat stronger among those who identify as a Remainer than it is among those who claim to be a Leaver (see also Curtice, 2018; Evans and Schaffner, 2019). As many as half (50%) of all those who say they are a Remainer say that their attachment to that side of the argument is ‘very strong’. Among Leavers the equivalent figure is only just over two in five (41%). Conversely, nearly one in five Leavers (19%) say their identity is not a very strong one, compared with around one in eight (13%) Remainers. The somewhat greater strength of identity among Remainers may reflect a sense of loss that some voters feel at the prospect of leaving the EU (Evans and Schaffner, 2019).
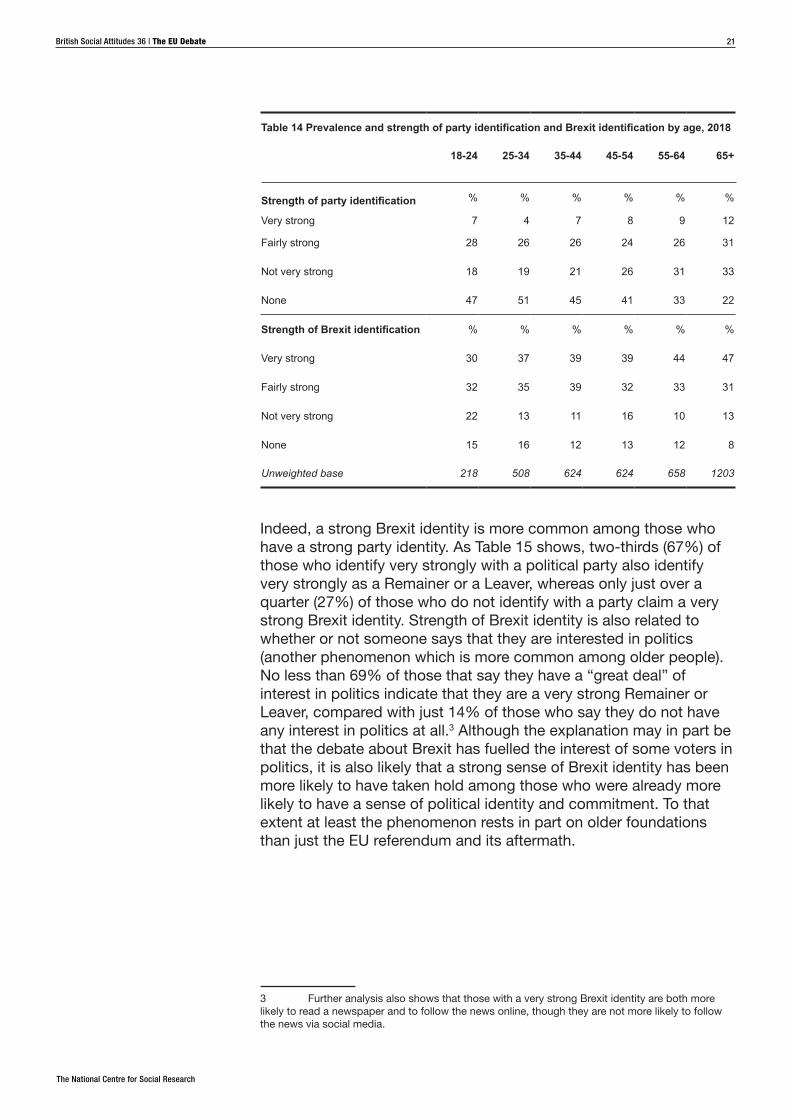
But if this sense of Brexit identity is indeed analogous to the identity that some express in respect of a political party, it should, perhaps, exhibit a similar demographic pattern as party identity. It has repeatedly been found that older people are both more likely to have a party identity and to say that they identify strongly with a party. That pattern is indeed found in our latest survey (see the top half of Table 14). It seems that party identification begins to develop in late childhood or early adulthood and is then gradually reinforced as people progress through their twenties and thirties – although the pattern in our data will also reflect the fact that the decline in partisan identity has been particularly evident in younger generations.
But is this pattern also in evidence in the case of Brexit identity? After all, in contrast to party identity, Brexit identity has emerged suddenly in the wake of the EU referendum, rather than being the product of a long-running social and political process that mostly influences people when they are relatively young.
In practice, much the same pattern is in evidence (see the bottom half of Table 14). Whereas nearly half (47%) of those aged 65 and over say that they are a very strong Remainer or a very strong Leaver, only three in ten (30%) of those aged between 18 and 24 make the same claim. Conversely more than one in three (37%) of those aged 18-24 either do not identify with one side or the other in the Brexit debate or say that they only do so “not very strongly”. This is true of only around one in five (21%) of those aged 65 and over.
The National Centre for Social Research
British Social Attitudes 36 | The EU Debate 21
Table 14 Prevalence and strength of party identification and Brexit identification by age, 2018
18-24 25-34 35-44 45-54 55-64 65+
Strength of party identification % % % % % %
Very strong 7 4 7 8 9 12
Fairly strong 28 26 26 24 26 31
Not very strong 18 19 21 26 31 33
None 47 51 45 41 33 22
Strength of Brexit identification % % % % % %
Very strong 30 37 39 39 44 47
Fairly strong 32 35 39 32 33 31
Not very strong 22 13 11 16 10 13
None 15 16 12 13 12 8
Unweighted base 218 508 624 624 658 1203
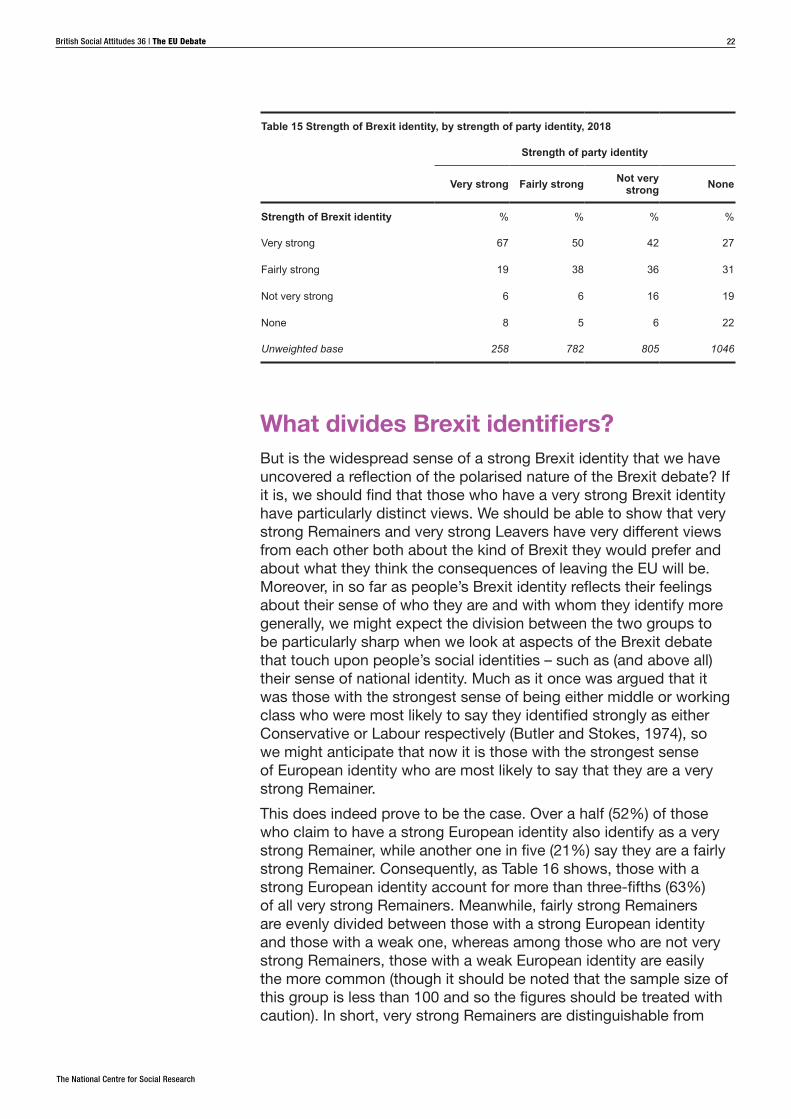
Indeed, a strong Brexit identity is more common among those who have a strong party identity. As Table 15 shows, two-thirds (67%) of those who identify very strongly with a political party also identify very strongly as a Remainer or a Leaver, whereas only just over a quarter (27%) of those who do not identify with a party claim a very strong Brexit identity. Strength of Brexit identity is also related to whether or not someone says that they are interested in politics (another phenomenon which is more common among older people). No less than 69% of those that say they have a “great deal” of interest in politics indicate that they are a very strong Remainer or Leaver, compared with just 14% of those who say they do not have any interest in politics at all.3 Although the explanation may in part be that the debate about Brexit has fuelled the interest of some voters in politics, it is also likely that a strong sense of Brexit identity has been more likely to have taken hold among those who were already more likely to have a sense of political identity and commitment. To that extent at least the phenomenon rests in part on older foundations than just the EU referendum and its aftermath.
3 Further analysis also shows that those with a very strong Brexit identity are both more likely to read a newspaper and to follow the news online, though they are not more likely to follow the news via social media.
The National Centre for Social Research
British Social Attitudes 36 | The EU Debate 22
Table 15 Strength of Brexit identity, by strength of party identity, 2018
Strength of party identity
Very strong Fairly strong Not very strong None
Strength of Brexit identity % % % %
Very strong 67 50 42 27
Fairly strong 19 38 36 31
Not very strong 6 6 16 19
None 8 5 6 22
Unweighted base 258 782 805 1046
What divides Brexit identifiers?But is the widespread sense of a strong Brexit identity that we have uncovered a reflection of the polarised nature of the Brexit debate? If it is, we should find that those who have a very strong Brexit identity have particularly distinct views. We should be able to show that very strong Remainers and very strong Leavers have very different views from each other both about the kind of Brexit they would prefer and about what they think the consequences of leaving the EU will be. Moreover, in so far as people’s Brexit identity reflects their feelings about their sense of who they are and with whom they identify more generally, we might expect the division between the two groups to be particularly sharp when we look at aspects of the Brexit debate that touch upon people’s social identities – such as (and above all) their sense of national identity. Much as it once was argued that it was those with the strongest sense of being either middle or working class who were most likely to say they identified strongly as either Conservative or Labour respectively (Butler and Stokes, 1974), so we might anticipate that now it is those with the strongest sense of European identity who are most likely to say that they are a very strong Remainer.
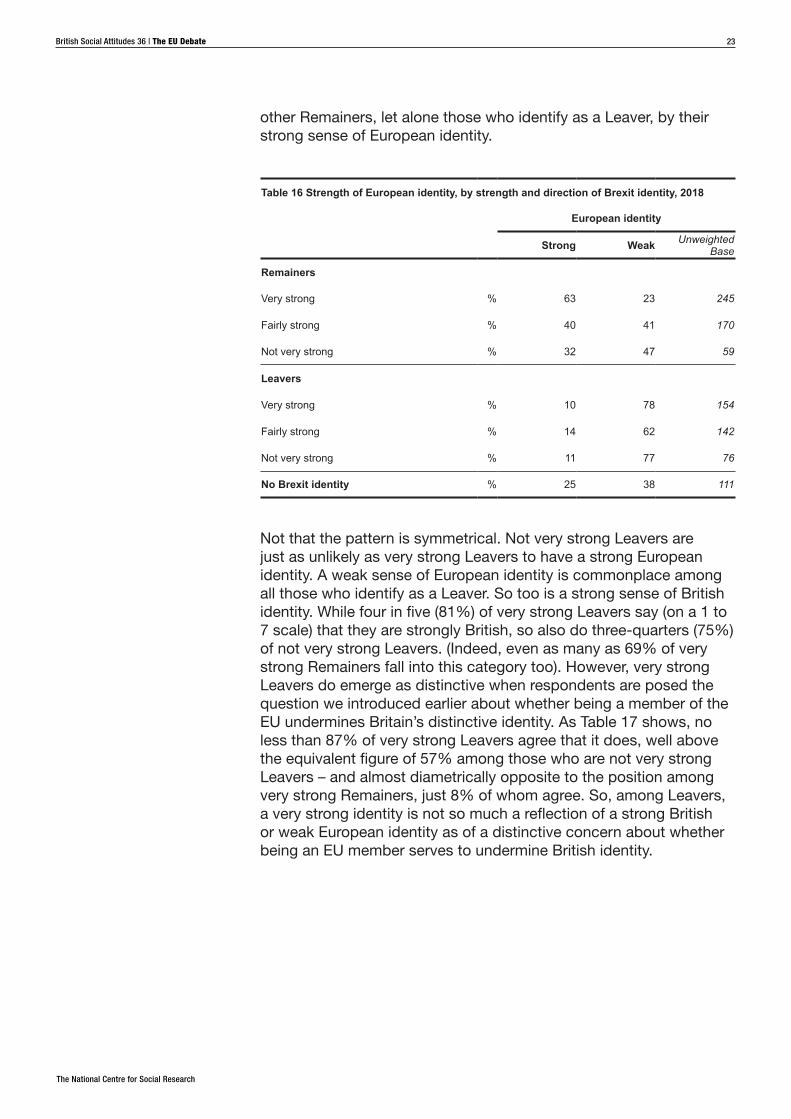
This does indeed prove to be the case. Over a half (52%) of those who claim to have a strong European identity also identify as a very strong Remainer, while another one in five (21%) say they are a fairly strong Remainer. Consequently, as Table 16 shows, those with a strong European identity account for more than three-fifths (63%) of all very strong Remainers. Meanwhile, fairly strong Remainers are evenly divided between those with a strong European identity and those with a weak one, whereas among those who are not very strong Remainers, those with a weak European identity are easily the more common (though it should be noted that the sample size of this group is less than 100 and so the figures should be treated with caution). In short, very strong Remainers are distinguishable from
The National Centre for Social Research
British Social Attitudes 36 | The EU Debate 23
other Remainers, let alone those who identify as a Leaver, by their strong sense of European identity.
Table 16 Strength of European identity, by strength and direction of Brexit identity, 2018
European identity
Strong Weak Unweighted Base
Remainers
Very strong % 63 23 245
Fairly strong % 40 41 170
Not very strong % 32 47 59
Leavers
Very strong % 10 78 154
Fairly strong % 14 62 142
Not very strong % 11 77 76
No Brexit identity % 25 38 111
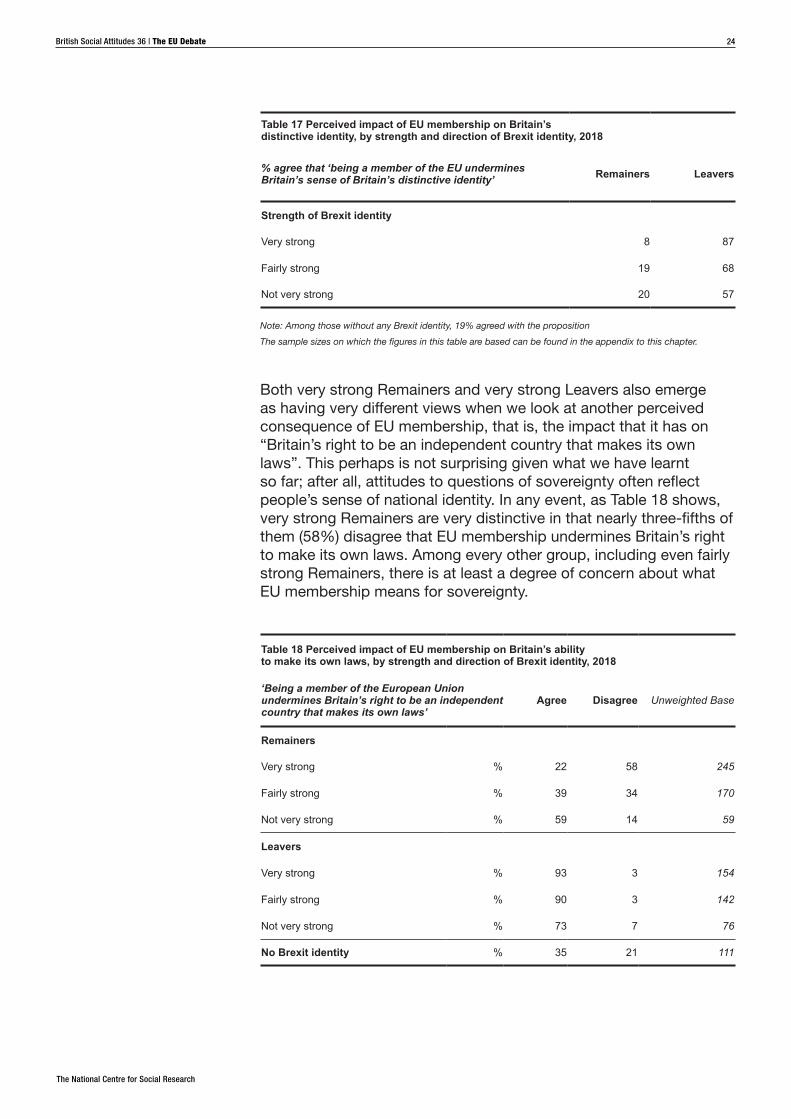
Not that the pattern is symmetrical. Not very strong Leavers are just as unlikely as very strong Leavers to have a strong European identity. A weak sense of European identity is commonplace among all those who identify as a Leaver. So too is a strong sense of British identity. While four in five (81%) of very strong Leavers say (on a 1 to 7 scale) that they are strongly British, so also do three-quarters (75%) of not very strong Leavers. (Indeed, even as many as 69% of very strong Remainers fall into this category too). However, very strong Leavers do emerge as distinctive when respondents are posed the question we introduced earlier about whether being a member of the EU undermines Britain’s distinctive identity. As Table 17 shows, no less than 87% of very strong Leavers agree that it does, well above the equivalent figure of 57% among those who are not very strong Leavers – and almost diametrically opposite to the position among very strong Remainers, just 8% of whom agree. So, among Leavers, a very strong identity is not so much a reflection of a strong British or weak European identity as of a distinctive concern about whether being an EU member serves to undermine British identity.
The National Centre for Social Research
British Social Attitudes 36 | The EU Debate 24
Table 17 Perceived impact of EU membership on Britain’s distinctive identity, by strength and direction of Brexit identity, 2018
% agree that ‘being a member of the EU undermines Britain’s sense of Britain’s distinctive identity’ Remainers Leavers
Strength of Brexit identity
Very strong 8 87
Fairly strong 19 68
Not very strong 20 57
Note: Among those without any Brexit identity, 19% agreed with the propositionThe sample sizes on which the figures in this table are based can be found in the appendix to this chapter.
Both very strong Remainers and very strong Leavers also emerge as having very different views when we look at another perceived consequence of EU membership, that is, the impact that it has on “Britain’s right to be an independent country that makes its own laws”. This perhaps is not surprising given what we have learnt so far; after all, attitudes to questions of sovereignty often reflect people’s sense of national identity. In any event, as Table 18 shows, very strong Remainers are very distinctive in that nearly three-fifths of them (58%) disagree that EU membership undermines Britain’s right to make its own laws. Among every other group, including even fairly strong Remainers, there is at least a degree of concern about what EU membership means for sovereignty.
Table 18 Perceived impact of EU membership on Britain’s ability to make its own laws, by strength and direction of Brexit identity, 2018
‘Being a member of the European Union undermines Britain’s right to be an independent country that makes its own laws’
Agree Disagree Unweighted Base
Remainers
Very strong % 22 58 245
Fairly strong % 39 34 170
Not very strong % 59 14 59
Leavers
Very strong % 93 3 154
Fairly strong % 90 3 142
Not very strong % 73 7 76
No Brexit identity % 35 21 111
The National Centre for Social Research
British Social Attitudes 36 | The EU Debate 25
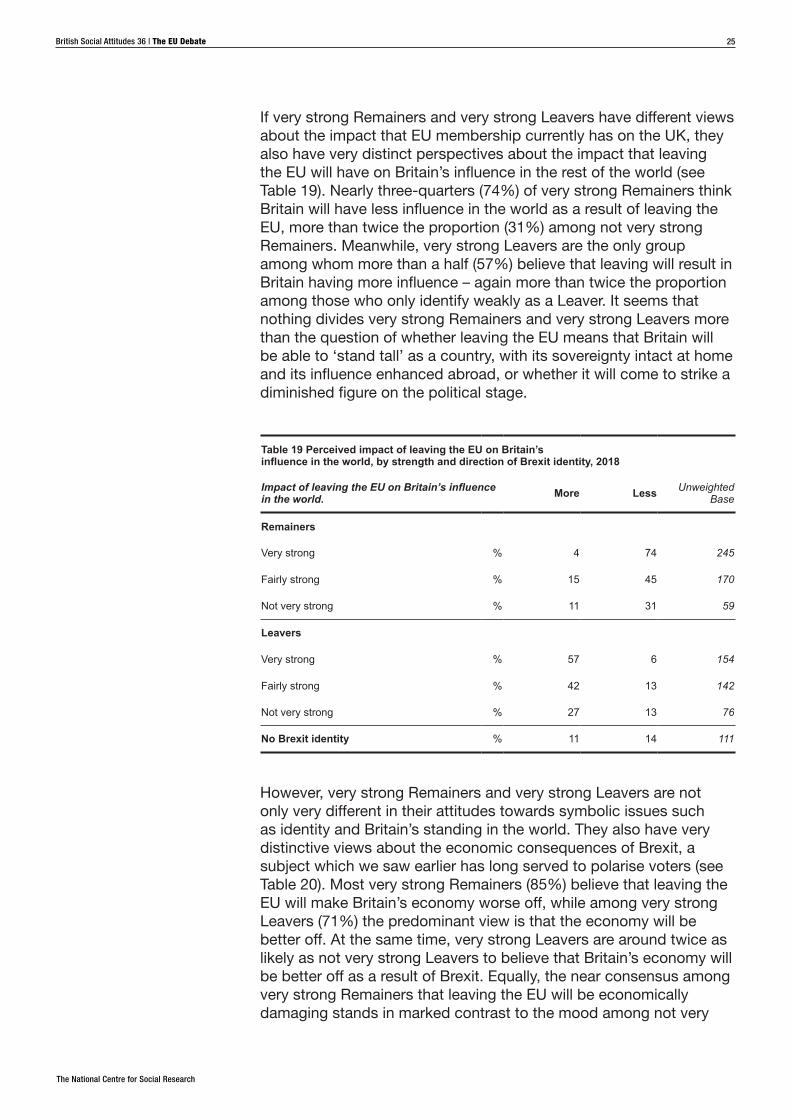
If very strong Remainers and very strong Leavers have different views about the impact that EU membership currently has on the UK, they also have very distinct perspectives about the impact that leaving the EU will have on Britain’s influence in the rest of the world (see Table 19). Nearly three-quarters (74%) of very strong Remainers think Britain will have less influence in the world as a result of leaving the EU, more than twice the proportion (31%) among not very strong Remainers. Meanwhile, very strong Leavers are the only group among whom more than a half (57%) believe that leaving will result in Britain having more influence – again more than twice the proportion among those who only identify weakly as a Leaver. It seems that nothing divides very strong Remainers and very strong Leavers more than the question of whether leaving the EU means that Britain will be able to ‘stand tall’ as a country, with its sovereignty intact at home and its influence enhanced abroad, or whether it will come to strike a diminished figure on the political stage.
Table 19 Perceived impact of leaving the EU on Britain’s influence in the world, by strength and direction of Brexit identity, 2018
Impact of leaving the EU on Britain’s influence in the world. More Less Unweighted
Base
Remainers
Very strong % 4 74 245
Fairly strong % 15 45 170
Not very strong % 11 31 59
Leavers
Very strong % 57 6 154
Fairly strong % 42 13 142
Not very strong % 27 13 76
No Brexit identity % 11 14 111
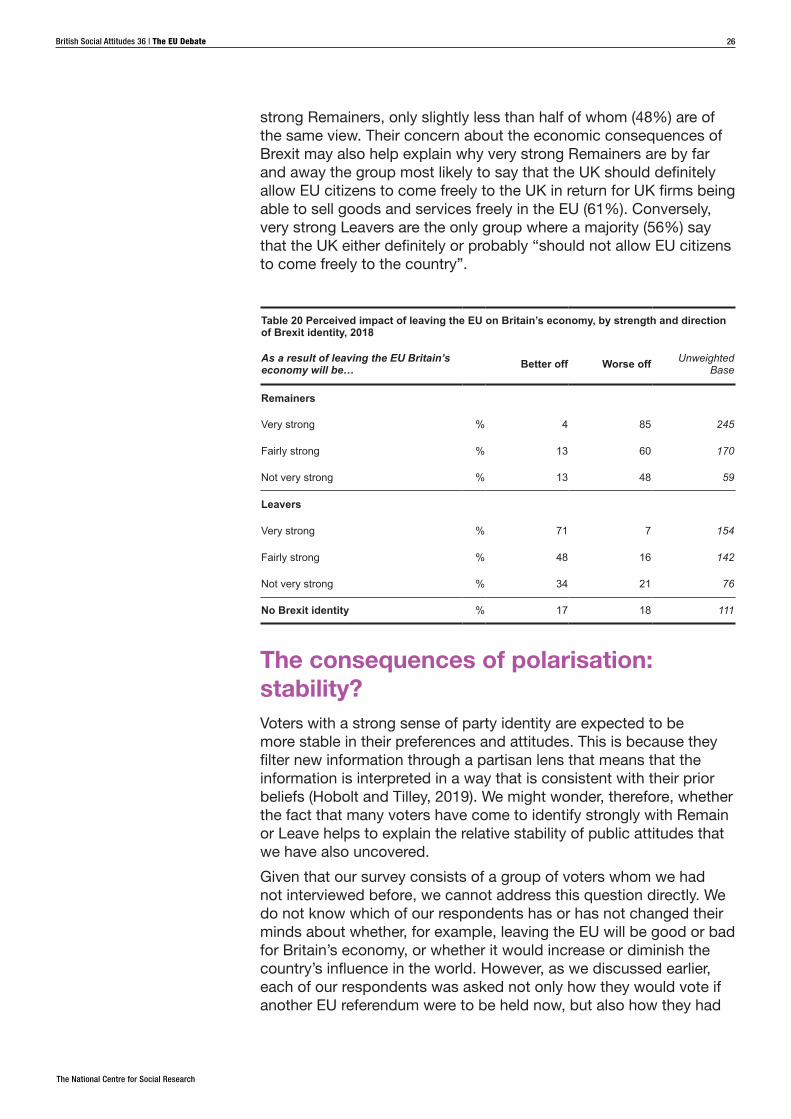
However, very strong Remainers and very strong Leavers are not only very different in their attitudes towards symbolic issues such as identity and Britain’s standing in the world. They also have very distinctive views about the economic consequences of Brexit, a subject which we saw earlier has long served to polarise voters (see Table 20). Most very strong Remainers (85%) believe that leaving the EU will make Britain’s economy worse off, while among very strong Leavers (71%) the predominant view is that the economy will be better off. At the same time, very strong Leavers are around twice as likely as not very strong Leavers to believe that Britain’s economy will be better off as a result of Brexit. Equally, the near consensus among very strong Remainers that leaving the EU will be economically damaging stands in marked contrast to the mood among not very
The National Centre for Social Research
British Social Attitudes 36 | The EU Debate 26
strong Remainers, only slightly less than half of whom (48%) are of the same view. Their concern about the economic consequences of Brexit may also help explain why very strong Remainers are by far and away the group most likely to say that the UK should definitely allow EU citizens to come freely to the UK in return for UK firms being able to sell goods and services freely in the EU (61%). Conversely, very strong Leavers are the only group where a majority (56%) say that the UK either definitely or probably “should not allow EU citizens to come freely to the country”.
Table 20 Perceived impact of leaving the EU on Britain’s economy, by strength and direction of Brexit identity, 2018
As a result of leaving the EU Britain’s economy will be… Better off Worse off Unweighted
Base
Remainers
Very strong % 4 85 245
Fairly strong % 13 60 170
Not very strong % 13 48 59
Leavers
Very strong % 71 7 154
Fairly strong % 48 16 142
Not very strong % 34 21 76
No Brexit identity % 17 18 111
The consequences of polarisation: stability?Voters with a strong sense of party identity are expected to be more stable in their preferences and attitudes. This is because they filter new information through a partisan lens that means that the information is interpreted in a way that is consistent with their prior beliefs (Hobolt and Tilley, 2019). We might wonder, therefore, whether the fact that many voters have come to identify strongly with Remain or Leave helps to explain the relative stability of public attitudes that we have also uncovered.
Given that our survey consists of a group of voters whom we had not interviewed before, we cannot address this question directly. We do not know which of our respondents has or has not changed their minds about whether, for example, leaving the EU will be good or bad for Britain’s economy, or whether it would increase or diminish the country’s influence in the world. However, as we discussed earlier, each of our respondents was asked not only how they would vote if another EU referendum were to be held now, but also how they had
The National Centre for Social Research
British Social Attitudes 36 | The EU Debate 27
voted in the referendum in 2016 itself. If those with a strong sense of Brexit identity are more likely to be stable in their views about Brexit then we would anticipate that those who say they are a very strong Remainer or very strong Leaver are more likely than other voters to say that they would vote Remain or Leave again.
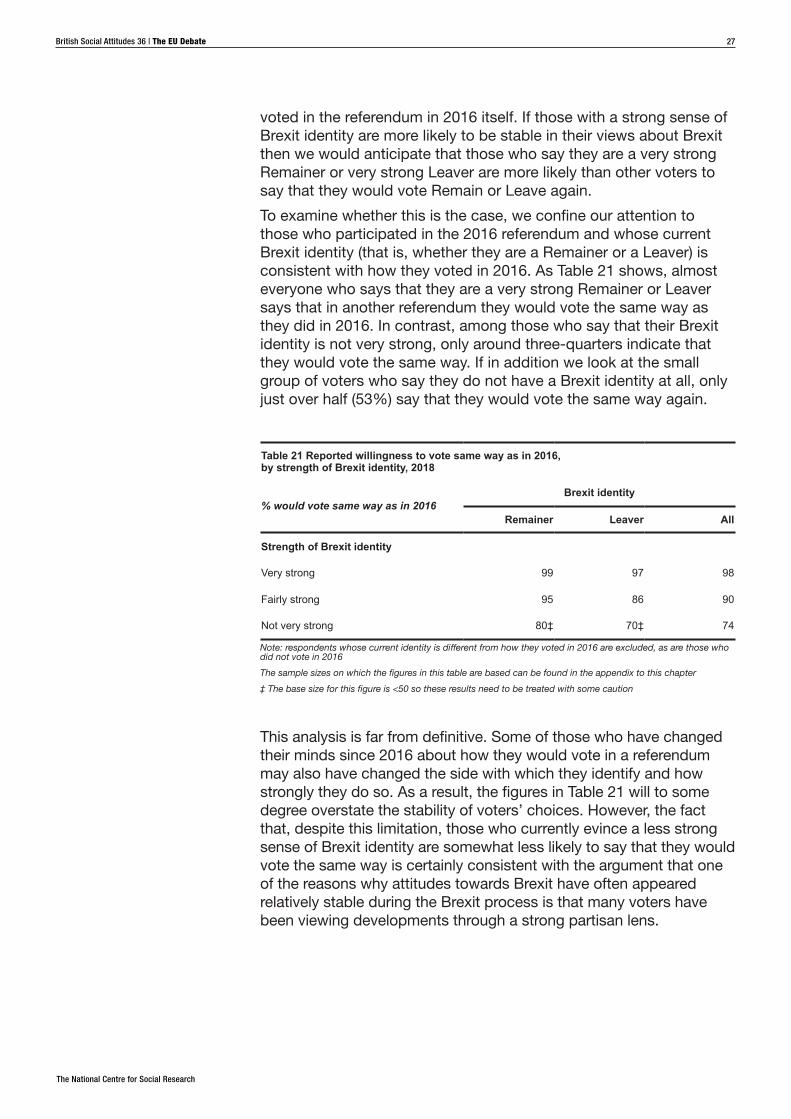
To examine whether this is the case, we confine our attention to those who participated in the 2016 referendum and whose current Brexit identity (that is, whether they are a Remainer or a Leaver) is consistent with how they voted in 2016. As Table 21 shows, almost everyone who says that they are a very strong Remainer or Leaver says that in another referendum they would vote the same way as they did in 2016. In contrast, among those who say that their Brexit identity is not very strong, only around three-quarters indicate that they would vote the same way. If in addition we look at the small group of voters who say they do not have a Brexit identity at all, only just over half (53%) say that they would vote the same way again.
Table 21 Reported willingness to vote same way as in 2016, by strength of Brexit identity, 2018
% would vote same way as in 2016Brexit identity
Remainer Leaver All
Strength of Brexit identity
Very strong 99 97 98
Fairly strong 95 86 90
Not very strong 80‡ 70‡ 74
Note: respondents whose current identity is different from how they voted in 2016 are excluded, as are those who did not vote in 2016The sample sizes on which the figures in this table are based can be found in the appendix to this chapter ‡ The base size for this figure is <50 so these results need to be treated with some caution
This analysis is far from definitive. Some of those who have changed their minds since 2016 about how they would vote in a referendum may also have changed the side with which they identify and how strongly they do so. As a result, the figures in Table 21 will to some degree overstate the stability of voters’ choices. However, the fact that, despite this limitation, those who currently evince a less strong sense of Brexit identity are somewhat less likely to say that they would vote the same way is certainly consistent with the argument that one of the reasons why attitudes towards Brexit have often appeared relatively stable during the Brexit process is that many voters have been viewing developments through a strong partisan lens.

The National Centre for Social Research
British Social Attitudes 36 | The EU Debate 28
The consequences of polarisation: party division?If Britain is now more polarised in its views about leaving the EU, we might wonder whether this polarisation is also in evidence in the country’s party system. True, during the referendum itself, the leaderships of all the major parties apart from UKIP were in favour of remaining in the UK. That might be felt to give little reason to anticipate that supporters of the two major parties should have diverged from each other in their level of support for leaving the EU. But since then, the vision for Britain’s future relationship with the EU presented by the Conservative government has widely been characterised as ‘harder’ than that proposed by the Labour party, who have also not ruled out the possibility that the question of whether the UK leaves the EU should be revisited in a second referendum (Evans and Menon, 2017). This might mean that Labour has found it easier to attract the support of those who would prefer to remain in the EU, while the Conservatives have seemed the more attractive prospect to those who wish to leave – and especially so for those who feel most strongly about the merits of remaining or leaving. Such a development, for which there certainly seemed to be evidence in the pattern of voting in the 2017 election (Curtice and Simpson, 2018), would mean that the views of Conservative and Labour supporters have diverged too.
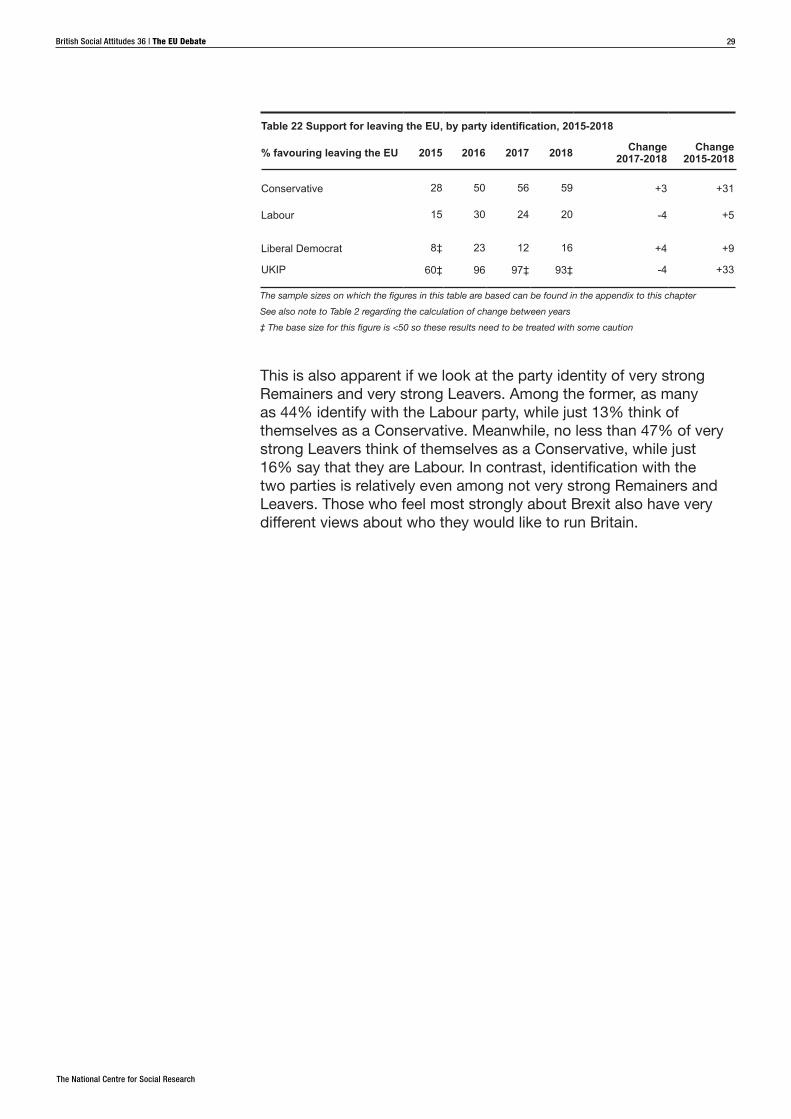
This is, indeed, what has happened. In Table 22 we use the measure of party identity that we introduced earlier to chart the level of support for leaving the EU among each party’s identifiers between 2015 and 2018. In 2015, apart from UKIP identifiers, only a minority of each party’s identifiers supported leaving the EU, albeit that support was higher among Conservative supporters (28%) than their Labour counterparts (15%). Although in the immediate wake of the referendum, support for leaving had increased among both sets of supporters, at 22 points the increase was a little greater among Conservatives than Labour identifiers (15 points). But attitudes diverged yet further in the wake of the 2017 election and have continued to do so more recently. As a result, support for leaving the EU is now nearly three times as high among those who identify as Conservative (59%) as it is among those who consider themselves to be Labour (20%). The polarisation of attitudes towards Brexit has also come to be reflected in the pattern of support for Britain’s two largest parties.
The National Centre for Social Research
British Social Attitudes 36 | The EU Debate 29
Table 22 Support for leaving the EU, by party identification, 2015-2018
% favouring leaving the EU 2015 2016 2017 2018 Change2017-2018
Change2015-2018
Conservative 28 50 56 59 +3 +31
Labour 15 30 24 20 -4 +5
Liberal Democrat 8‡ 23 12 16 +4 +9
UKIP 60‡ 96 97‡ 93‡ -4 +33
The sample sizes on which the figures in this table are based can be found in the appendix to this chapterSee also note to Table 2 regarding the calculation of change between years‡ The base size for this figure is <50 so these results need to be treated with some caution
This is also apparent if we look at the party identity of very strong Remainers and very strong Leavers. Among the former, as many as 44% identify with the Labour party, while just 13% think of themselves as a Conservative. Meanwhile, no less than 47% of very strong Leavers think of themselves as a Conservative, while just 16% say that they are Labour. In contrast, identification with the two parties is relatively even among not very strong Remainers and Leavers. Those who feel most strongly about Brexit also have very different views about who they would like to run Britain.
The National Centre for Social Research
British Social Attitudes 36 | The EU Debate 30
ConclusionsPeople in Britain have long disagreed with each other about the merits of Britain’s membership of the EU. However, the EU referendum and the subsequent Brexit negotiations have seen the country become more sharply divided in its attitudes. An individual’s social background, their sense of national identity, and their broader social values now distinguish supporters and opponents of EU membership more sharply than they did before the EU referendum. Moreover, although the heightening of this division might originally have been occasioned by the referendum campaign, there is little sign so far of the development being reversed. Rather, it seems that the subsequent debate about the terms under which the UK should leave the EU has served to maintain and reinforce the divergence. As a result, it might be felt that those who back staying in the EU and those who wish to leave now represent two rather different segments of British society.
Indeed, many voters themselves appear implicitly to recognise this characterisation by their ready willingness to identify themselves as a ‘Remainer’ or as a ‘Leaver’. As a result, these two perspectives on Britain’s future now appear to motivate and engage voters much more than do the country’s political parties, albeit that, gradually, the division between Remainers and Leavers has come increasingly to be reflected in the pattern of support for the parties. The debate about Brexit has come to represent much more than an argument about the practical consequences of leaving the EU; rather, it has created two camps with quite different perspectives on Britain and its place in the world. It may well prove not the easiest division to heal.
The National Centre for Social Research
British Social Attitudes 36 | The EU Debate 31
References
Butler, D. and Stokes, D. (1974), Political Change in Britain, 2nd Edition, London: Macmillan
Clarke, H., Goodwin, M., and Whiteley, P. (2017), Brexit: Why Britain Voted to Leave the European Union, Cambridge: Cambridge University Press
Clarke, H., Sanders, D., Stewart, M. and Whiteley, P. (2009), Performance Politics and the British Voter, Cambridge: Cambridge University Press
Curtice, J. (2017), ‘Brexit: Litmus Test or Lightening Rod?’ in Clery, E., Curtice, J. and Harding, R. (eds.), British Social Attitudes; 34th report, London: The National Centre for Social Research, available at: http://www.bsa.natcen.ac.uk/latest-report/british-social-attitudes-34/brexit.aspx
Curtice, J. (2018), The Emotional Legacy of Brexit: How Britain Became a Country of ‘Remainers’ and ‘Leavers’, London: The National Centre for Social Research, available at: https://whatukthinks.org/eu/analysis/the-emotional-legacy-of-brexit-how-britain-has-become-a-country-of-remainers-and-leavers/
Curtice, J. and Seyd, B. (2001), ‘Is devolution strengthening or weakening the UK?’ in Park A., Curtice, J., Thomson, K., Jarvis, L. and Bromley, C. (eds.), British Social Attitudes: the 18th report. Public policy, Social ties, London: Sage
Curtice, J. and Simpson, I. (2018), ‘The 2017 Election: New Divides in British Politics?’, in Phillips, D., Curtice, J., Phillips, M. and Perry, J. (eds.), British Social Attitudes: the 35th report, London: The National Centre for Social Research, available at: http://www.bsa.natcen.ac.uk/latest-report/british-social-attitudes-35/voting.aspx
Curtice, J. and Tipping, S. (2018), ‘Europe: A more informed public? The impact of the Brexit debate’, in Phillips, D., Curtice, J., Phillips, M. and Perry, J. (eds.), British Social Attitudes: the 35th report, London: The National Centre for Social Research, available at: http://www.bsa.natcen.ac.uk/latest-report/british-social-attitudes-35/europe.aspx
Evans, G. and Menon, A. (2017), Brexit and British Politics, Cambridge: Polity Press
Evans, G. and Schaffner, F. (2019), ‘Brexit identity and party identity’, in Menon, A. (ed.), Brexit and Public Opinion 2019, London: UK in a Changing Europe, available at: https://ukandeu.ac.uk/wp-content/uploads/2019/01/Public-Opinion-2019-report.pdf
Evans, G. and Tilley, J. (2017), The New Politics of Class: The Political Exclusion of the British Working Class, Oxford: Oxford University Press
Fieldhouse, E., Green, J., Evans, G., Mellon, J., Prosser, C., Schmitt, H. and Van der Eijk, C. (forthcoming), Electoral Shocks: The Volatile
The National Centre for Social Research
British Social Attitudes 36 | The EU Debate 32
Voter in a Turbulent World, Oxford: Oxford University Press
Hobolt, S. and Tilley, J. (2019), ‘The Brexit identity divide’, in Menon, A. (ed.), Brexit and Public Opinion 2019, London: UK in a Changing Europe, available at: https://ukandeu.ac.uk/wp-content/uploads/2019/01/Public-Opinion-2019-report.pdf
Jeffery, C., Wyn Jones, R., Henderson, A., Scully, R. and Lodge, G. (2014), Taking England Seriously: The New English Politics, Edinburgh: Centre for Constitutional Change, available at: https://www.centreonconstitutionalchange.ac.uk/sites/default/files/news/Taking%20England%20Seriously_The%20New%20English%20Politics.pdf
Jessop, C. (2018), ‘The NatCen Panel: Developing an open probability-based mixed-mode panel in Great Britain’, Social Research Practice, 6: 2-14Moreno, L. (2006), Moreno, L. (2006) ‘Scotland, Europeanization and the ‘Moreno Question’, Scottish Affairs, 54: 1-21
Sanders, D. (2017), ‘The UK’s changing party system: prospects for a party realignment at Westminster’, Journal of the British Academy, 5: 91-124
The National Centre for Social Research
British Social Attitudes 36 | The EU Debate 33
Appendix
The full wording for the questions presented in Tables 2 and 3 is shown below.
2015 wording:
If Britain were to leave the EU, do you think Britain’s economy would be better off, worse off, or wouldn’t it make much difference? (Please choose a phrase from the card.)
(A lot better off, A little better off, Wouldn’t make much difference, A little worse off, A lot worse off)
2017 and 2018 wording:
From what you have seen and heard so far, do you think that as a result of leaving the EU Britain’s economy will be better off, worse off, or won’t it make much difference? (Please choose a phrase from the card.)
(A lot better off, A little better off, Won’t make much difference, A little worse off, A lot worse off)
2015 wording:
And if Britain were to leave the EU, do you think unemployment in Britain would be higher, lower, or wouldn’t it make much difference? (Please choose a phrase from the card.)
(A lot higher, A little higher, Wouldn’t make much difference, A little lower, A lot lower)
2017 and 2018 wording:
And from what you have seen and heard so far, do you think that as a result of leaving the EU unemployment in Britain will be higher, lower, or won’t it make much difference? (Please choose a phrase from the card.)
(A lot higher, A little higher, Won’t make much difference, A little lower, A lot lower)
The National Centre for Social Research
British Social Attitudes 36 | The EU Debate 34
2015 wording:
If Britain were to leave the EU, do you think Britain would have more influence in the world, less influence, or wouldn’t it make much difference? Please choose a phrase from the card.
(A lot more influence, A little more influence, Wouldn’t make much difference, A little less influence, A lot less influence)
2017 and 2018 wording:
From what you have seen and heard so far, do you think that as a result of leaving the EU Britain will have more influence in the world, less influence, or won’t it make much difference? Please choose a phrase from the card.
(A lot more influence, A little more influence, Won’t make much difference, A little less influence, A lot less influence)
2015 wording:
(If Britain were to leave the EU,) do you think immigration to Britain would be higher, lower, or wouldn’t it make much difference? (Please choose a phrase from the card.)
(A lot higher, A little higher, Wouldn’t make much difference, A little lower, A lot lower)
2017 and 2018 wording:
(From what you have seen and heard so far,) do you think that as a result of leaving the EU immigration to Britain will be higher, lower, or won’t it make much difference? (Please choose a phrase from the card.)
(A lot higher, A little higher, Won’t make much difference, A little lower, A lot lower)
The National Centre for Social Research
British Social Attitudes 36 | The EU Debate 35
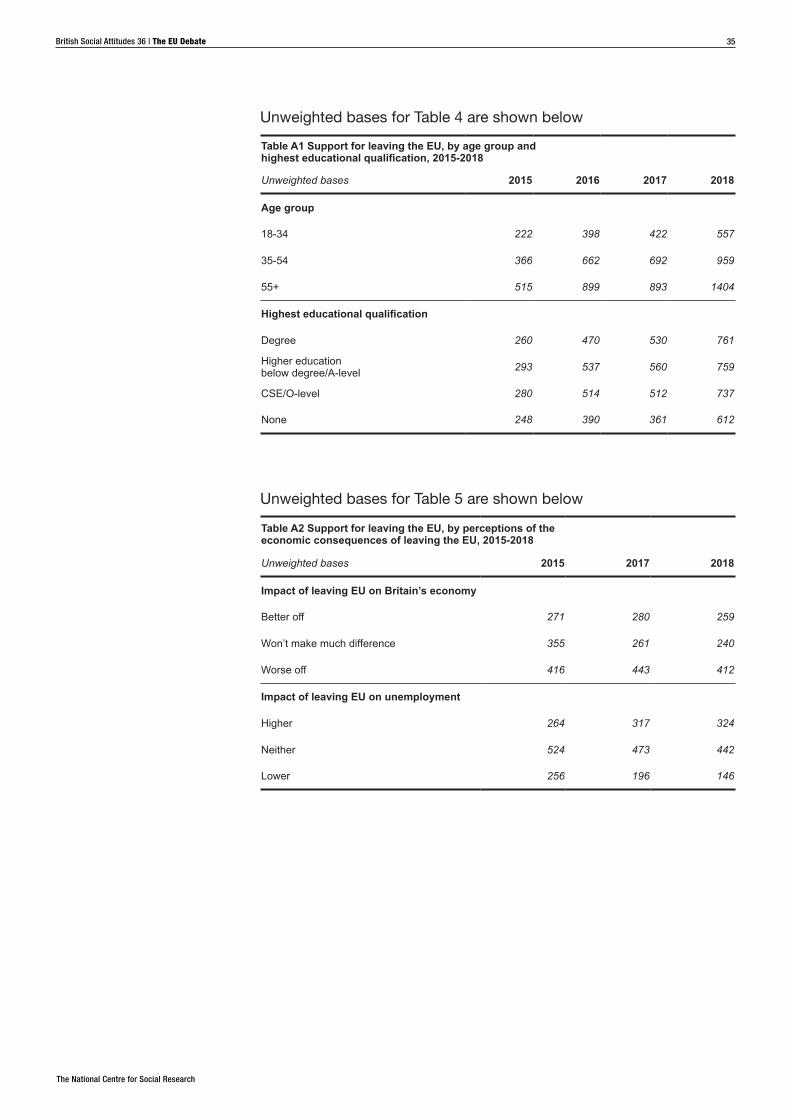
Unweighted bases for Table 4 are shown below
Table A1 Support for leaving the EU, by age group and highest educational qualification, 2015-2018
Unweighted bases 2015 2016 2017 2018
Age group
18-34 222 398 422 557
35-54 366 662 692 959
55+ 515 899 893 1404
Highest educational qualification
Degree 260 470 530 761
Higher education below degree/A-level 293 537 560 759
CSE/O-level 280 514 512 737
None 248 390 361 612
Unweighted bases for Table 5 are shown below
Table A2 Support for leaving the EU, by perceptions of the economic consequences of leaving the EU, 2015-2018
Unweighted bases 2015 2017 2018
Impact of leaving EU on Britain’s economy
Better off 271 280 259
Won’t make much difference 355 261 240
Worse off 416 443 412
Impact of leaving EU on unemployment
Higher 264 317 324
Neither 524 473 442
Lower 256 196 146
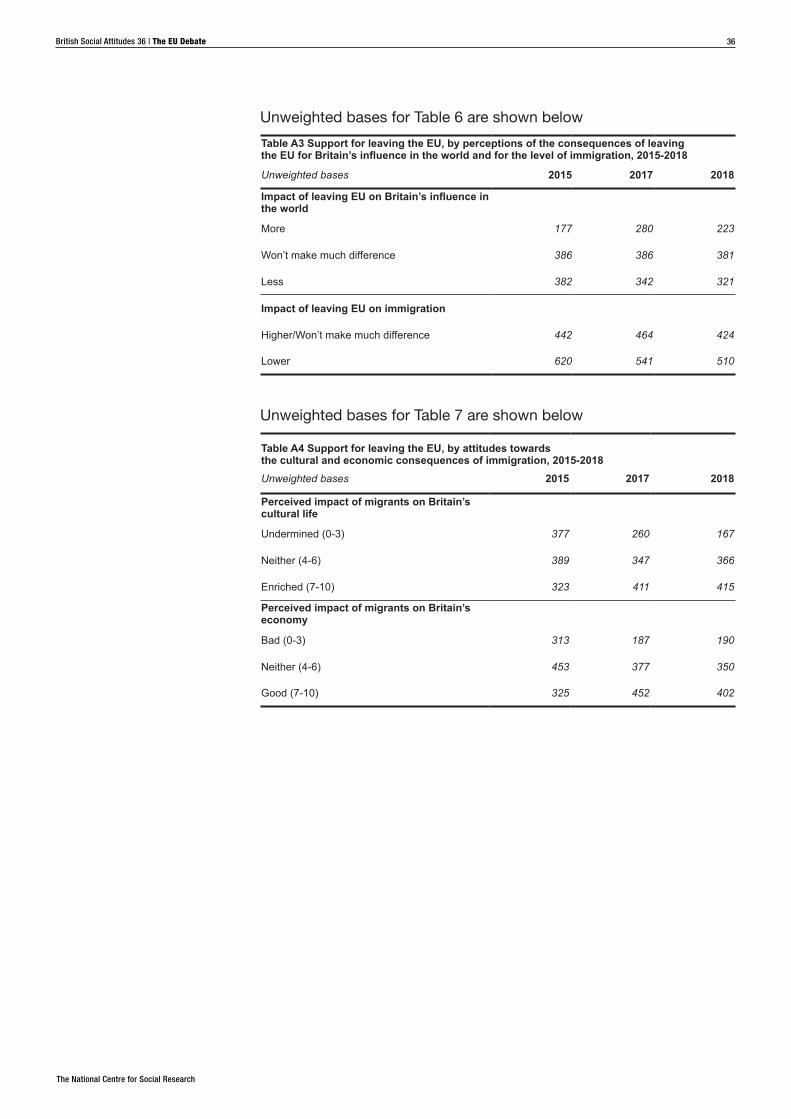
The National Centre for Social Research
British Social Attitudes 36 | The EU Debate 36
Unweighted bases for Table 6 are shown below
Table A3 Support for leaving the EU, by perceptions of the consequences of leaving the EU for Britain’s influence in the world and for the level of immigration, 2015-2018
Unweighted bases 2015 2017 2018
Impact of leaving EU on Britain’s influence in the world
More 177 280 223
Won’t make much difference 386 386 381
Less 382 342 321
Impact of leaving EU on immigration
Higher/Won’t make much difference 442 464 424
Lower 620 541 510
Unweighted bases for Table 7 are shown below
Table A4 Support for leaving the EU, by attitudes towards the cultural and economic consequences of immigration, 2015-2018Unweighted bases 2015 2017 2018
Perceived impact of migrants on Britain’s cultural life
Undermined (0-3) 377 260 167
Neither (4-6) 389 347 366
Enriched (7-10) 323 411 415
Perceived impact of migrants on Britain’s economy
Bad (0-3) 313 187 190
Neither (4-6) 453 377 350
Good (7-10) 325 452 402
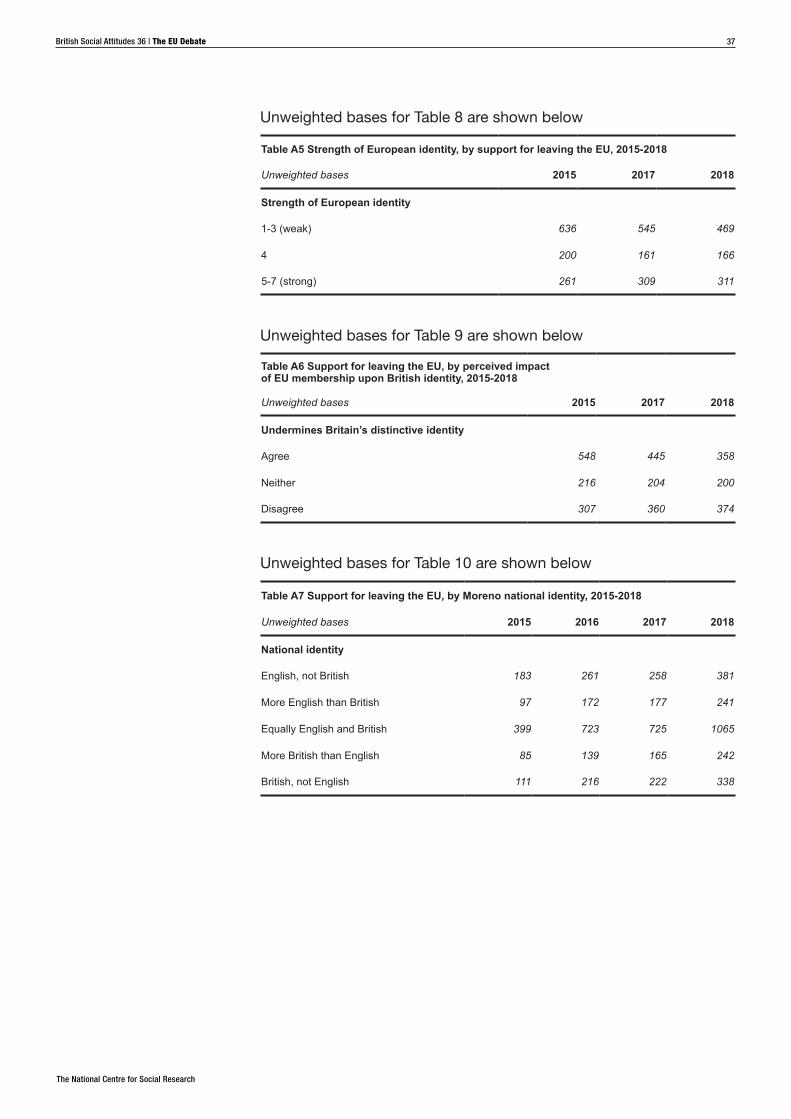
The National Centre for Social Research
British Social Attitudes 36 | The EU Debate 37
Unweighted bases for Table 8 are shown below
Table A5 Strength of European identity, by support for leaving the EU, 2015-2018
Unweighted bases 2015 2017 2018
Strength of European identity
1-3 (weak) 636 545 469
4 200 161 166
5-7 (strong) 261 309 311
Unweighted bases for Table 9 are shown below
Table A6 Support for leaving the EU, by perceived impact of EU membership upon British identity, 2015-2018
Unweighted bases 2015 2017 2018
Undermines Britain’s distinctive identity
Agree 548 445 358
Neither 216 204 200
Disagree 307 360 374
Unweighted bases for Table 10 are shown below
Table A7 Support for leaving the EU, by Moreno national identity, 2015-2018
Unweighted bases 2015 2016 2017 2018
National identity
English, not British 183 261 258 381
More English than British 97 172 177 241
Equally English and British 399 723 725 1065
More British than English 85 139 165 242
British, not English 111 216 222 338
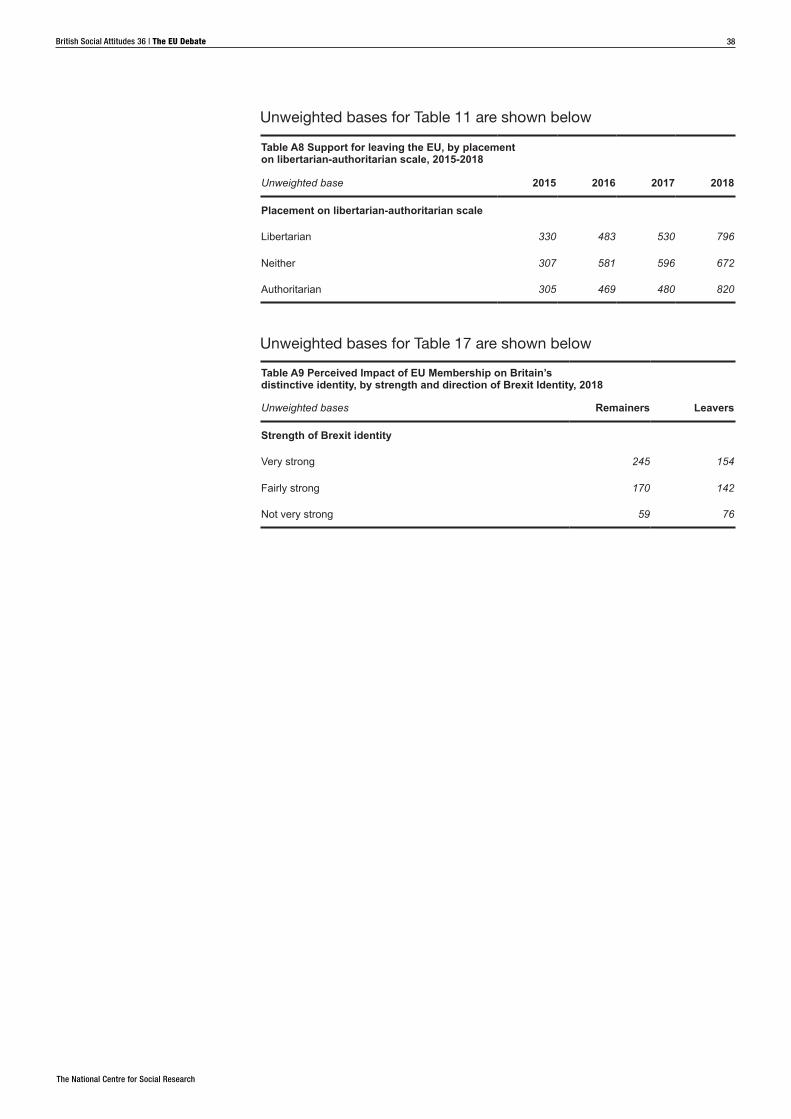
The National Centre for Social Research
British Social Attitudes 36 | The EU Debate 38
Unweighted bases for Table 11 are shown below
Table A8 Support for leaving the EU, by placement on libertarian-authoritarian scale, 2015-2018
Unweighted base 2015 2016 2017 2018
Placement on libertarian-authoritarian scale
Libertarian 330 483 530 796
Neither 307 581 596 672
Authoritarian 305 469 480 820
Unweighted bases for Table 17 are shown below
Table A9 Perceived Impact of EU Membership on Britain’s distinctive identity, by strength and direction of Brexit Identity, 2018
Unweighted bases Remainers Leavers
Strength of Brexit identity
Very strong 245 154
Fairly strong 170 142
Not very strong 59 76
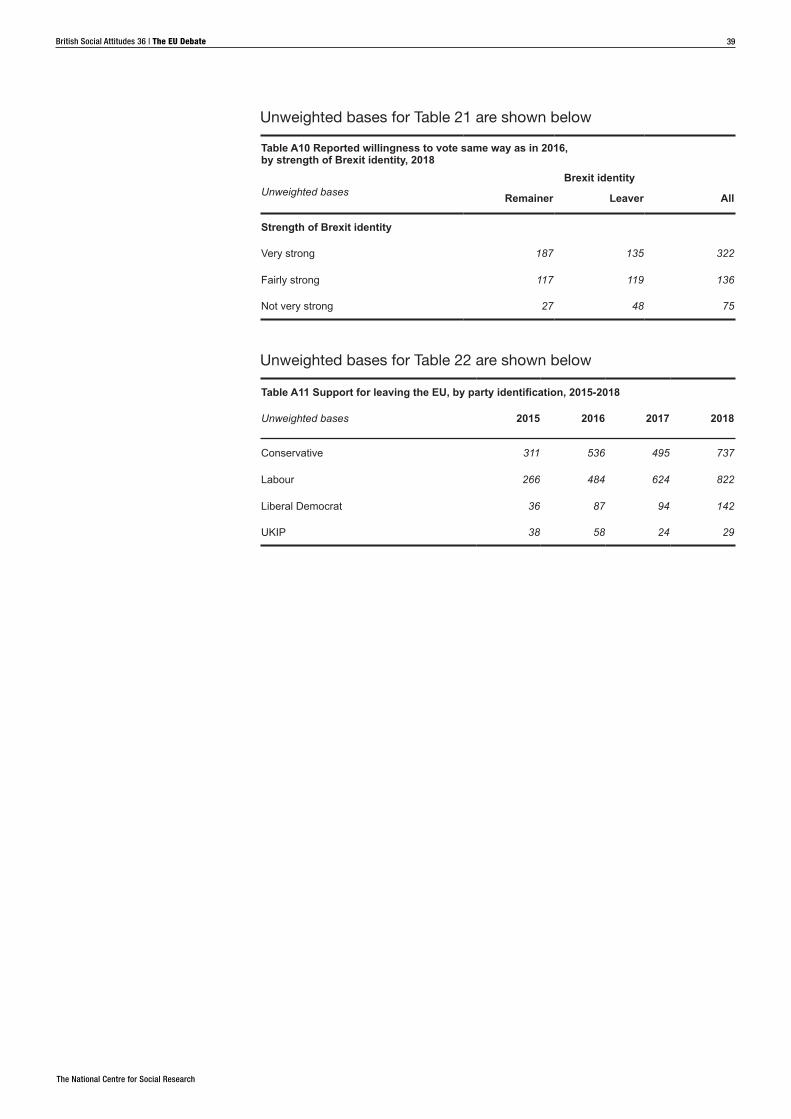
The National Centre for Social Research
British Social Attitudes 36 | The EU Debate 39
Unweighted bases for Table 21 are shown below
Table A10 Reported willingness to vote same way as in 2016, by strength of Brexit identity, 2018
Unweighted basesBrexit identity
Remainer Leaver All
Strength of Brexit identity
Very strong 187 135 322
Fairly strong 117 119 136
Not very strong 27 48 75
Unweighted bases for Table 22 are shown below
Table A11 Support for leaving the EU, by party identification, 2015-2018
Unweighted bases 2015 2016 2017 2018
Conservative 311 536 495 737
Labour 266 484 624 822
Liberal Democrat 36 87 94 142
UKIP 38 58 24 29
The National Centre for Social Research
British Social Attitudes 36 | The EU Debate 40
AcknowledgementFunding for the research reported here was provided by the Economic and Social Research Council as part of its ‘The UK in a Changing Europe’ initiative. Responsibility for the views expressed lies solely with the authors.