High biomass density promotes density-dependent microbial ...
Upload
jimmy-simpsonCategory
view
24download
2
Biosensors 1(1985)17434
Christine M. Harris arki Douglas B. KeW
Department of Botany and Microbiology, University College of Wales, Aberystwyth, DyEed SY23 3DA (Great Britain)
(Received: 12;lune, 1984)
ABSTRACT
Methods that have been used to estimate the content, and in some cases the nature, of the microbial biomass in a sample are reviewed. The methodr may be categorised in terms of their principle (physical, chemical, bio- logicai or mathematical/computational), their speed (real-time or otherwise) and the amount of automation/expense involved. For sparse populations, where the output signal is to be enhanced by growth ojc the organisms, physical, chemical and biological approaches may be of equal merit, whilst in systems, such as laboratory and industrial fermen- tations, in which the microbial biomass content is high, physical methods (Anne) can permit the real-time estimation; of microbial biomass.
Key words: biomass measurement, automated microbiology, microbial biomass, microbial growth, fermentation control.
1. IN’KRODIJCITON AND SCOPE
‘The study of the growth of bacterial cultures does not constitute a specialised subject or a branch of research; it is the basic method of microbiology.’ (Monad, 1949.)
In accepting at once the foregoing truism, one appreciates immediately that it is of the first importance to be able to quantify the number (and/or
.
*To whom all correspondence should be addressed.
17
Biosensors 0265-928X/85/$03.30 0 Elsevier Applied Science Put&hers Ltd, England, 1985. Printed in Great Britain

18 C. M. Harris, D. B. Keil
Features of an Ideal Probe Suitable for Monitoring Biomass Concentration in Fermenters
1. 2, 3. 4. 5 I *
6.
7. 8. 9.
10.
Co:ltmuous, real-time assay, i.e. rapid zzsponse. Sensitive (resolution of approximately O-02 mg/ml: lO’cfu/ml). Electrodes (probes) biologically inert. Non-destructive assay; no added reagent. Many ekctrodes (probes) using same equipment. Good lifetime. Low cost. Can be used i.n optically opaque and turbid solutions. Cleanable ix s&x. Sterilisable (autoclavable).
nature) of viable microorganisms, or to measure the microbial biomass, in a variety of circumstances. Thu s, it would be especially desirable to have a general ‘ideal biomass probe’ that would meet the needs both of industrial and research fermentation scientists (who generally wish to encourage microbial growth) and of others (who may not). Nevertheless, despite the plethora of possible techniques available for measuring biomass, no single method exists which is really satisfactory for either of these groups. An ideal biomass probe should possess the same characteristics as any other electrode or probe (Table 1: (Harrison, 1976; Kell, 1980; Sikyta, 1983)). Ho%-ever, reliable- biomass measurements are notoriously difficult to obtain, in particular because of the variety of environments in which the microorganisms exist, and the diversity, both in population size and in characteristics, of the microorganisms themselves.
In 1963 Levin commented, ‘Lt is abundantly clear that there is great room and need for improvement in classical procedures for quantitative microbiological determinations’; to a large extent this remains true some 20 years later. During this pe-riod, many attempts have been made to ititrodu.ce alternative, improved -ways of monitoring microbial growth
. (e.g. Bascomb, 1981): .
Although it is usually taken that growth and division constitute the key criteria of microbial viability (e-g. Postgate, 1976), and ergo distinguish biotiass from necromass, such an analysis (of growth and division) requires time, such that there is a lower’ limit to the time required to establish the content of biomass Senrtc sticro. Evidently, therefore, the goal of a ‘real-time biomass probe’ is in this sense unattainable. For an etitree to the literature on the rather marked, and by no means irrelevant,

The estimcuion of microbial biomass 19
philosophical difficulties invohfed in distinguishing life from non-life even in higher organisms, Watson’s popular and thoughtful treatment (Watson, 1974) is recommended. Parenthetically, we may mention that such paradoxes, well known in physics and chemistry (Primas, 1981; Wheeler & Zurek, 1983; Garden, 1984), are more prevalent in bioiogy than is perhaps often realised (Welch &L Kell, 1985). However, leaving such difficulties aside, it is pertinent first briefly and loosely to consider the appropriate means by which one might express the microbial biopruzvs content of a sample.
Microbial content may be expressed in terms of the following:
(i) The number of viable cells present: In many cases, especially in clinical analyses and ecological studies, the number of viable cells provides the required information concerning the F_ptilaZioli -*ithin the sample.
(ii) The total microbial biomass: Viable counts may provide the required information for industrial and research fermentation processes, but this may not always be so. For example, it is biomass, and in some cases also necromass, and not the number of viable cells, that is important in many fermentations, such as those which produce glycerol, poly+3- hydrpxybutyrate, and single cell protein (e-g. Dawes & Senior, 1973; Smith, 1980; Anthony, 1982; Reed, 1982). Further, biomass may change independently of cell number, for instance when a change in growth rate induces a change in the morphology of Arthrobacter, accompanied by a reduction iri the number of cells, but no reduction in the ‘oiomass (Lusconibe & Gray, 1971).
Biomass may be calculated from the number of viable cells, using the cell dimensions and density of the cellular protoplasm, but the innate errors are large, possibly as high as 50% (Hobbie & Watson, 1980).
(iii) The enclosed volume (fraction): This quantity. the volume (fraction) enclosed within the cytoplasmic membrane of the micro- organisms, may also be used to describe the microbial biomass content (Nestaas & Wang, 1981; Harris & Kell, 1983), and has a bioenergetically significant basis (Konings & Veldkamp, 1980).
Whilst our own interests are primarily focussed on techniq.ues suitable for measuring. biomass in axenic laboratory and industrial fermentors, this review will also. endeavour to cover the perhaps more numerous approaches to the monitoring of microbial growth undei- other conditions.
One possible categorisation of methods for determining microbial

20 C. M. Harris, D. B. Kell
biomass, as employed, for example, by Bascomb (1981), differentiates between those methods which depend upon growth (to enhance the dutput signal) and those which do not, Snuch a division may be relevant to clinical work, but for the applications to fermentation processes, the distinction between physical and chemical methodologies is initially more appropriate, and is used herein. Such a taxonomy distinguishes those methods which exploit. physical characteristics of the microorganisms, and/or their effects upon their surroundings, and those which rely upon chemicals added to the sample, or the measurements of cellular com- ponents or metabolites produced in the sample. Chemical methods almost always require that the sample is removed from the fermentor, and so are not appropriate for real-time monitoring. Conversely, the physical methods are non-destructive, and, in principle, can allow continuous monitoring of biomass in S&U and in real time. For completeness, micro- scopical and mathematical methods are also covered. A discussion of the problem of obtaining a representative sample is not given here.
The difficulties inherent to even the qualitative determination of microbial biomass in general are very well illustrated both by a con- troversy concerning the existence of extreme thennophiles in ‘black smokers’ (Baross & Deming, 1983; Trent et al., 1984) and by the well- known but inconclusive experiments carried out by the Viking Lander on the planet Mars (Sagan, 1981).
That the subject of biomass determination is of great importance (e.g. Marten, 1972) is evident from the quantity of published reviews, symposia and articles on the subject (e.g. Malletee, 1969; Coiiins & Lyne, 1970; Strange, 1972; Mitchell, 1974; Heden & Illeni, 1975; Pirt, 1975; Curby & Gall, 1976; Isenberg & MacLowry, 1976; Johnston & Newsom, 1976; Mitruka, 1976; Jones, 1979;.Dermer et ad., 1980; Bascomb, 1981; Bergan, 1981; Cundell, 1981; Washington, 1981; El-Shaarawi & Pipes, 1982; Geldreich Coonrod et ai,, 1984).
& Kennedy, 1982; Tilton, 1982a, b; Anon, i983b; 1983; O’Toole, 1983a; Clarke Ed al., 1985; Leach,
2. CHEMICAL METHODS
As %veIl as destroying the samtile, chemicai methods generally require disposable reagents, which makes frequent sampling expensive. The measurements may be reasonably rapid, perhaps minutes after sampling,

but they are certainly not in real time, and cannot provide a continuous monitor of microbial biomass in situ. Nevertheless, they are useful for many purposes (Dermer et al., 1980; Letich, 1984). .
2.1, EislwrPincescence and cbm&&ceraoe
: Several chemical reactions have been designed or identified such that light is produced quantitatively in response to a certain factor that may be used as an indicator of biomass. Of these reactions, bioluminescence is a method. t!lat is currently favoured by microbial ecologists, since it may be automated, is fairly rapid (output in under 2 min) and instrumentation based on this principle is commercially available (e.g. Karl, 1980). The bioluminescence assay is based upc?n the assumption that living cells of a given type contain a reasonably constant amount of-ATP, which is lost rapidly upon cell death. Biomass may therefore be expressed in terms of ATP concentration (and also of NASH under certain conditions (Lovgren et al., 1982)) by the amount of luminescence produced as a result of a reaction catalysed by firefly iuciferase:
ATP + luciferin + 02 = oxyluciferin + AMP + PPi + CO2 + light (1)
(e.g.’ Allen, 1972; Thore eb al., 1975; Jones, 1979; There, 1979; Anon, 198ld; O’Toole, 1983a; Thore, undated).
The light produced is detected photometrically, and the method is sensitive to cell numbers as Iow as 10’ cells/ml (Chappelle et al., 1978): Errors in the estimated biomass may arise, for instance, from one or more of the following sources:
W (ii)
(iii)
(iv) (v)
(vi)
(vii)
(viii)
incomplete extraction of ATP; quenching by extraction chemicals, “bur^fers tii ather substances in the sample; use of impure, though relatively inexpensive etai., J-978); stress on cells;
luciferase (Picciolo
activity of ATPases and other kinases; variation of cellular A,TP content with physiological conditions (Chapman et al., 1971; Atkinson, 1977; Chappelle et ai., 1978); the presence .of free ATP of non-microbial origin (Picziolo et al., 1977); .
degradation of ATP by the extraction reagents.

22 C. M. Harris, D. B. Keli
A further method, using firefly iuciferase, has been developed to overcome the problem of the variation in the ceIiuIar ATP content (or the adenylate energy charge) (Karl St Hahn-Hansen, 1978; Jones, 1979). Although ATP concentration varies with physiological conditions, it has been observed (Atkinson & Walton, 1967; Chapman et al., 1971) that the total concentration of adenine nucleotides (ATP, ADP, and &Pj remains essentially constant, and may be used as an indicator of meta- bolic activity and the potential for growth.
The concentrations of AMP and of ADP are determined by separation, enzymatic conversion to ATP, and a subsequent assay with firefly luci- ferase (Karl & HoIm-Hansen, 1978). The adenylate energy charge Es then calculated from:
adenyiate energy charge = [ATP) + O.S[ADP]
(A&C) [ATPI + [ADP) + LAMP] (2)
For growing cells, the AEC is typically between O-8 and 0.9 (Atkinson & Walton, 1967; Atkinson, 1977; Knowles, 1977). Absolute growth rates cannot be predicted from the AEC ratio, but the rate of protein synthesis and the capacity for cell growth correlate more closely to this than to absolute ATP concentrations; hence, although it has little thermo- dynamic basis, the AEC is a useful indicator of metabolic activity and the potential for cell growth.
The main disadvantage of the AEC method, regarding its application to the monitoring of biomass in fermentors, is the separation and subse- quent conversion of ADP and AMP to ATP. which would require removal of the sample from the fermentdr, and a delay of approximately 30 min before the results were availkble.
Bioluminescence is probably the.most convenient and reliable method for measuring total microbial biomass in most environmental samples (Karl, 1980). It has been used to assay biomass in fermentor broths (Cachet et al., 1984; Anon, undated, a), and Sharpe et al. (1970) suggested it to be. ‘a better indicator of biological activity in food than the number of colony-Forming units’,
Less successful than bioluminescence is the detection of microorgan- isms by the chemiluminescence of luminol. This measures the light emitted by the haem-protein-catalysed oxidation of luminol in the presence of hydrogen peroxide (Neufeld et d., 1965 ; Coates, 1976; Ewetz & Thore, 1976; Jones, 1979).
An automated luminol chemiluminescence method for measuring the

The estimation of microbial biomass 23
microbial content of water samples, seeded with one of six common contaminants, was developed by Oleniacz et UC. (1968). They proposed two separate systems, both capable of detecting 103 to IO5 cells/ml of water. These systems measured the light emitted from the reaction of alkaline luminol in the presence_of either sodium perborate or sodium pyrophosphate peroxide. I3oth methods were non-specific amongst organisms; they could not differentiate qtiantitatively one organism in the presence of a mixed population. For each type of microorganism seeded, however, the method exhibited a linear response to varying cell numb&s. It was also recognised that luminol chemiluminescence may be affected by certain transition metals, such as iron, which are known to catalyse chemiluminescence. In the same study, Oleniacz et al. (1968) examined the effect of ferric, ferrous, and calcium chlorjdes on the luminol per- borate system. Iron (III) chloride provoked luminol luminescence whether E.coCr’ was present or not; iron (II) chloride, below a critical concentration, similarly increased luminescence, but above this critical concentration iron (II) chloride had a quenching effect; calcium chloride exhibited a similar enhancing/quenching effect about a critical concentra- tion: The effect of these ions and various transition metal ions, on the luminol chemiluminescence reaction could be eliminated Gy the appro- priates use of filters, so as to permit the subtraction of the background chemiluminescence from that produced by the biomass in the sample. Miller & Vogelhut (1978) have also shown that the method is sensitive to haem moieties in the culture fluid, necessitating the isolation of micro- organisms from the growth medium, and hence greatly reducing the ease of application of the luminol chemiluminescence technique. They have also indicated that the method is not as sensitive to microbial biomass as was first reported.
2.2, QtIrer chem%eaI metho& for bhe assay of cellular compounds
A variety of other cellular components has also been used as indicators of biomass. Some of these methods are outlined below. .
‘Phospholipids constitute a part of every cellular membrane and form a relatively constant proportion of the membranes of different microbes’ (White, 1983). Measurements of the phospholipid content of a tiple can thus offer a convenient assessment of microbial content, though they cannot distinguish biomass from necromass. Phospholipids are quantita- tively extractable, and the lipid phosphate content is readily measured,
.

24 C. M. Hurris, D. B. Kell
either, following perchloric acid digestion, by calorimetric analysis (White, 1983), or by conversion to fluorescent derivatives and HPLC atialysis (White, 1980). Both methods have a sensitivity equivalent to approximately 10’ cells of the size of E.coZi. Alternatively, glycerol from phosphoiipids may be assayed somewhat more sensitively, in amounts equivalent to approximately 10” cells of the size of E,coii, using GLC (Gehron & White,. 1983). Martz et al. (1983) have used HPLC to assay one particular phospholipid, phytanylglycerol ether, which is found in methanogenic bacteria,
Watson et al. (1977) and Hobbie & Watson j1980) have used limuius amebocyte lysate (LAL), isolated from the blood cells of the horseshoe crab, to estimate biomass in the marine environment, L_4L reacts speci- fically with lipopolysaccharide (LPS), which comprises a relatively constant proportion of the cell wall of Gram-negative bacteria, to form a turbid solution. The amount of turbidity measured photometrically, minus that caused by free LPS, is linearly proportional to the amount of LPS and hence to biomass. This method provides a reasonable estimate for total biomass in marine samples, since they are comprised of 80-95% Gram-negative bacteria (e.g. Watson et al., 1977). The accuracy of the LAL method compares well with ATP methods and direct counts (Hobbie & Watson, 1980), but the consistency of the LAL method in different hands is poor (Watson et al,, 1977).
Newman & O’Brien (1975) developed a method for detecting meta- bolically produced ethanol in E.coZi using gas chromatography. The time between inoculation and detection was related to the initiai cell concentration.
Ribbons (1970) discussed the relationship between media constituents (e.g. carbon, energy solurce, ,nitrogen, potassium, magnesium, phos- phorus, sodium and trace elements) and cell yields and composit.ion. A relatively simple element to assay, using a commercially available organic carbon analyser, is carbon. The amount of totai organic carbon represents approximately 50% of the biomass present in the (washed\, sample. However,‘carbon alone is not a good indicator of growth and viability, since, Iike oxygen and the energy source, it may be incorporated or consumed after cell growth has ceased. Errors also arise owing to the presence of non-microbial carbon (e.g. .eukaryotic carbon in ecosystems) and incompletely utilised but adsorbed medium constituents in fermentors.
Muramic acid, which is found only in bacterial cell walls, including

The estimation of microbial biomms 25
those of blue green bacteria, has been correlated to biomass (e.g. King &; White, 1977; Jones, 1.979). To this end, it may be hydrolysed to lactate, either chemically, using alkali (King & White, 197.7; Jones, 1979), or enzymatically (e.g. Jones, 1979). The resulting lactate may then be assayed in a number of ways, with- sensitivities corresponding to lOa bacterial cells/ml, for instance using GLC, calorimetry or pulse labelling {King & White, 1977). The most obvious disadvantage, that the relative proportion of Gram-negative to Gram-positive bacteria needs to ‘be known for ecological studies (Moriarty, 1980), is not important in axeatc: fermentations, but the method is lengthy, labour-intensive, and certainly not practical for monitoring fermentors.
Obviously DNA, protein and, to a lesser extent because of the strong dependence of its content on growth rate (Herbert, P961), RNA (Koliander et al., 1984) may be regarded, in -favourable cases, as reasonably biomass-specific chemicals. Methods for their assay are well known, and since they suffer the same disadvantages as other chemica.1 assays when applied to growth in fermentor:;, we do not consider them further here.
At least two enzyme-based methods have been proposed, one to measure faecal coliforms by a calorimetric P-galactasidase assay (Warren et -al., 19781, and the other to measure ghrtamic acid decarboxylase activity in water samples (Trinel et al., 1980). The hydro;lysis of o-nitrophenyl-@-D-galactoside by faecal coliforms, recovered by mem- brane filters (LeChevallier et al., 1983), can be followed co!orimetrically, and the time taken to reach half the maximum possible absorbance change is proportiona, to the initial coliform concentration. raetection times using this method are between 8 and 20 h depending on the size of the inoculum. The assay for glutamic acid decarboxylase activity has been automated (LeChevallier et al., i983). The sample is concentrated by ultrafiltration and incubated for 12 h. Both methods rely on cell growth and so are unsuitable for real-time measurements in fermentors.
2.3. lWadiom2try
Radi.ometric procedures were pioneered by Levin and others in the 1950s. Since then radiometry *has been applied to a wide range of pro’blems, inciuding the enumeration of coliforms, particularly in water, the search for extraterrestrial iife, selection of antibodies, prospec.ting for oil and gas, and general microbiological research (Levin, 1963)_

26
‘The principle is to supply the microorganisms with a radioisotopically labelled substrate, the most common radioisotope being 14C. 14C02 is produced metabolically, and the amount of radioactivity whic’h is detected, for instance with a scintiUaiion counter, is representative of +,!z microbial activity (e.g. Bachrach, 1976). Alternatively, heterotrophic microorganisms capable of rapid uptake of the labelled metabolite may be filtered, washed and dried, and tire amount of intracellular activity counted. The amount of intracellular radioactivity may then be corre- lated to microbial activity (Bourgeois & Mafart, 1976). Early experiments by Levin detected 125 coliform cells in an hour, a sensitivity which was previously unobtainable, but the experimental protocol has now been modified, sacrificing the low detection times for the benefits of lower cost and lower levels of radioactivity (Levin, 1963).
Radiometry has subsequently been automated (e.g. Buddemeyer, 1976). The commercially available automated system, Bactec, has been tested, using blood and simulated blood samples, by Washington & Yu (197 l)., who reported, ‘it is clear from our studies that this system of ear& detection of bacteremia lacks the sensitivity to be a suitable alternative to conventional broth culture techniques’. This report was criticised by DeBlanc et al. (1971), who, in testing nearly 3000 blood cultures, found a sensitivity comparable to conventional methods, and detected 70% of the positive cultures more quickly using Bactec.
Waters (1.972) studied the sensitivity of the radiometric method in bacterial detection. He reported on the dependence of the detection time upon the initial size of the inocuIum. Thus, lo7 cells were detected in l-5-2-5 h, and 1 cekl in 8-16 h. Bachrach & Bachrach (1974) obtained similar results in detecting 14C02 produced by Ecoii grown on 14C lactose; they reported a detection time of 6 h for l-i0 cells in water samples. Rowley et af. (1976) found that 6-7 h was a time sufficient to differentiate suspect from non-contamin.ated food samples- by radio- metric procedures.
Radiometric techniques have obviou s applications in the early and sensitive detection’ .of microorganisms in clinical analyses, monitoring of water supplies, pharmaceutical and food industries, and ecological studies, Unfortunately, such a method, although extremely sensitive, is not performed in real time and is therefore unsuitable for monitoring fermentation processes. Its use is also limited to the detection of micro- organisms which metabolise the “C-source added.

The estimation of microbial biomass Z?
In recent years a variety of dissolved gases and volatile substances have been assayed by membrane inlet quadrupole mass spectrometry (e.g. Lloyd & Scott, 1983; Lloyd et,al., 1983). Such measurements, together with a knowledge of respiratdry quotients and yield coefiicients in aerobic organisms, may in principle b, p used to assess the biomass content of a fermentor. Obviously, gaseous CO2 may also be estimated by infra-,red spectroscopy, and such measurements may be correlated in certain cases to biomass content (e.g. Park et al., 1983). Whilst such methods may certainly be used to gain useful information about the state of a fermen- tation, it is to be assumed that any relations between the production of an extracellular chemical and the content of microbia’u biomass are likely to be casual rather than causal. We do not therefore pursue such approaches further.
3. MICROSCCYY
The microscope is an essential tool for the microbiologist, not only in revealing the stru&Ares of microorganisms, but also in quantifying them. With the use of appropriate staining and a counting chamber, e.g. a haemocytometer, an accurately predetermined volutne of cell suspension may be counted; from this the cell concentration may be determined, and biomass estimated (e.g. Norris & Swain, 1971; Quesnel, 1971; Adams, 1980).
Suitable staining is of the first importance, to ensure that only viable cells, and not non-viable cells or background matetial, are counted. Many stains are pf-i indicators, e.g. neutral red and phenolphthalein, atid emphasise the difference between living and non-living ceils on the basis of the commonly observed difference, in the former, between intra- cellular and extracellular ~1% (see Padan et al,, 1981). Other stains aie specific to nucleic acids, staining only the viable cells with intact nucleic acids. The use of nalidixic acid to differentiate viable and non-viable cells was introduced by Simidu & Kogure (IFW). The-basis of the method is that nalidixic acid, a DNA gyrase inhibitor (Sugino et al., 1977), inhibits

28 C. M. Harris, D. B. Keii
the divisiorr of cells without affecting their growth. Thus, the viable cells become greatly enlarged, enabling easy identification and enumeration, However, the method would seem to be too involved to be of widespread practical use.
A further consideration prior to executing direct counts is that particu- late material may be present, for instance in food samples, To eliminate the possibility of these particles being counted as colonies the sample may be filtered. However, filtration procedures themselves are liable to intro- duce secondary problems (e.g. Entis. 1981).
3.2. Epifiuorescence microscopy
Fluorochromes, e.g. a&dine orange, ethidium bromide, euchrysine, etc. (Jones, 1979), are greatly superior to the traditional stains. Of these, acridine orange seems to be the most commonly used. It has a high affinity for nucleic acids, and is used as a viable cell stain, since nucleic acids are rapidly degraded upon cell death. When viewed under ultra-violet light, stained RNA and single-stranded DNA fluoresce orange/red, whilst double-stranded DNA appears green.
Fluorochromes. are used in conjunction with a black membrane back- ground for contrast. They have proved particularly useful for environ- mental samples, which are filtered onto the black membrane and stained. Two types of filters are available: cellulose and polycarbonate. Cellulose filters have the disadvantage that the cells are not retained on a flat membrane surface, but on a rough surface, and since the counting is in one plane -only, it may in principle result in an underestimated cell population size-Hobbie et ai. ./,‘1977) claimed an improved accuracy in epifluorescence counts using nuclepore polycarbonate membranes dyed with Irgalan black, These membran es have a flat surface, thus allowing all the retained cells to be counted. However, this observed increase in accuracy was based on a comparison between filters that differed not only in composition but also in pore size; Jones (1979) repeated this com- parison and found.that the epifluorescence counts on the two types of membrane of comparable pore size did not differ significantly, and further fuund the cellulose filters to have the added advantage that they enhance fluorescence contrast.
Larsson et al. (1978) compared epifiuorescence microscopy with light and electron microscopic techniques for determining the microbial numbers in itike water, The samples were stained with acridine orange

The estimation of microbial biomaw 29
(which is five times more effective than erythrosine (Jones, 1.979)). and the microorganisms collected on a nuclepore filter. Since bacteria retain their morphology when stained as described (e.g. Jones, 1979); and so are distinguishable from detritus for counting pur@oses, Larsson et r?l. (1978) were able to conclude that acridine orange epifluorescence microscopy is the most accurate microscopic method, available for determining the total number of microorganisms in water samples.
Zimmermann (1980) applied a statistical analysis of the data obtained from epifluorescence microscopy to the estimation of bacterial biomass. Rosendal & Valdivieso-Garcia (i981) used this technique to enumerate mycoplasmas. They reported a good correlation between counts of acridine orange-stained cells and the number of colony-forming units in exponentially growing cultures, but a low correlation with organisms taken from batch cultures in their lag and death phases.
Pettipher et al. (1980) (see also Anon, undated, b), in their studies on direct enumeration of the bacterial content of raw milk, reported the direct eyifluorescence filter technique, DEFT, to be rapid (of the order of 25 min) and sensitive, in the range of 5 X lo3 to 5 x 10’ cells/ml_ Pettipher recognised the potential of DEFT as a rapid, sensitive and inexpensive method for enumerating the bacterial content of samples, but wit:;1 the major problem of operator fatigue. Pettipher & Rodrigues (1982) there- fore developed a semi-automated epifluorescence technique, utilising closed-circuit television and computer analyses, The closed-circuit television allowed quality control checks to be undertaken, and the computer recorded the amou.nt of fluorescence. The semi-automated DEFT studies on raw milk have been compared with manual DEFT (94% agreement), plate counts (83% agreement), and Coulter Counter methods (81% agreement) (Pettipher & Rodrigues, 1982). Complete automation would be possible, simply by coupling the available system to a computer-controlled movement of the microscope stage (Pettipher & Rodrigues, 1982). Such a system might, with appropriate sampling procedures, be applied to the control of fermentors, albeit with ti restricted response time. Pettipher’s recent (1983) monograph gives an extensive discussion of the technique.
3.3. Viable counts
In contrast to direct counts using traditional stains or fluorochromes, viable counts rely on the growth of microorganisms, and hence the

30 C. M. Harris, R. B. Kell
resulting colonies are counted rathe. r than the microorganisms them- selves. Briefly, the method requires the dilution (or otherwise) of the sample, aliquots of which are dispensed onto a suitable nutrient agar plate, followed by incubation to allow the viable cells present to form colonies (e.g. Postgate, 1969). The obvious disadvantage of such a meGi& is the long incubation period required befor,e emumeration is possible, often as.,long as 72 h. This is a real disadvantage in clinical analyses and renders the method valueless as an on-line monitor in fermenters. Nevertheless, viable counts are commonly used in micro- biology laboratories as a ‘benchmark’ method.
Several attempts have been made to reduce operator time in the preparation, and in the counting of colonies. Sharpe etal. (1972) explored the use of a fact pump dispenser, in conjunction with serial dilutions. In this arrangement, various dilutions of the sample are added to molten nutrient agar, aliquots of which are then dispensed via the foot pump into a sterile Petri dish. Don Whitley Scientific Ltd market a semi-automated spiral .plating device, which, after incubating the plates, a.ilows either manual or laser counting (see, e.g. Kramer et al., 1979; Couse $t Ming, 1982; Anon, undated, c). The counting time in this system has been reduced to approximately 5, which is itself a great advance in reducing operator fatigue, but the long incubation time is still necessary. Many other commercial video-based image analysers may be used to cou.nt colonies on a Petri dish in well under 5s.
Other problems encountered with viable counts are the contamination of the sample by growth-inhibiting substances, or by particles which may be mistaken for colonies. The food industry, in particular, suffers from the effect of particulate food constituents inhibiting growth, or them- selves being counted as colonies. To reduce this problem, Base1 et al. (1983) explored a technique using density centrifugation to remove any such particles prior to incubation and counting.
Attention has also been focussed on adapting the technique of viable counts to water samples, in which the microorganisms are generally fairly sparse. Cells of &.coli have been collected from water samples on membrane filters, which are then placed onto a selective medium, incubated, and the resulting colonies counted (Dufour et ai., 1981). This method does have the advantage that it is non-lethal to bacteria. Some previous methods, which involved measurement of zhe conversion of tryptophan to indole. were bactericidal (e.g. Dufour et al., 1981). Howei;~~, any method utilising filters is likely to result in some fraction of

The estimation o f microbial biomass 3 1
t h e -mic rob i a l c o n t e n t be ing lost o r d a m a g e d , y ie ld ing an u n d e r e s t i m a t e d p o p u l a t i o n size. P e r h a p s a b e t t e r m e t h o d for c o n c e n t r a t i n g t he m i c r o ' o r g a n i s m s p r e s e n t in w a t e r s amp l e s is c e n t r i f u g a t i o n . . T h e p e l l e t c a n t h e n be s p r e a d o n t o a g a r o n a m i c r o s c o p e s l ide, c o v e r e d wi th a c o v e r slip a n d i n c u b a t e d . T h e n u m b e r o f co lqn ies p r 6 d u c e d a re c o u n t e d as a p e r c e n t a g e of t h e t o t a l n u m b e r o f c o l o n y , f o m l i n g a n d s ingle-cel t uni~,s, g,~: ":-,.,g the p e r c e n t a g e a n d a b s o l u t e n u m b e r of viable cells (F ry & Z ia , 1982).~
V i a b l e c o u n t s a r e u s e d as a r e f e r e n c e t e c h n i q u e t h r o u g h o u t th e field o f the e n u m e r a t i o n o f m i c r o o r g a n i s m s . T h e m e t h o d ' s c o n s i d e r a b l e dis- a d v a n t a g e s , of l ong i n c u b a t i o n t ime a n d o p e r a t o r fa t igue , a r e o u t w e i g h e d by its h igh specif ici ty ( o b t a i n a b l e wi th the use of su i t ab l e n u t r i e n t s ) , its r e p r o d u c i b i l i t y , a n d t h e fact t h a t an ini t ial h igh ou t l ay is n o t r e q u i r e d . I t is c o n c e i v a b l e t h a t th is p r o c e d u r e cou ld be u sed as an occas iona l c h e c k o n the p rogres~ o f a c o n t i n u o u s f e r m e n t e r , b u t it is in n'o w a y su i t ab l e for an on- l ine b i o m a s s m o n i t o r i n g dev ice .
4. P H Y S I C A L M E T H O D S
In p r inc ip l e , t h e phys ica l m e t h o d s a re t h e b e t t e r m e t h o d s fo r a d a p t i n g to c o n t i n u o u s , in s i t u m o n i t o r i n g o f b i o m a s s in f e r m e n t o r s . T h e y exp lo i t a n d m e a s u r e phys ica l cha rac t e r i s t i c s wi th in the s a m p l e , l eav ing it u n a f f e c t e d , a n d do n o t r e q u i r e t h e r e m o v a l o f t he s a m p l e f rom t h e sys t em. M a n y phys ica l t e c h n i q u e s h a v e a l r eady b e e n fully a u t o m a t e d , a n d a re ava i l ab le c o m m e r c i a l l y ; o t h e r s a r e still in t he i r infancy.
4,1. Dry weights
D r y w e i g h t is o f t e n t a k e n as t h e def ini t ive m e n s u r e o f b iomass . H o w e v e r , t he m e a s u r i n g o f d ry w e i g h t s is o n e e x c e p t i o n a m o n g s t t h e phys i ca l m e t h o d s , in t h a t t h e s a m p l e is r e m o v e d f r o m t h e b u l k a n d s u b s e q u e n t l y lost. A s s u c h , it is n o t a su i t ab le t e c h n i q u e for t h e c o n t i n u o u s m o n i t o r i n g of f e r r n e n t o r s , b u t m a y , l ike v iab le c o u n t s , p r o v i d e a o n e - o f f s p o t c h e c k . _Tb__e m e t h o d en t a i l s t h e i so la t ion o f a k n o w n v o l u m e of s a m p l e , w h i c h is w a s h e d w i t h d is t i l led w a t e r , to r e m o v e a n y m e d i u m c o n s t i t u e n t s , a n d d r i e d to a c o n s t a n t mass . T h e d ry ing p rocess c a n be l e n g t h y , a n d t h e p r e p a r a t i o n l a b o u r - i n t e n s i v e . Diff icul t ies m a y ar ise w h e n a d s o r b e d b u t n o n - m i c r o b i a l s u b s t a n c e s a re present. , for i n s t ance m e d i a c o n s t i t u e n t s o r m e t a b o l i t e s of h igh m o l e c u l a r we igh t . N e u f e l d & Z a j i c (1982) h a v e

studied this problem with regard to growth on hexadecane, to which some cells adhere; they separated the adhered cells by freezing and centrifuging ti known volume of sample. The free cells pelleted at the bottom of the centrifuge tube, allowing straightforward measurement of dry weight in this fraction. Lyophilisation of the frozen hexadecane and any adhered cells released the remaining cells, allowing their dry weight to be deter- mined.
O’Toole (19836) investigated the effect of the hygroscopic nature of microbial cells on dry weight measurements. Dried cells adsorb moisture during weighing, which results in an error of approximately 0~6% of the total dry weight. This error, albeit small, may easily be eliminated, by taking readings of mass over 3 min, Good laboratory practice of linear extrapolation to time zero gives the correct dry weight.
In spite of their disadvantages, dry weight methods are commonly used as a spot check for fermenters, and as a standard in microbial physio- logical research, where the technique has been widely applied to both general and specific problems (e.g. Stouthamer, 1979; Tempest ZL) al., 1983). The use of dry weights in clinical and ecological studies is limited, owing to the paucity of the microorganisms in the samples.
4.2. Photometric systems
‘One of the strange coincidences of nature is that the size of bacterial cells and the wavelength of light are approximately the same. . . As a conse- quence of this closeness in size, bacterial cells will scatter visible radiation in a rather complicated manner, since they are in resonance with the incident waves.’ (Wyatt, 1973.) The scatter is mainly in the forward direction (Powell, 1963). The turbidity of a microbial suspension depends not only on the geometry of the instrument, the wavelength of light, relative and absolute refractive indices, and the cuvette path length; it is also a function-of microbial size, shape, which may alter with growth phase (e.g. Gates, 1983), and concentration, and may therefore be used to evaluate microbial growth.
Light scattering and transmission techniques have been made more accurate, reproducible and easier with the advent of lasers, micro- electronics, and digital computers. Lasers provide an almost ideal source of light, which is monochromatic, well collimated, easily polarised, coherent and available at a variety of powers and wavelengths. Micro- electronics and computers facilitate rapid manipulation of the data.
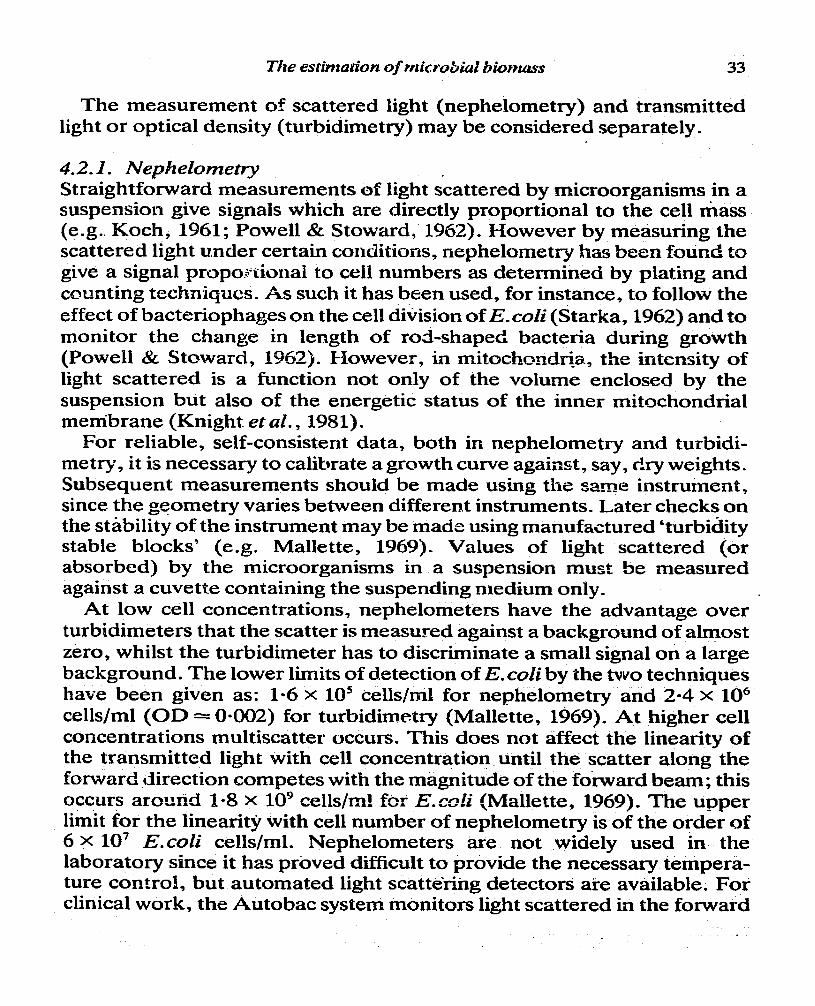
The measurement of scattered light (nephelometry) and transmitted light or optical density (turbidimetry) may be considered separately.
4.2.1. Nephelametry Straightforward measurements of light scattered by microorganisms in a suspension give signals which are directly proportional to the cell mass (e.g.. Koch, 1961; P owe11 & Stoward, 1962). However by measuring the scattered light under certain conditions, nephelometry has been found to give a signal propo.+xioual to cell numbers as determined by plating and counting techniques. As such it has been used, for instance, to follow the effect of bacteriophages on the cell division of Ecoii (Starka, 1962) and to monitor the change in length of rod-shaped bacteria during growth (Powell & Stoward, 1962). However, in mitochondti_a., the intensity of light scattered is a function not only of the volume enclosed by the suspension but also of the energetic status of the inner mitochondrial membrane (Knight. et al., 1981).
For reliable, self-consistent data, both in nephelometry and turbidi- metry, it is necessary to calibrate a growth curve against, say, dry weights. Subsequent measurements should be made using the sarme instrument, since the geometry varies between different instruments. Later checks on the stability of the instrument may be made using manufactured ‘turbidity stable blocks’ (e.g. Mallette, 1969). Values of light scattered (or absorbed) by the microorganisms in a suspension must be measured against a cuvette containing the suspending medium only.
At low cell concentrations, nephelometers have the advantage over turbidimeters that the scatter is measured against a background of almost zero, whilst the turbidimeter has to discriminate a small signal on a large background. The lower limits of detection of E.culi by the two techniques have been given as: 1=6 x 10⁵ cells/ml for nephelometry and 2.4 x lo6 cells/ml (OD = OXKI2) for turbidimetry (Mallette, 1969). At higher cell concentrations multiscatter occurs. This does not affect the linearity of the transmitted light with cell concentration until the scatter along the forward direction competes with the magnitude of the forward beam; this occurs around l-8 x IO’ cells/~1 f ..= *or E.c& (Mallette, 1969). The upper limit for the linearity with cell number of nephelometry is of the order of 6 X 10’ E.coZi cells/ml. Nephelometers are not widely used in the laboratory since it has proved difficult to provide the necessary tempera- ture control, but automated light scattering detectors are available. For clinical work, the Autobac system monitors light scattered in the forward

direction, during an incubation period of 5 to 6 h, and correlates the detection time with the initial size of the inoculum (Bascomb, 1983).
Keilmann ez ul. (1980) have utilised the sensitivity of nephelometers at the iower cell concentrations, and the linearity of turbidimeters at the higher ceil concentrations, in a multichannei photo-nephelometer, which is able to measure either tight scatter or transmission, or both simuitaneously.
Parenthetically. we may mention that light scattering techniques have proved to be particuiarly useful in assessing the viability of bull spermatozoa, on the basis of their motility (Chen & Hallett, 1982). The quasi-elastic light scattering technique may be used as a rapid and powerful means for determining the motile properties of these and other ceI1 populations. It measures the spectral broadening of scattered light, at a given scattering angle (Chu, 1974; Pusey & Tough, 1982; Earnshaw & Steer, 1983), caus., -d by the motile ceils (Chen & Hallett, 1982) _ The total light scattered by a population of viable (motile) and non-viable ce!.ls is a function of that scattered from each component. However, the deconvo- lution of the measured autocorrelograms is subject to a number of assumptions (Woolford & Harvey, 1982; Dahnecke, 1983).
An extension to the study of viability using quasi-elastic light scattering is the use of a twin-beam laser velocimeter, which acts on the principle of timing the transit of cells across the two laser beams in a direction perpendicular to the beam &es (Wilson & Harvey, 1983). .
4.2.2. 2krbidimett-y Routine photometric determinations as commonly executed in the laboratory measure, indirectly, the amount of light scattered by micro- organisms in suspension. They do so by recording the amount of light that is absorbed or transmitted by the sample, rather than that .which is actually scattered. This provides a relatively quick and convenient way of estimating cell concentrations + a fermentor, in general requiring only the removal and appropriate dilution of the sample. The physics of light scattering in this context is discussed, for instance, by Koch (1961), Mallette (19691, Jennings. & Morris (1974), Bohren & Muffman (1983) and Dahnecke (1983).
Highly automated turbidimeters &e available, being designed primarily for clinical analyses. Despite their very widespread use (e.g. Titus et al., 1984)) in situ optical measurements of fermentation processes

(e.g. Rancher et at., 1974) are generally unsatisfactory for the following reasons:
(0
(ii)
(iii)
(iv)
Commercially, the m’ srroorg;Inisms are normally grown at con- centrations outside the limits of linearity between optical density and cell concentrations (i.e. outside the range in which the Beer- : Lambert law holds). 0tker (non-microbial) particmate material may be present, par- ticularly in industrial fermentors, which often utilise media con- taining particulate matter. .
Gas bubbles, produced by aeration or metabolically, may be present. In the absence of the above three pr&!ems, accurate measure- ments may still be impossible, because the microorganisms can grow preferentially on the photosensor.
Probably the most fully automated photometric (or other) system for monitoring relativeIy sparse microbial populations is the AutoMicrobic System (AMS) (Vitek Systems Inc). This automated, computerised system was developed by Aldridge et al. (1977) for the detection, enumeration and identification of bacteria and yeasts in clinical specimens. The biological basis for the system resides in lyophilised, selective media enclosed in wells of a disposable plastic cuvette. The introduction of the sample into these wells both rehydrates and inoculates the media. An automated optical system monitors the change in light transmission by solid state optics. This system does not require lenses or optical condensers, and uses an array of light-emitting diodes with a peak emission at 665 nm. The computer interprets any optical changes within the sample, and provides enumeration withi%r. 13 h. The use of selective media enhances the detection time; they are also formulated to allow specific microbes to thrive whilst suppressing others. The media thus provide a means for the identification of individual types of micro- organisms and/or groups of microorganisms by the visual observation of both colour and turbidity changes. The effect of bubbles produced by the microorganisms during growth is eliminated by scanning the entire sample-containing cuvettes (Aldridge et al., 1977; Heslop, 1980; Bascomb, 1981; Gibson, 1982). This system contains all the elements of a fully automated system for detecting microorganisms by their growth and division (Fig. 1). .

36 C. M. Harris, D. B. Keii
The sensitivity of the AMS has been extensively studied using urine specimens. The AMS has detected 7 x 10⁴ colony-forming units (cfu)/ml, with a 92% agreement with plate counts. The detection time varied between 4 and 13 h, depending on the pathogen present and its concen- tration (Aldridge elt ‘al., 1977). Sonnenwirth (1977) used AMS to enumerate simulated and actual urine samples; he reported an agreement with the number of colony-forming units of 83-S%, and an agreement in correctly evaluating negative samples of 97.5%. Hasyn et al. (1981) reported the correct identification of 97% of Enterobacteriaceae samples using the Vitek AMS.
Another automated system for use in clinical work, that measures optical density using light-emitting diodes, is %he Abbott MS-2. It monitors the growth in a sample at 5min intervals, and is able to
F5g. 1. Block diagram of the elements (modules) required for the full automation of microbial enumeration. Regardless of the detection principle(s) employed, all growth- associated methodologies require the steps indicated, which are embodied in the system
described by edridge et al. (1977).
- .
enumerate and identify the. microorganisms present with the use of specific and selective media. Clinica studies have shown a 97-P% correct detection of ‘positive? specimens containing greater than IO5 &u/ml, and correctly defined 9907% of ‘negative’ specimens containing less than IO3 cfu/ml (Anon, 1980).
Coleman et al. (1983), motjvated by. the high cost of commercial equipment, have devised. their own automated system for measuririg bacterial concentration by optical means. They have interfaced 24 sampling channels to a Commodore PET microcomputer, X-Y d&ital plotter, biophotometer, inter-fare box, disc drive and printer, to study the

The estimation of micrubial bimnass 37
effect of inocula of anti’biotics on the growth of bacteria. ‘The growth curves obtained from the transmission data taken over a 24-h incubation period, have been compared (satisfactorily) with viable dounts taken over the same period. ‘l;he photometer was unable to detect any decrease in cell number below a concentration of 5 X lo6 cfu/ml, only an increase, and, of course, antibiotics which do not affect the ceil wall generally did not produce a fall in turbidity.
One of the problems that is encountered when using optical density as an estimator of biomass, as mentioned above, is the interference caused by bubbles. Ohashi et a/. (1979) overcame this by designing a submersible calorimetric probe, that permits easy-and continuous measurement of the 01 ltical density whilst removing the air bubbles Tom the sample. Their cell mass sensor consists of a double-layer cylinder for defoaming, a measuring chamber with a light source, a photocell or phototransistor, and a discharge port. The sample is forced through the double-layer cylirider by the agitation of the fermentor broth, dispelling any air bubbles; the bubble-free suspension then enters the measuring chamber, where the photocell or phototransistor measures the transmitted light. The optical density is determined from the photoelectromotive force givi:n_ by a d.c. voltmeter connected to the detector. This is, as are all optical density sensors, accurate to a maximum concentration in the order of 5 X 10’ cells/ml, which is often well below the operating cell concen- tration for fermenters. The problem of cell growth on the surface of the probe does n<st yet seem to have been solved generally; for photometric systems, electrolysis using optically transparent electrodes would appear to offer the most realistic solution.
optical density measurements combined with ‘growth delay’ analysis have been used for estimating the tota injury of a bacterial cell popu- lation which has been subjected to potentially bactericidal conditions (Takano & Tsuchido, 1982). The resulting growth reflects a decrease in the number of viable cells, and/or an Increase in the lag time w’hich is required by the injxred cells for the necessary repair processes. Auto- mated and contia’uous optical density measurements have be&n compared with the number of colony-forming units obtained by plating techniques (Takanti, & Tsuchido, 1982).
4.2.3. Other photometric techniques A major problem with measurements. involving the turbidity of a microbial suspension is that they are unable to distinguish viable cells

38 C. M. Han-k D_ B. Deli
from non-viable cells and non-microbial particulate material. Thus Ku11 &Cuatrecasas (1983) have estimated the number of viable cells using the absorbance of a sample after staining with neutral red, a stain specific, under many conditions, to viabie cells. This method utilises commonly available photometers, but the necessary preparative procedures are lengthy and labour-intensive, thus reducing its practicability.
Zabriskie & Humphrey (1978) applied culture fluorescence to the problem of estimating biomass in fermentors. ‘Erey irradiated the culture with near-ultra-violet light (366 nm), and detected the resulting fluorescence (at MO nm) using a photometer. Over half of the fluorescence of the intracellular material was caused by NADH, the rest being caused by NADPH and unidentified fluorophores. The log of the fluorescence was generally found to be linear with the log of the biomass, but the relationship is very dependent upon the culture environment, making the technique somewhat unreliable for accurate in siru moni- toring of biomass.
4-3. IMieroealsrirneUry
One of the most obvious changes which occur during the growth of all microorganisms is the production of heat. The study of this thermo- genesis can in principle be used to quantify microbial populations (Forrest, 1972; Mar, 1976). Further, the heat profile produced by a given microorganism is peculiar to that microorganism growing on a particular medium, allowing identification (Baling & Blanchard, 1973).
Beezer et al. (1976, 1978) (see also Bettleheim et al., 1976) used the linear relationship of heat production with microbial population to study the survival of yeast cells .that had been frozen in liquid nitrogen, and to detect the heat produced by 15 strains of bacteria which commonly cause urinary infection. They reported that lo5 organisms/ml could be detected+ after a 2-h incubation wriod, using flow microcalorimetry; this being the population size that is considered to cause urinary infection (Kass, 1957). Of the 299 urine specimens tested 15% were false positives and 1% false negative. The measurement of heat production was regularly and reproducibly detected for ah strains of bacteria studied. This could allow fast screening of urine samples in clinica analysis, and could eliminate a subsequent proportion of urine specimens from further investigL:tions within 2.5 h of receipt in thejaboratory, on the basis of their containing fewer than IO’ microorganisms/ml.

The estimation ofmicrobial biomass 39
Ishikawa & Shoda (1983) have used calorimetric analyses to follow the growth of E.ctili in continuous culture. Their prime, purpose was to understand the growth kinetics, rather than to estimate the biomass concentration. They followed the growth of E.coZi in a glucose-limited medium using in siti measuredents from a iwin-type heat cond&ion calori.meter, in which the vessel also &ted as a fez-mentor. They also measured the optical density at 660 nm, viable counts, dry weight, and the concentrations of glucose (substrate) and acetate (metabolite). Enthal- pies of the biomass were obtained’on the harvested, washed and dried cells in an oxygen bomb calorimeter,. It was found (Ishikawa Bs Shoda, 1983) that the growth yields based upon calculations of the tiee energy of catabolism or the total available energy were constant, but that growth yields based upon the glucose consumed decr&sed as the dilution rate increased; this was almost certainly due to the production of metabolites other than acetate and to the transition to Q,-limiting conditions at high dilution rates.
Nevertheless, temperature changes, or heat evolved from sources other than the metabolism of microorganisms, may be large in any fermentor. For example, in batch cultures heat exchange etiects are associated with the wetting of the vessel walls above the liquid phase on stirring, the stirring action itself, and many other factors (Biltonen & Langerman, 1979). This may make it difficult mitiocalorimetrically to detect temperature changes due to the heat production of the micro- organisms against such a large background. This, coupled to the heat evolution of respirin g but n&-growing cells, reduces probably prevents the practical application of such a successful monitoring of biomass concentration processes.
the accuracy and technique to the in fermentation
4.4. Filtration methods
Nestaas and Wang (Nestaas & Wang, 1981,1983a,b; Nestaas et al., 1981) developed a semicontinuous automated biomass probe to monitor the growth of Penicillium chrysogenum during the produczion of peni&in, in an attempt to over&me the ‘major bottleneck’ due to ‘the lack OE reliable biomass sensors for mycelial fermentations’ (Nestaas & Wang, 1981). Penicillin is not produced at a consistent rate; its production greatly depends upon the changing morphology of the mycelia throughout their life cycle (e.g. Nestaas & Wang, 1981). Thus, to achieve maximum
. .

40 C. M. Harris, D. B. Kell
production of penicillin it is desirable to use a feedback loop in order to control the mycelial morphology by means of the fermentation con- ditions. Nestaas and Wang (Nestaas &L Wang, 1981,1983a,b; Nes?aas et al., 168L) proposed such a feedback control system using a filtration probe. Using mathematical models and experimental evidence, Nestaas eb aZ. (1981) and Nestaas & Wang (1983u,b) showed that the filtrate volume and filter cake volume, taken as functions of time, may be related to the total biomass in accordance with the following equation:
x= vc lc”Xl v,+v, ij
where: X = biomass (g/litre), V, = filter cwhc volume, Vf = filtrate votume, and 3 = specific filter cake volume (ml cake/g dry biomass).
The measurements with the semicontinuous, automated filtration probe were initiated by pumping SO-100 ml of sample from the fermentor into the filtration unit, where the sample was degassed. A constant pressure ‘was then applied across the filtration unit, and both the filter cake volume, measured either with an optical sensor or a pressure trans- ducer, and the filtrate volume, measured with a load cell, were recorded as a function of time. Once the measurements had been completed the cake and filtrate were recycled into the fermentor, by way of solenoid valves triggered by a sequential timer, and the whole cycle was repeated after 30 min (Nestaas & Wang, 1983a). The resulting values for cell biomass, taken at different times during the fermentation, were in excellent agreement with those determined from dry weight measure- ments (Nestaak et aC., 1981). Furthermore, the number of cells obtained from these data, in conjunction with the average dry weight of a mycelial partide obtained microscopically; were in very good agreement with the number of spores inoculated, as determined from plate counts: l-3 X 10’ and l-5 x 10’ cfu/ml, respectively (Nestaas et al., 1981).
The filtration probe exploits simple physical phenomena which naturally occur during filtration; their measurement, however, may involve relatively complex devices. In addition, the nature of the fihration process as described Iimits the response t’me, and prevents genuinely continuous monitoring of biomass in fermenters; However, it is not unreasonable that measurement of the pressure transfer function using this probe could lead to a real-time estimation of microbial biomass. Sitiilar remarks may be made about the viscometric approach (Perley et al., 1979).
The estimation of microbial biomaw 41
4.9. bnpedimnetry
Changes in the electrical impedance (Z) of microbial cultures have been known to be associated with microbial growth since the 19th century (see e.g. Stewart, 1899; Green & Leon, 1922; Brooks, 1923; Zoond, 1927; Schanne & Ceretti, 1978; Anon, 198lb). They were first noticed in putrefying blood and samples conttiining Cb&idium spp. and ,$tl’eptococcm Zactis. However, it is only in the last decade or so that the impedance measurements have been widely exploited. This is due to the advent of commercially available impedance bridges that are suitable for the specific application of this principle to the monitoring of microbial growth. Several groups of workers have developed devices which monitor these impedance (or cond:lctance) changes, which are sometimes expressed as the ratio of the reference impedance to the sum of the reference and sample impedance:
impedance change = zr Zef + zample
This ratio is then related to microbial growth. The measured change in impedance is a function of the type and
number of microorganism(s), the medium in which they are growing, the frequency of the applied signal, the surface properties and geometry of the measuring electrode;:? L- cba slurface to volume ratio, the temperature and the interelectrode distance. For a given set of conditions, however, the impedance (or conductance) changes arise from tttttttttttttttttttto primary sources, outlined below:
(i) Microbial catabolism: the conversion of uncharged substrate molecules in the medium into c:narged metabolites, e.g. carbohydrates and lipids into lactic acid, acetic acid and bicarbonate. Such catabolic reactions create ion pairs and smaller, more mobile, and hence more conducting, molecules, resulting iti an increase in conductivity and a decrease in impedance (e-g. Cady, 1975; Hadley & Senyk, 1975; Ur & Brown, 1975; Cady, 1978; Ctidy et al., 1978; Anon, 1981a,b; Hause et al.,
1981). Conversely, ihe uptake of charged substances (NHs+, H#O;, etc.) will tend to raise the i~tipedtice (decrease the conductance)_
(ii) Electrode impedance: the impdance changes are measured between two electrodes in response to an &plied sinusoidal electric field. The impedance of this system, which consists of the electrodes separated

42 C. M. fiati, D. B. Kell
by microorganisms and medium, may be represented by a capacitor, C, and a resistor, K, in series, where
The reactive (capacitative) component undergoes a greater change than the resistive (conductive) component (e.g. Cady, 1975), suggesting that in addition to any conceivable permittivity changes occurring in the medium, there may be changes in the surface properties of the electrodes, thereby changing the capacitance of the electrode/electrolyte interface. Cady (1975) presented evidence supporting this hypothesis. Me followed the growth of EcoZi impedimetricaly. After 8 h the sample was carefully removed and the electrodes washed in sterile medium. Immediate measurements of the sterile medium gave an impedance value that closely approximated the final value attained by the Ecoli culture, and not the expected. value of the uninoculated medium. This demonstrated the presence of an altered electrode impedance. The measured impedance returns to its expected value after a few hours’ immersion, or immediately upon mechanical cleaning of the electrodes or on the application of an appropriate alternating current across them.
The frequency- and potential-dependent electrode impedance is a function of the electrode metal (Schwan, 1963, 1966; Smith, 1966; Geddes & Baker, 1968; Schwan, 1968; Sluyters-Rehbach & Sluyters, i970; Geddes, 1972; Ferris, 1974; Schanne & Ceretti, 1978; Bard & Faulkner, 1980; Bond, 1980; Gielen & Bergveld, 1982), platinum, gold and stainless steel all giving satisfactory resolution in microbial impedi- metry. Stainless steel is often preferred for its cheaper price and its relative biological inertness (Kagan et al., 1977; Hause et al., 1981); nevertheless, extremely thin and inexpensive platinum layers may be deposited on a variety of substrates. The impedance of the electrodes is also a very strong function of, the frequency of the applied voltage (Schwan, 1963,196s; Geddes, 1972; Ferris, 1974; Kagan et al., 1977; Bard & Faulkner, 1980; Bond., 1980; Hause et al., 1981).
Further evidence for a contribution of the electrode impedance to the measured impedance was presented by Hause et al. (1981). They reported that the use of a two-electrode ‘system is ‘likely to include concomitant effects both on the medium and the electrodes. To this end, they tested the relative roles of the medium and the eiectrodes at different fre- quencies (100 Hz, 1 kHz and 10 kHz). The impedance changes were

The estimation of microbial biomass 43
calculated as a percentage of the values recorded after electrode stabil- isation. They (Hause et al., 1981) found an increased, microorganism- dependent change in the impedance measurements at the lower frequencies, suggesting a significant role of the electrode impedance in the impedimetric system. This same effect was noted by Magan et al. (1977), and others. Furthermore, Hause et al. (1981) calculated the real and imaginary components of the measured impedance. Electrical impedance is a complex quantity, comprising a real component (resistance) and an imaginary component (reactance):
z= R-I-ix
where
resistance, R = G
G+- (WC)”
reactance, X = WC
z G + (WC)”
i=fi
w = 27rf
and G and C are the equivalent parallel conductance and capacitance, respectively (e.g. Schwan, 1963).
Hause et al. (1981) found that at low frequencies the impedance change closely follow6 the change in the imaginary component, whilst at higher frequencies the impedance change closely fohows the change in the real component. That is, the reactance’, and hence the capacitance, predominates at low frequencies. The capacitative term, as mentioned earlier, is overwhelmingly due to the electrode impedance, and not to changes in the permittivity of the medium (e-g. Cady, 1975).
There are at least three different manufacturers of impedance bridges, who market their impedimeters for the specific monitoring of microbial growth. These bridges were developed indepndent!y from the work of the following groups: Bactometer, produced by Bactomatic (see Anon, 1982, 1983a), from rhe. work of Cady (1975) in particular; Malthus Instruments Ltd based their system on the work of Richards et al. (1978) (see also Jason, 1983); and TEM developed Bactobridge as a result of ur &L Brown’s (1975) research, Each system offers slightly different

44 C. M. Nanis, D. B. Keli
operating conditions (see Table 2). In the latter (Bactobridge) system, measurements are made relative to a reference well containing sterile medium; this eliminates environmental effects, which are common to both wells, that do not arise fiorn the grolwth of the inoculum. These include, for example, fluctuations in the temperature, electrochemical reactions, adsorptiori sf gases and evaporation (Ur & Brown, 1975; Cady, 1978). Also with the aim of eliminating enviramnexkal influences, the impedance ratio previously given is measured in the case of the Bactometer, whilst the Malthus instrument uses the conductance mirzus the conductance at r = 0.
The shape of the growth cul~e, measured conductimetrically or impedimetrically , for a given microorganism, generally corresponds to the shape of the growth curve measured optically or by plate counts
(J ason, 1983; Eden & Eden, 1984). However, they are not super-
TABLE 2 Operating Conditions for Commercial Impedimetew
Signai measured
Detection
Electrode Input Temperature time for Se&ted material frequency Voltage control 10’ +/ml references
(kwz) w (“C) (h) .
Bactiomeier Impedance
I
stainless 04 0*04 O*l Z-6 Cady (1975) ; Conductance steel Capacitance or Au 29’0 -
Cady ez al.
0978)
Typically: z rcf
MalthusInstruments Ltd . ‘
Conductance Yt - 10 <l 0402 4 Ri chards et al. change (‘1978);
G-Go Jason (1983)
Bactobridge Conductake Au 10 l-5 04Ol 2 lir & Brown change c T1375) ;
G L Grer Ur (1974)

imposable, owing properties (Cady, certain impedance
The estimation ug’micrubial biumnss 45
to the effect of changes in the electrode surface 1978). The time which elapses before detection of a change is a function of the initial size of the inoculum,
generation time, lag time and the impedimetrically detectable threshold characteristics of the medium-organism-elect+ode combination. There- fore, if the threshold for the system and the generation and lag times of the microorganism are known, the initial cell concentration may be estimated (e.g. Hardy et al., 1977; Cady, 1978; Cady et al:, 1978; Anon, 1981b,c).
-
- + - Qi E .- -
- ve 0 fake -‘ve I
(ag viable count (cfu / ml)
Fig. 2. Diagram of a typical scattergram depicting the decrease in detection time with viable counts for instruments such as impedimeters whose output signal is growth- associated. The broken line indicates an ‘ideal’ response, whilst the solid diagonals indicate the limits between which, say, 9V% cf all saxmples Mb. The quadrants indicated give the false positive and negative regions using cut-off values of 2-6 h and 10” cfu/mL
A characteristic scattergram (Fig. 2) is produced when the initia! cell concentration, as measured for example by plate counts, is plotted against the impedimetric detection time. The large spread in the data comprising these scattergrams may be due to error associated with the. plate count, or it m&y arise from the impedimetric me&surements. Variation in the exact composition of the microorganisms, or types of microorganisms, within the sample, may TV_. r; p rise to different lag and generation times, tihilst the impedance method assumes the same growth and lag times for all microorganisms, present (Hardy .et al., 1977; Silverman & Munoz, 1979; Jason, 1983). F&thertnore, as a result of their microscopic examinations on milk flora, Gnan & Luedecke (1982)
46 C. M. Harris, D. B. Keil
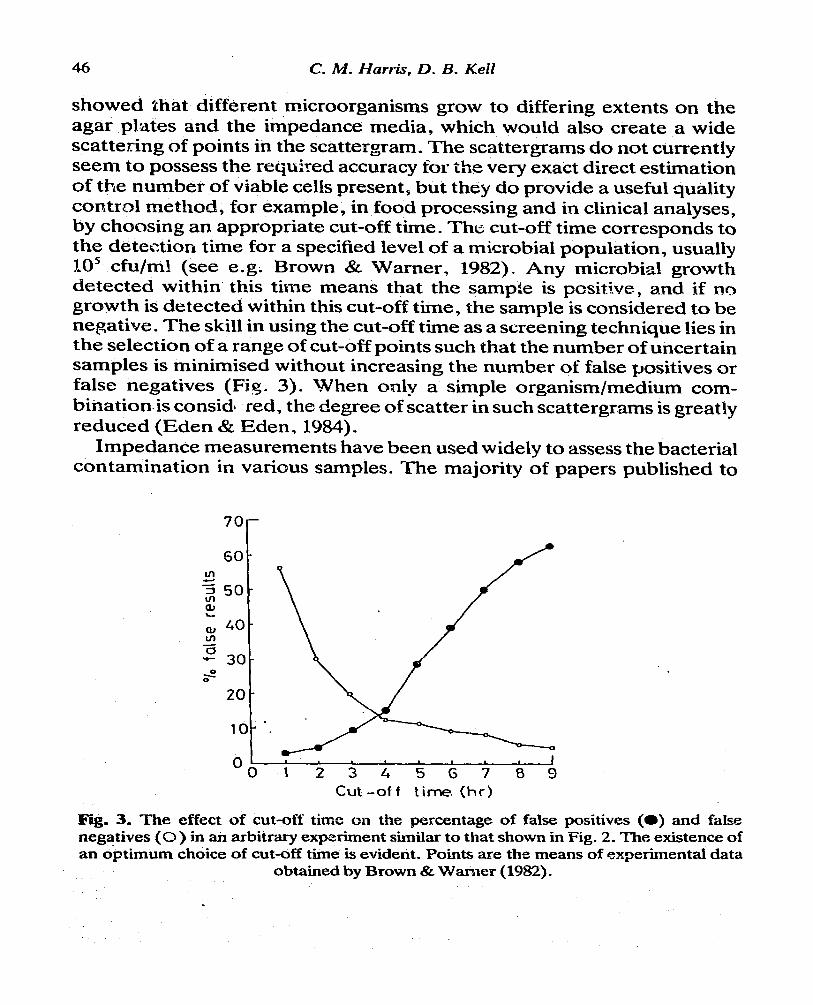
showed that different microorganisms grow to differing extents on the agar plates and the impedance media, which would also create a wide scattering of points in the scattergram. The scattergrams do not currently seem to possess the required accuracy for the very exact direct estimation of the number of viable cells present, but they do provide a useful quality control method, for example, in food processing and in clinical analyses, by choosing an appropriate cut-off time. The cut-off time corresponds to the detection time for a specified level of a microbial population, usually IO5 &u/ml (see e.g. Brown & Warner, 1982). Any microbial growth detected within this time means that the sample is pcsitlve, and if no growth is detected within this cut-off time, the sample is considered to be negative. The skill in using the cut-off time as a screening technique lies in the selection of a range of cut-off points such that the number of uncertain samples is minimised without increasing the number of false positives or false negatives (Fi%* 3). When only a simple organism/medium corn-. binationis considl red, the degree of scatter in such scattergrams is greatly reduced (Eden & Eden, 1984).
Impedance measurements have been used widely to assess the bacterial contamination in various samples. The majority of papers published to
Oo I I
1 2 3 4 5 G 7 8 9 Cut-off time. (hrj
Fig. 3. The effect of cut-off time on the percentage of false positives (0) and fake negatives (0 ) in an arbitrary experiment similar to that shown in Fig. 2. The existence of an @timtim choice of cut-off time is evident. Points are the means of experimental data
obtained by Brown & Waker (1982).

The estimation of microbial biomass 47
date on the use of impedimetric techniques seem c’o have involved the application of one of the Bactomatic systems. Some examples are now considered.
Martins et al. ‘(1982) evaluated the use of the Bactometer 32 against starid.ard plate counts, psychrotrophic plate counts and coliform counts, for dr,$_tii.mining th *e ktieping quality of.tiilk. They found that pasteurised milk samples with a detection time of 13-5 h or more had a shelf life of 12 days or longer, and a sample with a detection time of under 13.5 h spoiled within 11 days. The cut-off time of 13-S h was a great improvement on the 48 h previously required for quality checks, undertaken by plating methodr,. Gnan & Luedecke (1982), also using the Bactometer 32 to determine the microbial population of untreated milk, found the mean detection time for lo5 &u/ml could be reduced to 8-9 h by enhancing the growth rate of the microorganisms by the addition of yeast extract,
The Bactometer 32 was also used by Silverman & Munoz (1979), to detect the concentration of coliforms in the effluent from sewage plants. They measured the impedance changes in an inoculated sample relative to those in an uninoculated control. They rioted a large variation in the detection times, caused by the different growth phases of the inoculum and .the dependence of the lag time on environmental conditions at the plant, such as temperature and rainfall. However, an extension of this work overcame the problem of this large variation. Munoz & Silverman (‘1979) incubated the inoculated media for 24 h, recording any increase in the impedance ratiiti. A recorded increase in the impedance ratio greater than or equal to O&l039 in I h, and continuing for at least l-5 h, was considered a positive indication of growth, if it occurred inside the 24-h incubation period. All the positive samples tested gave indication of growth within 18 h, thus satisfactorily reducing the detection time as compared with conventional methods. However, they reported (Munoz & Silverman, 1979) that the detectable impedance change given above was associated with betitieen lo6 and 10’ coliforms/ml, which is the level that produces visible turbidity. So, providing there are no particles present in the medium, a simple visual check might determine whether the sample was positive or not.
Hardy et QI. (1977) achieved a 96% agreement between standard plate counts and the Bactometer in quantifying the microbial contamination of 367 frozen-vegetable samples. They reported that the impedance measurements themselves did not appear to interfere with microbial growth, and ftilund that the threshold concentration of 106-10’ &u/ml
.

48 c. M. wl;lr+, D. a. Ixel.?
necessary for detection was attained in 5 h for a sample initial1.y containing lCPcfar/ml.
A large proportion of the clinical microbiologist’s work is concerned with the detection of microorganisms in urine samples. Conventional methods require up to 48 h before the results are available, and also occupy a great deal of time in counting procedures. Impedance methods aim, as do the other novel methods reviewed herein, to decrease the test time and to free personnel for other laboratory tasks. Urine samples have been monitored for microbial contamination using the Eactomatic system, with a reduction in test time, for the 10’ coiiform cells/ml which are considered to produce bacteriuria (Kass, 1957), to approximately 3 h (e.g. Specter et al., 1976; Zafari & Martin, 1977; Cady et QI., 1978; Anon, 1981b). On assaying ZOO urine samples with the Bactometer 32, Specter ea al. (1976) found that the impedance method provided a rapid screen for clinical urine specimens whilst permitting reIatively accurate detection of bacterial growth. They reported 4% false positives and 2% false negatives in an average detection time of 2-5 h. Zafari & Martin (1977) also used the Bactometer to examine urine specimens. Of the 156 samples tested, they found a 96.8% correlation with standard plate counts in the classizcation of positive (those containing greater than 10’ &u/ml) and negative samples. However, they pointed out (Zafari & Martin, 1977) that bacteria with slow generation times may fail to give an impedimetrically detectable response before the cut-off time, and thereby increase the number of false negatives. Cady et aC. (1978) monitored the impedance changes of 1133 urine samples. Using a cut-off t’ime of 2.6 h to be an indicator of the presence of greater than 1.0’ &u/ml, they found 95*8% of the samples tested were correctly classified in accordance with the standard plate counts. They noted that the correct choice of cut-off time was important. A cut-off time longer than the 2*6 h chosen does not necessarily improve the correlation between impedimetry and conven- tional procedures, since, whilst it may produce a decrease in the number of false negatives, it also gives an i’ncrease in the number of false positives.
Clinical analyses also involve determining microbial populations in blood specimens, another area which has lent itself to impcdimetric studies, For example, Hiadley (1976) examined 1271 blood samples using the Bactometer 32. He f.ound thtit shaking the cultures and providing the optimal medium markedly improved the detection time of those micro- organisms which were otherwise detected very slowly or not at all. Hadley (1976) considered the blood samples to be positive when the microbial

The esrimulion of microbial biomass 49
population was greater than lo6 cells/ml, which corresponded to a detec- tion time of between 6 and 8 h. Of the total number of samples tested (127 I), 161 showed microbial growth by conventional methods, whilst a further 9 were detected as being positive’by the impedance method alone. Sixteen of the samples that wei-e considered positive by the conventional methods were classed as negative by the Bactometer. Half of these false negatives were thought to be caused by colonial growth of the micro- organisms away from the electrodes, and consequently the number of false negativc.?s was reduced (to 8) by shaking the culture to obtain a homogeneous suspension.
Kahn ef nC. (1976) also explored the use of the ‘Bactometer 32 to study blood samples, together with cerebrospinal fluid. of children. Zn testing 500 blood samples they found that positive samples-could be detected with an average detection time of S-5 h. Some 15% of the samples were considered positive by both impedance and conventional methods, and 1405% were positive by the impedance method only. On investigating cerebrospina: fiuid, Kahn and co-workers found a common cause of bacteria1 meningitis to be the presence of Haemophihs influenzae at concentrations above IO4 cells/ml_ Using the Bactometer 32 they were able to detect IO4 cells/ml and 1.0’ cells/ml in 5-8 and 2.4 h, respectively, thus greatly reducing the test time normally required by conventional methods (see above).
Throm et at. (1976) used the presence of bacterial activity in blood as a means of comparing radiometric methods, using the Bactec system, with the impedance technique embodied in the Ractometer 32. At that time the radiometric system was .well established; conversely automated impedance systems were new to the market. Throm et aC. (1976) appreciated the potential of the Bactometer 32, in that it offered ~more rapid detection times (up to 10 times faster than the standard plating methods, compared with Bactec \+hich was only three times faster). Other advantages were said to be:
(0 (ii)
(iii)
greater consistency between the detection times; lower cost per sample; easy adaptation to the monitoring of samples other tflan blood; and
(iv) that impedimetry is non-hazardous both to sample and operator.
However, in 1976 the Bactometer instrumentation did not offer standard- ised electrodes, and was capable of monitoring only 32 samples simul-
.

50 C. M. Harti, D. B. KeN
taneously- Hence, Throm et al. (1976) selected the radiometric method for use in their routine laboratory work. Bactomatic have now improved the performance of their system, in that their lafi=st model is capable of monitoring the microbial growth in over 500 sample wells simultane0zsly, and the gold and stainless steel electrode arrangements used have now been standardised, The Malthus ~nstNm~n~s use platinum electrodes, which fr’om a heuristic standpoint are probably more satisfactory, owing to their lower impedance. According to Richards et al. (‘11978), the use, as in the Malthus instrument+ of conductance rather than impedance, is also conceptuaiiy to be preferred.
In summary, the impedance methods offer advantages in their ease of use, reduced test time, ability to function in opaque media, and their ability to handle large numbers of samples while retaining a high level of agreement with conventional countrrrg techniques. More specialised
.
applications of this methodology have included the selective detection of bacteria by i’-- IIL use of selective media (Martins & Selby ‘I 1980). Currently, however, the prime objective. by way of the cut-off times, is that it be used as a quality control procedure, and not for providing very accurate estimations of the, total number of viable cells in a sample. Large errors may arise in the accuracy and consistency of measured values of the detection time for a given number of colony-forming units per unit volume, owing to different lag- and generation-times of the micro- organisms present in the sample. These large errors, cur&led with the detection time {which, although a great improvement in conventional quality control procedures, is by no means in real time), make impedi- metric methods of *he type discussed above unsatisfactory for monitoring biomass in fermenters.
Wheeler and Go~~s~~idt ~~o~ds~hrnidt & Wheeler, 1975; Wheeler & Goldschmidt, 1975) investigated the potential of an approach’ in some respects similar to that of the impedance method, for the rapid xreening of urine cultures from patients suspected of suffering bacteriuria. The purpose of this apjproaeh was to eliminate the ti.tie involved in plate counts or the accumulation of a measurable tiount cbf metabolite. Using relatively simple inst~.mentation, meeler & G~ldsc~idt (1975) applied a 10 V (sic) peak-to-peak square-wave signal across mierobiat suspensions, via the outer pair of a tetra-polar stainless steel electrode probe, and measured the change in electrical outPtit as a function of the frequency and the input voltage. They found the maximum signal for the different types and numbers of bacteria studied to occur at an input

The estimation of microbial biomass 51
frequency of 10 Hz. Further, they found a linear relationship between voltage change recorded on an oscilloscope at this ‘frequency of maximum resolution’ and the logarithm of the microbial ceil concen- tration. This method allows, in principle, the total electrical properties of the system to be measured jtistantaneously, without the need for the accumulation of metabolites. Hence, the advantage of this adaptation of the impedance method is the claimed 10-min,detection time, compared with the hoyrrs necessary for the impedance detection time. Wheeler and Goldschmidt tested 30 fresh urine samples against a calibration curve of output voltage for different concentrations of E.coCi. They reported a 90% correlation with plate counts for samples containirig greater than 10’ cells/ml, and detected several samples containing 103 and IO4 ceUs/ml which were considered to be negative ‘by the donventional methods.
However, it has been shr.>wn that the capacitative and resistive properties of microorganisms and similar charged objects at low frequencies are a function not only of the applied field, but also of the particle radius and cell wall (i.e. surface) properties (see, e.g. Schwan, 1957; Schwarz, 1962; Einolf & Carstensen, 1973; Dukhin & Shilov, 1974; P ~aiStensen et Marquis, 1975 ; Schanne & Ceietti, 1978; Pethig, 1979; Harris & Kell, 1983; Schwan, 1983; Harris et al., E&4; K&l, 1983). Wheeler & Goldschmidt (1975) tested their system for microorganisms of Mferent size and shape, and found no effect cn the output signal, thus demonstrating th:at their measurements of the passive electric& pro_~r- ties of th.e ‘microbial suspension are in fact dominated b;y the high impedance of the electrode/electrolyte interface at this frequency. Also, the electrical properties of microorganisms in the audio frequemcy range are mainly thought to be a result of the counterion relaxation tangential to their charged surfaces, and as such are, in principle (Harris tzt al., 1984; Kell, l-984), a strong function of the ions present in the suspending phase as well as of the biomass. They also scale with the microbial Wncentration and not its logarithm. Therefore, although the resolution obtained with this technique was apparently high, the signal was not wholly (or even mainly) due to the microbial population, Despite the reasonable results presented by Wheeler and Goldschmidt, further investigations tiould seem to’us to be necessary before either the value or the operating principle of this method may be accurately assessed. Finally, the.fact that the ceils had to be dispersed in distilled water (W$eeler & Goldschmidt, 1975) seriously diminishes the utility of their method for measurements in fermenters.
. .

52 C. A@. Harti, D. B. Kell
The optical assessment of cell size and numbers, and hence the estimation of biomass, has been superseded in many cases by the advent of electronic counting and sizing devices, such as the Coulter Counter and Channelyser. Electronic counting techniques monitor the effect of microorganisms on an electric field as the microorganisms traverse the field. The micro- organisms are suspended in an electrically conducting fluid, normally the growth medium, and are forced to flow through a small aperture across which an electric field is applied via a constant current source (Fig. 4). As the relatively non-conducting microorganism passes through the field, the electrical resistance within the aperture is increased, giving rise to a transiently increased voltage drop across the aperture. ‘%t was assumed that under certain conditions the magnitude of this pulse is proportional to the size of the microorganism (e.g. Grover et at., 1969b, 1982; Dow, 1976), such that particles giving pulses of a given magnitude may be differentiated and counted. However, the principle does not permit significant discernment of particle shape, and coccoid or rod-shaped bacteria are counted as spheres of equivalent size (e.g. Mubitschek, 1969; Hobson & Mann, 1970; Curds et UP., 1978; Anon, undated, d, bui cf. Bator et&., 1984). ’
Coulter Electronics Inc. indicated that their original electronic device could count and size particles in the range of 0*4 to 500 pm diameter, from the pulse heights produced. Empirical evidence presented by Kubitschek
particle
flow
. .
eig.4. The principle of the Coulter Counts . See text for farther explanation.

The estimation of microbial biomaw 53
(1969) supported this claim by demonstrating a fair degree of propor- tionality between measurements of optical density and the electronically measured cell volume for bacterial cells of differing*mean cell volumes.
Potentially successful applications of the Coulter Counter require that the following-conditions be met: .
(9
(ii)
(iii)
(iv>
(4
{vi)
The pulse height should be much greater than the background signal. Noise may be generated by other electrical equipment in the vicinity of the counter, e.g. fluorescent lights, and so the instrument must be suitably shielded to increase the reliability of the results (Hobson & Mann, 1970). Modern versions incor- porate a Faraday cage. Unusually large pulses must be minimised since they momen- tarily perturb the pulse-height analyser and prevent immediate, subsequent counting. Large signals may be produced by con- taminating par&es, or by two or more cells traversing the field simultaneously. An upper limit to the s.ize of the pulse counted and analysed may be enforced, but there may still be momentajl disturbance of the system (Kubitschek, 1969; Curds Ed al., 1978). The concentration of the suspension must be optimised; large concentrations increase the occurrence of coincident counts and 10~ concentrations decrease the signal to noise ratio (e.g. Kubitschek, 1969; Hobson & Mann, 1970; Zimrnermann et UC,, 1973). Samples of low concentration, or those containing a high propor- ti.on of large non-microbial particles, should be filtered to remove any material that may otherwise be counted (Kubitschek, 1969; Hobson & Mann, 1970). Aperture length, fiow rate and amplifier response must be matched to produce output voltages of suitable magnitude (Kubitschek, 1969). For sizing, the suspension should be hydrodynamically focussed to counteract the non-uniformity of the current density at different locations in the orifice, such that the path of the micro- organisms through the field is uniform (Jeltsch $r Zimmermann, 1979; Zimmermann, 1982), since the magnitude of the output voltage is also a function of rotation and deflection of the individual microbe as it traverses the field (Grover et al., 1969a; Zimmermann et al., 1973; Roberts, 1980).

54 C. M. Harris, D. B. Keil
(vii) Very important, and yet often overlooked, since it has only been noted rather recently, is that the magnitude of the applied field must be below a certain critical value, above which the measured size of the cells decreases with increasing field strength (Zimmermann et ai., 1973; Jeltsch & Zimmermann, 1379). Tnis critical value, causing dielectric breakdown, is of the order of 1 to 10 kV/cm fqr most microbial systems (Hamilton & Sale, 1367; Grover et al., 1372; Zimmermann et al., 1973; Zimmermann et al. ) 1980; Wulsheger & Niemann, 1981). This point will be discussed in some detail.
This non-proportionality between peak height and field strength may be due to one or a combination of two factors in particular: either a change in the electrical properties of the suspending medium caused by electrolysis at the higher voltages, or the dielectric breakdown of the, microbial membranes at the higher field strengths. In theory, non- conduciing partic1e.s should produce a square-wave voltage pulse that is proportional to the size of the particle when this particle crosses a d.c. (or low frequency) electric field. However, this assumes that the conductivity of the particle is ctinstant under different experimental conditions, For solid particles, e.g. pollen and latex spheres, this is indeed the case, but the electrical properties sf microorg anisms change with the magnitude of the applied field. If the electric field is small or absent, microorganisms consist of a relatively non-conducting membrane enclosing a relatively highly conducting cytoplasm. An electric field applied across a microbial cell induces a potential gradient across the cell membrane. This potential gradient causes, inter ah, an electrical alignment of the dipolar molecules comprising the membrane, to a degree dependent upon the field strength and the size of the microorganism. Such an alignment of the membrane dipoles (electrostatic versus elastic restoring force-ee e.g. Zimmermann et ai., 1373, 1980, 1381) can result in the dielectric breakdown of the membrane as seen by a decrease in the capacitance and an increase in the conductance of the suspension of microorganisms. The extent to which dielectric breakdown occurs is a function of the applied field strength per unit length (e,g. Hamilton SC Sale, 1967; Zimmerrnann et erl., 1373,198O; HuIsheger & Niemann, 1980,138? ).
Microorganisms being counted and sized in the Coulter Counter are often subjected to an electric field which ;s capable of producing dielectric

The esthation of micro&al biomass 55
breakdown. Under such conditions, the Co-d!ter Counter will rewrd a smaller change in conductance than if the breakdown had not occurred. Hence, <sn the assumption that pulse height is proportional to cell size, a smaller cell size than is actually the case is estimated. Providing that dielectric breakdown is not.complete, and the conductance of the micro- organism at this field strenkth is not equal to that of the suspending medium, a change in conductance will still be recorded., and although this change may not give correct sizing, it may be used for munting purposes. Grover eb al. (1972) noted this effect, for human red blood cells, about a critical field strength of O-8 kV/cm, but gave no explanation. Other workers (e.g. Morrison & Tomkins, 1973; Ricketts 8r Rappitt, 1974; Curds et al., 1978; Roberts, 1980) have observed a lower cell size measured with the Coulter Counter than with other techniques.
Morrison & Tomkins (1973) used the Cdulter Counter to measure the mean cell size df Tetrahymena under conditions of growth and starvation. They compared the values of cell size obtained from the electronic sizing with those obtained by tracing, cutting out and weighing the silhouettes of a series of cells from photomicrographs of the suspension. This com- parison revealed that the Coulter Counter underestimated the cell volume by 8 factor of 499 for normally growing cells, and this under- estimation increased during starvation of the protozoa. Morrison & Tomkins (1973) explained this discrepancy in terms of the error involved in the optical method because of the shap of the protczca, whereas the error was more likely to be in the Coulter Counter method owing to the dielectric breakdown of the Tetrahymena membranes. The increased underestimation of the cell volume of the starved protozoa may bc ascribed to the conditions of starvation giving rise to an electrically weaker membrane. A weaker membrane would undergo dielectric breakdown at a lower field strength, or the breakdown would be further advanced at the given field strength.
Ricketts & Rappitt (1974) compared values of the cell size of T’trahymena obtained using the Coulter Counter with cell dimensions measured optically. They, too, found that the Coulter Counter under- estimated the cell size, the electronically determined size being f-2 to 26 times lower than that determined from optical measurements. Again the full error was assigned to the optical method and the asymmetry of the protozoa, and no part of it to the Coulter Counter.
Curds et al. (1978) used the Coulter Counter to size ciliated protozoa, in conjunction with optical sizing methods. They found that the mean cell

56 C. M. Harris, $3. B. Keli
volume of an axenic population of Tetrahymenai measured over a wide range of sizes, was on average 3-3 times greater by optical methods than by the electronic device. No reason was proposed for this discrepancy. However, for a series of six separate electronic sizings they found the values of the mean cell volume to be reproducible to within I%, and further fc:s::nd that although the absolute values of the cell volumes measured 5y the iwo different methods did not agree, the ratio between them was consistent, and also that the electronically determined mean cell volume was linear with cell dry weight.
Roberts (1980) similarly reported an underestimated cell size (in com- parison with microscopic sizing techniques) when sizing Tetrahymena with the Coulter Counter and Channelyser, In an attempt to overcome this problem he calibrated the electronic device with pollen grains of a known size, osmotically stabilised the cells in mannitoi, and hydro- dynamically focussed the flow of cells through the field; nevertheless, he consistently found a four-fold underestimation in cell size (Roberts, 1980). Roberts concluded that the cell size was net proportional to the peak height under these conditions, and proposed that the under- estimated cell Size was due to an increase in the conductivity of the protozoa in the electric field. However, he offered no explanation as to why an iiicrease in conductivity should occur.
Zimmerrnann et al. (1973), Jeltsch & Zimmermann (1979) and Zimmermann et al. (1980) noted that the voltage applied across the orifice of the Coulter Counter was of th P, same order of magnitude as that which is required for the dielectric breakdown of microbial membranes. If inembrane breakdown should occur, the high conductance of the cyto- plasm contribu.es to the total conductance of the system, giving a smaller change in conductance with respect to the sus-ending medium, and hence an underestimation of the cell volume. Zimmermann et al. (1973) found that dielectric breakdown did not occur in solid particles, sucfi as latex spheres and pollen, nor in E.coZi when the membranes had been fixed with glutaralldehyde.
The implication ‘of the phenomenon of dielectric breakdown of microbial membranes in electronic counting and sizing systems has not been widely appreciated, and it may be assumed that results obtained from such systems have often .been misinterpreted. However, the tech- nique may still be used for counting cell5, and indeed for sizing if the a.pplied field is below the critical level, and h&s had many successful applications (e.g. Zinxmermunn et al., 1973; Dow, 1976; Do&et al., 1979;

The estimution of microbial biomass 57
Zimmermann et al,, 1980). Dow (i976) used the Coulter Counter linked to a Channelyszr to study population dynamics and morphology in microbial cultures. Further work of Dow et al. (19’q9) utilised this same system for particle distribution analysis of the microbial popLhations of 600 urine samples, The microorganisms present in the samples were sized, and those with a diamiter greater than 0.4 pm were counted. The result was purely qualitative, in thtit urine was classed as being either positive or negative, but an agreement of 98.8% was obtained between classification based on this technique and that based on microscopy and culture methods.
A major disadvantage of the electrical counting technique [it should not be affected by the magnitude of the applied field so long as a change in conductance is recorded) is its inability to distinguish viable cells from non-viable cehs and non-microbial particle& Several attempts have been made to overcome this problem (e.g. Seydel & Wempe, 198Q; Matsushita tq al., 1982). Seydel & Wempe (1980) devised a method using the Coulter Counter to differentiate viable and totzl cell counts in E.cdi cultures inhibited by chemotherapeutic agents and compared these results with the usual viable counts obtained through plating procedures. The principle w as to administer the drugs in such concentrations that they would inhibit the growth of some cells whilst killing others, producing a suspension of viable non-multiplying cells and killed cells, with a fairly constant cell count. The inoculated culture may then be diluted with fresh broth such that the concentration of the inhibitor is negligible, allowing the viable but inhibited cells to regrow. Coulter Counter measurements were taken at hourly intervals between three and six hours after dilution, thus minimising the error due to the killed cells and allowing the re- growing cells to reach a con=ntration suitable for counting. From a simple kinetic approach the logarithm of the cell co-unt was seen to be linear with the incubation time, and extrapolation to the time of dilution gave the number of viable cells after the addition of the drugs. This principle was applied to cultures of E,coli treated with three different drugs: HN-32 (a nitrofuran derivative), TMP (trimethoprim) and tetra- cycline. The death rates obtained wi.th the Couiter Counter were identical with those obtained from plating techniques for both MN-32 and TMP, but the Coulter Counter underestimated the death rate, that is, over- estimated the cell population, for tetracycline. Seydel & -Wempe (1980) suggested that the measured low death rate was probably due to the mode of action of tetracycline, and not to an error in the tedhnique, since it is

5& C. M. Harris, D. B. Kelg
k n o w n tha t cells r ecover ing f rom the act ion of t e t racyc l ine g row m o r e s lowly o n a g a r t h a n they do in l iquid cul tures . S u c h a m e t h o d has obv ious a d v a n t a g e s o v e r p la te coun t s in the saving of t ime; this C o u l t e r C o u n t e r m e t h o d •would r equ i r e a 6 h incuba t ion per iod c o m p a r e d wi th the 24 h n e e d e d for p la te coun t s , b u t fu r the r e x p e r i m e n t s are necessary .
M a t s u s h i t a e t a l . (1982) a t t e m p t e d to d is t inguish viable a n d non-v iab le m o u s e m y e l o m a cells, us ing a C o u l t e r C o u n t e r l inked to a C h a n n e l y s e r , by s u s p e n d i n g the cells in p h o s p h a t e - b u f f e r e d sal ine (PI3S) so lu t ion . T h e r e s u l t i n g e lec t r ica l size d i s t r ibu t ion profile was b i m o d a l a n d s h o w e d an i nc rea se in t he f rac t ion of Smaller cel ls in the p r e s e n c e of PBS. T r y p a n b lue s ta in ing , a n d microscopic e x a m i n a t i o n of the P B S - t r e a t e d cu l t u r e , s h o w e d t h a t PBS was le tha l and tha t the kil led cells w e r e i ndeed smal le r t h a n t he v iable p o p u l a t i o n , hence provid ing a m e a n s to d i f fe ren t ia te live a n d d e a d cells by e lec t r ica l sizing a n d coun t ing . H o w e v e r , t he m e m b r a n e s of t h e ki l led cells exh ib i t ed an inc reased pe rmeab i l i t y to ions , and the cells w o u l d t h e r e f o r e in• any even t g e n e r a t e pulses t~f d e c r e a s e d size.
E lec t r i ca l c o u n t i n g t echn iques by themse lves are n o t capab le of p ro- v id ing v iable coun t s . T h e a t t e m p t s to ex t end the t e c h n i q u e have n o t b e e n who l ly sa t i s fac tory in the specific sys tems wh ich they w e r e de s i gned to s tudy , a n d cou ld cer ta in ly no t be appl ied universa l ly to the e s t ima t ion of v iab le c o u n t s in f e rmen to r s . Elec t r ica l sizing t e c h n i q u e s a p p e a r to possess t he p o t e n t i a l for p rov id ing an insight in to cell p o p u l a t i o n dynamics , b u t h a v e b e e n s h o w n to suffer f rom ce r ta in ar t i facts , in pa r t i cu l a r t hose c a u s e d by the d ie lec t r ic b r e a k d o w n of mic rob ia l m e m b r a n e s , u n d e r t he c o n d i t i o n s of field s t r e ng th c o m m o n l y used (e,g. see Z i m m e r m a n n et a l . , 1973; J e l t s ch & Z i m m e r m a n n , 1979; Z i m m e r m a n n et a l . , 1981). E l e c t r o n i c c o u n t s do have the a d v a n t a g e t h a t they m o n i t o r passive e lec t r i ca l p r o p e r t i e s of the mi c roo rgan i sm and d o no t rely o n g r o w t h , a n d so t he c o u n t s a re avai lable in m i n u t e s r a t h e r t h a n hour s , a l t hough they are n o t qu i t e in rea l tinae. T i m e - d e p e n d e n t changes in the m e d i u m c o n ' duc t iv i ty w o u l d also t e n d to c o n f o u n d the i r appl icabi l i ty to on- l ine m e a s u r e m e n t s in f e r m e n t o r s .
.
4 .7 . EiectrochemicRuy based detection systems
M a n y e l e c t r o c h e m i c a l de t ec t i on sys tems have b e e n p r o p o s e d f o r the e s t i m a t i o n of microb ia l popula t ions . T h e i r a im, as wi th o t h e r physical t e c h n i q u e s d i scussed above , is to r e d u c e the t ime necessa ry for "the d e t e c t i o n of m ic roo rgan i sms , wi th the v iew u l t ima te ly to p rov ide a qu ick , e f fec t ive , a n d s i m p l e ' t o - u s e b iomass p robe .

The estimution of microbial biomass 59
Wilkins (Wilkins, 1974, 1979; Wilkirts et al., 1974, 1978, 1980) developed an electrical detection system for the evaluation of microbial populations, based on the detection of gases produced ‘by actively metabolising microorganisms. Initially the detection of these gases was effected by means of a pres$ure transducer linked to a chart recorder (Wilkins, 1974). The delay‘ period, for given experimental conditions, between the inoculation of the sample and the detection of the response was found to be linear with the logarithm of the inoculum size. As expected, the detection time increased for decreasing inoculum size; for example, the detection time for lo7 ce’lls/ml was 3 h, and for 1 cell/ml was 12 h. Despite the sensitivity of the pressure transducer, Wilkins (Wilkins et al., 1974) abandoned this method in favour of a yet more sensitive electrochemical method.
Wilkins (Wilkins et al., 1974) reported the use of an electrochemical method, consisting of a platinum electrode and a reference (standard calomel) electrode, which monitored the production of hydrogen by the metabolising microorganisms. The principle behind this detector is that the evolution of hydrogen decreases’the apparent Eh (redox potential) (see Morris, 1974) owing to the redox equilibrium established between (principally) the H&E’ couple and the platinum electrode:
Ma= 214+ + 2e- .
Subsequently, Wilkins et al. (1978) reported that responses to this electrode system w,ere also obtained with non-hydrogen-producing micro- organisms. It thus seems more likely that this electrode configuration was monitoring changes in redox potentials resulting from the microbial production of electroactive substances including, but not solely consisting of, molecular hydrogen (see Kjaergaard, 1977). Using the platinum and calomel electrode arrangement, Wilkins et ad. (1974) recorded response curves containing the characteristic lag period before ‘detection’ was possible. The lag period was found to be linear with the logarithm of the initial inocuium size as determined by viable counts. Typical detection times for E.coZi using this method were 1 h for lo6 cells/ml, and 7 h for 1 cell/ml, which is indeed quicker than for the pressure transducer. In view of this improved sensitivity, Wilkins et al. (1978) developed a multi- channel electrochemical detection unit capable of detecting and indi- cating the detection times for each of the+eight channels simultaneously and automatically. .
Wilkins (Wilkins et d., 1978) further found that the response curves ob?sitied with ts~o platinum electrodes of differing surface area were

40 C. M. Nan& D. B. Kell
similar to those obtained with the platinum/calomel electrode system. Here the experimental arrangement consisted of a test tube containing two platinum electrodes of differing length immersed into the sample medium. The response curve arising from the potential difference between the two electrodes again exhibited a lag period which was found to be linear with the logarithm of the size of the inoculum. The platinum- platinum electrode system was (not surprisingly) less sensitive than the combination electrode system, but was attractive by virtue of its lower cost and ease of handling. Ft also lent itself to adaptation for a combined membrane filtration -electrochemical method for microbial en-umeration (Wilkins et al., 1980). The objective of this adaptation was to decrease the detection time by increasing the initial concentration of the sample through filtration, thereby enabling the monitoring of microorganisms in sparsely populated environments. In practice, cells were collected on a 0.45 pm filter, on to which two platinum electrodes were clamped, and the potential difference between them was then measured. Wilkins et al. (1980) used this system to test nearly 100 aquatic samples. They found a certain degree of linearity, with a correlation coefficient of OG325, between the logarithm of the inoculum size and the detection time. However, filtration techniques are known to induce the death of a pro- portion of cells, and should be avoided for consistent results (Jones, 1979). The modus operandi of this system (Wilkins et al., 1980) is not at all evident; it may involve fuel cell-like reactions.
Holland et al. (1980) used a similar system to that of Wilki& (1979)) but with two stainless steel (rather than platinum) electrodes of differing size. They inoculated IOO-ml samples with 300 or 50 cfu of one of several microbial species commonly found in the blood of patients suffering from bauteraemia, and recorded changes in the apparent potential difference at 15-min intervals. The sample was considered to be positive if the voltage change was greater than or equal to 0-i mV/min and incrkased for the following 45 min. Qf the 163 test samples seeded with the larger inoculum, 90.8% were considered to be positive; 88.7% of the 53 samples seeded with 50 cfu were deemed positive using the electrochemical tech- nique. This principle was then applied to the detection of microbial grtiwth in blood specimens from 156 patients (Holland et al., 198Oj. This electrical detection system correctly identified the 13 positive samples that had also beet 1 identified by conventional turbidimetric methods, w.ith an average detection time 18 h less than for the ctinventional method.
Junter and co-workers (Junter et al., 1980, 1984; Junter & Selegny,

1982a,b) followed bacterial growth using electrochemical measurements of the decrease in redox potential associated with (i) the oxygen consump- tion during aerobic glycolysis and (ii) the subsequent reduction of exogenous lipoic acid, and f?om this estimated the number of viable cells present in an axenic populatiop of EC&. During the oxidation-reduction reactions of glucose catabolism, lipoic acid (LA) enters the bacterial cells where it is reduced to dihydrolipoic acid (LA&). The reduced form may then be transported from the cells (e.g. Junter & Selegny, 1982~). The output VoltngE, measured using a gold electrode with respect to a standard calomel electrode, therefore folloys the modification of redox potential due to the reduction of dissolved oxygen, and of the lipoate/ dihydrolipoate couple, resulting from bacterial activity. The gold eiectrodes were found to be highly sensitive to the dihydrolipoate produced, down to concentrations of the order *of 1 pM, owing to adsorption of the dihydrolipoic acid onto the gold (Junter & Selegny, 1982a).
In order to maximise the consistency in the measured redox potentials of samples containing inocula of the same size, the number of possible metabolic pathways was restricted by growing the bacteria in a relatively defined medium containing only salts and glucose (but sometimes a small amount of yeast extract)_ The time preceding the characteristic drop in potential of the output voltage was found to represent the number of viable cells initially present in the inoculum, enabling a$ few as 10 cellsi litre to be detected in 11 h. The experimentally observed linear relation- ship between the logarithm of the initial inoculum size and the time for’s 100 mV variation in potential to occur was supported by a mathematical model (Junter et ai., 1980). The kinetic expression obtained was related to the rate and me&an&m of lipoic acid uptake, the excretion znd reoxidation of the dillydrolipoic acid and the concentration and generation time of the microorganisms. Junter & Selegny (1982a) proposed a more complex mathematical model by describing the system tit three distinct levels, and simulating potential-time curves from the resulting series of equations. The three levels considered were:
(i) the electrqde: this expressed the potential of the gold electrode as a function of the concentration of the electroactive species present;
(ii) the cell or metabolic level: inv.olving the time evob~tion of the concentrations of the relevant electroactive species;

(iii) the culture broth: involving the physical and chemical conditions of the culture, such as the dissolution of molecular oxygen from the air into the broth.
The relationships of the cell population determined by colony counts with the theoretical minimum detection time, and with the detection time found experimentally, were of the same form for inocula sizes in the range IO--10” celIs/litre. ‘Thus the theory agreed with the experimental observations.
Using this electrochemical technique, 10’ Ecoli cells/ml, grown in a medium enriched with yeast extract, may be detected in und#er 7 h (Junter et al,, 1980), and compliance with the International Standards for drinking water, which require that disinfected drinking water contains only I bacterium/l00 ml, may be gauged within 12 h (Junter et al., 1980). Although this method offers features which are desirable for a probe to monitor biomass in fermentors, such as the comparative simplicity of an electrochemical approach, and the sensitivity obtainable, it does’, however, have its disadvantages. First, detection relies on microbial growth, and therefore cannot be in real time; secondly. the addition of lipoic acid might conceivably have an adverse effect on the fermentation process under study; and thirdly, the detection time for 10’ cells/ml is longer than by other growth methods (e.g. impedimetry, radiometry, etc., see above). Nevertheless, the elegant simplicity of this system seems to indicate that it would provide a convenient assay for microbial activity in clinical, ecological and food samples.
The detection systems of Wilkins et al.. (Wilkins et al., 1974,1978,19SO; Wilkins, 1979), Holland et al. (1980), Junter et al. (1980) and of Junter & Selegny (1982a,b) rely on the ch$nges in potential caused by the growth of the microorganisms and the production of electroactive metaboCites_ As such, these methods have the potential to detect very low ceI~.numbers, but the detection time may still be relatively long, in the order of 10 to i2 b for Iess than IO &u/ml, and 3 h for 10’ cfu/mi. Karube, Suzuki and coworkers (Matsunaga et al., 1979,198O; Ishimori eb al., 1951; Nishikawa ef al., 1982), and Turner et al. (Turner etal., 1983; Aston & Turner, 1984) have developed a fuel cell-type electrode system (see also Wingard et al., 1982), in which the detection time, some 15 to 20 min, is independent of microbial growth. This IS-rniir response time, although not in real time, could in principle enable the continuous monitoring of biomass in fermentor5.

The estimatiun of microbial biomass 63
Both pairs of reference and measuring electrodes of the system pro- posed by Matsunaga et al. (1979) consisted of a platinum anode and silver peroxide cathode. One pair of eiectrodes was covered by ti cellulose dialysis membrane, which allowed the free passage of the medium into this electrochemical cell, whilst preventing the access of the micro- organisms. Thus, the total electrode system measured the difference i-n current produced in the two circuits. In this, the changes in electroactive substances in the medium caused by the metabolic activities of the micro- organisms fe.g. the production of molecular hydrogen, formic acid and
probe
. i-
‘probe .A- dialysis
1 membrane
FQ. 5, The principle of using dual probes, one covered with a dklysis membrane, .a nuclepore filter or other microorganism-imperme,able membrane, to nullify the effect of environmental changes on purportedly biomass-specifk signals. The main disadvantages of this method are its requirement for the caIibration of both probes and a decreased
response time.
other metabolites) may be cancelled, and the measured difference in current is due to the microorganisms aIone. This principle (Fig. 5) is discussed in some detail by Clarke e&al. (1982) and by Clarke &al. (1985). Further, the system is apparently measuring the current output generated by viable cells, and not that generated by non-viable celis or other particulate material (prevented from entering the reference electrode by the dialysis membrane); heating, ultrasonic irradiation, and the addition of nystatin (an antibiotic that destroys,celI membrane integrity) produced a decrease in the output signal (Matsunaga et aZ., 1979).

54 C. M. E-an-is, D. I?. Kell
Matsunaga et ai. (1979) found the measured current difference to be proportional to the number OL cells in the sampl~z, estimated by colony counts, to within an average error of 67 o ‘r and evaluated the effect of pH, temperature, and phosphate buffer and oxygen concentrations on this relationship. They reported that the current output was independent of the oxygen and phosphate buffer concentrations. However, an increasing _ _ signal was obtained with increasing pH, and also with increasing terngera- ture up to a maximum at XI”@, thus necessitating temperature and pH control of the suspension. The linearity of the e!ectrode response was tested using suspensions of known concentrations of Lac&&~il~u.s fermenturn and Saccharumyces cerevisiue, and the device was then successfully applied to the continuous monitoring of ceil populations of S. cerevisiae in a fermentor.
This proposed electrochemical system (Matsunaga et al., 1979) has the distinct advantage over those of Wilkins (Wilkins, 1974, 1979; Wilkins et al., 1974,1978, i980), Ho i’iand ei ar’. (1980) and Junter et al. (Junter j?t al., 1980; Junter $c Selegny, 1982a,b) in that the detecTion time is a function of the response time of the dialysis-membrane-covered electrode (some 15 to 20 min) and does not depend on the growth of the microorganisms per se.. This faster response time, which would be improved by the substi- tution of a nucleopore filter for the dialysis membrane, when coupled with the simplicity of an electrode system, enables continuous, on-line monitoring of biomass in fermenters, However, the platinum-silver peroxide system has two disadvantages: (i) the silver peroxide cathode decomposes on autoclaving, and (ii) the system is not capable of providing the sensitivity required over the range of cell populations that are initially found in fermentation processes (the minimum number of detectable cells being 10’ yeast cells/ml, and 10’ Lfermentwn cells/ml), nor those that are typically found in clinical or ecological specimens.
To overcome the first disadvantage, Matsunaga et ali. (1980) tested another electrode system, similar to the platinum-silver pe~nxide system. This new system consisted of two cells, measuring and reference, each comprising a platinum working electrode, platinum counter electrode, and saturated calomel electrode (SCE). Both of these electrode cells were immersed into a culture of B.subtilis, the reference ~eii again being covered with a cellulose dialysis membra.ne to maintain a inicroorganism- free ‘reference solution’. The platinum working electrodes of .each electrode system were held at a constant potential with respect to the SCE, and the difference in current flowing in the ‘measuring’ and
The estimation of microbial biomass 65
‘reference’ circuits was recorded. Matsunaga et al. (1980) found that the maximum current difference was obtained at a working potent&al ofO=i V (versus SCE), and that the output signal increased with increasing tem- perature to a maximum at 5O”C, cwing !o the increased reactivity of the electroactive substances and t& subsequent inactivation of the bacteria at 50°C. They found that it was also necessary to neutralise the organic acids produced by actively metabolising B.subtiZ~, and hence to control the p1-I of the culture.
The output signal was attributed to the presence of viable micro- organisms, since an autoclaved sampie containing l-4 x 10’ &~&&/ml produced a greatly reduced signal in comparison -with a viable cell popu- lation of the same size. The difference in current between the measuring z:ud reference (electrochemical) cells was found to be linear with cell numbers (measured by colony counts) in the rahge 10” to 4 x 10’ B.subtilis/ml, with a mean error of 4%. This potentiostatic device, as well as being stable to autoclaving, has the added advantage ovez the platinum-silver peroxide system in that the response time has been re- duced from 20 min to only 5 min. However,.ttrt; operating range of bacterial concentration for this system, and for the platinum-silver peroxide electrodes, is restricted, and although their sensitivities will suffice in some instances, many cultures are srown at concentrations outside the limits of linearity of these devices. The second disadvantage of the platinum-silver peroxide system is therefore shared by the platinum- platinum_caIomel arangement, and in order to overcome this lack of. sensitivity, Karube, Suzuki and colleagues (Nishikawa et al., 1982)
adapted the fuel cell-type electrode system to include the filtration of dilute populations: they also added redox mediators (‘signal amplifiers’:\. Initially, they evaluated the efficiency of various redox dyes as sign211 amplifiers, using suspensions of E.coli. 0f the redox dyes tested, 2, 4-dichlorephenolindophenol (DCIP) was found to be the most effective signal amplifier, and like the other redox dyes it enhances the signal by acting as an electron carrier between the electron donors in the microbiai membrane and the platinum anode (Turner et al., 1983). The signal was maximal under the following conditions of pHr temperature7 and DCIP concentrations (Nishikawa et al., 1982): pH ?-8,3S”C, and 40 @G DCP, respectively. Subseq,uentTy, suspensions of 3. cdi and three other types of bacteria, Pseudomonas aeruginosa, Frankica aabrescens, and Bacihs sub&s, were concentrated onto acetylcr~lulose membranes, These membranes were attached to the anode of the ll;,ozsuring electrode axid

66
immersed in phosphate buffer containing DCIP. A linear relationship was obtained betv:een the logarithm of the output current and the
C. M. Harris, D. B. Kell
iogarithm of the cell population determined from colony counts, within the range of PO4 to lo6 cells/ml (Nishikawa et ai., 1982). Samples of industrial water, from a paper mill and a petrochemical plant, were similarly treated and their respective microbial populations estimated from a calibration curve for E.coZi (Nishikawa et al., 1982). The lower limit of det ection of the platinum-silver peroxide electrode system was decreased from 10’ to 10’ cells/ml by the use of DCIP (Nishikawa et al,, 1982). Different mediators would presumably be needed for use in anaerobic fermentation processes.
Ishimori, Karube and Suzuki (Ishimori et al., 1981) presented a novel electrochemical techniqre for the continuous monitoring of yeast popu- lations in fermentzars, exploiting the properties of piezoelectric membranes. Essentially, the probe consisted of two parallel piezoelectric membranes 2-S mm apart which were immersed into the yeast culture.. When the input piezoelectric membrane was charged to a certain voltage by an oscillator, the resulting ultrasonic waves were transmitted through the culture separating the two membranes, and induced a voltage on the output membrane. Ishimori et al. (1981) recorded the individual responses obtained from a yeast culture, the supematant of the yeast culture, and wrier, and found that approximately 40% of the output signal could be assigned to the effect of the microorganisms on the transmission of the ultrasonic waves between the two piezoelectric rfiembranes. The transmission cr” ultrasonic waves through fluids is also a function of (i) the frequency of the applied voltage, (ii) the pI? and buffering capacity of the sample;(iii) the temperature, (iv) the density of the medium, and (v) the adiabatic compressibility of the sample. All these variables were duly tested, and those which were found significantly to affect the signal were suitably controlled.
The piezoelectric membrane probe was used to estimate microbial populations in susp?nsions of B.su%ltilh and Klebsiella spp., and to monitor the growth of yeast in a fermentor. The calibration curve for yeast showed a linear response between the output voltage and the number of cells/ml (counted with a haemocytometer) in the range lo6 to 10’ cells/ml, and a different linear response between 10’ and 10’” cells/ml, with a mean error of 6%. The level of sensitivitv is below that at yeast is grown in a typical COIlUTErciai ferment&ion (Matsunaga
which et al.,

The esthation of microbial biomass 67
1979), but it may not be suitable for monitoring other fermentation processes. Ishimori et al. (1981) also found that although the piczoelectric membrane seemed promising as a biomass probe for yeast, small cracks appeared in the epoxy resin during autoclaving which resulted in the loss of the output signal. This is hardly an insuperable problem, and further investigation of devices based on this principle seems warranted.
The electrochemical detection systems probably offer the best tech- uiques for on-line and continuous monitoring of biomass in fermentors. They are inexpensive (particularly when compared with the currently available impedimetric, light scattering and radiometric devices), easy to use, the electrodes may be effectively sterilised by autocltiving, they function in the normal growth media, and they may be easily automated. However, further work is necessary in order to provide a system which has the desired sensitivity and a very fast, preferably real-time, response.
In certain circumstances, particularljj in sewage treatment, microbial growth is carried out in a film on an inert support matrix such as rock or plastic. In the former case, one method which has been proposed for the determining of microbial biomass content involves the measurement of the scattering of thermal (slow) neutrons (I-Iarvey et al., 1963). As is well known, the efficiency of hydrogen as a moderator of fast neutrons is so much higherthan that of any other element that the flux of slow neutrons. surro!rrrding a source of fast ne!ltrons at equilibrium is determined almost entirely by the hydrogen content of the medium. Measurement of the flux of slow neutrons then gives a measure maimy of the water content of a typical sample of interest (Marais & Smit. 1960), and can thus, in favourable cases, be used to assess the microbial biomass content of percolating filters. The method does not seem to hsve enjoyed wide- spread ‘use ta date.
S. MATHEMATICAL METIIODS AND COMPU’I’ATION
Problems with the direct determination of microbial biomass have led to the use of mass balancing, by which all components other than biomass are monitored, the biomass content ‘beifig assessed by difference. This has

68 C. M. Harris, D. B. &ii
obvious difficulties connected with the summation of errors. However, mathematical models (e.g. Robinson & Tiedge, 1983) have the potential for quantitative explanation of the phenomena observed during fermen- tation processes, coupled to the estimation of cell biomass. Mcvcrtheless, their limitatiorrs must be appreciated, and apparently successful models should not be considered final proof of any of the assumptions incor- porated into the model, since two or more alternative modeis may lead to similar conclusions (Topiwala, 1373; Reels, 1983).
The two main obstacles preventing on-r Jne, real-time monitoring of fermentations are the lack of real-time sensors, and insufficient under- standing of the interaction of process variables and the dynamic response of a fermentation to changes in environmental conditions (Zabtiskie et al., 1976; Kell: 1980; Clarke & al., 1982; Clarke et al., 1985). Despite these probleins, mathematical models have been proposed to describe some simple fermentation processes (e.g. Sinclair & Topiwala, 1970; Curds, 1971; Zabriskie et crl., 1976; Cooney et al., 1977; Wang et al., 1979; Junter & Selegny, 198&,6; Park et al., 1983; Roels, 1983; Solomon et al., 1983). 5Zowever I= farther discussion of the use of the mass balancing technique lies outside the scope of the present considerations.
6. SUMMARY AND PROSPECTS
(i) Many methods for the estimation of biomass have been proposed; in cases where the microbial population is sparse, growth leading to an increase in the butput signal of interest is required; given this delay, both chemical and physical methods are suitable.
(ii) No wholly satisfactory biomass senscr suitable for use in typical fermentation processes presently exists. lf a real-tilre probe is desired, its operating principle must rely on a physical character&ic which distin- guishes microorganisms from aqueous so!utions, gas bubbles and particulate material. . ’
(iii) It is to be ekpected that the advent of sophisticated signal processing techniques may contribute significantly to the realisation of a ‘microbiai biomass probe’ for use in laboratory and industrial fennentors It is our belief that the attainment of such a goal, based upon one or more of the methods alluded to herein, awill be possible within the next quinquennium.

T%e estimation of microbial biumam 69
ACKNOWLEDGEMENTS
We thank the Science & Engirieering Research Council, UK, and ICI Agricultural Division for financial support, and Professor Gareth Morris and Dr Stephen Bungard for many useful discussions.
REFERENCES
Adam,s, R. P. L. (1980). Cell counting procedures. In: Laboratory Techniques in Biochemistry and Molecular Biology (Ed. T. S. Work and R. II. Burdon), Vol. 8, Elsevier Scientific Publishers. Amsterdam, pp. 10343.
AIdridge, C., Jones, P. W., Gibson, S., Lanham, J., Meyer, M., Vannesti R, & Charles, R. (1977). Automated microbial detection/identification system, J. Clin. Microbial., 6,40&13.
Alien, P. D. (1972). Development of the luminescence biometer for microbial detection, Dev, Znd. Microhiol., 14,67-73.
Anon. (1980). Automated Microbiology, Abbott Diagnostics Division. Anon. (198la). Bactometel. Models 32 and 120. Anon. ( 198 lb). Impedance microbiology, a current persplective. Detection
Times (Bactomatic Inc.), l( 1).
Anon. (1981c). The impedance screen: An effective tool for the food micro- biologist, Detection Times (Bactomatic Inc.), l(2).
Anon. (1981d). Turner Designs, Luminescence Review, Bulletin 202. Anon. (1982). Impedance screening of raw meat samples using the model 120B.
Detection Times (Bactomatic Inc.), 2( 1). Anon. (1983a). Rapid Automated Iviicrobiology. Bactomatic Mode1 123. Anon. (19836). Bacterial colonies by numbers, Lab. Equip. Digest, 21,87-g. Anon. (undated, a). me bioluminescence of yeast biomass in fermentorbroths.
Lunzirz.escence Today. LKB Wallal:, Bioluminescence Application Note 508. Anon. (undated, b). Direct Epifluorescent Fiber Technique. DIFCO Technical
Information. Anon. (undated, c). The Spiral Plating Methc;rd. Don Whitiey Scientific Ltd. Anon. (undated, d). Microbial Growth Analyscrs, Maithus Instruments Ltd. Anthony, C. (1982). The Bitichemistry oJ’ ltfethyiotrophs, Academic Press,
London. Aston, W. f. & Turner, A. P. F. (1984). Biosensors .and biofuel cells,
Biotechnol. Genetic Eng. Rev., I, 89-120. Atkinson, D. E. (1977). .Celiular Energy Metabolism and its Regulation,
Academic Press, New York. Atkinson, D. E. 6r Walton, G. M. (1967). Adenosine triphosphate conversion in
metabolic regulation, J. Bioi. Chem., 242.323941. Bachrach, IJ. 11976). kadiometrid methods for the detection of bacteria in
biological fluids and water. In: Froc. 2nd Int. Symp. on Rapid Methods and

70 C. M. Harri.r, D. B. Kelt
A u t o m a t i o n in Microb io logy (Ed. H . H. Johnston and S. W. B. Newsom) , Lea rned Informat ion (Europe) Ltd, Oxford, p. 3.
Bachrach, U. & Bachrach, Z. (1974). Radiometr ie method for the detection of co l i form organisms in water , A p p L Microbic.l., 2,g, 169-71.
Bard , A. J. & Faulkner , L. R. (1980). Electrochemical Methods , Wiley, Chichester .
Baross, J. & Deming , J. W, (1983). Growth of 'Black Smoker" bacteria at t empera tu res of at least 250°C, Nature, 303, 423--6.
Bascomb, S. (1981). Application of automation to the general and specific detect ion of bacteria, Lab. Pract., 30, 461--4.
Basel , R . , Richter , E. & Banwart , G. (1983). Monitoring microbial numbers in food by density centrifugation, A p p L Env. Microbiol . , 45, 1156-9,
Bator , J. M. , Groves , M. R. , Price, B. J. & Eckstein, E. C. (1984). Erythrocyte deformabi l i ty and size measured in a mul t iparameter system that includes impedance sizing, Cytometry , 5, 34--41.
Beezer , A. E . , Newell , R. D. & Tyrrell , H. J. V. (1976). Applicat ion of flow microcalor imetry to analytical problems: The preparat ion, storage and assay of frozen inocula of Saccharomyces cerevisiae, J. App l . Bacterio!. , 41, 197- 207.
Beezer , A. E, , Bet t leheim, K. A . , AI-Salihi, S. & Shaw, E. J. (1978). The enumera t ion of bacteria in culture media and clinical specimens of urine by microcalor imetry , Sci. Tools, 25, 6--8,
Bergan, T. (1981). Rapid methods for the detection of aerobic bacteria in blood and spinal fluid, Proc. 3rd Int. Syrup. Rap id Methods and A u t o m a t i o n in
M; . c rob io !ogy (Ed. R. C. Tilton), Amer ican Society for Microbiology, Washing ton , pp. 36-40.
Be t t l ehe im, K, A~, O 'Far re l l , S. M. , AI-Salihi, S., Shaw, E. J. & Beezer , A. E. (1976). Clinical investigation into the potential use of microcalorimetry for the diagnosis of bacteriuria. In: Proc. 2rid Int. Syrup. on Rap id Me thods and A u t o m a t i o n in Microbio logy (Ed. H. H. Johnston and S. W. B. Newsom) , Learned Information (Europe) Ltd, Oxford, p. 8.
Bi l tonen, R. L. & Langerman, N. (1979). Microcalorimetry for biological chemistry: Exper imenta l design, data analysis and inteqaretation, Meth. E n z y m o L , 61,287-318.
Bohren , C. F. & Huffrnan, D. R, (1983). Absorp t ion and Scattering o f L ight by Sma l l Particles, Wiley, Chichester.
Boling, E. A. & Blanchard, G. C. (1973). Bacterial identification by micro- ca lor imetry , Nature~ 241; 472-3
Bond, A, M. (1980). Modern Polarographic Methods in Analyt ical Chemistry, Marcel Dehke r , New Nork.
Bourgeois , C. & Mafar t , P. (1976). The uptake of a labelled metabol i te as a technique for microorganism .d.etect~on. In: Proc. 2nd Int. Syrup. on Rap id M e t h o d s and A u t o m a t i o n in Microbiology (Ed. H. H . Johnston and S. W. B. Newsom) , Learned Informat ion (Europe) Ltd, Oxford~ p. 4.
B r o o k s , S: C. (1923). Conductivi ty as a measure of vitality and death , J. Phys io l . , 5, 365--81.
The e&imation of microbial biomass 71
Brown, D. F. .?. & Warner, M. (1982). Impedance and conductivity methods for detecting bacteriuria. In: Proc. %a’ Irtt. Symp. Rapid Methods and Auto- mation in Microbiology (Ed. R. C. Tiiton), American, Society ‘for Micro- biology, Washington s pp. 17 l-5.
Buddemeyer, E. U. (1976). Automated quantitative radiometric measurement of bacterial growth. In: croc. @d Int. Symp. Rapid Methods and Automation in Microbiology (Ed. H. H. Johnston and S. W. B. Newsom), Learned Inftirmation (Europe) Ltd, Oxford, p_ 4.
Cady, P. (1975). R apid automated bacterial identification by impedance measurements. In: New Approaches to the Idenrification of Microorganisms (Ed. C-G. Heden and T. Illeni), Wiley Biomedical, New York, pp. 73-99.
Cady, P. (1978). Progress in impedance measurements in micrtibiology. In: Mechanising Microbiology (Ed. A: Sharpe and D. Clarke), Charles C. Thomas, Springfield, pp. 199-239.
Cady, P., Dufour, S. W., Lawless, P., Nunke, B. & Kraeger, S. J. (1978). Impedimetric screening for bacteriuria, J. Clin. Microbfol,, 7,273-8.
Carstensen, E. L. & Marquis, R. E. (1975). Dielectric and electrochemical properties of bacieriai cells. In: Spores VZ (Ed. P. Gerhardt, R. N_ Costiiow and H. L. Sadoff), American Society for Microbiology, Washington, pp. 563-71.
Chapman, A. G., Fall, L. &Atkinson, D. E. (1971). Adenylate energy charge in E. coli during growth atid starvation, J. Bacteriof., lOf#, 1072-86.
Chagpetle, E. W., Piccioli., G. L. & Deming, J. W. (1978). Determination of bacterial content in fluids, Meth. EnzymoL, 57,65&72.
Chen; S.-H. & Hallett, F. R. (1982). Detetiilination of motile behaviohr of prokzryotic and eukaryotic cells by quasi-elastic iight scattering, Quart. Rev. Siophys., I.5,131-222.
Chu - B. (1974). Laser Light Scattering, Academic Press, New York. Clarke, D. J., Keli, D. B., Morris, J. G. gi Bums, A. (1982). The role of‘
ion-selective electrodes in microbial process control, Zon Sefec. Elec. Rev., 4,
75-131. Clarke, D. J., Calder, M. R., Carr, R. J. G., Blake-Coleman, B. C. & Moody,
S. C. (1985). The development and application of biosensing devices for bioreactor monitoring and control, Biosensqrs (in press).
Coates, D. A. (1976). The use of the limulus pyrogen assay for th,e rapid detection of contamination by Gram negative bacteria. In: Proc. Z!nd Int. Symp. Rapid Methocis end Automation in Microbiology (Ed. H. H. Johnston and S. W. B. Newsom), Learned Information (Europe) Ltd, Oxford, pp. 19-20,
Cachet, N . , Tyagi , R. D., Ghose, T. K. & Eebeault, J. M. (1984). ATP measurement for cellulose production control, Biotechnof. Lett., 6,155-60.
Coleman, K., Hunter, P. A: 8r Ridgeway Watt, P. (1983). Antibiotics.- Assess- ment of MicrobioCogicui Activity and Resistance, Sot. Appl. E?%dte.tiol, Technical Series no. 18 (Ed. A. D, Russell and L. B. QuesneI), Academic Press, London, pp. 317-30.
.
Collins, C. H. & Lyne, P. M. (1970). Microbiological Methods, Buttenvorths, London,
. .

Cooney , C. L., Wang, H. SC Wang, D. I. C. (1977). Computer aided material balancing fat prediction og ferruentation parameters, Biotechnol. Bioeng., 19, 55-67.
Coonrod, J. D. 9 Kunz, L. .I. & Ferraro, M. J. (Eds) (1983). Tf;z iSrir~~ct B&z&on of Microorganisms in C’lim.cul Samples, Academic Press, New York.
Cause, N. L. & King, J. W. (1982). Quantitation of the spiral plating technique for use with SalmoncIlalmamr~alian mi.cl*osome assay, Environ. Mutagen, 4, 445-55.
Cundell, A. M. (1981).. Rapid counting methods for colifoml bacteria, Ad\;. A,ppC. Microbioi., 27, 169-83.
Curby, W. A. & Gall, L. S. (P976). Instrumental approach to microbiological analysis of body Ruids, k‘ub. ikaiih Lab., 35,118-39.
Curds, C. R. (197 1) . A computer simulated study of predator--prey xelaticnships in a single-stage continuous-culture system, Water Res., 5,793812.
Curds, C. R., Roberts, D. McL. & Mru, C.-H. (1978). The use of continuous cultures and electronic sizing devices to study the growth of two species of ciliated protozoa. In: Techniques for the Study of Mixed Popukztions (Ed. D. W. Lovelock and R. Davies), Academic Press, London, pp. 165-77.
Dahnecke, S. E. (Ed.) (1983). Measurement of Suspended ParticZes by Quasi- Elastic lLight Scattering, Wiley, Chichester.
Dawes, E. A. & Senior, P. J. (1973). The role and regulation of energy reserve polymers in microorganisms. In: Advances in Microbial Physiology (Ed. A. H. Rose and D . W. Tempest), Vol. 18, Academic Press, London, pp. 135-246.
DeBtanc. H. J., DeLand. F. $r Wagner, I-5. D. (1971). Automated radiometric detection of bacteria in 2967 blood cultures, A@. Microbial., 22,8469.
Dermer, Q. C., Curtis. V. S. & Leach, F. R. (1980). Biochemical Indicators of Subsurface Pollution, Anna Arbor Science, Ann Arbor.
Dow, C. S. (1976). Cell volume analysis. In: Proc. %rzd Int. Symp, Rapid Methods and AutumaZion in niicrobioCogy (Ed. H. ?I. Johnston‘and S. W. B. Ncwsom), Learned Information (Europe) Ltd, Oxford, pp. 97-8.
Dow, C. S., France, A. D., Khan, M. S. & Johnson, T. (1979). Particle size distribution analysis for the rapid detection of microbial infection of urine, J. Clin. Pathol., 32,3%-90.
tiufour, A. P., Strickland. E. R. ,& Cabelli, V. J. (1981). Membrane filter method. for enumerating E. cc2i, Appl. Env. IHicrc&iol., 41, 1 X52-8;
Dukhin , S. S. & ShiioG , V . N . (1974). D&electric Phenomena and the Double Layer in Dsperse Sm~.mms and Polyeleczrolytes, Wiley, Chichester.
Earnshaw. J. C. & Steer, M. W. (Eds) (1983). The Application of Easer Light Scattering to rhe Study of.Bioiogicai Motion, Plenum Press: New York.
Eden, G. Cp Eden, iR. (‘1984). Enumeration of microorganisms by their dynamic ac conductance patterns, IEEE Trans. Biomed. Eng., 31,193-8.
Einolf. C. W. & Carstensen, E. L. (1973). Passive elect&al properties of microorganisms. V. Low frequency dielectric dispersion of bacteria, Bio,ohys. J., l3, %13.
El-Shaarawi, A. H. 8r Pipes, W_ 0 - (1982). Enumeration and statietical inferences. Xn: Bacterial Indicators of Pollution (Ed. W. 0. Pipes), CRC Press, Coca Raton. Florida, pp. 4%66.
. .

The estimution of microbir;f biomass 73
Entis, P. (1981). Practical ccmsider+tions in the filtration of foods. In: Proc. 3rd Int. Symp, Rapid Methoris and Automa~iun in Microbioirgy (Ed. R. C. Tilton), American Society for Microbiology, Washington, pp. 58-61.
EwetF, L. & There, A. (1976). Factors aflticting the specificity of luminol reaction with hematin compounds, Ana!. Biochem., 71,564-70.
Ferris. C. W. (1974). Zntroduct~on to Bioeleczrudes, Plenum Press, New York. Forrest, W. ?ft/. (1972). Microcaforimetry. In: Methods in Microbiulogy (Ed. J.
R.. Norris and D. W. Ribbons), .Vu1; 68, Academic Press, London. pp. 285-318.
Fry, J. C. & Zia, T. (1982). A method f o.~ estimating the viability of aquatic bacteria by slide culture, J. A&. Bacferiol., 53, 189-98.
Garden, R. W. (19g4). Modern Logic and Quavrtum M‘ecitnrtics, Adam HiIger, Bristol.
Gates, M. A. (1983). Trajectories of ceii vo;:lme distributions during the growth cycle of Tetruhymena. J. Gez, Micp-obiol., l29,895-960.
Geddes, L. A. (1972). Hectmties and the A4easrruemenr ~j’ Hoelectric EirePzts, Wiley Interscience. ‘Hew York.
Geddes, L. A. & Baker, L. E. (1968). P.+z@tes of Ap,-.&ri Biomedical Instru- memafion, Wiley Interscience, New York.
Gehron, M. J. & White, D_ C. (1983). Sensitive assay ofphosphohpid giycerol in environmental samples, J. Microbial. Me&., I, 23-32.
Geldreich, E. E. & Kennedy, I-I. (1982). The cost of microbial monitoring. In: Bacteri& Zfrdicutors of Poiiution (Ed. W. 0. Pipes), CRC Press, Boca Raton, Florida, pp. 13147.
Gibson, S. (1982). Arr automated approach to clinical microbiology-The auto- mitirobic q-stem. Ln: Proc. 3rd Int. Symp. Rapid Iwerhods a~zd Autom&i&n in Mic~obiubgy (Ed. R. C. Tihon), American Society for Microbiology. Washington, pp. 80-2.
Gielzn, F. L. Ii. & Bergveld, P. (1982). Comparison of electrode impdances of Pt, .Pt-Ir ( 10%) and Ir/AIROF electrodes used in eiectrophysiologicai experi- ments, Meti. BB‘iool. Eng. Cornput., Z&77-83.
Cinan, S. & Luedecke, L. 0. (1982). Impedance methods in raw milk as an alternative to the standard plate count, J. Food Prut.. 45,&7.
Goldschmidt, A/f. & Wheeler, 7’. C. (1975). Determination of bacterial ceEl concentration in urine specimens by electrical mensurrments. In: Micro- biok?g]t IO?5 (Ed. D. Schlessinger), American Society for ‘iMicrobiology, Washington, pp. 6- 11.
Green, R. G. Rc Larson, W. P. (1922). Conductivity of bacterial cells, J. Itr/Eect; Dis., 30,550-K
Grover, N. B., Naaman, J., Ben-Sasson, S. & Doljaniski, F. (1969~). Electrical sizing of particles in suspension, I. Theory, ,Riophy.s. j., 9, 1398413.
Grover, N. B., Naaqc:in, 3.; Ben-Sasson, S. & Doljaniski, F. (1969b). Electrical sizing of particles in suspension, If. Experiments with rigid spheres, Biophys, .I., 9, 1415-25.
Grover, N. B., Naaman, J,, Ben-Sasson, S. & CPoPjaniski, F. (1972). Electrical: sizing of particles in suspeflsfon, iIl_ Kigid spheroids and red blood cells, ~@hys. J. ., X2, 109S-117.

74 C. M. Harris, D. B. Kell
Grover, N. B., Ben-Sasson, S. A. &L Naaman, J. (1982). Electrical sizing of cells in suspension. In: Cell Analysis, Vol. f (Ed. N. Catsimpoolas), Plenum Press, New York, pp. 93-109.
Hadley , W. K. (i976). The use of electrical impedance measurements for the detection of microorganisms in blood cultures. In: Proc. 2nd Int. Symp. Rapid Methods und Automation in Microbiology (Ed. H. H. Johnston and S. W. 8. Newsom), Learned Information (Europe) Ltd, Oxford, p. 14.
Hadley. W. K. CG. Senyk, G. (1975). Early detection of microbial metabolism and growth by measurements of elel= tricai impedance. In: Microbiology I975 (Ed. D. Schlessinger), American Society for Microbiology, Washir:gton. pp. 12- 21.
Hamilton, W. A. & Sale, A. J. H. (1061). Effepts of+gh frequency electric fiekds on microorganisms, Biochim. Biophys. Acf.2, U3,781-8.
Hancher, C. W.. Thacker, L. H. & Phares. E. F. (1974j. iZ fibre-optic retro- reflective turbidinaeter for continucus5y monitoring cell concentration during fermentation, Biotechnoi. Bioeng., 16,475-84.
Hardy, D., Kraeger, S., Dufour, S. Rr Cady, P. (1977). Rapid detection of microbial contamination in frozen vegetables by automated impedance measurements, Appl. Env. Microbial., 34, 1617.
Harris, C.-M. & Kell, D. B. (1983). The radio-frequency dielectric properties of ’
yeast cells measured with a rapid, automated, frequency-domain dielectric spectrometer, !?icr&ectpochem. Bioentwg. q 111, 1528.
Harris, C. M., Hitchens, G. D. & Kell, D. B. (1984). Dielectric spectroscopy of microbial mernbrcrrc systems. In: Charge and Field Effects in Biosystems (Ed. M. J. Allen and P. N. R. Usherwood), Abacus Press, Tunbridge Wells, pp. 179-85.
Harrison, J. (1976). Rapid detection of microorganisms. in: Proc. 2nd Inc. Symp. Rapid Methods and Automation in Microbiology (Ed. H. H. Johnston and S. W. B. Newsom). Learned Information (Europe) Ltd, Oxford, pp. 101-2.
Harvey. 8. R., Eden, G. E. 8r Mitchell, N. T. (lCG3). Neutron scattering: A technique for the direct determination of the arnuunt of biological film in a percolating filter. J. Inst. Sew. Purif., 495-506.
Hasyn, J..T.,Cundy. K. R.,Dictz,C. C. & Wang, W. ( 1981). Clinical lnboratory evaluation of the automicrobic system for rapid identification of Entero- bacteriaceae. J. Ciin. Microbioi., l3.491-7.
Hause, L. L., Komorowski, R. A. 8: Gayon, F. (1981). Electrode and electro- lyte impedance in the detection of bacterial growth, IEEE ?‘r~n.s. Biomed. Eng., 28, 403-10. ’
Heden, C.-G. & Iileni, T. (Eds) t 1975). New Approaches to the identification of Microorganisms, Wiley, Chichester.
Herbert, D. ( 1961). The chemical composition of m.icroorganisms as a function of their environment, Symp. Society for General Microbiology. X& 391-416.
Heslop, 3. ( 1980). Automation in microbiology, Clin. Lab. Products, November issue, I-10.

The estimntion of microbial biomass 75
Hobbie, 3. E. & Watson. S. W. (19801. Comnarison of direct count and LPS estimations of bacterial biomass, A_bstr. 2hd Int. Symp. Microbial Ecol., Warwick, pp. 175-6.
Hobbie, .I. E., Daley, R. .I. & Jasper, S. (2977). Use of nuclepore filters for counting bacteria by fluorescence microscopy, A&. Enu. Micrubiol.. 33, 1225-8. r
Hobson, P. N. & Mailn, S. 0. (1970). Applications of the Couiter Counter in ~Wicrobiology. Automation, Mechanisation and LXata Handling in Micro- biology, Sot. Appl. Bacterial. Technical Series no. 4 (Ed. A. BailIie and R. J. Gilbert), Academic Press, London, pp. 91-105.
Holland, R. L., Cooper, B. I-I., Helgeson, N. G. P. & McCracken, A. W; (1980). Automated detection of microbial growth in blood cultures by using stzfr,lcss-steel electrodes1 J. Cliq. I-$itirobiol.: Iii, i W4.
Hulsheger, H. & Niemann, E. G. (1980); Lethal effectsof high volt&age pulses on E. coli K12. Radiat. Env. Biophys., X& 281-8.
klulsheger, ?-I. & Niemann, E_ G. (1981). Killing of bacteria with electrical pulses of high field strength. Hadziu. Enu. Biophys., 20,53+55.
Isenberg, H. D. & MacLowry, .I. D. (1976). Automated methods and data handling in bacteriology, AWL Rev. Micrubiol., 34X483-505.
Ishikawa, Y_ & Shoda, M. (1983). Calorimetric analysis of!Z.c& in continuous culture. Biotechnoi. Bioefzg., Z5,18i 7-27.
Ishimori, Y., Karube, I. & Suzuki, S. (1981). Determination of microbial pcpulations with piezoclectric membranes, A&. Env. Microbial., 42: 632-7.
Jason., A. C: (1983). A deterministic model for monophasic growth of batch cultures of bacteria, Antonie van Leeuwenhoek, 49,513-36.
Jeltsch, A. & Zimmermann, U. (1979). Particles in a homogeneous electric field: A model for the dielectric breakdown of living ceils in a Coulter Counter., Bioelectrochem. Bioenerg., 6,349-N.
Jennir?s.n+ B. R. & Morris, V. J. (1974). Light scattering by bacteria_ 11. Size and electrical properties of E_coii, Jr, Coil. Interf_ Sci.. 49,89-97.
Johnston, l-I. H. & Newsom, S. W. (Eds) (1976). proc. 2nd fnt. Symp. Rapid Methods and Automation in Microbiology, Learned Information (Europe) Ltd, Oxford.
Jones, J. G. ( 1979). A Guide to Metho&for &timgtirz,q Microbial Numbers and Biom~iss in Fresh Water, I-‘reslrwater Biol. Assoc., Scientific Publication 39, Kendal.
Junter, G.-A. & Selegny, E. (1982a). Evolution wit “h time of the zero._current potential of a gold electrode in E.coZi cultures supplied with fipoic acid, Part I: Mathematical modeling and computer simulation, Bioelectruchem. Bioenerg., l&l, 679-97.
Junter, G.-A. & Selegny, B. (19826). Evolution with time of the zero-current potential of a gold electr-ode in E-c& cultures suppbed with lipoic acid, Part II: Properties of the mm!el and their application to investigations on drug effects on bacterial activity, Bioelectrochem. Bioenerg., 14R, 699-709.
Junter, G.-A., Lemeland, J.-F. Sr Selegny, E. (1980). Electrochemical detection and counting of E_coli in the presence of a reduci’ble coenzyme, lipoic acid. Appl. Env. Microbiul., 38,307-16.

76 C. M. kGr?is, D. B. KeIl
Junter, G.-A_, Bogaczyk, M; C., Lemeland. J.-F. & Selegny, E. (1984). Poten- tiometric characterisation and monitoring of antibiotic effects on bacterial activity_ In: Charge arrd -Field Efle:-t~ i;z Eiosystems (Ed. M. J. Allen and P. N _
R. Usherwdod), Abacus, Tunbridge Wells. pp. 195-200. Kagan, R. L., Schuette. W. 8r Zierdt, C. H. (1977). Rapid and automated
diagnosis of bacteremia by impedance detection, J. Ciin. Microbial., 5,s 1-7. Kahn, vd., Friedman 3 G _ . Rodriguez, ‘O’J., Coutroni, C. & Ross, S. (1976).
Rapid detection and isolntion of bacteria in blood and cerebrospinal fluids in children by the electrical impedance methods. In: Proc. 2nd Irzr. Symp. on Rapid Methods and Automation in Microbiology (Ed. H. H. Johnston and S. W. B. Newsom), Learned Information (Europe) Ltd, Oxford, pp. 14-15.
Karl, D. M. (1980). Cellular nucleotide measurements and applications in microbial ecoiogy , Microbial. Rev., 44,739-96.
KZYI, L). M. 2k Holm-Hansen, 0. (1978). Methodology and measurement of adenylate energy charge ratios in environmental samples, Marine Biol., a, 185-97.
Kass, E. H. (1957). Bacteriuria and the diagnosis of iniections of the urinary tract, Arch. Int. Med., lW,709-14.
Keilmann, F., Bohme, D. Sr Santo, L. (1980). Multichannel photometer- nephejdmeter . Appl. Em_ Microhiol. : 40,458--61.
Kell, D. B. (1980). The role of ion-selective electrodes in improtling fermen- tation yields, Process. Biochem., 25, 18-23,29_
Kell, D. B. (1983). pielectric properties of bacterial chromatophores, Bio- electrochem. Bioenerg. 9 11,405-15.
Keli, D. B. (1984). Dielectric ?Fcctroscopy of the Rotationai and Translational Motions of Membrane Prot&ds: Theory and Experiment, EBEC Reports, 3, 645-6.
King, J; D. & White, D. C. (1977). Murasnic acid as a measure of mitzrobial biomass in estuarine and marine samples, Appi. Env. Microbiof., X4,777-83.
Kjaergaard, L. (1977). The redox potential: its use and control in biotechnology, Adv. Biochem. Eng., 7, 13 l-50.
Knight, V. A., *fliggins, P. M., Harvey, J. D. & O’Brien, J. A. (1981). The relationship between the size of mitochondria and the intensity of .light that they scatter in different energetic states, Biochim. Biophys. Acta. 637, 146-51.
Knowies, C. J. (1977). Microbial metabolic regulation by adenine nucleotide pools. Symp. Sot. Gen. Micmbiol.. 27,241-83.
Koch, A. IL. (1961). Some .calcul&tioris on the turbidity of mitochondria and bacteria, Biochim. Biophys. Acta, 51,4'29dl_
Koliander, B., HamyeI y W. & RoelIz, M. (1984). Indirect estimation of biomass by rapid ribonucleic acid determination, Appl. Microbial. Biotechnoi., 19, 2724.
Konings, W. IN. & Veldkamp, H. (i980). Pher&pic responses to environmental change. In: Contemporary Microbial Ecology (Ed. D. C_ Ellwood, 3 _ N.
Hedger, M. J. Latham. J. M. Lynch and J. H. Slater), Academic Press, London, pp. 161-91.

The estimation cf microbial biomass 77
Kramer, J. M., Kendall, M. & Gilbert, R. J. (1979). Evaluation of the spiral plate and laser colony counting techniques for the enumeration,of bacteria in food, Eur. J. App1. Microbial. Biotechno[. ,6,289-99.
Kubitschek, H.’ E:. (1969). Counting and sizing microorganisms with the Coulter Counter. In: Methods in Microbioiogy, Vol. 1 (Ed. J. R. Norris and D. W. Ribbons), Academic Press, Lopion, pp. 593-610.
Kull, F_ C. & Cuatrecasas, P. (i983). Estimation of cell number by neutral red content. Applications for proliferative and sur-+a1 assays, Appl. Biochem. Biotechnol., 8,97-103.
Larsson, K., W’eibull, C. & Cronberg, G. (1978). Comparison of light and electron microscope determinations of the number of bacteria and algae in lake water. AppZ. Env. Microbial., X5,397-404.
Leach, F. R. (1984). Biochemical indicators of groundwater pollution. In: Groundwater Pollution Microbiology (Ed. G. Sitton and C. P. Gerba). Wiley, London, pp. 303-5 1.
LeChevallier, M., Cameron, S. CgL McFeters, G. (1983). Comparison of verifi- cation procedures for the membrane filter total coliform technique, .4ppi. Env. Microbioi., 45, 11X-8.
Levin, G. V. (1963). Rapid microbiological determinations with radioisotopes, Adv. Appl. Micrubiol.. 5,95-133.
Lloyd, D. & Scott, R. I. (1983). Direct measurement of dissolved gases in microbiological systems using membrane inlet mass spectrometry, J. Microbial, Methods. ¶, 3 13-28.
Lloyd., D., Scott, R. I. & Williams, T. N. (1983). Membrane inlet mass spectro- scopy-measurements of dissolved gas in fermentation liquids. Tren& Biotechnoi., 1, W-3.
Lovgren, T., Peacock, R., Lavi, J., Karp, M. & Raunio, R. (1982). The bioluminescent assay of NADH and NADPH, irzt. Lab., p3,58_6i.
Lrrscombe, B. M. & Gray, T. R. (1971). Effect of varying growth rate on the- morphology of Arthrobacter, J, Gem Micrubiol., 69,433-4.
Mallette, M. F. (1969). Evaluation of growth by physical and chemical means. In: Methods in Microbiology, Vol. 1 (Ed. J. R. Norris and D. W. Ribbons). Academic Press, London, pp. 521-e.
Marais, P. G. $r Smit, W. B. De V. (1960). Laboratory calibration of the neutron moisture meter, South Afr. ,r. Agr. Sci.. 3,58L-601.
Marten, J. ( 1972). Automatic and continuous assessment of fermentation para- meters. In: Methads in Microbiology, Vol. 68 (Ed. J. R. Norris aad D. W. Ribbons), Academic Press, London, pp. 319-30.
Martins, B. H., Ho&pp, S.. Dufour, S. W. 8r Kraeger, S. J. ‘(1982). Evatuation of a rapid impedimetric method for determining the keeping quality of milk, J. Food B-o?. ,45, 1221-6.
Martins, S. B. & Selby, S. J. (1980). Evaluati.on of a rapid method for the quantitative estimation of coliforms in meat by impedimetric procedures, Appl. .Z%v. Microbial., 39,s 1!&24.
Martz, R. F., Sebacher, D. I. & White, D. C. (1983). Biomass measurements of methane forming bacteria in environmentai samples. J. Microbial. Meth.. 1, 53-61.

78 c. A+. Hcmi§, D. B. Kdi
Matsunaga, T., Karl&e. I. & Suzuki, S. (1979). Electrode system <or the determination of micro’bia: popiliahms, Appl. E?2i’. Microbial., 57, 11%2 1.
Matsunaga, T., Karube i I. & Suzuki, S. (1980). Electrochemical determinations of cell populations, Eur. J. Appl. Microbial. Biotechnol., IO, 125-32.
Matsushita, T., Brendzel, A., Shotola, M. & Groh, K. (198’2). Electrical determination of viability in saline treated mouse myeloma cells, Biophys. .I., 39,41-7.
Miller, C. A. & Vogelhut, P. 0. {1978). Chemiluminescent detection of bacteria: experimental and theoretical limits, Appl. Elnv. ME’crubiof., 35, 813-16.
Mitchell, R. (1974). Introductions to Environmental Biology, Prentice-Hall Serias in Environmental Sciences, Englewood Cliffs, NJ, p. 84.
Mitruka, 63. (19’76). Methods of Detection and Iden@cation of Bacteria, CRC Fress Lnc., Boca Raton, Florida.
Mor~od, J. (1949). The growth of bacterial cultures, Ann. Rev. MicrobioC.. 3, 37 I-94.
Mor, J. R. (1976). FIow microcalorimetry in microbiology. In: Proc. 2nd Inr. Symp. Rapid M&hods an.d Aritomatiun in Microbiology (Ed. H. H. Johnston and S. W. B. Newsom), Learned Information (Europe) Ltd, Oxford, p. 7.
Moriarty ,* D. J. W. (1980). Measurement of bacterial biomass using muramic acid, Abstr. 2nd Int. Symp. MicrobiaI Ecoiogy, Warwick, p. 177.
Morris, J. G. (i974). A Biologist’s Physictai Chemissrry, 2nd Ed., Edward Arnold, London.
Morrison, G. A. & Tbmkins, A. L. (1973). Determination of mean cell size of Tetrahymena in growing cultures, J. Germ. Microbial., 7’7’,383-92.
,Munoz, E. & Siiverman, M. (1979). Rapid, single step most-probable-number method for enumerating fecal coIiforms in effluepfs from sewage treatment, Appi. E:r.v. Microbial., 37.527-30.
Nestaas, E. & Wang, D. I. C. (1981). A new sensor, the ‘fi!:ration probe’ for quantitative characterisation of the penicillin fermentation. I: Mycelial morphology and culture activity, @iotechnoi. Bioeng., 23,2803--13.
Nestaas. E. & Wang, D. I. C. (1983a). A new sensor, the ‘filtration probe’ for quantitative characterisation of the penicillin fermentation. III: .An auto- matically operating probe, Biutechnoi. Bioeng., 2!5,1981-7.
Nestaas, E. & YIang, a. I. C. (19836). Computer control of rhe penicillin fermentation using tile filtration probe in ctinjunction with a structured process model, Biotechnol. Bioeng., 223,781-g&
Nestaas, E., Wang, D:I. C.; Suzuki, H. & Evans, L. (1981). A new sensor, the ‘fiftration probe’ for ‘quantitative characterisation of the penicillin fermen- tation. II: The monitoring of mycefial growth, Biofechnol. Bioeng., 22428 15- 24.
Neufeld, H. A., Conklin, J. & Towner, R. D. (1965). Chemiluminescence of hlminol in the presence of hematim compotiilds, Anal. Biochem., E&,303-9.
Neufeld, R. J. & Zajic, J. E. (1982). A technique for monitoring biomass ieveIs an@ ceil adhesion in hexadecane fermentations, Biotechnol. Len., 4+ 701-4.
Newman, J. & O’Brien, R. T. (1975). Gas chromatographic presumptive test for

The estimation of microbial biomar, 79
colifarm bacteria in water, AJ@ Env. MicrobioC. t 30,584-8.
Nishikawa, S., Sakai, S., Karube, I., Matsunaga, T. & Suzuki, S. (1982). Dye-coupled electrode system for the rapid determination of cell populations in polluted water, ;lap1. Eptu. Microbial., a, 81618.
Norris, J. R. & Swain, H. (1971). Staining bacteria. In: hfethods in Micru- biology; Vol. SA (Ed. J. R. Nbrris and D. W. Ribbons), Academic Press, London, pp. 105-34.
Ohashi, M., Watabe, T., Ishikawa, T. 6r Watanabe, Y. (1979). Sensors and instrumentation: Steam-sterilisablc dissolved oxygen sensor and cell mass sensor for on-line fermentation system control, Biotechnol. Bioeng. Symp., 9, 103-16.
Oleniacz, W. S., Pisano, M. A., Rosenfeld, M. H. & Elgart, R. L. (1968). _. Chemiluminescenr method for detedting microorganirirns in water: Env. Ski. Technol., 2,1030-3.
O’Toole, ID. L(,. (1983a), Methods for the direct and indirect assessment of tii;:e bacterial content of milk, J. Appl. Bact., 55, 187-202. _
O’Toole, ID. K. (1983b). Weighing technique’ Ear kletcrmining bacteriai dry weight tpased on rate of moisture uptak::, Appt. Env. Microbioi., &t& 506-X
Padan, E., Zilberstein, D. & Schuldiner, S. (1981). pi-I homeostasis in bacteria, Biochkz. Biophys. Acra, 650, 151-66.
Park, S. H., Hong, K. T., Lee, J. I-l.. & Bat, J. C. (1983). On-line estimation of cell growth for glutamic acid fermentation systems, Eur. J. Appl. Micrubiol. Btotechrzol., 17, 168-72.
Tcrky, c. Ea., Swanz, 5’. R. & C;Doney, C. L. (1979). Measurement of cell .mass concentration with a continuous flow viscometer, Bioifchnoll. Bioeng., 22. 519-23.
Pethig, R. ( 1979). Diekctric and Electronic Properties of BioIogicu! M&eriaZs, Wiley, Chichester.
Pettipher, G. L. (1983). The Direct Epijiuorescent Fikf Techniqu.e for&e Rapid Enumeration of Microorgankmz, Research Studies Press, Letchworth.
Fertipher, G. L. & Rodriglr;-:s, U. M. (1982). ‘Semi-automated counting of bacteria and somatic cells iir tnilk using epifluoresence microscop)- arid tele- vision image analysis, J. Appl. Bacterial. ; 53,323-g.
Pettipher, G. L., Mansell, R., McKinnon, C. II. & Cousins, C. M. (1980). Rapid membrane filttation-epifluorescence microscopy for direct enumera- tion of bacteria in raw milk, Appl. Etiv. Miertibi~l., 39,423-g.
Piccioio, G. L., Chappelle, E. W., Thomas, R. R. & .McGarry. M. A. (1977). Performance characteristics of a new Photometer with ;I moving Alter tape for luminescence assay, Appl. EPZV. MicrobiL , X, 720-4.
Picciolo, G. L., Deming, J. W., Sibley, I>. A. PI_ Chagpalle, E. W. (1978). Characteristics of commercial instruments and reagents for lrrlminescent assays, Mcth. Enzymol., 57,550-9.
Pirt , S. 3. (1975). Principles ofMicrobe and Cell Cukivation, Blackweil, Oxford. Postgate, J. K. (1969). Viable counts and viability. In: Methods in Micrubioiom,
&y.i8(Ed. J. R_ Norris and D. W. Ribbons), Academic Press, London, pp. - .

80 C. M. Hark, D. B. KelI
Postgate, J. R. (1976). Death in macrobes and microbes, S~?rn. Sot. Gen. Microbial., 26, I-i8.
Powell, El 0. (1943). Photometric methods in bacteriology, J. Sci, Agri., 14, l-8.
Powell, E. 0. & Stoward, P. J. (1962). A photometric method for following changes in length of bacteria, J. Gen. Microbial. s 2?,489-500.
Primas, W. (1981). Chemistry, Qua11fum Mecharks und Reductionism, Springer-Verlag, Heidelberg.
Pusey, R. N. &. Tough, R. 5. A. (1982). Dynamic light scattering, a probe of Brownian particle dynamics, A&. Coil. Interf. Sci., 14, 143-59.
Quesnel, L. B. (1971). Microscopy and micrometry. In: Me&o& ~FZ Micro- biology, Vol. SA (Ed. J. R. Norris and D. W. Rrbbons), Academic Press,, London, pp. 2-,103.
Reed, G. (1982). Microbial biomass. Single cell protein and other microbial products. In: Prescorr and Dunn’s Industrial Microbiology, 4th Edn (Ed. 6. Reedj, Macmillan, London, pp_ 541-92.
Ribbons, D. W. (1970). Growth relationships beiween growth mefdia consti- tu.:nts s:;d cellular yield and composition. In: Methods in Microbiology, Vol. 3A (Ed. J. R. Norris and 0. W. Ribbons), Academic Press, London, pp. 297-304.
Richards, . 1, C. S., Jason, A. C., Hobbs, G., Gibson, D. M. & Christie, R. l-i. (1978)_ Electronic measurements of &&?;;a1 growtia, b. Phys. E: Sci. Instrum., 11, 5m-8.
Ricketts, T. R. & Rappitt, A. F. (1974). Determination of the volume and surface area of Tetmhyn;ena pyrij~omis and their relationship to endocytosis. j. Pro~ozooi.) 21, 549-5 1..
Roberts, II?. McL. (198Oj. Aspects of cell size measurements in Te2rahymena eiiiotr’, J. Gem Microbial., lZ@, Z? I- 18.
Robinson, .i’. & Tiedge, J. (1983). Non-linear estimation of Monod growth kinetic pnrameters from a singie substrate depietiorl curve, ,4Fp!. Env. .Micro;‘~;oi. 7 45, 1452-s.
Roels, J’. A. (1983). Energetics atid Kinetics in Biotechnology. Elsevier, Amsterdam.
Rosen&! s .S _ and Valdivieso-Garcia, A. (1981). Enumeration of mycqplasmas after acridine orange staining, AppC. Env. &ficrobiol., 41, ICK-n!-2.
Rowley, D. B., Brevite, J. J_ & Sri;rrivasa, K ( l976 j. A radiometric screening method for estimating the level of aerobic mesophilic bacteria in foods. In: Proc. 2nd Inr. Symp. on Ra*nid M&h&s and Automcticr. iz Microbiology (Ed. M. H. Johnston and S; W. B. Newsirm), Learned information (Europe) Ltd, Oxford, p. 3.
Sagan, C. (1981). Cosmtis, Macdonaid, London, p. 122ff. Schanne, 0. F. $r Ceretti, E. R. P. (1978). Impedance Measurements in Bio-
logical Celis, Wiley Interscience, New York. Schwan, 11. _ , P (1957) Electrica.! properties of tissue and cell suspensions, Adti.
Biol. Med. Phys., 5: 147-208_ Schwan, si. P. (1953). Determination o$ biological1 impedances. In: Physical
_ .

The estimution of microbial biomass 81
Techniques in Biological Research, Vol. VIB (Ed. W. L. Nastuk) , Academic Press, New York, pp. 323407.
Schwan, H. P. (1966). Alternating current electrode polarisation, Biophjrsik, 3, 181-201.
Schwan, If. P. (1968). Electrode polarisation impedance and measurements in biologicai materials, Ann. NewYork Acad. Sci., 148, 191-209.
Sch%*an, H. P. (1983). Dielectric propertie:; of biological tissues atid cells at ELF-frequencies. In: Biological E8ect.s and Dosimewy of Nonionizing Rudiation (Ed. M. Grandolfo, S. M. Michaelson and A. Rindi), Plenum, New York, pp. 54949.
Schwarz, G. (11’62). A theory of the How-frequency die!ectric dispersion of colloidal particles in an electrolyte solution, J. Phys. Chern., 66,2636-42.
Seydel, J. K. & Wempe, E. (1980). ‘A simple,. fast, and inexpensive kinetic method to differentiate between total and viable bacteria using the Coulter Cot,.nter technique, Dncg Research, 30,298-301.
Sharpe, A. N.. Woodrow, M. N. & Jackson, A. K. (1970). ATP levels in food contaminated by bacteria, J. Appl. Bacterioi., 33,758-67.
Sharpc. A. N.% Uye:tt, E. J., Jackson, A. K. & Kilsby, D. C. (1972). Technique and apparaius for rapid and inexpensive enumeration of bacteria, Appl. Env. &ficrobioi., 24,4. -7.
Sikyta, B. (1983). Metho& in Industrial Microbiology. Ellis Horwood, Chichester, p. 3OOff.
Silverman, M. & Munoz, .E. (1979). Automated electrical impedance technique for rapid enumeration of fecal coliforms in effluents L”rom sewage treatment r$l-vlt.F r.'u-a, Appi. Env. Microbioi.. 37,52I-&
Simidu, U. & Kogure, K. (1980). I%zasurements of living and non-living marine bacteria using nalidixic acid, fibstr. 2nd XIII. Sym~, Microbial Ecoiogy, Warwick, p. 176.
Sinclair., C. G. & T’opiwala, H. H. (1970). Model for continuous cult-ure which considers the viability concept, Biotechnol. Bioerig., 12,, 106!%?6.
Sluyters-Rehbach, M. & SIuyters, J. H. (1970). Sine wave methods for the study of electrode processes. In: ElectroanaPyticar Chemistry (Ed, A. J. Bard), IUarcel Dekker, New York, pp. I-i28.
Smith, 0. E. (1966). A.C. polarography and related techniques; theory a.nd practice. In: Eiectroaca@ticaZ Chemistry, A Series slf Advances, Vol. I @d. A. J. Bard), Edward Am4d. London, pp. l-155.
Smith, S. R. L. (1980). Single cell protein, Phil. Trans. tl. Sot. B., 290,341.-54. Solomon, B. 0., Erickson, I_.. E. & Yang, S. S. (1983). Estimation & biczass
concentration in the presence of mlids for the purpose of parameter esti- mation, Biotechnol. Bioeng., Ls, ‘26%77,
Sonnenwirth, A. C:(1977). Preprototype of an autqmated microbial detection and identification system: A deveiopmental investigation, J. Clin. Micrubiul., 6,400-5.
Specter, S., Throm, R. & Friedman. H. (1976). Screening f& bacteriuria in the clinical microbiology laboratory by eleczr’lcal impedance monitoring_ In: Pmt. 2nd ht. Symp. Rapid Methods and Automation in MiCrobidlogy (Ed.

82 C. M. Harris, D. B. Keil
H. H. Johnston and S. W. 8. Newsom), Learned Infcrmation (Europe) Ltd, Oxford, pp. 13-14.
Starka, J _ (1962). Ce!lular division and reproduction of bacteriophage in syn- chronised cultures of E.coZi, .I. Gem Microbiul., 29,83-90.
Stewart, G. N. (1899). The changes produced bv the growth of bacteria in the molecular concentration and electrical conductivity of culture media, J. Exp. Med., 4,235-43.
Stouthamer, A. fi. (l979). The search for correlation between theoretical and experimental growth yie!ds . In: international Rmiews of Biochemktry, Series 2, Microbial Biochekstry (Ed. J. R. Quayle), University Park Press, Baltimore, pp. l-47.
Strange, R. E. (1972). Rapid detection and assessment of sparse microbial pop-u’lat’lons, Adu. Micr. Physiol., 8, 105-41.
Sugino, A., Peebler, C. L., Kreuzer, K. N. & Cozzarelli, N. R. (1977). Mechanism of action of nalidixic acid: Purification of Escherichiu coli naiA gene product and its relationsXp to DNA gyrase and a novel nicking-closing enzyme, Proc. N&l. /-cad. Sci., 74,4767-7 1.
Takano,, M. & Tsuchido, T_ (1982). Availability of growth delay analysis for the evaluation of total injury of stressed bacterial populations, J. Ferment. Technol., 60, 189-98.
Tempest, D. W., Neijssel, 0. H. & Zevenboom, W. (1983). EfEectofsupp!y and limitation of a cell substrate on the size of bacteria and their growth rate. In: Microbes iir Their ~Natural Environments, Symp. 34, Society for General Microbiology (Ed. 9. H. Slater, R. Whittenbury and 3. W. T. Wimpenny), Cambridge University Press, Cambridge, pp. 119-52.
Thore, A. (1979). Technical as pects of the bioluminescent firefy luciferase assay of ATP, Sci. Tc~o~s, 26,30-4.
Thore, A. (undated). Rioluminescence Assay, Extrnction of ATP from Biological Samples_ LKR Wallac.
Thore, A., Ansehn, A., Lundin, A. & Bergman, S. (1975). Detection of bac?eriuri.a by luciferase assay of adenosine tr-iphosphate, J. Cr’irz. Microbioi., 1,1--8.
Throm, R., Strauss, R., Specter, S. & Friedman, H. (1976). Auto;ntited blood culture testing using radio-isotope and electrical impedance monitoring equipment. In: Proc. 2nd lnt. Symp. Rapid Methods and Automation in Microbiology (Ed. H. I-9. Johnston and S. W. B. Newsom), Leanled Infor- mation (Europe) Ltd, Oxford, pp. 21-3.
Tilton, R. (3. (Ed-j ji9S2a); Rr@d Methods md 4 utomatior: in Micro biology, American Society for’Microbiology, Washington_
Tilton, R. C. (19826). The laboratory approach to detection of bacteremia, Ann. Rev. Microbial., 3& 47~5-93.
Titus, 3. A., Luli? G- W.: Dekleva: M. L. & Strohl. W. R. (1984). Applications of a microcomputer-based system t,c~ control and monitor bacterial growth, Appl. EHV. Microbioi., 47,23944.
Topiwala, H H. (1973). Mathematical modeling in microbiology. In: Methods in MicroGk:!ogy , Vol. 8 (Ed. 3. R. Norris and D. W. Ribbons), Academic Press, London, pp. 35-59.

Trent, J. A., Chastain, R. A. & Yayanos, A. A. (1984). Possible artefactual basis for apparent bacterial growth at 25o”C, Nature, 307,73740.
cp :, 1 rcilel, P. A., EknGt;iic, N. & L&ClCK, il. (ISSZ). .
AiitGTia’li2rG 01 Warr;a b~C~~ii- L--_.,r,, .
ological analysis: Running test of an experimental prototype, Appf. Env., Microbial., 39(5), 9’76-82.
Turner, A. P. F., Ramsay, G. SC. Xiggir,s, I. J. (1983). Applications of electron transfer between biological systems and electrodes, Biochem. sot. Trans., 11,
445-8.
‘tTr, A. (197’6). Prospects and limitations of the impedance technique. In: P~*oc. 2nd ht. Symp. Rapid lvhthods and Automation in Microbiology (Ed. H. I-L Johnston and S. W. B. NewsQti), Learned Information (Europe) Ltd, Oxford, pp. 24%7.
Ur, A. & Brown. D. F. J. (1975). Monitoring of bacterial activity by impedance measurements. Ln: New Approaches to the identijkation of Bacteria (Ed. C.-G. Heden and T. Illeni), Wiley, Chichester, pp. 61-71.
Wang, PI. Y.. Cooney, C. L. Rr Daniel, I. (1979). Computer control of bakers’ yeast production, Biotechnol. Bioeng., 21,975-95.
Warren, L. S., Benoit, R. E. & Jessee, J. A. (1978). .Rapid enumeration of fecal ctliforms in water by a calorimetric ,&galactosidase assay, Appl. Env. Microbial., 35, 136-41.
Washington, J _ A, (1981). Rapid methods for detection of microorganisms in septicemia and meningitis. In: Proc.. 3rd ht. Syp. Rapid M&o& twzd Auto- mation in Microbiology (Ed. R. C, Tilton), American Society for Micro- bislogy, Washington, pp. 33-5.
Washington6 J. A. (31) $r Yu, P. K. W. (1971). Radiometric method for the detection of bacteremia, Appl. Env. Microbial., 22, 100-l __
Waters, J. (1972). Sensitivity of the 14C02 radiom?tric method for bacteria! detection, Appi. Mictwbiol., 23, 198-9.
Watson, L. (1974). The Romeo Error, Hodder & Stoughton, London. ‘Watson, S. W.. Novitsky, T. J., Quinby, H. L. & Valois, F. W. (1977). Deter-
mination of bacterial numbers and biomass in marine environments, App1. Env. Microbioi., 33,940-h
Welch, G. R. & KeEl, D. B. (1985). Not just catalysts. The bioenergetics of molecular machines _ In: The Fluctuating Enzyme (Ed. G. R. Welch), Wiley, Chichester, in press.
Wheeler, J. A. & Zurek, W. H. (1983). Qtiuntum T?zeogj a~sci M&sureme~t, Princeton University Press, Princeton.
Wheelel, T. G. & Goldschmidt., M_ (1975). Determination of bacteria! ceI! concentrations by electrical measurements, J. Clin. Microbial,, I, 25-9.
White, D. C. (1980). Lipid extracts as a measurement of biomass and com- munity structure of detrital, benthic and bioi%uling assemblies, Abstr. 2nd In;. Symp. Microbial Ecology. Warwick, p. 77.
White, D. C. (1983). Analysis of rnicrqr ,,rganisiiis in ‘serms of quantity and * .
act:v;ty in natural environments.. In: Microbes h Their Natural Environ??zents, Society for General Microbiology, $&-np. 34. (Ed. J. H. Slater, R, Whittenbury and J. W. T. Wimpenny). Cambridge University Press, Cambridge _ pp. 37-66.

84 C. M. Harris, D. B. Keil
Wilkins, J. R. (1974). Pressure transduces method for measu zing gas prodlxtion by microorganisms, .Appl. Microbid., 2Y, 1X-40.
Wiikins, J. R. (1979j. Use of Pt electrodes for the electrochemical detection of bacteria, Appl. .%v. Microbial., X,683-7.
Wilkins, J. R., Stoner, G. & Boykin, E. (1974). Microbial detection method based on sensing molecular hydrogen, AppI. Env. Microbioi., 27,949-52.
Wilkins, J. R., Young, R. & Boykin, E. (1978). Multichannel electrochemical microbial detection unit, Appl. Em. Microbid., 35,214-15.
Wilkins, J. R., Grana, D. & Fox, S. (1980). Combined membrane Ritration- electrochemical microbial detection method, Appi. Env. Microbial., $8,
852-3. Wilson, M. C. & Harvey, 3. D. (1983). Twin-bexx laser veiocimeter for the
investigation of spermatozoa mobility, Biophys. J., 41, 13-21. Wingard, L. B., Shaw, C. il. 6L Castner, J., F. (1982). Bioeiectrochemical fuel
ceils, Em. Microb. Technol., 4, 137-42. Woolford, M. W. and Harvey, J. D. (1982). Light scattering studies of bull
spermatozoa. II Interaction and concentration effects, iT&..@y,s. .I., 4G, 7-16. Wyatt, P. (1973). Differential light scgttering techniques for microbiology. In:
Methods in Micr&Hogy, Vol. 8 (Ed. J. R. Norris and D. W. Ribbons), Academic Press, London, pp. 183-263.
Zabriskie, D. W. & Humphrey, A. E. (1978). Estimation of fermentrrtion biomass concentration by measuring culture fluorescence, Appl. Env. MicrobioZ., 35,337-43.
Zabriskie, D. W., Airniger, W. B. 8z EIumphrey, A. E. (1974). Computer Appiications in Fermentation Technology, GBF Monograph Series, No. 3, Veriag Chemie, Weinheim, pp. l-15.
Zzfari, Y. & Marlin, W. (1977). Comparison of bactometer micr.obiall moni- toring system with conventional methods for detectior: of microorganisms in urine specimens, J. Clin. Microbial., 5,545-7.
Zimmermann, R. (1980). Microscopical determination of microbial biomass, Abstr. 2nd int. Symp. Microbial Ecology, Warwick, p. 175.
Zimmermann, U. (1982). Electric field-mediated fusion and related electrical phenomena, Biochim. Biophys. Acta, 494,227.-77.
Zimmermann, U., Schulz, J. & Piiwat, G. (1973). Transceliuiar ion flow in E.co2i and electrical sizing in bacteria, Biophys. J., 3.3, iOO5-12.
Zimmermatin, U., Groves, M., Schnabi, H. & Piiwat, G. (1980). Development of a new Cotilter Counter system: Measuxment of the volume, internal conductivity and dielectric breakdown of a single guard cell protopiast of Vicia faba, J. Membrane Bid., 52,37-50.
Zimmermann, U., Scheurich; R., Pilwat, G. $r Benz, R. (1981). Cells with manipulated functions: New perspec+- E + -s for ceil biology, medicine and tech- nology, Angew. Chem. Znt. Ed., 20,32%1..
Zoond, A. (1927). The interpretation of changes in the electrical resistance accompanying the death of bacterial cei!s, 3. Bacteria!. , 14,279-86.