
The estimate of regional balances of payments in Croatia
44
The estimate of regional balances of payments in Croatia PETAR FILIPIĆ, PhD* Article** JEL: R10, E31, E42 doi: 10.3326/fintp.40.1.3 * The author is grateful to two anonymous reviewers, as well as his colleagues Nenad Starc and Dražen Koska, for their useful comments and suggestions. ** Received: October 12, 2015 Accepted: December 13, 2015 Petar FILIPIĆ University of Split, Faculty of Economics, Cvite Fiskovića 5, 21000 Split, Croatia e-mail: [email protected]
Transcript of The estimate of regional balances of payments in Croatia

The estimate of regional balances of payments in Croatia
PETAR FILIPIĆ, PhD*
Article**JEL: R10, E31, E42doi: 10.3326/fintp.40.1.3
* The author is grateful to two anonymous reviewers, as well as his colleagues Nenad Starc and Dražen Koska, for their useful comments and suggestions.
** Received: October 12, 2015 Accepted: December 13, 2015
Petar FILIPIĆ University of Split, Faculty of Economics, Cvite Fiskovića 5, 21000 Split, Croatiae-mail: [email protected]

petar filipić:
the estim
ate of r
egio
na
l ba
lan
ces o
f paym
ents in c
ro
atiafin
an
cia
l theo
ry an
d pr
ac
tice
40 (1) 85-128 (2016)
86 abstractNeither the region, as part of the state, nor regional development has occupied the centre of attention in the theory of international trade. There are several reasons, both theoretical and methodological, as well as entirely practical, including the want of any adequate statistics, particularly those necessary for the construction of Croa-tian regional balances of payments. Accordingly, there are several objectives to this work. After the introduction in which reference is made to the limitations of the run-ning of individual regional economic policies, comes a chapter in which the content of an ideal regional balance of payments is defined. On the way from the ideal to the objective content of regional balances of payments, that is, one reflecting the avail-able data, many methodological problems had to be solved and suitable statistics set up. In the sequel, the analysis of the balances of payments reveals a whole scale of regions that are negative or positive in terms of foreign currency. Although the quan-tities of the individual balances and items are interesting in themselves, it is impor-tant to understand that the different regional exposures to monetary policy possibly require a selective approach from economic policy. At the end, making use of the regional balances of payments, the influence of the depreciation of the kuna on the gross domestic product of the regions is analysed. It is established that in some hy-pothetical depreciation, if foreign currency transactions were treated ceteris paribus in relation to other economic aggregates, there would be important gains and losses, which would lead to ever greater developmental inequality in Croatia.
Keywords: region, balance of payment, exchange rate, developmental disparities, Croatia
1 IntRoDUctIon, oR, natIonal anD ReGIonal econoMIes anD econoMIc PolIcIes
When in Croatia in discussions of given economic problems, the terms metropolis and province are used as indicators of geography and development, only a little charge is necessary for arguments to be produced saying that those in the province would find it better if they managed their own economy.1 At that moment the tone of voice becomes sharper, the province is less developed than the national aver-age. And then, an octave higher still, the provinces are isolated in every sense with all the consequences entailed. After that into the discussion an argument is ad-duced that will not brook criticism, that the region is characterised by a high envi-ronmental sensitivity, which sometimes moves the interest of investors away from these areas. At the end, to the sound of fist on table, everything is top-down, in-stead of allowing something in the management approach that is bottom-up.
Then the region, irrespective of the internal dissents and divisions, is imagined as an economic entity that is in many elements like a little state, with an open econ-omy, on which exogenous factors have a strong and yet not a crucial impact. It is interesting that regional theory and international trade theory have often dealt with
1 For more on this see Filipić (2006).

petar filipić:
the estim
ate of r
egio
na
l ba
lan
ces o
f paym
ents in c
ro
atiafin
an
cia
l theo
ry an
d pr
ac
tice
40 (1) 85-128 (2016)87the similarities and differences of the national economy and a smaller and more or
less isolated part of it, the region.
If this theoretical framework is adjusted to the special requirements of the Croa-tian economic scene, but not only the Croatian (Filipić and Grčić, 2002; Capello and Nijkamp, 2009) the following can be observed:
– the regions are at different stages of development,– regional economies are more open than the national economy,– the economy of the region is more closely connected with the economies of
other regions within the national economy than different national economies are with each other,
– a poorer economic structure makes a regional economy sensitive to varied measures of economic policy.
In addition, regional specificities necessitate different forms of regional develop-ment policy, for:
– some of the regions are more less isolated from information,– some of the regions are characterised by high environmental sensitivity,– they have different urban structures (Barca et al., 2012), and also– they have various patterns of innovation (Alderman and Davies, 1990; Abreu
et al., 2008).
The recent global economic crisis made the discussion about the specific features of European regional economies very topical. Two aspects are in the centre of at-tention (Camagni, 2015). In member states of the monetary union who by acces-sion to the union were reduced, as it were, to the status of region, the impossibility of a devaluation of the currency in the event of a negative balance of trade in-creased the exposure to the crisis and deepened the social differences more strongly in the more weakly developed regions. In addition, the policy of austerity gener-ated asymmetrical effects that in the situation of reduced public spending hit the more weakly developed regions dependent on public transfers and internal de-mand more strongly, and the rise of interest rates is reflected on the reduction of investment, which is particularly visible in industrial regions.
What is particularly important is that there are constraints on the economic policy measures that the region had in their armoury to deal with their own economic problems (Filipić, 2000). This refers to all economic policies, particularly the most important, fiscal and monetary. Rules of the common national fiscal policy apply at the regional level. Although we have seen various kinds and strengths of fiscal decentralisation, the most productive budgetary revenues are always in the hands of the central (economic) policy. The region is part of the area of the com-mon currency in which the money supply is controlled by the central bank, which means that not even in monetary policy is it possible for it to seek instruments and measures to govern its own development (Filipić, 2001). However, this does not mean that these themes should be removed from the purview of research.
petar filipić:
the estim
ate of r
egio
na
l ba
lan
ces o
f paym
ents in c
ro
atiafin
an
cia
l theo
ry an
d pr
ac
tice
40 (1) 85-128 (2016)
88 An important and very topical segment of economic policy is the regulation of rela-tions with foreign countries. Foreign trade policy and price policy are directly inter-woven with monetary and foreign exchange policies, and then, via a multiplier, with other policies, so as ultimately to produce the most favourable result for the na-tional economy. All of this in the annual statement is entered in the balance of trade of the state, which represents a systematic representation of the value of the eco-nomic transactions of (Croatian) residents with foreign countries in a given period.
In most countries, regional balances of payments are not constructed, and this is the case with Croatia as well. Since 2012, data concerning the imports and exports of the counties have not been reported, although this had happened in an orderly man-ner for fifty years previously. And the current situation will certainly continue, for contemporary monetary theory, instead of addressing the regions, prompted by the monetary issues in the euro area, has reaffirmed and improved (Dellas and Taclas, 2009; Cesarano, 2006) the almost forgotten theory of optimal currency areas (Mun-dell, 1963). Nevertheless, even alongside these important theories, some entirely mundane questions will continue to look for answers. Like the following, con-verted into the case study at the end of this article: to what extent does a change in the exchange rate for the kuna affect regional developmental disparities in Croatia?
An attempt will be made to arrive at answers to these questions with the help of the regional balances of payments of the Croatian regions and countries constructed for the purpose of this analysis.
2 tHe balance of PaYMents anD ReGIonal PossIbIlItIes anD IMPossIbIlItIes
Every textbook on international economics or macroeconomics on its numerous pages will list everything about the concept and the structure of the balance of payments, the techniques of the accounts that are published in this balance, and will devote most of its space to the policy of balancing the balance of payments (for example, Babić and Babić, 2008). In the many methodological documents that are usually published by the central banks (for Croatian by the CNB, Annual Reports) there are definitions of every position of the balance sheet and listings of the residents who are bound to give the building elements of the balance of pay-ments to the central bank and the statistics office are provided. In line with the universally accepted theory, and with the conviction that all levels lower than the national are unimportant for macroeconomic policy, never, ever, in all these books and implementation documents are there mentions of the balance of payments of the smaller territorial units. In truth, in academic articles regional balances of pay-ments are mentioned, in three of their aspects: (a) when regions are understood to mean states that belong to economic, political or geographical groupings; (b) in the context of debates about the theory of optimal currency areas, and (c) when it is being proved that discussions of regional balances of payments are actually un-necessary (for example, Ramos, 2006) and the discussion is directed to the re-gional balances of current transactions (Ramos, 2007).

petar filipić:
the estim
ate of r
egio
na
l ba
lan
ces o
f paym
ents in c
ro
atiafin
an
cia
l theo
ry an
d pr
ac
tice
40 (1) 85-128 (2016)89So the theme of regional balances of payments is not at all on the agenda, either
of theory or of practice. The logical questions arises: whence the interest in draw-ing up Croatian regional balances of payments?
Once a year, each year, Croatian exporters meet (Brnić, 2015). Tirelessly, they re-peat their demand for a correction of the kuna exchange rate. Upwards, of course, for, and here one has to agree with them, export is supposed to exert a positive ef-fect on the whole of the economy. But the effects of this requested depreciation on the rest of the participants in economic life are not mentioned, nor is there any word of importers, for example. Several times a year, each year, debtors with loans de-nominated in a foreign currency or in kuna with a currency clause get together (Gatarić, 2015) who, logically, want the exchange rate not to be altered, or if it has to be, then to a lower level, the level of a few years back. Nor does this interest group pay any attention in its exchange rate calculations to the others; any mention of foreign currency deposits is for them anathema. It is important for the topic of this article, that both of them, and all others, live and make a living in a very con-crete space, in the regions, in the counties, and in many ways share the destinies of their own economic surrounding. Will a change in the exchange rate of the domes-tic currency improve or damage the economic situation in the region or county? Will a positive different of regional foreign currency inflows and outflows lead to a great income per capita of the region and a small number of unemployed? To find out, it is necessary to start off from analyses that ultimately, outside the scope of this work, can result in adequate measures of economic policy, and an appropriate analytical apparatus consists of the regional balances of payments.
It is the general government sector at all of its levels that makes the fundamental difference between the national and the regional balances of payments (sectorisa-tion according to European System of National and Regional Accounts, ESA, EC, 2013). It does not exist in the Croatian regional balances of payments that will be presented below. It is possible, according to some key (for example the structure of GDP or tax revenues) to divide state transfers and government loans into regions/counties, but in this case the regional balances of payments would to a great extent (because of the large aggregates of government sources and the use of the funds) lose their specificities. All other residents from the national balance of payments are also there in the regional: (1) non-financial corporations, (2) financial corpo-rates (excluding monetary institutions), (3) households, and (4) foreign countries.
Looked at in terms of the narrower balances that make up the balance of payment (table 1), the balance of current transactions (save for government transfers) is in its content the same for the national and the regional level. The difference is only in the geographical scope. All transactions that are conducted in the goods, service and transfer segment in a foreign currency or in kuna equivalent are listed here. Naturally, this makes up a difference from the regional corporate accounts and the kuna inter-regional transactions are treated as trade of a region with “abroad”.

petar filipić:
the estim
ate of r
egio
na
l ba
lan
ces o
f paym
ents in c
ro
atiafin
an
cia
l theo
ry an
d pr
ac
tice
40 (1) 85-128 (2016)
90
Ta
bl
e 1
C
onte
nt o
f the
bal
ance
of p
aym
ents
nat
iona
l lev
el –
cro
atia
Reg
iona
l or
coun
ty le
vel
cur
rent
acc
ount
cur
rent
acc
ount
Deb
itC
redi
tD
ebit
Cre
dit
a. G
oods
and
serv
ices
a. G
oods
and
serv
ices
1. G
oods
impo
rts1.
Goo
ds e
xpor
ts1.
Goo
ds im
ports
1. G
oods
exp
orts
Goo
ds b
alan
ceG
oods
bal
ance
2. S
ervi
ces i
mpo
rts2.
Ser
vice
s exp
orts
2. S
ervi
ces i
mpo
rts2.
Ser
vice
s exp
orts
2.1.
Tou
rist s
pend
ing
abro
ad2.
1. S
pend
ing
of fo
reig
n to
urist
s inl
and
2.1.
Tou
rist s
pend
ing
abro
ad2.
1. S
pend
ing
of fo
reig
n to
urist
s inl
and
2.2.
Oth
er se
rvic
es fr
om a
broa
d2.
2. O
ther
serv
ices
sold
abr
oad
2.2.
Oth
er se
rvic
es fr
om a
broa
d2.
2. O
ther
serv
ices
sold
abr
oad
Serv
ices
bal
ance
Serv
ices
bal
ance
Bal
ance
of g
oods
and
serv
ices
Bal
ance
of g
oods
and
serv
ices
b. I
ncom
e an
d cu
rren
t tra
nsfe
rsb
. Inc
ome
and
curr
ent t
rans
fers
3. T
rans
fers
abr
oad
3. T
rans
fers
from
abr
oad
3. T
rans
fers
abr
oad
3. T
rans
fers
from
abr
oad
3.1.
Rem
ittan
ces o
f for
eign
wor
kers
em
ploy
ed in
land
3.1.
Rem
ittan
ces o
f dom
estic
wor
kers
fr
om a
broa
d3.
1. R
emitt
ance
s of f
orei
gn w
orke
rs
empl
oyed
inla
nd3.
1. R
emitt
ance
s of d
omes
tic w
orke
rs
from
abr
oad
3.2.
Pen
sion
s pai
d to
fore
igne
rs3.
2. P
ensi
ons o
f dom
estic
resi
dent
s fr
om a
broa
d3.
2. P
ensi
ons p
aid
to fo
reig
ners
3.2.
Pen
sion
s of d
omes
tic re
side
nts
from
abr
oad
3.3.
Oth
er p
rivat
e tra
nsfe
rs to
fo
reig
ners
(int
eres
t and
div
iden
ds)
3.3.
Oth
er p
rivat
e tra
nsfe
rs fr
om
abro
ad (i
nter
est a
nd d
ivid
ends
)3.
3. O
ther
priv
ate
trans
fers
to
fore
igne
rs (i
nter
est a
nd d
ivid
ends
)3.
3. O
ther
priv
ate
trans
fers
from
ab
road
(int
eres
t and
div
iden
ds)
3.4.
Gov
ernm
ent t
rans
fers
abr
oad
3.4.
Gov
ernm
ent t
rans
fer r
even
ues
Bal
ance
of c
urre
nt tr
ansf
ers
Bal
ance
of c
urre
nt tr
ansf
ers
3.5.
Com
pens
atio
ns to
em
ploy
ees
3.5.
Com
pens
atio
ns to
em
ploy
ees
3.5.
Com
pens
atio
ns to
em
ploy
ees
3.5.
Com
pens
atio
ns to
em
ploy
ees
3.6.
Inco
me
from
FD
I in
the
dom
estic
ec
onom
y3.
6. In
com
e fr
om F
DI a
broa
d3.
6. In
com
e fr
om F
DI i
n th
e do
mes
tic
econ
omy
3.6.
Inco
me
from
FD
I abr
oad
3.7.
Inco
me
from
por
tfolio
inve
stm
ent
3.7.
Inco
me
from
por
tfolio
inve
stm
ent
3.7.
Inco
me
from
por
tfolio
inve
stm
ent
3.7.
Inco
me
from
por
tfolio
inve
stm
ent

petar filipić:
the estim
ate of r
egio
na
l ba
lan
ces o
f paym
ents in c
ro
atiafin
an
cia
l theo
ry an
d pr
ac
tice
40 (1) 85-128 (2016)91
nat
iona
l lev
el –
cro
atia
Reg
iona
l or
coun
ty le
vel
3.8.
Inco
me
from
oth
er in
vest
men
ts3.
8. In
com
e fr
om o
ther
inve
stm
ents
3.8.
Inco
me
from
oth
er in
vest
men
ts3.
8. In
com
e fr
om o
ther
inve
stm
ents
Bal
ance
of i
ncom
eB
alan
ce o
f inc
ome
Cap
ital a
nd fi
nanc
ial a
ccou
ntC
apita
l and
fina
ncia
l acc
ount
Ass
ets
Liab
ilitie
sA
sset
sLi
abili
ties
c. l
ong-
term
cap
ital
c. l
ong-
term
cap
ital
4. F
DI a
broa
d4.
FD
I fro
m fo
reig
n co
untri
es4.
FD
I abr
oad
4. F
DI f
rom
fore
ign
coun
tries
5. P
rivat
e in
vest
men
ts in
secu
ritie
s ab
road
5. P
rivat
e fo
reig
n po
rtfol
io
inve
stm
ents
in th
e co
untry
5. P
rivat
e in
vest
men
ts in
secu
ritie
s ab
road
5. P
rivat
e fo
reig
n po
rtfol
io
inve
stm
ents
in th
e re
gion
6. G
over
nmen
t loa
ns m
ade
abro
ad6.
Gov
ernm
ent b
orro
win
g ab
road
D. s
hort
-ter
m c
apita
lD
. sho
rt-t
erm
cap
ital
7. P
rivat
e co
mm
erci
al lo
ans m
ade
to
fore
igne
rs7.
Priv
ate
com
mer
cial
loan
s rec
eive
d fr
om fo
reig
ners
7. F
orei
gn c
urre
ncy
loan
s of c
redi
t in
stitu
tions
8. P
rivat
e de
posi
ts in
fore
ign
bank
s8.
Priv
ate
depo
sits
of f
orei
gner
s in
dom
estic
ban
ks8.
For
eign
cur
renc
y de
posi
ts in
ban
ks7.
1. N
on-fi
nanc
ial c
orpo
rate
s
8.1.
Non
-fina
ncia
l cor
pora
tes
7.2.
Hou
seho
ld8.
2. H
ouse
hold
9. P
rivat
e pu
rcha
ses o
f for
eign
m
onet
ary
inst
rum
ents
9. P
rivat
e sa
le o
f mon
etar
y in
stru
men
ts to
fore
igne
rs9.
Priv
ate
purc
hase
s of f
orei
gn
mon
etar
y in
stru
men
ts
9. P
rivat
e sa
le o
f mon
etar
y in
stru
men
ts to
fore
igne
rs10
. Gov
ernm
ent l
oans
mad
e ab
road
10. G
over
nmen
t bor
row
ing
abro
adR
eser
ves a
ccou
ntB
alan
ce o
f for
eign
cur
renc
y in
flow
s and
out
flow
sA
sset
sLi
abili
ties
Fore
ign
curr
ency
out
flow
Fore
ign
curr
ency
inflo
w
Sour
ce: f
or th
e na
tiona
l lev
el, C
BS; r
egio
nal l
evel
, aut
hor.

petar filipić:
the estim
ate of r
egio
na
l ba
lan
ces o
f paym
ents in c
ro
atiafin
an
cia
l theo
ry an
d pr
ac
tice
40 (1) 85-128 (2016)
92 Everything stated about the balance of current transactions also applies to the long-term capital sub-balance in the balances of capital and financial transactions, naturally apart from the item of government loans and borrowings. All real and portfolio investments to or from foreign countries, that have their origin or desti-nation in a region, can be recorded in the regional balance of payments too.
The “domestic-foreign” criterion of the national accounts unquestioningly takes it for granted that everything inland is paid in the domestic and abroad in the foreign currency. In the regional short-term balances of capital and financial transactions that are presented here, this criterion is replaced by the “foreign currency-kuna” criterion, according to which, apart from the county location, the only essential thing is the currency involved in the transaction. All financial transactions of resi-dents in a region in foreign currency or in kuna with a currency clause are the content of this segment of the regional balances of capital and financial transac-tions. In this manner, sometimes also because of want of information, on the way from national to regional, items 7 and 8 are modified and transformed into re-gional foreign currency loans and deposits.
Finally, the reserves account. For reasons stated above (general government level) it does not exist at the regional level. Instead of reserves, in the regional balance of payments, the balance of foreign currency inflows and outflows is recorded.
As already stated, the balance of payments is a systematic representation of the values of economic transactions of residents with the rest of the world in a given period. Regional balances of payments, in the way arranged in this paper, require a new definition. They are a systematic depiction of the value of economic trans-actions of regional residents that, irrespective of whether they are with foreign countries or with domestic residents, are carried out in a foreign currency, or in the domestic currency with a foreign currency clause, in a given period. Conceived in this way, in a considerable part, they can be considered foreign currency balances.
3 soURces of Data, oR PER ASPERA AD (ReGIonal) ASTRAThere are three kinds of sources of data for the compilation of the national balance of payments: (1) reports of government institutions: the Croatian Bureau of Statis-tics (CBS), the Croatian Institute for Retirement Insurance (CIRI); (2) specialised reports of the CNB about aggregated payment transactions with foreign countries, debtor relations with foreign countries, monetary statistics and international re-serves; and (3) assessments and statistical reports conducted by the CNB. In prin-ciple, the goods balance is made by the CBS, the balance of transfers in the part relating to pensions is the task of CIRI, and the rest, the balance of services, not including tourism, and items in the balance of capital and financial transactions, pursuant to reports by residents, is aggregated by the CNB. This “in principle” means that within all the balances there are items that are either estimated or adopted from foreign sources.

petar filipić:
the estim
ate of r
egio
na
l ba
lan
ces o
f paym
ents in c
ro
atiafin
an
cia
l theo
ry an
d pr
ac
tice
40 (1) 85-128 (2016)93All these data arrive from residents who carry out business transactions with for-
eign countries. In their reports are the addresses of residents, their principal places of residence or domiciles, depending on whether legal or natural entities are con-cerned. This fact, that the location of the transaction is known, suggests the con-clusion that in some ideal statistics it would be possible without any great prob-lems to draw up regional balances of payments (or regional social accounts, in-cluding regional input-output tables). But this is not done, and some of the reasons for this, to which one has to add the high degree of centralisation of almost every-thing in people’s minds and in practice, were given in the previous chapter. For the making of regional balances of payments, then, it would be necessary to identify where the information is, to ask those who have it to reorganise it according to the counties, and where this information does not exist, to estimate it and in some cases to make use of the information of international institutions.
Here concretely are the regional data that have led to the rearrangement of the Croatian databases about the balance of payments.
Goods balance. In Croatia, for more narrowly defined territorial units, for years, balances of goods exchanges with foreign countries were drawn up. Once these units were the unions of communes, and at request it was possible to obtain the balance from a commune. Then came the counties, for which these balances were properly drawn up as well. Until 2012, the last year in this long-term series, since which time the CBS has ceased to publish them. After Croatia joined the EU and had to meet the requirements of Eurostat, the goods exchanges of the counties with foreign countries are no longer (publicly) available. Although as a member of the EU it has to meet its requirements, Croatia is still a concrete country with its own regional identity.2 Accordingly, for analytical and economic reasons as well as for those of economic policy, it would be very important to known the economic and not just the political raison d’être of the counties. Especially if the raw data do exist somewhere. It is the merchandise trade balance that temporally defined for this paper the regional balance of payments, worked out for 2012. The data, then, are not up-to-date, which partially diminishes their topicality, but since changes in the balance of payments are in a great extent the consequences of struc-tural changes, the fundamental trends still hold.
And one specific feature that stems from the great concentration of economic ac-tivities in Zagreb. The CBS data in terms of counties are obtained on the basis of the classification of firms that have exported from or imported to the county (mu-nicipality, city) in which they are registered according to the Register of Business Entities. In this manner almost 60% of the total imports of goods (and 62% of services imports) are carried out in Zagreb. This information (marked *), tells us not only about the concentration but also the earnings of importers located in
2 Members of the EU do on the whole make up regional balances of the imports and exports of goods and ser-vices. As examples, only, the UK <https://www.uktradeinfo.com/Statistics/RTS/Pages/default.aspx>, and Ger-many <https://www.bundesbank.de/.../statso_11_balance_of_payments_by_region>.
petar filipić:
the estim
ate of r
egio
na
l ba
lan
ces o
f paym
ents in c
ro
atiafin
an
cia
l theo
ry an
d pr
ac
tice
40 (1) 85-128 (2016)
94 Zagreb (and then about the employees and the paid-in tax on personal and corporate income tax), but does not provide any information about the final allocation of the imports. For this reason, for the sake of greater reality in the regional balances of payments, alternative estimates (labelled **) have been made that assign the imports of goods and services across Croatia in line with the structure of GDP. Unlike imports, regional exports are well correlated with the GDP of the regions and do not need to be corrected. For example, in that same year, 2012, the city of Zagreb accounted for 37% of Croatian exports, and 33% of GDP.
Balance of services. There are two items in this balance. The first, the tourist (2.1) is estimated at the regional level, for there are no such balances. For the income side this is done in three steps: (1) the foreign current income from foreign tourists ac-cording to spending in commercial accommodation per county is calculated as the product of the number of overnight stays by foreign tourists per county and the daily spending of tourists in commercial accommodation in euros, (2) then the for-eign currency earnings according to spending in commercial accommodation ex-pressed in percentages for the counties, and (3) the structure calculated in this way per county is multiplied by the total foreign currency earnings from tourism in the balance of payments of the Republic of Croatia for 2012. On the debit side, tourist spending of the domestic population abroad is obtained by adaptation of data about foreign spending published by the CBS and the Institute of Tourism in Zagreb. Con-ceived in this way, it relies on the methodological consideration of the position of tourism in the balance of payments of Croatia (Galinec, 2000). Sources of data used in these calculations are given in tables A7, A8 and A9 in the appendix.
The second item (2.2), services from abroad and services sold abroad is taken in its entirety from the national balance of payments with the proviso that the em-ployees of the statistics section3 of the CNB have, making use of the addresses of the residents, converted it into a regional balance of services.
Income and current transfers. Drawing up this balance at a regional level turned out to be an insuperable problem. To such an extent that there are data for not a single item of transfers and earnings in the regional balances of payments. For example, information about the foreign currency remittances of workers abroad (3.1) are (in spite of the order of the CNB that they are reported on the regulation forms) partial, for the majority of foreign currency earnings are personally picked up abroad. At the national level the World Bank helps, for with the help of the IMF it draws up each year an estimate of foreign currency remittances for most coun-tries in the world. For Croatia in 2012 this came to almost 1.1 billion euros.4
In the case of pensions (3.2) the story is a bit different, but the outcome for the regional balances of payments is just as unsatisfactory. In the official statistical
3 Thanks of the author to employees in the Statistics Sector of the CNB for their expertise, patience and good will.4 Available at: <http://data.worldbank.org/indicator/BX.TRF.PWKR.CD.DT>.

petar filipić:
the estim
ate of r
egio
na
l ba
lan
ces o
f paym
ents in c
ro
atiafin
an
cia
l theo
ry an
d pr
ac
tice
40 (1) 85-128 (2016)95records of the CIRI for example, on December 31, 2014, there were 153,721 ben-
eficiaries whose pensions were defined by the application of international social security agreements, the average pension coming to 742.38 kuna. This works out to an annual sum of almost 1.4bn kuna or 180 million euros. In the number of 153,721 beneficiaries of these pensions, users whose pensions are sent abroad and to the Republic of Croatia are included. For the pensions that the CIRI pays abroad in the database of the beneficiaries of pensions there is no information about the municipality of origin from which it would be possible to list the data per county, only the foreign address of the residence of the beneficiary as reported to the CIRI. On the other hand, there is also no information about beneficiaries of pensions or the pension receipts that have their residence in the Republic of Croatia but who receive their pensions from abroad, for the payment from abroad is made directly into the bank account of the beneficiary, and not through the CIRI.
Undoubtedly, the regional balances of payments would be more realistic if foreign currency remittances and pensions were included in them. However, these two items, in the sum total of about 1.3 million euros make up less than 3% of the total foreign currency inflows of the regional balances of payments of about 42 million euros, which means that, after all, the results obtained have a high level of reliability.
Capital and financial transactions. As is done in the national balance of payments, in the regional balances of capital and financial transactions, all transactions are divided into short- and long-term. As for long-term transactions, for private in-vestments in securities abroad and private foreign portfolio investments at home (item 5 in table 1) there are no data for levels below the national. When direct in-vestment (item 4) is concerned, the CNB has information about foreign invest-ment in the country and also for investments from the country abroad. The meth-odology for foreign direct investment in the regional balances of payments fol-lows the national methodology,5 with the proviso that here too the statistics sector of the CNB excelled itself, converting for the purposes of this paper national into county-level data. Data about foreign investments are harmonised with the most recent statistical requirements (BPM6) of the EU, which has adopted the method-ology of the IMF (IMF, 2009).6
The short-term capital segment in the regional balance of capital and financial transactions basically records loans and deposits in the same way as in the na-tional balance of payments. However, not only are there different levels of geo-graphical coverage, but there is an important difference in content. At the regional level all foreign and domestic loans (item 8) and deposits (item 7) are compre-hended if the transaction is executed in a foreign currency or in kuna with a for-eign currency clause. For private sales of monetary instruments (item 9), there are no data at a level lower than the national.
5 Available at: <http://www.hnb.hr/statistika/strana-ulaganja/h-info-nova-metodologija.pdf>.6 Detailed explanations of the introduction of BPM6 (Assets and Liability Principle) instead of BPM5 (Direc-tion of Investment Principle) at Škudar (2014).
petar filipić:
the estim
ate of r
egio
na
l ba
lan
ces o
f paym
ents in c
ro
atiafin
an
cia
l theo
ry an
d pr
ac
tice
40 (1) 85-128 (2016)
96 Reserves account. The sum of the balance of current transfers and capital transac-tions in the national balance of payments is equal to the changes in reserves. Al-though in the regional balances of payments, conceived for this paper, the balance of all transactions expressed in the balances of current and capital transactions is shown, no reserves account, as final closing of the balance of payments, exists, for there is no need to cover the temporal gap between foreign currency earnings and expenses.
The data that were available determined the final appearance of the regional bal-ances of payments. Together with the amounts of the final items, the total bal-ances for all the countries are show in table 2 below.
4 ResUltsDisaggregation of the items of the national balance of payments according to the regional sample reveals to us the volume of transactions that the regional level carries out in foreign currency (or in kuna equivalent). As already pointed out, this is a kind of foreign currency balance sheet of the counties. But unluckily the data refer only to 2012, because there are no more recent figures for some important items (exports and imports), and to go back into the past, which would result in better quality conclusions, goes beyond the physical capacities of an individual. Nevertheless, the data gathered and processed for the one year analysed do throw light on the intra-Croatia foreign currency image which, in its basic aggregates and structure, holds good today too.
Some important information is contained in table 2. Above all, that concerning the total volume of transactions. The counties, together, in 2012 carried out foreign cur-rency transactions that almost reach the level of total Croatian GDP. In figures, that year Croatian GDP came to about 44 million euros, and foreign currency transac-tions on the outflow side came to 39.5 million euros (about 90% of GDP) and on the inflow side about 42 million euros (about 96% of GDP). These are very important resources, then, which can, in somewhat different approaches to the decentralisation of policy and economic policy, affect the development of the regional level.
The consolidated county balance is positive: foreign currency inflows are greater than outflows. The balance of 2.6 billion euros says that the foreign currency out-flows are almost 7% lower than the inflows. Naturally, here it has to be said that in the regional balance of payments there are no transfers and earnings, as there are not in general government, its sources and uses, which would as explained in chapter 2, have an effect on this balance.
Looked at in terms of structure, the real sector shown in the balance of current transactions on the debit accounted for 47.3% and on the credit side 43.9% of all transactions covered by the consolidated balance. The preponderance is then on the side of capital and financial transactions. In consequence, of which we are becom-ing fully cognisant today, the exposure of the economy and of households to for-eign currency risk on the basis of transactions with the banking system is great.

petar filipić:
the estim
ate of r
egio
na
l ba
lan
ces o
f paym
ents in c
ro
atiafin
an
cia
l theo
ry an
d pr
ac
tice
40 (1) 85-128 (2016)97Table 2
Consolidated balance of payments of all the counties in 2012, in millions of euros
consolidated counties balance of paymentscurrent account
Debit CreditA. Goods and services
1. Goods imports 16,147.1 1. Goods exports 9,605.7Goods balance 6,541.42. Services imports 2,526.7 2. Services exports 8,890.32.1. Tourist spending abroad 1,016.5 2.1. Foreign tourist spending
inland 6,858.7
2.2. Other services from abroad 1,510.2 2.2. Other services inland 2,031.6Services balance 6,363.6Goods and services balance 177.8
Capital and financial transactionsAssets Liabilities
C. Long-term capital4. FDI abroad -63.5 4. FDI from abroad 1,109.2Long-term capital balance 1,172.8
D. Short-term capital8. Foreign currency deposits in
banks 20,883.27. Foreign currency loans of
credit institutions 22,518.88.1. Non-financial corporate 2,291.0 7.1. Non-financial corporates 9,265.58.2.Households 18,592.2 7.2. Households 13,253.4Short-term capital balance 1,635.6Balance of capital and financial transactions 2,808.4
Balance of foreign currency inflows and outflows – all countiesForeign currency outflow 39,493.5 Foreign currency inflow 42,124.0Foreign currency inflow and outflow balance 2,630.6
Finally, the sub-balances. The imports of goods are greater than the exports. Ser-vices imports are smaller than exports, both in tourism and in other services; for-eign investments are greater than Croatian investments abroad, foreign currency loans to the non-financial sector are four times the size of the foreign currency deposits of the same sector; foreign currency deposits of households are 40% greater than their loans in foreign currency. All of these relations are on the whole familiar from CBS statistics about the balance of payments of the country.
What is not known is the territorial distribution of these balance of payments items and their balances. The data in table 3 distribute the figures in the last row of table 2 across the Croatian space.

petar filipić:
the estim
ate of r
egio
na
l ba
lan
ces o
f paym
ents in c
ro
atiafin
an
cia
l theo
ry an
d pr
ac
tice
40 (1) 85-128 (2016)
98 Table 3The balance of regional balances of foreign currency (RFCBP) and estimated balance (ERFCBP) inflows and outflows in 2012, according to NUTS 2, macroregions and counties in millions of euros
nUts 2, macroregion, county Regional balanceRfcbP* eRfcbP**
zagreb or central croatian macroregionZagreb County -283.5 -17.8Krapina-Zagora County 113.7 70.5Sisak-Moslavina County 390.3 124.0Karlovac County 40.7 -170.2Varaždin County 549.6 503.9Koprivnica-Križevci County 256.4 18.1Bjelovar-Bilogora County 60.6 -133.3Međimurje County 21.6 -47.1total excl. zagreb 1,148.8 348.0City of Zagreb -4,685.1 247.0zagreb macroregion total -3,536.3 595.1osijek or slavonian macroregionVirovitica-Podravina County 121.3 -5.9Požega-Slavonia County 63.0 -54.7Brod-Posavina County 94.8 -66.0Osijek-Baranja County 752.8 181.1Vukovar-Srijem County 139.5 -72.7osijek macroregion total 1,171.3 -18.2nUts 2 continental croatia -2,365.0 576.9Rijeka or Primorje-Gorski Kotar macroregionPrimorje-Gorski Kotar County 1,064.3 132.7Lika-Senj County 174.0 30.5Istria County 1,840.2 1,512.2Rijeka macroregion total 3,078.5 1,675.4split or Dalmatia macroregionZadar County 732.0 351.2Šibenik-Knin County 1,001.1 920.9Split-Dalmatia County -453.0 -1,159.8Dubrovnik-Neretva County 637.0 265.9split macroregion total 1,917.0 378.2nUts 2 adriatic croatia 4,995.5 2,053.7Rc total 2,630.6 2,630.6
Table 3, like all the subsequent tables, contains two variants of the balance of the balance of foreign currency inflows and outflows of the more closely defined ter-ritorial units. In the first, labelled (*), data per county are obtained on the basis of the classification of firms that have imported or exported goods and/or services into or out of the county (municipality, city) in which they are registered according to the registry of business entities. This is the usual approach in official statistics, hence the this variant of the balance has no E in its title. The second variant, marked with (**), estimates (hence the E) the imports of goods and services per county by

petar filipić:
the estim
ate of r
egio
na
l ba
lan
ces o
f paym
ents in c
ro
atiafin
an
cia
l theo
ry an
d pr
ac
tice
40 (1) 85-128 (2016)99dividing the total Croatian imports according to the country structure of GDP. Such
a distribution can be justified by a direct import coefficient that is calculated by comparing import with GDP. Other sub-balances (tourism, long-term and short-term capital) are the same in both versions of the regional balances of payments.
Apart from data for the twenty counties and Zagreb City, regional aggregates are also produced in table 3. In line with European criteria, Croatia is divided into two NUTS 2 regions, Continental Croatia and Adriatic Croatia (Regional Develop-ment of Croatia Law, OG 147/14) and also according to the division into regions from the Croatian Encyclopaedia (LZMK 2013-2015) into four macro-regions, those of Zagreb, Osijek, Rijeka and Split.
All sources, as well as the methodology of the alternative balances, and for the definitions of the regional units, are given along with the tables in the appendix.
In the official version (RFCBP*), all the counties, except for the Zagreb County, Zagreb City and Split-Dalmatia are positive with respect to foreign currency. The import of goods is the item that conditions this distribution of success. The very low coverage of goods imports by exports has brought the whole of the Zagreb macroregion, and even the NUTS 2 Continental Croatia, to a negative balance. In the Split-Dalmatia County, the negative balance of foreign currency inflows and outflows is contributed to not only by the import-export deficit but also by the very large discrepancy of loans and deposits.
graph 1Regional balances of foreign currency inflows and outflows* per county in 2012
The picture will be different and, it seems, more realistic if imports are divided according to GDP criteria. This criterion brings imports closer to their ultimate purpose and is more accurate than records according to the address of the import firm. To answer the question just how much more accurate, one would have to have data of the importers (mainly from Zagreb) about the ultimate destination of the goods imported.
<=0>0

petar filipić:
the estim
ate of r
egio
na
l ba
lan
ces o
f paym
ents in c
ro
atiafin
an
cia
l theo
ry an
d pr
ac
tice
40 (1) 85-128 (2016)
100 Instead of the three counties, in this estimated version of regional balances of pay-ments a negative balance is shown by ten of them, with the proviso that the City of Zagreb is no longer among them. It has delivered its negative balance to the surroundings and to the East, to Slavonia. The consequence of this transformation of imports is that both the NUTS 2 regions and the three macroregions, save for the Osijek, are foreign currency in the black.
graph 2Balance of regional balances of foreign currency inflows and outflows** per county, 2012
County statistics that reveal foreign currency positives and negatives, in which some have trading or capital surpluses, and some deficits, suggest a very ordinary question: is it good to be in the black and bad to be in the red? The answer to this question takes us to three situations: (a) a theoretically desirable balance, which from a series of (mainly structural) reasons is never achieved, particularly at the regional level, where the greater openness is positively correlated with opportuni-ties for development; (b) a positive balance, which up to a certain surplus encour-ages economic development and does not invite criticisms from the surroundings; and (c) a negative balance, which with every greater percentage invites every greater balance of payments problems. Although at first glance the selection is simple one should not forget that we are now inside economic theory and practice, in which the obvious often deceives. Although the positive is good and the nega-tive is bad, for a final estimate of success, the balance of payments of each re-gional unit has to be located in its national and regional economic framework, in the context of the economic analysis, so that we can give a more accurate answer to the previous question. In essence, this is not the task of this work. But for re-gional balances of payments not to be just a statistical display and live in isolation, they are correlated with GDP below.
<=0>0

petar filipić:
the estim
ate of r
egio
na
l ba
lan
ces o
f paym
ents in c
ro
atiafin
an
cia
l theo
ry an
d pr
ac
tice
40 (1) 85-128 (2016)101Table 4
Total volume of foreign currency transactions (TVFCT) per unit of GDP and per capita, according to NUTS 2, macroregions and counties in 2012, Croatia = 100
nUts 2, macroregion, county tVcft*/GDP
UoDt**/GDP
tVcft */per capita
tVcft **/ per capita
zagreb or central croatian macroregionZagreb County 99.6 93.8 75.8 71.4Krapina-Zagora County 87.9 90.7 53.1 54.8Sisak-Moslavina County 63.7 74.1 49.7 57.8Karlovac County 65.5 77.3 48.0 56.5Varaždin County 98.5 100.2 79.4 80.7Koprivnica-Križevci County 58.6 70.8 52.0 62.8Bjelovar-Bilogora County 63.1 76.0 41.8 50.3Međimurje County 88.3 92.2 72.5 75.7total excl. zagreb 81.7 86.1 62.0 65.2City of Zagreb 113.6 95.5 205.7 172.9zagreb macroregion total 100.8 91.7 116.9 106.4osijek or slavonian macroregionVirovitica-Podravina County 63.3 76.5 37.8 45.7Požega-Slavonia County 68.9 82.5 40.3 48.2Brod-Posavina County 75.7 85.1 42.8 48.1Osijek-Baranja County 68.9 81.5 54.0 63.8Vukovar-Srijem County 59.6 70.4 34.5 40.7osijek macroregion total 67.7 79.5 44.4 52.2nUts 2 – continental croatia 94.8 89.5 96.6 91.2Rijeka or Primorje-Gorski Kotar macroregionPrimorje-Gorski Kotar County 86.9 99.8 110.7 127.2Lika-Senj County 77.2 97.2 57.4 72.2Istria County 138.5 145.3 170.9 179.2Rijeka macroregion total 106.1 117.0 128.4 141.6split or Dalmatia macroregionZadar County 113.5 128.2 91.0 102.7Šibenik-Knin County 168.1 173.2 126.9 130.8Split-Dalmatia County 103.3 113.9 79.3 87.5Dubrovnik-Neretva County 122.0 138.6 117.2 133.1split macroregion total 116.3 128.1 93.1 102.6nUts 2 – adriatic croatia 111.2 122.6 107.0 117.9Rc total 100.0 100.0 100.0 100.0
It is usual to measure the inclusion of some economy in international change by the share of imports and/or exports of goods and services in GDP. This is how economies are ranked and compared. Because of the heterogeneous structure of the balance of payments, it includes the funds, and so it is only exceptionally compared with GDP. Since the regional balances of payments presented in this paper are very specific, the arguments were set out on the preceding pages, and since the natural need of researchers is to compare and rank, the indicator of inclu-sion of given regional units in Croatian foreign currency transactions (at home and abroad) is defined. In the indicator the total volume of foreign currency transac-

petar filipić:
the estim
ate of r
egio
na
l ba
lan
ces o
f paym
ents in c
ro
atiafin
an
cia
l theo
ry an
d pr
ac
tice
40 (1) 85-128 (2016)
102 tions of regional units (TVFCT), those on the inflow and outflow side, is first of all compared with the GDP of these units, and then with the Croatian average. In the result is the index of inclusion that locates (and ranks) regional units around the Croatian average. The same procedure is repeated for the second indicator, although here instead of GDP it is the populations of regional units that are placed in the denominator. Additional analytical gains would come from an indicator that would analyse foreign currency inflows and outflows separately, but this investi-gative pleasure must be reserved for some other occasion or some other analyst.
One country, two foreign currency economies. Or perhaps three, because the City of Zagreb is a story all to itself. With the honourable exception of Varaždin, all the counties in Continental Croatia are below the Croatian average in terms of the first indicator. The volume of foreign currency transactions in terms of GDP is some-where between 58 and 85% of the Croatian average. In Adriatic Croatia, only Lika-Senj County shares the same fate. All the other counties, save the Split-Dalmatia per capita, are above the Croatian and even the Zagreb average.
Per capita indicators increase the regional differences. The Osijek macroregion is just above half of the Croatian average, and the Zagreb (not including Zagreb City) hovers at two thirds of this average. While the Split macroregion according to this indicator has come down to the Croatian average, the Rijeka macroregion is a serious rival to the City of Zagreb.
As already pointed out, all these differences do not have to mean that Adriatic Croatia is richer and that it’s better to live and do business there, and that in Con-tinental Croatia all of that is worse. What the numbers do show, however, is that there is a different degree of exposure among the counties to almost all instru-ments and measures of monetary policy (exchange rate, inflation, foreign currency interventions, interest rates and so on). This would require a selective approach to monetary (and fiscal) policy, although such a demand as a whole brings an ironical or sour smile to the face of someone in charge of this policy. In favour of such a demand, although unwillingly it is sometimes necessary to look for the heaviest artillery, constitutional and statutory regulation about regional equality in which there is an insistence of the link of local and regional developmental needs with the priorities of the development of the central level and the adoption of measures for the even development of units of local and regional self-government.

petar filipić:
the estim
ate of r
egio
na
l ba
lan
ces o
f paym
ents in c
ro
atiafin
an
cia
l theo
ry an
d pr
ac
tice
40 (1) 85-128 (2016)103Table 5
Balance of sub-balances of regional balances of payments, 2012, in terms of NUTS 2, macroregions and counties in millions of euros
nUts 2, macroregion, county
trad
e in
good
sex
port
s (+)
Im
port
s (-)
trad
e in
serv
ices
earn
ings
(+)
expe
nditu
res (
-)
tour
ist ac
tivity
fore
igne
rs (+
) loc
als (
-)
Dire
ct in
vestm
ent
from
(+) t
o (-)
abro
ad
f.c.
loan
s (+)
an
d de
posit
s (-)
balance* balance** balance* balance** balance balance balancezagreb or central croatian macroregionZagreb County -864 -549 84 35 -35 128 4,049Krapina-Zagora County 42 17 -8 -27 -8 2 863Sisak-Moslavina County 205 -19 11 -31 -12 7 179Karlovac County 55 -133 4 -18 15 3 -36Varaždin County 223 218 -2 -43 -19 44 303Koprivnica-Križevci County 73 -139 4 -22 -15 6 188Bjelovar-Bilogora County -31 -200 1 -24 -12 23 79Međimurje County 97 55 -2 -29 -12 2 -64total excl. zagreb -200 -749 93 -158 -97 213 1,139City of Zagreb -6,147 -1,865 105 756 -220 753 824zagreb macroregion total -6,347 -2,614 198 597 -318 967 1,963osijek or slavonian macroregionVirovitica-Podravina County 49 -60 -0.06 -18 -8 1 80Požega-Slavonia County 33 -70 -1 -16 -8 1 38Brod-Posavina County -23 -155 15 -13 -14 3 113Osijek-Baranja County 29 -466 10 -67 -38 1 751Vukovar-Srijem County -54 -232 1 -33 -17 -8 217osijek macroregion total 33 -984 26 -147 -85 -1 1,199nUts 2 continental croatia -6,314 -3,598 224 450 -403 965 3,163Rijeka or Primorje-Gorski Kotar macroregionPrimorje-Gorski Kotar County -31 -887 131 56 1,032 106 -174
Lika-Senj County 5 -125 -0.15 -13 167 4 -2Istria County 15 -269 -4 -48 2,123 55 -349Rijeka macroregion total -10 -1,281 126 -5 3,322 165 -525split or Dalmatia macroregionZadar County 25 -345 47 37 773 12 -126Šibenik-Knin County 2 -55 100 78 319 -21 600Split-Dalmatia County -199 -841 -45 -110 1,075 46 -1,329Dubrovnik-Neretva County -46 -420 69 72 756 6 -148split macroregion total -218 -1,662 171 76 2,923 43 -1,002nUts 2 adriatic croatia -228 -2,943 297 71 6,245 208 -1,527Rc total -6,541 -6,541 521 521 5,842 1,173 1,636
A look at the balance of sub-balances in table 5 will expand the understanding and more precisely indicate the need for and direction of action. In the mosaic of positive and negative foreign currency balances there are sufficient elements for a separate study to be written about each country. Particularly if the absolute amounts of the individual items presented in the tables at the end of the paper are used as analytical material as well.

petar filipić:
the estim
ate of r
egio
na
l ba
lan
ces o
f paym
ents in c
ro
atiafin
an
cia
l theo
ry an
d pr
ac
tice
40 (1) 85-128 (2016)
104 In this place, merely a basic impression.
Something has been already said about goods trade and services trade with foreign countries from the perspective of consolidated regional balances. In this balance sheet, just as in the balance of services, a change of registration of import from the address of the firm that has implemented imports of goods and services to the poten-tial final purpose of the import has spread the negative county balances into the whole Croatian space. The foreign currency balance of tourism has without any doubt divided Croatia into two parts. The households and corporate of continual Croatia spend more on going abroad than they earn in foreign currency terms from foreign tourists. The balance of foreign investments is negative only in two counties (Vukovar-Srijem, Šibenik-Knin). And finally, the balance of foreign currency loans and deposits. Non-financial corporate show a negative balance in all counties, and the balance of households, and still more the total balance of loans and deposits of both residents, once again tells of a bipartite foreign currency and economic Croatia.
graph 3Balance of imports* (+) and exports* (-) according per county, 2012
graph 4Balance of goods exports* (+) and imports (-) per country, 2012
<=0>0
<=0>0

petar filipić:
the estim
ate of r
egio
na
l ba
lan
ces o
f paym
ents in c
ro
atiafin
an
cia
l theo
ry an
d pr
ac
tice
40 (1) 85-128 (2016)105graph 5
Balance of earnings* (+) and expenditures (-) on services per county, 2012
graph 6Balance of earnings* (+) and expenditures** (-) per county, 2012
graph 7Balance of foreign currency earnings (+) and expenditures (-) from tourism per county, 2012
<=0>0
<=0>0
<=0>0

petar filipić:
the estim
ate of r
egio
na
l ba
lan
ces o
f paym
ents in c
ro
atiafin
an
cia
l theo
ry an
d pr
ac
tice
40 (1) 85-128 (2016)
106 graph 8Balance of direct investments to (-) and from (+) foreign countries, per county, 2012
graph 9Balance of foreign currency loans (+) and deposits (-) of non-financial corporates per county, 2012
graph 10Balance of foreign currency loans (+) and deposits (-) of households per county, 2012
<=0>0
<=0>0
<=0>0

petar filipić:
the estim
ate of r
egio
na
l ba
lan
ces o
f paym
ents in c
ro
atiafin
an
cia
l theo
ry an
d pr
ac
tice
40 (1) 85-128 (2016)107graph 11
Balance of foreign currency loans (+) and deposits (-) of non-financial corporates and households per county, 2012
5 case stUDY: eXPosURe to foReIGn cURRencY RIsK, oR, tHe effects of a cHanGe In tHe eXcHanGe Rate of tHe KUna on tHe GDP of tHe ReGIons
The purpose of making a regional balance of payments is to provide a data base for the economic analysis of the effects of the foreign currency activities of the region founded on macroeconomic aggregates. Because of the meagre informa-tion base of the regional level in Croatia, only a few variables can be correlated. How vigorously some economic variable will react to the change of some other variable with which it is interdependent shows us the coefficient of elasticity. Hav-ing at our disposal information about the foreign currency transactions of the re-gions allows us to calculate GDP elasticity to changes in the exchange rate of the national currency.
In every macroeconomics textbook you can read that, with certain elasticity condi-tions, devaluation will improve the foreign trade balance. What happens if we factor into the analysis the other segments of the balance of payments? Elementary eco-nomic logic will tell us of the consequences of depreciation (or devaluation) of the domestic currency to every individual resident (Babić, 2000). Let us go in order.
The depreciation of the domestic currency will, immediately after the announce-ment of the new exchange rates, increase the value of foreign claims and claims contracted with a foreign currency clause. Earnings related to foreign currency outputs on foreign and domestic markets are increased. On the other side, that of liabilities, the costs for the procurement of raw materials and foreign equipment will be increased by the amount of the exchange rate change, and the costs of in-terest payment on foreign currency loans and loans with a foreign currency clause as well. All the necessary data for the calculation of this effect are contained in the balances of payments of the regions displayed above.
<=0>0

petar filipić:
the estim
ate of r
egio
na
l ba
lan
ces o
f paym
ents in c
ro
atiafin
an
cia
l theo
ry an
d pr
ac
tice
40 (1) 85-128 (2016)
108 Households in Croatia have more assets than liabilities, which in the event of a de-preciation of the domestic currency will result in positive effects for the assets of this sector, as compared with its liabilities. If the statistical circumstances were more favourable (if remittances from abroad and foreign pensions were not included) the positive effect of this resident in the calculation would be still more marked.
The financial sector too is powerfully involved in the matter of depreciation. For-eign currency loans and loans with a currency clause would become more expen-sive by the amount of the depreciation. Repayment instalments would be increased by the same amount. At the same time, owners of foreign currency deposit ac-counts would send their hearty thanks to the Central Bank governor who had signed the decision to depreciate.
General government does not exist in the balances of payments, and in the calcula-tion that follows this sector is not effected by depreciation. Accordingly, if only for heuristic reasons, it should be said that with this resident, foreign liabilities (par-ticularly foreign debt) are preponderant, each devaluation will increase them by the same percentage because in every payment the government has to sell kuna.
Table 6 shows the results of two calculations of a hypothetical depreciation of the kuna applied to the regional balance of payments conditions of 2012. This is the reason for the base exchange rate for the kuna being taken as 7.5172 for one euro, the average in that year. In columns 2 and 3 of the table a one-percent deprecation of the kuna is calculated, which has the significance of coefficient of elasticity of GDP on changes in the exchange rate of the domestic currency. In columns 4 and 5 come the results in the case of a ten-percent devaluation. Although the last two columns could have been omitted, a concession was made to the managers of ex-porting companies who, every year, once again demand depreciation of about that much. Here too, as in the previous calculations, the results are shown for both versions of regional balances of payments obtained by a different treatment of the allocation of the imports of goods and services.
The result is, once again, the same story. Half of the country would win by a de-preciation, half would lose. And not a random half of the counties, scattered here and there, but grouped very clearly in terms of geography and the economy. Only to prove the principle that the exception confirms the rule, there is however Međimurje, the only county that would have a positive effect expressed in the percentage of GDP in Continental Croatia, and Šibenik-Knin, the only one with a negative effect in Adriatic Croatia.
The extent to which (in the ERFCBP** version) a potential depreciation would affect the existing regional differences in development, if for a moment we leave out the City of Zagreb, is shown by the following figures. In the thirteen counties of depreciation losers, in 2012, about 49% of the population of Croatia produced about 35% of GDP. On the other hand are the seven winning counties, in which

petar filipić:
the estim
ate of r
egio
na
l ba
lan
ces o
f paym
ents in c
ro
atiafin
an
cia
l theo
ry an
d pr
ac
tice
40 (1) 85-128 (2016)10933% of the population produced 32% of Croatian GDP. There are two important
depreciation effects on regional disparities. The first, the better off, would be ad-ditionally distanced from those weakest in development; the second, if we look at them as a whole, is that if there were a ten-percent depreciation, the better off would reach the Croatian GDP average.
Table 6Effect of a depreciation of the kuna against the euro on percentage of GDP of the regions, 2012
nUts 2, macroregion, county
Difference in % GDPKuna/euro
exchange rate7.5172→7.5924 (>1%)
Kuna/euro exchange rate
7.5172→8.2689 (>10%)RfcbP* eRfcbP** RfcbP * eRfcbP **
zagreb or central croatian macroregionZagreb County -0.440 -0.333 -4.397 -3.326Krapina-Zagora County -0.071 -0.123 -0.711 -1.230Sisak-Moslavina County 0.024 -0.169 0.236 -1.694Karlovac County 0.117 -0.101 1.174 -1.005Varaždin County -0.039 -0.071 -0.395 -0.708Koprivnica-Križevci County -0.114 -0.341 -1.144 -3.410Bjelovar-Bilogora County -0.121 -0.360 -1.210 -3.596Međimurje County 0.156 0.084 1.558 0.841total excl. zagreb -0.114 -0.194 -1.138 -1.945City of Zagreb -0.431 -0.095 -4.315 -0.954zagreb macroregion total -0.303 -0.135 -3.033 -1.354osijek or slavonian macroregionVirovitica-Podravina County -0.075 -0.319 -0.747 -3.191Požega-Slavonia County -0.030 -0.281 -0.297 -2.812Brod-Posavina County -0.143 -0.318 -1.432 -3.179Osijek-Baranja County -0.305 -0.538 -3.052 -5.383Vukovar-Srijem County -0.277 -0.476 -2.769 -4.761osijek macroregion total -0.226 -0.446 -2.263 -4.456nUts 2 continental croatia -0.289 -0.191 -2.894 -1.914Rijeka or Primorje-Gorski Kotar macroregionPrimorje-Gorski Kotar County 0.365 0.124 3.647 1.242Lika-Senj County 0.457 0.088 4.575 0.875Istria County 0.964 0.840 9.642 8.397Rijeka macroregion total 0.599 0.395 5.989 3.954split or Dalmatia macroregionZadar County 0.704 0.431 7.038 4.314Šibenik-Knin County -0.236 -0.330 -2.356 -3.304Split-Dalmatia County 0.615 0.418 6.151 4.179Dubrovnik-Neretva County 0.772 0.464 7.717 4.644split macroregion total 0.557 0.338 5.572 3.385nUts 2 adriatic croatia 0.578 0.367 5.778 3.667Rc total -0.015 -0.015 -0.146 -0.146

petar filipić:
the estim
ate of r
egio
na
l ba
lan
ces o
f paym
ents in c
ro
atiafin
an
cia
l theo
ry an
d pr
ac
tice
40 (1) 85-128 (2016)
110 graph 12Positive and negative effects of a hypothetical depreciation per county, 2012
Discussion about the result of each individual county would dilute the essence of this analysis. But at least the leading results among the potential winners and losers should be brought out. In the S version of regional balances of payments, the big-gest losers are Zagreb County, City of Zagreb, Osijek-Baranja, Vukovar-Srijem and Šibenik-Knin Counties. In this version of payments balances the winners are all the Adriatic counties apart from Šibenik-Knin. In the E version, the positives are less positive, the negatives more negative, and only the City of Zagreb profits.
At the end, it is important to mention once again, that all the previous calculations hold ceteris paribus, that is, in a situation of an isolated influence of foreign cur-rency transfers on economic development. How the effects of depreciation might work if the amount of it, for example, to spill over, in its entirety, through prices, as a result of great exchange rate price elasticity, to end consumers, or, if users might not be able to pay off their loans are issues the answers to which exceed the limits of this paper.
6 conclUsIon, oR, WHo tHInKs tHat fRoM tHe anGle of foReIGn cURRencY localIsM tHe ReGIonal DIMensIon sHoUlD be DRoPPeD
It is very clear that the very mention of the regional aspect in the economy of inter-national trade arouses doubts as to the credibility of the methodological apparatus this aspect uses, and then the results based on it. After all it is semantically dubious to apply something international, between nations, then, to smaller territorial units, components of a single nation (and a single economy). If to this is added the un-questionable national monetary integrity, any efforts to build up the statistical and methodological apparatus capable of helping to give answers to many questions about the level to which the regions are involved in international goods and foreign currency flows, and the quality of that involvement, or concerning the influence of monetary policy measures on regional economies, seems futile. It would be possi-ble to carry out many analyses if one were in possession of regional corporate
<=0>0

petar filipić:
the estim
ate of r
egio
na
l ba
lan
ces o
f paym
ents in c
ro
atiafin
an
cia
l theo
ry an
d pr
ac
tice
40 (1) 85-128 (2016)111accounts in which the trade of a region with the surroundings, both domestic and
foreign, were registered. However, analysts of the regional economy of Croatia cannot do this, since quite simply such accounts are not drawn up in Croatia.
But what will happen if some analyst insists on wasting his time and attempting, what is more, to present the results of his barren attempts to the public? The public on the whole likes what is attractive. The occasional attraction, even if founded on a dubious methodological framework, can be found in this paper. The academic pub-lic, however, requires academic arguments. This public weighs and judges whether there are sufficiently strong arguments in a paper for it to be considered relevant.
Below are what, in this sense, can be found above in this paper.
Above all, the statistics that have been kept in the last sixty years about the situation of the regional Croatian economy moved along the curve of a normal distribution with a temporally precisely determined maximum. The movement was upwards, quantitatively and qualitatively, up to the moment when the first and last regional statistical bulletin was issued (CBS, 1994). Since then, there have been ever fewer regional statistics (save for the demographic), and there are none that are published and capable of being used in the making of regional balances of payments. Accord-ingly, this paper, implicitly, argues for the restoration of regional economic statis-tics to the public, for a published regional step forward by the CBS.
Secondly, about the methodology of drawing up regional balances of payments. For the compilation of these balances, the template of the national balance of payments was used, the idea being to territorialise the items, that is, distribute them over the Croatian regional units. From this point of view the ideal regional balance of pay-ments was determined without the items of general government. On the way from the ideal, because of the non-existence of all the necessary data, regional balances of payments were transformed into what is objectively possible. They became a sys-tematic depiction of the values of accessible economic transactions of regional resi-dents that, no matter whether with foreign countries or with domestic residents, were carried out in a foreign currency or in the domestic currency with a foreign currency clause in a given period. Conceived in such a way, regional balances of payments should in great part be considered foreign currency balances. The final result of the gap between theory (the ideal balance) and statistical practice (what is objectively possible) is the regional balances of payments shown in the paper, in which the balances of goods and services and the balances of capital and financial transactions are shown, while the balance of transfers and earnings, because of prob-lems with data, is omitted. One more important change happened on the way from the national to the regional balances. The criterion of national accounts “domestic-foreign” in the regional short-term balances of capital and financial transactions was replaced by the “foreign currency-kuna” criterion, according to which all financial transactions of regional residents in foreign currency or kuna with a currency clause, those abroad and those at home, then, is the content of this segment of regional bal-
petar filipić:
the estim
ate of r
egio
na
l ba
lan
ces o
f paym
ents in c
ro
atiafin
an
cia
l theo
ry an
d pr
ac
tice
40 (1) 85-128 (2016)
112 ances of capital and financial transactions. The paper, then, explicitly offers a meth-odology for drawing up the balances of payments of the Croatian regions.
Analysis of data from the regional balances of payments identifies important re-gional differences, in both consolidated balances and in each individual sub-bal-ance. However, it is pointed out in the paper that the differences do not have to mean that some county or region is wealthier or more developed than others that show worse balance of payments performance. What is stressed in the paper is that the different level of county exposure to foreign currency risk potentially re-quires a selective approach to economic policy.
For an assessment of the foreign currency (and overall international) position of individual regional units, two indicators are used. The first quantifies the involve-ment of the regions in foreign currency transactions and transactions with a for-eign currency clause; the second, used in the Case Study is the coefficient of elasticity of GDP to the kuna exchange rate. Never mind that the first identifies the strength and rate of involvement, and the second a marginal change of a variable, both of them, from the position of the foreign currency balance, indicate the pow-erful bipartite nature of the Croatian economic space, already recognised in the procedure in which Croatia was divided into Continental and Adriatic. In the event of a depreciation of the kuna, where foreign currency transactions as compared to other economic aggregates are treated ceteris paribus, important regional losses and gains would occur, which, according to the results of this analysis, would lead to a great developmental inequality in Croatia. This paper wishes to transform the attractiveness of the results obtained, irrespective of their restrictions in theory and practice, into an invitation for additional research into the influences of meas-ures of economic, and in particular monetary, policy, on regional development.
Well, that was that. Was it worth the effort? Can what has been put forward stand up to academic critiques? Even if the answers to these questions are negative, the author spent three jolly research months on them.

petar filipić:
the estim
ate of r
egio
na
l ba
lan
ces o
f paym
ents in c
ro
atiafin
an
cia
l theo
ry an
d pr
ac
tice
40 (1) 85-128 (2016)113aPPenDIX
Table a1 Area and population of RC per NUTS 2*, macroregion** and county in 2011nUts 2, macroregions* and counties of croatia
area (km²) % Population % Pop. den. (inh./km²)
zagreb or central croatian macroregionI Zagreb 3,060 5.41 317,606 7.41 103.8II Krapina-Zagora 1,229 2.17 132,892 3.10 108.1III Sisak-Moslavina 4,468 7.89 172,439 4.02 38.6IV Karlovac 3,626 6.41 128,899 3.01 35.5V Varaždin 1,262 2.23 175,951 4.11 139.4VI Koprivnica-Križevci 1,748 3.09 115,584 2.70 66.1VII Bjelovar-Bilogora 2,640 4.66 119,764 2.80 45.4XX Međimurje 729 1.29 113,804 2.66 156.1total 18,762 33.15 1,276,939 29.80 68.1City of Zagreb 641 1.13 790,017 18.44 1,232.5zagreb macroregion total 19,403 34.28 2,066,956 48.24 106.5osijek or slavonian macroregionX Virovitica-Podravina 2,024 3.58 84,836 1.98 41.9XI Požega-Slavonia 1,823 3.22 78,034 1.82 42.8XII Brod-Posavina 2,030 3.59 158,575 3.70 78.1XIV Osijek-Baranja 4,155 7.34 305,032 7.12 73.4XVI Vukovar-Srijem 2,454 4.34 179,521 4.19 73.4osijek macroregion total 12,486 22.06 805,998 18.81 64.5nUts 2 – continental croatia 31,889 56.34 2,872,954 67.05 90.09Rijeka or Primorje-Gorski Kotar macroregionVIII Primorje-Gorski Kotar 3,588 6.34 296,195 6.91 82.5IX Lika-Senj 5,353 9.46 50,927 1.19 9.5XVIII Istria 2,813 4.97 208,055 4.86 74.0Rijeka macroregion total 11,754 20.77 555,177 12.96 47.2split or Dalmatia macroregionXIII Zadar 3,646 6.44 170,017 3.97 46.6XV Šibenik-Knin 2,984 5.27 109,375 2.55 36.6XVII Split-Dalmatia 4,540 8.02 454,798 10.61 100.2XIX Dubrovnik-Neretva 1,781 3.15 122,568 2.86 68.8split macroregion total 12,951 22.88 856,758 19.99 66.1nUts 2 – adriatic croatia 24,705 43.65 1,411,935 32.95 57.15Rc total 56,594 100.00 4,284,889 100.00 75.0
* Pursuant to Article 43 of the Official Statistics Law (OG 103/03, 75/09, 52/12) the CBS deter-mines the National Classification of Spatial Units. In August 2012 the EC accepted the propos-al for the division of the RC into two NUTS 2 regions, that is, Continental and Adriatic Croatia. The use of the new classification for the purpose of the Cohesion Policy started when Croatia joined the EU, i.e. on July 1, 2013.** Regionalisation according to: Hrvatska enciklopedija, Internet edition, Leksikografski zavod Miroslav Krleža, Zagreb, 2013-2015.
Source: CBS, Census of population, households and dwellings, 2011; CBS, Statistical Bulletin, 2014.

petar filipić:
the estim
ate of r
egio
na
l ba
lan
ces o
f paym
ents in c
ro
atiafin
an
cia
l theo
ry an
d pr
ac
tice
40 (1) 85-128 (2016)
114 Table a2 GDP of the RC per NUTS 2, macroregion and county in 2012nUts 2, macroregions, counties GDP millions
of euros% Per capita
GDP in euroscroatia = 100
zagreb or central croatian macroregionZagreb 2,481 5.64 7,812 76.1Krapina-Zagora 823 1.87 6,193 60.4Sisak-Moslavina 1,380 3.14 8,003 78.0Karlovac 968 2.20 7,510 73.2Varaždin 1,454 3.31 8,264 80.6Koprivnica-Križevci 1,052 2.39 9,102 88.7Bjelovar-Bilogora 813 1.85 6,788 66.2Međimurje 958 2.18 8,418 82.1total excl. zagreb 9,929 22.59 7,776 75.8City of Zagreb 14,675 33.38 18,576 181.1zagreb macroregion total 24,604 55.97 11,903 116.0osijek or slavonian macroregionVirovitica-Podravina 520 1.18 6,129 59.7Požega-Slavonia 468 1.06 5,997 58.5Brod-Posavina 920 2.09 5,802 56.6Osijek-Baranja 2,452 5.58 8,039 78.4Vukovar-Srijem 1,065 2.42 5,932 57.8osijek macroregion total 5,425 12.34 6,731 65.6nUts 2 – continental croatia 30,029 68.31 10,452 101.9Rijeka or Primorje-Gorski Kotar macroregionPrimorje-Gorski Kotar 3,873 8.81 13,076 127.5Lika-Senj 388 0.88 7,619 74.3Istria 2,633 5.99 12,655 123.4Rijeka macroregion total 6,894 15.68 12,418 121.0split or Dalmatia macroregionZadar 1,398 3.18 8,223 80.2Šibenik-Knin 847 1.93 7,744 75.5Split-Dalmatia 3,583 8.15 7,878 76.8Dubrovnik-Neretva 1,208 2.75 9,856 96.1split macroregion total 7,036 16.01 8,212 80.0nUts 2 – adriatic croatia 13,930 31.69 9,866 96.2Rc total 43,959 100.00 10,259 100.0
Source: CBS, Communication no. 12.1.6. Gross Domestic Product for the RC, NCSU, level two and counties for the 2000-2012 period (ESA 2010), Zagreb, 13 March 2015.

petar filipić:
the estim
ate of r
egio
na
l ba
lan
ces o
f paym
ents in c
ro
atiafin
an
cia
l theo
ry an
d pr
ac
tice
40 (1) 85-128 (2016)115Table a3
International goods trade of the RC in mil. euros� – exports* and imports* per NUTS 2, macroregion and county in 2012nUts 2, macroregions, counties
export* % Import* % balance coverage(export/Import)
zagreb or central croatian macroregionZagreb 362.1 3.77 1,226.2 7.59 -864.1 29.53Krapina-Zagora 319.8 3.33 278.2 1.72 41.6 114.95Sisak-Moslavina 488.1 5.08 282.8 1.75 205.3 172.62Karlovac 222.4 2.32 167.4 1.04 55.0 132.87Varaždin 752.3 7.83 529.5 3.28 222.8 142.07Koprivnica-Križevci 247.8 2.58 174.6 1.08 73.2 141.96Bjelovar-Bilogora 98.7 1.03 129.4 0.80 -30.7 76.30Međimurje 406.9 4.24 310.1 1.92 96.7 131.20total excl. zagreb 2,898.0 30.17 3,098.0 19.19 -200.1 93.54City of Zagreb 3,525.5 36.70 9,672.1 59.90 -6,146.6 36.45zagreb macroregion total 6,423.5 66.87 12,770.1 79.09 -6,346.6 50.30osijek or slavonian macroregionVirovitica-Podravina 130.6 1.36 81.7 0.51 48.9 159.80Požega-Slavonia 101.5 1.06 69.0 0.43 32.5 147.11Brod-Posavina 182.8 1.90 205.8 1.27 -23.0 88.82Osijek-Baranja 434.93 4.53 406.1 2.52 28.6 107.04Vukovar-Srijem 159.3 1.66 213.4 1.32 -54.1 74.66osijek macroregion total 1,008.8 10.50 976.0 6.04 32.9 103.37nUts 2 – continental croatia 7,432.3 77.37 13,746.0 85.13 -6,313.8 54.07Rijeka or Primorje-Gorski Kotar macroregionPrimorje-Gorski Kotar 535.3 5.57 565.9 3.50 -30.6 94.59Lika-Senj 17.4 0.18 12.2 0.08 5.3 143.32Istria 698.1 7.27 682.7 4.23 15.5 102.27Rijeka macroregion total 1,250.9 13.02 1,260.8 7.81 -9.8 99.22split or Dalmatia macroregionZadar 168.1 1.75 142.6 0.88 25.5 117.86Šibenik-Knin 255.7 2.66 253.3 1.57 2.4 100.94Split-Dalmatia 475.2 4.95 674.4 4.18 -199.3 70.45Dubrovnik-Neretva 23.5 0.24 69.9 0.43 -46.4 33.60split macroregion total 922.5 9.60 1,140.3 7.06 -217.8 80.90nUts 2 – adriatic croatia 2,173.4 22.62 2,401.1 14.87 227.7 90.52Regions total 9,605.7 100.00 16,147.1 100.00 -6,541.4 59.49Unassigned 23.0 0.24 67.3 0.42 -44.3 34.14Rc total 9,628.6 100.24 16,214.4 100.42 -6,585.7 59.38
� Average euro/kuna exchange rate in 2012 = 7.5172.* Data per county obtained pursuant to the classification of firms that have exported from and imported into the county or municipality or city in which they are registered according to the Register of Business Entities.
Source: CBS, Communication no. 4.2.4, Trade in goods of the RC with foreign countries in terms of counties, cities and municipalities in 2012 – final figures, Zagreb, 13 June 2013.

petar filipić:
the estim
ate of r
egio
na
l ba
lan
ces o
f paym
ents in c
ro
atiafin
an
cia
l theo
ry an
d pr
ac
tice
40 (1) 85-128 (2016)
116 Table a4 International trade in goods of the RC in millions of euros� – exports* and imports**, per NUTS 2, macroregion and county in 2012nUts 2, macroregions, counties
export* % Import** % balance coverage(export/Import)
zagreb or central croatian macroregionZagreb 362.1 3.77 911.3 5.64 -549.3 39.73Krapina-Zagora 319.8 3.33 302.3 1.87 17.5 105.78Sisak-Moslavina 488.1 5.08 506.9 3.14 -18.8 96.29Karlovac 222.4 2.32 355.6 2.20 -133.2 62.54Varaždin 752.3 7.83 534.1 3.31 218.2 140.85Koprivnica-Križevci 247.8 2.58 386.4 2.39 -138.6 64.13Bjelovar-Bilogora 98.7 1.03 298.6 1.85 -199.9 33.05Međimurje 406.9 4.24 351.9 2.18 55.0 115.62total excl. zagreb 2,898.0 30.17 3,647.1 22.59 -749.2 79.46City of Zagreb 3,525.5 36.70 5,390.5 33.38 -1,864.0 65.40zagreb macroregion total 6,423.5 66.87 9,037.6 55.97 -2,614.1 71.07osijek or slavonian macroregionVirovitica-Podravina 130.6 1.36 191.0 1.18 -60.4 68.35Požega-Slavonia 101.5 1.06 171.9 1.06 -70.4 59.06Brod-Posavina 182.8 1.90 337.9 2.09 -155.2 54.08Osijek-Baranja 434.9 4.53 900.7 5.58 -466.0 48.26Vukovar-Srijem 159.3 1.66 391.2 2.42 -231.9 40.72osijek macroregion total 1,008.8 10.50 1,992.7 12.34 -983.9 50.63nUts 2 – continental croatia 7,432.3 77.37 11,030.3 68.31 -3,598.0 67.38Rijeka or Primorje-Gorski Kotar macroregionPrimorje-Gorski Kotar 535.3 5.57 1,422.6 8.81 -887.3 37.63Lika-Senj 17.4 0.18 142.5 0.88 -125.1 12.24Istria 698.1 7.27 967.2 5.99 -269.0 72.18Rijeka macroregion total 1,250.9 13.02 2,532.3 15.68 -1,281.4 49.40split or Dalmatia macroregionZadar 168.1 1.75 513.5 3.18 -345.4 32.73Šibenik-Knin 255.7 2.66 311.1 1.93 -55.4 82.20Split-Dalmatia 475.2 4.95 1,316.1 8.15 -840.9 36.10Dubrovnik-Neretva 23.5 0.24 443.7 2.75 -420.2 5.29split macroregion total 922.5 9.60 2,584.5 16.01 -1,662.0 35.69nUts 2 – adriatic croatia 2,173.4 22.62 5,116.8 31.69 -2,943.4 42.48Macroregions total 9,605.7 100.00 16,147.1 100.00 -6,541.4 59.49Unassigned 23.0 0.24 67.3 0.42 -44.3 34.14Rc total 9,628.6 100.24 16,214.4 100.42 -6,585.7 59.38
� Average euro/kuna exchange rate in 2012 = 7.5172.* Export: Data per county obtained pursuant to the classification of firms that have exported from and imported into the county or municipality or city in which they are registered according to the Register of Business Entities.** Import: Estimate of imports per county obtained by dividing RC total imports according to the county structure of GDP.
Source: CBS, Communication no. 4.2.4. Trade in goods of the RC with foreign countries in terms of counties, cities and municipalities in 2012 – final figures, Zagreb, 13 June 2013.

petar filipić:
the estim
ate of r
egio
na
l ba
lan
ces o
f paym
ents in c
ro
atiafin
an
cia
l theo
ry an
d pr
ac
tice
40 (1) 85-128 (2016)117Table a5
International trade in services of the RC in million euros� – earnings and expenditures*, per NUTS 2, macroregion and county in 2012nUts 2, macroregions, counties earnings % expenditures % balancezagreb or central croatian macroregionZagreb 120.6 5.94 36.1 2.39 84.4 Krapina-Zagora 1.6 0.08 9.7 0.64 - 8.1 Sisak-Moslavina 16.2 0.80 5.3 0.35 11.0 Karlovac 15.0 0.74 10.5 0.70 4.4 Varaždin 7.2 0.36 8.9 0.59 - 1.7 Koprivnica-Križevci 14.0 0.69 9.7 0.64 4.3 Bjelovar-Bilogora 4.0 0.20 3.2 0.21 0.9 Međimurje 4.2 0.21 6.1 0.40 - 1.9 total excl. zagreb 182.8 9.00 89.4 5.92 93.4 City of Zagreb 1,259.7 62.01 1,154.7 76.46 105.0zagreb macroregion total 1,442.5 71.01 1,244.1 82.38 198.4 osijek or slavonian macroregion Virovitica-Podravina 0 0.00 0.1 0.00 - 0.1Požega-Slavonia 0.1 0.01 1.2 0.08 - 1.1Brod-Posavina 18.4 0.91 3.0 0.20 15.4Osijek-Baranja 17.4 0.86 7.1 0.47 10.3Vukovar-Srijem 3.5 0.17 2.2 0.14 1.3osijek macroregion total 39.4 1.94 13.6 0.90 25.8nUts 2 – continental croatia 1,482.0 72.95 1,257.7 83.28 224.2Rijeka or Primorje-Gorski Kotar macroregion Primorje-Gorski Kotar 189.0 9.30 58.2 3.85 130.8Lika-Senj 0.001 0.00 0.2 0.01 - 0.2Istria 42.7 2.10 47.0 3.11 - 4.3Rijeka macroregion total 231.7 11.40 105.4 6.98 126.3split or Dalmatia macroregion Zadar 85.4 4.20 38.2 2.53 47.1 Šibenik-Knin 106.6 5.25 6.6 0.44 100.0 Split-Dalmatia 12.6 0.62 58.1 3.84 - 45.4Dubrovnik-Neretva 113.3 5.58 44.2 2.93 69.1split macroregion total 317.9 15.65 147.1 9.74 170.8nUts 2 – adriatic croatia 549.6 27.05 252.5 16.72 297.2Rc excl. tourism 2,031.6 100.00 1,510.2 100.00 521.4Unknown county (tourism)** 7,609.9 374.58 1,611.4 106.70 5,998.6Rc total 9,641.5 474.58 3,121.6 206.70 6,520.0
� Average euro/kuna exchange rate in 2012 = 7.5172.* Data per county obtained pursuant to the classification of firms that have had earnings or expenditures in the county or municipality or city in which they are registered according to the Register of Business Entities.** The item unknown county refers to the services that cannot be assigned to a county, and mostly relate to travel services (tourism) the expenditures of which cannot be geographically divided because of the shortcomings of the method of estimation.
Source: CNB, Statistics Sector, July 2013.
Drawn up in alignment with the Metodologija za razmjenu usluga s inozemstvom <http://www.hnb.hr/statistika/razmjena-usluga-inozemstvom/h-obuhvat-metodologija.pdf >.

petar filipić:
the estim
ate of r
egio
na
l ba
lan
ces o
f paym
ents in c
ro
atiafin
an
cia
l theo
ry an
d pr
ac
tice
40 (1) 85-128 (2016)
118 Table a6 International trade in services of the RC in million euros� – earnings and expenditures*, per NUTS 2, macroregion and county, 2012nUts 2, macroregions, counties earnings % expenditures % balancezagreb or central croatian macroregionZagreb 120.6 5.94 85.2 5.64 35.3Krapina-Zagora 1.7 0.08 28.3 1.87 -26.6Sisak-Moslavina 16.2 0.80 47.4 3.14 -31.2Karlovac 15.0 0.74 33.3 2.20 -18.3Varaždin 7.2 0.36 50.0 3.31 -42.7Koprivnica-Križevci 14.0 0.69 36.1 2.39 -22.2Bjelovar-Bilogora 4.0 0.20 27.9 1.85 -23.9Međimurje 4.2 0.21 32.9 2.18 -28.7total excl. zagreb 182.8 9.00 341.1 22.59 -158.3City of Zagreb 1,259.7 62.01 504.2 33.38 755.6zagreb macroregion total 1,442.5 71.01 845.3 55.97 597.3osijek or slavonian macroregion Virovitica-Podravina 0 0 17.9 1.18 -17.9Požega-Slavonia 0.1 0.01 16.1 1.06 -16.0Brod-Posavina 18.4 0.91 31.6 2.09 -13.2Osijek-Baranja 17.41 0.86 84.2 5.58 -66.8Vukovar-Srijem 3.5 0.17 36.6 2.42 -33.1osijek macroregion total 39.4 1.94 186.4 12.34 -146.9nUts 2 – continental croatia 1,482.0 72.95 1,031.6 68.31 450.3Rijeka or Primorje-Gorski Kotar macroregion Primorje-Gorski Kotar 189.0 9.30 133.1 8.81 55.9Lika-Senj 0.001 0.00 13.3 0.88 -13.3Istria 42.7 2.10 90.5 5.99 -47.7Rijeka macroregion total 231.7 11.40 236.8 15.68 -5.2split or Dalmatia macroregion Zadar 85.4 4.20 48.0 3.18 37.3Šibenik-Knin 106.6 5.25 29.1 1.93 77.5Split-Dalmatia 12.6 0.62 123.1 8.15 -110.5Dubrovnik-Neretva 113.3 5.58 41.5 2.75 71.8split macroregion total 317.9 15.65 241.7 16.01 76.2nUts 2 – adriatic croatia 549.6 27.05 478.6 31.69 71.1Rc services excl. tourism 2,031.6 100.00 1,510.2 100.00 521.4Unknown county (tourism)** 7,609.9 374.58 1,611.4 106.70 5,998.6Rc total 9,641.5 474.58 3,121.6 206.70 6,520.0
� Average euro/kuna exchange rate in 2012 = 7.5172.* Data per county obtained by dividing the total expenditures on services of the RC according to the country GDP structure. ** The item unknown county refers to the services that cannot be assigned to a county, and mostly relate to travel services (tourism) the expenditures of which cannot be geographically divided because of the shortcomings of the method of estimation.
Source: CNB, Statistics Sector, July 2013.
Drawn up in alignment with the Metodologija za razmjenu usluga s inozemstvom <http://www.hnb.hr/statistika/razmjena-usluga-inozemstvom/h-obuhvat-metodologija.pdf >.
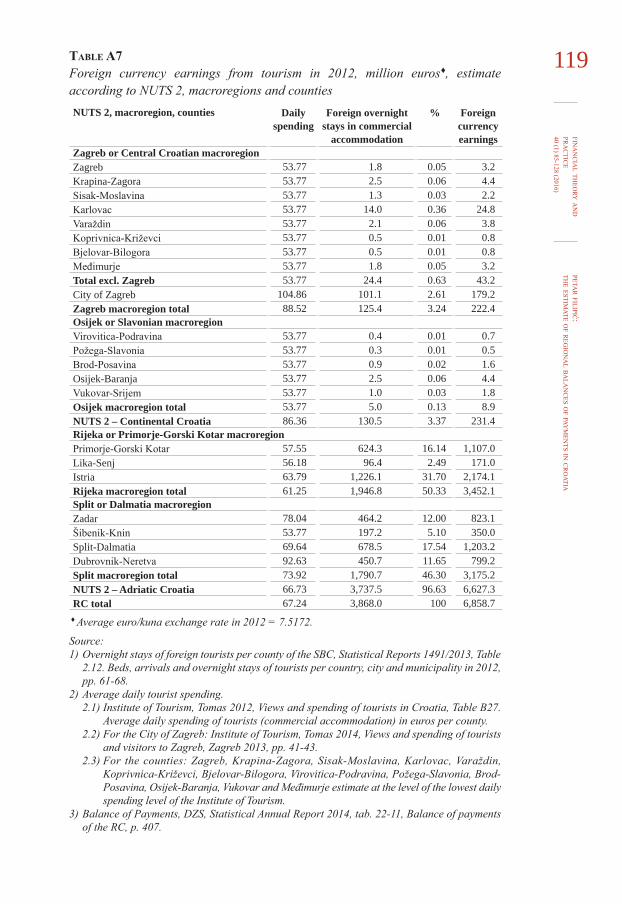
petar filipić:
the estim
ate of r
egio
na
l ba
lan
ces o
f paym
ents in c
ro
atiafin
an
cia
l theo
ry an
d pr
ac
tice
40 (1) 85-128 (2016)119Table a7
Foreign currency earnings from tourism in 2012, million euros�, estimate according to NUTS 2, macroregions and countiesnUts 2, macroregion, counties Daily
spendingforeign overnight
stays in commercial accommodation
% foreign currency earnings
zagreb or central croatian macroregionZagreb 53.77 1.8 0.05 3.2Krapina-Zagora 53.77 2.5 0.06 4.4Sisak-Moslavina 53.77 1.3 0.03 2.2Karlovac 53.77 14.0 0.36 24.8Varaždin 53.77 2.1 0.06 3.8Koprivnica-Križevci 53.77 0.5 0.01 0.8Bjelovar-Bilogora 53.77 0.5 0.01 0.8Međimurje 53.77 1.8 0.05 3.2total excl. zagreb 53.77 24.4 0.63 43.2City of Zagreb 104.86 101.1 2.61 179.2zagreb macroregion total 88.52 125.4 3.24 222.4osijek or slavonian macroregionVirovitica-Podravina 53.77 0.4 0.01 0.7Požega-Slavonia 53.77 0.3 0.01 0.5Brod-Posavina 53.77 0.9 0.02 1.6Osijek-Baranja 53.77 2.5 0.06 4.4Vukovar-Srijem 53.77 1.0 0.03 1.8osijek macroregion total 53.77 5.0 0.13 8.9nUts 2 – continental croatia 86.36 130.5 3.37 231.4Rijeka or Primorje-Gorski Kotar macroregionPrimorje-Gorski Kotar 57.55 624.3 16.14 1,107.0Lika-Senj 56.18 96.4 2.49 171.0Istria 63.79 1,226.1 31.70 2,174.1Rijeka macroregion total 61.25 1,946.8 50.33 3,452.1split or Dalmatia macroregionZadar 78.04 464.2 12.00 823.1Šibenik-Knin 53.77 197.2 5.10 350.0Split-Dalmatia 69.64 678.5 17.54 1,203.2Dubrovnik-Neretva 92.63 450.7 11.65 799.2split macroregion total 73.92 1,790.7 46.30 3,175.2nUts 2 – adriatic croatia 66.73 3,737.5 96.63 6,627.3Rc total 67.24 3,868.0 100 6,858.7
� Average euro/kuna exchange rate in 2012 = 7.5172.
Source: 1) Overnight stays of foreign tourists per county of the SBC, Statistical Reports 1491/2013, Table
2.12. Beds, arrivals and overnight stays of tourists per country, city and municipality in 2012, pp. 61-68.
2) Average daily tourist spending. 2.1) Institute of Tourism, Tomas 2012, Views and spending of tourists in Croatia, Table B27.
Average daily spending of tourists (commercial accommodation) in euros per county. 2.2) For the City of Zagreb: Institute of Tourism, Tomas 2014, Views and spending of tourists
and visitors to Zagreb, Zagreb 2013, pp. 41-43. 2.3) For the counties: Zagreb, Krapina-Zagora, Sisak-Moslavina, Karlovac, Varaždin,
Koprivnica-Križevci, Bjelovar-Bilogora, Virovitica-Podravina, Požega-Slavonia, Brod-Posavina, Osijek-Baranja, Vukovar and Međimurje estimate at the level of the lowest daily spending level of the Institute of Tourism.
3) Balance of Payments, DZS, Statistical Annual Report 2014, tab. 22-11, Balance of payments of the RC, p. 407.

petar filipić:
the estim
ate of r
egio
na
l ba
lan
ces o
f paym
ents in c
ro
atiafin
an
cia
l theo
ry an
d pr
ac
tice
40 (1) 85-128 (2016)
120 Table a8 Tourist activity of the domestic population in 2012, travels abroad. Estimate according to NUTS 2, macroregions and counties in millions of euros�
nUts 2, macroregion, counties business Private travels abroad by domestic population
zagreb or central croatian macroregionZagreb 21.7 16.5 38.3Krapina-Zagora 7.2 5.5 12.7Sisak-Moslavina 3.7 10.2 13.9Karlovac 2.6 7.2 9.7Varaždin 12.7 9.7 22.4Koprivnica-Križevci 9.2 7.0 16.2Bjelovar-Bilogora 7.1 5.4 12.5Međimurje 8.4 6.4 14.8total excl. zagreb 72.7 67.9 140.6City of Zagreb 111.3 288.3 399.6zagreb macroregion total 184.0 356.2 540.2osijek or slavonian macroregionVirovitica-Podravina 0.6 8.4 9.0Požega-Slavonia 0.6 7.6 8.1Brod-Posavina 1.1 14.9 16.0Osijek-Baranja 2.9 39.6 42.5Vukovar-Srijem 1.3 17.2 18.5osijek macroregion total 6.4 87.7 94.1nUts 2 – continental croatia 190.4 443.8 634.2Rijeka or Primorje-Gorski Kotar macroregionPrimorje-Gorski Kotar 17.9 57.0 74.9Lika-Senj 1.0 2.9 3.9Istria 12.2 38.8 50.9Rijeka macroregion total 31.1 98.6 129.8split or Dalmatia macroregionZadar 13.7 36.4 50.2Šibenik-Knin 8.3 22.1 30.4Split-Dalmatia 35.2 93.4 128.6Dubrovnik-Neretva 11.9 31.5 43.3split macroregion total 69.2 183.3 252.5nUts 2 – adriatic croatia 100.3 282.0 382.2Rc total 290.7 725.9 1,016.5
� Average euro/kuna exchange rate in 2012 = 7.5172.
NB: Used for the estimate were data from the publication ‟Tourist activity of the domestic pop-ulation in 2012”, CBS and IZTZG [Institute of Tourism] from April 2013, by regions of perma-nent dwelling that in this publication represent statistic units (Zagreb, N. Croatia, Slavonia, Lika, Kordun and Banija, Istria, Kvarner and Gorski Kotar, Dalmatia) being disaggregated with the use of data about country GDP into counties and then aggregated into macroregions.
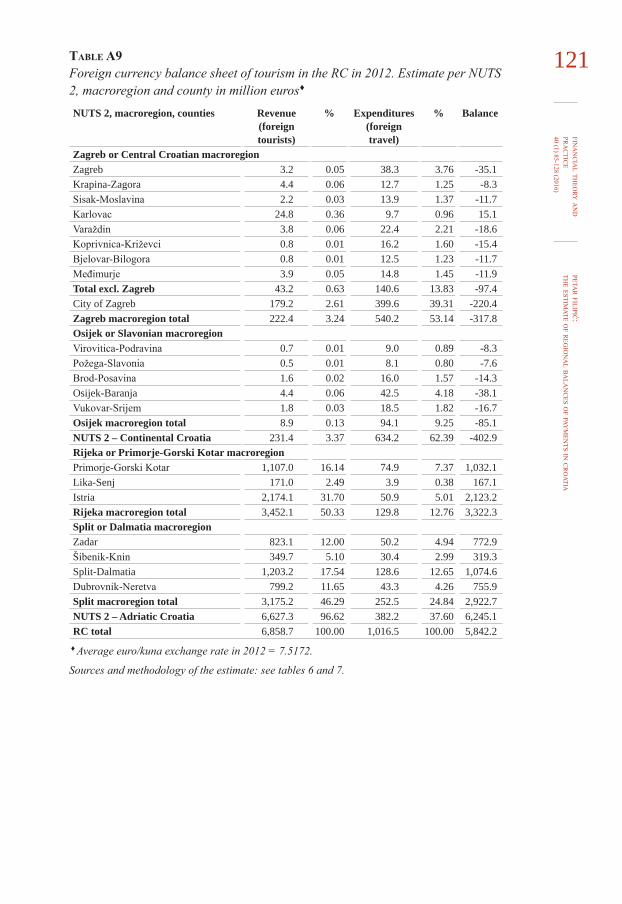
petar filipić:
the estim
ate of r
egio
na
l ba
lan
ces o
f paym
ents in c
ro
atiafin
an
cia
l theo
ry an
d pr
ac
tice
40 (1) 85-128 (2016)121Table a9
Foreign currency balance sheet of tourism in the RC in 2012. Estimate per NUTS 2, macroregion and county in million euros� nUts 2, macroregion, counties Revenue
(foreign tourists)
% expenditures (foreign travel)
% balance
zagreb or central croatian macroregionZagreb 3.2 0.05 38.3 3.76 -35.1Krapina-Zagora 4.4 0.06 12.7 1.25 -8.3Sisak-Moslavina 2.2 0.03 13.9 1.37 -11.7Karlovac 24.8 0.36 9.7 0.96 15.1Varaždin 3.8 0.06 22.4 2.21 -18.6Koprivnica-Križevci 0.8 0.01 16.2 1.60 -15.4Bjelovar-Bilogora 0.8 0.01 12.5 1.23 -11.7Međimurje 3.9 0.05 14.8 1.45 -11.9total excl. zagreb 43.2 0.63 140.6 13.83 -97.4City of Zagreb 179.2 2.61 399.6 39.31 -220.4zagreb macroregion total 222.4 3.24 540.2 53.14 -317.8osijek or slavonian macroregionVirovitica-Podravina 0.7 0.01 9.0 0.89 -8.3Požega-Slavonia 0.5 0.01 8.1 0.80 -7.6Brod-Posavina 1.6 0.02 16.0 1.57 -14.3Osijek-Baranja 4.4 0.06 42.5 4.18 -38.1Vukovar-Srijem 1.8 0.03 18.5 1.82 -16.7osijek macroregion total 8.9 0.13 94.1 9.25 -85.1nUts 2 – continental croatia 231.4 3.37 634.2 62.39 -402.9Rijeka or Primorje-Gorski Kotar macroregionPrimorje-Gorski Kotar 1,107.0 16.14 74.9 7.37 1,032.1Lika-Senj 171.0 2.49 3.9 0.38 167.1Istria 2,174.1 31.70 50.9 5.01 2,123.2Rijeka macroregion total 3,452.1 50.33 129.8 12.76 3,322.3split or Dalmatia macroregionZadar 823.1 12.00 50.2 4.94 772.9Šibenik-Knin 349.7 5.10 30.4 2.99 319.3Split-Dalmatia 1,203.2 17.54 128.6 12.65 1,074.6Dubrovnik-Neretva 799.2 11.65 43.3 4.26 755.9split macroregion total 3,175.2 46.29 252.5 24.84 2,922.7nUts 2 – adriatic croatia 6,627.3 96.62 382.2 37.60 6,245.1Rc total 6,858.7 100.00 1,016.5 100.00 5,842.2
� Average euro/kuna exchange rate in 2012 = 7.5172.
Sources and methodology of the estimate: see tables 6 and 7.
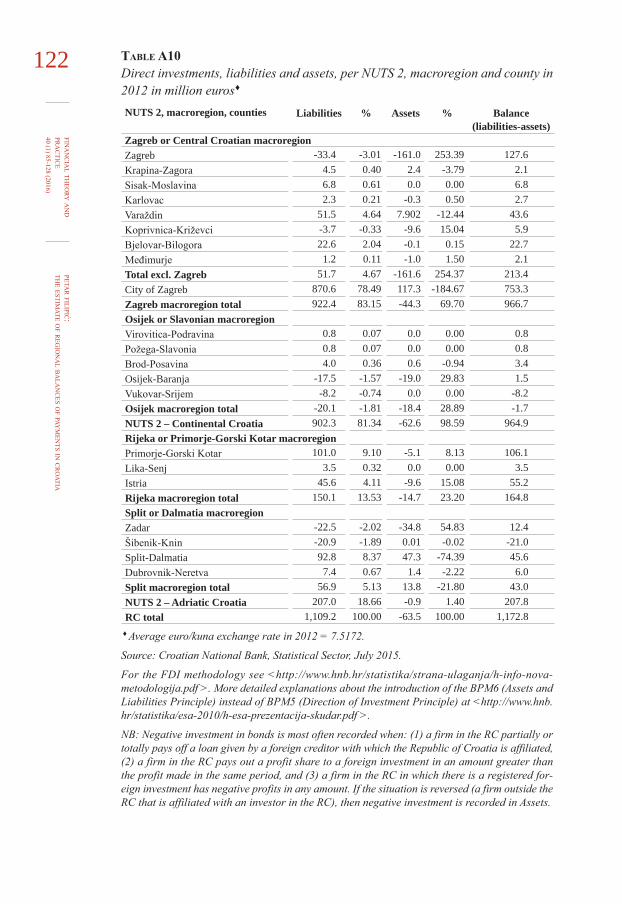
petar filipić:
the estim
ate of r
egio
na
l ba
lan
ces o
f paym
ents in c
ro
atiafin
an
cia
l theo
ry an
d pr
ac
tice
40 (1) 85-128 (2016)
122 Table a10 Direct investments, liabilities and assets, per NUTS 2, macroregion and county in 2012 in million euros� nUts 2, macroregion, counties liabilities % assets % balance
(liabilities-assets)zagreb or central croatian macroregionZagreb -33.4 -3.01 -161.0 253.39 127.6Krapina-Zagora 4.5 0.40 2.4 -3.79 2.1Sisak-Moslavina 6.8 0.61 0.0 0.00 6.8Karlovac 2.3 0.21 -0.3 0.50 2.7Varaždin 51.5 4.64 7.902 -12.44 43.6Koprivnica-Križevci -3.7 -0.33 -9.6 15.04 5.9Bjelovar-Bilogora 22.6 2.04 -0.1 0.15 22.7Međimurje 1.2 0.11 -1.0 1.50 2.1total excl. zagreb 51.7 4.67 -161.6 254.37 213.4City of Zagreb 870.6 78.49 117.3 -184.67 753.3zagreb macroregion total 922.4 83.15 -44.3 69.70 966.7osijek or slavonian macroregionVirovitica-Podravina 0.8 0.07 0.0 0.00 0.8Požega-Slavonia 0.8 0.07 0.0 0.00 0.8Brod-Posavina 4.0 0.36 0.6 -0.94 3.4Osijek-Baranja -17.5 -1.57 -19.0 29.83 1.5Vukovar-Srijem -8.2 -0.74 0.0 0.00 -8.2osijek macroregion total -20.1 -1.81 -18.4 28.89 -1.7nUts 2 – continental croatia 902.3 81.34 -62.6 98.59 964.9Rijeka or Primorje-Gorski Kotar macroregionPrimorje-Gorski Kotar 101.0 9.10 -5.1 8.13 106.1Lika-Senj 3.5 0.32 0.0 0.00 3.5Istria 45.6 4.11 -9.6 15.08 55.2Rijeka macroregion total 150.1 13.53 -14.7 23.20 164.8split or Dalmatia macroregionZadar -22.5 -2.02 -34.8 54.83 12.4Šibenik-Knin -20.9 -1.89 0.01 -0.02 -21.0Split-Dalmatia 92.8 8.37 47.3 -74.39 45.6Dubrovnik-Neretva 7.4 0.67 1.4 -2.22 6.0split macroregion total 56.9 5.13 13.8 -21.80 43.0nUts 2 – adriatic croatia 207.0 18.66 -0.9 1.40 207.8Rc total 1,109.2 100.00 -63.5 100.00 1,172.8
� Average euro/kuna exchange rate in 2012 = 7.5172.
Source: Croatian National Bank, Statistical Sector, July 2015.
For the FDI methodology see <http://www.hnb.hr/statistika/strana-ulaganja/h-info-nova-metodologija.pdf >. More detailed explanations about the introduction of the BPM6 (Assets and Liabilities Principle) instead of BPM5 (Direction of Investment Principle) at <http://www.hnb.hr/statistika/esa-2010/h-esa-prezentacija-skudar.pdf >.
NB: Negative investment in bonds is most often recorded when: (1) a firm in the RC partially or totally pays off a loan given by a foreign creditor with which the Republic of Croatia is affiliated, (2) a firm in the RC pays out a profit share to a foreign investment in an amount greater than the profit made in the same period, and (3) a firm in the RC in which there is a registered for-eign investment has negative profits in any amount. If the situation is reversed (a firm outside the RC that is affiliated with an investor in the RC), then negative investment is recorded in Assets.

petar filipić:
the estim
ate of r
egio
na
l ba
lan
ces o
f paym
ents in c
ro
atiafin
an
cia
l theo
ry an
d pr
ac
tice
40 (1) 85-128 (2016)123Table a11
Foreign currency loans from credit institutions to non-financial corporates per NUTS 2, macroregion and county at the end of 2012 in million euros�
nUts 2, macroregion, counties
foreign currency
loans
the interest on these
loans with a foreign currency
clause
Interest on these
foreign currency
loans total
%
zagreb or central croatian macroregionZagreb 114.5 1.2 338.6 5.8 453.1 4.89Krapina-Zagora 14.6 0.3 82.3 0.9 96.9 1.05Sisak-Moslavina 15.2 0.1 80.1 0.9 95.2 1.03Karlovac 11.2 0.1 72.5 0.99 83.7 0.90Varaždin 65.7 1.0 299.4 3.6 365.1 3.94Koprivnica-Križevci 70.8 0.4 103.9 1.3 174.7 1.89Bjelovar-Bilogora 8.9 0.2 117.4 2.0 126.3 1.36Međimurje 20.5 0.5 113.3 1.5 133.8 1.44total excl. zagreb 321.4 3.8 1,207.5 16.9 1,528.9 16.50City of Zagreb 1,129.8 15.9 2,527.6 41.2 3,657.4 39.47zagreb macroregion total 1,451.1 19.7 3,735.1 58.1 5,186.2 55.97osijek or slavonian macroregionVirovitica-Podravina 0.4 0.01 74.74 0.7 75.1 0.81Požega-Slavonia 3.9 0.04 61.7 0.8 65.6 0.71Brod-Posavina 8.4 0.1 138.8 1.9 147.2 1.59Osijek-Baranja 48.0 0.7 633.8 8.7 681.8 7.36Vukovar-Srijem 8.1 0.1 163.7 1.5 171.8 1.85osijek macroregion total 68.8 0.9 1,072.7 13.7 1,141.5 12.32nUts 2 – continental croatia 1,519.9 20.6 4,807.8 71.9 6,327.7 68.29Rijeka or Primorje-Gorski Kotar macroregionPrimorje-Gorski Kotar 111.4 1.6 543.8 8.3 655.2 7.07Lika-Senj 3.6 0.04 51.8 0.5 55.4 0.60Istria 114.9 1.5 417.9 6.8 532.8 5.75Rijeka macroregion total 230.0 3.1 1,013.4 15.6 1,243.4 13.42split or Dalmatia macroregionZadar 40.3 0.5 258.3 3.7 298.6 3.22Split-Dalmatia 245.4 3.9 661.8 10.3 907.2 9.79Šibenik-Knin 21.1 0.3 199.4 1.9 220.5 2.38Dubrovnik-Neretva 22.4 0.2 245.6 4.3 268.0 2.89split macroregion total 329.2 4.9 1,365.2 20.2 1,694.4 18.29nUts 2 – adriatic croatia 559.2 8.0 2,378.6 35.8 2,937.8 31.71Rc total 2,079.1 28.6 7,186.4 107.7 9,265.5 100.00
� Average euro/kuna exchange rate in 2012 = 7.5172.
Source: Croatian National Bank, Statistical Sector, July 2015.
The methodology follows <http://www.hnb.hr/statistika/statisticki_pregled/hmetod.pdf >, or tables D5 Statistical Review of the CNB for Institutional Sectors.
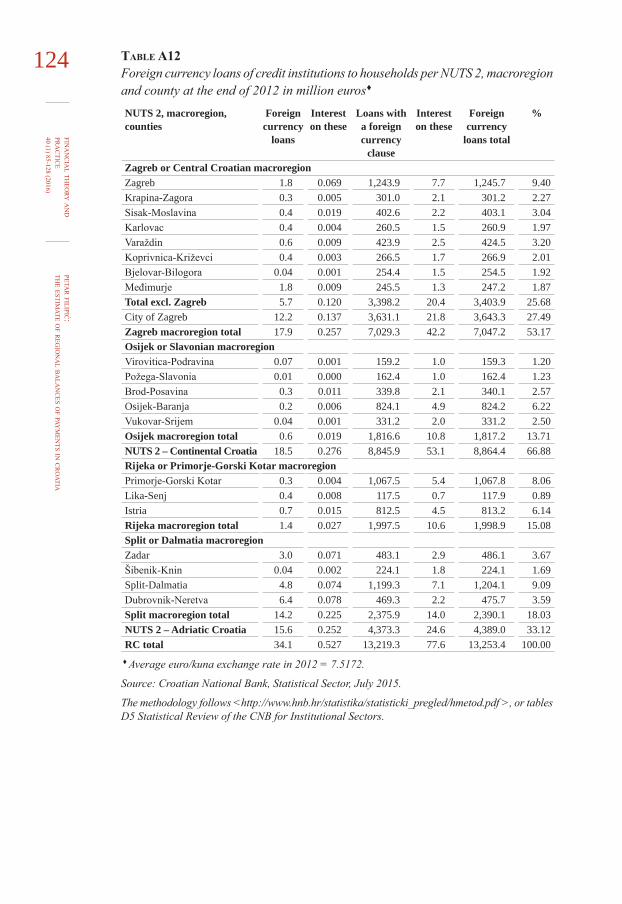
petar filipić:
the estim
ate of r
egio
na
l ba
lan
ces o
f paym
ents in c
ro
atiafin
an
cia
l theo
ry an
d pr
ac
tice
40 (1) 85-128 (2016)
124 Table a12 Foreign currency loans of credit institutions to households per NUTS 2, macroregion and county at the end of 2012 in million euros� nUts 2, macroregion, counties
foreign currency
loans
Interest on these
loans with a foreign currency
clause
Interest on these
foreign currency
loans total
%
zagreb or central croatian macroregionZagreb 1.8 0.069 1,243.9 7.7 1,245.7 9.40Krapina-Zagora 0.3 0.005 301.0 2.1 301.2 2.27Sisak-Moslavina 0.4 0.019 402.6 2.2 403.1 3.04Karlovac 0.4 0.004 260.5 1.5 260.9 1.97Varaždin 0.6 0.009 423.9 2.5 424.5 3.20Koprivnica-Križevci 0.4 0.003 266.5 1.7 266.9 2.01Bjelovar-Bilogora 0.04 0.001 254.4 1.5 254.5 1.92Međimurje 1.8 0.009 245.5 1.3 247.2 1.87total excl. zagreb 5.7 0.120 3,398.2 20.4 3,403.9 25.68City of Zagreb 12.2 0.137 3,631.1 21.8 3,643.3 27.49zagreb macroregion total 17.9 0.257 7,029.3 42.2 7,047.2 53.17osijek or slavonian macroregionVirovitica-Podravina 0.07 0.001 159.2 1.0 159.3 1.20Požega-Slavonia 0.01 0.000 162.4 1.0 162.4 1.23Brod-Posavina 0.3 0.011 339.8 2.1 340.1 2.57Osijek-Baranja 0.2 0.006 824.1 4.9 824.2 6.22Vukovar-Srijem 0.04 0.001 331.2 2.0 331.2 2.50osijek macroregion total 0.6 0.019 1,816.6 10.8 1,817.2 13.71nUts 2 – continental croatia 18.5 0.276 8,845.9 53.1 8,864.4 66.88Rijeka or Primorje-Gorski Kotar macroregionPrimorje-Gorski Kotar 0.3 0.004 1,067.5 5.4 1,067.8 8.06Lika-Senj 0.4 0.008 117.5 0.7 117.9 0.89Istria 0.7 0.015 812.5 4.5 813.2 6.14Rijeka macroregion total 1.4 0.027 1,997.5 10.6 1,998.9 15.08split or Dalmatia macroregionZadar 3.0 0.071 483.1 2.9 486.1 3.67Šibenik-Knin 0.04 0.002 224.1 1.8 224.1 1.69Split-Dalmatia 4.8 0.074 1,199.3 7.1 1,204.1 9.09Dubrovnik-Neretva 6.4 0.078 469.3 2.2 475.7 3.59split macroregion total 14.2 0.225 2,375.9 14.0 2,390.1 18.03nUts 2 – adriatic croatia 15.6 0.252 4,373.3 24.6 4,389.0 33.12Rc total 34.1 0.527 13,219.3 77.6 13,253.4 100.00
� Average euro/kuna exchange rate in 2012 = 7.5172.
Source: Croatian National Bank, Statistical Sector, July 2015.
The methodology follows <http://www.hnb.hr/statistika/statisticki_pregled/hmetod.pdf >, or tables D5 Statistical Review of the CNB for Institutional Sectors.

petar filipić:
the estim
ate of r
egio
na
l ba
lan
ces o
f paym
ents in c
ro
atiafin
an
cia
l theo
ry an
d pr
ac
tice
40 (1) 85-128 (2016)125Table a13
Foreign currency deposits of non-financial corporates per NUTS 2, macroregion and county at the end of 2012 in million euros�
nUts 2, macroregion, counties foreign currency deposits
Interest on these
Deposits %
zagreb or central croatian macroregionZagreb 65.5 0.4 2.86Krapina-Zagora 48.4 0.1 2.11Sisak-Moslavina 27.4 0.1 1.20Karlovac 18.0 0.1 0.79Varaždin 45.9 0.4 2.00Koprivnica-Križevci 15.4 0.1 0.67Bjelovar-Bilogora 6.3 0.1 0.27Međimurje 45.7 0.2 2.00total excl. zagreb 272.6 1.6 11.90City of Zagreb 1,093.8 7.3 47.74zagreb macroregion total 1,366.4 8.9 59.64osijek or slavonian macroregionVirovitica-Podravina 21.5 0.7 0.94Požega-Slavonia 6.4 0.02 0.28Brod-Posavina 15.7 0.2 0.69Osijek-Baranja 28.1 0.04 1.23Vukovar-Srijem 12.9 0.04 0.56osijek macroregion total 84.6 0.9 3.69nUts 2 – continental croatia 1,451.0 9.8 63.33Rijeka or Primorje-Gorski Kotar macroregionPrimorje-Gorski Kotar 127.8 0.7 5.58Lika-Senj 2.1 0.02 0.09Istria 381.8 3.2 16.67Rijeka macroregion total 511.7 3.9 22.34split or Dalmatia macroregionZadar 61.2 1.0 2.67Šibenik-Knin 11.4 0.1 0.50Split-Dalmatia 130.1 0.1 5.68Dubrovnik-Neretva 125.6 0.9 5.48split macroregion total 328.3 2.9 14.33nUts 2 – adriatic croatia 840.0 6.7 36.67Rc total 2,291.0 16.5 100.00
� Average euro/kuna exchange rate in 2012 = 7.5172.
Source: Croatian National Bank, Statistical Sector, July 2015.
NB: Foreign currency deposits include foreign currency deposits and kuna deposits with a cur-rency clause.
The methodology follows <http://www.hnb.hr/statistika/statisticki_pregled/hmetod.pdf >, or tables D5 Statistical Review of the CNB for Institutional Sectors.

petar filipić:
the estim
ate of r
egio
na
l ba
lan
ces o
f paym
ents in c
ro
atiafin
an
cia
l theo
ry an
d pr
ac
tice
40 (1) 85-128 (2016)
126 Table a14 Foreign currency deposits of households per NUTS 2, macroregion and county at the end of 2012 in million euros�
nUts 2, macroregion, counties foreign currency deposits
Interest on these
Deposits %
zagreb or central croatian macroregionZagreb 1,229.6 19.2 6.61Krapina-Zagora 263.9 4.7 1.42Sisak-Moslavina 292.0 3.6 1.57Karlovac 363.1 5.1 1.95Varaždin 440.2 7.1 2.37Koprivnica-Križevci 237.8 3.5 1.28Bjelovar-Bilogora 295.0 4.4 1.59Međimurje 399.2 4.2 2.15total excl. zagreb 3,520.7 51.8 18.94City of Zagreb 5,383.3 77.6 28.95zagreb macroregion total 8,904.0 129.3 47.89osijek or slavonian macroregionVirovitica-Podravina 132.8 2.0 0.71Požega-Slavonia 183.2 3.3 0.99Brod-Posavina 358.3 5.1 1.93Osijek-Baranja 727.3 11.5 3.91Vukovar-Srijem 273.0 3.8 1.47osijek macroregion total 1,674.6 25.7 9.01nUts 2 – continental croatia 10,578.6 155.1 56.90Rijeka or Primorje-Gorski Kotar macroregionPrimorje-Gorski Kotar 1,769.3 22.0 9.52Lika-Senj 172.9 2.8 0.93Istria 1,313.5 17.8 7.06Rijeka macroregion total 3,255.7 41.8 17.51split or Dalmatia macroregionZadar 849. 9.9 4.57Šibenik-Knin 519.6 4.2 2.79Split-Dalmatia 2,623.1 38.5 14.11Dubrovnik-Neretva 765.7 9.4 4.12split macroregion total 4,757.8 61.9 25.59nUts 2 – adriatic croatia 8,013.6 103.7 43.10Rc total 18,592.2 258.8 100.00
� Average euro/kuna exchange rate in 2012 = 7.5172.
Source: Croatian National Bank, Statistical Sector, July 2015.
NB: Foreign currency deposits include foreign currency deposits and kuna deposits with a cur-rency clause.
The methodology follows <http://www.hnb.hr/statistika/statisticki_pregled/hmetod.pdf >, or tables D5 Statistical Review of the CNB for Institutional Sectors.

petar filipić:
the estim
ate of r
egio
na
l ba
lan
ces o
f paym
ents in c
ro
atiafin
an
cia
l theo
ry an
d pr
ac
tice
40 (1) 85-128 (2016)127RefeRences
1. Abreu, M. [et al.], 2008. Absorptive Capacity and Regional Patterns of Inno-vation Centre for Business Research (CBR). University of Cambridge DIUS Research Report, No. 08 11. Available at: <http://dera.ioe.ac.uk/8752/1/DIUS-RR-08-11.pdf>.
2. Alderman, N. and Davies, S., 1990. Modelling regional patterns of innovation diffusion in the UK metalworking industries. Regional Studies, 24, pp. 513-528. doi: 10.1080/00343409012331346184
3. Babić, A. and Babić, M., 2008. Međunarodna ekonomija. Zagreb: Sigma savjetovanje.
4. Babić, A., 2000. Komentar o devalvaciji. Ekonomija moderna, 1-3.5. Bajo, A. [et al.], 2014. Učinci decentralizacije u Republici Hrvatskoj na eko-
nomski i fiskalni položaj Istarske županije. Zagreb: Institut za javne financije.6. Barca, F., McCann, P. and Rodriguez-Pose, A., 2012. The case for regional de-
velopment intervention: place-based versus place-neutral approaches. Journal of Regional Science, 52(1), pp. 134-152. doi: 10.1111/j.1467-9787.2011.00756.x
7. Brnić, M., 2015. Izvoznici traže prilagodbu tečaja u razmjeru od 2 posto godišnje, izvješće s Desete konvencije hrvatskih izvoznika. Poslovni dnevnik, June 1, 2015.
8. Camagni, R., 2015. Macroeconomic constraints and spatial strategies in re-newed cohesion policies. RSA Winter Conference Great Transformation: Re-casting Regional Policy, 19th – 20th November.
9. Capello, R. and Nijkamp, P., eds., 2009. Regional growth and development theo-ries in the XXI Century. Cheltenham: Edwar Elgar. doi: 10.4337/9781848445987
10. CBS and IZTZG, 2013. Turistička aktivnost domaćeg stanovništva u 2012. godini. Zagreb: Croatian Bureau of Statistics and Institute of Tourism.
11. CBS, 1994. Statistički ljetopis hrvatskih županija, Godina 1-1993. Zagreb: Croatian Bureau of Statistics.
12. CBS, 2012. Popis stanovništva, kućanstava i stanova 2011. godine. Zagreb: Croatian Bureau of Statistics.
13. CBS, 2013a. Priopćenje broj 4.2.4. Robna razmjena Republike Hrvatske s ino-zemstvom po županijama, gradovima i općinama u 2012. – konačni podatci. Zagreb: Croatian Bureau of Statistics.
14. CBS, 2013b. Statistička izvješća 1491. Zagreb: Croatian Bureau of Statistics.15. CBS, 2015a. Priopćenje, 12.1.6. Bruto domaći proizvod za Republiku Hrvat-
sku, NKPJS – 2. razina i županije za razdoblje 2000.-2012. (ESA 2010). Za-greb: Croatian Bureau of Statistics.
16. CBS, 2015b. Statistički ljetopis 2014. Zagreb: Croatian Bureau of Statistics.17. Cesarano, F., 2006. Optimum currency areas: a policy view. BNL Quarterly
Review, 40(239), pp. 317-332.18. CNB, 2015a. Klasifikacija i iskazivanje podataka o potraživanjima i obve-
zama. Zagreb: Croatian National Bank. Available at: <http://www.hnb.hr/stati-stika/statisticki_pregled/hmetod.pdf>.
19. CNB, 2015b. Informacija o novoj metodologiji kompilacije pozicije Izravna ulaganja u sklopu platne bilance. Zagreb: Croatian National Bank. Available at: <http://www.hnb.hr/statistika/strana-ulaganja/h-info-nova-metodologija.pdf>.

petar filipić:
the estim
ate of r
egio
na
l ba
lan
ces o
f paym
ents in c
ro
atiafin
an
cia
l theo
ry an
d pr
ac
tice
40 (1) 85-128 (2016)
128 20. Dellas, H. and Tavlas, G. S., 2009. An optimum-currency-area odyssey. Bank of Greece Working paper, No. 02.
21. European Commission, 2013. European System of Accounts – ESA 2010. Available at: <http://ec.europa.eu/eurostat/documents/3859598/5925693/KS-02-13-269-EN.PDF/44cd9d01-bc64-40e5-bd40-d17df0c69334>.
22. Filipić, P. and Grčić, B., 2002. Evaluation of regional development and (im)balances: the Croatian case. The Journal of Management Science & Regional Development (MSRD), (4), pp. 21-36.
23. Filipić, P., 2000. The Regional Impact of macroeconomic Policy: the Case of Countries in Transition, Local Development in Central and Eastern Europe, Universita degli studi di Ancona, pp. 31-35.
24. Filipić, P., 2001. The regional impact of monetary policy: The Island case. The First Encounter of Mediterranean Economists. CD ROM full paper. Split: Faculty of Economics.
25. Filipić, P., 2006. Makroekonomija za svakoga. Split: Slobodna Dalmacija: Faculty of Economics.
26. Galinec, D., 2000. Statističko evidentiranje pozicije putovanja – Turizam u platnoj bilanci Republike Hrvatske. HNB, Istraživanja, I-3. Zagreb: Croatian National Bank.
27. Gatarić, LJ., 2015. Dužnici čekaju ponudu banaka ili će na sud. Večernji list, May 15, 2015.
28. IMF, 2009. Balance of payments and international investment position manual. Washington: IMF.
29. IZTZG, 2013. Stavovi i potrošnja turista u Hrvatskoj. Zagreb: IZTZG.30. IZTZG, 2014. Stavovi i potrošnja turista i posjetitelja Zagreba. Zagreb: IZTZG.31. Leksikografski zavod Miroslav Krleža, 2013-2015. Hrvatska enciklopedija.32. Mundell, R. A., 1963. A Theory of Optimum Currency Area. American Eco-
nomic Review, 51, pp. 657-65.33. Ramos, N. P., 2006. Does the balance-of-payments matter at the regional
level?. 46th Congress of the European Regional Science Association, Volos, Greece August 30th – September 3rd.
34. Ramos, N. P., 2007. Does the trade balance really matter for regions? The An-nals of Regional Science, 41(1), pp. 229-243. doi: 10.1007/s00168-006-0091-5
35. Škudar, A., 2014. Uvođenje standarda BPM6 u statistike odnosa s inozem-stvom – PPT presentation. Available at: <http://www.hnb.hr/statistika/esa-2010/h-esa-prezentacija-skudar.pdf>.
36. UK Trend info, 2015. Available at: <https://www.uktradeinfo.com/Statistics/RTS/Pages/default.aspx>.
37. World Bank, 2015. Personal remittances, received (current US$). Available at: <http://data.worldbank.org/indicator/BX.TRF.PWKR.CD.DT>.
38. Zakon o regionalnom razvoju Republike Hrvatske, NN 147/14.39. Zakon o službenoj statistici, NN 103/03, 75/09, 52/12.