The Estey Centre Journal of International Law and Trade...
23
Volume 6 Number 2 2005/p.274-298 esteyjournal.com Editorial Office: 410 22 nd St. E., Suite 820, Saskatoon, SK, Canada, S7K 5T6. Phone (306) 244-4800; Fax (306) 244-7839; email: [email protected] 274 Alternative Market Access Scenarios in the Agricultural Trade Negotiations of the Doha Round ∗ Alessandro Antimiani Istituto Nazionale di Economia Agraria, Rome Piero Conforti Commodities and Trade Division, Food and Agriculture Organization of the United Nations, Rome Luca Salvatici Università degli Studi del Molise, Campobasso, Italy The article explores possible outcomes of the Doha Development Agenda by simulating agricultural liberalization scenarios with a modified version of the Global Trade Analysis Project (GTAP) model and the related version 6.0 database. A 2013 baseline is employed to analyze two hypotheses in the areas of market access and export competition. Proportional cuts in tariffs are compared with a Swiss-formula approach. Welfare gains arise both in developed and developing countries, and, at least in principle, both groups should support deep reforms. Results suggest that the choice of the nature of the formula is not crucial in determining an effective increase in market access. Keywords: commercial policy, protection, promotion, trade negotiations, agriculture in international trade The Estey Centre Journal of International Law and Trade Policy
Transcript of The Estey Centre Journal of International Law and Trade...

Vo lume 6 Number 2 2005 /p .27 4 -298 es tey j ou rn a l . com
Editorial Office: 410 22nd St. E., Suite 820, Saskatoon, SK, Canada, S7K 5T6. Phone (306) 244-4800; Fax (306) 244-7839; email: [email protected] 274
Alternative Market Access Scenarios in the Agricultural Trade Negotiations of the Doha Round∗ Alessandro Antimiani Istituto Nazionale di Economia Agraria, Rome
Piero Conforti Commodities and Trade Division, Food and Agriculture Organization of the United Nations, Rome
Luca Salvatici Università degli Studi del Molise, Campobasso, Italy
The article explores possible outcomes of the Doha Development Agenda by simulating agricultural liberalization scenarios with a modified version of the Global Trade Analysis Project (GTAP) model and the related version 6.0 database. A 2013 baseline is employed to analyze two hypotheses in the areas of market access and export competition. Proportional cuts in tariffs are compared with a Swiss-formula approach. Welfare gains arise both in developed and developing countries, and, at least in principle, both groups should support deep reforms. Results suggest that the choice of the nature of the formula is not crucial in determining an effective increase in market access.
Keywords: commercial policy, protection, promotion, trade negotiations, agriculture in international trade
The Es tey Cent re Journa l o fInternational Law
and Trade Policy

A. Antimiani, P. Conforti and L. Salvatici
Estey Centre Journal of International Law and Trade Policy 275
1. Introduction he reform in the three main areas of agricultural negotiations – market access, export competition and domestic support – has formed a key element of the Doha
Development Agenda since its launch in 2001. Negotiators missed the 2003 deadline for producing “modalities” (i.e., scope, methodology and numeric targets) for countries’ commitments, and the ministerial meeting of the World Trade Organization, held at Cancun in Mexico in September 2003, ended in deadlock. Subsequent efforts produced at the end of July 2004 an agreement on a “Framework for Establishing Modalities in Agriculture”, the so-called July package (WTO, 2004), which gave new impetus to the negotiations.
This study provides insights into the nature and magnitude of the impacts of an agricultural agreement, considering the trade-offs between different approaches to tariff cuts, such as the Swiss formula and the proportional cuts, and the interaction between developed and developing countries.
Scenarios are analyzed in a set of simulations run with a modified version of the general-equilibrium model of the Global Trade Analysis Project (GTAP) (Hertel, 1997). These are run on a 2013 baseline and aimed at isolating the effects of trade reforms from other changes. Welfare and price effects are studied for a number of countries and regions, and a game-theoretic approach is adopted to analyze the interaction between developed and developing countries. Given that the specific modalities of tariff reductions are at least as important as the overall average reduction (Bureau and Salvatici, 2004), tariff cuts are carried out at the most detailed level of existing information (Harmonized System, or HS, six digits) in the World Integrated Trade Solution (WITS) database (http://wits.worldbank.org).
2. Model and Baseline he GTAP provides a global, perfectly competitive, comparative-static, general-equilibrium model (Hertel, 1997) based on single “regional” households.
Bilateral trade flows are modeled through product differentiation on the demand side, assuming imperfect substitutability between goods produced in different countries (Armington, 1969). Transaction costs are also accounted for, as transport services are explicitly considered among economic activities. In the standard closure case, global investment adjusts to global saving, so that national balances of payments are endogenous.
The GTAP database is built starting from a set of the social accounting matrices of individual countries, and on trade data from COMTRADE. The most recent update – version 6 – refers to 2001 as a base period and employs trade policy data from the
T
T

A. Antimiani, P. Conforti and L. Salvatici
Estey Centre Journal of International Law and Trade Policy 276
MacMaps database (Bouët et al., 2004). Export subsidies are directly derived from countries’ notifications to the WTO.
Ad valorem tariffs are the only trade policy measure explicitly represented in the model. The assessment of the impact of trade liberalization may not be accurate due to the aggregation problem, not to mention the conceptual difficulties related to the presence of non-tariff barriers. In fact, trade policy operates with tariff line definitions that are far more detailed than the sectoral aggregation of existing trade models. We partly overcome this limitation by calculating reduction commitments from the most detailed information available in the WITS.
Scenarios were run for 47 regions, 15 products and 5 endowments (table 1), attempting to maximize the number of WTO members considered; products were chosen with emphasis on agriculture and food.
The construction of the 2013 baseline is based on projections for a number of non-policy variables (table 2) and on policy shocks accounting for some of the most important changes that have occurred and are due to occur in agricultural and trade policies between 2001 and 2013 (table 3). Particular consideration was given to the Common Agricultural Policy (CAP), the instruments of which have been modeled extensively (Bach, Frandsen and Jensen, 2000; Brockmeier, Herok and Salamon, 2001; van Meijl and van Tongeren, 2002; Jensen and Yu, 2005). Our policy specification draws partly on these contributions.
In particular, for direct payments – which are modeled as subsidies to primary factor use – a financial stabilization element based on reference (“base”) areas and on livestock inventory ceilings was added in order to allow the unit subsidy to endogenously adjust to output changes. Changes in intervention prices were approximated through changes in the corresponding import taxes, while dairy quotas were introduced by output increases. Regarding the 2003 Fischler reform of the CAP, decoupling was modeled by replacing the previous payments with a homogeneous subsidy to land use, the level of which was determined endogenously on the basis of the expenditure for crop-specific subsidies in the baseline (table 3).
EU enlargement was modeled through the removal of import tariffs between the EU and the Central and Eastern European countries (CEECs) and the alignment of domestic and trade policies. In order to introduce direct payments in the CEECs by year 2013, ad valorem–equivalent rates were calculated using data from both FAO and the GTAP databases. The Everything but Arms (EBA) preferential initiative was also introduced in the baseline, by eliminating tariffs on imports from least developed countries (LDCs) into the enlarged EU (table 3).

A. Antimiani, P. Conforti and L. Salvatici
Estey Centre Journal of International Law and Trade Policy 277
Table 1 Countries, Regions, Products and Endowments
Countries/Regions Products Endowments
Australia paddy rice land New Zealand cereals skilled labour China vegetables, fruit and nuts unskilled labour Japan oilseeds capital Republic of Korea (South Korea) plant-based fibres natural resources Taiwan other primary products Indonesia livestock and meat Malaysia raw milk Philippines vegetable oils and fats Thailand dairy products Vietnam processed rice Bangladesh sugar India other food products Sri Lanka manufacturing Rest of South Asia services Canada United States Mexico Central America Colombia Peru Venezuela Rest of Andean Pact Argentina Brazil Chile Uruguay Rest of South America Caricom Rest of Caribbean countries European Union (EU15) CEEC Russian Federation Turkey Rest of Middle East Morocco Tunisia Rest of North Africa Malawi Mozambique Tanzania Madagascar South Africa Custom Union Uganda Rest of Southern Africa Rest of sub-Saharan Africa Rest of world

A. Antimiani, P. Conforti and L. Salvatici
Estey Centre Journal of International Law and Trade Policy 278
Table 2 Sources of information for the 2013 baseline
Variable Source
GDP World Bank, World Development Indicators projections, adjusted by USDA/ERS with projections from the Oxford Economic Forecasting, DRI-WEFA, and the Project Link
population United Nations projections
agricultural labour force FAOSTAT total factor productivity Hertel and Martin (2000)
Table 3 Policy Shocks in the 2013 Baseline
Policy measure Shock introduced Sources of shock calculations
increase in the (semi-decoupled) payment per hectare to cereals producers (residual Agenda 2000 reform)
increase in the subsidy on land use +5%, from 54 to 63 Euro/ton
reduction in the cereals intervention price (residual Agenda 2000 reform) import tariff reduction
corresponding to market price reduction as a % of intervention price reduction in van Meijl and van Tongeren (2002)
reduction in the intervention price of butter and smp (Fischler reform) import tariff reduction -22% as trade weighted average of butter
and smp reduction in the intervention price of rice (Fischler reform) import tariff reduction -50% tariff on rice
increase in direct payment to rice producers (Fischler reform)
increases in subsidies to output and to input use
+37% in output subsidy; +96% increase in subsidy to land use
free trade between the EU15 and CEEC (enlargement)
abatement of bilateral tariff and export subsidies between the EU15 and CEEC -100% tariffs and subsidies
extension of the PAC to CEEC (enlargement)
equalization of all input and output subsidies between EU15 and CEEC; equalization of all bilateral tariffs and export subsidies toward the rest of the world
introduction of decoupling of direct payment in EU25 (Fischler reform)
abatement of crop-specific subsidies to land and capital use; introduction of a homogeneous subsidy to land use
FSRI act increase in output subsidies to cereals weighted average of 6% for wheat and 3% for coarse grains (Bouët et al., 2004)
FSRI act reduction in the output subsidy to soybeans -4% (Bouët et al., 2004)
FSRI act increase in output subsidies to dairy 3% (Bouët et al., 2004)
FSRI act increased land set aside -5% reduction in the productivity of land for wheat (Bouët et al., 2004)
direct payment to cereals and oilseeds in China subsidy to land use 13% (FAO data and GTAP database)
increase in direct payment to land use in Mexico subsidy to land use 7% (Eastwood et al., 2004)
Everything but Arms policy (EBA) between EU25 and countries involved in the EBA -100% tariffs
Laura
Laura
Laura
Laura
Laura
Laura
Laura
Laura
Laura
Laura
Laura
Laura
Laura
Laura
Laura
Laura
Laura
Laura
Laura

A. Antimiani, P. Conforti and L. Salvatici
Estey Centre Journal of International Law and Trade Policy 279
Some of the provisions of the U.S. 2002 Farm Security and Rural Investment Act (FSRI) were also considered, following Bouët et al. (2004). A reduction in land productivity was introduced to take into account the increase in the acreage conservation program. Output subsidies were increased for cereals and dairy products and decreased for soybeans. Finally, recent changes in the Mexican PROCAMPO program were considered, together with the direct payments recently granted to grains in China (FAO, 2005).
3. The Doha Agenda and the Trade Policy Reform Scenarios
f the three main areas of agricultural negotiations, our simulation scenarios focus on two: market access and export competition. Although domestic support
is also a contentious issue, it appears unlikely that the United States and the EU would accept any commitment that would disrupt their ongoing efforts towards “decoupling” agricultural support (Jensen and Yu, 2005). Moreover, there is evidence that a reduction in domestic support would account for only a small share of the potential welfare gains from a multilateral agreement (Rae and Strutt, 2003; Anderson, Martin and van der Mensbrugghe, 2005).
In the July package it was agreed that all forms of export subsidies are to be eliminated by a credible end date, while export measures that result in equivalent effects are to be disciplined. Accordingly, all our scenarios provide for the abolishment of export subsidies.
The Doha mandate commits WTO members to “substantially improve market access”. Two major approaches have emerged on this matter: one which would maintain the formula employed in the Uruguay Round Agreement on Agriculture (URAA) and another which proposes “non-linear” tariff cuts. The fundamental problem with the first approach is that it provides no incentives for cutting higher tariffs (“peaks”). The other approach – which could be based, for example, on a “Swiss formula”1 – would produce much steeper cuts on higher tariffs and could also have the effect of establishing a maximum tariff level. On the other hand, it requires the conversion of specific tariffs into ad valorem equivalents, which is quite a sensitive issue from the political point of view, as different conversion criteria may lead to different outcomes.
According to the July package, tariff cuts will be based on a single, tiered approach: the higher the tariff, the higher the cut. The agreement also caters to developed countries’ concerns related to “sensitive products”, as well as to special and differential treatment for developing countries (smaller tariff cuts) and special treatment for “special products” where there are implications for food security.
O

A. Antimiani, P. Conforti and L. Salvatici
Estey Centre Journal of International Law and Trade Policy 280
Meetings held since August 2004, however, have confirmed the difficulty of building consensus on the choice of a formula.
The actual modalities remain subject to negotiation; therefore, the number of bands, the thresholds of such bands and the tariff reductions within each band still need to be discussed. As a consequence, in designing the scenarios we decided to rely upon the Harbinson proposal (WTO, 2003a), which is the only available official proposal envisaging bands. The proposal requires larger reduction rates for the highest tiers and achieves harmonization across bands, but does not imply deeper cuts for higher tariffs within the bands. Building consensus on a non-linear formula is difficult, because the higher reduction in higher tariffs implies different effects in terms of each country’s average tariffs: countries face different degrees of “sacrifice” depending on their initial tariffs.
In order to add realism to the simulation, we considered a proposal advanced by the chair (Girard) of the non-agricultural market access negotiations (WTO, 2003b), which takes into account the differences in the tariff structures by introducing a variable (and country-specific) coefficient into the Swiss formula.2 Note also that a non-linear formula avoids the possibility that cutting a tariff in a given band results in a final tariff that is lower than the final tariff resulting from the cut required in a lower band (“overlapping”).
In essence, we focused on the two following scenarios (see point A1 in the appendix for details):
1. Harbinson approach – no export subsidies. In the March 2003 draft modalities, the formulas in each band use the Uruguay Round approach (average cuts subject to minimums). However, since it would be arbitrary to assume a specific pattern of cut allocations, our first scenario provides for a uniform reduction in each band.
2. Girard approach – no export subsidies. A Swiss formula is applied in each band of the March 2003 draft modalities, using the average bound rate as the coefficient representing the maximum rate allowed within each band.
In both cases tariff cuts are implemented at six Harmonized System (HS) digits, as allowed by the WITS. We also compared bound and applied rate reductions, and calculated a reduction only where the former result was lower than the latter. Such updated tariffs were aggregated from the HS at six digit level up to the GTAP sector definition through weighted averages. The provisions for “sensitive” and “special” products reported in the July package were ignored, given the absence of credible hints about likely criteria for their identification. Concerning the ad valorem

A. Antimiani, P. Conforti and L. Salvatici
Estey Centre Journal of International Law and Trade Policy 281
63.8
30.7
5.5Band <15
Band 15<>90
Band >90
Figure 1a Developed countries: % of total tariffs in each band
equivalents of the specific tariffs, we employed those provided by the WITS database which were computed with the UNCTAD Method 1.
A third, “free trade” scenario, implying the removal of all trade policies, was also simulated as a benchmark.
4. Results
4.1 Tariff-cutt ing Criteria and Their Effects Before analyzing the economic consequences of the scenarios, it is useful to explore the implications of the tariff-cutting formulas employed in each.
It should be noted, first, that the shares of tariffs included in each band for developed and developing countries are in fact quite different (figure 1). This difference is unavoidable if thresholds are homogeneous across countries, but it may create problems if a small number of members were to end up with most of their tariffs in the highest band. In the same vein, a “ghetto issue” could arise if a limited number of tariff lines were grouped in a band: political economy considerations suggest that it could be easier to accept substantial cuts if a specific industry is not cornered in the highest band. To achieve a homogeneous share of tariffs in each band, boundaries may be determined in terms of quantiles of the tariff distributions; this would be simple and objective, but would imply different thresholds for each country.

A. Antimiani, P. Conforti and L. Salvatici
Estey Centre Journal of International Law and Trade Policy 282
8.7
33.2
11.6
9.4
Band <20Band 20<>60Band 60<>120Band >120
Figure 1b Developing countries: % of total tariffs in each band
Second, it should be noted that in many cases the two scenarios do not differ
significantly in terms of reduction in the average tariffs (figures 2 and 3). To understand such an outcome, recall that “concave formulas” such as the Swiss one, reduce high tariffs more sharply, but they reduce low tariffs less sharply than do linear formulas below a “switching point”. The value of the point is inversely related to the proportional reduction and directly related to the (simple) average within the band (the analytical expression is derived in equation (3) of point A1 in the appendix). As a consequence, the Harbinson scenario is more likely to result in a higher number of larger cuts in the lower bands, as well as in the case of tariff structures characterized by a few large tariffs within each band.
0
10
20
30
40
50
Korea Rest of World EU25 Japan Australia Nez Zeland Canada USA
Bound Harbinson Girard
Figure 2 Average bound tariff and final tariff for Harbinson and Gerard cuts in
selected developed countries.

A. Antimiani, P. Conforti and L. Salvatici
Estey Centre Journal of International Law and Trade Policy 283
0
10
20
30
40
50
60
70
80
90
100
110
120
India Morocco Brazil Argentina China
Bound Harbinson Girard
Figure 3 Average bound tariff and final tariff for Harbinson and Gerard cuts in
selected developing countries Finally, the inclusion of preferential and/or applied tariffs is one of the advantages
of the version 6 GTAP database. Many developing countries apply Most-Favoured Nation (MFN) rates that are lower than their bound tariffs, due to high initial bindings and subsequent sharp waves of reductions in applied rates (Francois, Martin and Manole, 2005). The difference between bound and applied tariffs is usually referred to as “water”; the larger the amount of water in the tariffs, the less likely the reduction of the bound tariffs will result in an actual improvement in market access. Figure 4 provides information on the percentages of agricultural tariffs where the cut is effectively implemented, since the difference between the old and new bound rate is larger than the tariff overhang. The figure refers to developing countries, but it is worth recalling that the applied tariffs of developed countries also are much lower than their bound tariffs under preferential agreements.3

A. Antimiani, P. Conforti and L. Salvatici
Estey Centre Journal of International Law and Trade Policy 284
0
10
20
30
40
50
60
70
80
90
100
Chile
Tanza
nia
Malawi
India
Centra
l Ameri
ca
Philipp
ines
Rest of S
outh A
sia
South
Africa
Custom U
nion
Urugua
y
Rst of
the Cari
bbean
Rest of
South
Ameri
ca
Rest of
Sub S
ahara
n Afri
caPeru
Rest of th
e And
ean Pact
Thaila
nd
Turkey
Rest of
Nort
h Africa
China
Harbinson Girard
Figure 4 Developing countries. Percent of tariff lines in which cuts are effectively applied
4.2 Scenario Analysis Simulations confirm some basic intuitions: first, the degree of tariff reduction is positively related to the potential gains in economic welfare and market price changes; second, results are similar under the Harbinson and the Girard scenarios. Hence, what follows will deal mostly with the first of these two scenarios.
Geographically, simulations show that trade policy reform leads to a decrease in market prices in the major economies of Asia, in the Mediterranean region, in sub-Saharan Africa and in Europe, whereas in Oceania and throughout the Americas prices increase in most cases. With few exceptions – Japan and South Korea – price changes range up to a maximum of 15 percent and are below 10 percent in most instances (table 4).
Prices increase in Australia and New Zealand, especially for dairy products, and prices for rice increase in Thailand. India and China experience marked changes for oilseeds, due to both the reduction in the high tariffs and increased imports from South America. Price increases are also projected for the United States, Canada and Central America – especially for rice, cereals, oilseeds, and fruits and vegetables – in Uruguay for dairy, livestock and cereals, and in Argentina and Brazil, especially for oilseeds and cereals (table 4).

A. Antimiani, P. Conforti and L. Salvatici
Estey Centre Journal of International Law and Trade Policy 285
Table 4 Percentage Changes in Market Prices under the “Harbinson” Reform Scenario
Paddy Cereals Veg., fr., nts.
Oil-seeds
Sug. cane &
bt.
Oth. prim.
prods.
Live-stock
Raw milk
Veg oils & fats
Dairy prods.
Proc. rice
Plant based
Oth. foods
China 1.1 -0.7 -0.1 -5.1 -0.7 -0.4 -1.5 -1.7 -11.4 -1.0 -1.3 -0.2 -1.9Japan -12.7 -10.4 -6.7 -6.1 -22.3 -4.3 -7.5 -10.1 -0.8 -5.7 -36.3 -3.5 -4.7Republic of Korea -4.4 -13.6 -5.4 -35.7 -2.7 -1.9 -12.4 -12.4 -63.3 -6.2 -4.3 -4.1 -19.5Taiwan -0.5 -0.4 -0.6 2.5 -0.3 -1.6 -0.3 -0.2 0.8 -0.2 -0.4 -0.3 -0.2Indonesia -0.9 0.3 0.1 -0.5 -0.5 0.0 0.3 -0.1 -0.1 -0.3 -0.8 0.4 -0.2Malaysia 10.0 1.4 2.0 1.9 -0.9 -8.5 -2.2 -7.5 0.2 -0.8 -11.2 2.1 -9.2Philippines -3.2 -2.5 -1.9 -1.9 -1.4 0.9 -2.4 -2.6 -0.6 -1.2 -2.4 -1.2 -1.4Thailand 13.0 1.2 5.8 3.2 4.3 2.8 0.3 -0.6 -0.5 -2.3 10.5 2.4 -3.2Vietnam -3.1 -1.6 -3.2 -4.7 -1.8 -2.3 -3.0 -1.3 -1.3 0.1 -3.1 -1.3 -1.4Bangladesh -2.7 -2.6 -3.3 -2.9 -1.8 -2.7 -2.8 -2.8 -3.1 -2.4 -2.1 -1.7 -2.1India -1.4 -1.4 -2.2 -2.2 -1.0 -1.5 -2.2 -1.7 -1.8 -1.4 -0.8 -1.5 -1.1Sri Lanka -3.5 -0.1 -2.6 -4.2 -2.1 -0.9 -2.2 -3.1 -2.8 -2.9 -4.1 -0.8 -1.4Rest of Asia -3.5 -2.0 -2.1 -3.0 -2.1 -2.8 -1.7 -2.2 -3.9 -2.1 -2.2 -1.6 -1.9USA 10.7 1.4 1.3 2.3 0.0 1.2 0.2 0.8 0.6 0.2 0.4 1.0 0.1Mexico 1.7 0.0 -0.1 0.7 -0.5 -0.3 -0.4 -1.0 0.6 -0.6 -0.3 -0.1 -0.7Canada 0.8 0.9 0.2 -0.2 0.2 0.1 -0.5 -0.8 -0.6 -1.5 1.3 0.1 -0.4Colombia 1.6 0.6 4.6 1.2 0.2 1.1 0.9 1.4 -0.2 0.4 0.0 0.5 0.1Venezuela -0.5 -0.6 -0.2 -0.4 -0.2 -0.7 -0.5 -0.5 -0.4 -0.4 -0.3 -0.8 -0.3Perù 9.9 7.3 8.1 9.1 5.0 7.1 7.9 9.5 3.8 0.9 0.5 7.4 2.4Rest of Andean Pact 4.9 3.5 9.2 3.2 1.8 4.4 3.5 5.0 0.9 1.9 1.4 3.4 1.4Argentina 4.3 3.8 5.0 5.8 2.7 5.7 3.6 6.2 4.3 3.4 3.2 2.9 2.1Brazil 6.8 6.7 6.2 6.1 4.3 6.8 7.0 7.1 4.5 4.5 4.6 5.9 3.7Chile 4.4 3.7 4.6 3.2 2.5 1.8 3.9 5.5 0.3 1.8 1.5 -0.2 1.3Uruguay 7.9 8.3 7.2 5.6 5.2 5.9 8.2 13.3 4.4 10.1 4.0 3.5 5.0Rest of South America 5.7 7.6 7.8 5.7 7.0 3.9 5.8 6.8 3.4 4.8 3.6 4.1 4.0Central America 0.7 1.0 4.1 1.8 0.8 0.5 0.7 1.4 0.2 -0.8 -1.0 1.9 -0.2Caricom 0.1 -0.1 0.4 -0.4 1.4 -0.5 -0.7 0.0 -0.6 -1.3 -0.9 0.3 -0.9Rest of Caribbean 0.2 -0.3 -0.4 -0.1 0.1 -0.1 -0.7 -0.9 -0.1 -0.7 -0.4 -0.1 -0.3EU15 0.1 0.2 -0.4 0.2 -3.1 0.0 -0.9 -0.3 -0.3 -0.5 -0.4 -0.1 -0.7CEEC 0.1 0.3 0.2 0.3 0.2 0.1 0.0 0.8 0.0 0.1 -0.1 0.0 0.0Turkey 0.1 -0.1 0.3 0.8 -0.1 0.8 -1.0 -0.6 0.0 -0.2 -4.9 0.3 -3.4Russian Federation -1.5 -1.0 -0.9 -1.5 0.8 -1.5 -0.6 -0.6 -1.0 -0.5 -0.6 -0.9 -0.4Rest of Middle East -0.5 -1.4 -0.8 -0.7 -2.0 -0.8 -1.5 -1.5 -0.9 -0.9 -2.7 -0.4 -1.9Morocco -6.3 0.7 1.0 0.4 -0.2 -0.7 1.8 0.5 -0.6 -0.4 -1.2 0.4 -0.5Tunisia -4.0 -8.7 2.5 -4.7 0.2 -7.1 -5.5 -1.6 -4.1 -1.8 -4.7 0.5 0.4Rest of North Africa -1.1 -1.1 -0.9 -0.4 -1.0 -4.0 -1.4 -1.2 -1.4 -1.1 -1.2 -1.0 -1.0S. African Cust. Union 2.0 0.8 1.8 2.7 1.0 1.7 1.0 1.2 -0.1 0.1 0.5 1.5 0.2Tanzania -3.1 -2.7 -2.9 -2.9 -2.0 -2.6 -2.4 -2.8 -2.3 -2.2 -3.1 -1.6 -2.3Mozambique -2.4 -2.4 -2.6 -1.6 -2.1 -2.2 -3.1 -3.0 -2.3 -2.2 -2.3 -1.2 -1.8Rest S. Africa -7.4 -6.5 -6.6 -7.3 -8.0 -4.1 -6.0 -6.3 -5.3 -4.0 -4.1 -4.6 -4.6Madagascar -1.7 -1.6 -1.8 -1.7 -1.5 -1.8 -1.6 -1.6 -1.5 -1.4 -1.7 -1.4 -1.4Uganda -2.5 -2.3 -2.4 -2.4 -2.1 -2.1 -2.5 -2.4 -2.2 -2.7 -1.8 -1.8 -2.2Malawi -5.1 -4.9 -5.0 -4.4 -6.5 -3.9 -6.3 -5.9 -5.3 -5.6 -5.4 -3.4 -6.1Rest s-S. Africa -2.9 -2.2 -2.6 -0.4 -1.8 -1.9 -2.4 -2.4 -1.7 -4.0 -2.8 -1.3 -1.8Australia 13.2 4.6 2.4 0.3 1.6 0.6 1.3 2.5 0.7 1.3 3.3 1.7 0.9New Zealand 1.8 2.6 3.1 1.8 0.6 -0.4 1.5 4.7 0.8 2.9 1.0 1.9 0.7Rest of world -1.2 -1.5 -1.5 -1.5 -1.3 -1.6 -2.4 -1.6 -2.5 -0.9 -1.3 -0.9 -1.4
Source: Own calculation

A. Antimiani, P. Conforti and L. Salvatici
Estey Centre Journal of International Law and Trade Policy 286
Europe and the Russian Federation show price reductions, especially for sugar, livestock and dairy in the EU 15. The Russian Federation – where no trade policy reform applies, as the country is not a WTO member – shows a generalized marked price decrease, with the exception of sugar. The same is projected for sub-Saharan Africa, particularly for rice, livestock and dairy, while South Africa shows price improvements for many key products (table 4).
Changes in the real returns to land are consistent with the observed price behaviour. Reductions appear across East and Southeast Asia, Africa, the Middle East and Europe, while positive outcomes are found for the large producers of Latin America and Oceania. Increases are projected for a few LDCs, for example Malawi, and in South Africa (figure 5).
Changes in the returns to labour – skilled and unskilled labour behave similarly – are not directly related to the performance of the primary sector. Significant increases materialize in many countries where agricultural prices are projected to decrease, since improved resource allocation following from trade reform drives up the remuneration of this primary factor, both where the economy was distorted in the baseline and where there are benefits from improved price conditions (figure 6).

A. Antimiani, P. Conforti and L. Salvatici
Estey Centre Journal of International Law and Trade Policy 287
-80 -60 -40 -20 0 20 40 60 80 100 120
China
Japan
Republic of Korea
Taiwan
Indonesia
Malasya
Philippines
Thailand
Vietnam
Bangladesh
India
Sri Lanka
Rest of Asia
USA
Mexico
Canada
Colombia
Venezuela
Perù
Rest of Andean Pact
Argentina
Brazil
Chile
Uruguay
Rest of South America
Central America
Caricom
Rest of Caribbean
EU15
CEEC
Turkey
Russian Federation
Rest of Middle east
Morocco
Tunisia
Rest of North Africa
South African Custom Union
Tanzania
Mozambique
Rest S. Africa
Madagascar
Uganda
Malawi
Rest S-S. Afr.
Australia
New Zealand
Rest of World
HarbinsonFree-trade
Figure 5 Percentage change in real return to land

A. Antimiani, P. Conforti and L. Salvatici
Estey Centre Journal of International Law and Trade Policy 288
-6 -4 -2 0 2 4 6 8
China
Japan
Republic of Korea
Taiwan
Indonesia
Malasya
Philippines
Thailand
Vietnam
Bangladesh
India
Sri Lanka
Rest of Asia
USA
Mexico
Canada
Colombia
Venezuela
Perù
Rest of Andean Pact
Argentina
Brazil
Chile
Uruguay
Rest of South America
Central America
Caricom
Rest of Caribbean
EU15
CEEC
Turkey
Russian Federation
Rest of Middle east
Morocco
Tunisia
Rest of North Africa
South African Custom Union
Tanzania
Mozambique
Rest S. Africa
Madagascar
Uganda
Malawi
Rest S-S. Afr.
Australia
New Zealand
Rest of World
HarbinsonFree-trade
Figure 6 Percentage change in real return to skilled labour
The major world agricultural economies, where agricultural trade is a substantial portion of total trade, show more substantial changes in their overall terms of trade (figure 7) – an improvement in the cases of South America, Australia, New Zealand,

A. Antimiani, P. Conforti and L. Salvatici
Estey Centre Journal of International Law and Trade Policy 289
Morocco and Tunisia, and a worsening in South Asia and some African countries. On the other hand, smaller changes arise in some industrialized economies – the United States, Canada and the EU – due to the smaller relative importance of agricultural trade.
-6.0 -4.0 -2.0 0.0 2.0 4.0 6.0 8.0
China
Japan
Republic of Korea
Taiwan
Indonesia
Malasya
Philippines
Thailand
Vietnam
Bangladesh
India
Sri Lanka
Rest of Asia
USA
Mexico
Canada
Colombia
Venezuela
Perù
Rest of Andean Pact
Argentina
Brazil
Chile
Uruguay
Rest of South America
Central America
Caricom
Rest of Caribbean
EU15
CEEC
Turkey
Russian Federation
Rest of Middle east
Morocco
Tunisia
Rest of North Africa
South African Custom Union
Tanzania
Mozambique
Rest S. Africa
Madagascar
Uganda
Malawi
Rest S-S. Afr.
Australia
New Zealand
Rest of World
HarbinsonFree-trade
Figure 7 Percentage changes in the terms of trade
A. Antimiani, P. Conforti and L. Salvatici
Estey Centre Journal of International Law and Trade Policy 290
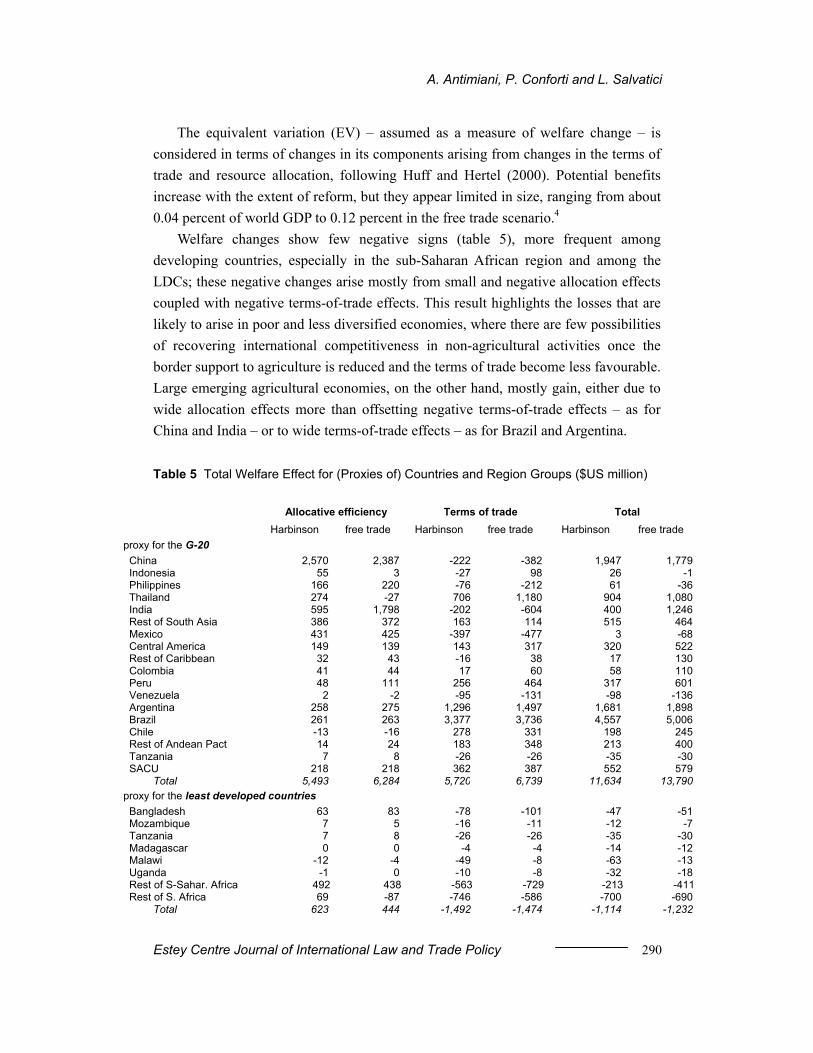
The equivalent variation (EV) – assumed as a measure of welfare change – is considered in terms of changes in its components arising from changes in the terms of trade and resource allocation, following Huff and Hertel (2000). Potential benefits increase with the extent of reform, but they appear limited in size, ranging from about 0.04 percent of world GDP to 0.12 percent in the free trade scenario.4
Welfare changes show few negative signs (table 5), more frequent among developing countries, especially in the sub-Saharan African region and among the LDCs; these negative changes arise mostly from small and negative allocation effects coupled with negative terms-of-trade effects. This result highlights the losses that are likely to arise in poor and less diversified economies, where there are few possibilities of recovering international competitiveness in non-agricultural activities once the border support to agriculture is reduced and the terms of trade become less favourable. Large emerging agricultural economies, on the other hand, mostly gain, either due to wide allocation effects more than offsetting negative terms-of-trade effects – as for China and India – or to wide terms-of-trade effects – as for Brazil and Argentina.
Table 5 Total Welfare Effect for (Proxies of) Countries and Region Groups ($US million)
Allocative efficiency Terms of trade Total Harbinson free trade Harbinson free trade Harbinson free trade proxy for the G-20 China 2,570 2,387 -222 -382 1,947 1,779 Indonesia 55 3 -27 98 26 -1 Philippines 166 220 -76 -212 61 -36 Thailand 274 -27 706 1,180 904 1,080 India 595 1,798 -202 -604 400 1,246 Rest of South Asia 386 372 163 114 515 464 Mexico 431 425 -397 -477 3 -68 Central America 149 139 143 317 320 522 Rest of Caribbean 32 43 -16 38 17 130 Colombia 41 44 17 60 58 110 Peru 48 111 256 464 317 601 Venezuela 2 -2 -95 -131 -98 -136 Argentina 258 275 1,296 1,497 1,681 1,898 Brazil 261 263 3,377 3,736 4,557 5,006 Chile -13 -16 278 331 198 245 Rest of Andean Pact 14 24 183 348 213 400 Tanzania 7 8 -26 -26 -35 -30 SACU 218 218 362 387 552 579
Total 5,493 6,284 5,720 6,739 11,634 13,790proxy for the least developed countries Bangladesh 63 83 -78 -101 -47 -51 Mozambique 7 5 -16 -11 -12 -7 Tanzania 7 8 -26 -26 -35 -30 Madagascar 0 0 -4 -4 -14 -12 Malawi -12 -4 -49 -8 -63 -13 Uganda -1 0 -10 -8 -32 -18 Rest of S-Sahar. Africa 492 438 -563 -729 -213 -411 Rest of S. Africa 69 -87 -746 -586 -700 -690
Total 623 444 -1,492 -1,474 -1,114 -1,232
Laura
Laura
Laura
Laura
Laura
Laura

A. Antimiani, P. Conforti and L. Salvatici
Estey Centre Journal of International Law and Trade Policy 291
proxy for the net-food-importing developing countries Sri Lanka 30 52 -26 127 4 177 Rest of South Asia 386 372 163 114 515 464 Central America 149 139 143 317 320 522 Rest of Caribbean 32 43 -16 38 17 130 Peru 48 111 256 464 317 601 Venezuela 2 -2 -95 -131 -98 -136 Morocco 294 355 51 -29 346 328 Tunisia 303 377 95 350 424 810 Rest of North Africa 194 121 -291 -463 -151 -373
Total 1,437 1,568 281 787 1,692 2,524proxy for developed countries Australia -110 -113 777 1,238 609 1,051 New Zealand 24 48 353 1,111 336 1,050 Japan 27,076 27,071 -3,853 -4,031 23,990 23,835 South Korea 4,162 3,975 -472 -482 3,507 3,328 Canada 1,207 1,002 -304 -2 881 976 United States -1,135 -1,079 1,816 1,394 594 247 EU-15 7,486 8,527 -1,735 -3,665 5,452 4,262 CEEC -406 267 439 345 86 472
Total 38,303 39,699 -2,978 -4,091 35,456 35,221proxy for the Cairns Group Argentina 258 275 1,296 1,497 1,681 1,898 Australia -110 -113 777 1,238 609 1,051 Brazil 261 263 3,377 3,736 4,557 5,006 Canada 1,207 1,002 -304 -2 881 976 Chile -13 -16 278 331 198 245 Colombia 41 44 17 60 58 110 Indonesia 55 3 -27 98 26 -1 Malaysia 1,664 1,444 -379 70 1,145 1,331 New Zealand 24 48 353 1,111 336 1,050 Philippines 166 220 -76 -212 61 -36 SACU 218 218 362 387 552 579 Uruguay 96 138 300 488 461 727
Total 3,866 3,526 5,974 8,804 10,563 12,935Other countries Taiwan -38 239 24 -162 -9 100 Vietnam -5 -8 -102 -96 -201 -180 Rest of South America 67 71 257 312 304 359 Turkey 323 444 241 234 568 685 Russian Federation 131 109 -294 -204 -147 -65 Rest of Middle East 530 167 -883 -798 -432 -672 Rest of World 3,221 3,202 -370 -1,271 2,793 1,823
Total 4,230 4,225 -1,126 -1,985 2,875 2,049Grand total 53,953 55,745 6,379 8,779 61,105 65,286
Results for the LDCs support the notion that these countries require ad hoc
measures to counteract potential losses. The same applies to some of the net-food-importing developing countries (NFIDCs), for which, however, a net aggregated benefit arises from substantial benefits for certain countries within that group. OECD countries, on the other hand, appear set to reap most of the benefits, together with the so-called Cairns group.5
4.3 A Game Approach to the Negotiation Welfare results have been elaborated by grouping countries into two broad entities – developed and developing countries – to study the interactions between their
Laura
Laura
Laura
Laura
Laura

A. Antimiani, P. Conforti and L. Salvatici
Estey Centre Journal of International Law and Trade Policy 292
respective possible strategies. A two-player, normal-form, non-cooperative, single-period game based on the model results is employed to search for a Nash equilibrium. Details on the game are in point A2 of the appendix.
In order to achieve an agreement in which both groups are at least as well off as before, the settlement must lie within the set of agreement actions (Kennedy, von Witzke and Roe, 1996). Strategies analysed are the three liberalization scenarios described in section 3, namely Harbinson (h), Girard (g) and free trade (ft), plus a status quo (sq).
Each player chooses a strategy by maximising its payoff given the strategy of the other, and the same set of strategies exists for both players. A Nash equilibrium occurs where each group chooses policies that are the best response to the choice of the other, maximising its EV given the choice of the other group.
Governments are assumed to maximize domestic welfare. The payoffs are money-metric measures of utility change from a base period. The differences in EV between the baseline and the scenarios are used to determine the amount of money available for compensation across countries within the two groups. Without compensations, the agreement action space would be empty, since in all scenarios some developing country would be worse off. Compensation is assumed to be given up to where the compensating country’s EV declines or the compensated country’s EV increases to status quo levels, whichever comes first.
Results are all positive (table 6); thus, within the groups it is always possible for countries to be better off than in the status quo. The number of countries reporting negative results in each case appears in parentheses. The unique Nash equilibrium occurs when both groups choose the “Girard scenario”, which is a symmetric dominant strategy for both players. Hence both groups, in principle, should be willing to significantly reduce agricultural protection. Table 6 Welfare Results from Game Simulations ($US million)
DGs/DCs* Status quo Harbinson Girard Free trade
Status quo 0; 0 7023; 50788 (17; 0) 7260; 52665 (17; 0) 7375; 50115 (17; 0)
Harbinson 4930; 230 (15; 4) 14223; 52251 (14; 0) 14463; 54104 (13; 0) 14569; 51526 (15;0)
Girard 5550; 618 (15; 3) 14847; 52648 (14; 0) 15072; 54390** (13; 0) 15194; 51925 (15; 0)
Free trade 5402; 1206 (18; 5) 14603; 53486 (15; 0) 14835; 55347 (15; 0) 14939; 52782 (15; 0)
In parentheses: the number of countries experiencing a loss in each group. * Developed countries (DCs) include: Australia, New Zealand, Japan, Korea, US, Canada, EU-25 (including EU-15 and CEEC) and ROW; other countries and regions listed in table 1 are included in the developing countries (DGs) group. ** Nash equilibrium
Laura
Laura
Laura

A. Antimiani, P. Conforti and L. Salvatici
Estey Centre Journal of International Law and Trade Policy 293
Although the Girard scenario was built to represent a possible compromise, this result does not necessarily provide a realistic forecast for the final outcome of the negotiations: inter-country compensations and side payments should not be taken for granted, and economic efficiency is certainly not the only – or even main – concern of policy makers.
5. Concluding Remarks he key parameters of the tiered approach to agricultural market access are still to be addressed within the ongoing WTO negotiations, and it is not clear yet what
the result may be in terms of tiers’ thresholds and tariff-cutting formulas. By examining the potential effects of a possible non-linear formula (the “Girard scenario”), we showed that there are few significant differences with respect to the Harbinson proposal, given the tariff distribution within the bands and the extent of the binding overhang. Therefore, as long as a substantial reduction in the average is met, choosing a linear approach may not greatly affect the outcome.
The analysis of the strategic interaction between developed and developing countries shows that, in principle, significant trade liberalization in agriculture should be the dominant strategy for both groups. Looking at the evolution of the actual negotiations, this result mostly highlights the extent to which the assumption of “neutral”, welfare-maximizing governments is ineffective for understanding governments’ behaviour.
Scenario results are consistent with orthodox expectations about the effects of a reduction in border protection: they confirm the notion that liberalization is positively related to the economic benefits arising from an increased role played by comparative advantages in determining product and factor prices. Potential benefits are likely in a number of European, American and Asian countries, which would change their agricultural production mixes and/or move labour and capital outside agriculture.
The same, however, does not apply to a number of African, to some Southern Asian, and to some Latin American countries, whose potential to benefit from relocating resources inside and outside agriculture is limited by the extent and the diversification of their economies, and whose terms of trade may deteriorate significantly. While this aspect – which appears to be correctly captured by the general-equilibrium approach – calls for ad hoc measures, such measures should be designed so as to minimize their interference with trade reform, in order not to undermine the efforts of these same countries to exploit the opportunities offered by a more liberalized trade environment.
T

A. Antimiani, P. Conforti and L. Salvatici
Estey Centre Journal of International Law and Trade Policy 294
References Anderson K., W. Martin, and D. van der Mensbrugghe. 2005. Doha merchandise trade
reform and developing countries. Paper presented at the 8th Annual Conference on Global Economic Analysis, Lübeck, Germany, 2005.
Armington, P. A. 1969. A theory of demand for products distinguished by place of production. International Monetary Fund Staff Papers, 16.
Bach C. F., S. E. Frandsen, and H. G. Jensen. 2000. Agricultural and economy-wide effects of European enlargement: Modelling the Common Agricultural Policy. Journal of Agricultural Economics 51(2).
Brockmeier M., C. A. Herok, and P. B. Salamon. Technical and institutional changes in an enlarged EU: Welfare effects for old and new members with a focus on the agri-food chain. Paper prepared for the Fourth Annual Conference on Global Economic Analysis, Purdue University, June 27 – June 29, 2001.
Bouët A., L. Fontagné, M. Mimouni, and X. Pichot. 2004. Market access maps: A bilateral and disaggregated measure of market access. Cepii document 18. Paris: Centre d’Etudes Prospectives et d’Information Internationale.
Bureau, J.-C., and L. Salvatici. 2004. WTO negotiations on market access: What we know, what we don’t and what we should. In Agricultural Policy Reform and the WTO: Where Are We Heading?, eds. G. Anania, M. E. Bohman, C. A. Carter, and A. F. McCalla. Cheltenham, UK & Northampton MA, USA: Edward Elgar Publishing (in press).
Eastwood R., M. Lipton, and A. Newell. 2004. “Farm size” paper prepared for volume III of the Handbook of Agricultural Economics, University of Sussex.
FAO. 2005. Review of Basic Food Policies 2003–2004. Rome: Commodities and Trade Division, FAO.
Francois J., W. Martin, and V. Manole. 2005. Choosing formulas for market access negotiations: Efficiency and market access considerations. World Bank Policy Research Working Paper 3474. Washington D.C.
Jensen H. G., and W. Yu. 2005. Reforming agricultural domestic support of the EU in the Doha Round: Measurement, feasibility, and consequences. Paper presented at the 8th Annual Conference on Global Economic Analysis, Lübeck, Germany, 2005.
Hertel, T. 1997. Global trade analysis: Modeling and applications. Cambridge, UK: Cambridge University Press.

A. Antimiani, P. Conforti and L. Salvatici
Estey Centre Journal of International Law and Trade Policy 295
Hertel T. W., and W. Martin. 2000. Second best linkages and the gain from global reform of manufactures trade. Review of International Economics 9(2): 215-32.
Huff, K., and T. Hertel. 2000. Decomposing welfare changes in the GTAP. GTAP Technical Paper no. 19. West Lafayette, IN: Purdue University.
Kennedy, P. L., H. Von Witzke, and T. L. Roe. 1996. Multilateral agricultural trade negotiations: A non co-operative and co-operative game approach. European Review of Agricultural Economics 23(4): 381-399.
Rae, A. N., and A. Strutt. 2003. The current round of agricultural trade negotiations: Should we bother about domestic support? The Estey Centre Journal of International Law and Trade Policy 4(2): 98-122.
van Meijl, H., and F. van Tongeren. 2002. The Agenda 2000 CAP reform, world prices and GATT–WTO export constraints. European Review of Agricultural Economics 29: 445-470.
WTO. 2003a. Negotiations on agriculture. First draft of modalities for the further commitments. TN/AG/W/1/Rev.1. Geneva.
WTO. 2003b. Draft elements of modalities for negotiations on non-agricultural products. TN/MA/W/35. Geneva.
WTO. 2004. Annex A. Framework for establishing modalities in agriculture. Decision adopted by the General Council on 1 August 2004. WT/L/579.
Endnotes ∗ This work was in part financially supported by the Agricultural Trade Agreements
(TRADEAG) project, funded by the European Commission (Specific Targeted Research Project, contract no. 513666) and in part supported by the Italian Ministry of University and Technological Research (“The new multilateral trade negotiations within the World Trade Organisation (Doha Round): liberalisation prospects and the impact on the Italian economy”). The authors are solely responsible for the contents of this article.
1 . This is a type of formula implying proportionally higher cuts for higher tariffs. See the appendix for the details of the calculation.
2. To some extent, this would also take into account the differences in tariff structures between developed and developing countries, since the latter generally maintain significantly higher bound rates. In the Harbinson scenario, instead, special and differential treatment for developing countries implies different thresholds and smaller cuts.

A. Antimiani, P. Conforti and L. Salvatici
Estey Centre Journal of International Law and Trade Policy 296
3. It should be noted, for instance, that more than one-third of the value of EU food
and agricultural imports enjoys preferential treatment, and that only nine countries export food products to the United States without enjoying some tariff preferences (Bureau and Salvatici, 2004).
4. The GDP employed in this comparison is the one reported in the GTAP database. 5. Caution should be applied in considering aggregated evidence for country groups,
due to the inevitably low accuracy of group representation: Central America and the Caribbean is a single region, as is the “rest of North Africa”; also, several participants in the Cairns group are not available as individual countries in the database.
The technical annex to this paper, pages 297-298 is available as a separate document.
The views expressed in this article are those of the author(s) and not necessarily those of the Estey Centre Journal of International Law and Trade Policy nor the Estey Centre for Law and Economics in International Trade. © The Estey Centre for Law and Economics in International Trade.