THE EPIDEMIOLOGY AND INCIDENCE OF TYPE 1 DIABETES IN ...
81
1 EPIDEMIOLOGY OF TYPE 1 DIABETES IN CHILDREN IN HUNGARY PhD Thesis Éva K Gyürüs, MD Department of Paediatrics Faculty of Medicine University of Pécs Program leader: Gyula Soltész MD, PhD, DSc 2011
Transcript of THE EPIDEMIOLOGY AND INCIDENCE OF TYPE 1 DIABETES IN ...
1
EPIDEMIOLOGY OF TYPE 1 DIABETES IN CHILDREN
IN HUNGARY
PhD Thesis
Éva K Gyürüs, MD
Department of Paediatrics
Faculty of Medicine
University of Pécs
Program leader: Gyula Soltész MD, PhD, DSc
2011

2
TABLE OF CONTENT
I. INTRODUCTION…………………….………………….…………………….……….....4
1. Classification of diabetes......................……………….……………………...……..........4
1.1 Type 1 diabetes………...…….………………………………………......………..…..6
1.2 Type 2 diabetes……...…….…………....……………………………......…………....8
1.3 MODY.......................................................................................................................9
2. Clinical presentation of diabetes......................................................................................9
3. Immune markers of type 1 diabetes...............................................................................10
4. Genetics of type 1 diabetes.............................................................................................12
5. Environmental factors……….……….....................………………………………….…13
6. Incidence of childhood type 1 diabetes……..…….…………...........................…….…14
6.1 Type 1 diabetes worldwide.........................................................................................15
6.2 Within-country variation............................................................................................19
6.3 Ethnicity…………...…………………………………………………….…………....19
6.4 Seasonality of type 1 diabetes…….............……...…………………….……………..20
6.5 Age............................................................................................................................21
6.6 Gender…………………………………………………………………….…………..22
6.7 Temporal trends in the incidence of T1DM……………………....…….……………..22
II. AIMS……………………………………………………....…………………………......24
III. INCIDENCE OF T1DM IN CHILDREN (0-14 YEARS) IN HUNGARY................26
1. Study design.....................................................................................................................26
2. Statistical methods............................................................................................................27
3. Results.............................................................................................................................28
4. Discussion........................................................................................................................36
IV. CLINICAL CHARACTERISTICS OF T1DM AT ONSET......................................39
1. Study design.....................................................................................................................39
2. Statistical methods............................................................................................................41
3. Results.............................................................................................................................42
4. Discussion........................................................................................................................50
V. THESIS..........................................................................................................................52
VI. REFERENCES............................................................................................................57

3
Abbreviations:
BMI-SDS Body mass index Standard deviation score (z score )
DKA Diabetic ketoacidosis
GAD glutamic acid decarboxylase
GDM gestational diabetes mellitus
HbA1c glycated haemoglobin
HLA human leucocyte antigen
IFG impaired fasting glucose
IGT impaired glucose tolerance
MODY maturity onset diabetes of the young
OGTT oral glucose tolerance test
T1DM type 1 diabetes
T2DM type 2 diabetes mellitus

4
THE EPIDEMIOLOGY AND INCIDENCE OF TYPE 1 DIABETES
I. INTRODUCTION
Diabetes mellitus is a complex multifactorial and heterogeneous syndrome characterized by
hyperglycaemia resulting from inadequate insulin secretion and/or insulin action. Several
pathogenic processes ranging from autoimmune destruction of the β-cells of pancreas to
abnormalities that result in resistance to insulin are involved in the development of diabetes.
The chronic hyperglycaemia of diabetes is associated with long-term complications including
cardiovascular disease, renal disease, peripheral neuropathy, visual abnormality and
dermatologic problems. Diabetes mellitus represents a huge burden to the individual, the
family and to the society. Furthermore, as its rate has reached an alarming proportion
worldwide, diabetes is a disease of great public health importance.
1. Classification of diabetes
The new classification proposes that hyperglycaemia, regardless of the underlying cause, can
be subcategorized as follows: insulin-requiring for survival, insulin-requiring for control (i.e.,
for metabolic control, not for survival), not insulin-requiring (i.e. with treatment by non-
pharmacological methods or drugs other than insulin). IGT is now categorized as a stage in
the natural history of disordered carbohydrate metabolism. IGT is coupled with impaired
fasting glucose (IFG) (6.1-7.0 mmol/l).

5
The classification of diabetes includes four clinical classes: type 1 diabetes, type 2 diabetes,
other specific types of diabetes and gestational diabetes.
Table 1 - Etiologic classification of diabetes mellitus based on the report of the Expert
Committee on the Diagnosis and Classification of Diabetes (1)
I. Type 1 diabetes (β-cell destruction, usually leading to absolute insulin deficiency)
A. Immune mediated
B. Idiopathic
II. Type 2 diabetes (may range from predominantly insulin resistance with relative insulin
deficiency to a predominantly secretory defect with insulin resistance)
III. Other specific types
A. Genetic defects of β -cell function (MODYa, mitochondrial diabetes…)
B. Genetic defects in insulin action
C. Diseases of the exocrine pancreas (pancreatitis, cystic fibrosis, hemochromatosis...)
D. Endocrinopathies (acromegaly, Cushing’s syndrome, pheochromocytoma...)
E. Drug- or chemical-induced (glucocorticoids, thyroid hormone, thiazides…)
F. Infections (congenital rubella, cytomegalovirus...)
G. Uncommon forms of immune-mediated diabetes (anti–insulin receptor antibodies…)
H. Other genetic syndromes sometimes associated with diabetes (Down syndrome...)
IV. Gestational diabetes mellitus (GDM)
aMODY: maturity onset diabetes of the young
6
1.1 Type 1 diabetes
Nowadays, we may subdivide T1DM in three groups from the etiological point of view:
autoimmune, idiopathic and double. The autoimmune group is represented by: type 1A, which
is polygenic and it is the most frequent type of this disease, corresponding to approximately
80-90% of all T1DM cases. LADA (latent autoimmune diabetes in the adult), the other
subtype of this group is a slowly progressive form of type 1 diabetes and is characterised by
GAD antibody (anti-GAD) positivity, older age at onset, less ketosis-proneness and no
immediate (for at least 6 months) insulin needs (2). Type 1B, also called idiopathic, has all the
clinical features of type 1A, but the autoimmune component is not detected (3).
Finally, the denomination of mixed, 1.5 or double (type 1 plus type 2) diabetes has been
proposed when we have the type 1A (autoimmunity) plus type 2 (obesity, insulin resistance,
dyslipidemia) diabetes characteristics in the same individual (4).
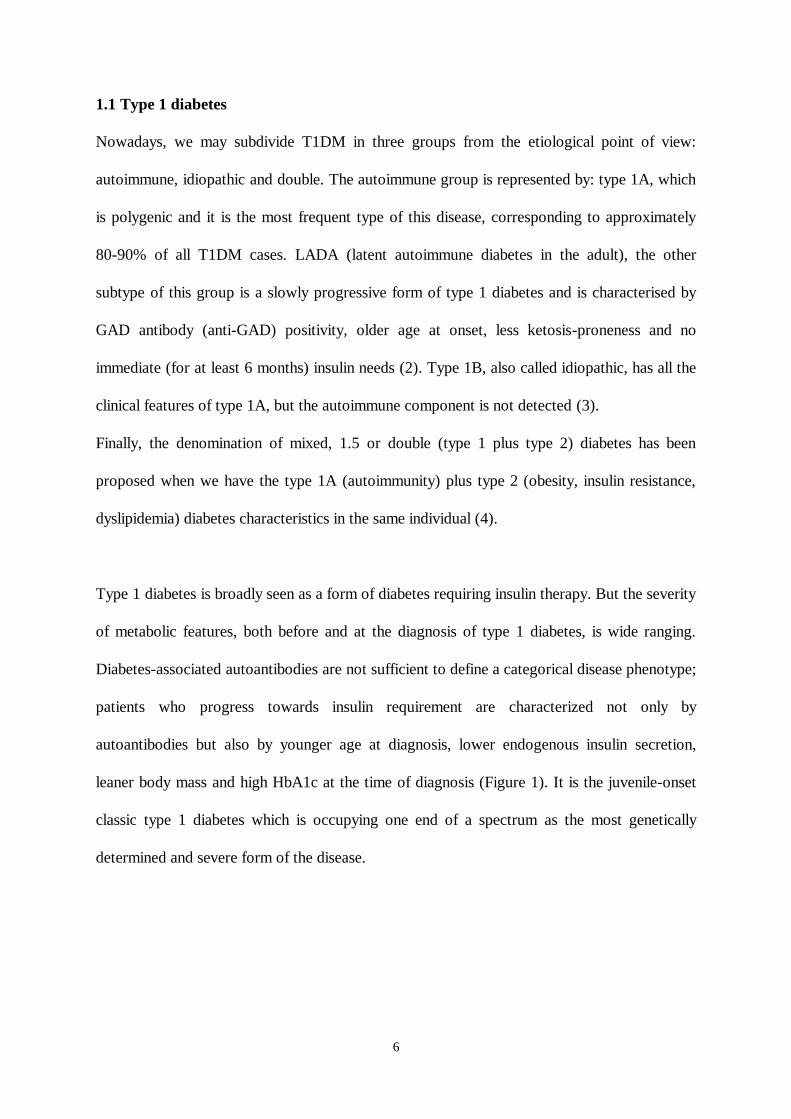
Type 1 diabetes is broadly seen as a form of diabetes requiring insulin therapy. But the severity
of metabolic features, both before and at the diagnosis of type 1 diabetes, is wide ranging.
Diabetes-associated autoantibodies are not sufficient to define a categorical disease phenotype;
patients who progress towards insulin requirement are characterized not only by
autoantibodies but also by younger age at diagnosis, lower endogenous insulin secretion,
leaner body mass and high HbA1c at the time of diagnosis (Figure 1). It is the juvenile-onset
classic type 1 diabetes which is occupying one end of a spectrum as the most genetically
determined and severe form of the disease.

7
IMMUNITY AGE GENES BMI INSULIN THERAPY
T1DM
in children
T1DM
in adults
LADA
T2DM
Figure 1 - The spectrum of diabetes encompasses variable risk according to type of diabetes
for immune changes, age at presentation, HLA genetic susceptibility, obesity (as body mass
index), and insulin therapy (5)
Type 1 diabetes (T1DM) is perceived as a chronic immune-mediated disease characterized by
selective loss of insulin-producing β-cells in the pancreatic islets in genetically susceptible
individuals. Based on histological studies of pancreas specimens from patients with new-onset
type 1 diabetes, beta cell mass is reduced by ~ 80-90% at the time of clinical manifestation of
the disease (6, 7).
The appearance of autoantibodies in the prediabetic phase prior to the onset of immune-
mediated type 1 diabetes is the first detectable sign of emerging β-cell autoimmunity. There
are five disease-related autoantibodies that have been shown to predict clinical T1DM (8, 9).
These include classical islet cell antibodies (ICA), insulin autoantibodies (IAA), autoantibodies
to the 65 kD isoform of glutamic acid decarboxylase (GADA), the protein tyrosine
Strong Child HLA++ low immediate
+++
++ adult HLA + normal immediate
+ adult HLA normal variable
weak adult ? high infrequent
8
phosphatase-related IA-2 molecule (IA-2A) and the zink transporter autoantibodies (ZnT8A).
These autoimmunity markers can be used to identify at-risk subjects during the prodromic
phase when autoimmune intervention is most likely to be effective and may also be therapeutic
agents in their own right. The duration – months, years or even decades of the pre-clinical
phase may vary according to the intensity of the pathologic process and beta cell repair (9,
10).
Several genes involved in the aetiology of type 1 diabetes have already been identified, but we
still have little idea of the etiologic mechanisms that trigger autoimmunity and promote
progression to disease. Type 1 diabetes may develop at any age but displays a marked age-
dependent heterogeneity in the severity of clinical presentation (11, 12). Past descriptions
depict type 1 diabetes as a disease of childhood and early adulthood, however, more recent
data suggest that only about 50–60% of those with type 1 diabetes are younger than 16–18
years at presentation and that such disease occurs at a low incidence level throughout
adulthood (11-13).
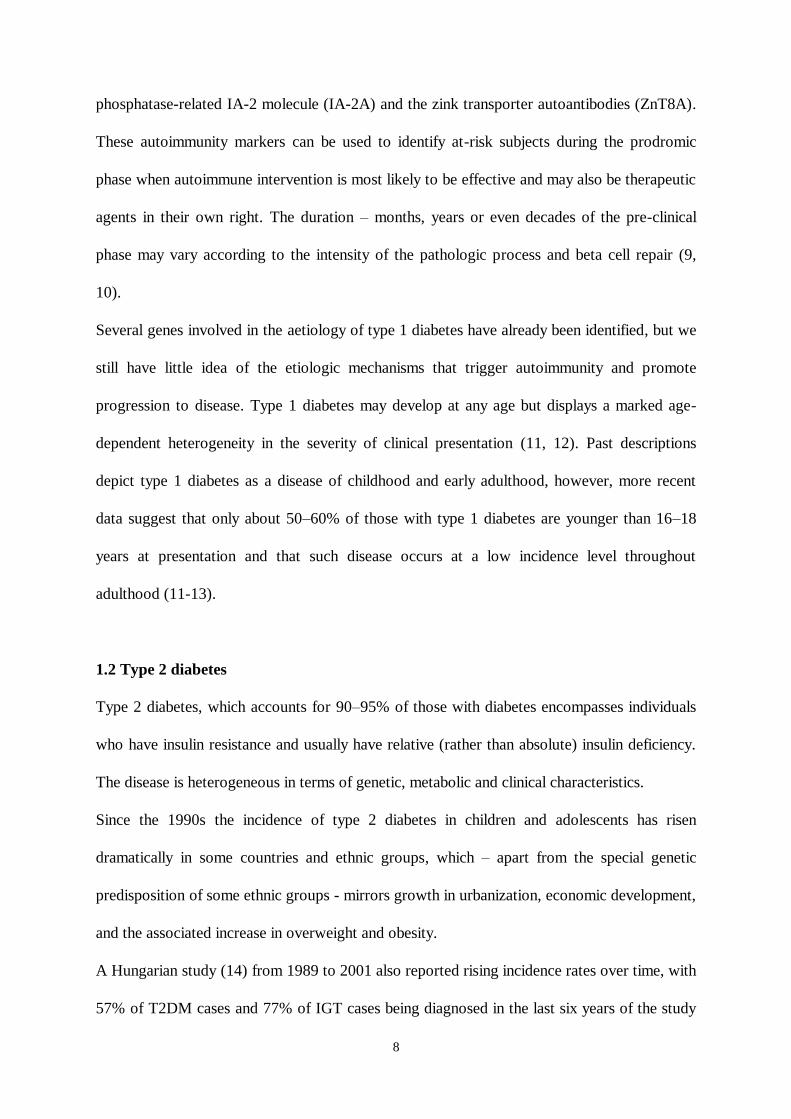
1.2 Type 2 diabetes
Type 2 diabetes, which accounts for 90–95% of those with diabetes encompasses individuals
who have insulin resistance and usually have relative (rather than absolute) insulin deficiency.
The disease is heterogeneous in terms of genetic, metabolic and clinical characteristics.
Since the 1990s the incidence of type 2 diabetes in children and adolescents has risen
dramatically in some countries and ethnic groups, which – apart from the special genetic
predisposition of some ethnic groups - mirrors growth in urbanization, economic development,
and the associated increase in overweight and obesity.
A Hungarian study (14) from 1989 to 2001 also reported rising incidence rates over time, with
57% of T2DM cases and 77% of IGT cases being diagnosed in the last six years of the study

9
(14). It is important to note, however, that this was a clinic-based and not a population-based
study. A more recent study using risk-stratified screening and OGTT in Hungarian children
and adolescents (15) has described a 2.5 % prevalence of IGT, and a 0.35% prevalence of
type 2 diabetes in high risk children (being overweight and having additional risk factors
according to the ADA criteria).
Overall, type 2 diabetes is characterised by an older age of onset, is frequently associated with
obesity (with predominantly abdominal fat distribution) and lack of physical activity.
1.3 Maturity-onset diabetes of the young
The clinical characterisation of MODY established that diabetes could develop on a familial
basis without the requirement of insulin resistance (16). Six MODY genes (HNF4A, GCK,
TCF1, PDX1, TCF2) which, overall, are involved in ~85% of MODY cases (17). All six
MODY genes are expressed in the beta cell, with glucokinase (encoded by GCK) serving as
the glucose sensor that controls the set point for insulin secretion, and the rest acting as
transcription factors regulating pancreatic beta cell development and final beta cell mass.
2. Clinical presentation of diabetes
The manifestation of diabetes may differ from patient to patient, according to the type of
diabetes and age at onset. Affected patients generally have a preceding history of the classic
symptoms of diabetes. The period of time from when abnormalities in glucose control can be
identified until the development of symptoms generally is relatively brief. The classic
symptoms of diabetes are polydipsia, polyuria, polyphagia, and weight loss. Re-emergence of
bedwetting, nocturia, and a need to leave classes in school to use the bathroom are complaints

10
that suggest polyuria. The other typical presentation for children who have type 1 diabetes is
metabolic deterioration into diabetic ketoacidosis (DKA), presenting with nausea, vomiting,
dehydration, and lethargy. In certain situations, the diagnosis of diabetes should be considered
in the absence of the classic symptoms (infant who presents with an acute febrile illness in
whom a plasma glucose value obtained as part of a chemistry panel is elevated). Chronic
hyperglycaemia in girls and in infants and toddlers of both genders commonly leads to perineal
candidiasis.
The rate of beta-cell loss postdiagnosis is highly variable and may depend in part on the
aggressiveness of the type 1 diabetes disease process. This aggressiveness may be determined
by several factors including underlying genetic predisposition, age of the patient, metabolic
control, and may vary within individuals over the course of their diabetes.
3. Immune markers of type 1 diabetes
The initial evidence for autoimmunity in patients with type 1 diabetes came from
immunofluorescence studies, which showed that a high percentage of sera from newly
diagnosed type 1 diabetic patients reacted with pancreatic islet cells (islet cell cytoplasmic
antibodies or ICA) (18, 19). Since then, a series of autoantigens have been identified in T1DM
including insulin, glutamic acid decarboxylase (GAD65) (20), the protein tyrosine
phosphatase-related islet antigen 2 (IA-2) (21), and most recently the zinc transporter
Slc30A8 residing in the insulin secretory granule of the β-cell (22).
Several studies have shown that β-cell autoimmunity may be induced early in life (23). Around
4% of offspring of parents with type 1 diabetes in the BABYDIAB study and around 6% of
genetically at-risk infants from the general population in the Finnish Diabetes Prediction and

11
Prevention (DIPP) study have developed islet autoantibodies by age 2 years (24, 25). Children
who develop autoantibodies within the first 2 years of life are those who most often develop
multiple islet autoantibodies and progress to type 1 diabetes in childhood (24). Autoantibodies
do not exclusively develop before age 2 years, but children who develop autoantibodies later
have a slower progression to multiple antibodies and type 1 diabetes (24).
There is no consensus whether there is any primary autoantigen in T1DM. According to the
suggestion of a recent article (26) in the beginning of the autoimmune process against
pancreatic beta cells, we may have three or more antigens, but at the end, there are endless
antigens which are activating the process, i.e., the greater the beta cell lesion, the more
antigens are expressed, which will reactivate the process. This proposal covers a new concept
for the natural history of T1A diabetes mellitus which, in its preclinical stage, would be
characterized by a succession of relapses and remissions with interrelation between regulatory
T cells and effectors cells, and regeneration of beta cells up to the moment when the
percentage of beta cell destruction would no longer allow a proper insulin secretion, resulting
in the expression of hyperglycaemia. Within this context, it becomes important to mention the
low capacity of regeneration/neogenesis of beta cells mainly when they are exposed to
hyperglycaemia, which is a stimulus metabolic factor to the insulin secretion, but it is also
glycotoxic. When proper glycaemic control is instituted at the beginning of the disease, these
cells have acquiescence and may to keep the levels of C peptide secretion for a additional
period of time.
Type 1B, also called idiopathic, has all the clinical features of type 1A, but the autoimmune
component is not detected (3).

12
4. Genetics
The importance of genetic components in the pathogenic process leading to type 1 diabetes is
supported by the observed higher concordance rate of monozygotic twins compared to
dizygotic twins, by the familial clustering of the disease and by ethnical differences in the
incidence of type 1 diabetes (27, 28). The vast majority of individuals who develop type 1A
diabetes do not have a first degree relative with the disorder (>85%). Extending the ability to
identify extreme risk to the general population without a relative with type 1A diabetes is thus
an important goal.
The risk of complex diseases such as type 1 diabetes is generally thought to be influenced by
multiple genetic and non-genetic factors, and it has been hypothesised that interactions
between genes, or epistasis, are very common for such diseases (29). There are now at least
four genetic loci that are established as causally involved in the aetiology of type 1 diabetes.
The major genetic susceptibility is encoded by specific allelic combinations of DRB1, DQA1
and DQB1 in the human leucocyte antigen (HLA) complex. Variants in the insulin gene (INS),
the cytotoxic T lymphocyte antigen-4 gene (CTLA4) and the protein tyrosine phosphatase,
non-receptor type 22 gene (PTPN22) have been repeatedly associated with type 1 diabetes
susceptibility using different approaches. All established loci are thought to be involved
somehow in immune regulation, but details of the mechanisms relating the polymorphisms to
risk of type 1 diabetes are in most cases poorly understood.

13
5. Environmental factors
Environmental factors have been implicated in the pathogenesis of type 1 diabetes both as
triggers and potentiators of beta-cell destruction (30-32). Studies in monozygotic twins
suggest that only 13–33% are pairwise concordant for the disease (33, 34), which implies that
there is either acquired postconceptional genetic discordance or differential exposure to
putative environmental factors. The tenfold difference in incidence of children under the age of
15 years reported in Europe with the highest incidence rate occurring in Finland (40.2/100000)
and the lowest in Macedonia (3.2/100000) can hardly be explained by genetic factors (35). A
considerable increase in the incidence of type 1 diabetes has been documented globally over
the last decades, particularly in Europe (36). The steep increase cannot be exclusively due to
an enhanced genetic disease susceptibility in the population but must mostly reflect changes in
lifestyle and environment. Available data of migrant studies indicate that the incidence of type
1 diabetes has increased in population groups who have moved from a low-incidence region to
a high-incidence area, emphasizing the influence of environmental conditions (31). Studies on
HLA genotypes demonstrated that the proportion of subjects with high-risk DR and DQ
alleles has decreased over the last decades among patients with newly diagnosed type 1
diabetes, whereas the proportion of people with low-risk or even protective HLA genotypes
has increased (37, 38) suggesting the increase of the environmental pressure.
Various exogenous triggers, such as certain dietary factors and viruses (39, 40), are thought to
induce the immune-mediated process leading to extensive beta cell destruction and ultimately
to the clinical manifestation of type 1 diabetes. Changes have occurred in multiple
environmental conditions over the last half-century. These include perinatal factors (41, 42),
increased weight gain in infancy (43, 44), sunlight exposure and vitamin D sufficiency (45),

14
dietary factors (46-48), use of pharmaceutical products (eg antibiotics), socioeconomic factors
(49) and psychological factors (50), (51).
6. Incidence of childhood type 1 diabetes
During the last decades large international collaborative studies, using standardized
ascertainment schemes have offered significant contributions to our knowledge of the global
epidemiology of the disease.
In 1983 an international meeting was held in Philadelphia, where the participating
epidemiologists discussed the importance of establishing standardised registries to facilitate
comparisons between countries. This meeting led to the birth of the Diabetes Epidemiology
Research International (DERI) group. The DERI group played a key role in collecting
standardised incidence data of T1DM between the late 1970s up to mid 1980s. Since then a
lot of registries have been established all over the world.
In 1988 the European Economic Community launched a study called EURODIAB ACE
(Europe and Diabetes: Aetiology of Childhood Diabetes on an epidemiological basis) with the
participation of 44 European centres to asses incidence of childhood T1DM in Europe, to
gather information to determine the causes and pathogenesis of the disease (52) in children
under the age of 15 years. The WHO Multinational Project for Childhood Diabetes
(DIAMOND) was started in 1990. The DIAMOND network includes 112 centres from 57
countries from around the world, representing about 84 million children with the data set of
43013 children diagnosed between the years 1990 and 1999 (53). Wide variation in incidence
of type 1 diabetes in children younger than 15 years has been well characterised by registry
15
reports from the EURODIAB study group within Europe and the DIAMOND project group
worldwide.
All of these registries have employed standardised protocols so that incidence data all over the
world can be compared more effectively. Epidemiological data on type 1 diabetes are still
lacking for the major part of the global population of children, especially in Africa, Asia, and
South America (53).
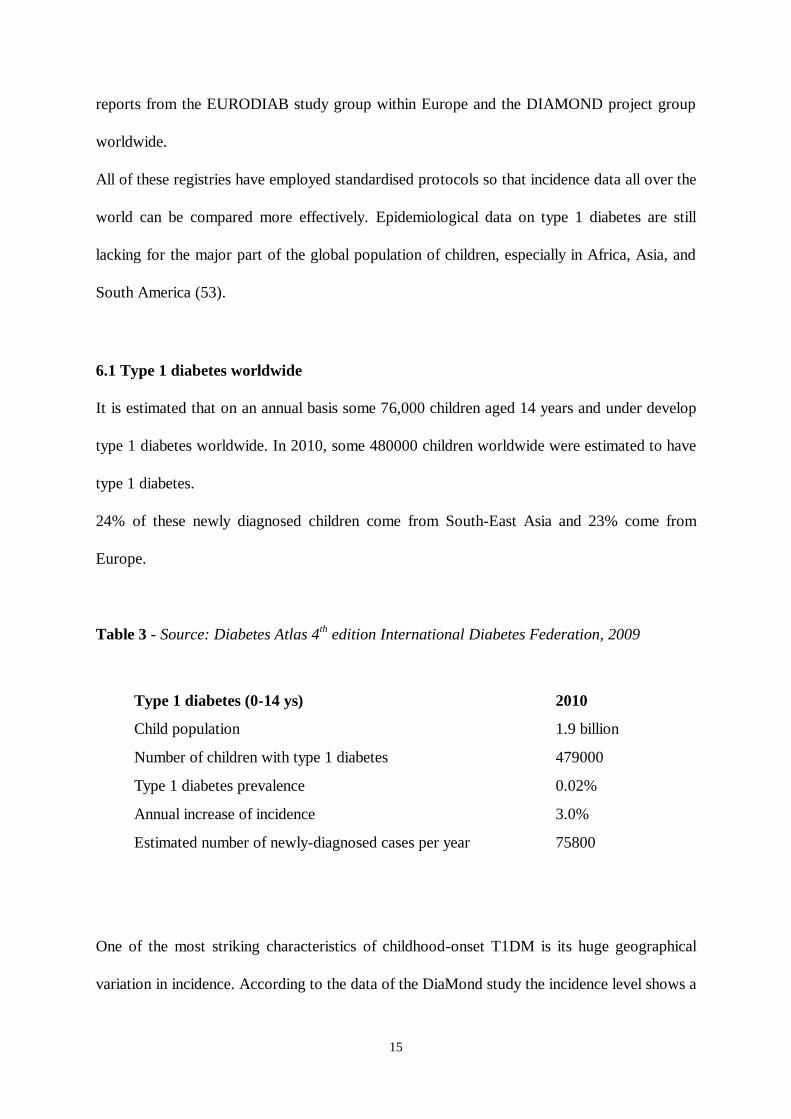
6.1 Type 1 diabetes worldwide
It is estimated that on an annual basis some 76,000 children aged 14 years and under develop
type 1 diabetes worldwide. In 2010, some 480000 children worldwide were estimated to have
type 1 diabetes.
24% of these newly diagnosed children come from South-East Asia and 23% come from
Europe.
Table 3 - Source: Diabetes Atlas 4th edition International Diabetes Federation, 2009
Type 1 diabetes (0-14 ys) 2010
Child population 1.9 billion
Number of children with type 1 diabetes 479000
Type 1 diabetes prevalence 0.02%
Annual increase of incidence 3.0%
Estimated number of newly-diagnosed cases per year 75800
One of the most striking characteristics of childhood-onset T1DM is its huge geographical
variation in incidence. According to the data of the DiaMond study the incidence level shows a

16
more than 350-fold variability across the populations studied between the years 1990 and 1999
(53). Finland has the highest incidence of type 1 diabetes worldwide, reaching about 40 new
cases per 100000 children at risk per year in the 1990s, whereas the Zunyi region in China was
reported to have the lowest incidence with a rate of 0.1 cases per 100000 children at risk.
Large intercontinental variation in incidence rates was also described (53); Figure 2).
In most Asian populations the incidence was very low (less than 1/100000/year); except
Kuwait, with a very high incidence of 22/100000/year.
Among African populations, incidence was low or intermediate (1-9/100000/year). The
incidence among South American populations varied between very low to high (1-
10/100000/year). In Central America and the West Indies, the range of variation was from 2
to 17 /100000/year. In Oceania, the incidence of Type 1 diabetes was high or very high (14-
22/ 100000/year), reflecting difference in the ethnicity of populations within this region. The
highest incidence rates were among European and North American populations varying from
low to very high in Europe, (4-41 /100000/year) and from high to very high in North America
(11- 25/100000/year).
Europe has by far the most informative and reliable data. In Europe, a north–south gradient
has been described (35, 52) in incidence, varying from the highest in Finland
(43.9/100000/year) and other Scandinavian countries to the lowest in Macedonia
(3.6/100000/year). Overall, the incidence rates were high in Northern and North Western
Europe and low in Central, Southern and Eastern Europe (35), (Figure 3). Sardinia as an
outlier being 3000 km south of Finland was an exception to this pattern with a five to seven
times higher incidence rate than continental Italy (54).

17
Figure 2 – Incidence rates of type 1 diabetes in children 0-14 years (cases/ 100000
population/ year) Source: Diabetes Atlas 4th edition International Diabetes Federation, 2009
Countries in Central Europe such as Austria, Hungary seem to be medium-risk countries
between the high-risk populations of the Nordic countries and the low-risk South-European
countries. The incidence of type 1 diabetes diagnosed under 15 years in Hungary (as
determined in 18 counties) is intermediate in Europe. The Hungarian incidence is similar to the
values observed in our neighbouring countries Austria, Slovakia and Slovenia.
Sharp contrast in incidence can also be observed among neighbouring countries. Even within
Scandinavia, with genetically homogenous populations, equally developed societies and at the
same latitude, there are differences in incidence rates varying between Finland
(42.9/100000/year, 1980-2005) (55), Denmark (22/100000/year, 1996–2000) (56), Iceland
(19/100000/year, 2001–2005) (57), and Sweden (28.9/100000/year, 1983-2000) (58).
18
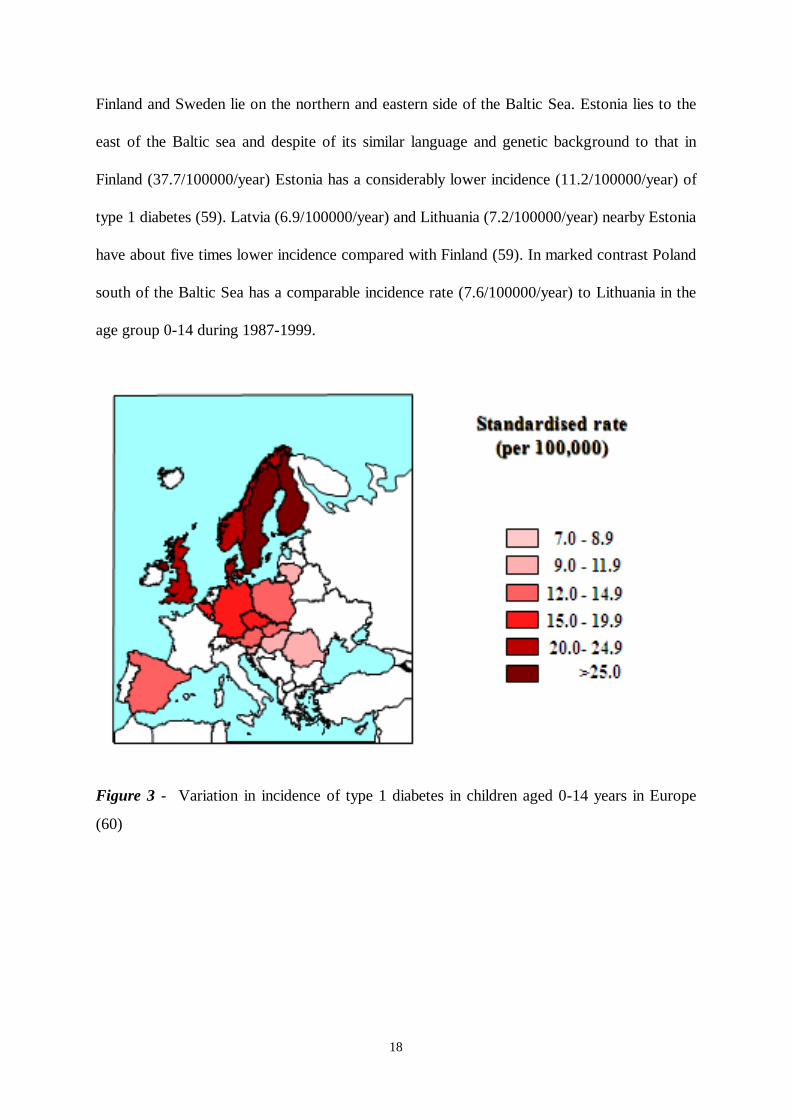
Finland and Sweden lie on the northern and eastern side of the Baltic Sea. Estonia lies to the
east of the Baltic sea and despite of its similar language and genetic background to that in
Finland (37.7/100000/year) Estonia has a considerably lower incidence (11.2/100000/year) of
type 1 diabetes (59). Latvia (6.9/100000/year) and Lithuania (7.2/100000/year) nearby Estonia
have about five times lower incidence compared with Finland (59). In marked contrast Poland
south of the Baltic Sea has a comparable incidence rate (7.6/100000/year) to Lithuania in the
age group 0-14 during 1987-1999.
Figure 3 - Variation in incidence of type 1 diabetes in children aged 0-14 years in Europe
(60)
19
6.2 Within-country variation
Within-country variation in incidence rate was observed in the Scandinavian countries such as
in Sweden (61), Finland (62), in England (63), Italy (64) and Sardinia (65). Furthermore,
studies in Finland (66), Sweden (67), Scotland (68) and Northern Ireland (49) have shown a
higher incidence in rural than in urban areas. In contrast, reports from Lithuania (69) and Italy
(64) have shown the opposite.
Geographical variations in incidence rates of T1DM in children may be associated with the
different distribution of socioeconomic factors between urban and rural area, population
density and ethnic differences.
6.3 Ethnicity
The incidence of T1DM shows remarkable variations between races and ethnic groups, the
risk being much greater among Caucasians, less in Blacks and extremely low in Asians and
Pacific Islanders and correlates strongly with the variability in incidence across countries.
According to the results of the largest population-based study in the US (SEARCH) the
incidence of T1DM was highest among non-Hispanic white children (18.6 for 0-4 years; 28.1
for 5-9 years; 32.9 for 10-14 years), followed by African American (9.7 for 0-4 years; 16.2
for 5-9 years; 19.2 for 10-14 years) and Hispanic youth (9.1 for 0-4 years; 15.7 for 5-9 years;
17.6 for 10-14 years), and lowest among American Indian (4.1 for 0-4 years; 5.5 for 5-9 years;
7.1 for 10-14 years) and Asian/Pacific Islander youth (6.1 for 0-4 years; 8.0 for 5-9 years; 8.3
for 10-14 years) (70).
A recent migration study, carried out among German residents, comparing the incidence of
German children versus Italian children originating from a very high-risk region (Sardinia) and
from medium-risk areas (continental Italy) showed that children from Italy had incidence rates
of T1DM that are closer to those of their native regions than to those of German children (71).

20
This finding indicates that genetic factors play a predominant role in the pathogenesis of
T1DM.
Muntoni et al. found that Sardinian-heritage children living in a region with low incidence
(Lazio, Lombardy) still maintain a much higher incidence of the disease relative to non-
Sardinian children in the host region which is consistent with a stronger genetic susceptibility
predominating over environmental factors (72).
The incidence of T1DM in Asian and Pacific Islanders is very low. Monozygotic twins and
first degree relatives of patients with T1DM in Japan had a similar risk of diabetes to twins and
relatives of patients in the United States, suggesting that most of the between-country
variation in diabetes risk might relate to genetic differences rather than environmental factors
(73).
6.4 Seasonality
6.4.1 Seasonality at diabetes onset
The seasonality at type 1 diabetes onset with a peak incidence in colder months and a nadir in
warmer months has been extensively studied previously. Although many studies have found
evidence for seasonality (74, 75), others have not (76) and some studies only found seasonality
in population subgroups (77). The EURODIAB Study has shown heterogeneity in the
seasonal pattern at type 1 diabetes onset according to age and region: seasonality was less
pronounced in children diagnosed under 5 years and in Scandinavian countries.
The incidence of type 1 diabetes is generally highest in older age groups which may explain
that the seasonal pattern is more often found in older children. A recent study (78) with the
participation of 105 centres also demonstrated a global seasonal pattern at diagnosis of type 1
diabetes. This seasonality pattern appears to be dependent on the geographical position, at
least as far as the northern ⁄ southern hemisphere dichotomy is concerned.

21
This seasonal variation has been taken as an indirect argument in favour of the role of
environmental factors – such as viral infection, average daily ultraviolet B (UVB) radiation –
in the development of the disease. One must remember, however, that the autoimmunity,
which leads to clinical diabetes is a long process, therefore, the environmental factors
associated with seasonality can only be considered as disease precipitators acting at a late
stage of prediabetes.
6.4.2 Seasonality of birth
Several epidemiological studies (79, 80) have reported a seasonal pattern of birth, with a
generally higher incidence for those born in spring and summer, than for those born in autumn
and winter (81, 82), but little evidence have been found to support the hypothesis that seasonal
environmental factors operating during fetal neonatal life have any influence on the
development of type 1 diabetes in future life (83).
6.5 Age
T1DM is the major type of diabetes in youth, accounting for 85% or more of all diabetes cases
in youth less than 20 years of age worldwide. The incidence increases from birth and peaks
during puberty. The increasing incidence of T1DM throughout the world is especially marked
in youngest children (0-4 years). Incidence rates decline after puberty especially in women but
remains relatively high in young adult males up to the 29–35 yr of age (13, 84).

22
6.6 Gender
Although data from various regions suggest a slight male excess in populations of high
(23/100000/year<) incidence and a minor female excess in low-incidence populations, on
average both genders carry similar risks. With an increasing incidence of T1DM the sex ratio
appears to shift from a female excess to a male excess (85). Male excess has been observed in
populations of European origin while slight female predominance has been reported in African
or Asian populations (13, 84).
6.7 Temporal trends in the incidence of T1DM
The incidence of childhood-onset type 1 diabetes exhibits remarkable temporal variation
concerning secular trends. Reports from the cumulative data from the large international
collaborative incidence registration systems have consistently found that since about 1990 the
incidence of childhood-onset type 1 diabetes has been rising globally (35, 53, 60), with the
possible exemption of Central America and West Indies (53).
According to the latest report from EURODIAB (60), in Europe the overall annual increase in
incidence is 3.9% (ranging from 0.6% to 9.3%) during 1989-2003. The most striking changes
with the steepest increase are observed in Central and Eastern Europe where the incidence is
relatively low (Figure 4). These increases may result in a tendency for regional differences in
European incidence rates to become less pronounced.
The rise in incidence is most pronounced in youngest children aged 0-4 years with an annual
rate of 5.4% compared to 4.3% in the age group 5-9 years and 2.9% in 10-14 years old
children (60).
In 2005 in Europe, the estimated number of newly diagnosed children with type 1 diabetes
aged 0-14 years was 15000 and expected to increase to 24400 in 2020. Due to the sharp
increase observed in youngest children, it is predicted that the percentage distribution of new

23
cases across the three age-groups will be more uniform at 29% (0–4 years), 37% (5–9 years),
and 34% (10–14 years) compared to the ratios of 24% (0-4 years), 35% (5-9 years) and 41%
(10-14 years) observed in 2005 (60).
The lifetime incidence is probably stable with incidence increasing in children and decreasing in
adults (86).
Figure 4 - Inverse association between rate of incidence increase and average incidence
Incidence rate on horizontal axis, plotted on a logarithmic scale. Spearman rank correlation
coefficient rs=–0.52, p=0.02 (60)
Average incidence rate 1989-2003 (per 100,000)
50403020109876
Annu
al in
cre
ase in incid
en
ce r
ate
19
89-2
003
(%
)
10
8
6
4
2
0
Czech Republic
Slovakia
SloveniaSweden
Poland
United KingdomYorkshire
United KingdomOxford
United KingdomNorthern Ireland
Finland
Spain
Romania
Norway
GermanyDüsseldorf
GermanyBaden Württemberg
Luxembourg
Lithuania
DenmarkHungary
Belgium
Austria
Spearman’s rank
correlation coefficient
rs= -0.52; P=0.02

24
II. AIMS
Our study had two main aims. First to analyse the incidence of type 1 diabetes in the age
group 0–14 years in Hungary for the period 1989–2009, second to ascertain the spectrum of
severity of presentation, the prevalence of diabetic ketoacidosis at diagnosis of diabetes, and
the potential predictors of DKA.
INCIDENCE OF TYPE 1 DIABETES IN CHILDREN (0-14 YEARS) IN HUNGARY
1. Incidence trends over time
1.1 To evaluate whether the previously described increase in incidence observed between 1978
and 1998 has continued.
1.2. To predict future trends
2. Gender, age-group specific incidence
2.1 To analyze gender difference
2.2 To analyze age-group specific incidence
3. Seasonality
3.1 To investigate whether the seasonal pattern of clinical onset of type 1 diabetes is a general
characteristic or it is restricted to gender and/or age at diagnosis subgroups.
4. Regional differences in incidence
4.1 To investigate any regional differences among counties in Hungary
4.2 To examine if population density was associated with incidence of type 1 diabetes

25
CLINICAL CHARACTERISTICS OF TYPE 1 DIABETES AT TIME OF DIAGNOSIS
IN HUNGARIAN CHILDREN (2002-2009)
1. Clinical and biochemical characteristics at time of diagnosis during 2002-2009
1.1 To determine clinical characteristics at onset of type 1 diabetes in children aged 0-14 years
1.2 To investigate gender and age group specific differences in clinical and biochemical
characteristics
1.3 To separately evaluate disease onset in subjects presenting with type 1 diabetes before
their second birthday during the period from 2002 to 2009
2. Diabetic ketoacidosis
2.1 To investigate the frequency of diabetic ketoacidosis at type 1 diabetes onset, to analyze
temporal trends and any regional differences in the occurrence of DKA
2.2 To compare clinical characteristics of children presenting with and without DKA
2.3 To identify predictors of diabetic ketoacidosis in newly diagnosed children under 15 years
of age in Hungary

26
III. INCIDENCE OF TYPE 1 DIABETES IN CHILDREN (0-14 YEARS) IN
HUNGARY
Study design
The Hungarian Childhood Diabetes Register has been collecting data of all newly diagnosed
children with type 1 diabetes under the age of 15 years since 1978. Data for the first 11 years
(1978–1988) were collected retrospectively. Prospective registration as part of the
EURODIAB Study started in 1989 (52). I have been the data manager of the database from
the beginning of the prospective data collection, and I have performed the statistical analyses.
The study included the data of 18 counties. Budapest, the capital, and county of Pest were
excluded from our study because historically we have found that the ascertainment level was
low (87). There are several paediatric departments in the capital, and some of them -
particularly in the first years of the registry - were unable to provide reliable case data. The
ascertainment level has considerably improved in recent years and incidence data for the last
year are now available for the capital, as well (vide infra). The children's population of
Budapest is about one fourth of national total. The Hungarian population aged 0–14 years in
18 counties decreased by one third from 1579450 (1989) to 1052184 (2009) during the study
period.
Type 1 diabetes mellitus was defined on the basis of a clinical diagnosis of idiopathic diabetes
by a physician. Cases secondary to other conditions (eg. having cystic fibrosis or high-dose
steroid treatment or MODY diabetes) were excluded. Date of onset was defined as the date of
the first insulin injection.
All cases on the register were included in the analysis if they were diagnosed between the 1
January 1989 and 31 December 2009. The capture–recapture methodology, which assumes

27
that independent primary and secondary sources of ascertainment are available, was used to
estimate the completeness of registration. In Hungary, children with new-onset diabetes aged
0–14 year are hospitalized in paediatric departments at the time of diagnosis. Hospital case
records served as primary source of ascertainment. The list of children who attended diabetes
summer camps was used as an independent secondary source of ascertainment. These camps,
organized by trade unions and later by charity organizations, were open to all diabetic children.
Ascertainment was above >95% throughout the 21-year period with a uniform pattern over
time: 1989-1993, 97.9%; 1994-1998, 95.9%; 1999-2003, 97.5%; 2004-2009, 100%.
All denominators for incidence calculations were provided annually by the Central Bureau of
Statistics.
Statistical methods
Annual end-year population estimates were used as denominators for calculation of rates.
Age- and sex-standardized incidence rates were obtained using the direct method with a
standard population consisting of equal numbers of children in each of the six subgroups
defined by age group (0–4y, 5–9y and 10–14y) and gender. Confidence intervals for rates
were calculated assuming that the observed number of cases followed a Poisson distribution.
Poisson regression models were used to assess time trends in incidence. Models with terms for
age group, gender and calendar year were fitted. Interactions were fitted to assess if the trends
differed significantly between age groups or genders. Cyclic behaviour in the incidence trend
was estimated by a Poisson regression model as described by Edwards JH (88). Heterogeneity
between counties was assessed using Poisson regression. Population density was calculated by
dividing the population by the geographical area (in square kilometres).

28
Predictions for future new cases until 2030 were made by extrapolating rates using the annual
percentage increase in incidence in each age/sex subgroup estimated from the Poisson
regression model.
Statistical analyses were performed using STATA release 8.0 (Stata Corporation, College
Station, TX, USA).
Results
THE AVERAGE STANDARDIZED INCIDENCE RATE
A total of 3432 patients (1777 boys; 1655 girls) under the age of 15 years were registered
during the observation period.
The average standardised incidence rate was 12.5 (95%CI 12.0-12.9) per 100000 per annum
over the 21 years, 12.6 (95% CI 12.0-13.2) in boys and 12.3 (95% CI 11.72-12.9) in girls.
The age-specific incidence rates were 8.8 (95% CI 8.2-9.5), 13.5 (95% CI 12.7-14.3) and
15.1 (95% CI 14.3-15.8) per 100000 person years in the 0-4, 5-9 and 10-14 year age groups,
respectively.
INCIDENCE TREND
The incidence increased from 7.7 (95%CI 6.3-9.0) per 100000 person years in 1989 to 18.2
(95%CI 15.7-20.9) in 2009 (Figure 5).
Table 4 shows the mean age- and sex-specific incidence rates by three 5 year and one 6 year
periods. The increase in incidence rate for the entire cohort (and in both sexes and in all three
age groups) was highest between the periods 1999-2003 and 2004-2009.

29
Figure 5 - Age-standardised incidence rate (with 95% confidence intervals) for type 1
diabetes in children aged 0-14 years in Hungary for each year in the period 1989-2009 with
fitted log-linear trend.
Table 4 - Age- and sex-specific incidence rates of type 1 diabetes in Hungary during 1989-
2009; incidence per 100 000 per year (95% CI) by three 5-year and a 6-year periods
1989-1993 1994-1998 1999-2003 2004-2009
Boys 0-4 5.1 (3.8-6.4) 8.0 (6.3-9.7) 8.3 (6.4-10.1) 14.3 (12.0-16.6)
5-9 9.7 (7.9-11.4) 10.4 (8.5-12.2) 12.7 (10.6-14.9) 21.1 (18.4-23.8)
10-14 11.5 (9.8-13.3) 12.4 (10.4-14.4) 16.6 (14.3-18.9) 22.4 (19.8-25.0)
Girls 0-4 5.4 (4.0-6.7) 7.2 (5.5-8.8) 9.5 (7.5-11.6) 13.8 (11.5-16.1)
5-9 9.4 (7.6-11.2) 12.1 (10.1-14.2) 13.8 (11.6-16.1) 19.9 (17.2-22.6)
10-14 13.0 (11.1-14.9) 13.9 (11.7-16.0) 13.5 (11.4-15.7) 17.7 (15.5-20.1)
Boys&Girls 0-4 5.2 (4.3-6.3) 7.6 (6.5-8.9) 8.9 (7.5-10.3) 14.1 (12.6-15.9)
5-9 9.5 (8.3-10.8) 11.3 (9.9-12.7) 13.3 (11.8-14.9) 20.5 (18.6-22.5)
10-14 12.3 (11.0-13.6) 13.1 (11.7-14.6) 15.1 (13.6-16.8) 20.1 (18.3-21.8)
Stand
incidence
9.0 (8.4-9.7) 10.6 (9.9-11.5) 12.4 (11.6-13.3) 18.3 (17.3-19.4)
Incid
en
ce
(per 1
00000 p
er y
ear)
30
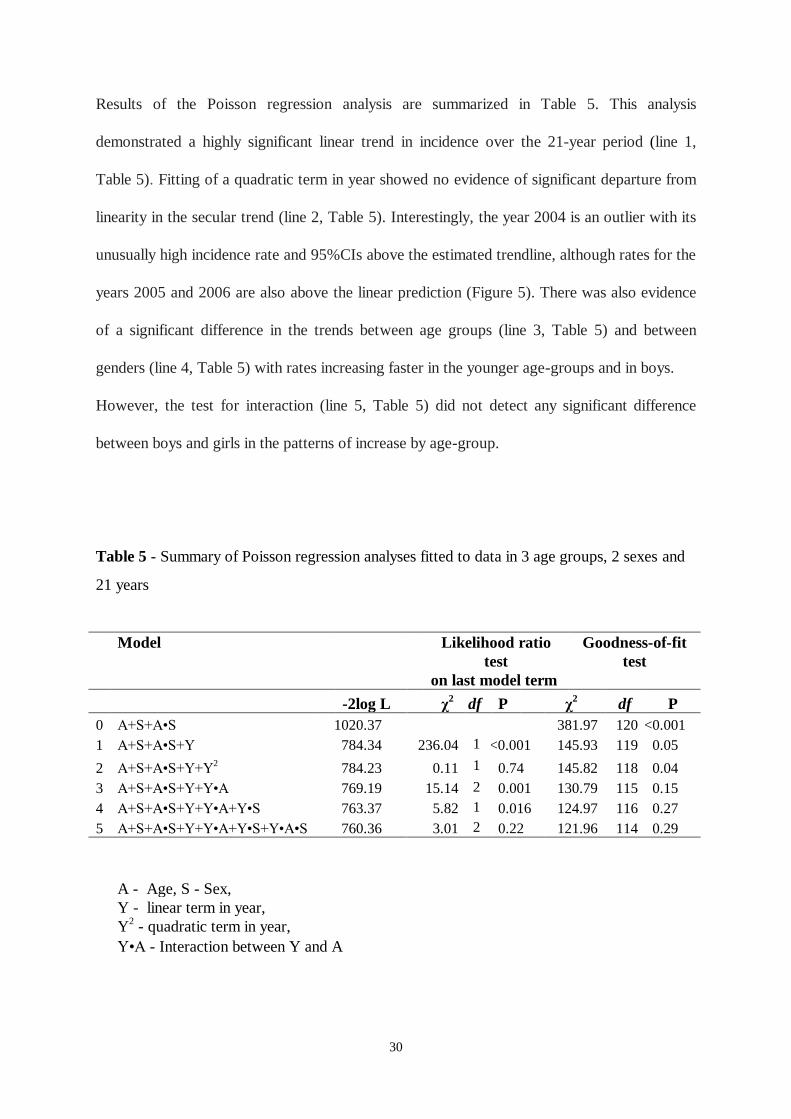
Results of the Poisson regression analysis are summarized in Table 5. This analysis
demonstrated a highly significant linear trend in incidence over the 21-year period (line 1,
Table 5). Fitting of a quadratic term in year showed no evidence of significant departure from
linearity in the secular trend (line 2, Table 5). Interestingly, the year 2004 is an outlier with its
unusually high incidence rate and 95%CIs above the estimated trendline, although rates for the
years 2005 and 2006 are also above the linear prediction (Figure 5). There was also evidence
of a significant difference in the trends between age groups (line 3, Table 5) and between
genders (line 4, Table 5) with rates increasing faster in the younger age-groups and in boys.
However, the test for interaction (line 5, Table 5) did not detect any significant difference
between boys and girls in the patterns of increase by age-group.
Table 5 - Summary of Poisson regression analyses fitted to data in 3 age groups, 2 sexes and
21 years
Model
Likelihood ratio
test
on last model term
Goodness-of-fit
test
-2log L χ2
df P χ2 df P
0 A+S+A•S 1020.37 381.97 120 <0.001
1 A+S+A•S+Y 784.34 236.04 1 <0.001 145.93 119 0.05
2 A+S+A•S+Y+Y2 784.23 0.11 1 0.74 145.82 118 0.04
3 A+S+A•S+Y+Y•A 769.19 15.14 2 0.001 130.79 115 0.15
4 A+S+A•S+Y+Y•A+Y•S 763.37 5.82 1 0.016 124.97 116 0.27
5 A+S+A•S+Y+Y•A+Y•S+Y•A•S 760.36 3.01 2 0.22 121.96 114 0.29
A - Age, S - Sex,
Y - linear term in year,
Y2 - quadratic term in year,
Y•A - Interaction between Y and A

31
Table 6 shows that there was an average annual increase of 4.4% (95%CI 3.9-5.0; p<0.001)
after adjustment for age and sex.
Table 6 - Summary of Poisson regression analyses showing age-and sex-specific annual
increases (95% CI) expressed as % during 1989-2009
Figure 6 shows that the increase was evident in both genders with higher rates for boys (5.1%,
95% CI 4.3-5.9; p<0.001) compared to girls (3.7%; 95% CI 2.9-4.6; p<0.001). Boys showed
faster rates of increase in incidence of type 1 diabetes in all three age groups than did girls, but
only in the oldest age-group was this difference significant (p=0.004), (Table 6).
Boys Girls Boys & Girls
0-4 y 6.4 (4.6-8.2) 6.0 (4.2-7.9) 6.2 (4.9-7.5)
5-9 y 5.2 (3.8-6.6) 4.6 (3.2-6.0) 4.9 (3.9-5.9)
10-14 y 4.5 (3.3-5.7) 1.9 (0.7-3.2) 3.3 (2.4-4.1)
All ages 5.1 (4.3-5.9) 3.7 (2.9-4.6) 4.4 (3.9-5.0)

32
Figure 6 - Time trends in age-specific incidence rates in boys and girls plotted on a
logarithmic scale for each year in the period 1989-2009.
AGE- AND SEX SPECIFIC INCIDENCE RATES
Figure 7 shows the age distribution of the incidence for girls and boys. The incidence peak for
girls occurred 2 years earlier than the peak for boys. The incidence rate was similar in boys
and girls at or before the age of 10 years, but thereafter it started to diverge (Figure 8). The
overall boy-to-girl ratio in incidence was 1.02, 1.0, 0.97, 1.08 for the age groups 0-4 year, 5-9
years and 10-14 years, respectively.
Boys Girls
0-4 yr
5-9yr
10-14 yr
0-4 yr
5-9yr
10-14
yr

33
0
5
10
15
20
25
30
0 1 2 3 4 5 6 7 8 9 10 11 12 13 14
Boys
Girls
Figure 7 – Age specific and sex specific incidence rates per 100000 per year in Hungarian
children
INCIDENCE PREDICTION
Assuming that the rates of increase observed in 1989-2008 continue, by 2030 the number of
newly diagnosed children aged 0-14 years in Hungary is predicted to be 2460 with a
distribution of 31% being in the 0-4 year, 38% in the 5-9 year and 31% in the 10-14 year age
groups. The predicted age-specific incidence rates are 56 per 100000, 59 per 100000, and 43
per 100000, respectively for the three age groups (Figure 8).
Incid
en
ce (
per 1
00,0
00 p
er y
ear)
Age at diagnosis

34
Figure 8 - Estimated and predicted incidence of newly diagnosed type 1 diabetes
SEASONALITY AT DIAGNOSIS
There was a clear seasonal variation over the year (χ2=72.8; p<0.001), with a peak in the
winter months and a trough in the summer months (Figure 9).
Figure 9 - a. Seasonality at first insulin injection in Hungary
b. Seasonality of first insulin injection by age groups during the period 1989 and 2009
The solid lines represent the observed values transformed into results for months of equal length. The
dotted lines represent the fitted sinusoidal trend. a 0–4 years: cyclic trend: χ2=0.56, p=0.76, b 5-9 years:
cyclic trend: χ2=26.1, p<0.001. c 10–14 years: cyclic trend: χ2=66.21, p<0.001

35
When the data were further analyzed by age groups, the seasonal variation was observed in the
10-14 years age group (χ2=66.2; p<0.001) and in the 5-9 years old children (χ2=26.1;
p<0.001) but not in the youngest children. January had the highest peak whereas June showed
the lowest number of newly diagnosed children. The corresponding amplitudes of oscillation
were + / - 3.9%, + / - 20.9% and + / - 29.6% for the age groups 0-4yr, 5-9yr and 10-14yr,
respectively.
REGIONAL DIFFERENCES
There was evidence of a difference in age-standardised incidence rates among the counties
(χ2=109.4; p<0.001).
Figure 10 – Regional differences in incidence of type 1 diabetes in children aged 0-14 years in
Hungary (1989-2009)
Incidence (/105/yr)
<10
10-11.9
12-13.9
14-15.9
16≤

36
The addition of a year by region interaction term was not significant, indicating that the rate of
increase did not differ among the counties. Counties in the western part of Hungary tend to
have higher incidence rates than the overall average while the eastern part show lower
incidence rates (Figure 10). Population density failed to show any significant association with
incidence (r=0.02; p=0.94).
Discussion
The present study has reported the 21-year data of the Hungarian Childhood Diabetes Registry
during 1989-2009 in a genetically stable, homogenous population using standard diagnostic
criteria and epidemiological methods, with an ascertainment level of >95% over the years.
With the overall incidence rate of 12.5 per 100000 per year, which is comparable to the
incidence in the surrounding countries (89-92), Hungary belongs to the medium incidence
geographical regions. During the observation period the background population of children
aged below 15 years has dropped by a third, and at the same time the number of newly
diagnosed children increased considerably by around 40 new cases per year in boys and 20
new cases per year in girls. These changes have resulted in the 2.4 fold increase in incidence of
type 1 diabetes in Hungarian children during 1989-2009 exceeding the earlier prediction –
based on the observed trend between 1989-1998 - of a doubling in incidence rates in 15 years
(93). The incidence of type 1 diabetes increases with age, the peak is around puberty with the
associated gender effect as at the beginning of the study period but because of the rapid
increase in younger children the difference in incidence among the age groups seems to be
diminishing; the incidence in the 5 to 9 year age group has now reached that of the 10 to 14
year age group, particularly in females. Although our study has been restricted to children
younger than 15 years of age, more data are becoming available about the incidence of type 1
diabetes in young adults. According to these results the incidence rate decreases substantially

37
after the age of 15 years and seems to stabilize in young adults (15-29 years), although there
are some indications of an increasing trend up to the age of 39 years.
In more recent years a male excess in the age standardised rate has become evident compared
to a female excess noted previously, and the Poisson regression analysis detected this
difference in rates of increase between the sexes (93).
The statistical analysis showed an overall increasing trend with little evidence of deviation
from linearity. However, the year 2004 was an outlier with higher incidence than predicted
compared to previous years and the subsequent periods, mainly because of the unexpectedly
high number of new cases observed in the 5-9-year old males. The “peak” incidence in the year
2004 was followed by stable rates for a number of years. We observed similar transient
stabilization of incidence (at a lower level) between 1980 and 1984 (87). Some of the high risk
countries have also shown no increase in incidence for brief periods over the last 20 years (94,
95) . The latest report from Finland (55) shows strikingly stable rates between 1980 and 1987
with subsequent steep increase. Recent publications from neighbouring Austria (91) and
Croatia (90) have also reported transient periods of stabilization (1979 to 1989 and 1995 to
2000, respectively), although the general trend remained clearly upward. When we compared
the first 10-year period with the second 11 years we found that the increase was larger during
1999-2009 (5.2% vs. 3.6% during 1989-1998) although the difference was not significant.
Publications from the neighbouring countries of Hungary as well as other European
populations reported similar increasing trends in incidence with accelerated increase in recent
years (90, 91, 96-98). Although we found no evidence of systematic departures from log linear
trends, in countries with high incidence where the rate of increase is less steep suggesting a
levelling off compared to medium or low-incidence regions, a log linear trend may not always
be appropriate (94, 99). Reports of stabilization of rates should therefore be interpreted with
caution, particularly if they are based solely on visual impression of short-term changes in rates

38
or on the fitting of smoothed non-linear relationships that do not offer any significant
improvement in model fit. The prevailing pattern seems to be one of continuing increase.
Many attempts have been made to explain the rising trend in incidence over the past decades
and several studies indicated the role of life-style-related risk factors (environmental
exposures) such as high calorie intake, rapid early growth and rapid early weight gain (100-
103). It is of considerable significance that a recent publication from Sweden reported a
levelling off of incidence in birth cohorts from the year 2000 and thereafter (99) paralleling a
decline in the prevalence of overweight and obesity in 4-year-old children. It is at present too
early to know whether or not this new observation is an isolated phenomenon unique to
Sweden or if it will generalize to other populations in due course. However, the claim that this
represents a shift back to older age at onset (99) seems premature until data are available on
the risks in this young cohort at older age-groups.
Consistent with previous reports, we found a significant seasonal pattern at clinical diagnosis
of type 1 diabetes, with peak values between January and March. The seasonal variation was
comparable with a sinusoidal curve, and the observed amplitude of oscillation averaged
±20.6%. Although the seasonal variation in the 10-14 age-group is well described as a
sinusoidal pattern in Hungarian children this is not the case for the 5-9 age-group. In contrast
to EURODIAB, our study failed to observe seasonal variation in the youngest age group,
possibly due to a lower number of cases in this age group. It is interesting to note, that all age-
groups show a larger than expected number of cases diagnosed in October possibly due to
return to school.
Regional differences between continents, countries and areas within countries in incidence of
type 1 diabetes have widely been observed. The finding of a higher incidence in rural areas
compared to urban areas has been linked to a theory called “hygiene hypothesis”. According to
this hypothesis, high-dense population urban areas with crowded households and higher

39
infectious exposure in early life are expected to have lower incidence rates due to the
protective effect of infections (104). A number of studies have supported this finding; the
results are however, controversial. Although, the current analysis showed some evidence of
difference in incidence among counties, no clear pattern has been identified. Furthermore, no
association with population density could be confirmed. There were some indications that
countries in the western part of Hungary have higher incidence rates compared to those lying
in the Eastern part. More detailed analysis using small area units and including socioeconomic
factors are needed to investigate any possible differences among areas.
One possible limitation of our study is that Budapest and county of Pest covering about 25%
of the children’s population were excluded for their low level of ascertainment. In 2010 we
managed to collect more accurate data, which show that the incidence in Budapest
(25.6/100000/year; 95% CI 19.3-33.3) and in county of Pest (18.6/100000/year; 95% CI
13.1-25.5) was comparable with the national average incidence and we assume that it was
similar in previous years.
IV. CLINICAL CHARACTERISTICS OF TYPE 1 DIABETES AT ONSET IN
CHILDREN AGED 0-14 YEARS IN HUNGARY
Introduction
Ketoacidotic episodes are still the most common causes of hospitalisation and deaths in
children with type 1 diabetes and also seem to influence the longer term clinical course of type
1 diabetes. Children with diabetic ketoacidosis at diagnosis have poorer glycaemic control, less
residual β cell function up to two years after diagnosis (105, 106) and a lower frequency of
remission (106, 107).

40
Diabetic ketoacidosis at onset has been the subject of many investigations and reviews during
the last decade. Although some studies have found that the clinical presentation at onset has
become less severe with time (108, 109); there is no clear evidence that the prevalence of
diabetic ketoacidosis at time of diagnosis has decreased over the past years (110, 111); in fact
with increasing incidence of type 1 diabetes reported to be most remarkable in youngest
children, an actual increase is anticipated.
There were only isolated reports based on hospital records on the clinical characteristics of the
disease in children (112-114), but no population-based study has been initiated so far to assess
the frequency of diabetic ketoacidosis at time of diagnosis in Hungarian children.
Study design
Prospective registration of laboratory and clinical data at diagnosis as part of the Hungarian
Childhood Diabetes Register has started in January 1, 2002. All children with new-onset type
1 diabetes aged 0-14 years diagnosed between 1 January 2002 and 31 December 2009 were
involved in our study.
In order to investigate clinical characteristics at type 1 diabetes onset and to provide reliable
information about the prevalence of diabetic ketoacidosis in Hungary I prepared a standard
data sheet for prospective registration of clinical and laboratory data. Data collection using
this new form (by e-mail and by post) from all paediatric diabetes centres started on 1st
January, 2002. Information regarding the clinical presentation, duration (given as number of
days) of symptoms prior to diagnosis observed by a parent (or reported by a child) and
preceding infection were recorded. Level of consciousness (classified into three categories of
normal, impaired consciousness and coma), hydration status (normal or dehydrated) were
evaluated by the clinician examining the patient at the time of hospital admission. Weight and
height at diagnosis was documented. BMI (kg/m2) was expressed as body mass index

41
standard deviation score (BMI-SDS) based on the national standard data of the longitudinal
growth study by Joubert et al (115). Biochemical data were obtained before administering
intravenous fluids or insulin at the hospital. Data were submitted continuously to the Central
Coordinating Office, Department of Paediatrics, University of Pécs, Pécs, Hungary. Individual
data were entered into a Microsoft Access database (set up and maintained by myself).
Standard laboratory methods were used to measure serum glucose, HbA1c, electrolytes, blood
urea nitrogen, venous blood gases and urinalysis. HbA1c was measured by HPLC (high-
performance liquid chromatography method) with a reference range of 4 to 6%.
Ketoacidosis was defined as a blood pH less than 7.3. Ketoacidosis was categorized by
severity of the acidosis, varying from mild with 7.3>pH≥7.2, to moderate with 7.2>pH≥7.1 l
and severe with pH≤7.1.
Positive family history was defined as having a first-degree relative with type 1 diabetes.
Statistical methods
Statistical analyses were carried out using SPSS for Windows (version 15.0, Chicago, IL). For
normally distributed data results data were summarized as mean values ± standard deviations
(SD). Unequally distributed results expressed as median and interquartile range (IQR) were
analyzed by Kruskal-Wallis and Mann-Whitney U tests. Continuous variables were compared
by the independent sample Student`s t- or one-way analysis of variance tests; categorical
variables, using cross tabulation calculation. Univariate analyses were followed by a
dichotomous (DKA yes/no) logistic regression model with forward, stepwise elimination
methods, including all variables that showed p<0.10 on univariate analysis. Main effects and
interaction effects were estimated. The Hosmer-Lemeshow method was used to assess
goodness of fit.

42
Results
Between 1 January, 2002 and 31 December, 2009, a total of 1558 newly diagnosed children
(828 boys; 730 girls) were identified with type 1 diabetes. The mean age at diabetes diagnosis
was 8.6±3.9 years (range 0.4-14.9); girls were significantly younger (8.3±3.8 years; p=0.02) as
compared to boys (8.8±4.0 years). The mean blood glucose concentration was 26.5±11.9
mmol/l (range 6.9-140mmol/l), the mean glycated haemoglobin (HbA1c) was 11.9±2.6 %
(range 5.6-25.8%) at the time of diagnosis.
CLINICAL CHARACTERISTICS AT TIME OF DIAGNOSIS
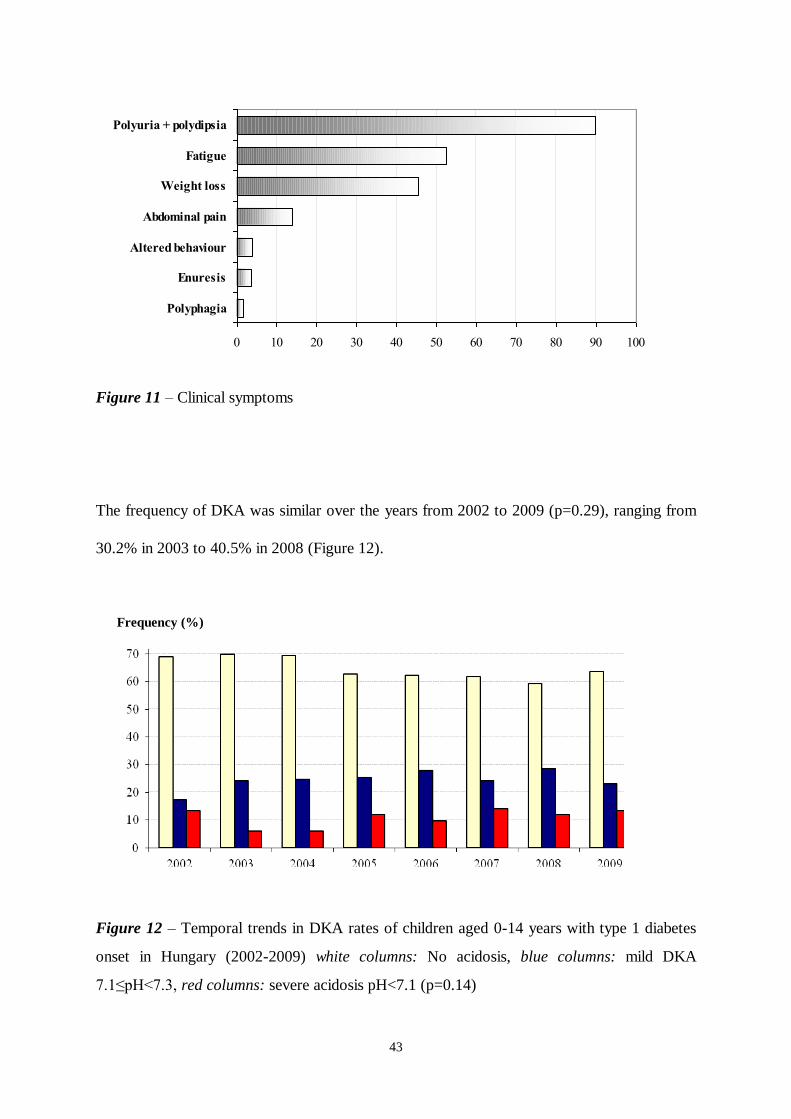
3% of the children had no symptoms before diagnosis. The median duration of symptoms
before diagnosis was 14 days (range 0-364). 514 (33%) children had duration of symptoms ≤7
days, 4.6% of the children had symptoms over 2 months. Polyuria and polydipsia, the most
frequent symptoms in all age groups were present in 89.2% of all cases (Figure 11). 7.9% of
the children were reported to have impaired consciousness at diagnosis and 0.2% was
considered unconscious. 296 children (19%) had an infection at diagnosis. Girls had
significantly lower BMI-SDS compared to boys (-0.73±1.1 vs -0.55±1.1; p=0.002). Other
clinical and biochemical characteristics at onset did not differ significantly between boys and
girls.
Blood pH ranged from 6.76 to 7.60 (mean±SD; 7.30±0.14). DKA (pH<7.3) was identified in
32% of the children (n = 498), of which 44% had mild, 26% moderate, and 30% severe DKA.
The highest prevalence of ketoacidosis occurred in more underweight children with a BMI-
SDS ≤ -1 (42% vs 32% with -1< BMI-SDS ≤ 0 vs 29% with 0< BMI-SDS ≤ 1 vs 19% with a
1 < BMI-SDS; p<0.001).
43
0 10 20 30 40 50 60 70 80 90 100
Polyphagia
Enuresis
Altered behaviour
Abdominal pain
Weight loss
Fatigue
Polyuria + polydipsia
Figure 11 – Clinical symptoms
The frequency of DKA was similar over the years from 2002 to 2009 (p=0.29), ranging from
30.2% in 2003 to 40.5% in 2008 (Figure 12).
Figure 12 – Temporal trends in DKA rates of children aged 0-14 years with type 1 diabetes
onset in Hungary (2002-2009) white columns: No acidosis, blue columns: mild DKA
7.1≤pH<7.3, red columns: severe acidosis pH<7.1 (p=0.14)
Frequency (%)

44
Comparison of clinical and biochemical characteristics of patients with DKA and those
without DKA are shown in Table 7. Patients with ketoacidosis at onset were younger, had a
significantly lower BMI-SDS, higher mean blood glucose and mean HbA1c level and one-
quarter of them had an acute infection at presentation. The occurrence of DKA was less
frequent in children with a first degree relative of type 1 diabetes.
Table 7 - Comparison of clinical and laboratory data of children according to metabolic status
Clinical characteristics DKA No DKA p
Male (%) 263 (53) 497 (57) NS1
Age [year] 7.4±4.1 8.4±3.8 <0.0012
Duration of symptoms days [(IQR)] 14 (7-22) 14 (7-28) 0.073
BMI-SDS -0.9±1.1 -0.5±1.0 <0.0012
Infection [%] 27.3 15.8 <0.0011
Dehydration [%] 88.3 43.8 <0.0011
Positive family history [%] 11.0 16.0 0.0121
Blood glucose [mmol/l] 30.8±13.1 24.5±10.6 <0.0012
HbA1c [%] 12.5±2.4 11.6±2.6 <0.0012
Data are mean±SD or frequency or median (interquartile range).
1 Crosstabulations,
2 T-test,
3 Mann-Whitney U test
COMPARISON OF CLINICAL CHARACTERISTICS ACCORDING TO AGE GROUPS
351 children (22.5%) were aged 0-4 years, 553 children (35.5%) were aged 5-9 years and 654
children (42%) were 10-14 years at diagnosis (χ2=91.7; p<0.001). Gender distribution of the

45
two younger age groups was similar; however in oldest children more boys compared to girls
have been diagnosed (369 boys vs 285 girls; χ2=10.3; p=0.001).
The median duration of symptoms before diagnosis was 14 days (range 7-2.5 days) and it was
significantly shorter in youngest children [9 days (IQR 7-19) in 0-4yr vs 14 days (IQR 7-21) in
the 5-9 yr vs 21 days (IQR 7-28) in 10-14yr; (χ2=60.9; p<0.001)]. Symptoms at presentation
were similar in all age groups. Consciousness was more often impaired in the very young
children (16.4% in 0-4 yr vs. 6.3% in 5-9 yr vs. 5.2% in 10-14 yr; p<0.001). A concomitant
infection was more frequently observed in the youngest age group (31.5% in 0-4 yr vs. 19% in
5-9 yr-, vs. 13.3% in 10-14 yr; χ2=40.7; p<0.001).
Lower BMI SDSs compared with age matched reference data were found in all age groups
(Table 8). Youngest children had gross hyperglycaemia with mean blood glucose close to 30
mmol/l, while HbA1c was lowest in children aged 0-4 years, indicating a shorter duration of
hyperglycaemia in this age group. The youngest age group had significantly lower BMI-SDS
compared to older children. Patients in the age group 0-4-years had more severe acidosis
compared to older children and about half of them had DKA (Table 8).
Although, a decreasing frequency of DKA was observed with increasing age in both genders,
there was an indication of the lowest frequency of DKA to be found around 5-6 years (Figure
13).

46
Table 8 - Clinical and biochemical characteristics of children with newly diagnosed type 1
diabetes according to age groups
0-4 years 5-9 years 10-14 years p
n (%) 351 (22.5) 553 (35.5) 654 (42) <0.001
Male (%)§ 176 (50) 283 (51) 369 (56) NS
1
Duration of symptoms (days) * 9 (7-19) 14 (7-21) 21 (7-28) <0.001
1
<0.0012
0.023
BMI-SDS -1.04±1.3 -0.54±1.1 -0.51±1.0 <0.0011
<0.0012
NS3
Blood glucose (mmol/l) **
29.4±13.1 26.0±11.0 25.4±11.6 <0.0011
<0.0012
NS3
HbA1c (%)**
10.9±2.2 12.0±2.6 12.3±2.6 <0.0011
<0.0012
NS3
pH**
7.26±0.16 7.31±0.13 7.31±0.13 <0.0011
<0.0012
NS3
DKA, pH<7.30 (%)§ 46.4 33.2 30.7 <0.001
1
<0.0012
NS3
Severe DKA, pH<7.10 (%)§ 17.2 9.8 7.9 <0.001
1
<0.0012
NS3
Data are mean±SD or median (interquartile range) or frequency
*Mann-Whitney,
** T-test,
§ Crosstabulations
10-4yr vs 5-9 yr;
20-4yr vs 10-14 yr;
35-9yr vs 10-14 yr

47
Figure 13 – DKA (pH<7.3) frequency in children with type 1 diabetes aged 0-14 years at
diabetes onset in Hungary (2002-2009).
CLINICAL CHARACTERISTICS IN CHILDREN AGED <2 YEARS
From 2002 to 2009, a total of 94 (6.0%) patients were diagnosed before the age of 2 years
and 257 (16.5%) patients were diagnosed between 2.0 and 4.99 years of age. Comparison of
children aged <2 years at diagnosis with children aged 2.0–4.9 years is displayed in Table 9.
There were no significant differences in the duration of symptoms and the presenting
symptoms before diagnosis. Furthermore, there were no differences in the frequency of a
preceding infection (37% children <2 yr vs 29.5% in 2.0-4.9 yr; NS) and a family history of
type 1 diabetes between the age-groups.
Frequency (%)
Age at onset (year)

48
Table 9 - Clinical and biochemical characteristics of children with newly diagnosed type 1
diabetes according to age groups
<2 years 2.0-4.9 years p
Male (%) 49 (52) 127 (49) NS1
BMI-SDS -1.14±1.1 -1.0±1.4 NS2
Blood glucose (mmol/l) 32.1±16.2 28.3±11.7 0.042
HbA1c 10.3±2.1 11.2±2.2 0.0062
pH 7.22±0.17 7.28±0.16. 0.0072
DKA, pH<7.30 59.3 41.2 0.0031
Severe DKA, pH<7.10 25.3 14.0 0.011
Data are mean±SD or frequency
1 Crosstabulations,
2 T-test
The proportion of children with impaired consciousness tended to be higher in children aged
less than 2 years (25% in children <2 yr vs 13.1% in 2.0-4.9 yr; χ2=8.53, p=0.01). Children
aged <2 years had a significantly higher rate of DKA at presentation.
RISK FACTORS OF DIABETIC KETOACIDOSIS
The results of the univariate analysis and multiple logistic regression models used to examine
the risk factors for DKA at diagnosis are shown in Table 9. Using logistic regression analysis,
we found that children <2 years of age had two times the risk of presenting in diabetic
ketoacidosis as children 10-14 years of age (Table 10). Children with lower BMI-SDS are
more likely to present in diabetic ketoacidosis. Higher blood glucose and a history of infection
were associated with an increased risk of diabetic ketoacidosis. Our study failed to show a
significant association with a family history of type 1 diabetes.

49
Table 10 - Results of univariate and multivariate logistic regression analyses related to factors
associated with diabetic ketoacidosis (pH<7.30) The analysis was performed with a binary
logistic regression model using the reference levels as age group: 10–14 yr, infection status: no
and family history: no.
Variable Univariate analysis Logistic regression analysis
Adjusted Odds Ratio
(95% CI) p value
Age groups 0.021
<2 years 2.24 (1.3-3.7) 0.002
2-4.9 years 1.2 (0.8-1.7) 0.3
5-9.9 years 1.0 (0.8-1.4) 0.7
Infection <0.0011 1.7 (0.9-2.1) 0.001
Blood glucose [mmol/l] <0.0012 1.04 (1.03-1.05) <0.001
Duration of symptoms [weeks] 0.073 0.95 (1.2-2.4) 0.06
BMI-SDS <0.0012 0.8 (0.7-0.9) <0.001
Positive family history 0.0121 0.7 (0.5-1.1) 0.1
HbA1c [%] <0.001
2
Ketonuria <0.0011
Dehydration <0.0011
1 Crosstabulations;
2 T-test;
3 Mann-Whitney U test

50
Discussion
Our study showed that 30% of Hungarian children had DKA (pH<7.3) at diagnosis of type 1
diabetes and 9.6% presented with severe DKA (pH<7.1) during the study period of 8 years,
with no significant time trend over the years.
This observed prevalence is somewhat higher than published in Sweden (116) and Finland
(117) and comparable with recent and earlier results in other European countries (118-122)
although the wide range of definition for diabetic ketoacidosis used in different studies makes
the comparison difficult.
The clinical pattern has not changed in the past few years; polydipsia and polyuria, the classic
symptoms of diabetes as well as fatigue and weight loss were the most commonly reported
symptoms. Although one-third of the children was reported to have duration of symptoms
before diagnosis ≤ 7 days, the higher mean HbA1c level suggested that symptoms might have
been present for a longer period without being recognized. Some studies found clear evidence
that at least some children with diabetic ketoacidosis experienced diagnostic or treatment
delays as up to a third of the children had at least one medical consultation in the week before
diagnosis, and misdiagnosis was associated with a threefold increase in diabetic ketoacidosis.
We failed to observe higher frequency/risk of DKA at onset in older children as recently
reported by studies in Austria (120), Finland (117) and Germany (121). In agreement with
other studies (120), younger age was associated with an increased risk of diabetic ketoacidosis
at diagnosis. This increased risk was most noticeable in children less than 2 years old and
disappeared by the age of 5 years. The reasons for this are probably multifactorial. DKA can
easily be overlooked in younger children, since the classic symptoms of diabetes in this age
group may be subtle and decompensation usually develops quicker as the mechanisms of
metabolic compensation are less developed (108). On the other hand, β cell destruction may
be more aggressive in young children: serum levels of proinsulin C peptide are lower in

51
children under 2 years old at time of diagnosis and they continue to lose their endogenous
insulin secretory capacity faster than older children after diagnosis (122).
Multiple factors affect the risk of developing diabetic ketoacidosis at the onset of type 1
diabetes in children. In our study, younger age at diagnosis, history of preceding infection,
lower BMI-SDS and higher blood glucose were the factors associated with increased risk of
presenting with diabetic ketoacidosis at time of diagnosis.
It is unclear why some children present in diabetic ketoacidosis whereas others do not and
whether the development of diabetic ketoacidosis is a consequence of delayed diagnosis or
whether it reflects a particularly aggressive form of diabetes. Understanding which factors are
associated with diabetic ketoacidosis at diagnosis and the relative importance of delayed
diagnosis and treatment is, therefore, important.
52
V. THESIS
I. INCIDENCE OF TYPE 1 DIABETES IN CHILDREN (0-14 YEARS) IN HUNGARY
Using the large database of a prospective registry, including 3432 incident cases, covering
about 75% of the total 0-14 year-old population in Hungary we were able to study incidence
trends with precise statistical methods over two decades. Crucial for time-trend analysis is a
sustained high level of ascertainment over time. Ascertainment procedures show a consistently
high ascertainment rate above 95%. The variability over time is thus assessed to be a
maximum of 4%, which should not affect the time trend analysis in this age group.
1. Incidence of type 1 diabetes in children aged 0-14 years in Hungary
1.1 With the overall incidence rate of 12.5 per 100000 per year, Hungary belongs to the
medium incidence geographical regions. During 1989-2009 the background population of
children aged below 15 years has dropped by a third, and at the same time the number of
newly diagnosed children increased considerably by around 40 new cases per year in boys and
20 new cases per year in girls, resulting a 2.4 fold increase in incidence of type 1 diabetes in
Hungarian children. The most important finding of the present study was that the annual
increase (3.6%) of type 1 diabetes during 1979-1998 has continued further at an even higher
rate (5.3%) in the last 11 years with no evidence of levelling off. The increase follows a linear
trend with random fluctuations
1.2 Extrapolation of incidence rates would suggest that by 2030 the predicted number of new
cases is 2460 but this change is not shared evenly between the age groups with incidence of
type 1 diabetes in the youngest age group expected to increase by 3.5 times in both sexes
compared with a factor of 2.5 in boys and 1.5 in girls in the oldest age group. Our model
suggests that in 2030 the percentage distribution of new cases across the three age-groups will

53
be more uniform at 31% (0–4 years), 38% (5–9 years), and 31% (10–14 years), with the
excess of new cases in the 5–9 year age range being most apparent in boys.
2. Gender, age-group specific incidence
2.1. Most populations worldwide have shown that males and females have a similar risk for
developing the disease, concurring with our results. Although a slight female excess has
previously been noted (1989-1998), in more recent years a male excess (but not significant) in
the age standardised rate has become evident. The increases in incidence seen in the present
study were evident in both genders, although with a difference between the sexes primarily
explained by the lower rate of increase in the 10-14 yr old girls compared to boys. Boys
showed faster rates of increase in incidence in all three age groups than did girls, but only in
the oldest age-group was this difference significant.
2.2. From the beginning of the study period our results demonstrated a greater relative
increase in incidence in the youngest children (6.2%), particularly in boys, compared to the
increase in 5-9 years old (4.9%) and 10-14 years old children (3.3%). In spite of the rapid
increase of the 0-4 year-old age group, the incidence rates (total and sex-specific) remain
lowest in the youngest children and highest in 10-14 year-old children. The difference in
incidence among the age groups, however, seems to be diminishing; at the end of the study
period the incidence in the 5 to 9 year age group has now reached that of the 10 to 14 year
age group, particularly in females.
3. Seasonality
3.1 Our study confirms the well-known seasonality of type 1 diabetes at diagnosis with a peak
during winter (January) and a trough during summer (June). Seasonal variation was most
apparent in 10-14 year-old children and absent in youngest children, possibly due to a lower
number of cases in this age group.

54
4. Regional differences in incidence
4.1 Disease maps demonstrated marked geographical variation in incidence within Hungary.
There were indications that counties in the Western part of Hungary tend to have higher
incidence rates, while counties in the Eastern part had lower rates than the overall average,
however the rate of increase failed to show any significant difference.
4.2 Our observation could not confirm any association between population density and the
incidence of type 1 diabetes.
Continued registration of incidence is of paramount importance to recognize long term
tendencies, which may provide clues to the environmental exposures behind these trends.
Furthermore, appropriate planning of services and resources are necessary to meet the need
for the increased number of children diagnosed with diabetes. The rising incidence has far
reaching effects beyond the diabetes teams: in schools, the community and other components
of the healthcare system that these children use currently and in the future.
II. CLINICAL CHARACTERISTICS OF TYPE 1 DIABETES AT TIME OF DIAGNOSIS
IN HUNGARIAN CHILDREN
1. Clinical and biochemical characteristics at time of diagnosis during 2002-2009
1.1 The duration of clinical symptoms in type 1 diabetes is short, about 14 days and one third
of the children were reported to have symptoms for less than 7 days. Polyuria and polydipsia
remain the most common symptoms noted in 89% of the children. The majority of children
have no family history of type 1 diabetes. Biochemical characteristics at diagnosis were in
agreement with those from other studies: the mean blood glucose level was 26.5±11.9 mmol/l,
mean HbA1c was 11.9±2.6 % and mean pH 7.30±0.14.

55
1.2 The median duration of symptoms before diagnosis was longer in older children. The
clinical symptoms at onset did not differ significantly between groups with regard to age and
gender. A concomitant infection was more frequently observed in the youngest age group.
Youngest children had gross hyperglycaemia with mean blood glucose close to 30 mmol/l,
while HbA1c was lowest in children aged 0-4 years, indicating a shorter duration of
hyperglycaemia in this age group.
1.3 The clinical picture at diagnosis was comparable between the two youngest age groups
and similar to the presenting symptoms in older children. The higher blood glucose and lower
HbA1c was even more pronounced in children under 2 years of age.
2. Diabetic ketoacidosis
2.1 Overall 32% of children aged <15 years presented with ketoacidosis at the time of T1DM
onset. In Hungary, the frequency of DKA is high and has not changed over the years despite
the increase in incidence of T1DM. We have not found any regional differences in the
prevalence of DKA among the counties.
2.2 Our study showed an increased frequency and severity of DKA at presentation in the
younger age groups and a reduction with increasing age. Nearly half of the young children 0-4
years of age presented in DKA at diagnosis compared to about one third in children aged 10-
14 years. We observed a conspicuously severe clinical decompensation at onset of type 1
diabetes in children less than 2 years of age; about 60% of them presented with diabetic
ketoacidosis and one fourth presented with impaired consciousness. Patients with ketoacidosis
at onset had a significantly lower BMI-SDS, higher mean blood glucose and mean HbA1c
level and one-quarter of them had an acute infection at presentation. The occurrence of DKA
was less frequent in children with a first degree relative of type 1 diabetes.
2.3 We also sought to investigate factors that could be associated with a higher prevalence of
DKA, such as age at onset, duration of symptoms, history of a preceding infection, history of
56
T1DM among first degree relatives, BMI-SDS and blood glucose at time of diagnosis. As
expected, DKA was more prevalent in younger age groups. Our study showed that children <2
years old had two times the risk of presenting in diabetic ketoacidosis as children aged 10-14
years. This increased risk was not present at 5years of age. Furthermore, higher blood glucose,
lower BMI-SDS and a history of infection were significantly associated with an increased risk
of DKA. Neither a history of T1DM in a first-degree relative nor the duration of symptoms
predicted a diagnosis of new-onset diabetes before progression to DKA.
In Hungary despite considerable improvements in diabetes therapy, no significant decline was
observed in the prevalence of onset DKA over the past 8 years. This finding suggests that the
general public is still not familiar with the signs and symptoms of type 1 diabetes, parents seek
medical attention late, and that can lead to more profound metabolic decompensation,
especially in younger children. The unacceptably large proportion of diabetic children with a
high blood glucose, glycated haemoglobin, dehydration and ketonuria indicate a relatively
severe metabolic decompensation at the time of diagnosis and call for further improvement in
the diagnostic acumen of the paediatric community, as well. The very young children, in whom
clinical presentation is more acute and early diagnosis may be difficult are particularly
vulnerable.
From an epidemiological perspective, further improvements should be made in the educational
programs to increase the sensitivity of parents, child carers and physicians to the early signs of
hyperglycaemia. Only a higher level of public awareness can reduce the frequency and severity
of DKA in children as it has already been proven by information campaigns promoted in Italian
schools (123, 124). A similar campaign has started in Hungary with an article recently
published (13th April 2011) in NŐK LAPJA, the widely read weekly women’s magazine.

57
REFERENCE
1. Report of the Expert Committee on the Diagnosis and Classification of Diabetes Mellitus.
Diabetes Care 1997;20(7):1183-97.
2. Tuomi T, Carlsson A, Li H, Isomaa B, Miettinen A, Nilsson A, et al. Clinical and genetic
characteristics of type 2 diabetes with and without GAD antibodies. Diabetes 1999;48(1):150-
7.
3. Diagnosis and classification of diabetes mellitus. Diabetes Care 2008;31 Suppl 1:S55-60.
4. Libman IM, Becker DJ. Coexistence of type 1 and type 2 diabetes mellitus: "double"
diabetes? Pediatr Diabetes 2003;4(2):110-3.
5. Leslie RD, Kolb H, Schloot NC, Buzzetti R, Mauricio D, De Leiva A, et al. Diabetes
classification: grey zones, sound and smoke: Action LADA 1. Diabetes Metab Res Rev
2008;24(7):511-9.
6. Gepts W. Pathologic anatomy of the pancreas in juvenile diabetes mellitus. Diabetes
1965;14(10):619-33.
7. Butler AE, Galasso R, Meier JJ, Basu R, Rizza RA, Butler PC. Modestly increased beta
cell apoptosis but no increased beta cell replication in recent-onset type 1 diabetic patients
who died of diabetic ketoacidosis. Diabetologia 2007;50(11):2323-31.
8. Knip M. Can we predict type 1 diabetes in the general population? Diabetes Care
2002;25(3):623-5.
9. Atkinson MA, Eisenbarth GS. Type 1 diabetes: new perspectives on disease pathogenesis
and treatment. Lancet 2001;358(9277):221-9.
10. Gorus FK. Diabetes registries and early biological markers of insulin-dependent diabetes
mellitus. Belgian Diabetes Registry. Diabetes Metab Rev 1997;13(4):247-74.

58
11. Molbak AG, Christau B, Marner B, Borch-Johnsen K, Nerup J. Incidence of insulin-
dependent diabetes mellitus in age groups over 30 years in Denmark. Diabet Med
1994;11(7):650-5.
12. Karjalainen J, Salmela P, Ilonen J, Surcel HM, Knip M. A comparison of childhood and
adult type I diabetes mellitus. N Engl J Med 1989;320(14):881-6.
13. Kyvik KO, Nystrom L, Gorus F, Songini M, Oestman J, Castell C, et al. The
epidemiology of Type 1 diabetes mellitus is not the same in young adults as in children.
Diabetologia 2004;47(3):377-84.
14. Korner AM ML. Rising tide of type 2 diabetes mellitus and impaired glucose tolerance
among
Hungarian children and adolescents. Diabetol Hung 2002;10(suppl2):22-7.
15. Barkai L, Madacsy L. [Risk-stratified screening for diabetes in adolescents: results of
the first investigation in Hungary]. Orv Hetil 2010;151(42):1742-7.
16. Fajans SS, Bell GI, Polonsky KS. Molecular mechanisms and clinical pathophysiology of
maturity-onset diabetes of the young. N Engl J Med 2001;345(13):971-80.
17. Vaxillaire M, Froguel P. Genetic basis of maturity-onset diabetes of the young.
Endocrinol Metab Clin North Am 2006;35(2):371-84, x.
18. Bottazzo GF, Florin-Christensen A, Doniach D. Islet-cell antibodies in diabetes mellitus
with autoimmune polyendocrine deficiencies. Lancet 1974;2(7892):1279-83.
19. MacCuish AC, Irvine WJ, Barnes EW, Duncan LJ. Antibodies to pancreatic islet cells in
insulin-dependent diabetics with coexistent autoimmune disease. Lancet 1974;2(7896):1529-
31.
20. Baekkeskov S, Aanstoot HJ, Christgau S, Reetz A, Solimena M, Cascalho M, et al.
Identification of the 64K autoantigen in insulin-dependent diabetes as the GABA-synthesizing
enzyme glutamic acid decarboxylase. Nature 1990;347(6289):151-6.

59
21. Lan MS, Wasserfall C, Maclaren NK, Notkins AL. IA-2, a transmembrane protein of the
protein tyrosine phosphatase family, is a major autoantigen in insulin-dependent diabetes
mellitus. Proc Natl Acad Sci U S A 1996;93(13):6367-70.
22. Wenzlau JM, Juhl K, Yu L, Moua O, Sarkar SA, Gottlieb P, et al. The cation efflux
transporter ZnT8 (Slc30A8) is a major autoantigen in human type 1 diabetes. Proc Natl Acad
Sci U S A 2007;104(43):17040-5.
23. Kimpimaki T, Kupila A, Hamalainen AM, Kukko M, Kulmala P, Savola K, et al. The
first signs of beta-cell autoimmunity appear in infancy in genetically susceptible children from
the general population: the Finnish Type 1 Diabetes Prediction and Prevention Study. J Clin
Endocrinol Metab 2001;86(10):4782-8.
24. Hummel M, Bonifacio E, Schmid S, Walter M, Knopff A, Ziegler AG. Brief
communication: early appearance of islet autoantibodies predicts childhood type 1 diabetes in
offspring of diabetic parents. Ann Intern Med 2004;140(11):882-6.
25. Kimpimaki T, Kulmala P, Savola K, Kupila A, Korhonen S, Simell T, et al. Natural
history of beta-cell autoimmunity in young children with increased genetic susceptibility to
type 1 diabetes recruited from the general population. J Clin Endocrinol Metab
2002;87(10):4572-9.
26. von Herrath M, Sanda S, Herold K. Type 1 diabetes as a relapsing-remitting disease?
Nat Rev Immunol 2007;7(12):988-94.
27. Kyvik KO, Green A, Beck-Nielsen H. Concordance rates of insulin dependent diabetes
mellitus: a population based study of young Danish twins. BMJ 1995;311(7010):913-7.
28. Field LL. Genetic linkage and association studies of Type I diabetes: challenges and
rewards. Diabetologia 2002;45(1):21-35.
29. Moore JH. The ubiquitous nature of epistasis in determining susceptibility to common
human diseases. Hum Hered 2003;56(1-3):73-82.

60
30. Dahlquist G. Environmental risk factors in human type 1 diabetes--an epidemiological
perspective. Diabetes Metab Rev 1995;11(1):37-46.
31. Akerblom HK, Knip M. Putative environmental factors in Type 1 diabetes. Diabetes
Metab Rev 1998;14(1):31-67.
32. Akerblom HK, Vaarala O, Hyoty H, Ilonen J, Knip M. Environmental factors in the
etiology of type 1 diabetes. Am J Med Genet 2002;115(1):18-29.
33. Barnett AH, Eff C, Leslie RD, Pyke DA. Diabetes in identical twins. A study of 200
pairs. Diabetologia 1981;20(2):87-93.
34. Kaprio J, Tuomilehto J, Koskenvuo M, Romanov K, Reunanen A, Eriksson J, et al.
Concordance for type 1 (insulin-dependent) and type 2 (non-insulin-dependent) diabetes
mellitus in a population-based cohort of twins in Finland. Diabetologia 1992;35(11):1060-7.
35. Variation and trends in incidence of childhood diabetes in Europe. EURODIAB ACE
Study Group. Lancet 2000;355(9207):873-6.
36. Gale EA. The rise of childhood type 1 diabetes in the 20th century. Diabetes
2002;51(12):3353-61.
37. Gillespie KM, Bain SC, Barnett AH, Bingley PJ, Christie MR, Gill GV, et al. The rising
incidence of childhood type 1 diabetes and reduced contribution of high-risk HLA haplotypes.
Lancet 2004;364(9446):1699-700.
38. Sanjeevi CB, Sedimbi SK, Landin-Olsson M, Kockum I, Lernmark A. Risk conferred by
HLA-DR and DQ for type 1 diabetes in 0-35-year age group in Sweden. Ann N Y Acad Sci
2008;1150:106-11.
39. Infections and vaccinations as risk factors for childhood type I (insulin-dependent)
diabetes mellitus: a multicentre case-control investigation. EURODIAB Substudy 2 Study
Group. Diabetologia 2000;43(1):47-53.
61
40. Honeyman MC, Coulson BS, Stone NL, Gellert SA, Goldwater PN, Steele CE, et al.
Association between rotavirus infection and pancreatic islet autoimmunity in children at risk of
developing type 1 diabetes. Diabetes 2000;49(8):1319-24.
41. Cardwell CR, Carson DJ, Patterson CC. Parental age at delivery, birth order, birth
weight and gestational age are associated with the risk of childhood Type 1 diabetes: a UK
regional retrospective cohort study. Diabet Med 2005;22(2):200-6.
42. Sumnik Z, Drevinek P, Lanska V, Malcova H, Vavrinec J, Cinek O. Higher maternal
age at delivery, and lower birth orders are associated with increased risk of childhood type 1
diabetes mellitus. Exp Clin Endocrinol Diabetes 2004;112(6):294-7.
43. Lammi N, Moltchanova E, Blomstedt PA, Tuomilehto J, Eriksson JG, Karvonen M.
Childhood BMI trajectories and the risk of developing young adult-onset diabetes.
Diabetologia 2009;52(3):408-14.
44. Harder T, Roepke K, Diller N, Stechling Y, Dudenhausen JW, Plagemann A. Birth
weight, early weight gain, and subsequent risk of type 1 diabetes: systematic review and meta-
analysis. Am J Epidemiol 2009;169(12):1428-36.
45. Vitamin D supplement in early childhood and risk for Type I (insulin-dependent)
diabetes mellitus. The EURODIAB Substudy 2 Study Group. Diabetologia 1999;42(1):51-4.
46. Gerstein HC. Cow's milk exposure and type I diabetes mellitus. A critical overview of
the clinical literature. Diabetes Care 1994;17(1):13-9.
47. Virtanen SM, Jaakkola L, Rasanen L, Ylonen K, Aro A, Lounamaa R, et al. Nitrate and
nitrite intake and the risk for type 1 diabetes in Finnish children. Childhood Diabetes in Finland
Study Group. Diabet Med 1994;11(7):656-62.
48. Hypponen E, Laara E, Reunanen A, Jarvelin MR, Virtanen SM. Intake of vitamin D and
risk of type 1 diabetes: a birth-cohort study. Lancet 2001;358(9292):1500-3.

62
49. Patterson CC, Carson DJ, Hadden DR. Epidemiology of childhood IDDM in Northern
Ireland 1989-1994: low incidence in areas with highest population density and most household
crowding. Northern Ireland Diabetes Study Group. Diabetologia 1996;39(9):1063-9.
50. Thernlund GM, Dahlquist G, Hansson K, Ivarsson SA, Ludvigsson J, Sjoblad S, et al.
Psychological stress and the onset of IDDM in children. Diabetes Care 1995;18(10):1323-9.
51. Essex MJ, Klein MH, Cho E, Kalin NH. Maternal stress beginning in infancy may
sensitize children to later stress exposure: effects on cortisol and behavior. Biol Psychiatry
2002;52(8):776-84.
52. Green A, Gale EA, Patterson CC. Incidence of childhood-onset insulin-dependent
diabetes mellitus: the EURODIAB ACE Study. Lancet 1992;339(8798):905-9.
53. Incidence and trends of childhood Type 1 diabetes worldwide 1990-1999. Diabet Med
2006;23(8):857-66.
54. Cherubini V, Chiarelli F, Altobelli E, Verrotti A, Carle F. Regional variability in the
epidemiology of childhood diabetes in Italy. J Pediatr Endocrinol Metab 1997;10(5):471-8.
55. Harjutsalo V, Sjoberg L, Tuomilehto J. Time trends in the incidence of type 1 diabetes
in Finnish children: a cohort study. Lancet 2008;371(9626):1777-82.
56. Svensson J, Lyngaae-Jorgensen A, Carstensen B, Simonsen LB, Mortensen HB. Long-
term trends in the incidence of type 1 diabetes in Denmark: the seasonal variation changes
over time. Pediatr Diabetes 2009;10(4):248-54.
57. Thorsson AV AT, Helgason T. Incidence of childhood diabetes in Iceland for 35 years
1971–2005 – data from the last decade confirms a steady increase. In: IDF Cape Town 2006
poster. 2006 Ref Type:
Abstract.; 2006.

63
58. Pundziute-Lycka A, Dahlquist G, Urbonaite B, Zalinkevicius R. Time trend of childhood
type 1 diabetes incidence in Lithuania and Sweden, 1983-2000. Acta Paediatr
2004;93(11):1519-24.
59. Podar T, Solntsev A, Karvonen M, Padaiga Z, Brigis G, Urbonaite B, et al. Increasing
incidence of childhood-onset type I diabetes in 3 Baltic countries and Finland 1983-1998.
Diabetologia 2001;44 Suppl 3:B17-20.
60. Patterson CC, Dahlquist GG, Gyurus E, Green A, Soltesz G. Incidence trends for
childhood type 1 diabetes in Europe during 1989-2003 and predicted new cases 2005-20: a
multicentre prospective registration study. Lancet 2009;373(9680):2027-33.
61. Samuelsson U, Lofman O. Geographical mapping of type 1 diabetes in children and
adolescents in south east Sweden. J Epidemiol Community Health 2004;58(5):388-92.
62. Rytkonen M, Ranta J, Tuomilehto J, Karvonen M. Bayesian analysis of geographical
variation in the incidence of Type I diabetes in Finland. Diabetologia 2001;44 Suppl 3:B37-44.
63. McKinney PA, Law GR, Bodansky HJ, Staines A, Williams DR. Geographical mapping
of childhood diabetes in the northern English county of Yorkshire. Diabet Med
1996;13(8):734-40.
64. Cherubini V, Carle F, Gesuita R, Iannilli A, Tuomilehto J, Prisco F, et al. Large
incidence variation of Type I diabetes in central-southern Italy 1990-1995: lower risk in rural
areas. Diabetologia 1999;42(7):789-92.
65. Songini M, Bernardinelli L, Clayton D, Montomoli C, Pascutto C, Ghislandi M, et al.
The Sardinian IDDM study: 1. Epidemiology and geographical distribution of IDDM in
Sardinia during 1989 to 1994. Diabetologia 1998;41(2):221-7.
66. Rytkonen M, Moltchanova E, Ranta J, Taskinen O, Tuomilehto J, Karvonen M. The
incidence of type 1 diabetes among children in Finland--rural-urban difference. Health Place
2003;9(4):315-25.

64
67. Holmqvist BM, Lofman O, Samuelsson U. A low incidence of Type 1 diabetes between
1977 and 2001 in south-eastern Sweden in areas with high population density and which are
more deprived. Diabet Med 2008;25(3):255-60.
68. Staines A, Bodansky HJ, McKinney PA, Alexander FE, McNally RJ, Law GR, et al.
Small area variation in the incidence of childhood insulin-dependent diabetes mellitus in
Yorkshire, UK: links with overcrowding and population density. Int J Epidemiol
1997;26(6):1307-13.
69. Pundziute-Lycka A, Urbonaite B, Ostrauskas R, Zalinkevicius R, Dahlquist GG.
Incidence of type 1 diabetes in Lithuanians aged 0-39 years varies by the urban-rural setting,
and the time change differs for men and women during 1991-2000. Diabetes Care
2003;26(3):671-6.
70. Dabelea D, Bell RA, D'Agostino RB, Jr., Imperatore G, Johansen JM, Linder B, et al.
Incidence of diabetes in youth in the United States. JAMA 2007;297(24):2716-24.
71. Ehehalt S, Popovic P, Muntoni S, Willasch A, Hub R, Ranke MB, et al. Incidence of
diabetes mellitus among children of Italian migrants substantiates the role of genetic factors in
the pathogenesis of type 1 diabetes. Eur J Pediatr 2009;168(5):613-7.
72. Muntoni S, Fonte MT, Stoduto S, Marietti G, Bizzarri C, Crino A, et al. Incidence of
insulin-dependent diabetes mellitus among Sardinian-heritage children born in Lazio region,
Italy. Lancet 1997;349(9046):160-2.
73. Ikegami H, Ogihara T. Genetics of insulin-dependent diabetes mellitus. Endocr J
1996;43(6):605-13.
74. Levy-Marchal C, Patterson C, Green A. Variation by age group and seasonality at
diagnosis of childhood IDDM in Europe. The EURODIAB ACE Study Group. Diabetologia
1995;38(7):823-30.

65
75. Willis JA, Scott RS, Darlow BA, Lewy H, Ashkenazi I, Laron Z. Seasonality of birth
and onset of clinical disease in children and adolescents (0-19 years) with type 1 diabetes
mellitus in Canterbury, New Zealand. J Pediatr Endocrinol Metab 2002;15(5):645-7.
76. Padaiga Z, Tuomilehto J, Karvonen M, Dahlquist G, Podar T, Adojaan B, et al.
Seasonal variation in the incidence of Type 1 diabetes mellitus during 1983 to 1992 in the
countries around the Baltic Sea. Diabet Med 1999;16(9):736-43.
77. Michalkova DM, Cernay J, Dankova A, Rusnak M, Fandakova K. Incidence and
prevalence of childhood diabetes in Slovakia (1985-1992). Slovak Childhood Diabetes
Epidemiology Study Group. Diabetes Care 1995;18(3):315-20.
78. Moltchanova EV, Schreier N, Lammi N, Karvonen M. Seasonal variation of diagnosis
of Type 1 diabetes mellitus in children worldwide. Diabet Med 2009;26(7):673-8.
79. Dahlquist GG, Kallen BA. Time-space clustering of date at birth in childhood-onset
diabetes. Diabetes Care 1996;19(4):328-32.
80. Samuelsson U, Johansson C, Ludvigsson J. Month of birth and risk of developing insulin
dependent diabetes in south east Sweden. Arch Dis Child 1999;81(2):143-6.
81. Laron Z. Interplay between heredity and environment in the recent explosion of type 1
childhood diabetes mellitus. Am J Med Genet 2002;115(1):4-7.
82. Grover V, Lipton RB, Sclove SL. Seasonality of month of birth among African
American children with diabetes mellitus in the city of Chicago. J Pediatr Endocrinol Metab
2004;17(3):289-96.
83. McKinney PA. Seasonality of birth in patients with childhood Type I diabetes in 19
European regions. Diabetologia 2001;44 Suppl 3:B67-74.
84. Pundziute-Lycka A, Dahlquist G, Nystrom L, Arnqvist H, Bjork E, Blohme G, et al.
The incidence of Type I diabetes has not increased but shifted to a younger age at diagnosis in
the 0-34 years group in Sweden 1983-1998. Diabetologia 2002;45(6):783-91.

66
85. Karvonen M, Pitkaniemi M, Pitkaniemi J, Kohtamaki K, Tajima N, Tuomilehto J. Sex
difference in the incidence of insulin-dependent diabetes mellitus: an analysis of the recent
epidemiological data. World Health Organization DIAMOND Project Group. Diabetes Metab
Rev 1997;13(4):275-91.
86. Dahlquist GG, Nystrom L, Patterson CC. Incidence of Type 1 Diabetes in Sweden
Among Individuals Aged 0-34 Years, 1983-2007: An analysis of time trends. Diabetes Care
2011;34(8):1754-9.
87. Soltesz G, Madacsy L, Bekefi D, Danko I. Rising incidence of type 1 diabetes in
Hungarian children (1978-1987). Hungarian Childhood Diabetes Epidemiology Group. Diabet
Med 1990;7(2):111-4.
88. Edwards JH. The recognition and estimation of cyclic trends. Ann Hum Genet
1961;25:83-7.
89. Michalkova D, Minarik P, Hlava P, Camajova J, Nazarov V. Trends in the incidence of
childhood-onset type 1 diabetes in Slovakia 1985 - 2000. Cent Eur J Public Health
2004;12(2):75-7.
90. Stipancic G, La Grasta Sabolic L, Malenica M, Radica A, Skrabic V, Tiljak MK.
Incidence and trends of childhood Type 1 diabetes in Croatia from 1995 to 2003. Diabetes Res
Clin Pract 2008;80(1):122-7.
91. Schober E, Rami B, Waldhoer T. Steep increase of incidence of childhood diabetes since
1999 in Austria. Time trend analysis 1979-2005. A nationwide study. Eur J Pediatr
2008;167(3):293-7.
92. Bratina NU, Tahirovic H, Battelino T, Krzisnik C. Incidence of childhood-onset Type I
diabetes in Slovenia and the Tuzia region (Bosnia and Herzegovina) in the period 1990-1998.
Diabetologia 2001;44 Suppl 3:B27-31.

67
93. Gyurus E, Green A, Patterson CC, Soltesz G. Dynamic changes in the trends in
incidence of type 1 diabetes in children in Hungary (1978-98). Pediatr Diabetes
2002;3(4):194-9.
94. Joner G, Stene LC, Sovik O. Nationwide, prospective registration of type 1 diabetes in
children aged <15 years in norway 1989-1998: no increase but significant regional variation in
incidence. Diabetes Care 2004;27(7):1618-22.
95. Taplin CE, Craig ME, Lloyd M, Taylor C, Crock P, Silink M, et al. The rising incidence
of childhood type 1 diabetes in New South Wales, 1990-2002. Med J Aust 2005;183(5):243-
6.
96. Ehehalt S, Blumenstock G, Willasch AM, Hub R, Ranke MB, Neu A. Continuous rise in
incidence of childhood Type 1 diabetes in Germany. Diabet Med 2008;25(6):755-7.
97. Cinek O, Sumnik Z, Vavrinec J. [Childhood diabetes in the Czech Republic: a steady
increase in incidence]. Cas Lek Cesk 2005;144(4):266-71; discussion 71-2.
98. Jarosz-Chobot P, Polanska J, Szadkowska A, Kretowski A, Bandurska-Stankiewicz E,
Ciechanowska M, et al. Rapid increase in the incidence of type 1 diabetes in Polish children
from 1989 to 2004, and predictions for 2010 to 2025. Diabetologia;54(3):508-15.
99. Berhan Y, Waernbaum I, Lind T, Mollsten A, Dahlquist G. Thirty years of prospective
nationwide incidence of childhood type 1 diabetes: the accelerating increase by time tends to
level off in Sweden. Diabetes 2011;60(2):577-81.
100. Hypponen E, Virtanen SM, Kenward MG, Knip M, Akerblom HK. Obesity, increased
linear growth, and risk of type 1 diabetes in children. Diabetes Care 2000;23(12):1755-60.
101. Wilkin TJ. The accelerator hypothesis: weight gain as the missing link between Type I
and Type II diabetes. Diabetologia 2001;44(7):914-22.
102. Knip M, Virtanen SM, Akerblom HK. Infant feeding and the risk of type 1 diabetes. Am
J Clin Nutr;91(5):1506S-13S.

68
103. Dahlquist G. Can we slow the rising incidence of childhood-onset autoimmune diabetes?
The overload hypothesis. Diabetologia 2006;49(1):20-4.
104. Gale EA. A missing link in the hygiene hypothesis? Diabetologia 2002;45(4):588-94.
105. Fernandez Castaner M, Montana E, Camps I, Biarnes J, Merino JF, Escriba JM, et al.
Ketoacidosis at diagnosis is predictive of lower residual beta-cell function and poor metabolic
control in type 1 diabetes. Diabetes Metab 1996;22(5):349-55.
106. Bowden SA, Duck MM, Hoffman RP. Young children (<5 yr) and adolescents (>12 yr)
with type 1 diabetes mellitus have low rate of partial remission: diabetic ketoacidosis is an
important risk factor. Pediatr Diabetes 2008;9(3 Pt 1):197-201.
107. Abdul-Rasoul M, Habib H, Al-Khouly M. 'The honeymoon phase' in children with type
1 diabetes mellitus: frequency, duration, and influential factors. Pediatr Diabetes
2006;7(2):101-7.
108. Samuelsson U, Stenhammar L. Clinical characteristics at onset of Type 1 diabetes in
children diagnosed between 1977 and 2001 in the south-east region of Sweden. Diabetes Res
Clin Pract 2005;68(1):49-55.
109. Pozzilli P, Andreani D. Type 1 diabetes at presentation: the scene changes. Diabet Med
1990;7(9):762-3.
110. Bui TP, Werther GA, Cameron FJ. Trends in diabetic ketoacidosis in childhood and
adolescence: a 15-yr experience. Pediatr Diabetes 2002;3(2):82-8.
111. Pinkey JH, Bingley PJ, Sawtell PA, Dunger DB, Gale EA. Presentation and progress of
childhood diabetes mellitus: a prospective population-based study. The Bart's-Oxford Study
Group. Diabetologia 1994;37(1):70-4.
112. Soltesz G, Gyorko BJ, Levy-Marchal C. [Clinical diagnosis of childhood insulin
dependent diabetes mellitus. Hungarian Epidemiological Group for Childhood Diabetes]. Orv
Hetil 1997;138(1):7-9.
69
113. Krikovszky D, Luczay A, Korner A, Madacsy L. [Diabetic ketoacidosis in childhood].
Orv Hetil 2000;141(4):173-7.
114. Gyürüs E HR, Soltész Gy. Diabetic ketoacidosis in childhood - Experiences of treatment
over the last ten years. Diabetologica Hungarica 1998;6(2):79-84.
115. Joubert K, Darvai S, Gyenis G, Éltető Ö, Mag K, van't Hof M, et al. [Results of the
national longitudinal growth studies in Hungarian children from birth up to the age of 18
years.]. Budapest: Hungarian Central Statistical Office, Demographic research Institute; 2006.
116. Nordwall M, Ludvigsson J. Clinical manifestations and beta cell function in Swedish
diabetic children have remained unchanged during the last 25 years. Diabetes Metab Res Rev
2008;24(6):472-9.
117. Hekkala A, Reunanen A, Koski M, Knip M, Veijola R. Age-related differences in the
frequency of ketoacidosis at diagnosis of type 1 diabetes in children and adolescents. Diabetes
Care 2010;33(7):1500-2.
118. Neu A, Hofer SE, Karges B, Oeverink R, Rosenbauer J, Holl RW. Ketoacidosis at
diabetes onset is still frequent in children and adolescents: a multicenter analysis of 14,664
patients from 106 institutions. Diabetes Care 2009;32(9):1647-8.
119. Szypowska A, Skorka A. The risk factors of ketoacidosis in children with newly
diagnosed type 1 diabetes mellitus. Pediatr Diabetes 2011;12(4 Pt 1):302-6.
120. Schober E, Rami B, Waldhoer T. Diabetic ketoacidosis at diagnosis in Austrian children
in 1989-2008: a population-based analysis. Diabetologia 2010;53(6):1057-61.
121. Fritsch M, Rosenbauer J, Schober E, Neu A, Placzek K, Holl RW. Predictors of diabetic
ketoacidosis in children and adolescents with type 1 diabetes. Experience from a large
multicentre database. Pediatr Diabetes 2011;12(4 Pt 1):307-12.

70
122. Komulainen J, Kulmala P, Savola K, Lounamaa R, Ilonen J, Reijonen H, et al. Clinical,
autoimmune, and genetic characteristics of very young children with type 1 diabetes.
Childhood Diabetes in Finland (DiMe) Study Group. Diabetes Care 1999;22(12):1950-5.
123. Vanelli M, Chiari G, Ghizzoni L, Costi G, Giacalone T, Chiarelli F. Effectiveness of a
prevention program for diabetic ketoacidosis in children. An 8-year study in schools and
private practices. Diabetes Care 1999;22(1):7-9.
124. Vanelli M, Scarabello C, Fainardi V. Available tools for primary ketoacidosis prevention
at diabetes diagnosis in children and adolescents. "The Parma campaign". Acta Biomed
2008;79(1):73-8.
71
PUBLICATIONS
PUBLICATIONS IN RELATION TO THESIS:
1. Gyürüs E, Patterson CC, Soltesz G and the Hungarian Childhood Diabetes
Epidemiology Group. Twenty-one years of prospective incidence of childhood type 1
diabetes in Hungary – the rising trend continues (or peaks and highlands?). Pediatric
Diabetes 2012;13:21-25. IF: 2.171
2. Gyürüs E, Patterson CC, Soltesz G and the Hungarian Childhood Diabetes
Epidemiology Group. “Continuous rise or peaks and highlands?" Incidence of
childhood type 1 diabetes in Hungary (1989-2009). Orv Hetil 2011; 152(42):1692-97.
(Hungarian)
3. Patterson CC, Dahlquist GG, Gyürüs E, Green A, Soltész G. EURODIAB Study
Group. Incidence trends for childhood type 1 diabetes in Europe during 1989-2003
and predicted new cases 2005-20: a multicentre prospective registration study. Lancet.
2009; 373(9680):2027-33. IF:30.758
4. Gyürüs E, Soltesz Gy: Incidence of childhood type 1 diabetes in Europe. Lege Artis
Medicinae 2004; 14(6):399-404. (Hungarian)
5. Gyürüs E, Green A, Patterson CC, Soltesz Gy and the Hungarian Childhood Diabetes
Epidemiology Group. Dynamic changes in the trends in incidence of type 1 diabetes in
children in Hungary (1978-1997) Pediatric Diabetes 2002; 3:194-99.

72
6. Gyürüs E, Györkő B, Green A, Patterson C, Soltész G. Incidence of childhood type 1
diabetes in Hungary (1978-1997) Orv Hetil. 1999; 140(20):1107-11. (Hungarian)
7. Gyürüs E, Hermann R, Soltesz Gy. Diabetic ketoacidosis in children. Experiences of
treatment in the last ten years. Diabetologia Hungarica 1998; 6:79-84. (Hungarian)
ABSTRACTS IN RELATION TO THESIS
1. EK Gyurus, G. Soltesz & The Hungarian Childhood Diabetes Epidemiology Group:
Changing pattern in incidence of type 1 diabetes in Hungarian children over 1989–
2008. Pediatric Diabetes 2010; 11:(Suppl. 14), O3, page 23. IF:2.171
2. E Gyurus, G. Soltesz for the Hungarian Childhood Diabetes Epidemiology Study
Group: Clinical characteristics at presentation – analysis of 1444 prospective incidence
cases of the Hungarian Registry (2002-2008) Pediatric Diabetes 2009; 10:(Suppl. 11),
Inv 38, p 12 IF:2.628
3. Gyürüs E, Györkő M, Patterson C, Green A, Soltész G and the Hungarian Childhood
Diabetes Epidemiology Group. Twenty year incidence of type 1 diabetes in Hungarian
children (1978-1997). Diab Res and Clin Practice 1999; 44:(Suppl. 81)

73
OTHER PUBLICATIONS
1. Gyurus E, Kaposztas Z, Kahan BD Sirolimus therapy predisposes to new-onset
diabetes mellitus after renal transplantation: a long-term analysis of various treatment
regimens. Transpl P 2011; 43(5):1583-92. IF: 0.993
2. Kaposztas Z, Gyurus E, Kahan BD. New-onset diabetes after renal transplantation:
diagnosis, incidence, risk factors, impact on outcomes and novel implications. Transpl
P 2011; 43(5):1375-94. IF: 0.993
3. Patterson CC, Dahlquist G, Harjutsalo V, Joner G, Feltbower RG, Svensson J,
Schober E, Gyürüs E, Castell C, Urbonaité B, Rosenbauer J, Iotova V, Thorsson AV,
Soltész G. Early mortality in EURODIAB population-based cohorts of type 1 diabetes
diagnosed in childhood since 1989. Diabetologia 2007; 50(12):2439-42. IF:5.822
4. Gyürüs E, Soltész Gy: Growth patterns and final height in children with type 1
diabetes. Diabetologia Hungarica 2005; 13(1):37-41. (Hungarian)
5. Kyvik KO, Nystrom L, Gorus F, Songini M, Oestman J, Castell C, Green A, Gyürüs
E, Ionescu-Tirgoviste C, McKinney PA, Michalkova D, Ostrauskas R, Raymond NT.
The epidemiology of Type 1 diabetes mellitus is not the same in young adults as in
children. Diabetologia 2004; 47(3):377-384. IF:5.583
6. Gyürüs E, Szász M, Kövesi T, Adamovich K: Perioperative management of neonates
Gyermekgyógyászat 2004; 55(6):674-680. (Hungarian)

74
7. Hermann R, Gombos Z, Gyürüs E, Soltesz Gy. Prevalence and predictive value of
GAD65 autoantibodies and their correlation with HLA DR-DQ genotypes in children
with type-1 diabetes Orv Hetil. 2003; 23;144(8):355-360. (Hungarian)
8. Soltész Gy, Gyürüs E. Effects of mild and severe hypoglycaemia on the brain.
Gyermekgyógyászat 1999; 50(1):18-22. (Hungarian)
ABSTRACTS PUBLISHED in PERIODICALS or JOURNALS
1. C Patterson C, G Dahlquist, E Gyürüs, G Soltész, EURODIAB Childhood Type 1
Diabetes Registers. EURODIAB childhood type 1 diabetes incidence registers – results
from the first 20 years. Diabetologia 2011; 54:(Suppl1)S72. IF:6.973
2. Z Kaposztas, E Gyurus, BD Kahan. Sirolimus therapy exacerbates new onset diabetes
mellitus after renal transplantation: a long-term analysis of various treatment regimens.
Transplant Int 2011; 24:(Suppl. 2), p135 IF:3.1
3. Z Kaposztas, E Gyurus, BD Kahan. Primary role of sirolimus (SRL) to exacerbate
new onset diabetes after renal transplantation (NODAT) Am J Transplant 2010;
10:(Suppl. 4), p245 IF:6.048
4. Z Kaposztas, E Gyurus, BD Kahan. Adverse impact of sirolimus on development of
new onset disabetes after transplantation. Am J Transplant 2009; 9:(Suppl. 2) IF:6.433
75
5. C Patterson C, G Dahlquist, E Gyürüs, G Soltész. Incidence trends for childhood type
1 diabetes in Europe during 1989-2003 and projection of numbers to 2025.
Diabetologia 2008; 51:(Suppl1)S49. IF:6.418
POSTERS
1. Z. Kaposztas, E. Gyurus, BD Kahan. Sirolimus Therapy Exacerbates New Onset
Diabetes Mellitus after Renal Transplantation: A Long Term Analysis of Various
Treatment Regimens ESOT congress Glasgow Sept. 4-7, 2011
2. Z Kaposztas, E Gyurus, BD Kahan. Adverse impact of sirolimus on development of
new onset diabetes after transplantation. American Transplant Congress 2009, May,
Boston, USA
ORAL PRESENTATIONS
1. Z Kaposztas, E Gyurus, BD Kahan. Sirolimus therapy exacerbates new onset diabetes
mellitus after renal transplantation: a long-term analysis of various treatment regimens.
European Society for Organ Transplantation (ESOT), 4-7 September 2011, Glasgow,
UK
2. Gyürüs E, Soltesz Gy and The Hungarian Childhood Diabetes Epidemiology Group:
Changing pattern in incidence of type 1 diabetes in Hungarian children over 1989-
2008. 36th Annual Meeting of the International Society of Pediatric and Adolescent
Diabetes (ISPAD), 27-30 October 2010, Buenos Aires, Argentina

76
3. Gyürüs E, Soltesz Gy and The Hungarian Childhood Diabetes Epidemiology Group:
Prospective analysis of the incident cases of the Hungarian Childhood Diabetes
Registry (1989-2008). XVII. Scientific Meeting of the Hungarian Childhood Diabetes
Association, 15-16 October 2010, Győr, Hungary
4. Gyürüs E, Soltesz Gy and The Hungarian Childhood Diabetes Epidemiology Group:
Clinical characteristics at time of diagnosis – prospective analysis of 1444 cases in
incidence of type 1 diabetes in Hungarian children (2002-2008). XX. Scientific
Meeting of the Hungarian Diabetes Association, 22-25 April 2010, Tihany, Hungary
5. Gyürüs E, Soltesz G for the Hungarian Childhood Diabetes Epidemiology Study
Group Clinical characteristics at presentation – analysis of 1444 prospective incidence
cases of the Hungarian Registry (2002-2008). 35th Annual Meeting of the
International Society of Pediatric and Adolescent Diabetes (ISPAD), 2-5 September
2009, Ljubljana, Slovenia
6. Gyürüs E, Soltesz Gy and The Hungarian Childhood Diabetes Epidemiology Group:
Clinical characteristics at time of diagnosis – prospective analysis of 1444 cases of type
1 diabetes (2002-2008). XVI. Scientific Meeting of the Hungarian Diabetes
Association, 13-14 November 2009, Gödöllő, Hungary
7. Patterson C, Dahlquist G, Gyürüs E, Soltész G. Incidence trends for childhood type 1
diabetes in Europe during 1989-2003 and projection of numbers to 2025. 44th

77
European Association for the Study of Diabetes (EASD) Annual Meeting, 7-11
September 2008, Rome, Italy
8. Gyürüs E, Soltesz Gy and The Hungarian Childhood Diabetes Epidemiology Group:
Comparison of clinical presentation of childhood type 1 diabetes nowadays and ten
years before. Scientific Meeting of the Hungarian Childhood Diabetes Association, 7-8
October 2005, Székesfehérvár, Hungary
9. Gyürüs E, Soltesz Gy and The Hungarian Childhood Diabetes Epidemiology Group:
Diabetic epidemic in Hungary? Scientific Meeting of the Hungarian Childhood
Diabetes Association, Oct 7-8. 2005., Székesfehérvár, Hungary
10. Gyürüs E, Green A, Patterson C, Soltesz Gy and The Hungarian Childhood Diabetes
Epidemiology Group: Changes in incidence of type 1 diabetes in Hungarian children.
The 25-year-old Hungarian Childhood Diabetes Registry. XVII. Scientific Meeting of
the Hungarian Diabetes Association, 22-25 April 2004, Tihany, Hungary
11. Gyürüs E, Green A, Soltesz Gy: Impact of the family history of type 1 diabetes
mellitus in Hungarian children. (1989-1999) XVI. Scientific Meeting of the Hungarian
Diabetes Association, May 30-June 2 2002, Debrecen, Hungary
12. Gyürüs E, Green A, Patterson C, Gyorko JM, Soltesz Gy: Clinical characteristics of
newly diagnosed diabetic children. XV. Scientific Meeting of the Hungarian Diabetes
Association, 13-16 April 2000, Tihany, Hungary

78
13. Gyürüs E, Gyorko M, Patterson C, Green A, Soltesz Gy and the Hungarian
Childhood Diabetes Epidemiology Group Twenty-year incidence of type 1 diabetes in
Hungarian children (1978-1997). 25th Annual Meeting of the International Society for
Pediatric and Adolescent Diabetes, 24-27 April 1999, Noordwijkerhout, Holland
14. Gyürüs E, Gyorko M, Patterson C, Soltesz Gy and the Hungarian Childhood Diabetes
Epidemiology Group: Incidence of Type 1 diabetes in Hungarian children (1978-1997)
The EURODIAB TIGER Workshop, 16-17 October 1998, Pécs, Hungary
15. Gyürüs E, Gyorko M, Patterson C, Soltesz Gy and the Hungarian Childhood Diabetes
Epidemiology Group: The twenty-year-old Hungarian Childhood Diabetes Registry
(1978-1997) – Trend-analysis of incidence. Scientific Meeting of the Hungarian
Childhood Diabetes Association, 2-3 October 1998, Nyíregyháza, Hungary
16. Gyürüs E: Incidence of type 1 diabetes mellitus in Hungary in children aged 0-14
years. II. Conference for PhD Students, 30 August -1 September 1998, Debrecen,
Hungary
17. Gyürüs E, Hermann R, Soltesz Gy. Management of diabetic ketoacidosis in diabetic
children The Annual Meeting of The Hungarian Pediatric Association, 24-27 June
1998, Szeged, Hungary

79
18. Gyürüs E, Hermann R, Soltesz Gy. Diabetic ketoacidosis at diagnosis of childhood
type 1 diabetes. Temporal changes over the last 20 years. XIV. Scientific Meeting of
the Hungarian Diabetes Association, 17-19 April 1998, Eger, Hungary
19. Gyürüs E, Hermann R, Bódis M, Soltesz Gy. Diabetic ketoacidosis: experiences of
treatment in the last ten years. Scientific Meeting of the Hungarian Childhood Diabetes
Association, 19-20 September 1997, Szombathely, Hungary
20. Gyürüs E, Szász M, Kövesi T, Adamovich K.: Perioperative management of neonates
for surgical emergencies. I. Annual Meeting of the Hungarian Perinatology
Association, 27-28 September 2002, Lakitelek, Hungary
21. Gyürüs E, Szász M, Kövesi T, Adamovich K.: Perioperative management of
neonates in our PIC XIV. Scientific Meeting of the Hungarian Childhood
Anaesthesiology and Intensive Care Association, 26-27 April 2002, Visegrád, Hungary

80
ACKNOWLEDGEMENTS
This PhD thesis would not have been possible without the guidance and the help of several
individuals who in one way or another contributed and extended their valuable assistance in
the preparation and completion of this study.
I would like to express my sincere gratitude to Professor Gyula Soltesz, my mentor, who has
introduced me to the field of diabetes as a medical student and later supported me throughout
my clinical studies. I am grateful for his detailed and constructive comments, and for his
important support throughout this work. This thesis would not have been possible without his
guidance, kind support, inspiration and persistent encouragement.
I would like to express my warm and sincere thanks to Professor Anders Green, who has
introduced me to the field of epidemiology and statistics. His perpetual energy and enthusiasm
in research has always motivated me. I also thank him for his support and the opportunity of
spending some time in the Department of Epidemiology and Public Health, Aarhus, Denmark.
I am grateful to his wife Bodil, for the friendly atmosphere during my stay in Aarhus and for
both of their friendship.
I would like to thank my co-author, Dr Chris Patterson for his guidance in statistical analysis
and his invaluable input.
The realisation of my work would not have been possible without the continuous collaboration
of the members of the Hungarian Childhood Diabetes Epidemiology Group. I also thank Mrs

81
Györgyné Molnár Senior Counsellor of The Hungarian Central Statistical Office, who
provided me with the important population data throughout the years.
I also wish to thank my colleagues in the Endocrinology and Diabetes Unit for their
contribution to my work and the friendly atmosphere.
Most of all, I wish to thank the love and continuous support of my husband and my wonderful
children, not only on this thesis, but also throughout the years. I would like to thank my
parents and my brother, whose love and guidance are with me in whatever I pursue. I could
not have managed without their encouragement.