The Environmental Flow Determination for the Barwon River ... · The Environmental Flow...
135
The Environmental Flow Determination for the Barwon River - Issues Paper Corangamite Catchment Management Authority 64 Dennis St COLAC VIC 3250 AUGUST 2005
Transcript of The Environmental Flow Determination for the Barwon River ... · The Environmental Flow...

The Environmental Flow Determination for the Barwon River - Issues Paper
Corangamite Catchment Management Authority 64 Dennis St COLAC VIC 3250
AUGUST 2005

Contents
i
1 Introduction -----------------------------------------------------------------------------------------------------------------------------2
1.1 The Barwon River Environmental Flows Project 2 1.2 The Adopted Methodology 6 1.3 The Technical Panel ii 1.4 Issues Paper Scope 7
2 Policy Context -------------------------------------------------------------------------------------------------------------------------9
2.1 Strategic Basis for the Assessment and Provision of Environmental Water Requirements 9
3 Review of Existing Information----------------------------------------------------------------------------------------------11
3.1 General Catchment Characteristics 11 3.2 Catchment Development 11 3.3 Catchment Geology and Geomorphology 12 3.4 Groundwater 13 3.5 Water Resources System Operation 13
4 Hydrology ------------------------------------------------------------------------------------------------------------------------------16
4.1 Preamble 16 4.2 Data availability 16 4.3 Methodogy 18 4.4 Annual discharge 22 4.5 Flow duration curves for entire year 24 4.6 Distribution of flow types 26 4.7 Flow seasonality 28 4.8 Cease to flow frequency-duration 32 4.9 Low flows 38 4.10 Low flow freshes 43 4.11 High baseflows 51 4.12 High flow freshes 55 4.13 Bankfull and overbank flows 63 4.14 Rate of rise and fall 65 4.15 Summary 81
5 Environmental Values and Current Condition -----------------------------------------------------------------------85
5.1 Stream Condition 85 5.2 Water Quality 87 5.3 Geomorphology 88 5.4 Vegetation and Aquatic Plant Communities 97 5.5 Macroinvertebrates 113 5.6 Fish 114 5.7 Aquatic Fauna Habitat and Flow Objectives 122
6 Constraints and Risks ---------------------------------------------------------------------------------------------------------128
6.1 Key Information Gaps 128 6.2 Constraints by Non-flow-related Issues 128 6.3 Operational Constraints 128 6.4 Risks Associated with Flow Changes 128
7 References --------------------------------------------------------------------------------------------------------------------------129

Acknowledgements
ii
This report was developed with a range of inputs of several people. These are acknowledged below: Technical Panel
The determination of the environmental flow requirements of the Barwon River is being undertaken by the Barwon River Environmental Flows Technical Panel (EFTP) which comprises:
• Lance Lloyd Fish and Macro-invertebrate Ecology
• Dr Marcus Cooling Plant Ecology
• Dr Chris Gippel Hydrology and Fluvial Geomorphology
• Dr Brett Anderson Hydraulics & Modelling
• Associate Professor John Sherwood Estuarine Ecology
The project was reviewed by Dr Mike Stewardson of The University of Melbourne, who is a hydrologist and environmental flows expert.
Steering Committee
The EFTP's investigations have been assisted by the Steering Committee which comprises:
• Simone Gunn, Corangamite Catchment Management Authority
• Cameron Welsh, Southern Rural Water
• Steve Nicol, Department of Sustainability and Environment
• Cameron Howie and Mee Teng, Barwon Region Water Authority.
Community Advisory Committee and Expert Panel – Estuaries
In addition, a Community Advisory Committee and an Expert Panel – Estuaries (consisting of the estuary and freshwater scientists and managers) have also been established to assist the Environmental Flows Technical Panel and the Steering Committee for this project. Advisory Committee members included Bob Carraill, Pat Russell, Cameron Steele , Steven McDougal, Trevor Prescott, Nellie Shalley, Stuart Mathieson, Gary Battye, Graham Perkins , Neil Pearce, Gary Wishart, and David Cotsell. The Expert Panel – Estuaries included Matt Ward, Lochie Jackson, Peter Kemp, Ian McLaughlan, Graham Perkins, Trevor Prescott as well as members of the Steering Committee and the Project team.

SECTION 1 Introduction
1
Introduction
The Barwon River Environmental Flows Project will recommend the flows required to achieve a 'healthy river ecosystem', as defined by the Victorian River Health Strategy. The project applies the FLOWS methodology for determining environmental water requirements (DNRE 2001).
This project follows the recent Victorian Government White Paper, Our Water Our Future, which recognised that water in the Barwon River is fully allocated. Our Water Our Future sets out a plan to establish an Environmental Water Reserve to provide for environmental water requirements by capping the consumption of water.
The FLOWS methodology involves the collation and review of the information through literature review, field assessments, consultations with agency and community members, topographic surveys of each site, hydraulic modelling, and a scientific panel workshop to make environmental flow recommendations. This document, the Issues Paper presents a preliminary assessment of the physical and ecological assets that are to be protected and promoted in the river, and makes preliminary recommendations for the flows on which they depend. It should be read in conjunction with the Site Paper that was completed earlier in the project and summarised the general characteristics of the study area and identified the river reaches on which the methodology will be based.

SECTION 1 Introduction
2
1 I n t r o d u c t i o n
1.1 The Barwon River Environmental Flows Project
Background
The Barwon River is identified as a fully-allocated catchment where the water reserve will be established initially by recognising existing entitlements, capping consumption, and applying a moratorium to new diversions. In a state -wide assessment, the Barwon has been identified as one of 21 streams which require the development of a stream flow management plan. The Victorian Government White Paper 'Securing Our Water Future Together' provides the policy underpinning for the water needs of the environment by establishing an Environmental Water Reserve.
The Corangamite CMA is responsible for the overall river health of the Barwon River and the assessment of the environmental flow needs of this river, including its internationally significant lakes and wetlands in its estuary zone. The CMA is responsible for determining ecological objectives for flow-dependent ecosystems, which will be used by DSE to set priorities and develop options for water recovery.
The Barwon is a major water supply for Geelong, the smaller urban centres, and farm water supply for the region. The system is significantly altered via extensive farm dam storages, on-stream reservoirs and many diversion licences. Inter-basin transfers occur from Lake Colac (via the Lough Calvert drainage scheme) and Lake Corangamite (via the Woady Yaloak drainage scheme) into the Barwon River.
Recent assessment of the ecological condition of the river, as part of the Corangamite River Health Strategy, has indicated that most reaches are in marginal to very poor condition, whereas a few streams in good or excellent condition are high in the catchment, above water supply storages. Wetland condition assessment (2004), which covers 5 sub-catchments only, has shown that most wetlands (60%) are either degraded or severely degraded, with only 15% being intact or pristine.
The estuary of the Barwon River, which includes Lake Connewarre, Reedy Lake and the lower Barwon, are internationally significant wetlands and regional, Victorian and Australian government agencies have a responsibility to protect and enhance these values.
The Corangamite CMA has commissioned Lloyd Environmental Pty Ltd, Ecological Associates Pty Ltd, and Fluvial Systems Pty Ltd to undertake this FLOWs study to gain an understanding of the role of water in the health and functioning of the freshwater and estuarine reaches of the Barwon River system. The study will classify the flows in each hydrological component, or reach, of the system, and predict the frequency, duration and seasonality of each flow band required to sustain the ecosystem. Quantification of these requirements, through a hydrological model, will allow the deficiencies between the required and current water regime to be prioritised and targeted by appropriate use of available environmental flows.

SECTION 1 Introduction
3
Figure 1: The Barwon River Catchment
Objectives
The overall objective of this project is to determine the environmental water requirements of the Barwon River, including Lake Connewarre and the Barwon Estuary, and to develop options to meet the environmental needs.
More specifically, this investigation will:
• identify water dependent environmental and social values within each reach;
• gauge the current health of the environmental values;
• identify the flow regimes that will maintain or enhance the environmental values;
• develop Environmental Flow Objectives that take into account current social, economic and environmental values of the river; and,
• recommend an environmental flow regime to meet the objectives.

SECTION 1 Introduction
4
The Study Area
The Barwon River rises in the Otway Ranges and flows close to the townships of Forrest, Birregurra, Winchelsea, and Inverleigh before flowing through Geelong and joining the coast at Barwon Heads. The Leigh River, a major tributary, rises near Ballarat and joins the Barwon River at Inverleigh. Two other tributaries, Birregurra and Boundary Creeks, flow into the Barwon from the western part of the catchment. The environmental flow requirements of the Moorabool River, also a major tributary of the Barwon River, have been determined in previous studies and will not be revisited in this study. The Upper Leigh River is not considered in this study (apart from the downstream effects in the mid and lower Leigh River).
The project study area comprises of nine (9) reaches which are shown in Table 1 and Figure 2.
Table 1: Reach Names and Descriptions for the Barwon River Environmental Flow Study
Reach Name Description
Upper Barwon Barwon River from West Barwon Reservoir to Birregurra Creek Confluence
Winchelsea Barwon River from Birregurra Creek Confluence to Leigh River confluence
Murgheboluc Valley Barwon River from Leigh River confluence to Moorabool River Confluence
Geelong Barwon River from Moorabool River Confluence To Lower Breakwater
Estuary Lower Breakwater, Lake Connewarre and Reedy Lake, lower estuary to Barwon Mouth
Birregurra Ck Birregurra Creek
Boundary Ck Boundary Creek
Mid Leigh River Leigh River from Napoleons Rd to Quiney Hill
Lower Leigh River Leigh River from Quiney Hill to Barwon confluence

SECTION 1 Introduction
5
Figure 2: Map indicating delineated reaches of the Barwon River.

SECTION 1 Introduction
6
1.2 The Adopted Methodology
This project applies the FLOWS method to determine environmental flows in rivers and streams in Victoria (DNRE 2002). The steps involved in the application of the method are presented in Figure 2.
Figure 3. Flow chart illustrating the implementation of the FLOWS methodology. Note EFTP refers to Environmental Flows Technical Panel (DNRE 2002).

SECTION 1 Introduction
7
FLOWS assumes that the flow regime required to achieve the desired ecological condition in a river can be represented by a set of flow components. Flow components are defined in terms of the timing, duration and magnitude of flow events. Flow components are attributed to a representative set of ecological and physical characteristics and functions. For example, the flow component of "low flow in summer" might be attributed to the persistence of aquatic habitat in a stream bed.
A conceptual model of the desired condition of a stream is developed from existing policy and strategy statements and a review of important physical and ecological values (or 'assets' in FLOWS). This is further developed by a detailed field assessment. The conceptual model is formally articulated by relating the required status of the flow components to the intended condition of each environmental asset. This information is presented in the Issues Paper.
Steps completed so far include:
• an initiation meeting with the Steering Committee;
• a review of existing data and completion of a Site Paper, which provided initial advice on ecological characteristics and the selection of reaches and sites;
• a consultation meeting with the Advisory Committee; and
• a field assessment, in which the selection of reaches and sites was confirmed and detailed site descriptions were prepared.
When this Issues Paper has been finalised in consultation with the Steering Committee and the Advisory Committee, the remaining tasks will be to:
• develop hydraulic models to characterise the flow regime of study reaches in detail;
• analyse the relationship between flow and hydrology in detail in each reach;
• set quantitative objectives for river health;
• determine how flow management should be changed to achieve the river health objectives.
1.3 Issues Paper Scope
The scope of this Issues Paper is to outline:
• the reaches and sites used in the environmental flow assessment, including the rationale behind their selection;
• the water dependent environmental assets of the catchment and their condition, considering social, ecological, hydrological, geomorphic and water quality issues;
• the trajectory of the conditions above and an assessment of the practical likelihood of rehabilitation;
• current threats to the environmental assets specifically resulting from system operation, water extraction and harvesting and also other factors;
SECTION 1 Introduction
8
• recommendations for environmental flow objectives (which will be revised in later stages of the project) that are specific, measurable and clearly described in terms of the ecological or geomorphic functions of stream flows in the catchment; and
• other stressors in the catchment which, although not directly related to flow, impact on the health of water-dependent environmental assets.
The Issues Paper incorporates some of the material from the Site Paper that was produced earlier in the project (see flow chart in Figure 3). The purpose of the Site Paper is to summarise existing information relevant to the study and to propose how the study area will be divided into reaches and how representative sites will be selected in each reach. The Site Paper was reviewed by the Steering Committee. The Advisory Committee was consulted about the delineation of reaches at the initial consultation meeting.

SECTION 2 Policy Context
9
2 Policy Context
2.1 Strategic Basis for the Assessment and Provision of Environmental Water Requirements
The imperative of achieving an ecologically healthy Barwon River through flow management is recognised in the following major strategies and management plans.
Our Water Our Future: Securing Our Water Future Together
In 2004 the Victorian Government released a White Paper that sets out policy on the future use and management of water resources. Our Water Our Future recognises that water in the Barwon River is fully allocated.
The White Paper defines the share of water set aside for the environment as the Environment Water Reserve. The Environmental Water Reserve in the Barwon River will be set by capping diversions (Action 3.3).
Victorian River Health Strategy
The Victorian River Health Strategy (VRHS) provides the state -wide policy framework for managing the health of Victoria's rivers, floodplains and estuaries (DNRE 2002b). The objective of the strategy is:
"healthy rivers, streams and floodplains which meet environmental, economic, recreational and cultural needs of current and future generations"
The VRHS requires the determination of environmental water requirements sufficient to maintain rivers in an environmentally healthy condition and to protect high value assets. The VRHS also defines an ecologically healthy river as:
"A river which retains the major ecological features and functioning of a river prior to European settlement and which would be able to sustain these characteristics into the future".
The Victorian Catchment Management Council has set out these criteria to define a healthy river. An ecologically healthy river will have flow regimes, water quality and channel characteristics that:
• in the river and riparian zone, the majority of plant and animal species are native and no exotic species dominates the system;
• natural ecosystem processes are maintained;
• major natural habitat features are represented and are maintained over time;
• native riparian vegetation communities exist sustainably for the majority of its length;
• native fish and other fauna can move and migrate up and down the river;

SECTION 2 Policy Context
10
• linkages between river and floodplain and associated wetlands are able to maintain ecological processes;
• natural linkages with the sea or terminal lakes are maintained; and
• associated estuaries and terminal lake systems are productive ecosystems.

SECTION 3 Review of Existing Information
11
3 R e v i e w o f E x i s t i n g I n f o r m a t i o n
3.1 General Catchment Characteristics
The Barwon River catchment lies north and west of Geelong and covers an area of 2,713 km2 at Pollocksford and 3,986 km2 at Geelong, which includes the Moorabool River catchment. The catchment has three arms, the Otways to the west, the Brisbane Ranges (southern slopes of Great Dividing range) to the north and the Bellarine Peninsula in the lower reaches. The Barwon catchment thus includes two major river systems, the Barwon River which drains from the west, and the Leigh River which drains from the north. Birregurra Creek and Warrambine Creek are the other major tributaries (apart from the Moorabool River which joins at the Barwon River near the end of its course). Prior to entering the sea the Barwon River drains through a large estuarine zone comprising a lake and wetland complex, including Lake Connewarre, Reedy Lake and Hospital Swamp (OCE, 1988). The west of the catchment features several inland saline/brackish lakes including Lakes Murdeduke, Modewarre and Gherang.
The northern and southern areas of the catchment are mountainous to undulating sedimentary country (also basalt, granites and gneisses in the far north), while the central area forms part of the western basalt plain. Natural forests and woodlands remain in parts of the Otways and Brisbane ranges headwater areas, forming 13% of the catchment area (excluding the Moorabool catchment). Grassland used for grazing and cleared land used for grain cropping occupies 81% of the area (excluding the Moorabool catchment). The other major categories of land use are intensive agriculture (2%), plantation (1%) and urban areas (2%) (DWR, 1989a, p. 111). Potatoes are grown in the upper basin, near Colac, and there is some market gardening in the vicinity of Geelong (Drew and Atkin-Smith, 1987). Prior to European settlement the area of forest and woodland would have been more extensive, but the central part of the catchment would have been grassland (DWR, 1989a, p. 6).
The climate of the Barwon River catchment is temperate. Average annual rainfall varies from about 1,400 mm per year in the Otways to 700 mm in the headwaters of the Leigh River, and drops to 500 – 600 mm per year in the central part of the basin (DWR, 1989a). Mean annual rainfall in Geelong is 540 mm per year (DWR, 1989b, p. 253).
Flows in the rivers of the catchment are strongly seasonal and the Barwon and Leigh rivers typically have long periods of very low flow in the summer and autumn (DWR, 1989b). Maximum flows usually occur in August or September, and the minimum in the January to April period. As a general rule, the low flow period can be defined as the 5-month period extending from December to April. The high flow period can be defined by the 7-month period from May, when flows generally begin to rise, to November, by which time they have generally declined. December can be a transition month when the last of the winter period baseflows recede to a lower summer baseflow. At the gauge at Pollocksford, 60% of the annual flow occurs in the 3-month period July to September, while the 3-month period January to March carries only 5% of the annual flow (DWR, 1989b, p. 253).
3.2 Catchment Development
Prior to European settlement the Barwon catchment comprised land owned by the Wathaurung tribe (Tindale, 1974). John Batman and his party arrived in the Port Phillip region in 1835 and within two years

SECTION 3 Review of Existing Information
12
runs were taken as far as Winchelsea. The port of Geelong developed from the earliest days of Victorian settlement. The gold rush of the 1850s attracted a large number of people to the Ballarat region.
3.3 Catchment Geology and Geomorphology
During the Tertiary a shallow sea inundated the majority of the areas that are now drained by the Barwon River and the Lower Leigh Rivers. The Barwon River catchment lies in the South Victorian Coastal Plains landform unit (Jenkin, 1988a), draining the northern slopes of the Otway ranges. The catchment of the West Barwon Dam and the headwaters of the southern tributaries of the Barwon River are steep and forested, with highly varied Cainozoic sedimentary geology (Hills, 1955; Jenkin, 1988a). The catchment of Boundary Creek is mostly forested although not steep, with the underlying material being coarsely- and finely-textured unconsolidated deposits (DWR, 1989a). The majority of the Upper Barwon River catchment drains a sedimentary plain (DWR, 1989a). The boundary of the South Victorian Coastal Plain lies about 10 km upstream of Winchelsea (DWR, 1989a).
The mid-Barwon River flows through the West Victorian Volcanic Plain landform unit (Hills, 1955; Jenkin, 1988a). Here the river flows through flat to undulating plain topography with a number of lakes present. The geology is Plio. to Recent basic lava and pyroclastics, known as the Newer Volcanics (lava flows in this area are around 4.5 – 7 million years old) (Joyce, 1988). The volcanics veneer or are inter-bedded with Tertiary marine and freshwater sediments (Hills, 1955; Jenkin, 1988a). The lava flows on the Plain are thin, from 2 m to 10 m (Joyce, 1988). Blockage of the Leigh and Barwon Rivers by lavas resulted in the formation of a great lake, 1,800 km2 in area, extending from Winchelsea and Inverleigh in the east to beyond Camperdown in the west, and Colac in the south to Cressy in the north (Hills, 1975, p. 317). The current Lake Corangamite was a small part of this lake system. Overflow was through a gap near Inverleigh, and as this was eroded down the lake level fell, leaving many of the lakes and swamps that remain today as relics (Hills, 1975, p. 314). The old shoreline of this system is marked by a terrace 3 m above the level of the relic lakes that now remain (Hills, 1975). The current Mid-Barwon River flows along the former southern shore of this former lake.
Most of the Barwon River catchment (the upper Barwon) drains sedimentary material, but Birregurra Creek partially drains volcanic material (DWR, 1989a). The lavas have weathered to a wide range of soil sand weathering profiles, but clay is common in the soil profiles (Joyce, 1988). At the lower end of the Murgheboluc reach, downstream of the Leigh River confluence, on the southern side of the Barwon River is a hilly area of sedimentary rocks known as Barrabool Hills (Jenkin, 1988a).
The lower Barwon remains within the West Victorian Volcanic Plain landform unit. Geologically the lower Barwon River is located in the Port Phillip Sunkland, which is a broad low-lying area between two major lineaments, the Rowsley and Selwyn Faults (Jenkin, 1988b). The major topographic units within it are due to tectonics, which consequently affected Quaternary sedimentation. The Bellarine Peninsula is a horst-like block consisting mainly of Tertiary sediments and volcanics, with a core of Mesozoic rocks (Jenkin, 1988b). The western end of the Peninsula was once a seaway, which has been partly closed by Plio-Pleistocene basaltic flows. Further closure is due to Pleistocene dunes and Recent sandy barriers. The lower Barwon River was ponded by the edges of a lava flow, forming swampy deposits. Thus the area between the Newer Volcanics in the west and the uplifted block on the east is extensive tracts of salt

SECTION 3 Review of Existing Information
13
marsh and reed swamp silt, underlain by clay, black mud, minor sand and shell beds (Jenkin, 1988b). The river runs through a high level Pleistocene alluvial terrace through south-eastern parts of Geelong (Jenkin, 1988b). The part of the catchment from Barwon Heads to Queenscliff is a Quaternary coastal dune complex.
The Upper-Leigh River drains gentle to moderately sloping dissected tablelands. The underlying geology is mostly sedimentary rocks, with granites and gneisses forming low hills. This area falls within the dissected uplands geomorphic unit of the Central Victorian Uplands region (DWR, 1989a). A small section at the top of the catchment near Ballarat, and also where the first order headwater streams are located, drains volcanic rocks (DWR, 1989a). The Mid-Leigh River reach lies within the West Victorian Volcanic Plain landform unit. Here the river flows through undulating plain topography, with finely-textured unconsolidated deposits. The Mid-Leigh River, from Grenville to Willangi is a gorge. Just north of Shelford the valley widens to around 1.0 - 1.5 km in width (Earth Tech, 2004), forming the lower-Leigh River reach. The Lower-Leigh River reach lies within the West Victorian Volcanic Plain landform unit. Here the river flows through undulating plain topography, with finely-textured unconsolidated deposits (DWR, 1989a).
3.4 Groundwater
The upper tributaries of the Barwon River are significantly spring-fed. The shallow aquifer system varies from fractured rock aquifers of Newer Volcanics basalt in the north-east and north-west of the catchment (Leigh River) and Mezozoic mudstone and sandstone of the Otway Ranges, to unconsolidated Quaternary dune sands along the coast, and gently dipping Tertiary units that lie to both the east and west of the Otway Ranges. These units are largely undeveloped, except for the major borefield at Barwon Downs (Gerangamete), which augments Geelong’s water supply (DWR, 1989b, p. 253).
The quality of the groundwater varies across the catchment, from fresh (<300 µS/cm) in the northern and southern extremities to saline (>3,000 µS/cm) in the Bellarine Peninsula and central areas. There are also large areas of brackish (900 – 3,000 µS/cm) groundwater quality (DWR, 1989b, p. 253).
The divertible groundwater resource of the Barwon Basin is estimated to be 46 GL/yr, and the minor sources about 2.6 GL/yr. A total of 8 GL/y of the groundwater resource is committed (DWR, 1989b, p. 239).
3.5 Water Resources System Operation
Diversions
The mean annual natural yield of the Barwon catchment (excluding the Moorabool) is 270 GL, of which 85 GL is considered divertible surface water resource. Of this, 25 GL has been developed (DWR, 1989b).
The proclaimed water supply catchment of the Upper Barwon River covers a total area of 148 km2. The West Barwon Reservoir, which affects a catchment of 51 km2, and with a useable capacity of 20.9 GL,

SECTION 3 Review of Existing Information
14
was constructed in 1964. Flows from the West Branch are captured and diverted a few hundred metres downstream of the dam into a tunnel that leads to the Barwon River East Branch. East Barwon diversion weir received water from the Barwon River East Branch, and also from the West Barwon diversion tunnel. Water is diverted by this weir into the Wurdee Boluc inlet channel, which at this point has a capacity of 205 ML/d (DCNR, 1995).
There are several small tributaries (Gosling, Matthews, Callahan, Dewing and Pennyroyal Creeks) flowing from the south into the Barwon River upstream of Birregurra from which water has been or is harvested via diversion weirs. The last diversion from Gosling Creek occurred in 23 years ago, and from Dewing Creek it was 20 years ago (Raadick, 2000). The Barwon System Bulk Entitlement includes provision for a diversion from Dewing Creek, but hydraulic constraints currently prevent this (Barwon Water, 2003). The right to harvest from Gosling Creek was forgone in order to increase environmental flows in the Barwon River (Barwon Water, 2003). Callahan Creek, Matthews Creek, and Pennyroyal Creek diversion weirs divert water to channels with a capacity of 100 ML/d (DCNR, 1995). The diverted water is sent via the Wurdee Boluc inlet channel (an aqueduct of 250 ML/d capacity) to Wurdee Boluc Reservoir near Winchelsea (DCNR, 1995). Wurdee Boluc is an off stream storage with a capacity of 38 GL (DCNR, 1995). There is a large private Dam on the upper Boundary Creek of about 200ML.
Historically, flows in Boundary Creek have been reduced by groundwater pumping from Barwon Downs (SKM, 2005). Water from Barwon Downs is piped 2.3 km to the Wurdee Boluc inlet channel (DCNR, 1995).
Central Highlands Water operates four reservoirs in the northernmost part of the catchment to supply Ballarat and other small urban demands (SKM, 2005). These reservoirs are filled in the main by water from the Moorabool catchment, piped from Lal Lal reservoir and carried via aqueduct from a number of diversions in the Moorabool catchment. The authority has a bulk water entitlement to divert 10.5 GL/yr from the Upper Moorabool catchment into the Leigh River basin. The spills from these reservoirs enter the Leigh River (SKM, 2005). There are six diversions/storages in the upper Leigh River catchment: Pinacotts Reservoir (218 ML capacity), Giles Creek Weir, Kirks Reservoir (400 ML capacity), Gong Gong Reservoir (1900 ML capacity), Clarks Creek Weir, and White Swan Reservoir (14,100 ML capacity). The characteristics and operation of these structures are described by DCNR (1995).
Discharges
The Ballarat South Waste Water Treatment Plant (WWTP) discharges to the Leigh River (SKM, 2005). It discharges about 7,000 ML of treated effluent per year, which in summer contributes 15 – 20 ML/d to the river (DCNR, 1995).
Flows in Birregurra Creek have been increased through transfers of saline water from the Corangamite basin via Lough Calvert Outlet during times of flood (SKM, 2005). The objective of this transfer is to reduce flooding around the margins of lakes in the Colac district (DCNR, 1995). The discharges can only be made between May 1 and September 30, on the condition that salinity of the Barwon River at Winchelsea does not exceed 1,667 µS/cm (DCNR, 1995).

SECTION 3 Review of Existing Information
15
Warrambine Creek enters the Barwon River upstream the Leigh River junction. Historically, flows in Warrambine Creek have been increased by transfer of flows from the Lake Corangamite/Woady Yaloak River diversion scheme (SKM, 2005).
The Woady Yaloak diversion scheme is operated under the conditions that salinity of the Barwon River at Geelong is maintained below specified salinities which range from 1,200 µS/cm in November to April to 3,100 µS/cm from July to August (DCNR, 1995).
Ballarat Goldfield has a licence to discharge up to 8 ML/d into the upper Leigh River near the Ballarat South WWTP, but because they are required to maintain in-stream salinity at a specified level their low flow discharges are usually restricted to 1.5 – 2.5 ML/d (DCNR, 1995).
Existing Environmental Flow Rules
Prior to the Bulk Entitlement Conversion Process natural flows were required to be passed in the Barwon River when flows fell to 14.7 ML/d at Winchelsea or 7.35 ML/d at the confluence of the East and West branches of the Barwon River. These rules were intended to protect the interests of downstream users (DWR, 1988, as cited in DCNR, 1995 and NRE, 2001). NRE (2001) referred to the pre-Bulk Entitlement summer passing flow being “the notional 10 ML/d at Conns Lane”. This site, on the Barwon River upstream of Birregurra Creek, is located between the confluence of the East and West branches of the Barwon River and Winchelsea.
The Bulk Entitlement Process (completed in 2002) was based on recommendations made in NRE (2001). The process was informed by expert advice from Freshwater Ecology section of Arthur Rylah Institute for Environmental Research. The process involved modelling of options to cater for both improved environmental protection taking into consideration the constraints of reliability of urban supply (NRE, 2001). The passing flows for the upper tributaries are based on triggers as follows:
(a) When the West Barwon storage is over 40 GL the environment receives enhanced passing flows in the months April to December (estimated to apply 60% of the time).
(b) When the West Barwon storage is under 40 GL the environment receives existing ‘base’ passing flows in the months April to December (estimated to apply 40% of the time). Once the system capacity exceeds the trigger, the stream receives natural higher flows or enhanced passing flows.
(c) During the months of January, February and March, regardless of storage level, a ‘natural passing flow’ (natural flow with no diversion) is provided in all streams except West Barwon.
For the West Barwon Branch, when the storage is <40 GL the passing flow is 4 ML/d, and when the storage is >40 GL, for all months except September, the passing flow is 5 ML/d, and 15 ML/d for September. This higher flow in September is intended to assist native fish breeding and movement, and will assist in providing improved conditions prior to summer (NRE, 2001).
NRE (2001) expected that the previous notional passing flow of 10 ML/d at Conns Lane would increase to around 21 ML/d or higher under the Bulk Entitlement passing flow rules.

SECTION 4 Hydrology
16
4 H y d r o l o g y
4.1 Preamble
Dissection of daily flow time series’
The main objectives of the Issues Paper are to identify the flow dependent physical and ecological assets that are to be protected and promoted by the environmenta l flow regime, to assess the relative condition of those assets, to assess hydrological alteration (from natural) as a stressor, and to broadly identify the flow components necessary to meet ecological and geomorphological objectives. This section of the Issues Paper characterises the hydrology of the Barwon River, with an emphasis on quantifying the degree of alteration from natural. The next phase of the FLOWS process involves detailed analysis of the relationships between flow and ecological and geomorphic processes, from which follows recommendation of an environmental flow regime made up of various flow components. This process, much of which is completed in a workshop setting, ideally requires availability of hydrological “look-up” tables or graphs that enable the Panel to specify the flow components in terms of magnitude, duration, frequency, timing, and rate of change and to assess the degree to which the flow components are provided by the current flow regime. Availability of tailored hydrological statistics reduces subjectivity in the environmental flow assessment process. With this future requirement in mind, the approach to hydrological analysis adopted in this Issues Paper was to dissect the hydrographic record into FLOWS flow components, to describe these components in terms of statistics that quantify magnitude, duration, frequency, timing and rate of change, and to assess the degree of alteration of these statistics from the natural hydrological condition.
4.2 Data availability
Numerous flow gauging stations are located on streams within the Barwon River Basin although some of them have been discontinued, and some have patchy records. Using gauged flow data to compare the current (regulated) flow regime with the pre-regulation (natural) flow regime can be complicated by the lack of consistent data sets for the periods of interest, and confounded by changing hydrological conditions through time that are independent of regulation (i.e. naturally occurring extended dry and wet periods). For these reasons it is preferable to use modelled flow data, derived for a consistent and representative period of time.
To support this environmental flows assessment project, modelling of daily streamflow series’ at various locations throughout the catchment was recently undertaken by Sinclair Knight Merz (SKM, 2005). The modelling provided daily historic, current and unimpacted streamflows, as defined by SKM (2005), at nine selected locations throughout the catchment from 1st January 1955 to 30th June 2004. This period of analysis corresponds to the period of modelled streamflow data available from previous projects. The first six months of data were not included in the analysis, giving an even 49 years of data.
Unimpacted streamflows are the streamflows that would have occurred over the historical climate sequence without private diversions, irrigation district diversions, urban diversions, the effects of farm dams and the effects of major reservoirs. Unimpacted flows are also referred to here by the term “natural”,

SECTION 4 Hydrology
17
which is a more conventional term. They are modelled natural flows, not actual natural flows. No attempt was made to correct streamflows for change in vegetation cover and urbanisation (SKM, 2005). Current conditions are for the year 2002 level of development demands and for current bulk entitlement rules. The modelling was conducted for nine locations, with each location representing an environmental flow reach (Table 1).
The existing Upper Barwon weekly REALM model (first developed in 1995) was updated to include representation of separate private diverter demands for the sub-catchments, farm dam impacts, and the impact of groundwater pumping from Boundary Creek. The existing Lower Barwon weekly REALM model (first developed in 2003) was updated to include representation of farm dam impacts, waste water treatment plant discharges to the Leigh River, Lough Calvert discharges to Birregurra Creek, and the impact of Ballarat Headworks. The model was then recalibrated by adjusting the loss/gain functions.
The data from the weekly REALM models were disaggregated into a daily time-step by calculating the inflows to each reach, disaggregating them, and then adding them to the natural time series calculated at the reach immediately upstream. The daily patterns used as the basis for disaggregation of the natural time series’ varied for each site, two using unimpacted gauged data and others using HYDROLOG simulated data. For the current time series’, the historical gauged data were used as the pattern for disaggregation of weekly data to daily data.

SECTION 4 Hydrology
18
Table 1. Environmental flow reaches and relevant REALM modelling site location.
Reach No.
Environmental flow Reach name
Environmental flow Reach extent
Relevant REALM model site number, name and gauge station name and ID number
1 Upper Barwon Barwon River from West Barwon Reservoir to upstream of Birregurra Ck junction
• 1A: Barwon River at downstream of West Barwon Dam
• 1B: Barwon River upstream of Birregurra Ck (Ricketts Marsh:233224)
2 Winchelsea Barwon River from downstream of Birregurra Ck junction to Leigh River confluence
2: Barwon River Winchelsea (Inverleigh:233218)
3 Murgheboluc Valley Barwon River from Leigh River confluence to Buckley’s Falls
3: Barwon River Murgheboluc (Pollocksford:233200)
4 Geelong Barwon River from Buckley’s Falls To Lower Breakwater
4: Barwon River Geelong (Geelong:233217)
5 Estuary Lower Breakwater, Lake Connewarre and Reedy Lake, lower estuary to Barwon Mouth
Not modelled
6 Birregurra Ck Birregurra Creek 6: Birregurra Creek (Ricketts Marsh:233211)
7 Boundary Ck Boundary Creek 7: Boundary Creek (Yeodene:233228)
8 Mid-Leigh River Leigh River Cambrian Hill to Quiney Hill
8: Mid-Leigh River (Mount Mercer:233215)
9 Lower Leigh River Leigh River from Quiney Hill to Barwon River confluence
9: Lower-Leigh River (Inverleigh:233209)
4.3 Methodogy
Dissection of daily flow time series’
Most of the standard statistical analysis tools used by hydrologists were developed in response to the traditional engineering problems of drought management, flood mitigation, or development of water supply systems. In contrast, environmental flow assessment uses established or hypothesised relationships between hydrological characteristics of a stream and ecological response, so that the regulated flow regime can be tailored to provide a basic level of ecosystem protection. Gippel (2001) suggested an approach to hydrological analysis appropriate to the problem of assessing environmental flows, especially when using one of the expert panel or holistic -type approaches, such as FLOWS. The approach is grounded in the assumption that the hydrological time series (or regime) contains identifiable, recurring

SECTION 4 Hydrology
19
ecologically and/or geomorphologically relevant facets or events. These facets are then dissected from the record and their hydrological characteristics determined separately. Given the hypothesised importance of hydrological variability, there is an emphasis on characterising the extremes of the distributions.
The FLOWS method requires recommendations to be made for a number of different flow components (Table 2). Each component has a known or assumed important environmental function, although the method is generic for Victoria, so not all components will necessarily be important or critical in all reaches of the Barwon River.
Table 2. Hydrological description of the FLOWS flow components
FLOWS flow component
Hydrological description Relevant season
Cease-to-Flow (also called “zero flows”)
Cease-to-flow is defined as periods where no flows are recorded in the channel.
Not present in some streams, nearly always occurs in Summer, but can occur in Winter
Low Flows Low flows are the natural summer/autumn baseflows that maintain water flowing through the channel, keeping in-stream habitats wet and pools full.
Summer
Low Flow Freshes Low flow freshes are frequent, small, and short duration flow events that last for one to several days as a result of localised rainfall during the low flow period.
Summer
High Baseflows High baseflows refer to the persistent increase in baseflow that occurs with the onset of the wet season.
Winter
High Flow Freshes High flow freshes refer to sustained increases in flow during the high flow period as a result of sustained or heavy rainfall events.
Winter
Bankfull Flows Bankfull flows fill the channel, but do not spill onto the floodplain.
More common in Winter, but occurs in Summer
Overbank Flows Overbank flows are higher and less frequent than bankfull flows, and spill out of the channel onto the floodplain.
More common in Winter, but occurs in Summer
Definition of high flow and low flow seasons
Five of the seven flows components are associated with distinct seasons, while the ecological and geomorphological effectiveness of the bankfull and overbank flow components is not strongly dependent on the time of year that they occur (Table 2).
SECTION 4 Hydrology
20
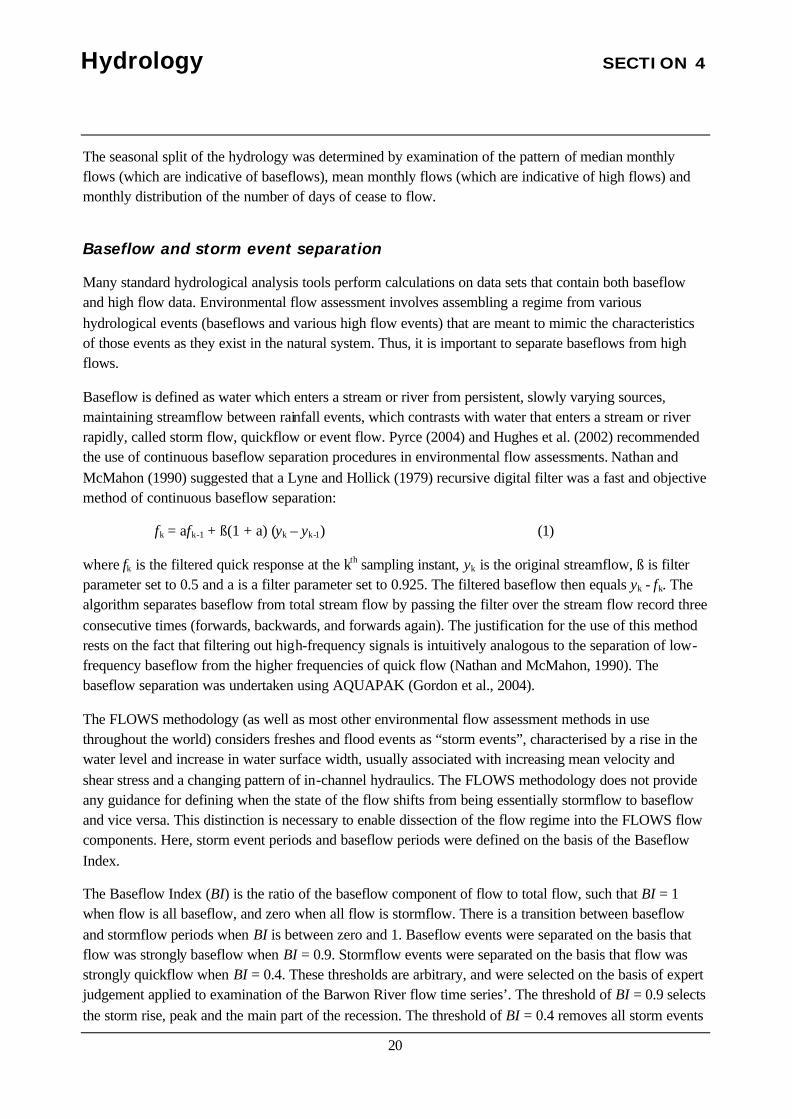
The seasonal split of the hydrology was determined by examination of the pattern of median monthly flows (which are indicative of baseflows), mean monthly flows (which are indicative of high flows) and monthly distribution of the number of days of cease to flow.
Baseflow and storm event separation
Many standard hydrological analysis tools perform calculations on data sets that contain both baseflow and high flow data. Environmental flow assessment involves assembling a regime from various hydrological events (baseflows and various high flow events) that are meant to mimic the characteristics of those events as they exist in the natural system. Thus, it is important to separate baseflows from high flows.
Baseflow is defined as water which enters a stream or river from persistent, slowly varying sources, maintaining streamflow between rainfall events, which contrasts with water that enters a stream or river rapidly, called storm flow, quickflow or event flow. Pyrce (2004) and Hughes et al. (2002) recommended the use of continuous baseflow separation procedures in environmental flow assessments. Nathan and McMahon (1990) suggested that a Lyne and Hollick (1979) recursive digital filter was a fast and objective method of continuous baseflow separation:
fk = afk-1 + ß(1 + a) (yk – yk-1) (1)
where fk is the filtered quick response at the kth sampling instant, yk is the original streamflow, ß is filter parameter set to 0.5 and a is a filter parameter set to 0.925. The filtered baseflow then equals yk - fk. The algorithm separates baseflow from total stream flow by passing the filter over the stream flow record three consecutive times (forwards, backwards, and forwards again). The justification for the use of this method rests on the fact that filtering out high-frequency signals is intuitively analogous to the separation of low-frequency baseflow from the higher frequencies of quick flow (Nathan and McMahon, 1990). The baseflow separation was undertaken using AQUAPAK (Gordon et al., 2004).
The FLOWS methodology (as well as most other environmental flow assessment methods in use throughout the world) considers freshes and flood events as “storm events”, characterised by a rise in the water level and increase in water surface width, usually associated with increasing mean velocity and shear stress and a changing pattern of in-channel hydraulics. The FLOWS methodology does not provide any guidance for defining when the state of the flow shifts from being essentially stormflow to baseflow and vice versa. This distinction is necessary to enable dissection of the flow regime into the FLOWS flow components. Here, storm event periods and baseflow periods were defined on the basis of the Baseflow Index.
The Baseflow Index (BI) is the ratio of the baseflow component of flow to total flow, such that BI = 1 when flow is all baseflow, and zero when all flow is stormflow. There is a transition between baseflow and stormflow periods when BI is between zero and 1. Baseflow events were separated on the basis that flow was strongly baseflow when BI = 0.9. Stormflow events were separated on the basis that flow was strongly quickflow when BI = 0.4. These thresholds are arbitrary, and were selected on the basis of expert judgement applied to examination of the Barwon River flow time series’. The threshold of BI = 0.9 selects the storm rise, peak and the main part of the recession. The threshold of BI = 0.4 removes all storm events

SECTION 4 Hydrology
21
and the majority of storm event recession periods. In between these BI thresholds lies a range of transitional flows, plus cease to flow, when BI has no meaning. Periods when 0.9 < BI > 0.4 represent the tails of flood recessions. The tails of flood recessions, after the quickflow has essentially ended but before baseflow dominates, are not explicitly defined as an important hydrological facet in the FLOWS methodology. This is not to say that the tails of flood recessions do not perform important ecological functions (although they would have only a minor role in facilitating the important geomorphic processes), but this is not explicitly considered here.
One reason for only considering flows that are strongly stormflow, strongly baseflow or cease to flow is that transitional flows are more difficult to implement as environmental flows. While cease to flow can be implemented by not releasing water, baseflows can be released from storages, and freshes and flood events can be released entirely from storages or releases made to supplement naturally occurring events, flows that are mixtures of baseflow and stormflow are difficult to manage. Also, managers would not be aware of the mix of stormflow and baseflow at any particular time. For management purposes, it is reasonable to consider the tails of flood recessions as low flows in summer and baseflows in winter as hydraulically (in terms of flow depth, width, velocity and shear stress) they more closely resemble baseflows than freshes and flood events (the essential character of which is a marked increase in flow depth, water surface width, velocity and shear stress).
Flow event statistics
The primary hydrological characteristics of interest when considering flow dependent ecological and geomorphological processes are:
• Magnitude,
• Frequency,
• Duration,
• Timing, and
• Rate of change
These are the primary flow characteristic s because they translate directly to specifications for an environmental flow regime, and they allow estimation of the volume of water required for allocation to the environment.
Cease to flow duration was analysed using spells analysis (AQUAPAK), for spell duration below a threshold of 0.01 ML/d. Spells were assumed independent if separated by more than 7 days.
Baseflows were analysed for baseflow events separated from the flow records on the basis of the digital baseflow filter. Baseflow magnitude and duration statistics were calculated using purpose written spreadsheet algorithms.

SECTION 4 Hydrology
22
Peak over threshold partial flood series analysis was undertaken assuming events were independent if separated by more than 7 days. Partial series flood frequency analysis used the Cunnane plotting position formula (Nathan et al., 2004, p. 207).
Storm events were analysed for storm events separated from the flow records on the basis of the digital baseflow filter. The duration and peak magnitude of every identified event were calculated using purpose written spreadsheet algorithms. The calculation assumed that events were independent if separated by more than 7 days. If events were separated by less than seven days, the intervening period of non-stormflow (i.e. when flow was temporarily baseflow dominated) was not counted in the duration of the event.
Rates of rise and fall need to be specified for any storm events (freshes and floods) recommended in an environmental flow regime. The rates of rise of individual stormflow events are largely determined by the initial event rainfall intensity. The rates of fall (recession) depend on the pattern of ongoing rainfall and the physical characteristics of the catchment and stream. For streams in the Barwon River catchment the natural rate of rise is typically rapid, with the major peak in the stream level normally reached within 1 – 2 days of the onset of the rainfall event. Recession rates are typically lower, with the initially high rate of decline decaying slowly for an extended period after rainfall ceases.
Ecologically, the limiting aspect of rate of discharge change is the peak rate of change. On the rising limb of an event, some biota need to seek out sites of refuge, and on the falling limb some biota need to avoid being stranded. The analysis of rate of rise and fall was undertaken on the storm events dissected from the record using the baseflow filter in two steps. The first step was to examine the departure of current rates of rise and fall from natural rates. This was done by comparing the distributions of all values of rises and falls for current and natural conditions. The second step was to characterise the natural maximum rates of rise and fall for the natural condition, as this information is required in order to specify the characteristics of freshes and floods when recommending environmental flow components (in a later stage of the FLOWS procedure). The maximum rates of rise and fall were calculated for each event (winter and summer events were treated separately) and plotted as a function of event peak discharge.
4.4 Annual discharge
Annual discharge in the Barwon River increases in a predictable way with catchment area (Figure 1). It is reasonable to assume that flow recommendations made for a modelled point on the river can be scaled as a function of catchment area to apply to non-modelled points. The tributaries are relatively drier, with less annual discharge for the same catchment area. The impact of regulation varies throughout the catchment, with the largest relative impact occurring immediately downstream of West Barwon Dam (Figure 2). Elsewhere the reduction is <10%, except at Barwon River Geelong (which is also impacted by regulation of the Moorabool River), Boundary Creek, and Birregurra Creek, which has experienced an increase in annual discharge due to transfers of water from the Corangamite basin via Lough Calvert Outlet during times of flood.

SECTION 4 Hydrology
23
1
10
100
1,000
10 100 1,000 10,000
Catchment area (km2)
Mea
n an
nual
dis
char
ge (G
L/yr
)
Unimpacted
Current
Reach 1 A- d/s W. Barwon Dam
Reach 7 - Boundary Ck.
Reach 6 - Birregurra Ck.
Reach 1B - at Ricketts Marsh
Reach 8 - Mid-Leigh
Reach 9 - Lower Leigh
Reach 2 - at Inverleigh
Reach 3 - at Pollocksford
Reach 4 - at Geelong
Figure 1. Mean annual discharge for the Barwon River and tributaries as a function of catchment area, showing the impact of regulation.

SECTION 4 Hydrology
24
0
50
100
150
200
250
300
350
400
450
500
1A: B
arw
on R
iver
at
dow
nstr
eam
of W
est
Bar
won
Dam
1B: B
arw
on R
iver
upst
ream
of B
irreg
urra
Ck
(Ric
ketts
Mar
sh:2
3322
4)
2: B
arw
on R
iver
Win
chel
sea
(Inv
erle
igh:
2332
18)
3: B
arw
on R
iver
Mur
gheb
oluc
(Pol
lock
sfor
d:23
3200
)
4: B
arw
on R
iver
Gee
long
(Gee
long
:233
217)
6: B
irreg
urra
Cre
ek(R
icke
tts M
arsh
:233
211)
7: B
ound
ary
Cre
ek(Y
eode
ne:2
3322
8)
8: M
id-L
eigh
Riv
er (M
ount
Mer
cer:
2332
15)
9: L
ower
-Lei
gh R
iver
(Inve
rleig
h:23
3209
)
Mea
n an
nual
dis
char
ge (
GL)
natural
current
-61%
-3%
-13%
-21%
-6%
-0.4%
-9%
+403%
-9%
Figure 2. Mean annual discharge for the Barwon River and tributaries, showing the impact of regulation.
4.5 Flow duration curves for entire year
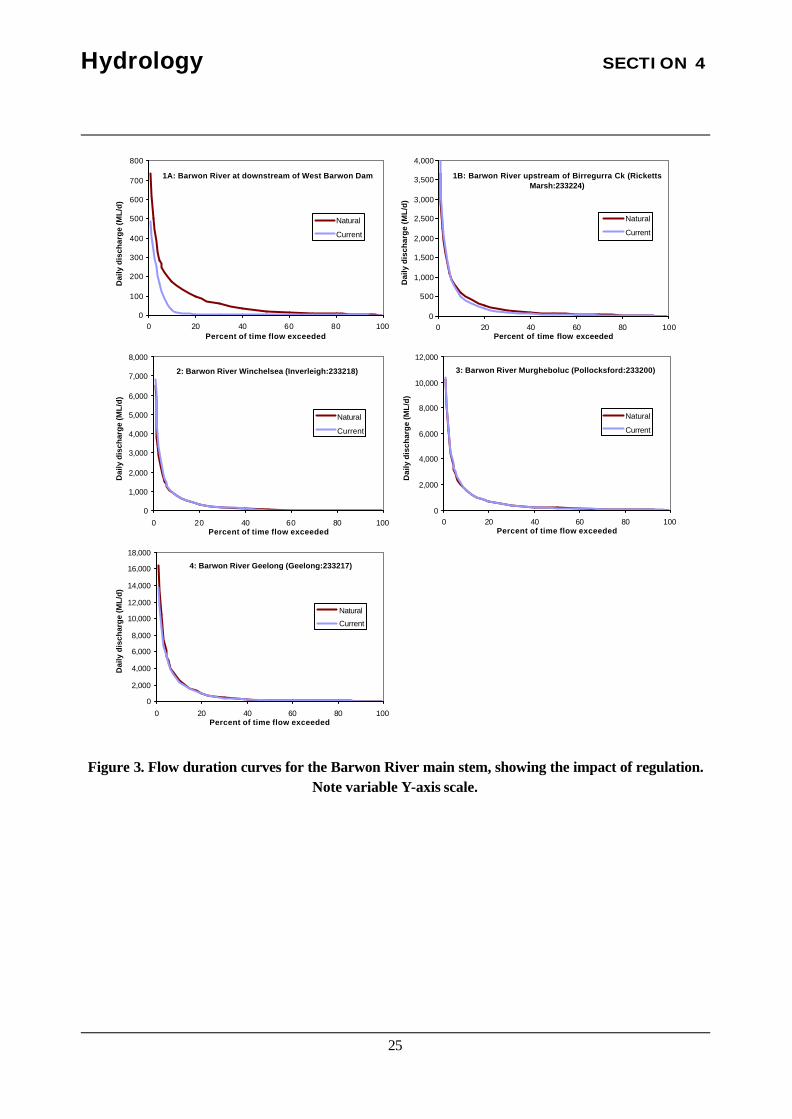
Flow duration curves summarise the entire flow distribution and can indicate the range of flow that are impacted by regulation, but they do not reveal detail of the extremes of low flows and high flows, and they do not indicate seasonal impacts. Regulation has clearly reduced the entire range of flows immediately downstream of West Barwon Dam and Boundary Creek, while regulation has increased flows across the range at Birregurra Creek. The impacts are more subdued at the other sites (Figure 7, Figure 8).
SECTION 4 Hydrology
25
1A: Barwon River at downstream of West Barwon Dam
0
100
200
300
400
500
600
700
800
0 20 40 60 80 100Percent of time flow exceeded
Dai
ly d
isch
arg
e (M
L/d
)
Natural
Current
1B: Barwon River upstream of Birregurra Ck (Ricketts Marsh:233224)
0
500
1,000
1,500
2,000
2,500
3,000
3,500
4,000
0 20 40 60 80 100Percent of time flow exceeded
Dai
ly d
isch
arg
e (M
L/d
)
Natural
Current
2: Barwon River Winchelsea (Inverleigh:233218)
0
1,000
2,000
3,000
4,000
5,000
6,000
7,000
8,000
0 20 40 60 80 100Percent of time flow exceeded
Dai
ly d
isch
arg
e (M
L/d
)
Natural
Current
3: Barwon River Murgheboluc (Pollocksford:233200)
0
2,000
4,000
6,000
8,000
10,000
12,000
0 20 40 60 80 100Percent of time flow exceeded
Dai
ly d
isch
arg
e (M
L/d
)Natural
Current
4: Barwon River Geelong (Geelong:233217)
0
2,000
4,000
6,000
8,000
10,000
12,000
14,000
16,000
18,000
0 20 40 60 80 100Percent of time flow exceeded
Dai
ly d
isch
arg
e (M
L/d
)
Natural
Current
Figure 3. Flow duration curves for the Barwon River main stem, showing the impact of regulation. Note variable Y-axis scale.

SECTION 4 Hydrology
26
7: Boundary Creek (Yeodene:233228)
0
20
40
60
80
100
120
0 20 40 60 80 100Percent of time flow exceeded
Dai
ly d
isch
arg
e (M
L/d
)
Natural
Current
8: Mid-Leigh River (Mount Mercer:233215)
0
500
1,000
1,500
2,000
2,500
3,000
0 20 40 60 80 100Percent of time flow exceeded
Dai
ly d
isch
arg
e (M
L/d
)
Natural
Current
6: Birregurra Creek (Ricketts Marsh:233211)
0
50
100
150
200
250
300
350
400
0 20 40 60 80 100Percent of time flow exceeded
Dai
ly d
isch
arg
e (M
L/d
) Natural
Current
9: Lower-Leigh River (Inverleigh:233209)
0
500
1,000
1,500
2,000
2,500
3,000
0 20 40 60 80 100Percent of time flow exceeded
Dai
ly d
isch
arg
e (M
L/d
)Natural
Current
Figure 4. Flow duration curves for the Barwon River tributaries, showing the impact of regulation. Note variable Y-axis scale.
4.6 Distribution of flow types
On the basis of the Baseflow Index, flows were split into cease to flow, baseflows (BI = 0.9), storm event flows (BI = 0.4) and transitional flows (0.4 > BI < 0.9). The flows classed as transitional flows occurred for a reasonably large percentage of the time (Figure 5, Figure 6). Although these are mostly flood recession flows, the recession rates are low for these transitional flows and in terms of ecological and geomorphic functions they would be equivalent to baseflows. In the case of Birregurra Creek, cease to flow was more common than baseflows and transitional flows combined. Regulation generally decreased the proportion of days with storm event flows, and increased the proportion of days with baseflows (Figure 5, Figure 6).

SECTION 4 Hydrology
27
Natural conditions
0%
10%
20%
30%
40%
50%
60%
70%
80%
90%
100%
Per
cen
tag
e o
f to
tal t
ime
cease to flow baseflow transition storm event
Figure 5. Distribution of main flow types the Barwon River main stem and tributaries under Natural conditions.

SECTION 4 Hydrology
28
Current conditions
0%
10%
20%
30%
40%
50%
60%
70%
80%
90%
100%
Per
cen
tag
e o
f to
tal t
ime
cease to flow baseflow transition storm event
Figure 6. Distribution of main flow types the Barwon River main stem and tributaries under Current conditions.
4.7 Flow seasonality
Seasonality is a distinct feature of all aspects of flow in the Barwon River catchment. Median flows are higher in the months of June to November than in the months of December to May, and this is true for the main stem and tributaries, and for natural and current flow conditions (Figure 7, Figure 8). The only exception is for current flows downstream of West Barwon Dam, when the median flows are 5 ML/d for all months except February and March when the median is 4.4 ML/d. The median flow conditions at this site reflect the passing flow releases.
The monthly distributions of mean flows (which reflect stormflows) display the same pattern as for median flows and are not plotted here.
The pattern of monthly distribution of the mean number of cease to flow days is the inverse of the distribution of median and mean flows (Figure 9, Figure 10). Under natural conditions cease to flow did not occur outside the period December to May except for the cases of Birregurra Creek which had a significant number of days of cease to flow in Winter, and Boundary Creek which had a few days of cease to flow in Winter (Figure 10).

SECTION 4 Hydrology
29
On the basis of the seasonal distributions of median flow, mean flow and cease to flow, the high flow (Winter) period was defined as June to November (inclusive) and the low flow (Summer) period was defined as December to May (inclusive).
1A: Barwon River at downstream of West Barwon Dam
0
50
100
150
200
250
300
350
Jan Feb Mar Apr May Jun Jul Aug Sep Oct Nov Dec
Med
ain
dai
ly d
isch
arg
e (M
L/d
)
natural
current
1B: Barwon River upstream of Birregurra Ck (Ricketts Marsh:233224)
0
50
100
150
200
250
300
350
Jan Feb Mar Apr May Jun Jul Aug Sep Oct Nov Dec
Med
ain
dai
ly d
isch
arg
e (M
L/d
)
natural
current
2: Barwon River Winchelsea (Inverleigh:233218)
0
200
400
600
800
1,000
1,200
Jan Feb Mar Apr May Jun Jul Aug Sep Oct Nov Dec
Med
ain
dai
ly d
isch
arg
e (M
L/d
)
natural
current
3: Barwon River Murgheboluc (Pollocksford:233200)
0
200
400
600
800
1,000
1,200
Jan Feb Mar Apr May Jun Jul Aug Sep Oct Nov Dec
Med
ain
dai
ly d
isch
arg
e (M
L/d
)
natural
current
4: Barwon River Geelong (Geelong:233217)
0
200
400
600
800
1,000
1,200
Jan Feb Mar Apr May Jun Jul Aug Sep Oct Nov Dec
Med
ain
dai
ly d
isch
arg
e (M
L/d
)
natural
current
Figure 7. Median daily discharge for each month for Barwon River main stem sites. Note variable Y-axis scale.

SECTION 4 Hydrology
30
8: Mid-Leigh River (Mount Mercer:233215)
0
50
100
150
200
250
Jan Feb Mar Apr May Jun Jul Aug Sep Oct Nov Dec
Med
ain
dai
ly d
isch
arg
e (M
L/d
)
natural
current
9: Lower-Leigh River (Inverleigh:233209)
0
50
100
150
200
250
Jan Feb Mar Apr May Jun Jul Aug Sep Oct Nov Dec
Med
ain
dai
ly d
isch
arg
e (M
L/d
)
natural
current
6: Birregurra Creek (Ricketts Marsh:233211)
0
20
40
60
80
100
120
140
160
180
Jan Feb Mar Apr May Jun Jul Aug Sep Oct Nov Dec
Med
ain
dai
ly d
isch
arg
e (M
L/d
)
natural
current
7: Boundary Creek (Yeodene:233228)
0
5
10
15
20
25
Jan Feb Mar Apr May Jun Jul Aug Sep Oct Nov Dec
Med
ain
dai
ly d
isch
arg
e (M
L/d
)
natural
current
Figure 8. Median daily discharge for each month for Barwon River tributary sites. Note variable Y-axis scale.

SECTION 4 Hydrology
31
1A: Barwon River at downstream of West Barwon Dam
0
1
2
3
4
Jan Feb Mar Apr May Jun Jul Aug Sep Oct Nov Dec
Mea
n d
ays
of
zero
flo
w (
day
s/m
on
th)
natural
current
1B: Barwon River upstream of Birregurra Ck (Ricketts Marsh:233224)
0
1
2
3
4
Jan Feb Mar Apr May Jun Jul Aug Sep Oct Nov Dec
Mea
n d
ays
of z
ero
flo
w (d
ays/
mo
nth
) natural
current
2: Barwon River Winchelsea (Inverleigh:233218)
0
1
2
3
4
Jan Feb Mar Apr May Jun Jul Aug Sep Oct Nov Dec
Mea
n d
ays
of
zero
flo
w (
day
s/m
on
th) natural
current
Figure 9. Mean days of cease to flow for each month for Barwon River main stem sites. Cease to flow did not occur in the Murgheboluc and Geelong reaches for both natural and current conditions.

SECTION 4 Hydrology
32
6: Birregurra Creek (Ricketts Marsh:233211)
0
5
10
15
20
25
30
Jan Feb Mar Apr May Jun Jul Aug Sep Oct Nov Dec
Mea
n d
ays
of
zero
flo
w (
day
s/m
on
th)
natural
current
7: Boundary Creek (Yeodene:233228)
0
5
10
15
20
25
30
Jan Feb Mar Apr May Jun Jul Aug Sep Oct Nov Dec
Mea
n d
ays
of z
ero
flo
w (d
ays/
mo
nth
) natural
current
8: Mid-Leigh River (Mount Mercer:233215)
0
1
2
Jan Feb Mar Apr May Jun Jul Aug Sep Oct Nov Dec
Mea
n d
ays
of
zero
flo
w (
day
s/m
on
th) natural
current
cease-to-flow did not occur under current conditions
9: Lower-Leigh River (Inverleigh:233209)
0
1
2
Jan Feb Mar Apr May Jun Jul Aug Sep Oct Nov Dec
Mea
n d
ays
of
zero
flo
w (
day
s/m
on
th) natural
current
cease-to-flow did not occur under current conditions
Figure 10. Mean days of cease to flow for each month for Barwon River tributary sites. Note variable Y-axis scale.
4.8 Cease to flow frequency-duration
Cease to flow did not occur on the Barwon River main stem downstream of the Winchelsea reach. The average frequency of Summer cease to flow events varied across the catchment, with Boundary Creek, Birregurra Creek and the Barwon River Winchelsea reach having more than one cease to flow event per season (Table 3). Birregurra Creek had the longest events, and Boundary Creek had the most frequent events. Only Birregurra Creek and Boundary Creek naturally experienced cease to flow events in Winter, with Birregurra Creek often not flowing in Winter (Table 4).

SECTION 4 Hydrology
33
Table 3. Frequency and mean duration of Summer cease to flow events for Barwon River and tributary sites for natural and current conditions.
Natural Current Site
Frequency (mean events per season)
Mean duration (days)
Std Dev
Frequency (mean events per season)
Mean duration (days)
Std Dev
1A: Barwon River at downstream of West Barwon Dam
0.4 18 21 1.9 7 9
1B: Barwon River upstream of Birregurra Ck (Ricketts Marsh:233224)
0.2 10 9 0.2 14 8
2: Barwon River Winchelsea (Inverleigh:233218)
1.2 4 7 0.4 14 14
3: Barwon River Murgheboluc (Pollocksford:233200)
- - - - - -
4: Barwon River Geelong (Geelong:233217)
- - - - - -
6: Birregurra Creek (Ricketts Marsh:233211)
1.5 95 78 1.5 98 73
7: Boundary Creek (Yeodene:233228)
2.7 12 13 2.8 14 13
8: Mid-Leigh River (Mount Mercer:233215)
1.0 5 5 - - -
9: Lower-Leigh River (Inverleigh:233209)
0.6 3 3 - - -

SECTION 4 Hydrology
34
Table 4. Frequency and mean duration of Winter cease to flow events for Barwon River and tributary sites for natural and current conditions.
Natural Current Site
Frequency (mean events per season)
Mean duration (days)
Std Dev
Frequency (mean events per season)
Mean duration (days)
Std Dev
1A: Barwon River at downstream of West Barwon Dam
- - - 1.3 5 3
1B: Barwon River upstream of Birregurra Ck (Ricketts Marsh:233224)
- - - - - -
2: Barwon River Winchelsea (Inverleigh:233218)
- - - - - -
3: Barwon River Murgheboluc (Pollocksford:233200)
- - - - - -
4: Barwon River Geelong (Geelong:233217)
- - - - - -
6: Birregurra Creek (Ricketts Marsh:233211)
1.9 22 34 1.4 30 40
7: Boundary Creek (Yeodene:233228)
0.2 6 8 0.6 9 9
8: Mid-Leigh River (Mount Mercer:233215)
- - - - - -
9: Lower-Leigh River (Inverleigh:233209)
- - - - - -
The distributions of Summer cease to flow spell lengths were generally log-normally distributed, with a small number of long duration spells and the majority being short events (Figure 11, Figure 12). In the Barwon main stem, most events were less than 10 days duration. Downstream of West Barwon Dam the impact of regulation was to shorten the longest half of the events, while downstream the effect was been to increase the duration of cease to flow events (Figure 11). The distributions of duration of Summer cease to flow events at Boundary Creek and Birregurra Creek were not impacted by regulation (Figure 12). Birregurra Creek experienced long duration cease to flow events, most being longer than 100 days. Under natural conditions the Leigh River had a Summer cease to flow event each season or every second season on average, with flow events mostly less than 5 days long. Regulation removed the cease to flow component from the Leigh River regime (Figure 12).
Regulation introduced cease to flow downstream of West Barwon Dam, and increased the duration of cease to flow events at Birregurra and Boundary Creeks (Figure 13). However, the frequency of Winter cease to flow decreased markedly at these sites (Table 4).

SECTION 4 Hydrology
35
1A: Barwon River at downstream of West Barwon Dam
0
10
20
30
40
50
60
70
80
0 20 40 60 80 100Percent of events spell length exceeded
Su
mm
er s
pel
l len
gth
(day
s)
Natural
Current
1B: Barwon River upstream of Birregurra Ck (Ricketts Marsh:233224)
0
5
10
15
20
25
30
35
0 20 40 60 80 100Percent of events spell length exceeded
Su
mm
er s
pel
l len
gth
(d
ays)
Natural
Current
2: Barwon River Winchelsea (Inverleigh:233218)
0
5
10
15
20
25
30
35
40
45
50
0 20 40 60 80 100Percent of events spell length exceeded
Sum
mer
spe
ll le
ngth
(da
ys)
Natural
Current
Figure 11. Distributions of Summer cease to flow spell lengths for Barwon River main stem sites. Note variable Y-axis scale.

SECTION 4 Hydrology
36
7: Boundary Creek (Yeodene:233228)
0
10
20
30
40
50
60
70
0 20 40 60 80 100Percent of events spell length exceeded
Su
mm
er s
pel
l len
gth
(d
ays)
Natural
Current
8: Mid-Leigh River (Mount Mercer:233215)
0
5
10
15
20
25
0 20 40 60 80 100Percent of events spell length exceeded
Su
mm
er s
pel
l len
gth
(day
s)
Natural
Current
cease-to-flow did not occur under current conditions
6: Birregurra Creek (Ricketts Marsh:233211)
0
20
40
60
80
100
120
140
160
180
200
0 20 40 60 80 100Percent of events spell length exceeded
Su
mm
er s
pel
l len
gth
(day
s)
Natural
Current
9: Lower-Leigh River (Inverleigh:233209)
0
2
4
6
8
10
12
14
0 20 40 60 80 100Percent of events spell length exceeded
Su
mm
er s
pel
l len
gth
(day
s)Natural
Current
cease-to-flow did not occur under current conditions
Figure 12. Distributions of Summer cease to flow spell lengths for Barwon River tributary sites. Note variable Y-axis scale.

SECTION 4 Hydrology
37
1A: Barwon River at downstream of West Barwon Dam
0
2
4
6
8
10
12
14
16
0 20 40 60 80 100Percent of events spell length exceeded
Win
ter
spel
l len
gth
(d
ays)
Natural
Current
cease-to-flow did not occur under natural oonditions
7: Boundary Creek (Yeodene:233228)
0
10
20
30
40
50
60
0 20 40 60 80 100Percent of events spell length exceeded
Win
ter
spel
l len
gth
(day
s)
Natural
Current
6: Birregurra Creek (Ricketts Marsh:233211)
0
20
40
60
80
100
120
140
160
180
200
0 20 40 60 80 100Percent of events spell length exceeded
Win
ter
spel
l len
gth
(day
s)
Natural
Current
Figure 13. Distributions of Winter cease to flow spell lengths for relevant Barwon River main stem and tributary sites. Note variable Y-axis scale.

SECTION 4 Hydrology
38
4.9 Low flows
Low flows (Summer baseflows) were dissected from the hydrographic records by selecting flows with a Baseflow Index =0.9 and considering only the December to May period.
Magnitude
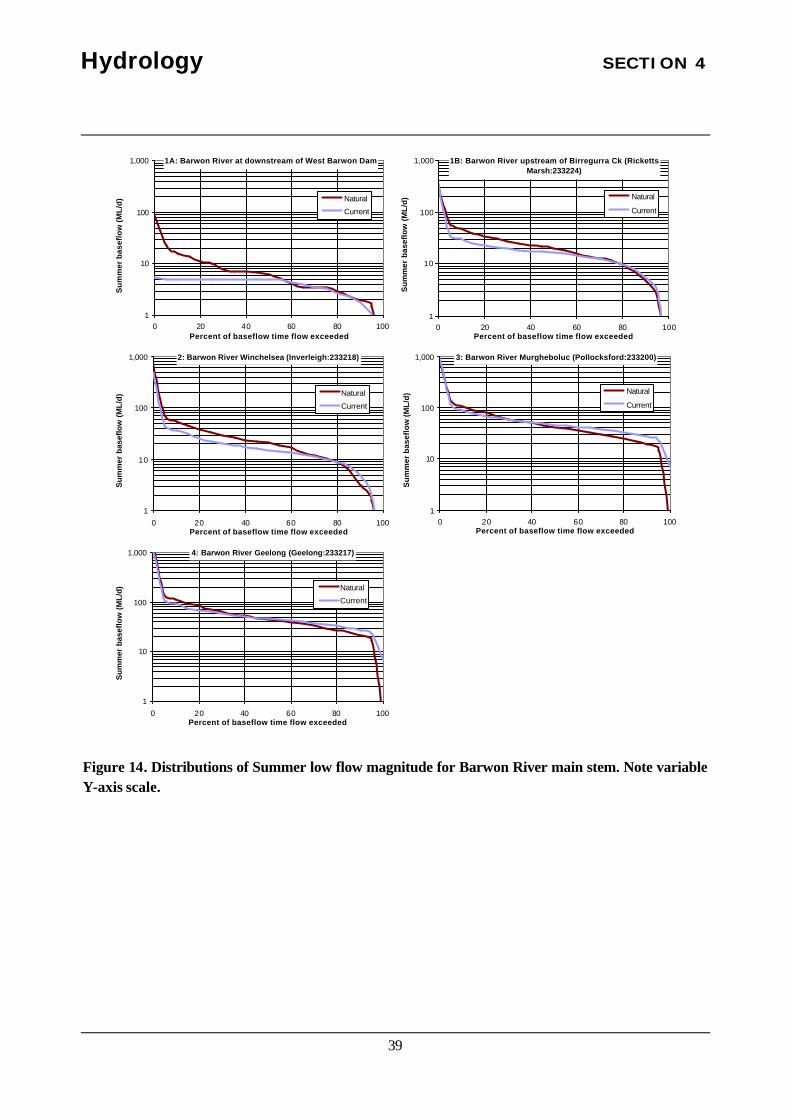
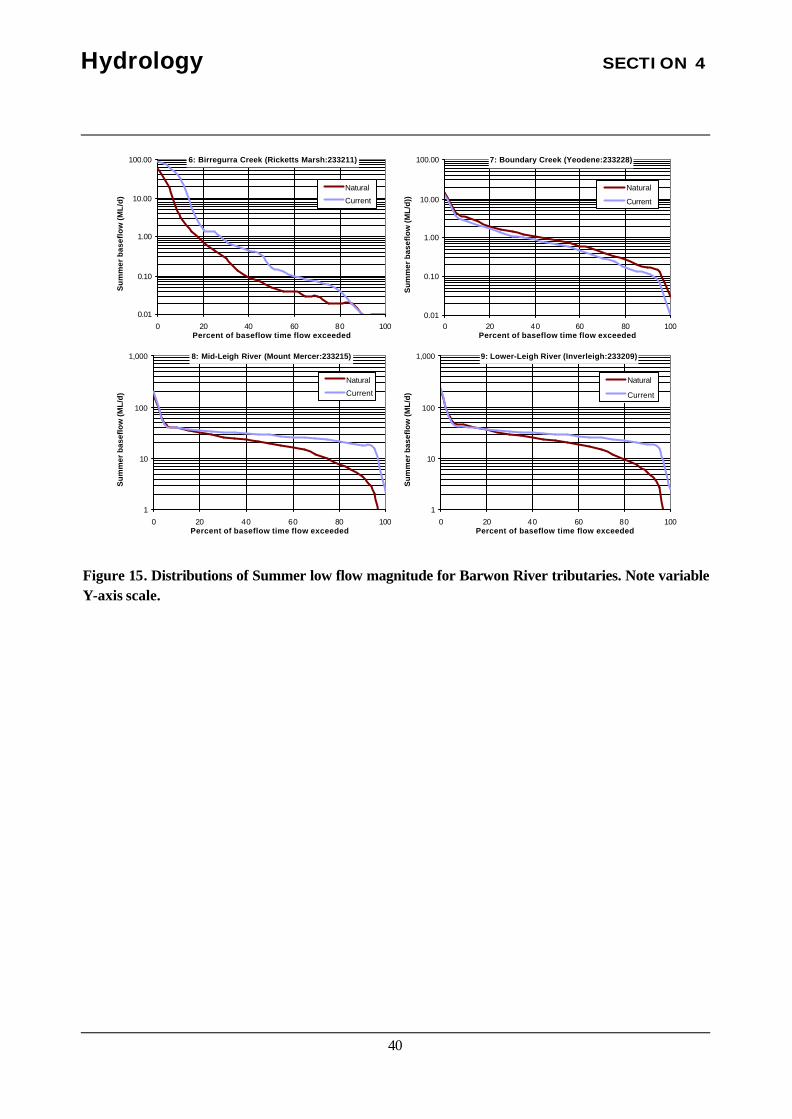
The distributions of low flow magnitudes were highly skewed at all sites, with the great majority of values being relatively low, and around 5% of values being an order of magnitude higher (Figure 14, Figure 15). These higher values represent days of flow during flood event rise or recession limbs that were not filtered by the baseflow digital filter. They are more likely an artefact of the baseflow separation algorithm (Equation 1) rather than representing summer low flows as defined in the FLOWS methodology (Table 2). Regulation had a variable impact on the magnitude of summer low flows, with the main impacted sites being on the Leigh River, which had noticeably higher magnitude summer low flows under current conditions, and the Upper Barwon River which had lower magnitude summer low flows under current conditions. The median natural Summer baseflow values varied from close to zero (0.1 ML/d) at Birregurra Creek to 42 – 44 ML/d on the lower Barwon River (Figure 16).
SECTION 4 Hydrology
39
1A: Barwon River at downstream of West Barwon Dam
1
10
100
1,000
0 20 40 60 80 100Percent of baseflow time flow exceeded
Su
mm
er b
asef
low
(ML
/d) Natural
Current
1B: Barwon River upstream of Birregurra Ck (Ricketts Marsh:233224)
1
10
100
1,000
0 20 40 60 80 100Percent of baseflow time flow exceeded
Su
mm
er b
asef
low
(M
L/d
) Natural
Current
2: Barwon River Winchelsea (Inverleigh:233218)
1
10
100
1,000
0 20 40 60 80 100Percent of baseflow time flow exceeded
Su
mm
er b
asef
low
(M
L/d
) Natural
Current
3: Barwon River Murgheboluc (Pollocksford:233200)
1
10
100
1,000
0 20 40 60 80 100Percent of baseflow time flow exceeded
Su
mm
er b
asef
low
(ML
/d) Natural
Current
4: Barwon River Geelong (Geelong:233217)
1
10
100
1,000
0 20 40 60 80 100Percent of baseflow time flow exceeded
Su
mm
er b
asef
low
(M
L/d
) Natural
Current
Figure 14. Distributions of Summer low flow magnitude for Barwon River main stem. Note variable Y-axis scale.
SECTION 4 Hydrology
40
7: Boundary Creek (Yeodene:233228)
0.01
0.10
1.00
10.00
100.00
0 20 40 60 80 100Percent of baseflow time flow exceeded
Su
mm
er b
asef
low
(ML
/d))
Natural
Current
8: Mid-Leigh River (Mount Mercer:233215)
1
10
100
1,000
0 20 40 60 80 100Percent of baseflow time flow exceeded
Su
mm
er b
asef
low
(ML
/d)
Natural
Current
6: Birregurra Creek (Ricketts Marsh:233211)
0.01
0.10
1.00
10.00
100.00
0 20 40 60 80 100Percent of baseflow time flow exceeded
Su
mm
er b
asef
low
(ML
/d)
Natural
Current
9: Lower-Leigh River (Inverleigh:233209)
1
10
100
1,000
0 20 40 60 80 100Percent of baseflow time flow exceeded
Su
mm
er b
asef
low
(ML
/d)
Natural
Current
Figure 15. Distributions of Summer low flow magnitude for Barwon River tributaries. Note variable Y-axis scale.

SECTION 4 Hydrology
41
0
5
10
15
20
25
30
35
40
45
50
1A: B
arw
on R
iver
at
dow
nstr
eam
of W
est
Bar
won
Dam
1B: B
arw
on R
iver
upst
ream
of B
irreg
urra
Ck
(Ric
ketts
Mar
sh:2
3322
4)
2: B
arw
on R
iver
Win
chel
sea
(Inv
erle
igh:
2332
18)
3: B
arw
on R
iver
Mur
gheb
oluc
(Pol
lock
sfor
d:23
3200
)
4: B
arw
on R
iver
Gee
long
(Gee
long
:233
217)
6: B
irreg
urra
Cre
ek(R
icke
tts M
arsh
:233
211)
7: B
ound
ary
Cre
ek(Y
eode
ne:2
3322
8)
8: M
id-L
eigh
Riv
er (
Mou
ntM
erce
r:23
3215
)
9: L
ower
-Lei
gh R
iver
(Inv
erle
igh:
2332
09)
Med
ian
Su
mm
er b
asef
low
(M
L/d
)
naturalcurrent
Figure 16. Median Summer low flow magnitude for Barwon River main stem and tributaries.
Frequency-Duration
The existence of baseflow is not characterised here as an event, but rather as the hydrological state that between cease to flow events and storm flow events. When specifying the duration and frequency of baseflows in an environmental flow assessment it is appropriate to allocate this component to the time remaining after cease to flow and stormflows are allocated. Thus, baseflows are not described here in terms of event frequency and duration statistics, but in terms of the percentage of the time that they occurred through the season. The distinction between baseflow and stormflow was arbitrarily defined by Baseflow Index thresholds, with transitional flows in-between that are closer in function to baseflows than stormflows.
Under natural conditions, Summer baseflows occurred for between 33% and 42% of the time for the Barwon River and Leigh River, for 20% of the time for Boundary Creek and only 4% of the time for Birregurra Creek (Table 5). Including the transitional flows with baseflows increased these durations to 79% to 84% of the time for the Barwon River and Leigh River and 46% of the time for Boundary Creek and 9% of the time for Birregurra Creek (Table 5). Thus, for the larger rivers baseflow is the dominant

SECTION 4 Hydrology
42
hydrological condition in Summer, while Birregurra Creek is dominated by the cease to flow condition and Boundary Creek has an even split of cease to flow and baseflow. Regulation slightly increased the duration of baseflows for most sites, although this increase was more marked in the case of the Leigh River (Table 5).
Table 5. Percentage of the time in Summer when Baseflows and Transitional flows occurred for Natural and Current conditions. Small inconsistencies in the totals are due to rounding.
Natural Current
Baseflow Transition Baseflow plus
Transition
Baseflow Transition Baseflow plus
Transition
1A: Barwon River at downstream of West Barwon Dam
33% 47% 80% 37% 49% 86%
1B: Barwon River upstream of Birregurra Ck (Ricketts Marsh:233224)
35% 49% 84% 38% 50% 87%
2: Barwon River Winchelsea (Inverleigh:233218) 33% 46% 79% 33% 48% 80%
3: Barwon River Murgheboluc (Pollocksford:233200) 41% 42% 83% 42% 48% 90%
4: Barwon River Geelong (Geelong:233217) 42% 40% 82% 42% 47% 89%
6: Birregurra Creek (Ricketts Marsh:233211) 4% 6% 9% 2% 7% 9%
7: Boundary Creek (Yeodene:233228) 20% 26% 46% 19% 25% 44%
8: Mid-Leigh River (Mount Mercer:233215) 35% 47% 82% 46% 47% 93%
9: Lower-Leigh River (Inverleigh:233209) 38% 43% 81% 46% 47% 93%

SECTION 4 Hydrology
43
4.10 Low flow freshes
Summer low flow freshes (low flow period storm events) were dissected from the hydrographic records by selecting flows with a Baseflow Index = 0.4 and considering only the December to May period.
Magnitude-Frequency
A range of storm events occurred throughout the summer period, but only the smaller freshes that occurred more frequently than once per year are plotted here. The peak magnitude of these freshes increased with catchment area and for each site the more frequent an event the lower was its magnitude (Figure 17, Figure 18). Birregurra Creek had few summer freshes and they were of low peak magnitude (Figure 18). Regulation had the effect of reducing the peak magnitude of summer freshes at all sites except for the Mid-Leigh River where there was no noticeable impact and Birregurra Creek where the 1:1 year (summer only) flood peak increased but the 2:1 year (summer only) flood peak decreased (Figure 18).
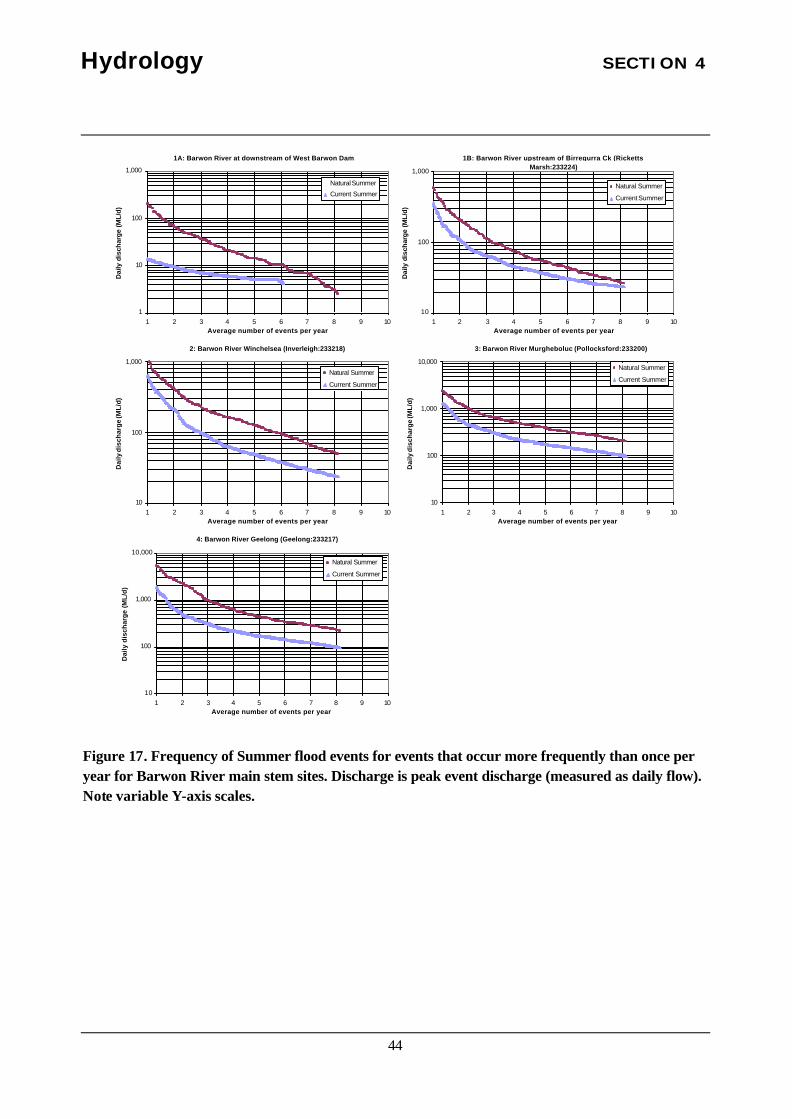
SECTION 4 Hydrology
44
1A: Barwon River at downstream of West Barwon Dam
1
10
100
1,000
1 2 3 4 5 6 7 8 9 10Average number of events per year
Dai
ly d
isch
arg
e (M
L/d
)
Natural Summer
Current Summer
1B: Barwon River upstream of Birregurra Ck (Ricketts Marsh:233224)
10
100
1,000
1 2 3 4 5 6 7 8 9 10Average number of events per year
Dai
ly d
isch
arg
e (M
L/d
)
Natural Summer
Current Summer
2: Barwon River Winchelsea (Inverleigh:233218)
10
100
1,000
1 2 3 4 5 6 7 8 9 10Average number of events per year
Dai
ly d
isch
arg
e (M
L/d
)
Natural Summer
Current Summer
3: Barwon River Murgheboluc (Pollocksford:233200)
10
100
1,000
10,000
1 2 3 4 5 6 7 8 9 10Average number of events per year
Dai
ly d
isch
arg
e (M
L/d
)
Natural Summer
Current Summer
4: Barwon River Geelong (Geelong:233217)
10
100
1,000
10,000
1 2 3 4 5 6 7 8 9 10Average number of events per year
Dai
ly d
isch
arg
e (M
L/d
)
Natural Summer
Current Summer
Figure 17. Frequency of Summer flood events for events that occur more frequently than once per year for Barwon River main stem sites. Discharge is peak event discharge (measured as daily flow). Note variable Y-axis scales.
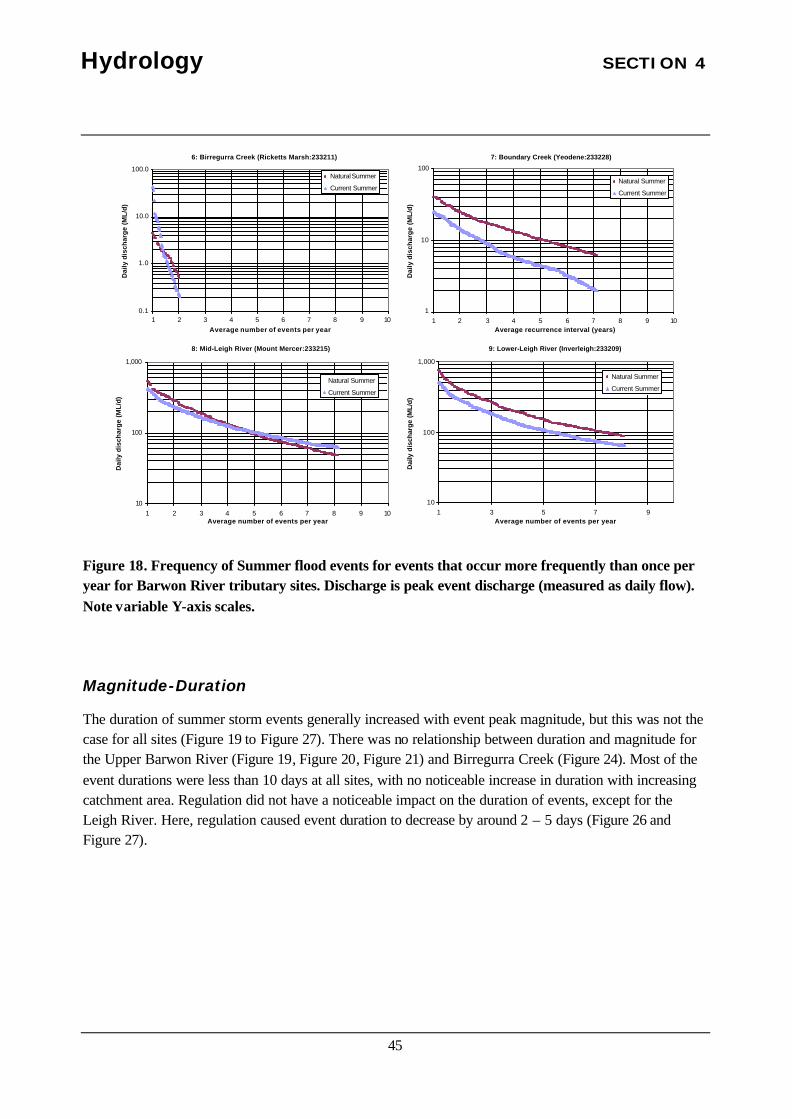
SECTION 4 Hydrology
45
6: Birregurra Creek (Ricketts Marsh:233211)
0.1
1.0
10.0
100.0
1 2 3 4 5 6 7 8 9 10Average number of events per year
Dai
ly d
isch
arg
e (M
L/d
)
Natural Summer
Current Summer
7: Boundary Creek (Yeodene:233228)
1
10
100
1 2 3 4 5 6 7 8 9 10Average recurrence interval (years)
Dai
ly d
isch
arg
e (M
L/d
)
Natural Summer
Current Summer
8: Mid-Leigh River (Mount Mercer:233215)
10
100
1,000
1 2 3 4 5 6 7 8 9 10Average number of events per year
Dai
ly d
isch
arg
e (M
L/d
)
Natural Summer
Current Summer
9: Lower-Leigh River (Inverleigh:233209)
10
100
1,000
1 3 5 7 9Average number of events per year
Dai
ly d
isch
arg
e (M
L/d
)
Natural Summer
Current Summer
Figure 18. Frequency of Summer flood events for events that occur more frequently than once per year for Barwon River tributary sites. Discharge is peak event discharge (measured as daily flow). Note variable Y-axis scales.
Magnitude-Duration
The duration of summer storm events generally increased with event peak magnitude, but this was not the case for all sites (Figure 19 to Figure 27). There was no relationship between duration and magnitude for the Upper Barwon River (Figure 19, Figure 20, Figure 21) and Birregurra Creek (Figure 24). Most of the event durations were less than 10 days at all sites, with no noticeable increase in duration with increasing catchment area. Regulation did not have a noticeable impact on the duration of events, except for the Leigh River. Here, regulation caused event duration to decrease by around 2 – 5 days (Figure 26 and Figure 27).
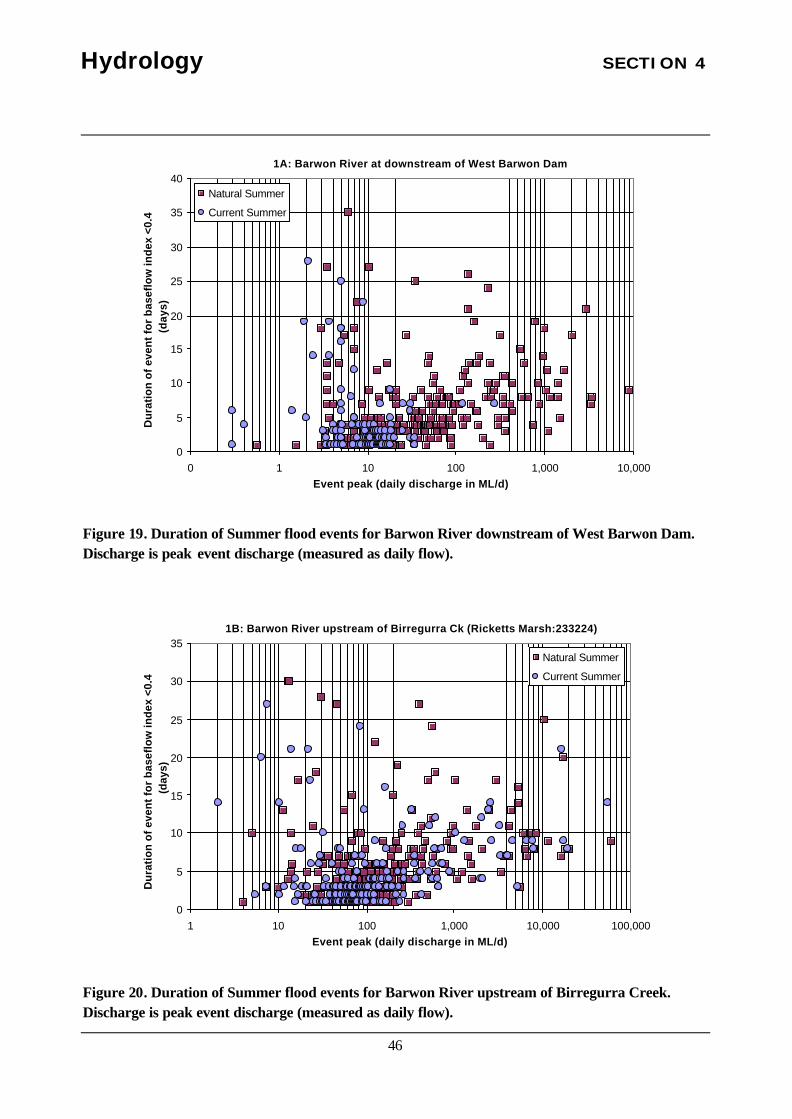
SECTION 4 Hydrology
46
1A: Barwon River at downstream of West Barwon Dam
0
5
10
15
20
25
30
35
40
0 1 10 100 1,000 10,000Event peak (daily discharge in ML/d)
Du
rati
on
of
even
t fo
r b
asef
low
ind
ex <
0.4
(d
ays)
Natural Summer
Current Summer
Figure 19. Duration of Summer flood events for Barwon River downstream of West Barwon Dam. Discharge is peak event discharge (measured as daily flow).
1B: Barwon River upstream of Birregurra Ck (Ricketts Marsh:233224)
0
5
10
15
20
25
30
35
1 10 100 1,000 10,000 100,000Event peak (daily discharge in ML/d)
Du
rati
on
of
even
t fo
r b
asef
low
ind
ex <
0.4
(d
ays)
Natural Summer
Current Summer
Figure 20. Duration of Summer flood events for Barwon River upstream of Birregurra Creek. Discharge is peak event discharge (measured as daily flow).

SECTION 4 Hydrology
47
2: Barwon River Winchelsea (Inverleigh:233218)
0
5
10
15
20
25
30
35
1 10 100 1,000 10,000 100,000 1,000,000Event peak (daily discharge in ML/d)
Du
rati
on
of
even
t fo
r b
asef
low
ind
ex <
0.4
(d
ays)
Natural Summer
Current Summer
Figure 21. Duration of Summer flood events for Barwon River Winchelsea. Discharge is peak event discharge (measured as daily flow).

SECTION 4 Hydrology
48
3: Barwon River Murgheboluc (Pollocksford:233200)
R2 = 0.4035N = 358
R2 = 0.4876N = 247
0
5
10
15
20
25
30
10 100 1,000 10,000 100,000 1,000,000Event peak (daily discharge in ML/d)
Du
rati
on
of
even
t fo
r b
asef
low
ind
ex <
0.4
(d
ays)
Natural Summer
Current Summer
Power (Natural Summer)
Power (Current Summer)
Figure 22. Duration of Summer flood events for Barwon River Murgheboluc. Discharge is peak event discharge (measured as daily flow).
4: Barwon River Geelong (Geelong:233217)
R2 = 0.4493N = 369
R2 = 0.5540N = 247
0
5
10
15
20
25
30
10 100 1,000 10,000 100,000 1,000,000Event peak (daily discharge in ML/d)
Du
rati
on
of
even
t fo
r b
asef
low
ind
ex <
0.4
(d
ays)
Natural Summer
Current Summer
Power (Natural Summer)
Power (Current Summer)
Figure 23. Duration of Summer flood events for Barwon River Geelong. Discharge is peak event discharge (measured as daily flow).

SECTION 4 Hydrology
49
6: Birregurra Creek (Ricketts Marsh:233211)
0
5
10
15
20
25
30
35
40
45
50
55
60
0.1 1.0 10.0 100.0 1,000.0Event peak (daily discharge in ML/d)
Du
rati
on
of
even
t fo
r b
asef
low
ind
ex <
0.4
(d
ays)
Natural Summer
Current Summer
Figure 24. Duration of Summer flood events for Birregurra Creek. Discharge is peak event discharge (measured as daily flow).

SECTION 4 Hydrology
50
7: Boundary Creek (Yeodene:233228)
R2 = 0.1486N = 298
0
5
10
15
20
25
30
35
40
45
50
0.1 1.0 10.0 100.0 1,000.0Event peak (daily discharge in ML/d)
Du
rati
on
of
even
t fo
r b
asef
low
ind
ex <
0.4
(d
ays)
Natural Summer
Current Summer
Power (Natural Summer)
Figure 25. Duration of Summer flood events for Boundary Creek. Discharge is peak event discharge (measured as daily flow).
8: Mid-Leigh River (Mount Mercer:233215)
R2 = 0.4715N = 295
R2 = 0.1723N = 279
0
5
10
15
20
25
30
35
10 100 1,000 10,000 100,000Event peak (daily discharge in ML/d)
Du
rati
on
of
even
t fo
r b
asef
low
ind
ex <
0.4
(d
ays)
Natural Summer
Current Summer
Power (Current Summer)
Power (Natural Summer)
Figure 26. Duration of Summer flood events for Mid-Leigh River. Discharge is peak event discharge (measured as daily flow).
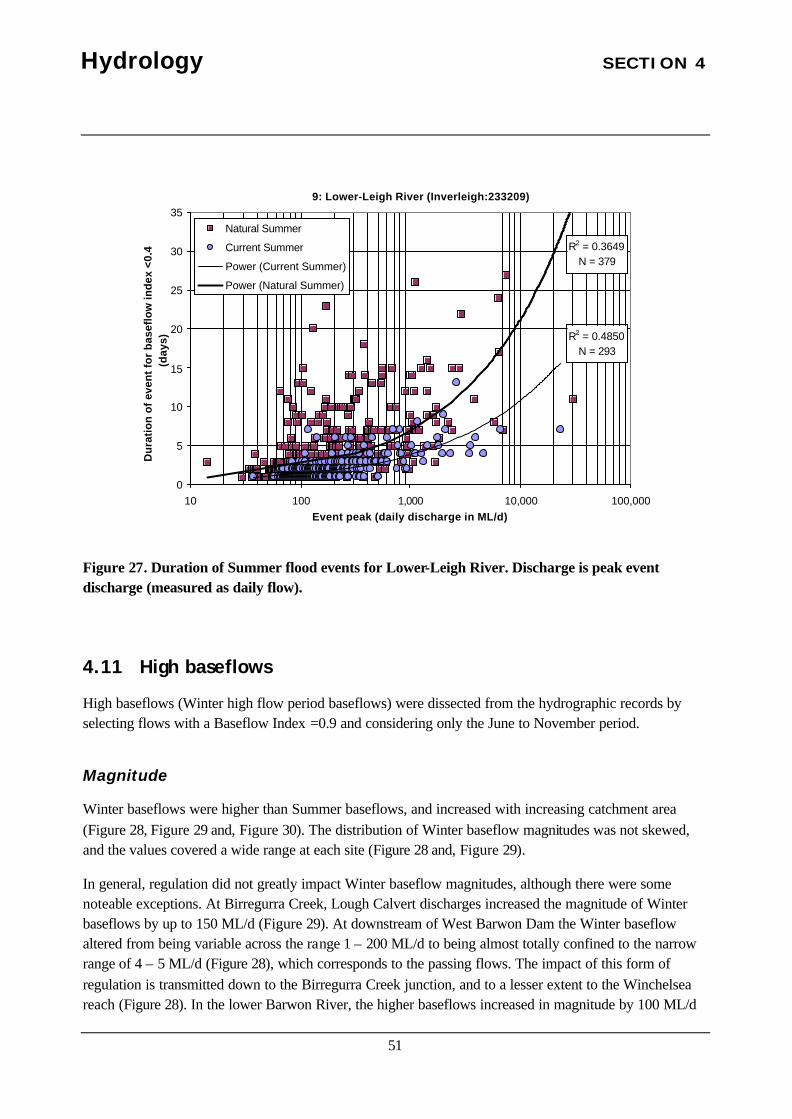
SECTION 4 Hydrology
51
9: Lower-Leigh River (Inverleigh:233209)
R2 = 0.4850N = 293
R2 = 0.3649N = 379
0
5
10
15
20
25
30
35
10 100 1,000 10,000 100,000Event peak (daily discharge in ML/d)
Du
rati
on
of
even
t fo
r b
asef
low
ind
ex <
0.4
(d
ays)
Natural Summer
Current Summer
Power (Current Summer)
Power (Natural Summer)
Figure 27. Duration of Summer flood events for Lower-Leigh River. Discharge is peak event discharge (measured as daily flow).
4.11 High baseflows
High baseflows (Winter high flow period baseflows) were dissected from the hydrographic records by selecting flows with a Baseflow Index =0.9 and considering only the June to November period.
Magnitude
Winter baseflows were higher than Summer baseflows, and increased with increasing catchment area (Figure 28, Figure 29 and, Figure 30). The distribution of Winter baseflow magnitudes was not skewed, and the values covered a wide range at each site (Figure 28 and, Figure 29).
In general, regulation did not greatly impact Winter baseflow magnitudes, although there were some noteable exceptions. At Birregurra Creek, Lough Calvert discharges increased the magnitude of Winter baseflows by up to 150 ML/d (Figure 29). At downstream of West Barwon Dam the Winter baseflow altered from being variable across the range 1 – 200 ML/d to being almost totally confined to the narrow range of 4 – 5 ML/d (Figure 28), which corresponds to the passing flows. The impact of this form of regulation is transmitted down to the Birregurra Creek junction, and to a lesser extent to the Winchelsea reach (Figure 28). In the lower Barwon River, the higher baseflows increased in magnitude by 100 ML/d

SECTION 4 Hydrology
52
to 200 ML/d (Figure 28, Figure 30), while in the Leigh River they decreased by up to 100 ML/d (Figure 29, Figure 30).
1A: Barwon River at downstream of West Barwon Dam
1
10
100
1,000
0 20 40 60 80 100Percent of baseflow time flow exceeded
Win
ter
bas
eflo
w (M
L/d
)
Natural
Current
1B: Barwon River upstream of Birregurra Ck (Ricketts Marsh:233224)
1
10
100
1,000
0 20 40 60 80 100Percent of baseflow time flow exceeded
Win
ter
bas
eflo
w (M
L/d
)
Natural
Current
2: Barwon River Winchelsea (Inverleigh:233218)
10
100
1,000
10,000
0 20 40 60 80 100Percent of baseflow time flow exceeded
Win
ter
bas
eflo
w (M
L/d
)
Natural
Current
3: Barwon River Murgheboluc (Pollocksford:233200)
10
100
1,000
10,000
0 20 40 60 80 100Percent of baseflow time flow exceeded
Win
ter
bas
eflo
w (M
L/d
)
Natural
Current
4: Barwon River Geelong (Geelong:233217)
10
100
1,000
10,000
0 20 40 60 80 100Percent of baseflow time flow exceeded
Win
ter
bas
eflo
w (M
L/d
)
Natural
Current
Figure 28. Distributions of Winter low flow magnitude for Barwon River main stem. Note variable Y-axis scale.

SECTION 4 Hydrology
53
7: Boundary Creek (Yeodene:233228)
0.01
0.10
1.00
10.00
100.00
0 20 40 60 80 100Percent of baseflow time flow exceeded
Win
ter
bas
eflo
w (M
L/d
)
Natural
Current
6: Birregurra Creek (Ricketts Marsh:233211)
0.01
0.10
1.00
10.00
100.00
1,000.00
0 20 40 60 80 100Percent of baseflow time flow exceeded
Win
ter
bas
eflo
w (M
L/d
)
Natural
Current
9: Lower-Leigh River (Inverleigh:233209)
1
10
100
1,000
0 20 40 60 80 100Percent of baseflow time flow exceeded
Win
ter
bas
eflo
w (
ML
/d)
Natural
Current
8: Mid-Leigh River (Mount Mercer:233215)
1
10
100
1,000
0 20 40 60 80 100Percent of baseflow time flow exceeded
Win
ter
bas
eflo
w (
ML
/d)
Natural
Current
Figure 29. Distributions of Winter low flow magnitude for Barwon River tributaries. Note variable Y-axis scale.

SECTION 4 Hydrology
54
0
50
100
150
200
250
300
1A: B
arw
on R
iver
at
dow
nstr
eam
of W
est
Bar
won
Dam
1B: B
arw
on R
iver
upst
ream
of B
irreg
urra
Ck
(Ric
ketts
Mar
sh:2
3322
4)
2: B
arw
on R
iver
Win
chel
sea
(Inv
erle
igh:
2332
18)
3: B
arw
on R
iver
Mur
gheb
oluc
(Pol
lock
sfor
d:23
3200
)
4: B
arw
on R
iver
Gee
long
(Gee
long
:233
217)
6: B
irreg
urra
Cre
ek(R
icke
tts M
arsh
:233
211)
7: B
ound
ary
Cre
ek(Y
eode
ne:2
3322
8)
8: M
id-L
eigh
Riv
er (M
ount
Mer
cer:
2332
15)
9: L
ower
-Lei
gh R
iver
(Inv
erle
igh:
2332
09)
Med
ian
Win
ter
bas
eflo
w (
ML
/d)
naturalcurrent
Figure 30. Median Winter low flow magnitude for Barwon River main stem and tributaries.
Frequency-Duration
Under natural conditions, Winter baseflows occurred for between 27% and 36% of the time for the Barwon River, Boundary Creek and Leigh River, and 14% of the time for Birregurra Creek (Table 6). Including the transitional flows with baseflows increased these durations to 64% to 76% of the time for the Barwon River, Boundary Creek and Leigh River and 38% of the time for Birregurra Creek (Table 6). Thus, for the larger rivers baseflow is the dominant hydrological condition in Winter, while Birregurra Creek is dominated by the cease to flow condition. Regulation did not greatly impact the duration of baseflows for most sites, and the direction of the impact was variable (Table 6).

SECTION 4 Hydrology
55
Table 6. Percentage of the time in Winter when Baseflows and Transitional flows occurred for Natural and Current conditions. Small inconsistencies in the totals are due to rounding.
Natural Current
Baseflow Transition Baseflow plus
Transition
Baseflow Transition Baseflow plus
Transition
1A: Barwon River at downstream of West Barwon Dam
27% 48% 75% 47% 35% 82%
1B: Barwon River upstream of Birregurra Ck (Ricketts Marsh:233224)
30% 45% 74% 32% 41% 73%
2: Barwon River Winchelsea (Inverleigh:233218) 30% 41% 72% 29% 43% 73%
3: Barwon River Murgheboluc (Pollocksford:233200) 33% 38% 71% 30% 46% 76%
4: Barwon River Geelong (Geelong:233217) 36% 32% 67% 29% 43% 73%
6: Birregurra Creek (Ricketts Marsh:233211) 14% 24% 38% 11% 36% 47%
7: Boundary Creek (Yeodene:233228) 27% 38% 64% 24% 36% 60%
8: Mid-Leigh River (Mount Mercer:233215) 31% 45% 76% 37% 43% 80%
9: Lower-Leigh River (Inverleigh:233209) 32% 41% 73% 36% 43% 79%
4.12 High flow freshes
Winter high flow freshes (high flow period storm events) were dissected from the hydrographic records by selecting flows with a Baseflow Index =0.4 and considering only the June to November period.
Magnitude-Frequency
A range of storm events occurred throughout the winter period, but only the smaller freshes that occurred more frequently than once per year are plotted here. The peak magnitude of these freshes increased with catchment area and for each site the more frequent an event the lower was its magnitude (Figure 31, Figure 32). Regulation had the effect of reducing the peak magnitude of winter freshes at all sites except for the Mid-Leigh River, where there was no noticeable impact, and Birregurra Creek, where the 1:1 year (winter only) flood peak increased but the 2:1 year (winter only) flood peak decreased (Figure 32).

SECTION 4 Hydrology
56
1A: Barwon River at downstream of West Barwon Dam
1
10
100
1,000
1 2 3 4 5 6 7 8 9 10Average number of events per year
Dai
ly d
isch
arge
(M
L/d)
Natural Winter
Current Winter
1B: Barwon River upstream of Birregurra Ck (Ricketts Marsh:233224)
100
1,000
10,000
1 2 3 4 5 6 7 8 9 10Average number of events per year
Dai
ly d
isch
arg
e (M
L/d
)
Natural Winter
Current Winter
2: Barwon River Winchelsea (Inverleigh:233218)
100
1,000
10,000
1 2 3 4 5 6 7 8 9 10Average number of events per year
Dai
ly d
isch
arge
(M
L/d)
Natural Winter
Current Winter
3: Barwon River Murgheboluc (Pollocksford:233200)
100
1,000
10,000
100,000
1 2 3 4 5 6 7 8 9 10Average number of events per year
Dai
ly d
isch
arge
(M
L/d)
Natural Winter
Current Winter
4: Barwon River Geelong (Geelong:233217)
100
1,000
10,000
100,000
1 2 3 4 5 6 7 8 9 10Average number of events per year
Dai
ly d
isch
arg
e (M
L/d
)
Natural Winter
Current Winter
Figure 31. Frequency of Winter flood events for events that occur more frequently that once per year for Barwon River main stem sites. Discharge is peak event discharge (measured as daily flow). Note variable Y-axis scales.

SECTION 4 Hydrology
57
6: Birregurra Creek (Ricketts Marsh:233211)
1
10
100
1,000
1 2 3 4 5 6 7 8 9 10Average number of events per year
Dai
ly d
isch
arge
(M
L/d)
Natural Winter
Current Winter
7: Boundary Creek (Yeodene:233228)
10
100
1,000
1 2 3 4 5 6 7 8 9 10Average recurrence interval (years)
Dai
ly d
isch
arge
(M
L/d)
Natural Winter
Current Winter
8: Mid-Leigh River (Mount Mercer:233215)
100
1,000
10,000
1 2 3 4 5 6 7 8 9 10Average number of events per year
Dai
ly d
isch
arge
(M
L/d)
Natural Winter
Current Winter
9: Lower-Leigh River (Inverleigh:233209)
100
1,000
10,000
1 3 5 7 9Average number of events per year
Dai
ly d
isch
arge
(M
L/d)
Natural Winter
Current Winter
Figure 32. Frequency of Winter flood events for events that occur more frequently that once per year for Barwon River tributary sites. Discharge is peak event discharge (measured as daily flow). Note variable Y-axis scales.
Magnitude-Duration
The duration of winter storm events generally increased with event peak magnitude, but this was not the case for Birregurra Creek (Figure 33 to Figure 41). Most of the event durations were less than 15 days at all sites, with no noticeable increase in duration with increasing catchment area. Regulation did not have a noticeable impact on the duration of events, except for the lower Leigh River where it appears that duration decreased by around 2 – 5 days (Figure 41).

SECTION 4 Hydrology
58
1A: Barwon River at downstream of West Barwon Dam
R2 = 0.1698N = 312
R2 = 0.4684N = 154
0
5
10
15
20
25
30
35
1 10 100 1,000 10,000 100,000Event peak (daily discharge in ML/d)
Du
rati
on
of
even
t fo
r b
asef
low
ind
ex <
0.4
(d
ays)
Natural Winter
Current Winter
Power (Natural Winter)
Power (Current Winter)
Figure 33. Duration of Winter flood events for Barwon River downstream of West Barwon Dam. Discharge is peak event discharge (measured as daily flow).
1B: Barwon River upstream of Birregurra Ck (Ricketts Marsh:233224)
R2 = 0.3756N = 307
R2 = 0.4154N = 292
0
5
10
15
20
25
30
35
40
10 100 1,000 10,000 100,000 1,000,000Event peak (daily discharge in ML/d)
Du
rati
on
of
even
t fo
r b
asef
low
ind
ex <
0.4
(d
ays)
Natural Winter
Current Winter
Power (Natural Winter)
Power (Current Winter)
Figure 34. Duration of Winter flood events for Barwon River upstream of Birregurra Creek. Discharge is peak event discharge (measured as daily flow).

SECTION 4 Hydrology
59
2: Barwon River Winchelsea (Inverleigh:233218)
R2 = 0.3819N = 348
R2 = 0.2196N - 310
0
5
10
15
20
25
30
35
10 100 1,000 10,000 100,000 1,000,000Event peak (daily discharge in ML/d)
Du
rati
on
of
even
t fo
r b
asef
low
ind
ex <
0.4
(d
ays)
Natural Winter
Current Winter
Power (Natural Winter)
Power (Current Winter)
Figure 35. Duration of Winter flood events for Barwon River Winchelsea. Discharge is peak event discharge (measured as daily flow).

SECTION 4 Hydrology
60
3: Barwon River Murgheboluc (Pollocksford:233200)
R2 = 0.4550N = 393
R2 = 0.3569N = 298
0
5
10
15
20
25
30
35
10 100 1,000 10,000 100,000 1,000,000Event peak (daily discharge in ML/d)
Du
rati
on
of
even
t fo
r b
asef
low
ind
ex <
0.4
(d
ays)
Natural Winter
Current Winter
Power (Natural Winter)
Power (Current Winter)
Figure 36. Duration of Winter flood events for Barwon River Murgheboluc. Discharge is peak event discharge (measured as daily flow).
4: Barwon River Geelong (Geelong:233217)
R2 = 0.4781N = 320
R2 = 0.2772N = 288
0
5
10
15
20
25
30
35
40
45
50
55
10 100 1,000 10,000 100,000 1,000,000Event peak (daily discharge in ML/d)
Du
rati
on
of
even
t fo
r b
asef
low
ind
ex <
0.4
(d
ays)
Natural Winter
Current Winter
Power (Natural Winter)
Power (Current Winter)
Figure 37. Duration of Winter flood events for Barwon River Geelong. Discharge is peak event discharge (measured as daily flow).

SECTION 4 Hydrology
61
6: Birregurra Creek (Ricketts Marsh:233211)
0
10
20
30
40
50
60
70
80
0.1 1.0 10.0 100.0 1,000.0 10,000.0Event peak (daily discharge in ML/d)
Du
rati
on
of
even
t fo
r b
asef
low
ind
ex <
0.4
(d
ays)
Natural Winter
Current Winter
Figure 38. Duration of Winter flood events for Birregurra Creek. Discharge is peak event discharge (measured as daily flow).

SECTION 4 Hydrology
62
7: Boundary Creek (Yeodene:233228)
R2 = 0.193N = 368
0
5
10
15
20
25
30
35
40
45
50
0.1 1.0 10.0 100.0 1,000.0Event peak (daily discharge in ML/d)
Du
rati
on
of
even
t fo
r b
asef
low
ind
ex <
0.4
(d
ays)
Natural Winter
Current Winter
Power (Natural Winter)
Figure 39. Duration of Winter flood events for Boundary Creek. Discharge is peak event discharge (measured as daily flow).
8: Mid-Leigh River (Mount Mercer:233215)
R2 = 0.3648N = 317
R2 = 0.4697N = 345
0
5
10
15
20
25
30
35
1 10 100 1,000 10,000 100,000Event peak (daily discharge in ML/d)
Du
rati
on
of
even
t fo
r b
asef
low
ind
ex <
0.4
(d
ays)
Natural Winter
Current Winter
Power (Natural Winter)
Power (Current Winter)
Figure 40. Duration of Winter flood events for Mid-Leigh River. Discharge is peak event discharge (measured as daily flow).

SECTION 4 Hydrology
63
9: Lower-Leigh River (Inverleigh:233209)
R2 = 0.4754N = 380
R2 = 0.4469N = 340
0
5
10
15
20
25
30
35
40
10 100 1,000 10,000 100,000Event peak (daily discharge in ML/d)
Du
rati
on
of
even
t fo
r b
asef
low
ind
ex <
0.4
(d
ays)
Natural Winter
Current Winter
Power (Natural Winter)
Power (Current Winter)
Figure 41. Duration of Winter flood events for Lower Leigh River. Discharge is peak event discharge (measured as daily flow).
4.13 Bankfull and overbank flows
Magnitude-Frequency
Bankfull flows occur at a variable frequency in different river systems in Australia, but rivers that are not incised or aggraded would generally overtop their banks at an average frequency of between once a year (1:1 year ARI) to once every three years (1:3 year ARI).
In the Barwon River catchment, the peak magnitude of flood peaks increased with catchment area and for each site the more frequent an event the lower was its magnitude (Figure 42 and Figure 43). Regulation had the effect of noticeably reducing the peak magnitude of flood events at all sites except for Boundary Creek and Leigh River (Figure 43). For the Barwon River downstream of West Barwon Dam the impact was severe, with flood magnitudes significantly lower across the full range of recurrence intervals (Figure 42). Further downstream, events less than 1:10 year ARI were lower in magnitude under the current conditions, but the larger less frequent overbank events were not impacted (Figure 42). Regulation increased the magnitude of floods at Birregurra Creek due to the impact of Lough Calvert discharges which are generally released during storm flow periods (Figure 43). The current conditions at Boundary

SECTION 4 Hydrology
64
Creek have reduced magnitudes for high floods (greater than 1:10 year ARI) (Figure 43). The reason for this is unclear.
1A: Barwon River at downstream of West Barwon Dam
100
1,000
10,000
100,000
1 10 100Average recurrence interval (years)
Dai
ly d
isch
arg
e (M
L/d
)
Natural Entire year
Current Entire year
1B: Barwon River upstream of Birregurra Ck (Ricketts Marsh:233224)
1,000
10,000
100,000
1 10 100Average recurrence interval (years)
Dai
ly d
isch
arg
e (M
L/d
)
Natural Entire year
Current Entire year
2: Barwon River Winchelsea (Inverleigh:233218)
1,000
10,000
100,000
1,000,000
1 10 100Average recurrence interval (years)
Dai
ly d
isch
arg
e (M
L/d
)
Natural Entire year
Current Entire year
3: Barwon River Murgheboluc (Pollocksford:233200)
10,000
100,000
1,000,000
1 10 100Average recurrence interval (years)
Dai
ly d
isch
arg
e (M
L/d
)
Natural Entire year
Current Entire year
4: Barwon River Geelong (Geelong:233217)
10,000
100,000
1,000,000
1 10 100Average recurrence interval (years)
Dai
ly d
isch
arg
e (M
L/d
)
Natural Entire year
Current Entire year
Figure 42. Average recurrence interval of flood events for Barwon River main stem sites. Discharge is peak event discharge (measured as daily flow). Note variable Y-axis scales.

SECTION 4 Hydrology
65
6: Birregurra Creek (Ricketts Marsh:233211)
100
1,000
10,000
1 10 100Average recurrence interval (years)
Dai
ly d
isch
arg
e (M
L/d
)
Natural Entire year
Current Entire year
7: Boundary Creek (Yeodene:233228)
100
1,000
1 10 100Average recurrence interval (years)
Dai
ly d
isch
arg
e (M
L/d
)
Natural Entire year
Current Entire year
8: Mid-Leigh River (Mount Mercer:233215)
1,000
10,000
100,000
1 10 100Average recurrence interval (years)
Dai
ly d
isch
arg
e (M
L/d
)
Natural Entire year
Current Entire year
9: Lower-Leigh River (Inverleigh:233209)
1,000
10,000
100,000
1 10 100Average recurrence interval (years)
Dai
ly d
isch
arg
e (M
L/d
)
Natural Entire year
Current Entire year
Figure 43. Average recurrence interval of flood events for Barwon River tributary sites. Discharge is peak event discharge (measured as daily flow). Note variable Y-axis scales.
Magnitude-Duration
Bankfull and overbank floods can occur in Summer or Winter, although the majority occur in the Winter period. The duration of these events (Figure 19 to Figure 27 and Figure 33 to Figure 41) generally increased with event peak magnitude, but this was not the case for Birregurra Creek. Most of the high flood event durations were less than 20 days at all sites, with no noticeable increase in duration with increasing catchment area. Regulation did not have a clear impact on the duration of these events, except for the Barwon River at downstream of West Barwon Dam and Geelong, and the Leigh River, where there is a suggestion that the duration of bankfull and overbank floods may have decreased (Figure 41).
4.14 Rate of rise and fall
Indices of rate of rise and fall
Rate of rise and fall can be expressed as a percentage change in discharge from one day to the next. This normalises the index, so that it can be compared among events regardless of magnitude. However, it could be argued that the ecological significance of a high percentage change at high discharges could be different to that at low discharges. High rates of change in discharge for small freshes that are confined to

SECTION 4 Hydrology
66
the bed of the channel would have a different significance to high rates of change in discharge when the channel is full of water and there would be associated large changes in shear stress, water depth and velocity. Also, a fundamental problem with the percentage change index is that it cannot be calculated when discharge rises from zero. Thus, for the smaller streams, the rate of rise of many events, particularly during summer, cannot be expressed using this index. For this study the rate of rise and fall was expressed as change in discharge (in ML) from one day to the next.
Current compared to natural rates of rise and fall
The distributions of all rises and falls for stormflow cover a wide range at all sites (Figures Figure 44 to Figure 52). This demonstrates that rates of rise and fall are highly variable and are difficult to characterise in a simple way. The comparison of natural and current rates of rise and fall show a consistent pattern of reduced or little changed rates of both rise and fall for all sites except Birregurra Creek and Leigh River. The sites with reduced rates of rise and fall also have reduced flood magnitudes. These two variables are closely related, because the peak magnitude sets the upper limit on how much the discharge can increase and fall in any one day. Rates of rise and fall for Summer events appear to have been more markedly impacted than for Winter events.
Birregurra Creek has markedly increased rates of rise and fall due to Lough Calvert discharges that supplement the natural flood discharges. The Leigh River has increased rates of rise and fall, especially for Summer, even though flood magnitudes have not changed. This observation is consistent with the observation that flood event durations have decreased for the Leigh River sites (Figure 40 and Figure 41).
1A: Barwon River at downstream of West Barwon Dam
0.1
1.0
10.0
100.0
1,000.0
10,000.0
0 20 40 60 80 100Percent of time rate of rise higher / rate of fall lower
Rat
e o
f dis
char
ge
chan
ge
(ML
/d)
Natural Winter Fall Current Winter FallNatural Winter Rise Current Winter Rise
1A: Barwon River at downstream of West Barwon Dam
0.1
1.0
10.0
100.0
1,000.0
10,000.0
0 20 40 60 80 100
Percent of time rate of rise higher / rate of fall lower
Rat
e o
f dis
char
ge
chan
ge
(ML
/d)
Natural Summer Fall Current Summer FallNatural Summer Rise Current Summer Rise
Figure 44. Distribution of natural and current daily changes in discharge (rise and fall) for stormflow, Barwon River downstream of West Barwon Dam.

SECTION 4 Hydrology
67
1B: Barwon River upstream of Birregurra Ck (Ricketts Marsh:233224)
0.1
1.0
10.0
100.0
1,000.0
10,000.0
0 20 40 60 80 100
Percent of time rate of rise higher / rate of fall lower
Rat
e o
f ch
ang
e p
er d
ay (M
L/d
)
Natural Winter Fall Current Winter FallNatural Winter Rise Current Winter Rise
1B: Barwon River upstream of Birregurra Ck (Ricketts Marsh:233224)
0.1
1.0
10.0
100.0
1,000.0
10,000.0
0 20 40 60 80 100
Percent of time rate of rise higher / rate of fall lower
Rat
e o
f ch
ang
e p
er d
ay (M
L/d
)
Natural Summer Fall Current Summer FallNatural Summer Rise Current Summer Rise
Figure 45. Distribution of natural and current daily changes in discharge (rise and fall) for stormflow, Barwon River upstream of Birregurra Creek.
2: Barwon River Winchelsea (Inverleigh:233218)
1
10
100
1,000
10,000
100,000
0 20 40 60 80 100
Percent of time rate of rise higher / rate of fall lower
Rat
e o
f ch
ang
e p
er d
ay (
ML
/d)
Natural Winter Fall Current Winter FallNatural Winter Rise Current Winter Rise
2: Barwon River Winchelsea (Inverleigh:233218)
1
10
100
1,000
10,000
100,000
0 20 40 60 80 100
Percent of time rate of rise higher / rate of fall lower
Rat
e o
f ch
ang
e p
er d
ay (
ML
/d)
Natural Summer Fall Current Summer FallNatural Summer Rise Current Summer Rise
Figure 46. Distribution of natural and current daily changes in discharge (rise and fall) for stormflow, Barwon River Winchelsea.

SECTION 4 Hydrology
68
3: Barwon River Murgheboluc (Pollocksford:233200)
1
10
100
1,000
10,000
100,000
0 20 40 60 80 100
Percent of time rate of rise higher / rate of fall lower
Rat
e o
f ch
ang
e p
er d
ay (
ML
/d)
Natural Winter Fall Current Winter FallNatural Winter Rise Current Winter Rise
3: Barwon River Murgheboluc (Pollocksford:233200)
1
10
100
1,000
10,000
100,000
0 20 40 60 80 100
Percent of time rate of rise higher / rate of fall lower
Rat
e o
f ch
ang
e p
er d
ay (
ML
/d)
Natural Summer Fall Current Summer FallNatural Summer Rise Current Summer Rise
Figure 47. Distribution of natural and current daily changes in discharge (rise and fall) for stormflow, Barwon River Murgheboluc.
4: Barwon River Geelong (Geelong:233217)
1
10
100
1,000
10,000
100,000
0 20 40 60 80 100
Percent of time rate of rise higher / rate of fall lower
Rat
e o
f ch
ang
e p
er d
ay (
ML
/d)
Natural Winter Fall Current Winter FallNatural Winter Rise Current Winter Rise
4: Barwon River Geelong (Geelong:233217)
1
10
100
1,000
10,000
100,000
0 20 40 60 80 100
Percent of time rate of rise higher / rate of fall lower
Rat
e o
f ch
ang
e p
er d
ay (
ML
/d)
Natural Summer Fall Current Summer FallNatural Summer Rise Current Summer Rise
Figure 48. Distribution of natural and current daily changes in discharge (rise and fall) for stormflow, Barwon River Geelong.

SECTION 4 Hydrology
69
6: Birregurra Creek (Ricketts Marsh:233211)
0.1
1.0
10.0
100.0
1,000.0
0 20 40 60 80 100
Percent of time rate of rise higher / rate of fall lower
Rat
e o
f ch
ang
e p
er d
ay (
ML
)
Natural Winter Fall Current Winter FallNatural Winter Rise Current Winter Rise
6: Birregurra Creek (Ricketts Marsh:233211)
0.1
1.0
10.0
100.0
1,000.0
0 20 40 60 80 100
Percent of time rate of rise higher / rate of fall lower
Rat
e o
f ch
ang
e p
er d
ay (
ML
)
Natural Summer Fall Current Summer FallNatural Summer Rise Current Summer Rise
Figure 49. Distribution of natural and current daily changes in discharge (rise and fall) for stormflow, Birregurra Creek.
7: Boundary Creek (Yeodene:233228)
0.1
1.0
10.0
100.0
0 20 40 60 80 100
Percent of time rate of rise higher / rate of fall lower
Rat
e o
f ch
ang
e p
er d
ay (
ML
)
Natural Winter Fall Current Winter FallNatural Winter Rise Current Winter Rise
7: Boundary Creek (Yeodene:233228)
0.1
1.0
10.0
100.0
0 20 40 60 80 100
Percent of time rate of rise higher / rate of fall lower
Rat
e o
f ch
ang
e p
er d
ay (
ML
)
Natural Summer Fall Current Summer FallNatural Summer Rise Current Summer Rise
Figure 50. Distribution of natural and current daily changes in discharge (rise and fall) for stormflow, Boundary Creek.

SECTION 4 Hydrology
70
8: Mid-Leigh River (Mount Mercer:233215)
1
10
100
1,000
10,000
0 20 40 60 80 100
Percent of time rate of rise higher / rate of fall lower
Rat
e o
f ch
ang
e p
er d
ay (
ML
)
Natural Winter Fall Current Winter FallNatural Winter Rise Current Winter Rise
8: Mid-Leigh River (Mount Mercer:233215)
1
10
100
1,000
10,000
0 20 40 60 80 100
Percent of time rate of rise higher / rate of fall lower
Rat
e o
f ch
ang
e p
er d
ay (
ML
)
Natural Summer Fall Current Summer FallNatural Summer Rise Current Summer Rise
Figure 51. Distribution of natural and current daily changes in discharge (rise and fall) for stormflow, Mid-Leigh River.
9: Lower-Leigh River (Inverleigh:233209)
1
10
100
1,000
10,000
0 20 40 60 80 100
Percent of time rate of rise higher / rate of fall lower
Rat
e o
f ch
ang
e p
er d
ay (
ML
)
Natural Winter Fall Current Winter FallNatural Winter Rise Current Winter Rise
9: Lower-Leigh River (Inverleigh:233209)
1
10
100
1,000
10,000
0 20 40 60 80 100
Percent of time rate of rise higher / rate of fall lower
Rat
e o
f ch
ang
e p
er d
ay (
ML
)
Natural Summer Fall Current Summer FallNatural Summer Rise Current Summer Rise
Figure 52. Distribution of natural and current daily changes in discharge (rise and fall) for stormflow, Lower-Leigh River.
Natural maximum rates of rise and fall
Rates of rise and fall are so variable between events and within events that it is not possible to characterise them with a single value. Natural variability of rates of rise and fall should be preserved in any environmental flow regime. High rates of rise and fall are an important dimension of the disturbance effect of freshes and floods, and should be retained. However, rates of rise and fall should not exceed the natural maximum rates. The maximum rates of rise and fall were calculated for each site for every defined winter and summer storm event, for natural and current conditions (Figure 53 to Figure 61).
The characterisation of maximum daily rates of rise revealed that rates of rise were commonly equal to, or very close to, the magnitude of the peak of the event, which means that the hydrograph often rose within one day, regardless of the magnitude of the event. The maximum rate of rise varied for events of the same peak magnitude, but for most events half of the event peak was reached in one day, and very few events

SECTION 4 Hydrology
71
had a maximum daily rate of rise that was lower than one tenth of the event peak. Relatively low magnitude events (freshes) generally had lower rates of rise than the larger events. There was no obvious difference in the maximum rate of rise between summer and winter.
The characterisation of maximum daily rates of fall revealed that rates of fall were rarely higher than 80% - 90% of the event peak magnitude, but more commonly around 50% of the peak magnitude or less. This means that the storm event often declined to half its peak value in one day. The relative rates of fall tended to be higher for the larger rivers. The Leigh River in particular had relatively high maximum rates of recession.
Although not illustrated here, the differences in maximum rates of rise and fall between natural and current conditions were examined. The patterns of differences were revealed to be similar to those apparent in the overall distributions of rates of rise and fall (which included all rises and falls that occurred in storm events, not just the maximum rates) (Figure 44 to Figure 52).

SECTION 4 Hydrology
72
1A: Barwon River at downstream of West Barwon Dam
1
10
100
1,000
10,000
1 10 100 1,000 10,000Event peak (daily discharge in ML/d)
Max
. dai
ly r
ate
of
rise
fo
r ev
ent
(ML
/d)
Winter
Summer
100%
50%
10%
1A: Barwon River at downstream of West Barwon Dam
1
10
100
1,000
10,000
1 10 100 1,000 10,000Event peak (daily discharge in ML/d)
Max
. dai
ly r
ate
of
fall
for
even
t (M
L/d
)
Winter
Summer
100%
50%
10%
Figure 53. Maximum rates of daily changes in discharge (rise and fall) for each defined stormflow event for natural and current conditions for Barwon River downstream of West Barwon Dam. Lower tails of distributions truncated from graphs. Lines indicate where maximum daily rise or fall of discharge in event is 100%, 50% and 10% of event peak magnitude.
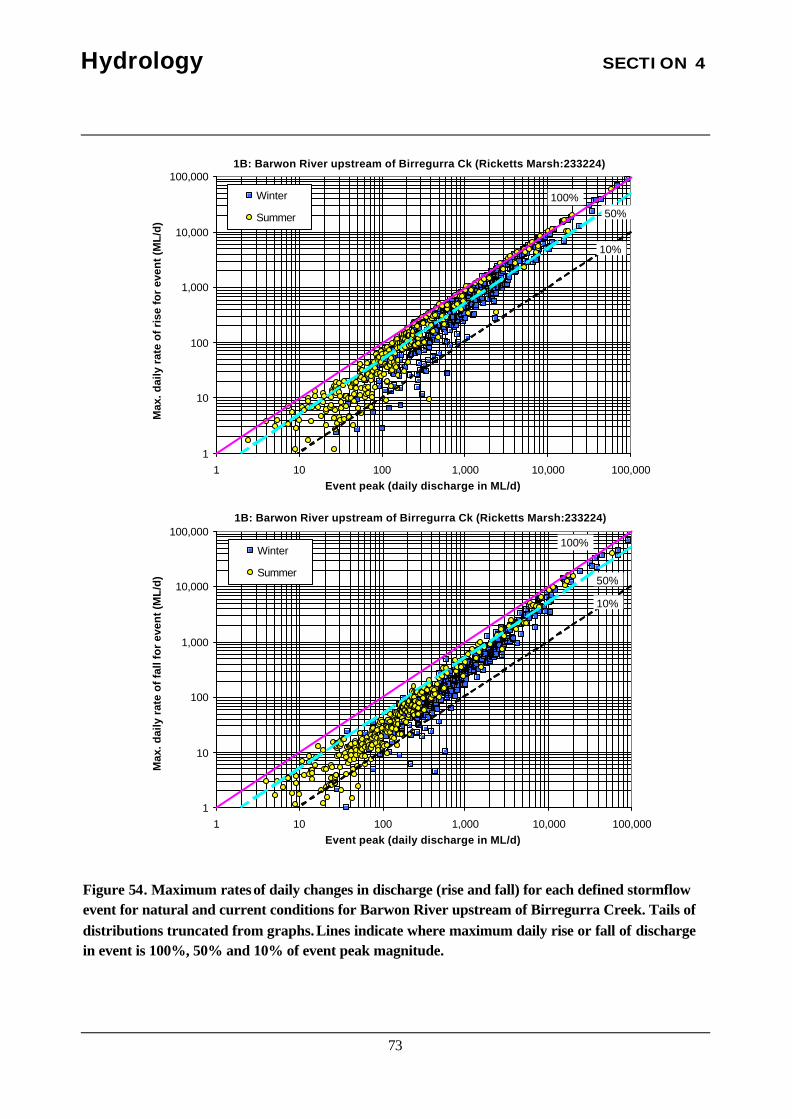
SECTION 4 Hydrology
73
1B: Barwon River upstream of Birregurra Ck (Ricketts Marsh:233224)
1
10
100
1,000
10,000
100,000
1 10 100 1,000 10,000 100,000Event peak (daily discharge in ML/d)
Max
. dai
ly r
ate
of
rise
fo
r ev
ent
(ML
/d)
Winter
Summer
100%50%
10%
1B: Barwon River upstream of Birregurra Ck (Ricketts Marsh:233224)
1
10
100
1,000
10,000
100,000
1 10 100 1,000 10,000 100,000Event peak (daily discharge in ML/d)
Max
. dai
ly r
ate
of
fall
for
even
t (M
L/d
)
Winter
Summer
100%
50%
10%
Figure 54. Maximum rates of daily changes in discharge (rise and fall) for each defined stormflow event for natural and current conditions for Barwon River upstream of Birregurra Creek. Tails of distributions truncated from graphs. Lines indicate where maximum daily rise or fall of discharge in event is 100%, 50% and 10% of event peak magnitude.

SECTION 4 Hydrology
74
2: Barwon River Winchelsea (Inverleigh:233218)
10
100
1,000
10,000
100,000
10 100 1,000 10,000 100,000Event peak (daily discharge in ML/d)
Max
. dai
ly r
ate
of
rise
fo
r ev
ent
(ML
/d)
Winter
Summer
100%
50%
10%
2: Barwon River Winchelsea (Inverleigh:233218)
10
100
1,000
10,000
100,000
10 100 1,000 10,000 100,000Event peak (daily discharge in ML/d)
Max
. dai
ly r
ate
of
fall
for
even
t (M
L/d
)
Winter
Summer
100%
50%
10%
Figure 55. Maximum rates of daily changes in discharge (rise and fall) for each defined stormflow event for natural and current conditions for Barwon River Winchelsea. Tails of distributions truncated from graphs. Lines indicate where maximum daily rise or fall of discharge in event is 100%, 50% and 10% of event peak magnitude.

SECTION 4 Hydrology
75
3: Barwon River Murgheboluc (Pollocksford:233200)
100
1,000
10,000
100,000
100 1,000 10,000 100,000Event peak (daily discharge in ML/d)
Max
. dai
ly r
ate
of
rise
fo
r ev
ent
(ML
/d)
Winter
Summer
100%
50%
10%
3: Barwon River Murgheboluc (Pollocksford:233200)
100
1,000
10,000
100,000
100 1,000 10,000 100,000Event peak (daily discharge in ML/d)
Max
. dai
ly r
ate
of
fall
for
even
t (M
L/d
)
Winter
Summer
100%
50%
10%
Figure 56. Maximum rates of daily changes in discharge (rise and fall) for each defined stormflow event for natural and current conditions for Barwon River Murgheboluc. Tails of distributions truncated from graphs. Lines indicate where maximum daily rise or fall of discharge in event is 100%, 50% and 10% of event peak magnitude.

SECTION 4 Hydrology
76
4: Barwon River Geelong (Geelong:233217)
100
1,000
10,000
100,000
100 1,000 10,000 100,000Event peak (daily discharge in ML/d)
Max
. dai
ly r
ate
of
rise
fo
r ev
ent
(ML
/d)
Winter
Summer
100%
50%
10%
4: Barwon River Geelong (Geelong:233217)
100
1,000
10,000
100,000
100 1,000 10,000 100,000Event peak (daily discharge in ML/d)
Max
. dai
ly r
ate
of
fall
for
even
t (M
L/d
)
Winter
Summer
100%
50%
10%
Figure 57. Maximum rates of daily changes in discharge (rise and fall) for each defined stormflow event for natural and current conditions for Barwon River Geelong. Tails of distributions truncated from graphs. Lines indicate where maximum daily rise or fall of discharge in event is 100%, 50% and 10% of event peak magnitude.

SECTION 4 Hydrology
77
6: Birregurra Creek (Ricketts Marsh:233211)
1
10
100
1,000
1 10 100 1,000Event peak (daily discharge in ML/d)
Max
. dai
ly r
ate
of
rise
fo
r ev
ent
(ML
/d)
Winter
Summer
100%
50%
10%
6: Birregurra Creek (Ricketts Marsh:233211)
1
10
100
1,000
1 10 100 1,000Event peak (daily discharge in ML/d)
Max
. dai
ly r
ate
of
fall
for
even
t (M
L/d
)
Winter
Summer
100%
50%
10%
Figure 58. Maximum rates of daily changes in discharge (rise and fall) for each defined stormflow event for natural and current conditions for Birregurra Creek. Lower tails of distributions truncated from graphs. Lines indicate where maximum daily rise or fall of discharge in event is 100%, 50% and 10% of event peak magnitude.

SECTION 4 Hydrology
78
7: Boundary Creek (Yeodene:233228)
1
10
100
1,000
1 10 100 1,000Event peak (daily discharge in ML/d)
Max
. dai
ly r
ate
of
rise
fo
r ev
ent
(ML
/d)
Winter
Summer
100%
50%
10%
7: Boundary Creek (Yeodene:233228)
1
10
100
1,000
1 10 100 1,000Event peak (daily discharge in ML/d)
Max
. dai
ly r
ate
of
fall
for
even
t (M
L/d
)
Winter
Summer
100%
50%
10%
Figure 59. Maximum rates of daily changes in discharge (rise and fall) for each defined stormflow event for natural and current conditions for Boundary Creek. Lower tails of distributions truncated from graphs. Lines indicate where maximum daily rise or fall of discharge in event is 100%, 50% and 10% of event peak magnitude.

SECTION 4 Hydrology
79
8: Mid-Leigh River (Mount Mercer:233215)
10
100
1,000
10,000
10 100 1,000 10,000Event peak (daily discharge in ML/d)
Max
. dai
ly r
ate
of
rise
fo
r ev
ent
(ML
/d)
Winter
Summer
100%
50%
10%
8: Mid-Leigh River (Mount Mercer:233215)
10
100
1,000
10,000
10 100 1,000 10,000Event peak (daily discharge in ML/d)
Max
. dai
ly r
ate
of
fall
for
even
t (M
L/d
)
Winter
Summer
100%
50%
10%
Figure 60. Maximum rates of daily changes in discharge (rise and fall) for each defined stormflow event for natural and current conditions for Mid-Leigh River. Tails of distributions truncated from graphs. Lines indicate where maximum daily rise or fall of discharge in event is 100%, 50% and 10% of event peak magnitude.

SECTION 4 Hydrology
80
9: Lower-Leigh River (Inverleigh:233209)
10
100
1,000
10,000
10 100 1,000 10,000Event peak (daily discharge in ML/d)
Max
. dai
ly r
ate
of
rise
fo
r ev
ent
(ML
/d)
Winter
Summer
100%
50%
10%
9: Lower-Leigh River (Inverleigh:233209)
10
100
1,000
10,000
10 100 1,000 10,000Event peak (daily discharge in ML/d)
Max
. dai
ly r
ate
of
fall
for
even
t (M
L/d
)
Winter
Summer
100%
50%
10%
Figure 61. Maximum rates of daily changes in discharge (rise and fall) for each defined stormflow event for natural and current conditions for Lower-Leigh River. Tails of distributions truncated from graphs. Lines indicate where maximum daily rise or fall of discharge in event is 100%, 50% and 10% of event peak magnitude.

SECTION 4 Hydrology
81
4.15 Summary
The analysis characterised the hydrology of the Barwon River catchment at nine sites in terms of frequency-magnitude-duration of the FLOWS flow components. These characteristics were compared for modelled natural and current flow conditions (results summarised in (Figure 7 and Figure 8. The results of the analysis are presented as a series of look-up tables and plots that provide information on central tendency and variability. This information is provided to minimize subjectivity in the expert panel process when specifying the characteristics of environmental flows required to achieve the geomorphological and ecological objectives.

SECTION 4 Hydrology
82
Table 7. Summary of the impacts of regulation on hydrology, Barwon River main stem.
Flow Component/Index
1A: D/S West Barwon Dam
1B: U/S Birregurra Creek
2: Winchelsea 3: Murgheboluc 4: Geelong
Annual discharge
-61% (reservoir harvesting)
-9% (harvesting and diversions)
-0.4% (harvesting and divers ions)
-3% (reservoir harvesting and diversions offset by Lough Calvert
discharges)
-13% (upper Barwon diversions + Leigh River and Moorabool River diversions)
Cease to flow Frequency reduced by a factor of 5 due to harvesting; duration reduced (Note: ceas e to flow introduced in winter)
No major change in frequency or duration
Frequency reduced by a factor of 5; duration increased by factor of 3
Cease to flow did not naturally occur Cease to flow did not naturally occur
Summer low flows
Higher range of low flows replaced by passing flows of 5 ML/d; no change to duration
Higher range of low flows reduced in magnitude by 5 – 10 ML/d due to water harvesting; no change to duration
Higher range of low flows reduced in magnitude by 5 – 10 ML/d; no change to duration
Higher range of low flows reduced by 10 ML/d; Lower range of low flows increased in magnitude by 10 ML/d possibly due to transfer of flows from the Lake Corangamite/Woady Yaloak River diversion scheme via Warrambine Creek; no change to duration
Higher range of low flows reduced by 10 – 20 ML/d; Lower range of low flows increased in magnitude by 10 ML/y possibly due to transfer of flows from the Lake Corangamite/Woady Yaloak River diversion scheme via Warrambine Creek; no change to duration
Low flow freshes Reduced frequency due to harvesting; no change to event duration
Reduced frequency due to harvesting; no change to event duration
Reduced frequency; no change to event duration
Reduced frequency; no change to event duration
Reduced frequency; no change to event duration
High baseflows Magnitude reduced - confined to the range of 4 – 5 ML/d due to passing flows; increased duration
Impacted by reduced baseflows from Dam and diversions; no change to duration
Impacted by reduced baseflows from Dam; no change to duration
Higher baseflows have increased in magnitude by 100 ML/d to 200 ML/d; no change to duration
Higher baseflows have increased in magnitude by 100 ML/d to 200 ML/d; no major change to duration
High flow freshes
Reduced frequency; no change to event
Reduced frequency; no change to event
Reduced frequency; no change to event
Reduced frequency; no change to event duration; reduced rates of rise
Reduced frequency; no change to event duration; reduced rates of rise and fall
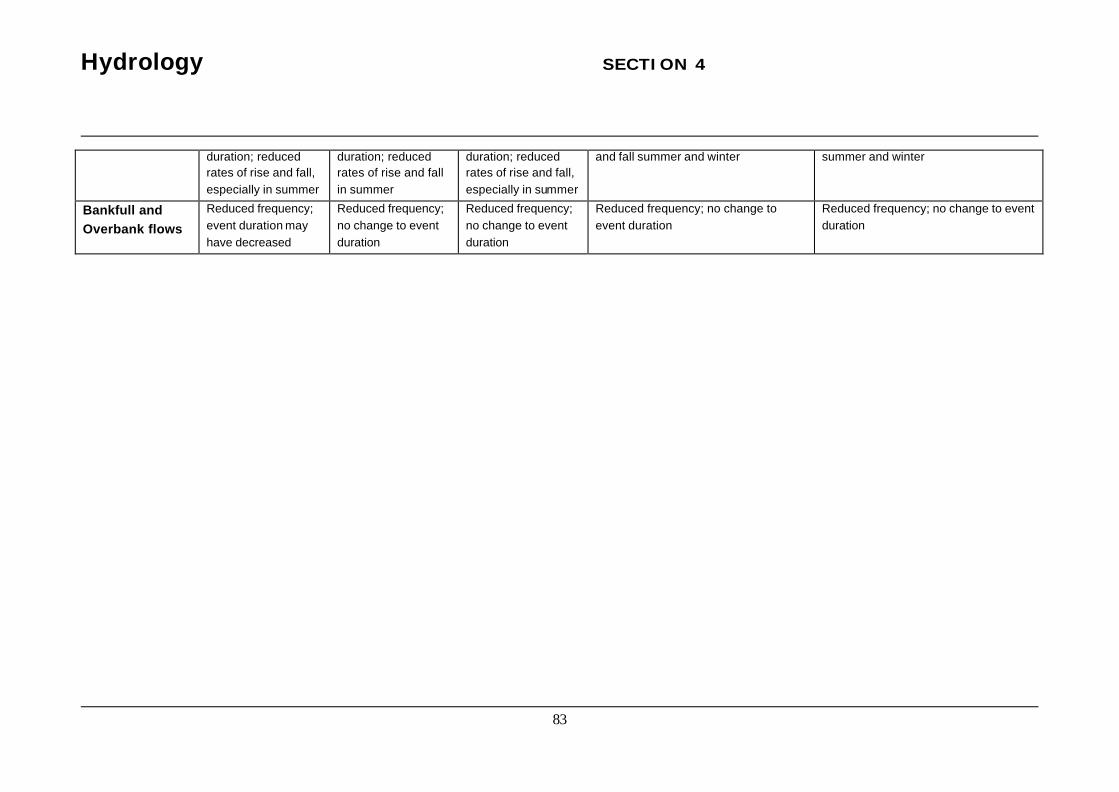
SECTION 4 Hydrology
83
duration; reduced rates of rise and fall, especially in summer
duration; reduced rates of rise and fall in summer
duration; reduced rates of rise and fall, especially in summer
and fall summer and winter summer and winter
Bankfull and Overbank flows
Reduced frequency; event duration may have decreased
Reduced frequency; no change to event duration
Reduced frequency; no change to event duration
Reduced frequency; no change to event duration
Reduced frequency; no change to event duration

SECTION 4 Hydrology
84
Table 8. Summary of the impacts of regulation on hydrology, Barwon River tributaries.
Flow Component/Index
6: Birregurra Creek 7: Boundary Creek 8: Mid-Leigh 9: Lower Leigh
Annual discharge + 403% (Lough Calvert discharges) -21% (groundwater pumping and catchment
dams)
-6% (reservoir harvesting) -9% (reservoir harvesting)
Cease to flow No major change in frequency or duration (Note: cease to flow naturally occurs in winter and summer)
No change in frequency or duration (Note: cease to flow naturally occurs in winter and summer)
Cease to flow eliminated by discharges from Ballarat WWTP and Ballarat Goldfield discharges
Cease to flow eliminated by discharges from Ballarat WWTP and Ballarat Goldfield discharges
Summer low flows Increased in magnitude by up to 50 ML/d; no change to duration
Decreased in magnitude by 1 ML/d probably due to groundwater pumping; no change to duration
Lower range of low flows increased in magnitude by 10 ML/d due to discharges from Ballarat WWTP and Ballarat Goldfield discharges; increase in duration
Lower range of low flows increased in magnitude by 10 ML/d d due to discharges from Ballarat WWTP and Ballarat Goldfield discharges; increase in duration
Low flow freshes Reduced frequency; no change to event duration
Reduced frequency; no change to event duration
No major change to frequency or event duration
Reduced frequency; event duration decreased by around 2 – 5 days
High baseflows Lough Calvert discharges increased the magnitude by up to 150 ML/d; duration increased
Slightly reduced magnitude; no change to duration
Relatively small reduction in magnitude; no change to duration
Relatively small reduction in magnitude; no change to duration
High flow freshes 1:1 year (winter only) flood peak magnitude increased but the 2:1 year (winter only) flood peak magnitude decreased; no change to event duration; increased rates of rise and fall especially in winter
Reduced frequency; no change to duration; reduced rates of rise and fall summer and winter
No change to frequency; no change to event duration; increased rates of rise and fall summer and winter
Reduced frequency; event duration decreased by around 2 – 5 days; increased rates of rise and fall in summer
Bankfull and Overbank flows
Reduced frequency; no change to event duration
No change to frequency; no change to event duration
No change to frequency; event duration may have decreased
No change to frequency; event duration may have decreased

SECTION 5 Environmental Values and Current Condition
85
5 Environmental Values and Current Condition
5.1 Stream Condition
The rivers and streams of the Barwon cacthment are in a relatively degraded condition, with the majority of the system in marginal or poor condition and only 7% in good condition as measured by the Index of Stream Condition (Table xx; Figure zz; CCMA 2005).
Table 9. Index of Stream Condition Results for the Barwon Catchment.
Rating Number of Reaches
% Length Reaches
Excellent - 0%
Good 3 7% 16, 24, 26
Marginal 9 39% 2, 4, 9, 10, 12, 19, 20, 22, 25
Poor 11 33% 1, 3, 5, 8, 15, 17, 18, 23, 27, 29, 30
Very Poor 3 15% 6, 14, 21
The individual scores for the index of stream condition assessment (Table xx) show that, generally, the physical form and water quality are in better condition; the hydrology indicator is variable but poor results are evident in the streamside zone and aquatic life indices. In general, this has resulted from land clearance and river regulation which in turn results in poor habitat conditions in both the riparian and aquatic zones of the system.
Table 10. Reach Index of Stream Condition Scores for the Barwon Catchment.
Stream Name
Reach Hydrology Physical Form
Streamside Zone
Water Quality
Aquatic Life
Total Condition
1 5 5 4 - - 24 Poor
2 5 8 4 6 6 26 Marginal
3 5 8 2 - 5 21 Poor
4 5 6 4 6 9 26 Marginal
5 4 4 4 8 - 22 Poor
27 7 3 3 - 5 20 Poor
Barwon River
28 - - - - - - n/a
11 6 - - - - 24 Poor Leigh River 12 6 6 5 6 5 27 Marginal

SECTION 5 Environmental Values and Current Condition
86

SECTION 5 Environmental Values and Current Condition
87
Figure 62. Index of Stream condition scores for the Barwon Catchment
5.2 Water Quality
Salinity is low in the upper parts of the catchments but is about 2000 mg/l downstream of the Leigh River and where other tributaries join the Barwon main stem. Birregurra Creek, has historically received saline inflows from the nearby Lough Calvert Drainage Scheme from Lake Colac catchment. These inflows have resulted in this stream having high median salinities (8700 mg/l) which has limited the range of aquatic flora and fauna able to inhabit this system. However, perhaps due to the improved operation of the drainage schemes, or relatively dry weather, there is a significant, decreasing, salinity trend at Birregurra Creek, the Barwon @ Whittlesea and the Barwon @ Pollocksford (Smith & Nathan 1999).
Table 11. Water quality data from the Barwon Catchment; (source: VWQMN Data Warehouse (cumulative data) www.vicwaterdata.net/vicwaterdata) .
WQ Parameters (medians) Reach Name (Number)
Site No.
EC (µS/cm) TN (mg/l) TP (mg/l) pH Turbidity (NTU)
Upper Barwon (1) 233214 (Forrest) 150 0.193 0.03 7.0 4
233224 (Ricketts Marsh)
880 0.55 0.32 7.2 9.25 Winchelsea (2)
233218 (Inverleigh)
1900 0.72 0.047 7.6 7.4
Murgheboluc Valley (3)
233200 (Pollocksford)
2000 1.15 0.18 7.9 3.2
Geelong (4) 003361 (Queens Bridge)
1600 1.24 0.14 7.85 -
Birregurra Creek (6) 233211 (Ricketts Marsh)
8700 2.31 0.3 8.6 10.45
Boundary Creek (7) 233228 (Yeodene) 560 0.72 0.02 5.6 8.1
Mid Leigh River (8) 233215 (Mt Mercer)
1200 3.4 0.64 8.1 4.6

SECTION 5 Environmental Values and Current Condition
88
Nutrients follow the same pattern with quite high levels throughout the catchment with the exception of the highland areas. The Leigh River receives high levels of nutrients from STP outfalls from Ballarat and the nutrient levels at Mt Mercer are still the highest in the catchment despite this being many kilometres downstream of the outfalls. Smith & Nathan (1999) reported that there is a significant increasing nitrogen trend in the mid-Leigh River. Interestingly, there is a significant decreasing phosphorus trend at the same location (mid-Leigh River) which is hard to explain (Smith & Nathan 1999).
pH is mostly neutral or mildly alkaline across the catchment but Boundary creek has relatively acid waters. There is a significant, decreasing, pH trend at Boundary Creek as well as at the Upper Barwon @ Forrest and the Barwon @ Inverleigh (Smith & Nathan 1999).
Turbidity is low across the catchment, being generally below 10 NTU and rarely exceeding 50 NTU in extreme events.
5.3 Geomorphology
Premable
The key focus for fluvial geomorphology investigation in environmental flow assessments is in linking physical channel structural characteristics (or geomorphic units) to the ecological processes that have been identified as important. This is principally about determining the characteristics of:
• Flows that are important for maintaining certain desirable hydraulic conditions (as hydraulic conditions of depth and velocity are highly dependent on channel morphology);
• Flows that ensure the formation or maintenance of desirable in-channel forms (such as benches, bars, undercut benches etc), and;
• Flows that will maintain sediment transport processes that will scour pools and bed surfaces, maintain substrates by removing surface and interstitial fines, and maintain gross bed structures such as riffles.
Geomorphic features and processes have no inherent “value” but they impart stream values through their importance in providing a dynamic physical template for ecological processes to proceed. The discussion below describes the geomorphic character of the streams based on a field inspection conducted on 15th to 17th June 2005, and supported by information from the literature.
Methods
In the hierarchy of geomorphological methodologies suitable for application in environmental flow assessments (Gippel, 2002), the sedimentological is the most physically-based and should produce the most realistic results. The basic data needs of the sedimentological method are: particle size data for the

SECTION 5 Environmental Values and Current Condition
89
river sediments of interest, usually riffle sediments (which can be surveyed in the field); critical shear stress values for mobilisation of these sediments (derived from established formula in the published literature); critical shear stress values for removing any plants on the bed surface that prevent mobilisation of bed sediments (derived from empirical values in the published literature); and, shear stress distributions for the river at various flow levels (an output of HEC-RAS hydraulic modelling). Thus, the sedimentological method has been selected for use in the Barwon River environmental flows study. The method does need to be applied with a level of caution. The reliance on critical shear stress values as the trigger for a sediment movement event is theoretically defensible, and can be used to specify a series of flow events that will create the sediment mobilisation events that are thought to be ecologically important. However, natural flow regimes are composed of a multitude of events with varying shear stress conditions. There is currently a lack of knowledge regarding the importance of frequency and duration of various shear stress conditions, both from the perspective of ‘completing’ the geomorphic process of sediment movement, and from the perspective of facilitating the desirable ecological processes.
The sedimentological methodology is a numerical approach to predicting the flows required for geomorphic processes. As such, input data are required. The numerical data consist of the topographic transect surveys of the channel, estimates of roughness and slope, and measurements of particle size. Qualitative data consisting of descriptions of the in-channel and floodplain features are also required. Finally, the geomorphic assessment requires assessment of past and present threats to the geomorphic character of the stream. Stream channel geomorphology is dynamic over a range of time scales, but if the rates of geomorphic processes are accelerated or slowed beyond the natural range, there could be detrimental ecological consequences. Thus, the present geomorphic character requires interpretation from the perspective of past disturbances (if any) and possible future trajectories of change – this interpretation generates the geomorphic “issues” relevant to an environmental flows assessment. The time constraints of the FLOWS method mean that the basis of this interpretation is largely professional judgement, supported by any available information from previous studies.
Data is required regarding bed material particle size. For wadable streams with bed particle sizes in the range gravel (2 mm) to boulder (2 m), the particle size distribution can be determined using a pebble count. Wolman first described the method as requiring manual collection of at least 100 particles from the stream bed, using a random selection process (Gordon et al., 2004, p. 105). The best way to achieve this is to traverse the bed in a zigzag pattern, stopping at a consistent interval, say every second sep, and selecting the particle under either the right or left toe (being consistent). The method must be random, so it is important to avoid selectively picking particular sized particles. Unlike the pebble selection process, which is random, the location of the site for the pebble count is determined on the basis of the objective of the investigation. Normally, the issue of ecological, and therefore geomorphic, interest is mobilisation of bed material on riffles. Thus, the survey should be done on a representative riffle, with the traverse running fully across and along the selected riffle.
The randomly sampled individual gravels, cobbles and boulders can be directly measured in the field using a retractable tape measure. Ideally, the three axes are measured: the A or longest axis, the B or intermediate axis, and the C or shortest axis. The B axis is the shortest axis of the plane of the largest area perpendicular to the C axis. The A axis is measured perpendicular to the B axis – it is not the longest, corner to corner length (Gordon et al., 2004, p. 117-118). The mean diameter of the particle is the average of the three axis lengths. The process can be speeded by measuring only the B axis, which gives a
SECTION 5 Environmental Values and Current Condition
90
reasonable representation of the mean diameter. The B axis determines whether or not an individual particle will fall through a mesh of a given size, thus explaining why it is the most useful measure of the three axes.
The FLOWS method requires that the field observations and other field requirements (such as pegging transects for cross-section survey) be completed in a fairly rapid time frame. For this reason the standard sampling requirement of 100 particles was relaxed for the Barwon River [as Gordon et al. (2004, p. 105) did for the Acheron River], counting a sample size of 30 – 50 particles, with only the B axis measured. The survey was undertaken on at least one representative riffle at each site, with the traverse covering the entire riffle width and most of the shallow length. The particle size survey was only undertaken when the bed particle size was gravel or greater. For beds composed of fine-grained material, the texture of the particles was determined by tactile and visual estimation.
Bed material particle size
The majority of the upper Barwon River catchment drains fine-grained sedimentary material, which gives rise to clay and silt rich stream beds. Where the river flows through the volcanic plains it has cut through the thin basalt into the underlying fine grained (mostly clay) Tertiary sediments, so streams beds are hard basal clay, occasionally interrupted by outcropping basalt, and with sandy bars formed from material supplied by bank erosion. The Leigh River drains sedimentary and volcanic material in the upper catchment, which provides a range of sediment sizes. Where it cuts through the basalt through the gorge the river bed is controlled by bedrock, with the mobile bed material formed by locally supplied large-sized blocky basalt, and sandy deposits of material supplied from erosion of banks and gullies upstream. The river flows out of the gorge onto wide alluvial flats at Shelford, where it has incised into the hard clay bed. The river does not have the power to transport the cobble sized-material, but it does continue to transport (albeit at a slower rate) the sand-sized material from upstream. After the Leigh River joins the Barwon River, the river system flows though another steeper tract of basalt, where the bed material is a mixture of locally derived blocky basalt of cobble and boulder size forming controls at riffles, and finer cobbles, gravels and sands within riffles, in pools and forming benches. Further downstream the gradient declines and the river cannot transport coarse-grained material. Here, the river flows through fine-grained swampy deposits.
Material larger than fine gravel was observed at two of the eight reaches investigated: lower Barwon River in the Murgheboluc Valley and the gorge of the Mid-Leigh River (Figure 63). The coarsest bed material was observed in the riffle at the top end of the reach of the Barwon River at Murgheboluc Valley (David Cotsell’s property). The riffle sampled in the Mid-Leigh River in the gorge (Wilma Webb’s property) was also very coarse. The bed material in the channels skirting the island in the Barwon River at the Murgheboluc site was finer grained, with the right (main) channel being a little finer than the left. A low, grassed, coarse sand/gravel bench was observed on the left bank at this site. The gravel component was sampled at this site.

SECTION 5 Environmental Values and Current Condition
91
10
100
1000
0 10 20 30 40 50 60 70 80 90 100Percentage finer than indicated size
Par
ticle
siz
e (m
m)
Upper riffle, Barwon River at Murgheboluc Valley
Right channel around Island, Barwon River at Murgheboluc Valley
Left channel around Island, Barwon River at Murgheboluc Valley
Gravel on bench, Barwon River at Murgheboluc Valley
Lower riffle, Mid-Leigh River
Figure 63. Particle size distributions of sampled bed material for Barwon River at Murgheboluc Valley and Mid-Leigh River in the gorge downstream of Mt Mercer Gauge.

SECTION 5 Environmental Values and Current Condition
92
Table 12. Particle size of bed material of the Barwon River
Reach Fluvial component Bed particle calibre (range) D50
River main stem
1. Upper Barwon
Bed Silt-clay 0.008 mm (estimated)
2. Winchelsea Bed Hard basal clay overlain by coarse sand bars in places
1 mm (estimated for sand bars)
Riffle Very coarse gravel to medium boulder – poorly to moderately sorted
195 mm (large cobble)
Right channel around island
Very coarse gravel to small boulder – moderately sorted
55 mm (very coarse gravel)
Left channel around island
Very coarse gravel to large cobble – well sorted
60 mm (very coarse gravel)
3. Murgeboluc Valley
Left low bench 50% coarse sand, 50% medium to very coarse gravel – very well sorted
21.5 mm (coarse gravel – for gravel component only)
4. Geelong Bed
5. Estuary Bed Not sampled -
Tributaries
6. Birregurra Ck Bed Silt-clay 0.008 mm (estimated)
7. Boundary Ck Bed Hard basal clay, with fine red coloured silt deposits in organic matts
0.015 mm (estimated for red silt)
8. Mid-Leigh River
Bed Very coarse gravel to small boulder – moderately sorted
170 mm (large cobble)
9. Lower-Leigh River
Bed Hard basal clay extensively overlain by coarse sand
1 mm (es timated for sand deposits)
Reach 1 – Upper Barwon River (Dam to Birregurra Ck junction)
The fluvial geomorphology of the river channel through this reach varies widely. In the upper part close to the West Barwon Dam the channel flows through the foothills and has a narrow floodplain confined by steep valley walls. Here the gradient is moderate, with the channel having a fine-grained bed. The channel width averages around 2-5 m, with pools 0.5-1.3 m deep (Tunbridge and Rogan, 2004). As the river emerges from the foothills onto the plain, the channel becomes shallow and wide, flowing through a wide partly-confined and sometimes unconfined floodplain. Toward Birregurra the channel averages 5-9 m in width and with pools to 2.2 m deep (Tunbridge and Rogan, 2004). Prior to European settlement most of the floodplain areas would have been swamps that were wet through the winter and spring. There may have been multiple meandering channels through these swamps. These floodplains have since been drained, by cutting drainage channels, and by channelising the main river channel.
The river was inspected by the Panel at Nellie Shalley’s property – just upstream of Boundary Creek confluence – where the natural morphology has been altered by channelisation. The former natural channel may have had pools, perhaps separated by sandy bars, variable width and high sinuosity. In

SECTION 5 Environmental Values and Current Condition
93
contrast, the channelised river has a constant width and depth and is relatively straight. The bed and banks are clay-rich silt (Table 12).
The artificial channel has been dug principally along the right hand side of the natural river channel. The channel was originally hand-dug, and has occasionally been cleared and dredged, the last time being around the mid-1970s. There is evidence of dredge spoil heaps along the banks. The channel is currently quite heavily infested with macrophytes. There are no pools or riffles in either the natural or artificial channel. The variability in the natural channel is mainly through patchy in-channel vegetation variation, and width variation. The natural channel is well vegetated, with an organic matted bed in most places. The natural channel and the artificial channel occasionally intersect such that for certain sections they are connected while in other sections they are disconnected.
Reach 2 – Winchelsea (Barwon River from Birregurra Ck junction to Leigh River junction)
In this reach the river has incised a narrow valley into the volcanic plain, with a narrow confined floodplain present within the valley. The bed of the river is partly bedrock controlled, although in many places it has eroded down to the underlying hard basal clay. The width of the channel in the upper part of the reach is around 10-12 m, with pools 1.5-2.3 m deep (Tunbridge and Rogan, 2004). Between Winchelsea and Inverleigh the river has some extensive pools. Here the width of the channel is around 17-25 m and pool depth is up to 4.7 m (Tunbridge and Rogan, 2004). Gravel may be present in some riffles (Tunbridge and Rogan, 2004). Some deep, potentially saline pools occur in this area as a result of groundwater intrusion near Lake Murdeduke (DCNR, 1995, p. 29), but the Panel did not observe these in the field.
The river was inspected by the Panel at Kildean Road, where the bed is mostly exposed hard clay, overlain in places by sandy bars (Table 12), usually associated with large woody debris accumulations. In other places, outcropping basalt exerts geomorphic control on the bed. Longitudinally the river consists of fairly shallow pools and runs through shallower areas with large woody debris, and occasional steeper riffles and cascades through exposed bedrock. The channel is incised into the basalt, with relatively narrow floodplain. The banks show evidence of bank slumping, which provides much of the upper bank cross-sectional variation. There is a low bench present in places.
Reach 3 – Murgheboluc Valley (Barwon River from Leigh River junction to Moorabool River junction)
In this reach the river has incised a narrow valley into the volcanic plain, with a narrow confined floodplain present within the valley. Through Murgheboluc the bed of the river is partly bedrock controlled. In the upper Murgheboluc part of the reach down to Ceres, the bed material is coarse, varying from cobbles/boulders to coarse sand (Figure 63, Table 12). The channel morphology is large deep pools, coarse steep riffles, islands, and steeply sloping banks. The banks of the river appear to be stable in this area.

SECTION 5 Environmental Values and Current Condition
94
The 1995 flood inundated the high bank on the left. A low bench is often apparent. This is coarse grained, with sand and gravel (Figure 63, Table 12). Vegetation is mostly grassed (poa) but in places this has been scoured, with deeper runners incised into the bench sediment. Through the island, most of the flow passes through the right channel. The island is heavily vegetated with grasses, shrubs and eucalypts.
Buckley’s Falls is a major bedrock outcrop located at the end of the reach, just above where the Moorabool River joins the Barwon River. Balm’s Weir has been constructed 400 m upstream of the Falls. The river between these features is a deep pool, under the hydraulic influence of the Falls (Tunbridge and Rogan, 2004). For a distance upstream of the Weir the Barwon River is under the hydraulic influence of the Weir, forming a pool environment. Upstream to Ceres the river has extensive pools in the flat, meandering channel (Tunbridge and Rogan, 2004), with cutoff channels present on the floodplain.
Reach 4 – Geelong (Barwon River from Moorabool River junction to Lower Breakwater)
The channel has incised a narrow valley into the volcanic plain, with a narrow confined floodplain present within the valley. This is an 18 km long reach of low sinuosity. The morphology is pools 4-6 m deep in a channel up to 59 m wide (Tunbridge and Rogan, 2004). Substrate is silt and clay (Tunbridge and Rogan, 2004).
Reach 6 – Birregurra Creek
Birregurra Creek has incised through the volcanic material to form a narrow and low gradient, partly confined channel. The floodplain alternates between a wide floodplain (about 100 – 150 m wide) and narrow constricted areas (about 10-20 m wide). The bed is composed of clay-rich silty material (Table 12) and lacks substantial pools. The channel was dry on the day of survey, but appeared to have very little lateral or longitudinal variability. The bed was clay rich fine silty loam, lacking macrophytes.
Reach 7 – Boundary Creek
The lower part of Boundary Creek has a relatively narrow floodplain (20 – 50 m wide), with an unconfined channel. The channel appears to be channelised and incised. The channel has a pool/run/riffle appearance, but the pools are formed by organic matts that form hydraulic controls. The pools are deep with a hard clay bed and the shallower areas are narrower and organic, formed by macrophytes and grasses that have confined the channel. The organic matted bed contains fine red sediment (clay and fine silt) (Table 12), with the likely origin being forestry roads and other local unsealed roads. The local bank material of Boundary Creek is black soil.
Reach 8 – Mid-Leigh River (Cambrian Hill to Quiney Hill)
Extensive gold mining occurred within the upper part of the Leigh River catchment since gold was discovered in 1851. Mining impacts influenced the river in two ways (Earth Tech, 2004). Firstly, alluvial mining literally turned over large areas of valley floor of the Leigh River between Ballarat and Garibaldi.

SECTION 5 Environmental Values and Current Condition
95
Floodplain deposits were removed in order to access gold bearing gravels. Secondly, mining on the valley hillsides removed large volumes of rock. The silt and sand fractions would have been washed from the tailings left on the floodplain and transported into the Leigh River (Earth Tech, 2004).
The headwater zone of the Leigh River is largely in the Ballarat urban area. Streams are bedrock confined, or have been in some cases completely rock armoured (Earth Tech, 2004). The Upper-Leigh River reach from Ballarat to Napoleons is partly confined, with extensive erosion of the gravel, silt and sandy banks (Earth Tech, 2004). Some cut and fill sub-catchment streams are located to the north west of the Upper-Leigh River catchment (west of the Yarrowee in the area of Dog Trap and Winter Creeks). Where gullied these sub-catchments form secondary sources of sediment to the Leigh River (Earth Tech, 2004).
The Mid-Leigh River, from Grenville to Willangi is a gorge. This is a high energy sediment transport zone that also contains sediment stores in bars and benches (Earth Tech, 2004). Through the gorge the river has a narrow valley floor with localised sediment accumulation occurring in the form of gravel and cobble bars or benches. Stream power during flood events would be high. Longitudinally the river contains pools of varying depth and length separated by bedrock-controlled rapids and cascades (containing boulders and cobbles).
The Panel inspected the reach downstream of the Mt Mercer gauge (Wilma Webb’s Property). Here the right bank is bedrock controlled. The left bank has a narrow floodplain constructed of coarse material mostly cobbles/small boulders (Figure 63, Table 12), covered by coarse sand. The narrow coarse-grained floodplain has a distinctive flood runner formed between each riffle. The runner leaves at the top of the riffle (the sill) and cuts down through the floodplain, emerging somewhere along the top end of the pool.
Reach 9 – Lower-Leigh River (Quiney Hill to confluence with Barwon River)
Just north of Shelford the valley widens to around 1.0 – 1.5 km in width (Earth Tech, 2004), forming the Lower-Leigh River reach. From Shelford, floodplains extend laterally for several kilometres down each side of the moderately sinuous channel (Earth Tech, 2004). The channel bed south of Shelford is reportedly homogenous and flat except at tight bends where scour occurs (Earth Tech, 2004). The sand deposits appear to be less extensive further downstream where the Panel inspected the river at Garry Wishart’s property. Here the channel long profile is controlled by large woody debris accumulations. Sand bars have developed around the woody debris and shallow pools are formed in-between these constrictions. The banks are steeply sloping incised silt/sand material, and erosion does not appear to be highly active. No benches are present, and the channel has a very simple cross-sectional form. The landholder reported the 1995 flood inundated the floodplain by 0.5 – 0.8 m.

SECTION 5 Environmental Values and Current Condition
96
Table 13. Flow components relevant to main geomorphic objectives for each reach and the method used for determination of flow thresholds
Geomorphic Objective Main Flow Components Method of flow threshold determination
Reaches where relevant
Movement of sand bed material to maintain bed morphological and hydraulic diversity.
High Flow Freshes Critical shear stress (Shields equation)
2, 3, 8, 9
Scour sediments from base of pools to maintain quantity and quality of pool habitat.
High Flow Freshes Critical shear stress (Shields equation)
2, 3, 4, 7, 8, 9
Prevent excessive macrophyte colonisation of the bed leading to channel capacity reduction and potential erosion.
High Flow Freshes Critical velocity for stem rupture
1, 2, 3, 4, 6, 7, 8, 9
Scour surficial and interstitial fine sediment from riffles and overturn bed substrate (gravels and cobbles where present).
Low Flow Freshes (surface) High Flow Freshes (interstitial), Bankfull and overbank flows (coarse bed material mobilisation)
Critical shear stress (Shields equation)
3, 8
Disturb riparian vegetation to provide new habitats and regeneration and to control riparian vegetation encroachment into stream channel.
High Flow Freshes and Bankfull Flows
Critical shear stress and velocity (from literature)
1, 2, 3, 4, 6, 7, 8, 9
Maintain channel form and key habitats, including undercuts, in-channel benches, and flood runners where present.
High Flow Freshes and Bankfull Flows
Morphologically defined levels
1, 2, 3, 4, 6, 7, 8, 9
Form large woody debris accumulations and scour pools around large woody debris.
High Flow Freshes and Bankfull Flows
Critical shear stress (Shields equation)
2, 3, 9
Maintain channels and inlets for connectivity of main channel with important floodplain and wetland zones (where present).
Bankfull Flows and Overbank flows
Morphologically defined bankfull
1, 2, 3, 4, 6, 7, 8, 9
Maintain downstream sediment transport processes to prevent incision and aggradation of the bed, and consequent accelerated bank erosion and changed flood frequency.
Effective flows (assume Bankfull Flow magnitude and frequency)
Morphologically defined bankfull
1, 2, 3, 4, 6, 7, 8, 9
Flow components to meet geomorphological objectives
Geomorphic objectives are closely linked to those for riparian and aquatic vegetation because of the role of vegetation in stabilising sediments. The geomorphic objectives are all connected to the processes of sediment mobilisation, transport and deposition, so High- and Low-Flow Freshes, Bankfull Flow and Overbank flow components are relevant (Table 13). Various methods are used to determine the flow

SECTION 5 Environmental Values and Current Condition
97
threshold to achieve the various geomorphic objectives (Table 13). The reaches are geomorphologically diverse, so only some of the geomorphic objectives are relevant to each reach (Table 13).
Riparian zone condition is relevant to achievement of geomorphological objectives. Bank stability is partly related to the integrity, coverage and structure of riparian vegetation. The health of the riparian zone vegetation is partly reliant on appropriate environmental flows, but it is also dependent on non-flow related factors. Riparian zone vegetation can be affected by stock access and invasion by pest plant species. The riparian zone is also the source of large woody debris, which interacts with the hydraulics and sediment dynamics in the channel to create habitat for various organisms. Stock access to the riparian zone can also directly affect bank stability and water quality, through pugging, trampling and other physical disturbance.
5.4 Vegetation and Aquatic Plant Communities
Reach 1 – Upper Barwon River (Dam to Birregurra Ck junction)
The structure of vegetation communities in this reach is closely related to the geomorphic setting. Below the West Barwon Reservoir the river has a relatively steep grade and has an incised and well defined channel. Riparian vegetation is confined to the banks of the stream and a narrow floodplain exists between surrounding hill slopes. Further downstream, where the study site for this investigation was located, the stream has a much lower grade and flows through a broad flat-bottomed valley. The flat retains features of a complex ‘chain of ponds’ environment despite the construction of a drain to reduce the spread of water.
The drain is approximately 4 m wide and appeared to have a depth of approximately 1.5 m on the day the site was visited. The vegetation of the drain is characteristic of low energy environments on deep, organic, waterlogged soils. The drain is lined by tall emergent macrophytes including Phragmites australis, Juncus procerus and Eleocharis sphacelata. A complex community of wetland herbs exists at ground level including Carex appressa, Persicaria descipiens, Poa labillardieri, *Ranunculus repens, *Rumex spp., Cyperus eragrostis and Triglochin procerum. Aquatic plants living within the channel include Myriophyllum caput-medusae, Azolla filiculoides and Lemna minor.
A complex wetland environment of shallow anabranches and billabongs exists adjacent to the watercourse and probably represents relicts of the original meandering path of the stream. On channel banks are stands of emergent macrophytes, particularly Juncus spp. and Carex appressa between grazed pasture grasses. The shallow depressions and channels support Triglochin procerum, *Rorippa nasturtium-aquaticum, Persicaria descipiens, Rumex brownii, Azolla filiculoides, Callitriche stagnalis and Myriophyllum caput-medusae.
Prior to drainage and land clearance, the entire flat is likely to have supported a continuous, extensive wetland habitat. The area near the drain is the low point in the flat and is likely to have featured permanent pools and beds of emergent macrophytes. The boggy conditions and frequent inundation of the flat outside the main flow path is likely to have supported Melaleuca squarrosa / Leptospermum lanigerum Swamp Forest, such as occurs in the nearby Barwon Downs Aquifer Outcrop areas (Carr 2002). The environment

SECTION 5 Environmental Values and Current Condition
98
has been changed considerably by the removal of native vegetation from the flat (excluding the watercourse), the establishment of pastures, the introduction of stock and the construction of the drain.
The presence of tall emergent vegetation and a dense, diverse community of aquatic herbs in or adjacent to the drain indicates that the site experiences prolonged, if not perennial, waterlogging. Stream energy is usually likely to be low and insufficient to up-root or wash vegetation from the site. When high flows do occur, the energy will be spread across the flat and will have a low scouring potential. The landholder reported that the drain requires regular excavation to prevent it becoming choked by aquatic vegetation.
The boggy nature of the soils and presence of wetland vegetation outside the main flow path suggested there is a shallow water table aquifer that is hydrologically linked to the watercourse.
The ecosystem cannot be considered ‘healthy’ in its current state due to the impacts of grazing and land clearance. The drain will have reduced the lateral extent of flow and reduced the extent of habitat available for wetland vegetation and Tea Tree (Melaleuca sp., Leptopsermum sp.). Tea Tree is believed to have been cleared from the flat. With the exception of the drain, these impacts are not related to flow.
A key consideration in restoring the reach to a health state should be the restoration of shrubby wetland vegetation on the flat and the provision of freshes to support its growth.
Key roles of flow in the structure and diversity of vegetation in this reach are:
• maintain a shallow water table with low salinity groundwater throughout the year;
• maintain prolonged, if not perennially, waterlogged condit ions in wetlands and relict channels adjacent to the drain that support perennial growth by emergent and semi-emergent aquatic plants;
• maintain likely permanent pools in the drain, which support perennial growth by aquatic macrophytes;
• inundate the flat immediately adjacent to the channel several times a year to support wetland plant growth; and
• inundate the flat several times every 2 years to retain potential Tea Tree habitat.
Reach 2 – Winchelsea (Barwon River from Birregurra Ck junction to Leigh River junction)
The Barwon River at this site has a clearly defined, steep-sided channel cut into a broad floodplain.
The sandy channel bed is interrupted by outcrops of basalt which form small riffles. The channel bed appears to be too energetic to support vegetation and is likely to experience high shear stresses and may be frequently reworked during high flows. The only vegetation observed was sparse Phragmites australis, Triglochin procerum and some *Pennisetum clandestinum that was encroaching from the bank.
Sandy sediments form shelves at the edge of the channel at several sites in this reach. The shelves provide a broad habitat for a range of semi-emergent and emergent species that otherwise occur in a very narrow strip at the base of the steep stream bank. Species present include Phragmites australis, Schoenoplectus

SECTION 5 Environmental Values and Current Condition
99
?validus, *Pennisetum clandestinum, *Paspalum distichum, Poa labillardieri, Bolboschoenus medianus, *Callitriche stagnalis, Schoenus sp. and Dichondra repens.
The vegetation becomes increasingly woody higher on the channel banks, approximately 1 to 2 m above the sandy shelves. Phragmites australis, Juncus sp. and Poa labillardieri persist in the understorey, but there are also shrubs and trees such as Eucalyptus camaldulensis, Acacia melanoxylon, Callistemon seiberi, Hymenanthera dentata, Leptospermum obovatum, *Fraxinus rotundifolia and *Ulex europaeus.
The floodplain has largely been cleared of native vegetation, but retains scattered Eucalyptus camaldulensis and Acacia melanoxylon. Adjacent to the bank some native understorey species persist, particularly Poa labillardieri.
The key roles of flow in the structure and diversity of vegetation in this reach are:
• maintain an open and diverse channel bed assemblage by knocking-down or up-rooting emergent vegetation and re-working stream bed sediments;
• re-work and deposit sediments to provide broad sandy benches that support a variety of emergent and semi-emergent aquatic plants;
• waterlog and frequently inundate these benches during winter and spring to support the growth of emergent and semi-emergent aquatic plants.
• maintain flow at or near the level of emergent riparian vegetation at the base of the bank during winter and spring;
• intermittently inundate this vegetation during summer and autumn; and
• temporarily inundate woody vegetation high on the stream bank several times every two years to support plant growth and promote germination and recruitment.
Reach 3 – Murgheboluc Valley (Barwon River from Leigh River junction to Moorabool River junction)
The stream has complex geomorphic features which proved a wide range of plant habitats.
In the upper part of the site, baseflow is concentrated into a single channel, and the stream does not support submerged or emergent vegetation. The stream is likely to experience high shear stresses which knock-down or uproot macrophytes. However in the lower part of the site, the baseflow flows via multiple channels. In this area emergent macrophytes grow in cobbles and gravel in areas with flowing water, particularly Phragmites australis, Schoenoplectus validus, Bolboschoenus sp. Triglochin procerum and *Pennisetum clandestinum.
The site features extensive benches and islands of coarse alluvium. The alluvium comprises gravels and cobbles which retain little soil moisture but allow plants to access hyporheic water at likely depths of more than 2 m. Dense beds of emergent macrophytes such as Phragmites australis, Schoenoplectus validus and Phalaris aquatica growing in the channel can extend on to benches and islands, usually up to 1 m above

SECTION 5 Environmental Values and Current Condition
100
the channel, particularly where the gradient is shallow. A steep gradient likely reflects greater exposure to shear stress and stands of Poa labillardieri are more common. At levels more than 1 m above the channel, the benches support a dense shrub assemblage comprising Leptospermum obovatum, Leptospermum lanigerum, Callistemon sieberi over Poa labillardieri, Lomandra longifolia, *Holcus lanatus (Yorkshire Fog) and *Foeniculum vulgare (Fennel). Eucalyptus camaldulensis is the only tree species present and occurs at all levels above the channel.
The benches feature a number of channels that are active at a range of high flows. Pools within these channels may retain water as flow recedes. These may provide important lentic habitat for some aquatic plant species.
The bank gradient is relatively steep where the channel is cut into the older, fine grained soil of the surrounding landscape. In these areas the bank up to 0.3 m above the channel tends to support a narrow band of emergent macrophytes such as Schoenoplectus validus, Poa labillardieri, Juncus subsecundus, Selliera radicans, Schoenus sp., *Pennisetum clandestinum, Persicaria descipiens and Urtica incisa. At levels 0.3 to 2 m above the channel, the bank more shrubby species are present including Hymenanthera denticulata, Callistemon sieberi and Solanum laciniatum over Poa labillardieri, *Juncus acutus and *Oxalis pes-caprae.
The floodplain has been largely cleared of native vegetation but retains scattered Eucalyptus camaldulensis, Muehlenbeck ia florulenta and Hymenanthera denticulata over pasture grasses.
This site features a number of species which are indicative of saline conditions such as Selliera radicans, Schoenoplectus validus, *Galenia pubescens, Isolepis nodosa and *Juncus acuta . This is likely to reflect the influence of saline groundwater discharge to the channel within the reach.
The key roles of flow in the structure and diversity of vegetation at this site are:
• the discharge of saline groundwater to maintain the distinctive floristic diversity of the site;
• baseflows and high flow freshes to recharge the local aquifer and prevent excessive salinisation of the site;
• provide perennial flow to support the growth of emergent macrophytes and shrubs that access water from the channel, the channel fringe or in the coarse alluvium of benches;
• provide energetic flows once every two years to rework the stream bed and prevent the encroachment of emergent macrophytes;
• provide high flow freshes to activate channels on benches several times every 2 years, to fill pools and provide flooding to bench vegetation; and
• provide bank full flows to rework benches and islands once every 10 years, disturbing shrubby vegetation and creating a variety of native plant assemblages.
At this site, the floodplain vegetation had been extensively modified and there did not appear to be a role of floodplain inundation in supporting vegetation.

SECTION 5 Environmental Values and Current Condition
101
Reach 4 – Geelong (Barwon River from Moorabool River junction to Lower Breakwater)
The aquatic and riparian plant habitat in this reach has been extensively modified and retains few natural values. The breakwater has maintains a minimum level in this reach. The river level varies only in response to freshes and flood flows. Along most of this reach the river has only three habitats, a slow flowing permanently inundated channel environment, a narrow riparian zone and the floodplain.
The channel environment is too deep to support emergent macrophytes. There are scattered occurrences of Triglochin procerum in shallower water (less than 1 m deep) near the edge of the channel and other semi-emergent species may also occur, such as Myriophyllum spp. and Potamogeton sp.
There is a steep narrow bank at the edge of the channel that rises from approximately 0.5 m below the water level to 0.5 m above the water level, where the floodplain commences. The bank supports a narrow zone of emergent macrophytes including scattered Eucalyptus camaldulensis, Eleocharis acuta, Schoenoplectus validus, Phragmites australis, *Rubus fruticosis spp. agg. *Galium aparine (Cleavers), Poa labillardieri, Juncus subsecundus and Cyperus sp.
The floodplain has been largely cleared of native vegetation. Some areas have been developed for parks and playing fields where mature Eucalyptus camaldulensis remain over mown grasses. Undeveloped areas are generally weedy and have infestations of *Rubus fruticosis spp. agg., *Bromus spp., Pennisetum clandestinum and *Cortaderia jubata (Pink Pampas-grass). There are some depressions that feature remnant wetland vegetation, particularly Meuhlenbeckia florulenta.
An area of floodplain has been rehabilitated at the Balyang Sanctuary. Earthworks and revegetation have created a complex of floodplain and wetland habitats in an area of 9 ha. The wetlands are flooded primarily by stormwater collected in Geelong, but the system is also flooded by peaks in Barwon River flow. The site has an overstorey of Eucalyptus camaldulensis, Callistemon sieberiana and Acacia dealbata over Poa laibllardieri, Goodenia ovata, Lomandra longifolia and other species.
The key roles of flow in the structure and diversity of vegetation in this reach are:
• support semi-emergent vegetation at the fringes of the channel with a stable water level less than 1 m deep;
• support a narrow zone of stream bank vegetation with frequent small freshes throughout the year that raise the water level by up to 0.5 m above the pool level; and
• inundate the floodplain every 2 to 5 years to promote the growth of perennial flora (e.g. Eucalyptus camaldulensis, Muehlenbeckia florulenta, Poa labillardieri) and to allow the growth and seed-set of opportunistic floodplain flora (e.g. Helichrysum sp.).

SECTION 5 Environmental Values and Current Condition
102
Reach 5 – Estuary – Salt Swamp
The following site description is based on field notes by Marcus Cooling and detailed floristic information prepared by Yugovic and Gowans (no date).
Salt Swamp is a shallow basin located to the south of Lake Connewarre, extending south-west from the Lower Barwon Channel. The Barwon Heads Road intersects the southern corner of the swamp. The site has previously been impacted by grazing and shell-grit extraction, but it retains diverse and largely intact native vegetation.
Estuarine water is excluded from the lake at normal levels by a low bund. The lake receives runoff from a local catchment which accumulates in the lake bed and is lost to seepage and evaporation. High levels in the estuary can spill into the swamp with a reported recurrence interval of 2 years (Yugovic and Gowans no date). The site appears to be a groundwater discharge zone and supports a waterlogging-tolerant halophytic plant community.
The central, lowest lying part of the lake supports an extensive (approximately 40 ha) Wilsonia herbfield. The dominant species in this assemblage is Wilsonia humilis, but the species W. backhousei and W. rotundifolia are also present. The herbfield is subject to annual inundation, approximately from June to December. The extent of the herbfield corresponds to the extent of regular inundation. When flooded the swamp supports Ruppia maritima, Lepilaena preissii and Chara sp.
A Sarcocornia quinqueflora herbfield occurs in seasonally waterlogged, saline soils at the perimeter of the area subject to regular inundation. Component species of this association are Triglochin striata and Samolus repens.
A samphire shrubland, dominated Sclerostegia arbuscula and Halosarcia pergranulata occurs on well-drained saline soils at the at the perimeter of the Sarcrocorina herbfield. Rainfall in winter and spring promotes seasonal growth and flowering of Disphyma clavellatum, Frankenia pauciflora and Cotula coronopifolia.
Gahnia filum sedgeland occurs at the perimeter of the wetland in association with Distichlis distichophylla, Enchylaena tomentosa, Dysphyma clavellatum, Wilsonia humilis and Poa poiformis. It appears to be associated with seasonally waterlogged soils that lying over a saline water table.
The aspects of the water regime in the structure and diversity of vegetation at Salt Swamp are:
• a saline water table that lies at or near the surface of the wetland bed;
• drying of the wetland bed in summer and autumn to maintain the dominance of Wilsonia spp. by curtailing the growth of aquatic plants and providing a recovery period for Wilsonia spp.; and
• flooding the wetland to the limit of the Wilsonia herbfield on an annual or biannual basis for 4 to 6 months to provide surface water and soil water and salinity requirements for Wilsonia spp. and to provide growing conditions for aquatic plants (e.g. Ruppia maritima).

SECTION 5 Environmental Values and Current Condition
103
Flooding of areas higher in the wetland are probably not essential to maintaining the vegetation communities of the wetland. However, they are tolerant of flooding and would tolerate the following water regime:
• flooding in the Samphire shrubland for up to 2 months 1 year in 5; and
• flooding in the Gahnia sedgeland for up to 2 months 1 year in 10.
Reach 5 – Estuary – Hospital Swamp
The water regime of Hospital Swamp has been regulated for approximately 20 years.
Hospital Swamp comprises 5 basins which receive water both from the Barwon River estuary and from local runoff. The wetland is isolated from the estuary by a bund. Water is diverted from the Barwon River via a regulated channel through Sparrowvale Farm, which has an invert of 0.3 m AHD. Other unregulated channels become active at Barwon River levels greater than 1.4 m AHD.
The wetland overflows to Lake Connewarre at a level of 0.5 m AHD. The wetland can be drained using a regulated pipe with an invert of 0.2 m AHD.
The regulator is opened when the Barwon River exceeds 0.7 m AHD. Barwon levels greater than 0.9 m AHD allow Hospital Swamp levels to reach 0.5 m AHD, the normal full level.
The wetland features a range plant assemblages that correspond to soil the various soil moisture, salinity and flooding environments present. The limit of wetland vegetation is defined by Muehlenbeckia florulenta shrubland which occurs in association with Distichlis distochophylla and Juncus kraussii. This association lies at an elevation of more than 1 m AHD is rarely flooded. It is likely to occur in soils that are seasonally waterlogged. Flooding would be tolerated, but is not a requirement to sustain this vegetation.
Elevations between the Lignum and the normal full level of the wetland (0.5 m AHD) support salt tolerant sedges and herbs. Bolboschoenus caldwellii was observed growing over Sarcocornia quinqueflora and Selliera radicans. Other species likely to be present include Mimulus repens, Schoenoplectus pungens, Triglochin striata and Distichlis distichophylla. Bolboschoenus caldwellii grows in saline areas subject to inundation with fresh or brackish water for a period of 1 month to 4 months in most years. The vegetation in this area most likely reflects a zone of permanent waterlogging where saline groundwater discharges to the surface, but soil salinities are reduced seasonally by flooding.
The normal full level of the wetland is marked by emergent macrophytes, particularly Phragmites australis and Bolboschoenus caldwellii. Schoenopletctus validus is also likely to be present. This association occurs at the fringe at the wetland at at islands within the wetland that emerge above 0.5 m AHD.
Between elevations of 0.5 and 0.1 m AHD (the base of the wetland) the vegetation comprises a marshland assemblage. This area is regularly inudated to a largely stable maximum depth of 0.5 m AHD and supports a range of submerged and semi-emergent herbs and shrubs. Common species observed during the site

SECTION 5 Environmental Values and Current Condition
104
inspection include Sarcocornia quinqueflora, Ruppia maritima, Distichlis distichophylla, Mimulus repens and Cotula coronopifolia. Other species likely to be present include Potamogeton sp., Crassula helmsii, Rumex bidens, Triglochin procerum, Triglochin striata, Schoenoplectus pungens and Lilaeopsis polyantha. This assemblage reflects the brackish conditions of the wetland, which are likely to be least saline when freshwater enters from the Barwon River, but becomes progressively more saline as water levels fall and groundwater discharge increases. Species such as Triglochin procerum, Ruppia and Lilaeopsis will tolerate permanent inundation or seasonal flooding. Species such as Sacrocornia, Distichlis, Mimulus, Rumex and Triglochin striata are favoured by seasonal inundation but will tolerate permanent waterlogging. The presence of the latter species suggests that drawdown of the wetland in late spring is important to this vegetation structure. Low water levels in November and December will provide an opportunity for these low-growing species to flower and set seed before excessive temperatures, high salinities or insufficient moisture in January and February inhibit further growth.
The aspects of the water regime relevant to the structure and diversity of vegetation at Hospital Swamp are:
• a saline water table that lies at or near the surface of the wetland bed;
• fresh water inundation between June and November for a period of at least 3 months in most years to a depth of more than 0.4 m to support the growth of submerged aquatic plants such as Lilaeopsis, Potamogeton and Ruppia ;
• fresh water inundation for 2 to 4 months to an elevation of 0.5 m AHD in winter and spring in most years to support the growth of emergent aquatic macrophytes such as Phragmites australis;
• intermittent inundation (events of 1 to 2 weeks, 2 to 4 times per year) of the Bolboschoenus sedgeland;
• drawdown in November or December in most years to provide a growing opportunity for lake bed herbland species; and
• drawdown of the wetland in late summer and all of autumn to maintain the salinity of soil water and to restrict emergent macrophytes to the wetland fringe.
Flooding is not required by Muehlenbeckia shrubland growing at the fringes of the wetland. However this plant association tolerates temporary inundation and probably reflects a water regime involving soils that are seasonally waterlogged by saline groundwater and inundated by surface water for 2 months 1 year in 10.
Reach 5 – Estuary – Reedy Lake
Reedy Lake is approximately 850 ha in area and is reported to be one of the largest freshwater wetland in central Victoria (Yugovic 1985).
Prior to European settlement, Reedy Lake was an ephemeral wetland that received minor flow from a small local catchment and major flows from peaks in the Barwon River. The Barwon River was originally

SECTION 5 Environmental Values and Current Condition
105
estuarine upstream beyond the lake and the lake would have received a combination of saline and freshwater inflows, depending on the contribution of high tides and high river flows.
A regulated channel was cut between the Barwon River and Reedy Lake in 1953, upstream of the lower breakwater. The channel provided a regular input of freshwater to the lake. Initially, water entering the lake rapidly drained to the estuary. In order to maintain water levels in the lake during the 1967-1968 drought, the bank at the outlet was raised.
These works have important implications for the groundwater environment of the lake. Like the other lakes fringing the estuary, the lake is a natural discharge site for shallow groundwater. Under natural conditions, the salinity of the lake would have increased when water was absent, as groundwater discharge to the surface, or when sea water entered the lake. The salinity of the lake would have declined when the lake was inundated by fresh water from the Barwon River. The greater the depth of flooding, the greater was the potential for fresh surface water to have freshened the soil profile.
This water regime is likely to have created a similar plant habitat to conditions currently found in Hospital Swamp. Shallow saline groundwater would have supported a zone of salt tolerant macrophytes a the fringe, such as Muehlenbeckia florulenta, Gahnia sieberi, Poa labillardieri and Distichlis distichophlla . Shallow, seasonal inundation by freshwater would have occurred at the fringes of the wetland, at the limit of normal flooding from the Barwon River. This would have created waterlogged, flooded soils with some degree of freshening in winter and spring, but more saline in summer and autumn. These conditions are tolerated by the emergent macrophytes Typha sp., Phragmites australis, Schoenoplectus validus, Eleocharis sphacelata and Bolboschoenus medianus. Schoenplectus validus and Eleocharis sphacelata tend to occur in deeper water (a normal seasonal range of 0.2 to 0.8 m) that does not normally dry out. Phragmites australis and Typha sp. tend to occur in soils that dry out seasonally, but are flooded seasonally by 0.2 to 1.5 m of water, ideally for 9 months. Bolboschoenus caldwellii is highly salt tolerant and will grow in areas that are seasonally inundated by up to 0.8 m for as little as 2 months per year. Sandy soils a the wetland fringe would provide favourable habitat for Baumea juncea. It is possible that well-flushed soils with low salinity may have supported sedgelands of other Baumea species.
Emergent macrophytes are likely to have been excluded from the lower bed of the lake by deep flooding in winter and spring. Regular seasonal flooding to more than 1 m will exclude most emergent macrophytes, particularly when flooding depth represents an additional stress to saline soils. When flooded, the lake is likely to have supported a variety of salt tolerant semi-emergent and submerged macrophytes such as Ruppia sp., Lepilaena sp., Myriophyllum sp., Vallisneria gigantea, and Triglochin procerum. Falling lake levels in late spring / early summer would have provided a saline marsh habitat for herbs such as Triglochin striata, Mimulus repens, Pratia concolor, Apium annuum and Cotula spp.
If the lake dried out, the deepest lake bed may only have provided bare soil, but would have been colonised by opportunistic terrestrial grasses, particularly Agrostis avenacea.
These broad concentric zones of vegetation were observed by Yugovic and Gowans (no date) in the late 1980s.
The balance between these plant habitats has been altered by a gradual freshening of the lake and the introduction of a more stable and permanent freshwater regime. Since 2000, a new water regime has been

SECTION 5 Environmental Values and Current Condition
106
introduced with the objectives of controlling carp and maintaining the quality of habitat for waterbirds. The flow thresholds relevant to the current water management regime are:
• 0 m AHD - inlet sill at the channel between the Barwon River and Reedy Lake upstream of the lower breakwater;
• 0 m AHD – lake bed level;
• 0 m AHD – sill of outlet channel between Reedy Lake and Lake Connewarre;
• 1.7 m AHD - overtop level of bank between Barwon River and Reedy Lake; and
• 0.9 m AHD – overtop level of bank between Reedy Lake and Lake Connewarre.
The water regime as recommended by PPK (2000) is presented in Table 14.
Table 14. Recommended Water Regime for Reedy Lake (PPK 2000).
Month Water Level
(m AHD)
May 0.5
June 0.6
July 0.6
August 0.7
September 0.75
October 0.8
November 0.8
December 0.6
January 0.4
February 0.2
March 0.2
April 0.4
May 0.5
The key expected outcomes of this regime were:
• to provide deep water feeding and breeding habitat for waterfowl and habitat for eels and other fish between May and December;
• to exclude emergent macrophytes from most of the seasonally inundated area;
• to expose the lake margins between November and February to provide mudflat habitat for wading birds;
• to attract ducks and provide access by shooters to a range of locations with flooding of 0.4 m AHD in April and May.

SECTION 5 Environmental Values and Current Condition
107
In addition to this annual cycle was recommended that the lake is completely dried from time to time to eliminate carp. The recommended regime was to completely dry the lake for three months from February. It was also recommended that in years when large numbers of Ibis breed that higher lake levels are maintained until fledging occurs.
This water regime has not had the intended result. The extent of open water habitat has been extensively replaced by reeds (particularly Typha orientalis and Phragmites australis) such that only a small area of open water remains. Furthermore, the reed habitat has a low floristic diversity and many of the plant communities described by Yugovic and Gowans (no date) have declined or been lost.
The main causes of the change in vegetation are likely to relate to the relatively stable water levels under the current water regime (particularly during the growing season of plants between September and January) and the relatively deep water levels.
While the current water regime floods and exposes a significant proportion of the lake bed June and December, this corresponds to a change in water level of only 0.2 m. It is likely that the area that is exposed by falling water levels will remain damp and will therefore provide similar plant habitat to areas flooded by up to 0.4 m. This is particularly true for summer-growing generalist species such as Typha orientalis and Phragmites australis which will readily grow in a range of water depths ranging from waterlogged soils to depths of 0.5 m. The current water regime provides these conditions over a large proportion of the lake between October and January, which is the main growing period for these species.
The current water regime also maintains a water depth of 0.5 m or more for 8 months of the year. This will exert a downward pressure on the naturally saline groundwater that lies beneath the lake. Saline groundwater is a significant controlling factor on the structure of plant communities in the Barwon River estuary. This water regime will create fresh soil conditions over a large proportion of the lake, which will favour species that grow in low salinity soils, such as Typha orientalis and Phragmites sp.
The vegetation is likely to be more diverse and to have more similarities to the original vegetation of the site with the introduction of a water regime with greater seasonal variation and a lower average water depth. This may involve creating three water management zones.
The highest fringing zone would be flooded intermittently by high flows from the Barwon River. The target plant community in this zone would comprise Muehlenbeckia florulenta shrubland over Distichlis distichophylla, Poa labillardieri and Sarcocornia quinqueflora. This area would be flooded intermittently by high flows from the Barwon River. Generally it would be waterlogged in winter and spring by rainfall, runoff and groundwater discharge, and would dry out in summer and autumn when groundwater levels are lowest. This may only be inundated by levels over 0.8 m AHD.
Emergent macrophytes could be promoted in the next zone down the bank (elevation range 0.4 to 0.8 m AHD). These would be inundated from 1 to 4 months annually between June and October to a depth of up to 0.4 m. The species to be promoted in this zone would include Bolboschoenus caldwellii, Scheonoplectus pungens, Phragmites australis, Typha orientalis and Baumea spp. By exposing this zone in October it is likely that the growth of summer-growing macrophytes will be curtailed. Furthermore, soil salinities are likely to be higher than currently, which will reduce the vigour of these plants.

SECTION 5 Environmental Values and Current Condition
108
The central lake bed (elevation range 0 to 0.4 m AHD) could be managed as an alternate aquatic herbland / lake bed herbland community. The central lake would be flooded by 0.4 to 0.8 m for 1 to 4 months per year between June and October. The water level would be drawn down to 0.2 m depth in October or December and remain at that level, or allowed to dry out until the following June. It is expected that when flooded to 0.8 m semi-emergent and submerged plants aquatic macrophytes will be promoted. It is expected that flooding of 0.4 to 0.8 m as late as September will help exclude emergent macrophytes from this zone. Lowering the water level from 0.4 and 0.2 in late spring will expose the lake bed to high evaporation and will reduce downward pressure on the water table. This is likely to increase the salinity of the soil, which may limit the downward extent of emergent macrophytes and promote saline herbland species such as Mimulus repens, Samolus repens, Rumex bidens, Lilaeopsis polyantha and Triglochin striata.
The implementation of the PPK (2000) regime should be considered as a valuable natural experiment from which important lessons can be learned. The vegetation structure proposed here, and its recommended water regime, should also be considered experimental. It would be valuable to monitor groundwater salinities as the current or alternative water regimes are implemented to clarify the hydrological and salinity processes that influence vegetation structure.
Reach 6 – Birregurra Creek
Birregurra Creek drains a gently undulating landscape and has a low gradient with a broad channel. The stream intersects a saline water table which is expressed by the presence of sparse, salt tolerant vegetation in the channel bed. The site is accessed by stock.
The downstream part of the site has a relatively narrow channel approximately 8 m wide that lies 0.5 to 1 m below a 10 m wide floodplain shelf. The channel bed supports dense beds of the salt tolerant Bolboschoenus caldwellii together with Halosarcia sp., Triglochin striatum, Eleocharis acuta and *Chenopodium sp. and stattered Phragmites australis. The floodplain shelf is vegetated with dense *Thynopyron ponticum (Tall Wheat Grass), *Phalaris aquatica, Juncus sp. and Poa labillardieri.
The stream bed is much broader upstream. The stream is up to 100 m wide and represents a broad wetland enviornment. There is a relatively narrow flow path in the stream bed approximately 0.4 m deep and 8 m wide. In this location the stream supports sparse Distichlis distichophylla, *Critesion marinum, Halosarcia sp. and pasture grasses. There are scattered clumps of Juncus sp. at the fringes.
The channel vegetation represents species that experience prolonged seasonal waterlogging by saline groundwater and temporary inundation by fresh or brackish surface water. Surface water flows mitigate the saline soil conditions, providing a seasonal opportunity for growth before plants return to dormancy during summer and autumn when soil salinity will be highest. The duration of plants’ growing season will be related to the duration of flow.
The key roles of flow in the structure and diversity of vegetation in this reach are:
• cease to flow in summer and autumn to allow surface expression of the water table to create a saline, open grassland habitat for halophytes (e.g. Halosarcia);

SECTION 5 Environmental Values and Current Condition
109
• low flow to create shallow flooding of 0.1 to 0.5 m and mitigate soil salinities during the growing season for emergent macrophytes (Bolboschoenus caldwellii, Distichlis distichophylla, Eleocharis acuta and Phragmites australis), a period of approximately 3 months on an annual basis;
• multiple high flow freshes on an annual or bi-annual basis to create extensive inundation of the flats in the upstream part of the site and the bench in the downstream part of the site to support the growth of drought-tolerant riparian plants (e.g. Juncus sp.) and provide temporary habitat for opportunistic wetland species such as Myriophyllum salsugineum and Ruppia spp.
Reach 7 – Boundary Creek
The Boundary Creek site assessed in this project was a highly modified reach comprising a narrow, incised channel set in a broad, modified floodplain. The floodplain has been cleared of native vegetation and supports grazed pasture. The channel appears to have been deepened and straightened to drain the floodplain and facilitate the transmission of flood flows.
The plant communities at this site have a simple structure. The stream bed appears to comprise deep soil but has sparse vegetation, probably due to the perennial flow and frequent energetic freshes that occur in this reach. Where present, stream bed vegetation comprises sparse clumps of Triglochin procerum, Crassula helmsii, Eleocharis sp. and Juncus sp.
The lower bank of the stream supports a mixture of emergent aquatic plants such as Persicaria descipiens, Juncus subsecundus, Carex appressa, Poa labillardieri, Cyperus lucidus and Phragmites australis. The upper bank has a greater proportion of exotic plants such as *Rubus fruticosis spp. agg. (Blackberry), *Phalaris aquatica, Geranium dissectum, *Taraxacum sect. ruderalia and *Plantago lanceolata . The main native riparian species present in the upper bank is mature remnant Acacia melanoxylon trees.
Native vegetation has essentially been removed from the floodplain, which is grazed and supports pasture grasses.
Grazing has recently been excluded from the top of the bank and a narrow strip of the floodplain. In some sections the top of the bank has been revegetated with local native trees and shrubs.
Upstream of the study site, in the Aquifer Outcrop Area, Boundary Creek featues more complex and natural riparian and wetland plant communities. Carr and Muir (1994) reports the presence of:
• Eucalyptus ovata riparian forest;
• Melaleuca squarros / Leptospermum lanigerum swamp forest or scrub;
• Eucalyptus ovata grassy wetland;
• Lepidosperma longitudinale sedgeland;
• Baumea arthrophylla sedgeland; and
• constructed wetland herbfields.

SECTION 5 Environmental Values and Current Condition
110
Objectives to achieve a healthy stream at this site are constrained by the highly modified stream morphology. The available aquatic vegetation habitats are limited to stream bed, the lower bank and upper bank.
Stream bed vegetation will tolerate temporary drying, although this is not a natural characteristic of this reach. Pools with slower flowing water will support Triglochin procerum, Crassula helmsii and other semi-emergent species and will benefit from perennial inundation and tolerate temporary seasonal drying. The vegetation of the lower riparian zone requires temporary seasonal inundation. The water requirements of this zone are met by sustained baseflow in winter and spring and intermittent inundation in summer and autumn to relieve water stress. There is benefit to vegetation from floodplain inundation in this reach.
The key roles of flow in the structure and diversity of vegetation in this reach are:
• provide baseflow throughout the year to support the growth of semi-emergent aquatic plants (e.g. Triglochin procerum, Persicaria descipiens) and riparian emergent species (e.g. Juncus lucidus, Phramites australis);
• provide low flow freshes frequently in winter and spring and intermittently in summer and autumn to support the seasonal growth of emergent riparian species at a range of levels on the channel bank;
• provide high flow freshes annually to promote the growth of riparian woodland species at higher positions on the bank (e.g. Acacia melanoxylon, Leptospermum sp., Callistemon sieberi, Juncus subsecundus); and
• provide bank full flows to remove emergent vegetation from the channel bed.
Reach 8 – Mid-Leigh River (Cambrian Hill to Quiney Hill)
The channel bed comprises a sequence of deep pools with relatively slow moving water and shallow rocky riffles. In general there is no macrophyte vegetation in the channel. Some plants do occur on shallow rocky riffles, particularly Callistemon sieberi and Phragmites australis, although they are sparse and likely to be subject to high shear stress.
A low shelf exists at the edge of the channel and comprises fine sediment of sand or silt. The shelf is approximately 3 m wide at Peg 276 and supports beds of emergent vegetation such as Phragmites australis, Eleocharis acuta, Juncus acutus and Pennisetum clandestinum. These species, particularly E. acuta, are indicative of prolonged seasonal inundation and drying. This assemblage suggests that the shelf is inundated to a depth of up to 0.5 m by baseflows during winter and spring and is exposed by low flows in summer and autumn. The shelf was inundated to a depth of approximately 0.3 m on the day of the site inspection.
The floodplain represents a complex set of habitats including relatively high energy runners and low energy benches. Runners divert water from the main channel at a range of levels.
The lowest runners tend to have a substrate of coarse sand and gravel and feature pools and riffles. Vegetation is sparse. Species present include Phragmites australis, Juncus subsecundus, Poa labillardieri

SECTION 5 Environmental Values and Current Condition
111
and Paspalum distichum. When filled the pools may support Eleocharis acuta and Triglochin procerum. There are few shrubs but Callistemon sieberi is occasionally present and large mature Eucalyptus camaldulensis are also present. These runners appear to be a frequently inundated, high energy environment where the substrate is frequently sorted or fine materials and macrophytes are uprooted and removed. Pools in the runners lie at a similar elevation to the interpreted baseflow level of the river, and may be hydraulically connected by porous floodplain sediment. Permanently damp or inundated areas in the pools may support small aquatic macrophytes such as Schoenus sp.
Runners that flow at higher river levels tend to have a finer substrate that is similar to higher-level floodplain soil. They are vegetated by exotic understorey grasses and herbs such as *Bromus spp., *Juncus acutus, *Paspalum distichum, and *Oxails pes-caprae. Native Juncus sp. is also present.
The floodplain represents the surface that is intersected by these channels, and has a gradual slope from the top of the channel to the foot of the enclosing hill slope. The floodplain is vegetated by an open Eucalyptus camaldulensis woodland. The middle stratum comprises variously dense and open stands of Acacia melanoxylon, Leptospermum lanigerum, Callistemon sieberi, *Ulex europaeus and immature Eucalyptus camldulensis. The ground layer is relatively disturbed, probably reflecing a history of grazing. Common species include Lomandra longifolia, *Phalaris aquatica, *Foeniculum vulgare, Poa labillardieri, *Bromus sp., *Paspalum distichum, *Juncus acutus, Juncus subsecundus and *Oxalis pes-caprae.
Key roles of flow in the structure and diversity of this reach include:
• baseflow in winter and spring of every year for more than 5 months to support emergent vegetation by inundating the in-channel bench (e.g. Phragmites australis and Eleocharis acuta );
• high flow in winter and spring to support aquatic vegetation (particularly Phragmites australis) on the floodplain by maintaining the subsurface water in coarse floodplain sediments;
• regular high flow freshes every winter and spring to maintain a broad zone of emergent vegetation at the channel edge extending from the benches to the edge of the floodplain;
• high flow freshes to inudate low runners and provide pools for semi-emergent species (e.g. Triglochin procerum);
• bankfull flow to uproot and remove emergent vegetation and shrubs from the channel and low level runners; and
• annual or bi-annual overbank flows for a period of several days to temporarily increase soil moisture in floodplain sediments and promote the growth of floodplain species (e.g. Lomandra longifolia and Callistemon sieberi).

SECTION 5 Environmental Values and Current Condition
112
Reach 9 – Lower-Leigh River (Quiney Hill to confluence with Barwon River)
The stream has little habitat diversity within the stream banks. The channel does not support macrophyte vegetation, presumably due to frequent energetic flows. An exception is Triglochin procerum that is occasionally present in the shelter of snags or sand bars.
A sandy shelf is occasionally present (refer to Peg 383) and can feature sparse emergent plant species such as *Juncus acutus, Schoenus sp., Poa labilladieri, Schoenplectus pungens, *Paspalum distichum, *Solanum nigrum and Persicaria descipiens.
The banks of the channel are steep. A narrow zone of emergent macrophytes is present from the channel up to a height of approximately 0.5 m. Species present include Schoenoplectus validus, Bolboschoenus medianus, *Juncus acutus, Phragmites australis and Poa labillardieri.
Poa labillardieri is also present in the upper part of the bank. Other species in this zone include Eucalyptus camaldulensis, Acacia melanoxylon, Acacia dealbata, *Sysimbrium sp., *Phalaris aquatica and a variety of other pasture grasses and weeds.
The floodplain is managed as pasture and has been cleared of native vegetation with the exception of mature Eucalyptus camaldulensis. There are some billabongs on the floodplain but they have little or no native vegetation. Drought tolerant species such as Carex appressa may be present. When flooded the billabongs may provide habitat for semi-emergent macrophytes such as Triglochin procerum, Myriophyllum spp., Potamogeton sp. and Eleocharis acuta .
Key roles for flow in the structure and diversity of vegetation in this reach are:
• baseflow in winter and spring to support the seasonal growth of macrophytes growing at the channel edge and on sand bars;
• high flow freshes to support the growth of channel edge macrophytes growing up to 0.5 m above the channel edge;
• bankfull flow to uproot and remove emergent vegetation and shrubs from the channel; and
• bankfull flows once per year to inundate woody vegetation in the upper bank (e.g. Acacia dealbata, Eucalyptus camaldulensis) and to support its growth;
• overbank flows every 1 to 5 years to inundate and support the growth of floodplain Eucalyptus camaldulensis; and
• overbank flows every 1 to 5 years to fill billabongs and support the growth of semi-emergent and emergent wetland vegetation.

SECTION 5 Environmental Values and Current Condition
113
5.5 Macroinvertebrates
Macroinvertebrates have been studied in the catchment to assess the impact of saline drainage disposal but the studied reported in Table xx was conducted at a time of little saline disposal and forms a baseline of catchment condition as indicated by aquatic macro-invertebrate communities (Canale et. al. 2001). This study showed that few sites met SEPP objectives and indicated mild pollution at these sites. Obviously, since saline inflows were not an issue at the time it was believed that riparian habitat disturbance, lack of environmental flows, and high nutrient levels, were the likely reasons for the poor biodiversity.
Table 14. Aquatic macroinvertebrate biodiversity with the Barwon catchment. Sites are arranged with upstream sites at top of table going downstream in each system/reach. *shading indicates that site does not meet SEPP Objectives (see Canale et. al. 2001).
Reach Name (Number)
Site No. (Canale et al 2001)
EPT Richness
Total Taxa Richness
SIGNAL Index Score*
Number of Families Score*
B10 8 39 5.1 24
B16 2 24 4.9 17
Upper Barwon (1)
B17 11 44 5.3 26
B18 10 36 5.1 21
B19 17 53 5.0 31
B21 3 55 5.2 35
B11 4 38 4.9 25
Winchelsea (2)
B3 2 41 4.8 27
B2 10 39 5.0 24 Murgheboluc Valley (3)
B1 5 27 4.6 17
L5 11 43 5.1 28 Lower Leigh River (9)
L4 13 48 5.1 29
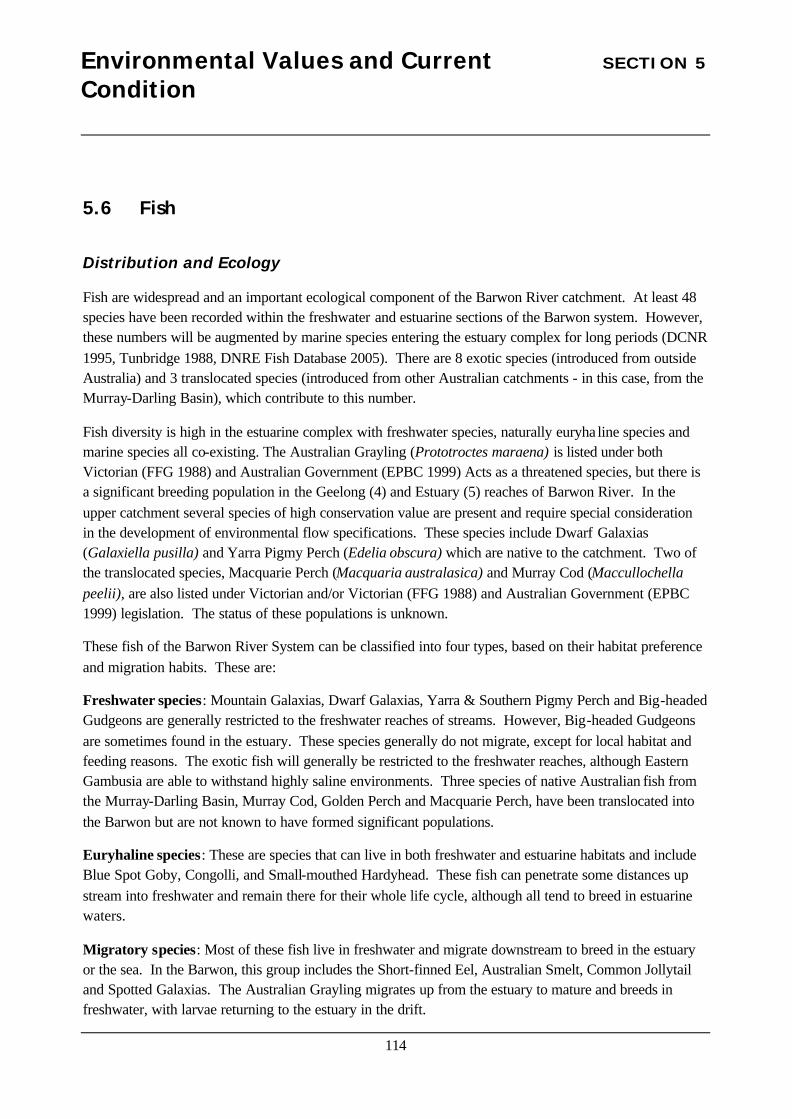
SECTION 5 Environmental Values and Current Condition
114
5.6 Fish
Distribution and Ecology
Fish are widespread and an important ecological component of the Barwon River catchment. At least 48 species have been recorded within the freshwater and estuarine sections of the Barwon system. However, these numbers will be augmented by marine species entering the estuary complex for long periods (DCNR 1995, Tunbridge 1988, DNRE Fish Database 2005). There are 8 exotic species (introduced from outside Australia) and 3 translocated species (introduced from other Australian catchments - in this case, from the Murray-Darling Basin), which contribute to this number.
Fish diversity is high in the estuarine complex with freshwater species, naturally euryha line species and marine species all co-existing. The Australian Grayling (Prototroctes maraena) is listed under both Victorian (FFG 1988) and Australian Government (EPBC 1999) Acts as a threatened species, but there is a significant breeding population in the Geelong (4) and Estuary (5) reaches of Barwon River. In the upper catchment several species of high conservation value are present and require special consideration in the development of environmental flow specifications. These species include Dwarf Galaxias (Galaxiella pusilla) and Yarra Pigmy Perch (Edelia obscura) which are native to the catchment. Two of the translocated species, Macquarie Perch (Macquaria australasica) and Murray Cod (Maccullochella peelii), are also listed under Victorian and/or Victorian (FFG 1988) and Australian Government (EPBC 1999) legislation. The status of these populations is unknown.
These fish of the Barwon River System can be classified into four types, based on their habitat preference and migration habits. These are:
Freshwater species: Mountain Galaxias, Dwarf Galaxias, Yarra & Southern Pigmy Perch and Big-headed Gudgeons are generally restricted to the freshwater reaches of streams. However, Big-headed Gudgeons are sometimes found in the estuary. These species generally do not migrate, except for local habitat and feeding reasons. The exotic fish will generally be restricted to the freshwater reaches, although Eastern Gambusia are able to withstand highly saline environments. Three species of native Australian fish from the Murray-Darling Basin, Murray Cod, Golden Perch and Macquarie Perch, have been translocated into the Barwon but are not known to have formed significant populations.
Euryhaline species: These are species that can live in both freshwater and estuarine habitats and include Blue Spot Goby, Congolli, and Small-mouthed Hardyhead. These fish can penetrate some distances up stream into freshwater and remain there for their whole life cycle, although all tend to breed in estuarine waters.
Migratory species: Most of these fish live in freshwater and migrate downstream to breed in the estuary or the sea. In the Barwon, this group includes the Short-finned Eel, Australian Smelt, Common Jollytail and Spotted Galaxias. The Australian Grayling migrates up from the estuary to mature and breeds in freshwater, with larvae returning to the estuary in the drift.
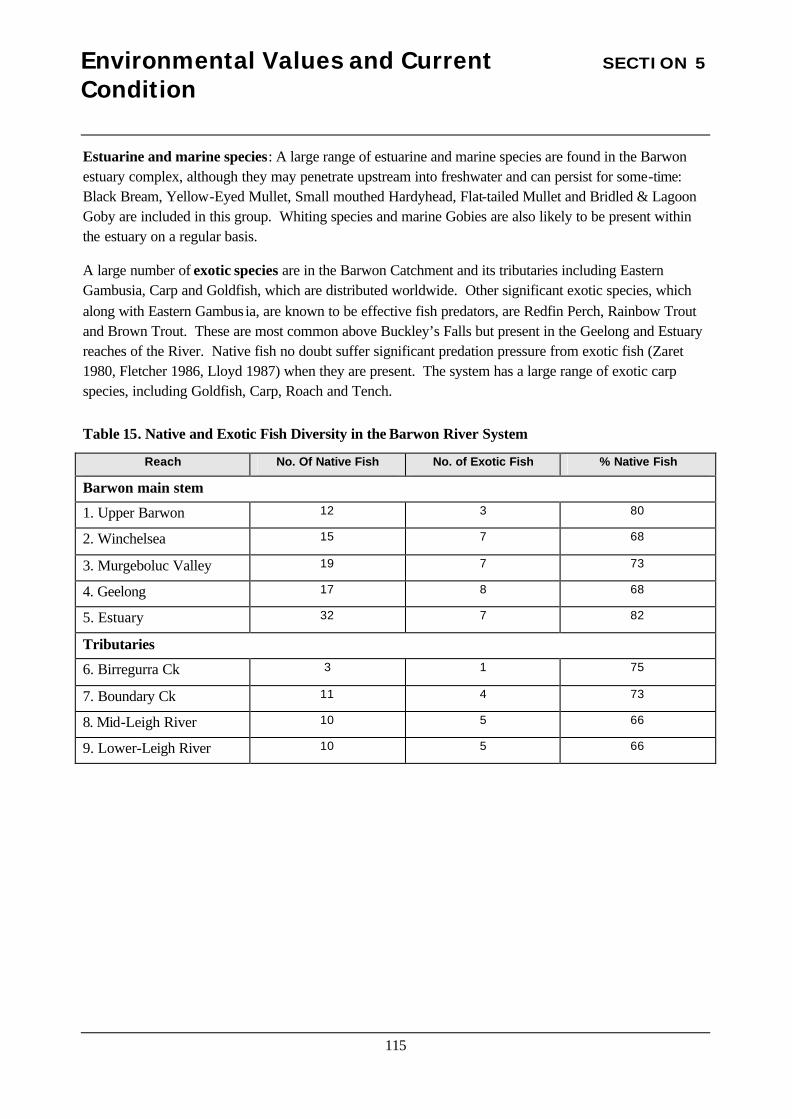
SECTION 5 Environmental Values and Current Condition
115
Estuarine and marine species: A large range of estuarine and marine species are found in the Barwon estuary complex, although they may penetrate upstream into freshwater and can persist for some-time: Black Bream, Yellow-Eyed Mullet, Small mouthed Hardyhead, Flat-tailed Mullet and Bridled & Lagoon Goby are included in this group. Whiting species and marine Gobies are also likely to be present within the estuary on a regular basis.
A large number of exotic species are in the Barwon Catchment and its tributaries including Eastern Gambusia, Carp and Goldfish, which are distributed worldwide. Other significant exotic species, which along with Eastern Gambus ia, are known to be effective fish predators, are Redfin Perch, Rainbow Trout and Brown Trout. These are most common above Buckley’s Falls but present in the Geelong and Estuary reaches of the River. Native fish no doubt suffer significant predation pressure from exotic fish (Zaret 1980, Fletcher 1986, Lloyd 1987) when they are present. The system has a large range of exotic carp species, including Goldfish, Carp, Roach and Tench.
Table 15. Native and Exotic Fish Diversity in the Barwon River System
Reach No. Of Native Fish No. of Exotic Fish % Native Fish
Barwon main stem
1. Upper Barwon 12 3 80
2. Winchelsea 15 7 68
3. Murgeboluc Valley 19 7 73
4. Geelong 17 8 68
5. Estuary 32 7 82
Tributaries
6. Birregurra Ck 3 1 75
7. Boundary Ck 11 4 73
8. Mid-Leigh River 10 5 66
9. Lower-Leigh River 10 5 66

SECTION 5 Environmental Values and Current Condition
116
Table 16. Known or likely locations of freshwater fish found in the Barwon River Catchment (Tunbridge 1988; DCNR 1995; Zampatti & Grgat 2000; Raadik, T. 2000; NRE 2001; Zampatti & Koster 2002)
Common Name Scientific Name
1 U
pper
Bar
won
2 W
inch
else
a
3 M
urgh
ebol
uc V
alle
y
4 G
eelo
ng
5 E
stua
ry C
ompl
ex
6 B
irre
gurr
a C
reek
7 B
ound
ary
Cre
ek
8 M
id L
eigh
Riv
er
9 L
ower
Lei
gh R
iver
Native Fish
Mountain Galaxias Galaxias olidus v v v v ? ?
River Blackfish Gadopsis marmoratus v v v v v v
Common Jollytail Galaxias maculatus v v v v v v v v v
Spotted Galaxias Galaxias truttaceus ? v v v v ? ? v
Broad-finned Galaxias Galaxias brevipinnis v v v v v v v v
Dwarf Galaxias Galaxiella pusilla v v ? v v
Big-headed Gudgeon Philypnodon grandiceps v v v v v v v v
Blue Spot Goby Pseudogobius olorum v v v
Congolli/Tupong Pseudaphrits urvilli v v v v
Short Finned Eel Anguilla australis v v v v v v v v v
Pouched Lamprey Geotria australiis v v v v v
Short-headed Lamprey Mordacia mordax v v v v v
Southern Pigmy Perch Nannoperca australis v v v ? v ? ?
Yarra Pigmy Perch Edelia obscura v v v v
Australian Smelt Retropinna semoni v v ? v v v v v
Australian Grayling Prototroctes maraena v v v v ?
Murray Cod* Maccullochella peelii peelii ? ? ?

SECTION 5 Environmental Values and Current Condition
117
Common Name Scientific Name
1 U
pper
Bar
won
2 W
inch
else
a
3 M
urgh
ebol
uc V
alle
y
4 G
eelo
ng
5 E
stua
ry C
ompl
ex
6 B
irre
gurr
a C
reek
7 B
ound
ary
Cre
ek
8 M
id L
eigh
Riv
er
9 L
ower
Lei
gh R
iver
Golden Perch* Macquaria ambigua ? ? ?
Macquarie Perch* Macquaria australasica ? ? ?
Small-mouthed Hardyhead Atherinosoma microstoma v v
Black Bream Acanthopagrus butcheri ? v
Yellow-eyed Mullet Aldrechetta forsteri v
Flat-tailed Mullet Liza argentea v
Bridled Goby Arenigobius bifrenatus v
Lagoon goby Tasmanogobius lasti v
Tamar Goby Afurcagobius tamarensis v
Sea Mullet Mugil cephalus v
Greenback flounder Rhombosolea tapirina v
Estuary Perch Macquaria colonorum v
Longsnout flounder Ammotretis rostratus v
Kingfish Argyrosomus japonicus v
Tailor v
Australian ruff Arripis georgianus v
Australian salmon Arripis trutta v
Luderick Girella tricuspidata v
Cobbler Gymnapistes marmoratus v
Sandy sprat Hyperlophus vittatus v
Bluefish Pomatomus saltatrix v
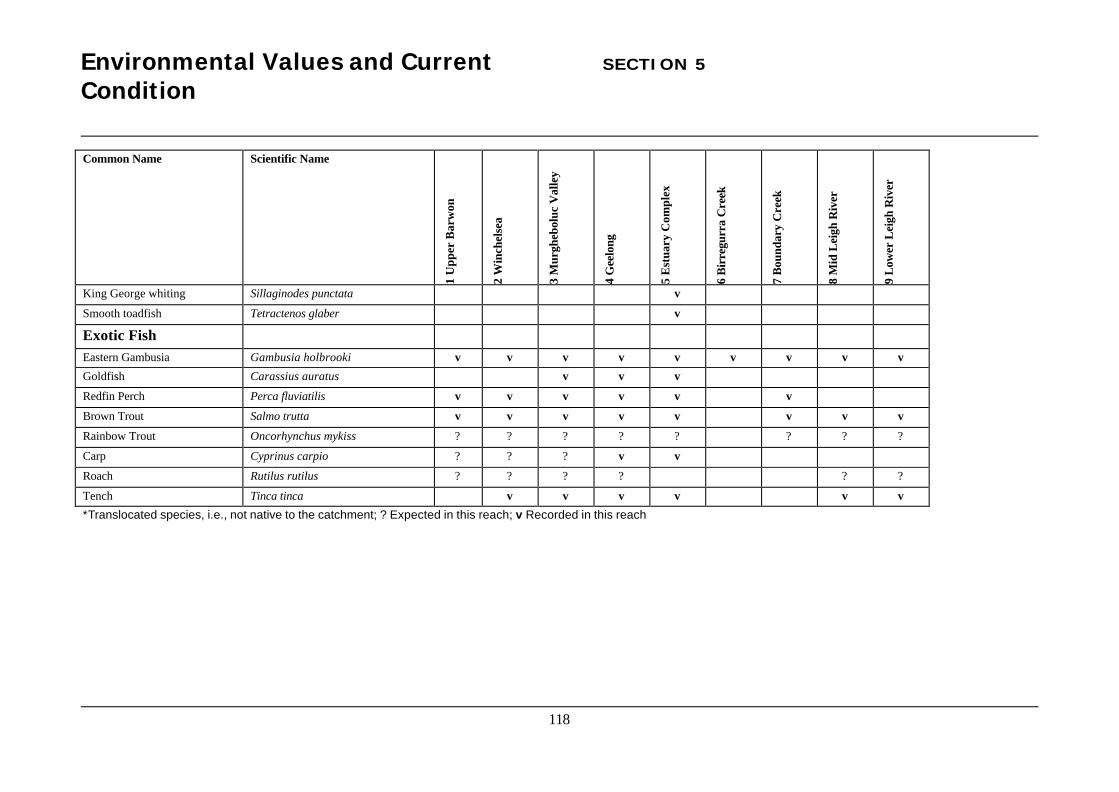
SECTION 5 Environmental Values and Current Condition
118
Common Name Scientific Name
1 U
pper
Bar
won
2 W
inch
else
a
3 M
urgh
ebol
uc V
alle
y
4 G
eelo
ng
5 E
stua
ry C
ompl
ex
6 B
irre
gurr
a C
reek
7 B
ound
ary
Cre
ek
8 M
id L
eigh
Riv
er
9 L
ower
Lei
gh R
iver
King George whiting Sillaginodes punctata v
Smooth toadfish Tetractenos glaber v
Exotic Fish
Eastern Gambusia Gambusia holbrooki v v v v v v v v v
Goldfish Carassius auratus v v v
Redfin Perch Perca fluviatilis v v v v v v
Brown Trout Salmo trutta v v v v v v v v
Rainbow Trout Oncorhynchus mykiss ? ? ? ? ? ? ? ?
Carp Cyprinus carpio ? ? ? v v
Roach Rutilus rutilus ? ? ? ? ? ?
Tench Tinca tinca v v v v v v
*Translocated species, i.e., not native to the catchment; ? Expected in this reach; v Recorded in this reach

SECTION 5 Environmental Values and Current Condition
119
Environmental Water Requirements
Each of these species have specific habitat requirements but generally they are robust and tolerate a broad salinity range (Koehn & O'Connor 1990, Lloyd & Balla 1986, Lloyd 1987, Lloyd 2000, McDowall 1980). Black Bream and Australian Grayling need quite specific flow and salinity conditions for breeding. Blue Spot Goby is susceptible to predation and requires good vegetation to provide cover. The Mountain Galaxias is able to survive in pools over summer, provided some water remains in the pools. There are diverse habitat types within the Barwon River catchment for native fish system. These include riverine pools, riffles, runs, woody debris, undercut banks, rocks & boulders, swamps, and floodplains wetlands.
Many of these fish species will require the opportunity to migrate upstream and downstream to either complete their life-cycle or to find suitable habitats. Instream barriers such as drop-structures, road crossings, piped sections, weirs, erosion control structures, and zones of very poor habitat can all prevent fish being able to move within the system. This increases the likelihood of local extinctions of species.
In determining the environmental flow for a river system, it is important to consider its fish community and the life history of key species, together with other organisms. These key characteristics include the life span, spawning season, incubation, duration, migration, and habitat requirements of these species.

SECTION 5 Environmental Values and Current Condition
120
Table 17. Ecological requirements of key fish species actually or likely to inhabit the Barwon River and its tributaries. These are based on current knowledge but these can only be cons idered as approximate until further research is conducted on these species
Fish Species
Common Name Scientific Name
Life Span Spawning Season
Incubation Duration* Migration Other
Blue-spot Goby Psuedogobius olorum 2-3 years Oct-Jan 4 days Local only Need hollow in log or burrow under rock or wood as a substrate for laying eggs.
Australian Smelt Retropinna semoni 1 year Sept - Nov 9-10 days Local only Aquatic vegetation required as a substrate for laying eggs
Australian Grayling Prototroctes maraena Males 1-2 years
Females 2-3 years
Feb - May 14-21 days in freshwater <2ppt
Larvae washed to sea – May – July
Juveniles migrate from sea upstream Oct - Dec
Demersal non-adhesive eggs Fry slender and buoyant Spawning occurs after high flow – full moon to last quarter
Eggs develop in slow water to 5m deep
Juveniles spend May to Oct in estuary
Need high O2
Can swim up riffles at flow of 2-4m/s sustained swimming 0.6m/sec
Prefer 0.2 to 0.35 m/sec
Congolli Pseudaphritis urvillii >5years Sept - Dec Unknown (likely to be short 3 or so days)
Adults migrate downstream to estuary for breeding. Juveniles migrate upstream
Congolli are susceptible to impacts from the presence of water flow barriers
Common Jollytail Galaxias maculatus 2-3 years Aug-Nov Normally take 10-16 days between flow events or tides (in estuary
Downstream to estuary in Autumn.
Riparian macrophytes (intertidal in estuary) or required as a substrates for laying eggs

SECTION 5 Environmental Values and Current Condition
121
Fish Species
Common Name Scientific Name
Life Span Spawning Season
Incubation Duration* Migration Other
Climbing Galaxias Galaxias brevipinnis 2-4 years
(Uncertain)
May -June Unknown – perhaps 5-7 days (same as G. olidus)
Larvae are washed downstream to the sea in Winter. Juveniles return upstream in spring and early summer.
Prefer rocky streams with flowing water and good riparian vegetation however have are also found in habitats with silt substrates.
Silverside Atherinosoma microstoma
1 year Sept - Feb 4-7 days Local only Breeding probably occurs in estuary or lower reaches of rivers
Black Bream Acanthopagrus butcheri 29 years Nov – Jan 2 days Between sea and estuary
Breeding in estuary at specific salinities. Tend to inhabit areas where rocky river beds, snags or structures provide cover but can be found in open waters over sand or mud substrates. Larvae and small juveniles require seagrass beds in shallow estuarine waters.
Mountain Galaxias Galaxias olidus 2-4 years July - Oct 5-7 days Upstream, if at all Leaf litter required
River Blackfish Gadopsis marmoratus 4–7 years Nov - Jan 7 - 10 days (plus 21 days “tethered” larvae
Local only Hard substrate required – hollow logs as a substrate for laying eggs
Pigmy Perch Nannoperca australis 3 + years Sept - Oct 3-5 days Local only Vegetation or rocks instream habitat required
Big-headed Gudgeon Philypnodon grandiceps
4-7 years Oct - Feb 4-6 days Local only Hard surfaces required as a substrate for laying eggs
*Time that eggs take to develop into larvae (eggs require inundation at least for this period)

SECTION 5 Environmental Values and Current Condition
122
5.7 Aquatic Fauna Habitat and Flow Objectives
Reach 1 – Upper Barwon River (Dam to Birregurra Ck junction)
Habitats in the upper part of this reach and largely confined to the well defined channel with a narrow strip of riparian vegetation on steep and sometimes incised river banks. The river channel here retains good submerged aquatic vegetation beds, undercut banks, overhanging vegetation as well as a riffle/pool sequence providing relatively some habitat diversity for fish and other aquatic fauna. Further downstream, the Barwon flows through the Gerangamite Valley, which has a low grade and retains features of a complex ‘chain of ponds’ wetland environment though a channelised section of stream has been formed in the deepest zone. Pools and shallow wetland and floodplain flats are important habitats in this section for fish and aquatic fauna.
Key roles of flow for aquatic fauna and its habitat in this reach are:
• maintain likely permanent pools in the drain, which provide a refuge and permanent population for fish; and,
• inundation the flat immediately adjacent to the channel which adds to the complexity and extent of habitat available, breeding opportunities for aquatic macro-invertebrates and fish such as dwarf galaxias, and pigmy perch. Prolonged inundation (2-4 weeks at least) during late winter and spring would be of most benefit.
Reach 2 – Winchelsea (Barwon River from Birregurra Ck junction to Leigh River junction)
The Barwon River at this site has a clearly defined, steep-sided channel cut into a broad floodplain. The channel is sandy with rocky outcrops which form small riffles and adjacent to the streambed there are several vegetated shelves and islands which would be inundated during low flow flushes providing additional fish and macro-invertebrate habitat. Instream habitats are enhanced by some over-hanging vegetation and large woody debris. The floodplain is largely cleared with some overstorey trees and tussock grasses.
The key roles of flow for aquatic fauna and its habitat in this reach are:
• frequent low flows to maintain pools;
• high flows to maintain pool riffle sequence and maintain instream habitat complexity;
• frequently inundate instream shelves and benches during winter and spring to provide addition macroinvertebrate habitats and breeding habitat for fish;
• maintain flow at or near the level of emergent riparian vegetation at the base of the bank during winter and spring to provide fish habitat and a source of terrestrial insect fall as a source of food for fish.

SECTION 5 Environmental Values and Current Condition
123
Reach 3 – Murgheboluc Valley (Barwon River from Leigh River junction to Moorabool River junction)
This reach has complex geomorphic, vegetation and habitat features which result in the most species diverse reach for fish in the Barwon system. This reach (as represented by our study site) alternates between large and deep single channel sections with deep pools and long riffles and sections with multiple low flow channels over a significant grade change with fast flowing water. The substrate is sand, gravel and cobbles which means the areas between these small channels are extensively vegetated which are regulated inundated by moderate and high flows and intermittent flushes. At higher flows, benches and high flow channels become active dramatically increasing aquatic fauna habitat at these times and temporary pools and wetland habitats develop in this section. The banks are well covered with marginal and riparian vegetation and the stream and bank has extensive woody debris, all providing excellent cover and fish habitat.
The key roles of flow for aquatic fauna and its habitat in this reach are:
• baseflows and high flow freshes to recharge the local aquifer and prevent excessive salinisation and eutrophication of the site;
• perennial low-moderate flow to provide inundated low flow channels and shallow rocky riffles;
• provide prolonged spring flows to inundate channels and pools on benches every year to initiate fish breeding and allow for fish recruitment;
• provide high flow freshes to activate channels on benches several times every year, to fill pools and provide flooding to benches to increase habitat for aquatic invertebrates; and
• provide bank full flows to rework benches and islands once every 10 years, disturbing vegetation and creating a variety of habitats.
Reach 4 – Geelong (Barwon River from Moorabool River junction to Lower Breakwater)
This reach’s habitats have been extensively modified by clearance of the floodplain and simplification of the riparian zone by river regulation by the breakwater which maintains the reach as freshwater. Previously, the reach would have had a variable salinity depending upon river flows. Now the channel is a permanent, deep, wide and slow flowing waterbody which consists of open water habitat and a narrow aquatic macrophyte fringe in shallow flooded shelves. The riparian zone is narrow and modified by works to prevent flooding and urbanisation. The floodplain is highly modified by previously clearance, lack of natural flooding and weed invasion. One small area has been rehabilitated which receives stormwater overflows and occasional flood flows from the Barwon. Large floods still occur but urban infrastructure is flooded and significant community pressure exists to prevent such flooding. Nevertheless, the rehabilitated part of the floodplain indicates that the floodplain could be rehabilitated and reconnected to river flows, regaining many natural values in this reach if urban infrastructure issues could be resolved.

SECTION 5 Environmental Values and Current Condition
124
Despite these changes, significant fish populations, such as the threatened Australian Grayling, exist in this reach.
The key roles of flow for aquatic fauna and its habitat in this reach are:
• permanent flows to support fish populations with occasional water level drawndowns to 1 m deep to maintain the habitat quality of the shallow fringe zone;
• support a narrow zone of riparian vegetation with frequent small freshes throughout the year that raise the water level by up to 0.5 m above the pool level, especially during spring; and
• inundate the floodplain every 2 to 3 years to promote breeding and recruitment of fish.
Reach 5 – Estuary
The Estuary is a complex of habitats, such as:
– Salt Swamp
– Hospital Swamp
– Reedy Lake
– Lake Connewarre
Each has a range of values for fish and aquatic fauna, despite modification of the water regime of three of these, with only Lake Connewarre fully connected to the estuary. The habitat values are described in the vegetation section above.
Salt Swamp
The aspects of the water regime for aquatic fauna and its habitat for Salt Swamp are:
• drying of the wetland bed in summer and autumn to maintain the habitat; and
• flooding the wetland during late winter and spring for at least 3-4 months to create habitat, trigger breeding and allow for fish recruitment; and
• flooding in the fringing shrubland and sedgelands for 1- 2 months every 3 years to enable significant breeding events for fish species.

SECTION 5 Environmental Values and Current Condition
125
Hospital Swamp
The aspects of the water regime for aquatic fauna and its habitat for Hospital Swamp are:
• permanent low levels of inundation to maintain permanent pools to allow fish to over summer and maintain a complex of aquatic vegetation beds by drying out some areas and leave others inundated;
• winter and spring inundation in most years for about 3 months to at least 0.5 m AHD to support the creation of extensive aquatic habitat, stimulate fish breeding and enable recruitment of fish larvae; and
• intermittent deeper inundation (events of 1 to 2 weeks, about twice per year, in the spring) to enable extensive breeding events of fish such as galaxiids within the sedgelands.
Reedy Lake
The aspects of the water regime for aquatic fauna and its habitat for Reedy Lake are:
• a variable water regime with greater seasonal variation and a lower average water depth to promote a more diverse aquatic vegetation and habitat;
• the lake should be flooded during winter and spring each year for at least one month for triggering fish breeding and longer periods (at least 3 months) to enable large scale fish larvae recruitment;
• a drying phase to control exotic fish species and allow nutrient processing in the wetland bed during late summer and autumn, some pools should remain to allow fish to over summer;
• high level intermittent flooding in winter and spring by rainfall and river flows every 2-3 years to allow extensive flooding, aquatic habitat creation and fish breeding events.
Lake Connewarre
Lake Connewarre, the current active estuary of the Barwon, is characterised by dynamic changes in water levels and salinity – this variability is required to maintain the diverse fish and macroinvertebrate fauna.
The aspects of the water regime for aquatic fauna and its habitat for Lake Connewarre are:
• Complete flushing during winter to maintain salinities at or below seawater;
• Spring flushes of freshwater from upstream to lower salinity and flood marginal zones of the lake to trigger fish breeding and recruitment;
• Low discharge in autumn to minimise flushing; and,
• Flows over the fishway at Lower Breakwater to enable fish movement along the lower Barwon.

SECTION 5 Environmental Values and Current Condition
126
Reach 6 – Birregurra Creek
Birregurra Creek is a wide and shallow temporary stream which is largely cleared and flows slowly through a broad open channel. The stream is natural saline and also receives saline discharge from the Lough Calvert drainage scheme.
The key roles of flow for aquatic fauna and its habitat in this reach are:
• cease to flow in summer and autumn to macroinvertebrates to lay drought-resistant eggs, reset fish populations and to maintain to open grassland habitat;
• low flows to create shallow flooding and aquatic habitat for 3-6 months per year which will allow fish to invade and utilise the macroinvertebrate and habitat resources of the stream;
• multiple high flow freshes on an annual or bi-annual basis to create extensive inundation of the flats and benches in the reach to allow fish breeding and recruitment.
Reach 7 – Boundary Creek
The Boundary Creek is a small stream which is baseflow driven but is large modified comprising a narrow, incised channel set in a broad, cleared floodplain. The habitats for aquatic fauna are surprisingly good and in areas where a narrow riparian strip is being revegetated they are even more diverse. Extensive aquatic vegetation beds, pools, riffles, runs, under cut banks, overhanging vegetation and some woody debris all provide habitats for fish and aquatic invertebrates (including listed threatened species).
The key roles of flow for aquatic fauna and its habitat in this reach are:
• provide baseflow throughout the year to support permanent fish populations;
• provide low flow freshes with a sustained descending flow limb several times during winter and spring to increase aquatic habitat and trigger fish breeding and recruitment; and,
• provide high flow freshes annually to support riparian habitat and maintain physical habitat.
Reach 8 – Mid-Leigh River (Cambrian Hill to Quiney Hill)
This reach consist of complex range of habitats including deep pools (with slow flowing water), extensive runs with aquatic vegetation and shallow rocky riffles (with fast flow). Overhanging vegetation, undercut banks, rocks and boulders, woody debris and marginal and instream vegetation provide excellent aquatic fauna and fish habitat. The floodplain has a complex set of habitats including relatively high energy runners and low energy benches. These runners flow from the main channel at almost all river levels providing a complex and dynamic aquatic habitat.

SECTION 5 Environmental Values and Current Condition
127
The key roles of flow for aquatic fauna and its habitat in this reach are:
• low flows during summer to dry out the floodplain habitats, reset fish populations, open high level pools and allow nutrient processing;
• moderate flows in winter and spring of every year for more than 5 months to support aquatic fauna and fish to maintain a range of aquatic habitats;
• high flows in winter and spring to create aquatic habitat on the floodplain and in runners to create habitat which sustains fish and macroinvertebrate populations;
• regular high flow freshes every winter and spring to trigger fish breeding and allow fish to floodplain and instream aquatic habitat;
• bankfull flow to maintain physical habitat; and
• annual or bi-annual overbank flows for a period of several days to maintain riparian vegetation.
Reach 9 – Lower-Leigh River (Quiney Hill to confluence with Barwon River)
This reach is typified by a simplified instream habitat due to sand slugs moving from upstream clearing meaning that the pools riffle sequence is largely eliminated and aquatic macrophytes are sparse. Some pools remain but these are now much shallower than they once were (Gary Wishart per comm.). Woody debris and undercut banks do exist but are also modified by the sand slug. Several sand bars and sandy shelves are occasionally present and provide some vegetated zones as do the margins of the stream bank which provides further fish and aquatic fauna habitat. The floodplain is connected by flood flows annually but poor habitat conditions mean that little effective use can be made by fish and aquatic macroinvertebrates except within various billabongs which do provide some habitat however regular flooding may be required to allow fish to migrate back to the main river.
The key roles of flow for aquatic fauna and its habitat in this reach are:
• baseflow in winter and spring to support permanent fish populations;
• high flow freshes to trigger fish breeding and create aquatic habitat for macroinvertebrate populations;
• annual bankfull flows to maintain channel form and inundate bank vegetation; and,
• overbank flows every few years to inundate billabongs and floodplain redgums, allow fish and macroinvertebrates to colonise and breed. Repeat flows 3-6 months latter will allow return of fish to the main stem and prolonging the aquatic habitat of billabongs.

SECTION 6 Constraints and Risks
128
6 C o n s t r a i n t s a n d R i s k s
6.1 Key Information Gaps
• Few fish, macro-invertebrate and macrophyte surveys have been undertaken throughout catchment. The assessment of vegetation and aquatic fauna relationships with flow are largely based on the field investigation and the Panel’s experience.
• Groundwater discharge throughout the system is poorly known except for those sites in the Barwon Downs region. There is little groundwater level and quality data to assess the contribution of groundwater discharge to stream hydrology.
6.2 Constraints by Non-flow-related Issues
Clearance of native vegetation, unrestricted stock access (and grazing effects on vegetation and habitat diversity) and invasion by weeds and exotic aquatic species contribute to the degradation of the riparian and aquatic habitat. The benefits of environmental flow amendments will not be realised until these aspects of stream health are also addressed and these aspects are of equal or greater importance to stream health than flow in some reaches of the Barwon River and its tributaries. Some programs are underway which are most effective on public lands but is limited to committed private landholders.
Saline and nutrient discharges from the two drainage schemes and the Ballarat (respectively) potentially impact upon stream health and these factors need to be considered when setting stream health objectives.
6.3 Operational Constraints
The requirement of the river system to supply and convey water to urban consumers is a potential constraint on the delivery of environmental flows. The restoration of a more natural flow pattern may be limited by the availability of water for environmental needs or the demands of consumers for particular flows. The extensive regulation of the Moorabool system (which has been examined by a previous study) may limit water availability for the lower Barwon.
6.4 Risks Associated with Flow Changes
The proposed flow changes may result in changes to habitat and stream geomorphology which may cause short or long term stressors to habitat and aquatic biotic diversity or impact upon stream infrastructure. Interactions between environmental flow provisions, stream geomorphology & habitat and stream management actions, such as revegetation and stock exclusion will be examined when the flow objectives are refined later in the project.

SECTION 7 References
129
7 R e f e r e n c e s
Barwon Water 2003. Water Resources Development Plan. Geelong.
Carr, G.W. (1994). Inventory and assessment of floral and faunal values of the Barwon Down aquifer outcrop areas and assocaites streams, Otway Ranges, Victoria. Ecology Australia PtyLtd, Clifton Hill, Victoria.
Carr, G.W. (2002). Barwon Downs aquifer flora re-survey. Report prepared by Ecology Australia for Barwon Water.
CCMA (2005) Corangamite River Health Strategy. Corangamite CMA.
DCNR 1995. Barwon River Basin Overview Report. Environmental input into the Bulk Entitlement Conversion Process. Draft Report. Office of Water Reform, Department of Conservation and Natural Resources, Victoria, Melbourne, April.
DNRE. 2001. Review of the Benefits of Bulk entitlements Conversion Process on the Environmental Health of the Barwon River: A Report to Barwon Water.
Drew, S.W.G. and Atkin-Smith, R.E. 1987. South-west Region Water Management Strategy, Agricultural Aspects. Research Report Series No. 42. Department of Agriculture and Rural Affairs, Victoria.
DWR 1988. Managing the water resources of South-Western Victoria. Water allocations issues paper. Water Resource Management Report Series No. 18. South-Western Region Task Force, Department of Water Resources, Victoria.
DWR 1989a. Water Victoria, an Environmental Handbook. Department of Water Resources, State of Victoria, Melbourne.
DWR 1989b. Water Victoria, a Resource Handbook. Department of Water Resources, State of Victoria, Melbourne.
Earth Tech 2004. Leigh River sediment sourcing and transport. Corangamite Catchment Management Authority.
Gippel, C.J. 2001. Hydrological analyses for environmental flow assessment. In Ghassemi, F. and Whetton, P. (eds) Proceedings MODSIM 2001, International Congress on Modelling and Simulation, Modelling & Simulation Society of Australia & New Zealand, The Australian National University, Canberra, pp. 873-880.
Gippel, C.J. 2002. Geomorphic issues associated with environmental flow assessment in alluvial non-tidal rivers. Australian Journal of Water Resources 5(1): 3-19.
Gordon, N.D., McMahon, T.A., Finlayson, B.L., Gippel, C.J. and Nathan, R.J. 2004. Stream Hydrology: An Introduction for Ecologists. Second Edition, John Wiley & Sons, Chichester.
Hills, E.S. 1955. Physiography and Geology. In G.W. Leeper (Ed.) Introducing Victoria. Australian and New Zealand Association for the Advancement of Science, Melbourne, pp. 25 – 39.

SECTION 7 References
130
Hughes, D.A., Hannart, P. and Watkins, D. 2003. Continuous baseflow separation from time series of daily and monthly streamflow data. Water SA 29(1) URL: http://www.wrc.org.za (accessed 10th August 2005).
Jenkin, J.J. 1988b. Geomorphology. In Douglas, J.G. and J.A. Ferguson (eds) Geology of Victoria. Victorian Divis ion of the geological Society of Australia Inc., Melbourne, August, pp. 403 – 419.
Joyce, E.B. 1988. Newer Volcanic Landforms. In Douglas, J.G. and J.A. Ferguson (eds) Geology of Victoria. Victorian Division of the geological Society of Australia Inc., Melbourne, August, pp. 419 – 426.
Lyne, V. and M. Hollick, 1979. Stochastic time-variable rainfall-runoff modelling. Hydrology and Water Resources Symposium, Perth. Institution of Engineers Australia National Conference Publication 79/10. Institution of Engineers Australia, Canberra, ACT, pp. 89–93.
Nathan, R.J. and McMahon, T.A. 1990. Evaluation of automated techniques for base flow and recession analysis. Water Resources Research 26: 1465-1473.
NRE 2001. Review of the benefits of the bulk entitlement conversion process on the environmental health of the Barwon River. A report to Barwon Water. Natural Resources and Environment, State of Victoria, Melbourne.
Pyrce, R. 2004. Considering baseflow as a low flow or instream flow. WSC Report No.04-2004 Appendix. Watershed Science Centre, Trent University, Symons Campus, Peterborough, Ontario, September, 17 p. URL: http://www.trentu.ca/wsc/PDFfiles/LowFlowOntRptApp2004.pdf (accessed 10th August 2005).
Raadick, T. 2000. Brief environmental assessment of the Barwon Water Supply Headworks (Upper Barwon River). Arthur Rylah Institute for Environmental Research, Department of Natural Resources and Environment.
SKM 2002. Barwon Downs Groundwater Study Stage 2. Impacts on Boundary Creek. Barwon Region Water Authority, February.
SKM 2005. Environmental water requirements of the Barwon System: preparation of daily stream flow data for the Barwon River, Draft A. Corangamite Catchment Management Authority, May.
Tindale, N.B. 1974. Aboriginal Tribes of Australia. University of California Press.
Tunbridge, B.R. and Rogan, P.L. 2004. A Guide to the Inland Angling Waters of Victoria. 5th Edition. Department of Primary Industries, The State of Victoria. URL: http://www.dpi.vic.gov.au/angling/33-Barwon/BasinWaters.htm (accessed 1st July 2005).
Yugovic, J.Z. (1985) The vegetation at the Lake Connewarre State Game Reserve. Arthur Rylah Institute for Environmental Research, Heidelberg.

Appendix A Flora and Fauna Names
131
Common and Scientific Names of Flora and Fauna (* exotic species)
Common Name - Flora Scientific Name
*African Boxthorn Lycium ferocissimum
*Annual Veldt Grass Eharta longifolia
*Blackberry Rubus sp.
*Desert Ash Fraxinus rotundifolia
*Gorse Ulex europaeus
*Hawthorn Crataegus monogyna
*Kikuyu Pennisetum clandestinum
*Malta Thistle Centaurea melitensis
*Pepper Tree Schinus
*Periwinkle Vinca major
*Spanish Artichoke Cynara cadunculus
*Toowoomba Canary-grass Phalaris aquatica
*Water Cress Nasturtium officinale
*Willow Salix sp.
Black Wattle Acacia mearnsii
Blackwood Wattle Acacia melanoxylon
Blown Grass Agrostis sp.
Blue Box Eucalyptus bauerana
Bull Mallee Eucalyptus behriana
Buttercup Ranunculus spp.
Canary Grass Phalaris
Club-rush Bolboschoenus sp.
Common Bog-sedge Schoenus apogon
Common Reed Phragmites australis
Common Spike-sedge Eleocharis acuta
Common Tussock-grass Poa labillardieri
Couch Paspalum distichum
Cumbungi Typha sp.
Dock Rumex spp.
Drooping She-oak Allocasuarina verticillata
Eel Weed Vallisneria americana var. americana
Floating Club-sedge Isolepis fluitans
Fragrant Saltbush Rhagodia parabolica
Hollow Sedge Carex tereticaulis
Inland Pigface Carpobrotus modestus
Knobby Club-rush Isolepis nodosa
Large Kangaroo Apple Solanum laciniatum

Appendix A Flora and Fauna Names
132
Common Name - Flora Scientific Name
Manna Gum Eucalyptus viminalis
Marsh Saltbush Atriplex paludosa
Milfoil Myriophyllum sp.
Moonah Melaleuca lanceolata
River Bottlebrush Callistemon sieberi
River Club-rush Schoenoplectus validus
River Red Gum Eucalyptus camaldulensis
River Tea-tree Leptospermum obovatum
Ruby Saltbush Enchylaena tomentosa
Rush Juncus sp.
Sharp Rush Juncus acutus
Silver Wattle Acacia dealbata
Southern Shepherds -purse Ballantinia antipoda
Spear Grass Stipa sp.
Spiny-headed Mat-rush Lomandra longifolia
Sticky Hop-bush Dodonea viscosa
Streaked Arrow-sedge Triglochin striatum
Tall Sedge Carex appressa
Tall Spike-sedge Eleocharis sphacelata
Tree Violet Hymenanthera dentata
Wallaby Grass Danthonia sp.
Watercress Rorippa nasturtium -officianale
Waterwort Elatine gratioloides
Wirilda Acacia retinodes
Woolly Tea Tree Leptospermum lanigerum