The Energy & Resources Institute, New Delhi 10 … Prodipto Ghosh_TERI.pdf · The Energy &...
36
Prodipto Ghosh, Ph.D Distinguished Fellow The Energy & Resources Institute, New Delhi 10 November 2013
-
Upload
hoangquynh -
Category
Documents
-
view
213 -
download
0
Transcript of The Energy & Resources Institute, New Delhi 10 … Prodipto Ghosh_TERI.pdf · The Energy &...

Prodipto Ghosh, Ph.D
Distinguished Fellow
The Energy & Resources Institute, New Delhi
10 November 2013

India’s key environmental challenges relate to the nexus between environment and poverty, and economic growth
At present c. 20% of disease burden in India is directly linked to environmental degradation, and several environmental health factors – e.g. lack of access to clean water/energy
Intrinsically connected with state of environmental resources – land, water, air, flora and fauna
Proximate drivers are: population growth, inappropriate technology and consumption choices, and poverty, leading to changes in relations between people and ecosystems, and development activities e.g. intensive agriculture, polluting industry, unplanned industrialization
However, these factors give rise to environmental degradation through institutional failures – lack of clarity or enforcement of access rights, perverse fiscal policies, market (or regulatory) failures, governance constraints
2

Environmental degradation is a major factor in enhancing poverty when soil fertility, water (quantity and quality), air quality, forests, fisheries, and wildlife, are affected
Women are particularly affected, given their role in collection and use, but not management, of environmental resources
Poor are vulnerable to loss of resilience (capacity to withstand natural or manmade shocks) in ecosystems, due to loss of genetic diversity
Urban environmental degradation – lack of sanitation/wastewater treatment, industry and transport related pollution, differentially affects the poor (more exposed in home/workplace), leading to loss of employment, schooling, financial stress for medical treatment.
3

Multilateral environmental challenges – climate change, biodiversity loss, ozone depletion – need to ensure that global treaties do not place constraints on country’s development, but enhance economic opportunities. Our approach to these issues is premised on the principle of “common but differentiated responsibilities” of countries, and equal per-capita sharing of global environmental resources.
4

The present policy/legal/regulatory structure for the environment are contained in:
National Forest Policy, 1988
Forest Act 1927, Forest Conservation Act 1980
Wildlife Protection Act, 1972
Environment Protection Act, 1986
Water (Prevention and Control of Pollution Act), 1974
Air (Prevention and Control of Pollution) Act, 1981
5

The National Environment Policy, 2006
In addition, various sector policies, such as National Agriculture Policy, 2000; National Population Policy, 2000; National Water Policy, 2002, have important bearing on environmental outcomes
The question is, have these policies and laws/regulations “worked”? I will answer this in the later part of this presentation
6

India’s National Environment Policy, 2006 is premised on sustainable development, not environmental protection in isolation from the broader development context:
Definition: “First, that human beings should be able to enjoy a decent quality of life; second, that humanity should become capable of respecting the finiteness of the biosphere; and third, that neither the aspiration for the good life, nor the recognition of biophysical limits should preclude the search for greater justice in the world”.
7

To protect and conserve critical ecological systems and resources
To ensure intra-generational and inter-generational equity
To integrate environmental concerns in economic and social development
To ensure efficiency in environmental resource use
To apply principles of good environmental governance
To enhance resources for environmental conservation
8

Regulatory Reforms (in the legislative framework and regulatory institutions)
Revisiting the legislative framework
Process related reforms:
o Approach
o Framework for legal action
9

Substantive reform in:
o Environment and forest clearance procedures
o Coastal areas management
o Living Modified Organisms (LMOs) processes
o Environmentally Sensitive Zones Management
o Monitoring and enforcement
o Use of economic principles in decision making
10

Enhancing and Conserving Environmental Resources in :
o Land degradation
o Forests
o Wildlife
o Biodiversity, Traditional Knowledge, and Natural Heritage
11

Fresh Water Resources-
o River Systems
o Groundwater
o Wetlands
Mountain Ecosystems
Coastal Resources
12

Pollution Abatement
o Air
o Water and
o Soil
Conservation of Manmade heritage
Climate Change
13
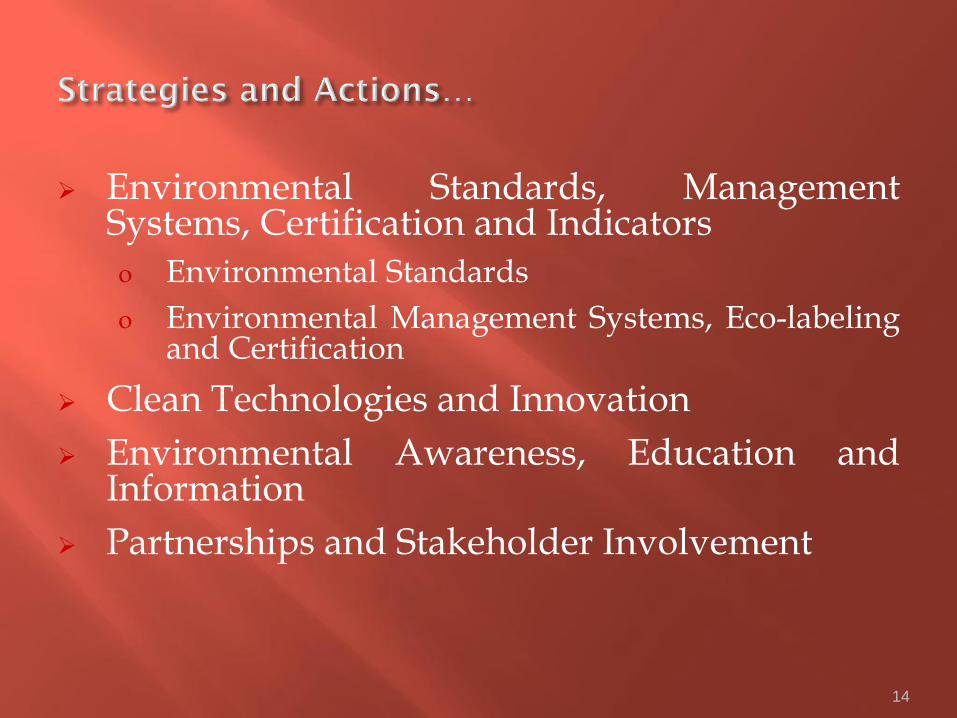
Environmental Standards, Management Systems, Certification and Indicators
o Environmental Standards
o Environmental Management Systems, Eco-labeling and Certification
Clean Technologies and Innovation
Environmental Awareness, Education and Information
Partnerships and Stakeholder Involvement
14

Consultations with groups of diverse stake holders would be undertaken every three years for updating
Comprehensive examination in the third of the three years reviews
15

Societal resources are fungible and may be used for different purposes
The approach must be to consider a range of societal risks collectively, in the sense that it is pointless to spend large resources on small risk from one source, and few resources on large risk from others
A formal approach would equate the unit costs of risk reduction from different sources to maximize risk reduction across society as a whole for a given level of societal resources => as a society becomes richer, it can afford more stringent standards!
16

Traditionally, environmental regulation has relied upon a fiats based, criminal penalties oriented system for violations
What are the problems with this approach?
Costs of compliance may be excessive because regulatees cannot realize opportunities for cost-reduction in meeting standards; in particular, prescribing particular abatement technologies may be unnecessarily costly
17

Evidentiary requirements for criminal prosecutions cannot generally be met in environmental violation situations
What are alternative approaches?
Incentive based (or “economic” instruments)
Greater reliance on civil liability, as opposed to criminal prosecutions
18

Greater reliance on civil liability may involve lower evidentiary burdens than criminal prosecutions
Enables compensation for impacted population
Both “fault-based” and “strict liability” may be applied
Currently based on jurisprudence rather than environmental statute
19

Traditionally monitoring done exclusively by centralized public agencies
Reason: requires scientific skills, independence from regulatee
Problems: “Regulatory capture” by regulatee; major stakeholders the potentially impacted local publics
20

Decentralize to public agencies having necessary scientific capability and spatial jurisdiction at levels at which impacts may occur
Partial responsibility to local public agencies for monitoring mandated environmental management plans (which may require lesser scientific capacities)
Possibilities of multistakeholder partnerships between independent monitoring agency, local governments, and regulator
21

Programme: Corporates voluntarilty undertake environmental protection measures beyond legal regulatory requirements under the “ Corporate Responsibility for Environmental Protection “ (CREP) programme
May relate to abatement of their own pollution below prescribed standards; and/or environmental conservation in the local area more generally
Benefit: Improved corporate image; increased employee motivation; greater support of local communities
22

If population does not internalize environmentally responsible behaviours, societal costs of clean-up may be excessive; regulatory systems may be overwhelmed
Analogy: moral sense among people enables law and order burden to be manageable
Environmental education from primary school levels, media campaigns, are accordingly a major component of environmental policy
23

Sustainability outcomes depend not only upon policies and regulations, but also upon lifestyles
We look at some indicators of lifestyles having a bearing on sustainability, irrespective of income levels:
24

25
Source: TERI analysis (various data sources)
0.1 0.1
1.7 1.8 1.9
2.0 2.2
0.00
0.25
0.50
0.75
1.00
1.25
1.50
1.75
2.00
2.25
2.50
India China UnitedKingdom
Germany Netherlands Australia United States
ton
CO
2/m
kca
l o
f fo
od
en
erg
y
CO2 emission from food sector--from Field (production) to Table (processed food)-excluding cooking
Production related CO2 emission (tonne CO2/million kcal of food energy)
Processing related CO2 emissions (tonne CO2/million kcal of food energy)
Total CO2 emissions (tonne CO2/million kcal of food energy)

26
30
47.3 53
70
0
20
40
60
80
US Germany Japan India
23
10 8
4
0
5
10
15
20
25
USA UK Germany India
Average rate of recycling (%) (excl. re-use)
GHG emissions from waste (gm/’000$GDPppp)
Municipal solid waste
Source: TERI Analysis, based on National Communications of different countries

16
118
193
0
50
100
150
200
250
India EU (15 countries) USA
27
Estimated CO2 emissions from passenger transport
(gm/passenger-km)
Source: TERI Analysis, various data sources

0.4 74 22 1 43 45 17
630
456
94
1599
1907
0
200
400
600
800
1000
1200
1400
1600
1800
2000
Aluminium Cement Steel
(thou
sand
ton
nes/
capi
ta/s
q. k
ilom
etre
s)
India Japan EU-15 USA
28

The National Geographic has, since
2008, been evaluating several countries
on the sustainability of life styles.
In the first evaluation (2008), India tied
with Brazil for the first place
In all the subsequent evaluations (2009-
2012), India was ranked No. 1.
29

Is India doing better or worse than currently developed countries when they were at comparable levels of development
To answer this, we look at statistical estimates of the Environmental Kuznets curve for several environmental parameters in case of India
Environmental Kuznets curve: Empirical relationship showing that during economic growth, environmental parameters at first worsen, and then improve
The historical turning point for currently developed countries is $ 6000-8000 per-capita in PPP terms
30

31
• An inverted U shaped relationship between various
environmental indicators and levels of economic growth
• Initial stages of economic growth can lead to environmental
degradation. Later stages, improvement due to demand for
better environment, government initiative, shifts in
technology, etc.

32 EKC U
Countries SO2 SPM NOx
MK* India
CRB* 11 OECD $6,900 $7,300 $14,700
GK1* Upto 32 countries $4,107
GK2* Upto 32 countries $4,053
P1* $3,000 $4,500 $5,500
P2* 30 developed and developing $5,000
SS* 22 OECD and 8 developing $10,700 $9,600 $21,800
SB* 31 countries $3,670 $3,280
$1,695 $1,640 $1,707
$957 $1,440 $1,413
$1,752 $1,840 $1,770
MK= Mukherjee and Kathuria (2006)
CRB= Cole et al (1997)
GK1= Grossman and Krueger (1993)
GK2=Grossman and Krueger (1995)
P1= Panayotou (1995)
P2= Panayotou (1997)
SS= Selden and Song (1994)
SB= Shafik and Bandhopadhya (1994)
* in 1985 US $
**industrial, transport and residential sectors, respectively
for the study by MK, a composite index of pollution including
63 environmental indicators has been used as the dependent variable
$523
This
studyIndia (ind, trans and res)**

33
Countries BOD COD Wastewater
MK* India
GK*Upto 32
countries $7,623 $7,853
CSB* India $2,369
NP** India $65
$1,668 $3,150 (CI cities)
$1,694 (CII cities)
MK= Mukherjee and Kathuria (2006)
GK=Grossman and Krueger (1995)
CSB= Chandra Sahu and Bali (2006)
NP= Narayanan and Palanivel (2003)
*in 1985 US $
** in constant 1995 US $
for the study by MK, a composite index of pollution including
63 environmental indicators has been used as the dependent variable
$523
This
studyIndia
$548 and
$ 2,388
EKC N U

34 Turning points for per capita forest cover are $ 1,330 and $ 5,302
EKC N U Inverted N
Global Latin Amercia Africa Asia India
MK* $523
AH* $2,049
CG* $5,420 $4,760
P* $823
C ** $2,097
BH***$6,600
$1,300 &
$ 5,000
$2,200 &
$5,500
KT**** $501 $1,537 $1,510 $797
This
study
$1,955 &
$2,988
MK= Mukherjee and Kathuria (2006)
AH= Antle and Heidebrink 1995
CG= Cropper and Griffiths 1994
GK2=Grossman and Krueger (1995)
P= Panayotou (1995)
C= Culas (2006)
BH= Bhattarai and Hammig (2001)
KT= Koop and Tole (1999)
* in 1985 US $
** in 1995 US $ (at market prices)
*** in PPP 1985 US $
****adjusted to a common set of international prices
for the study by MK, a composite index of pollution including
63 environmental indicators has been used as the dependent variable

India still has a long way to go in ensuring sustainable development, broadly defined
However, despite strenuous attempts by various quarters, to portray India as environmentally irresponsible, a careful reading of the facts reveals otherwise
International comparisons show that India has generally done better than currently developed countries at comparable stages of their development
This is to be attributed to policies, laws, regulation, and the inherent sustainability of India’s cultural norms
35

36