
The Energy Report © Wild Wonders of Europe / Inaki Relanzon / WWF Addressing Instability BECCS and...
26
The Energy Report © W i l d W o n d e r s o f E u r o p e / I n a k i R e l a n z o n / W W F Addressing Instability BECCS and climate – Saveguards needed Stephan Singer Stockholm 11 June 2012
-
Upload
regina-knapton -
Category
Documents
-
view
219 -
download
2
Transcript of The Energy Report © Wild Wonders of Europe / Inaki Relanzon / WWF Addressing Instability BECCS and...

The Energy Report
© W
ild Wonders of E
urope / Inaki Relanzon / W
WF
Addressing InstabilityBECCS and climate –Saveguards needed
Stephan Singer
Stockholm
11 June 2012

The Energy Report
Global energyconsumption trends
Source: BP Stat. Review 2011
Mil
l t
OE

The Energy Report
Global fuel CO2 emissions
0
2000
4000
6000
8000
10000
12000
14000
Coal Oil Gas
1971
1985
2000
2008
Source: IEA, 2011
Mil
l t
CO
2
April 2011
19 April 2023 - 4
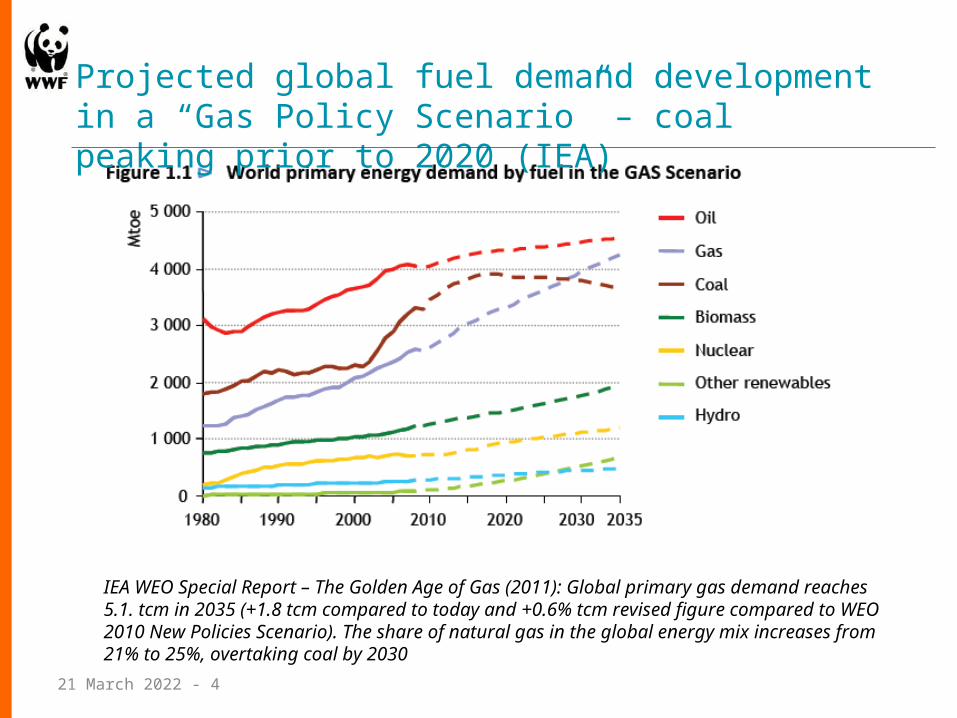
IEA WEO Special Report – The Golden Age of Gas (2011): Global primary gas demand reaches 5.1. tcm in 2035 (+1.8 tcm compared to today and +0.6% tcm revised figure compared to WEO 2010 New Policies Scenario). The share of natural gas in the global energy mix increases from 21% to 25%, overtaking coal by 2030
Projected global fuel demand development in a “Gas Policy Scenario” – coal peaking prior to 2020 (IEA)

IPCC GHG emissions and temperature scenarios until 2100, A1B is one of the central IPCC scenarios (+3 degree by 2100)
Source: IPCC (4AR, 2007)

Regional annual temperature change by 2100 compared to 1980- 1999 average under A1B
Source: IPCC (4AR, 2007)

Regional seasonal % precipitation change by average 2090-2099 compared to 1980- 1999 average under A1B;left: December to February; right: June to August
Source: IPCC (4AR, 2007)

Marine pH development and change under A1B;
Source: Turkley & Findlay (2009)
Pre-industrial
Surface ocean pH
Present day
Projected for 2100 under SRES A1FI scenario
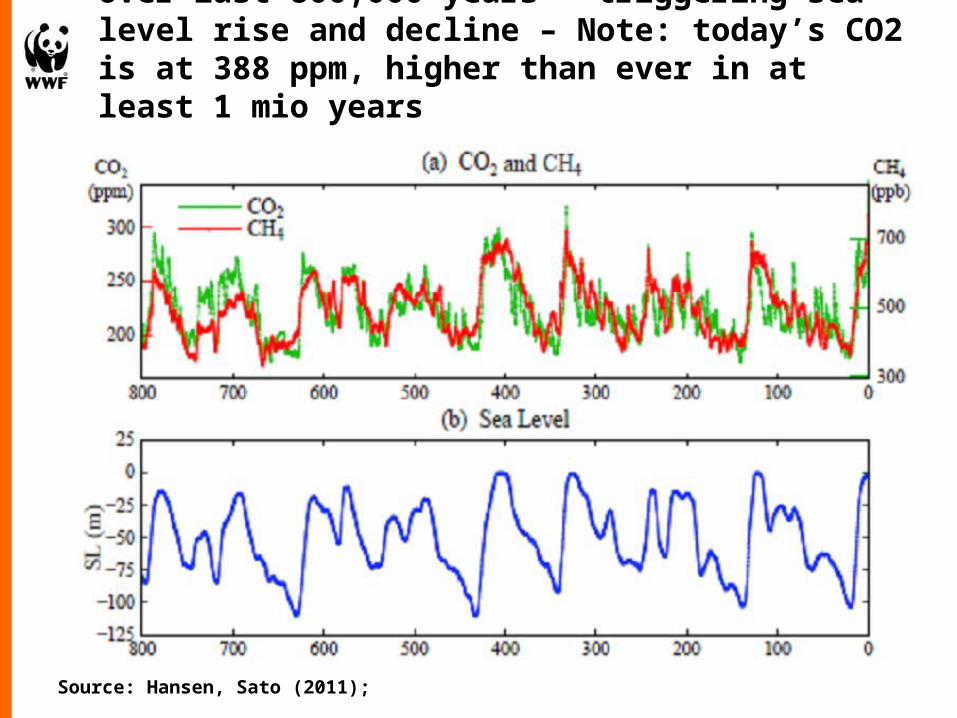
Atmospheric CO2 and CH4 concentrations over last 800,000 years – triggering sea level rise and decline – Note: today’s CO2 is at 388 ppm, higher than ever in at least 1 mio years
Source: Hansen, Sato (2011);

Future danger zones of temperature increases above 1990
Source: IPCC (4AR, 2007)

Once the damage is done…..slow responses of nature resulting from CO2 cuts
Source: IPCC (AR 4, 2007)

Hypothetical 100% cut of GHG emissions do NOT change CO2 concentrations in atmosphere for a long time UNLESS CO2 is removed (Negative Emissions)
Source: Hadley Centre (HadCM3LC model 2009)

The Energy ReportIPCC Emissions/stabilisation scenarios
Zero emissions globally
Source: IPCC 2007
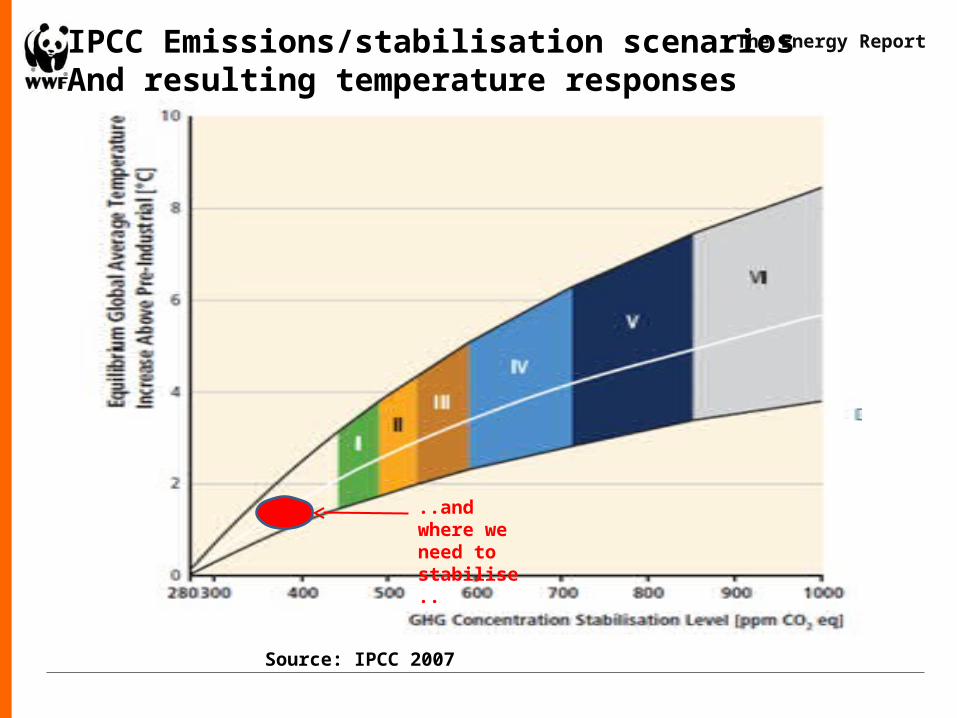
The Energy ReportIPCC Emissions/stabilisation scenariosAnd resulting temperature responses
Source: IPCC 2007
..and where we need to stabilise..
The Energy Report
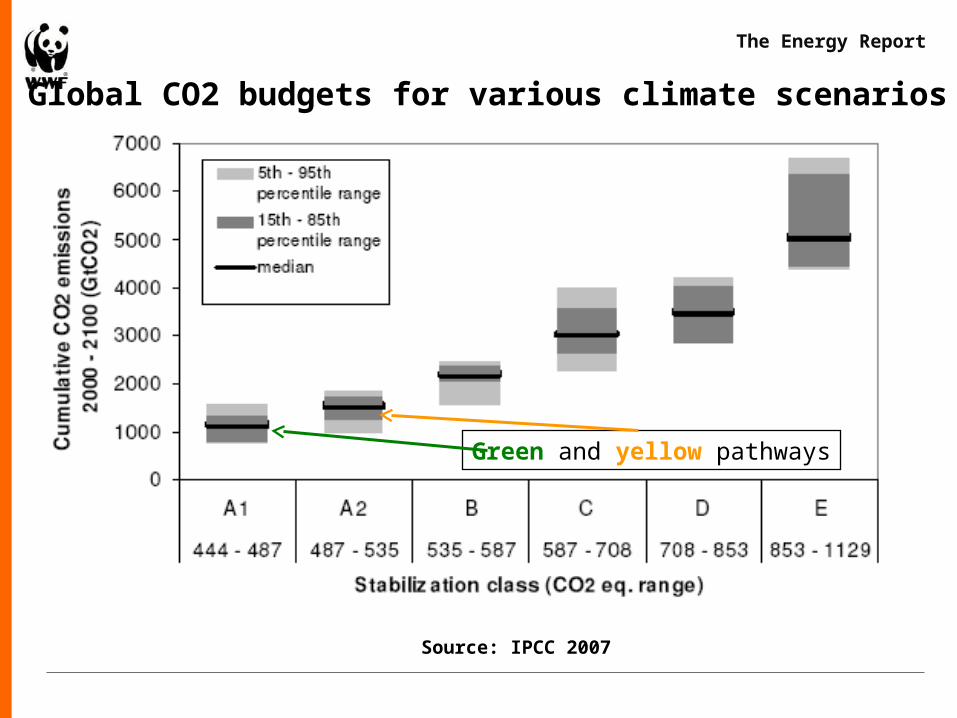
Source: IPCC 2007
Global CO2 budgets for various climate scenarios
Green and yellow pathways

The Energy Report
Source: OPEC Secretariate 2011, BP 2011, IEA 2011, IPCC 2007
The global GHG budget requires to retire about 60% of all known conventional fossil fuel recoverable reserves til 2050 (if CCS is excluded)
Gt CO2e
GAP
2010 - 2050

The Energy ReportRegarding all fossil fuel conventionaland unconventional resources about 95%need to stay untouched, mainly coal
Source: IPCC 2011
Global allowance until 2050

The Energy Report
Recent Science“…A 450 ppm CO2e concentration level is consistent with a probability level of 60% to exceed 2 degree temperature increase at equilibrium …limiting global temperature increase at equilibrium to 2 (1.5) degree above pre-industrial levels with a 66% chance would require stabilisation of atmospheric CO2e from all forcing agents at less than 415 (370) ppm CO2e….ranges of 380 – 420 ppm CO2e for 2 degree and 350 – 375 ppm CO2e for 1.5 degree C….” Rogelij, Meinshausen, Knutti; NATURE climate change; 2012
The Energy Report
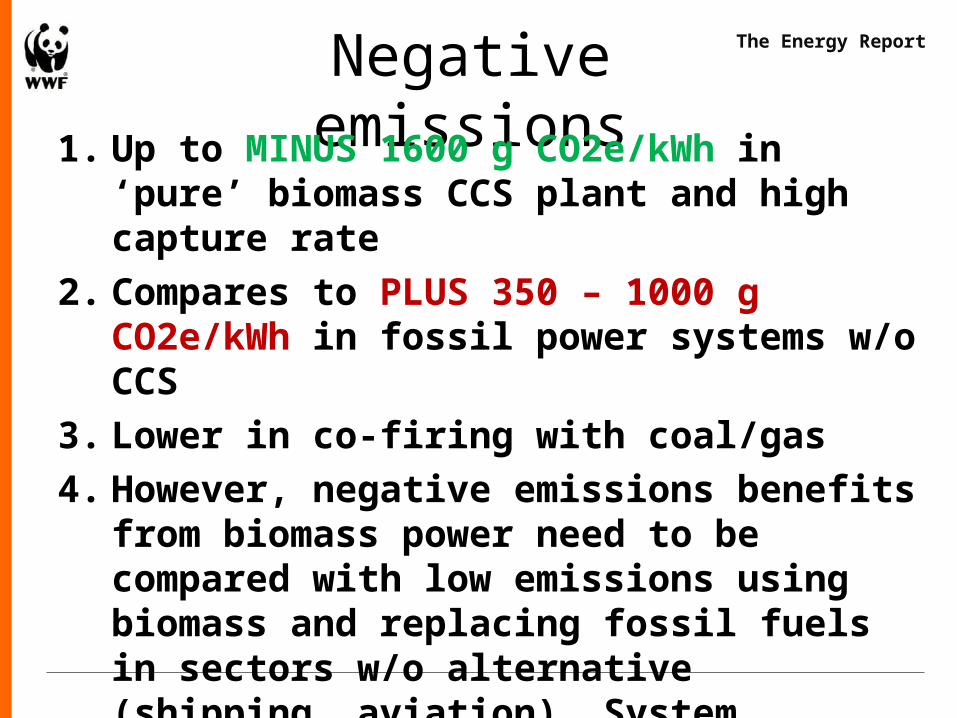
Negative emissions1. Up to MINUS 1600 g CO2e/kWh in ‘pure’ biomass
CCS plant and high capture rate2. Compares to PLUS 350 – 1000 g CO2e/kWh in fossil
power systems w/o CCS3. Lower in co-firing with coal/gas4. However, negative emissions benefits from biomass
power need to be compared with low emissions using biomass and replacing fossil fuels in sectors w/o alternative (shipping, aviation). System approach.
5. Amount of land use of biomass power?

The Energy Report
Land use of BECSS1. One 1t CO2 (0.3t C) negative emissions “requires”
about 0.6t dry matter of wood. Yields are about 2 – 10 t/ha/y in various regions and forests.
2. One ton CO2 reduction = 0.06 - 0.3 ha/y 3. One Gt CO2 negative emissions (2% of global CO2e)
requires about 60 – 300 Mha forest land. 4. But there are only about 250-500 Mha available
(ECOFYS, WWF) for global biomass production based on sustainable land use, securing food production, and biodiversity.

The Energy ReportEnergy type distribution until 2050SOURCE: Ecofys Energy Scenario, 2011, www.panda.org
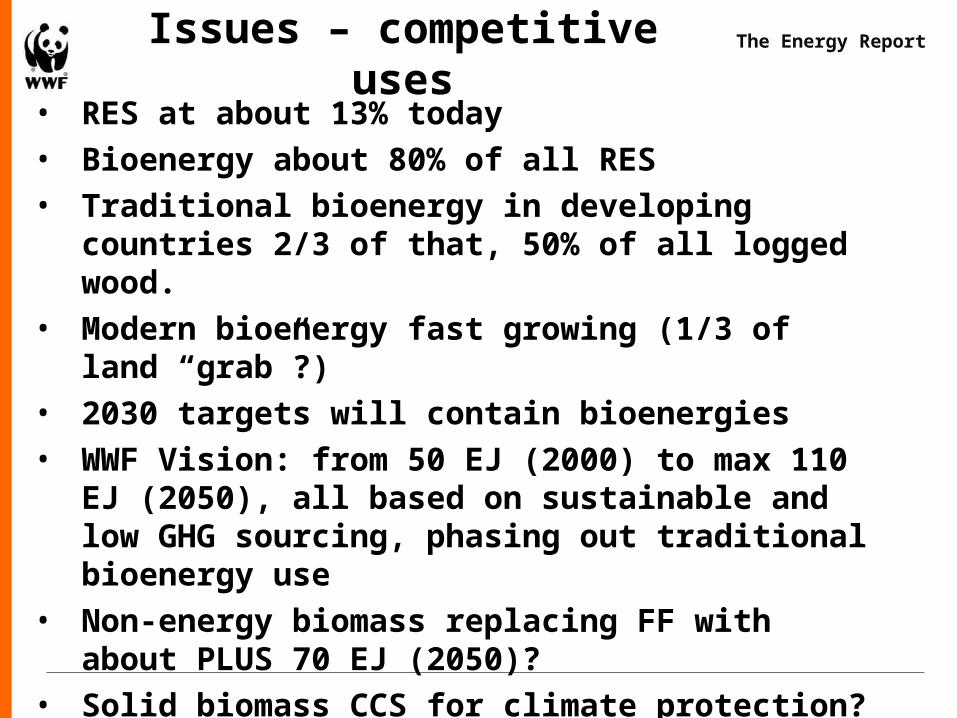
The Energy ReportIssues – competitive uses• RES at about 13% today• Bioenergy about 80% of all RES• Traditional bioenergy in developing countries 2/3 of that,
50% of all logged wood.• Modern bioenergy fast growing (1/3 of land “grab”?)• 2030 targets will contain bioenergies• WWF Vision: from 50 EJ (2000) to max 110 EJ (2050), all
based on sustainable and low GHG sourcing, phasing out traditional bioenergy use
• Non-energy biomass replacing FF with about PLUS 70 EJ (2050)?
• Solid biomass CCS for climate protection?• Reality : 250 – 300 EJ ?

The Energy Report
Needed approaches
• Upscaling of bioenergy policy into new areas, policy interventions, innovations – towards a quantitative bioenergy cap
• Sectoral allocation for biomass, biofuels (aviation, industrial fuels)• Address meat consumption – 4 Gha used• Demand Side approaches, recycling, re-use, countering unlimited
‘bio-plastification’• Bioenergy phase-in/phase out approach (rH2, rCH4) in context of
full electrification• Addressing energy poverty in developing countries• New materials, R & D, 2nd-3rd generation biofuels, algae• Address ILUC in a more holistic, ‘fair’ way• Binding certification/GHG accounting in national contexts

24
The Energy ReportScenario summary – Supply
Bioenergy & land-use
Global Land Use Distribution Today
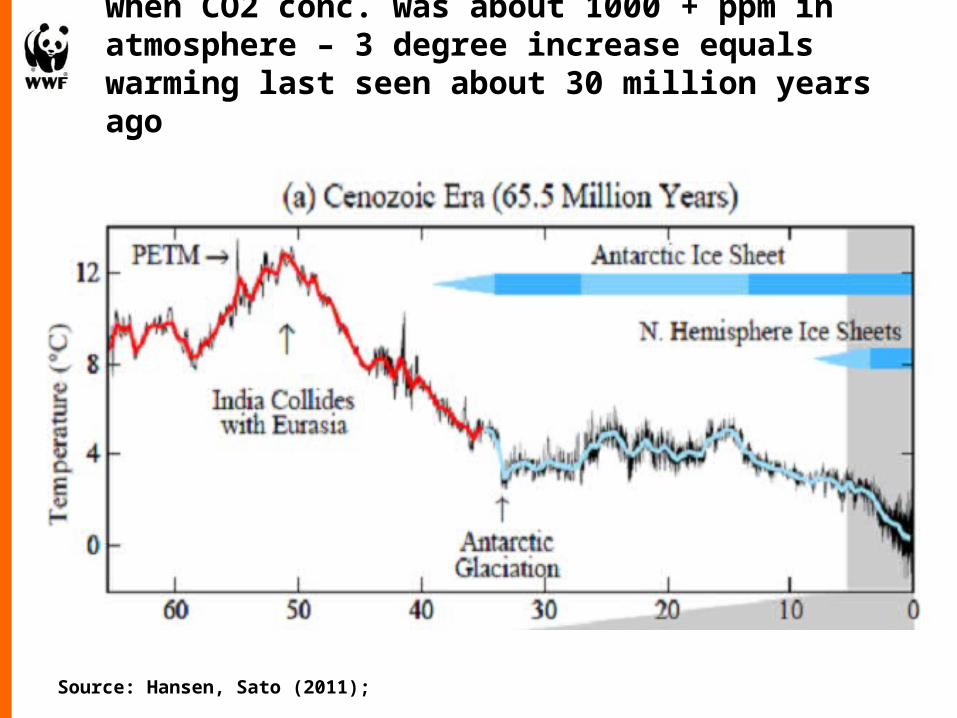
Global temperatures since 65 million years when CO2 conc. was about 1000 + ppm in atmosphere – 3 degree increase equals warming last seen about 30 million years ago
Source: Hansen, Sato (2011);

Global temperatures since 0.5 million years over the various glacial and interglacial periods
Source: Hansen, Sato (2011);