THE ENERGY OF NATURE - Gazprom · Dynamics and Trends in the World Gas ... High growth rates were...
53
THE ENERGY OF NATURE THE NATURE OF ENERGY GAZPROM IN FIGURES 2004–2008 FACTBOOK
Transcript of THE ENERGY OF NATURE - Gazprom · Dynamics and Trends in the World Gas ... High growth rates were...

THE ENERGY OF NATURE
THE NATURE OF ENERGY
G A Z P R O M I N F I G U R E S2 0 0 4 – 2 0 0 8F A C T B O O K

OAO GAZPROM
GAZPROM IN FIGURES 2004–2008

OAO GAZPROM GAZPROM IN FIGURES 2004–2008
2
TABLE OF CONTENTS
Preface.................................................................................................................................................................3
Dynamics and Trends in the World Gas Industry in 2008....................................................................................4
Gazprom in the World Gas Industry and Russian Economy ................................................................................5
OAO Gazprom Mission and Development Strategy .............................................................................................7
Gazprom in Development, 2004–2008 ...............................................................................................................9
Resource Base..................................................................................................................................................9
Hydrocarbon Production ................................................................................................................................28
Transportation and Underground Storage ......................................................................................................32
Electric Power Supply to UGSS Technologic Facilities ...................................................................................39
Technological Communications and Automation of Technological Processes Control ..................................39
Refining and products ....................................................................................................................................40
Marketing .......................................................................................................................................................44
Share Capital, Dividends, Financial And Market Indicators ............................................................................48
Business Property ..........................................................................................................................................50
Energy Saving.................................................................................................................................................51
Personnel .......................................................................................................................................................52
OAO GAZPROM GAZPROM IN FIGURES 2004–2008
3
Fact book “Gazprom in Figures 2004–2008” is an informational and statistical edition, prepared for OAO Gazpromannual General shareholders meeting 2009. It is aimed at providing figures about Gazprom’s standing and role inthe world and Russian fuel and energy market as well as about the Group’s activities in 2004–2008 to share�holders and investors. These materials supplement and expand Gazprom’s production and economic indicatorspresented in OAO Gazprom Annual report for 2008.
The Fact book is prepared on the basis of corporate reports and accounts of OAO Gazprom, including figuresof earlier annual reports, the issuer’s quarterly reports, offering circulars, as well as on the basis of Russian andforeign sources of publicly disclosed information.
All the terms, assumptions, and restrictions of OAO Gazprom Annual report for 2008 are valid in the presentFact book. In particular, the term OAO Gazprom refers to the head company of the Group, i.e. to Open JointStock Company “Gazprom”. The Gazprom Group, the Group or Gazprom imply OAO Gazprom and its sub�sidiaries taken as a whole. Similarly, the terms Gazprom Neft Group and Gazprom Neft refer to OAO GazpromNeft and its subsidiaries, the term Sibur Holding refers to OAO Sibur Holding and its subsidiaries.
Gazprom’s operating results presented in the Fact book are stated based on the principles for preparingGazprom Group’s consolidated accounting (financial) statements in accordance with the Russian legislation. At the same time some results of OAO Gazprom and its subsidiaries’ operations are stated in compliance withthe principles for preparing management reports. Figures calculated using these methods may differ due to differences in methodologies for preparing consolidated financial statements and management reports.
PREFACE

OAO GAZPROM GAZPROM IN FIGURES 2004–2008
4
It was favorable pricing situation in the oil and gas market (the average annual price of BRENT was 34 % higherthan in 2007) that primarily accounted for record�high figures in the world gas industry in 2008. Global naturalgas production reached 3,055.2 bcm, and 4.0 % increase compared to last year. The positive dynamics in gasproduction was noted in all the geographic segments. However, the development of global natural gas production in the reporting year was hampered by a numberof factors, the following of which should be highlighted:
Sharp slowdown in the world economy in the second half of 2008 that considerably affected gas industrymainly in the 4th quarter;Natural decrease in production volumes at the fields, which development started long ago, in Canada, theBritish sector of the North Sea, the Gulf of Mexico, and Argentina;A series of hurricanes in the Gulf of Mexico that accounted for a 16 % decrease in production in the region.
The change in natural gas production in the CIS countries (the largest natural gas production region) was con�sistent with the global trend (a 2.4 % growth). Russia accounted for 76 % of the volumes produced in theregion. In spite of high growth rates in the 1st and 2nd quarters of 2008, natural gas production volumes inthe country increased but slightly (by 1.6 % or 10 bcm) over the year. This dynamics is linked with a decreasein the demand for natural gas in the domestic market (primarily on behalf of consumers that represent themetallurgy and cement industries) and the foreign markets. High growth rates persisted in Azerbaijan (15.7 %),where production was increased at the Shah Deniz field, Turkmenistan (2.3 %), and Kazakhstan (12.9 %).The increase in production in the North America was mostly contributed to by the USA, where productionincreased by 7.8 % and reached 582.2 bcm. These changes resulted from the development of natural gas pro�duction onshore from non�traditional sources (shale gas, methane from coal beds, and gas in higher densityrocks), which accounted for 51 % of the total natural gas production in the USA in 2008 (compared to 47 %in 2007). The African continent yielded 201.5 bcm of natural gas in 2008. Almost all countries in the region increasedtheir production volumes. Nigeria was an exception, where a decrease in gross production volumes was com�pensated for by an increase in the level of associated petroleum gas (APG) utilization, so that the productionin the country remained at last year’s level. Equatorial Guinea showed a small increase in production both inabsolute and relative terms (126 % or 3.7 bcm), where additional volumes of natural gas were transferred toan export�oriented LNG plant commissioned in 2007.High growth rates were seen in natural gas production in European countries. In 2008, natural gas productionin the region increased by 4.2 % (compared to the previous year’s decline of 3.8 %) and amounted to 300.9bcm. Aggregate production volumes of Norway and the Netherlands that are the largest producers accountingfor 58 % of the consolidated production in the region reached 175 bcm this year, which is 11 % more than in2007. Production also increased in Denmark (by 9.7 %). At the same time, production levels kept decreasingin the UK (by 3.3 %) and Romania (by 7.8 %). Structural problems in the industry caused a decrease in production in Germany, Italy, and France.Natural gas production in Latin America increased by 2.7 and reached 150.9 bcm. The dynamics was nothomogeneous in the countries of the region this year. Record�high growth rates were reached in Brazil (28.4 %),which is due to the beginning of production within two shelf projects in the Espirito Santo and Campos Basins.On the contrary, negative dynamics was seen in Argentina and Venezuela (a decrease by 1.7 % and 1.9 %respectively).Production in the Middle East grew up by 6 %, which was mainly due to an increase in natural gas productionin Qatar (by 21 %), which accounted by 60 % of the production growth in the region.Natural gas production growth rates were also high in South�Eastern Asia, Oceania, and Australia (5.3 %).China, Indonesia, Malaysia and Australia accounted for over 60 % of production volumes in the region. International natural gas trade increased 3 % up to 936.2 bcm in 2008. Europe accounted for nearly half of theimported gas, with 18 % for Asia and 16 % for North America. The global pipeline gas trade increased 4.2 %, whereas global LNG trade decreased compared to last year by0.5 % mostly due to a sharp decrease in the demand in the US market. Thus, the buoyant trend in LNG tradewitnessed since 1981 was disrupted. As a result of that, the share of liquefied natural gas (LNG) in the globalnatural gas supply decreased slightly from 25 % down to 24 %.
WORLD GAS INDUSTRY DEVELOPMENT IN 2008*
* This section has been prepared based upon the information material “2008 Natural Gas Year in Review CEDIGAZ’ FirstEstimates” of the international centre on natural gas “CEDIGAZ”.

OAO GAZPROM GAZPROM IN FIGURES 2004–2008
5
2004 2005 2006 2007 2008Share in the world natural gas 16 16 16 16 17proved reserves (at the beginning of the year), %*Share in the world marketed natural gas production, %* 19 19 18 17 17Share in the world natural gas/LNG export, %* 25 26 28 28 28Russian GDP share, %** 8 8 11 10 10Share of Russian natural gas reserves controlled, % 61 61 62 62 69Share in national gas production, %** 87 87 85 84 83Share in national oil and condensate production, %** 3 4 9 9 9Length of gas distributions pipelines serviced by Gazprom 463 485 514 545 575subsidiaries and affiliated companies, thousand kmNumber of flats and private dwellings with Gazprom gas supply (natural gas and LNG), mln 25.1 25.6 26.1 25.9 26.1Number of utilities plants with Gazprom gas supply by Gazprom (natural gas and LNG), thousand 149.2 159.8 173.4 181.8 191.8Number of industrial plants with Gazprom gas supply 13.7 14.6 15.9 16.2 17.1by Gazprom (natural gas), thousand
* Based on International Natural Gas Center “CEDIGAZ” and Gazprom figures. International statistic data on production and international trade were adjusted to Russian standard
terms and conditions using 1.07 ratio.
** Based on the data supplied by the Federal State Statistics Service and OAO Gazprom.
GAZPROM IN THE WORLD GAS INDUSTRY
AND RUSSIAN ECONOMY

OAO GAZPROM GAZPROM IN FIGURES 2004–2008
6
GAZPROM GROUP ACTIVITY IN RUSSIA AND ABROAD IN 2008

OAO GAZPROM GAZPROM IN FIGURES 2004–2008
7
OAO Gazprom mission is to ensure an efficient and balanced gas supply to consumers in the Russian Federationand fulfill its long�term contracts on gas export at a high level of reliability.
OAO Gazprom strategic goal is to establish itself as a leader among global energy companies by entering newmarkets, diversifying its activities, and ensuring reliable supplies.
GEOLOGICAL EXPLORATION WORK AND PRODUCTION
A reduction in demand for gas in internal and external markets caused by recessionary occurrences in globaleconomy leads to gas depletion control at production facilities in medium�term period. Moreover taking intoconsideration that long term forecasts on gas demand were made by the Group relying upon conservative valuations, strategic goals and projects of the Group are tolerant to short terms and long term changes of economic environment.The Group is intended to ensure production of natural gas to the extend of 650–670 bcm by year 2020. In orderto achieve the projected gas production level, it is assumed to utilize new strategic gas production areas on theYamal Peninsula, the shelf in the Arctic seas, in Russian Far East, and Eastern Siberia.The Group is intended to increase volumes of oil production up to 90–100 million tons by 2020.Achievement of these goals will be provided by means of stage�by�stage involvement of all the explored fieldsof Gazprom Neft (inclusive OAO Gazprom Neft 50 % shareholding in OAO NGK Slavneft and OAO TomskneftVNK) into the production process, and also due to liquid reserves of the Group’s gas production companies.It is planned to develop Gazprom Group activities in the fields of crude hydrocarbons resources developmentfar abroad.
GAS TRANSPORTATION
In order to ensure reliable supply of the Group’s ever growing natural gas volumes to the domestic market andfulfill its contractual obligations related to the export of natural gas, the Group seeks to implement projects on construction of new transportation facilities. Under conditions of world economic crises the followingprojects on building of gas pipe�lines are set as top priority projects: Pochinki – Gryazovets, Gryazovets –Vyborg, Nord Stream, expansion of the Urengoy gas transportation unit.The next major projects, which envisage commissioning are: Bovanenkovo – Ukhta and Ukhta – Torzhok trunkgas pipelines for gas transportation from the Yamal Peninsula fields, Murmansk – Volkhov gas pipeline for gastransportation from Stockman field to North�West region of Russia and South Stream gas pipeline.
REFINING
The main goal of the Group development in the fields of gas�processing and gas chemistry is increase of degreeof valued gas components recovery ratio, also of associated petroleum gas and its efficient utilization for furtherprocessing in high liquidity products with high added value.The strategy is supposed to minimize production cost due to logistics costs optimization as well as newtechnologies usage. Also one of the tools of brining gas chemical business to a new affectivity level will be furtherimprovement of finance and management control systems while implementing investment projects.Development of gas processing and gas chemistry may be provided by current availability and future increaseof natural gas production with high assay of ethane, propane and butane. Particularly, according to the MasterPlan of gas industry development for the period up to 2030 the Group forecasts natural gas production growthwith high assay of these components from 90 bcm up to 160 bcm by 2020. OAO Gazprom considers also aquestion of development of gas processing and gas chemical productions while utilizing West Siberia and FarEast resources within the frames of the strategy on gas processing and gas chemicals complexes development.According to the strategy of oil business development up to 2020 it is supposed to increase the volume of oilprocessing up to 70–80 million tons per year, sales volume of petroleum products via own retail chain up to 12 million tons per year. It is planned to expand the retail chain up to 5.0–5.5 thousand of petrol stations. It issupposed to set up as an independent business such product areas as bitumen and oil chemistry, kerosene,fueling, lubricants, oils and oil chemistry.
OAO GAZPROM MISSION AND DEVELOPMENT STRATEGY

OAO GAZPROM GAZPROM IN FIGURES 2004–2008
8
MARKETING AND SALES
Gazprom’s strategy in the domestic market consists in ensuring continuous gas supply of the country andmaking sales more profitable. Starting from 2006 Government of the Russian Federation takes measures onadjustment of whole sale gas prices to economically feasible level.Particularly, the dynamic of changing whole sale gas prices has been set and it is prescribed to move them tothe level which provides equal return of export gas deliveries and domestic market deliveries using market priceformula. In September 2006 Government of the Russian Federation allowed OAO Gazprom to sell restricted volumes of gas at market prices formed using exchange technologies within the frames of experiment on electronic stock exchange OOO Mezhregiongas (further ESE). From November 2006 up to December 2008inclusive 7.5 bcm of Gazprom gas was merchandised at electronic stock exchange.Gas realization at market prices set at marginal gas volume in variable range, implemented according to the resolution № 333 dated 28.05.07 of Government of the Russian Federation is supposed to allow customers toadapt to new pricing conditions. According to the mentioned resolution 22.2 bcm of gas was sold for the periodfrom 3Q 2007 up to the end of 2008.Instability of global finance and power generation markets, crises phenomena of the country economy generatenegative, restrictive impact on the process of adoption to market pricing for gas delivered to internal market.OAO Gazprom takes all possible measures in order not to cancel planned steps on improving a system of gasprices formation, creating special terms for smooth, no price fluctuations transition to market gas prices formation.One of the goals of internal market development is transition from state regulated whole sale gas prices to stateregulated tariffs on gas transportation. Further work of the Group on Russian regions gasification will be focused on achievement of maximum economically proved level of Russia gasification.The main goal of the Group in European market is to keep the leading position, provide reliable gas supply andalso increase efficiency of sales. Achievement of these goals is planned due to development of relationshipswith traditional customers based on long term contracts, usage of new trading activities based on short termand mid term sales and also on subsidiary operations and single transactions. For the purpose of position con�solidation at the European market, increase of reliability and flexibility of deliveries the Group is intended todevelop the system of underground storage in the territory of European countries, extend participation in sharecapital of companies specialized in gas and energy sales to final consumers.The main element of strategy in the markets of CIS and Baltic counties is maintaining a dominating position ofRussian gas in power generation sector of the region, adjustment of current contracts with CIS countries inorder to move to the same contract conditions and pricing mechanisms used in European countries and alsoaccess extension to final consumers.In order to provide some room for maneuvers while defining steps of fields development in new gas produc�tion regions in the territory of Russia the Group develops cooperation in the sphere of gas fields development,upgrading and development of gas transportation systems of Central Asian countries. Gas recourses of CentralAsia give the opportunity to come to new markets while supporting reliability of deliveries to traditional customers.In order to diversify geography of deliveries the Group considers as new, key markets the countries of Asian�Pacific Region, North America which are supposed to be discovered due to stage by stage production develop�ment, LNG see transportation and trading.
POWER INDUSTRY
The Group treats power industry as strategically important sphere of activity and considers expansion of presencein power sector will increase business stability and bring additional income in long term perspective.In 2007–2008 within the process of restructuring of Russian power sector the Group acquired power generatingassets and is planning to participate in investment projects on building of electric power stations in RussianFederation. The total planned capacity input according to the investment program of the companies inside theGroup of Russian power generating companies is estimated up to 7 GW for the period by 2015. More than that,the investment program of OAO TGK�1 which is planned to be controlled by the Group is supposed to inputcapacity more than 2 GW.The Group also considers the opportunity to invest in building and enquiring of European power generatingassets in order to increase efficiency and strengthen its own positions at utilities markets of European countriesand also develop cooperation with power generating companies possessing client bases and set of technologieswhich will help to enlarge the Group presence at international electric power markets.

OAO GAZPROM GAZPROM IN FIGURES 2004–2008
9
RESOURCE BASE
LICENSES
Exploration and production of the subsoil resources in the Russian Federation are subjected to state licensing.Most of Gazprom Group’s licenses for the exploration, development and production of hydrocarbons werereceived in 1993–1996 in accordance with the Subsoil Resources Law. The validity period of most licensesexpires after 2012. Since the holders of Gazprom Group’s licenses comply with the basic terms and conditionsof license agreements they are entitled to the extension of the existing licenses to complete field exploration ordevelopment. Gazprom plans to have its licenses extended till the field development stops being cost�efficient.
GAZPROM GROUP LICENSES TO STUDY, EXPLORE AND PRODUCE HYDROCARBONS BY TYPE
GAZPROM GROUP LICENSES AS OF 31.12.2008.
License holder LicensesExploration, Exploration Exploration Total
assessment and production and production and assessmentOAO Gazprom 22 (1) 15 20(14) 57(15)ООО Gazprom dobycha Astrakhan 1 1 0 2ООО Gazprom transgaz Makhachkala 3 0 1 4OOO Kubangazprom 3 48 4 55ООО Gazprom dobycha Nadym 2 7 5 14ООО Gazprom dobycha Noyabrsk 5 5 2 12ООО Gazprom dobycha Orenburg 1 2 5 8ООО Gazprom pererabotka 0 5 5 10ООО Gazprom transgaz Surgut 1 1 0 2ООО Gazprom transgaz Yugorsk 0 3 0 3ООО Gazprom transgaz Yekaterinburg 1 0 1ООО Gazprom dobycha Urengoy 1 5 0 6ООО Gazprom dobycha Yamburg 1 4 0 5OAO Severneftegazprom 0 1 0 1ОАО Vostokgazprom 4 0 0 4ОOО Sevmorneftegaz 0 2 0 2ZAO Gazprom neft Orenburg (former – ZAO Stimul) 0 1 0 1OAO Tomskgazprom 0 5 0 5ОOО Servisneftegas 1 1 0 2ОАО Krasnoyarskgazprom 0 0 1 1ООО Kranoyarskdobycha 2 1 1 4
GAZPROM IN DEVELOPMENT, 2004–2008
Exploration and production Exploration and assessment
300
250
200
150
100
50
02005 2006 2007 2008
43
154
59
169
60
194
59
222
197
228254
281
OAO GAZPROM GAZPROM IN FIGURES 2004–2008
10
License holder LicensesExploration, Exploration Exploration Total
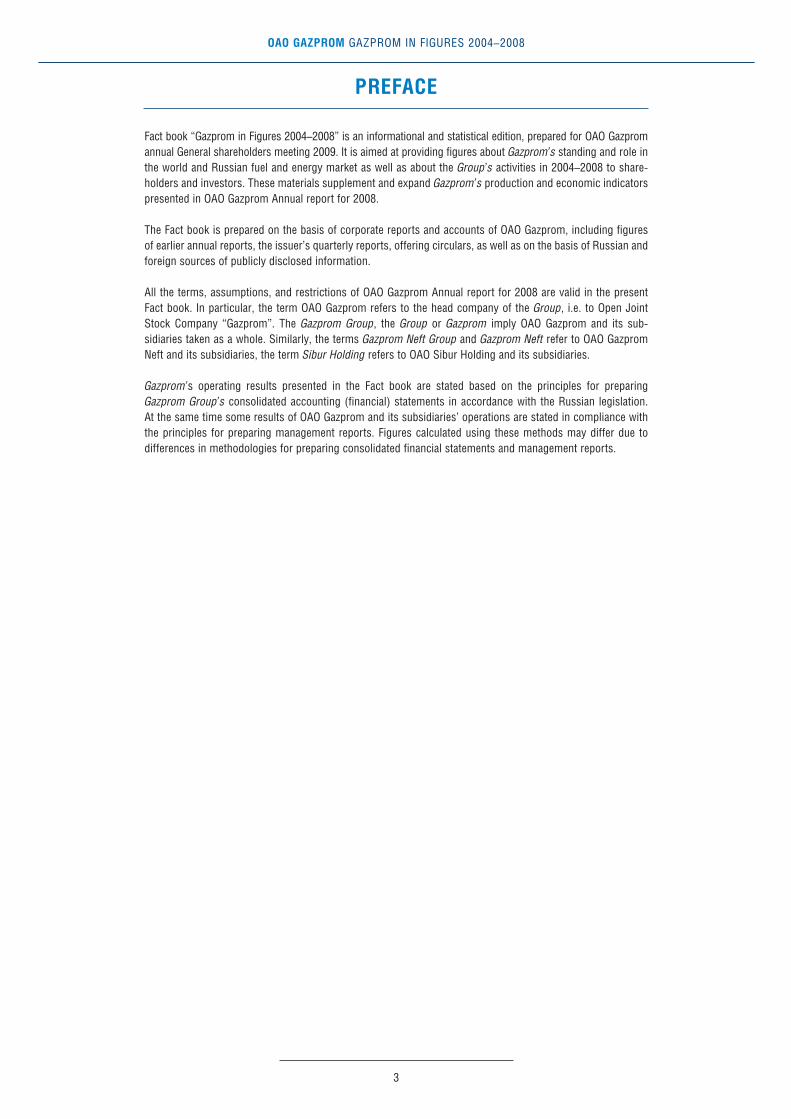
assessment and production and production and assessmentZAO Purgas 0 1 0 1ОАО Kalmgas 0 2 0 2ООО GPK Kuznetsk 1 0 0 1Group Gazprom Neft 16 41 15 72ОАО Uzhnaya neftyanaya kompania 2 0 0 2Group Gazprom (UK) Limited 2 (2) 0 0 2(2)Gazprom Libya 2 (2) 0 0 2(2)Total 71(5) 151 59(14) 281(19)
Note: The licenses in the brackets are those for the use of mineral resources outside the Russian Federation.
AFFILIATED COMPANIES LICENSES AS OF 31.12.2008
License holder LicensesExploration, Exploration Exploration Total
assessment and production and production and assessmentZAO Nortgas 0 1 0 1ОАО NGK Slavneft 11 27 1 39ОАО Tomskneft VNK 1 30 0 31Sakhalin Energy Investment Company Ltd. 2 0 0 2ООO Kaspiyskaya NK 0 0 1 1ZAO Pechorneftegazprom 0 1 0 1OOO CentrCaspneftegaz 0 0 1 1ОАО Uralneftegazprom 0 6 0 6Total 14 65 3 82
LICENSE EXPIRATION DATES OF GAZPROM GROUP MAIN HYDROCARBON FIELDS
License holder Name of the field Type of the field License expiration yearOAO Gazprom Zapadno�Tambeyskoe oil�gas condensate 2028
Kruzenshternskoe gas condensate 2028Uzhno�Kruzenshternskoe gas 2028
Malyginskoe gas condensate 2028Severo�Tambeyskoe gas condensate 2028
Tasiyskoe gas condensate 2028Antypajutinskoe gas 2028
Zapadno�Astrakhanskoe gas condensate 2024Dolginskoe oil 2025
Severo�Kamennomysskoe gas condensate 2026Kamennomysskoye more gas 2026
Chikanskoe gas condensate 2028Chayadinskoe oil�gas condensate 2028Semakovskoe gas 2028
Kitinskoe gas condensate 2028Tota�Yahinskoe gas 2028
Bao�Vang (block № 112 of Vietnam continental) gas condensate 2025ООО Gazprom dobycha Astrakhan Astrakhanskoe gas condensate 2019ООО Gazprom dobycha Nadym Medvezhye oil�gas condensate 2018
Ubileynoe oil�gas condensate 2018Yamsoveiskoye gas condensate 2018
Kharasaveiskoye gas condensate 2019Bovanenkovskoye oil�gas condensate 2018Novoportovskoye oil�gas condensate 2019
ООО Gazprom dobycha Noyabrsk Vyngapurovskoye (Cenomanian) gas 2012Komsomolskoye (Cenomanian) gas 2012Yety�Purovskoye (Cenomanian) gas 2014
Zapadno�Tarkosalynskoe oil�gas condensate 2018Vyngayakhinskoye (Cenomanian) gas 2019

OAO GAZPROM GAZPROM IN FIGURES 2004–2008
11
License holder Name of the field Type of the field License expiration yearZAO Purgas Gubkinskoe (Cenomanian) gas 2014ООО Gazprom dobycha Orenburg Orenburgskoe oil�gas condensate 2018ООО Gazprom pererabotka Vuktylskoe oil�gas condensate 2016OAO Severneftegazprom Uzhno�Russkoe oil�gas condensate 2018ZAO Gazprom neft Orenburg (former – ZAO Stimul) Orenburgskoye (eastern section) oil�gas condensate 2018ООО Gazprom dobycha Urengoy Urengoyskoye oil�gas condensate 2013
Yen�Yakhinskoye oil�gas condensate 2013Severo�Urengoyskoye (Cenomanian) gas 2013
Pestsovoye oil�gas condensate 2019Uzhno�Pestsovoe gas condensate 2027
Severo�Samburgskoye oil 2027ООО Gazprom dobycha Yamburg Yamburgskoye oil�gas condensate 2018
Zapolyarnoye oil�gas condensate 2018Tazovskoye oil�gas condensate 2025
Severo�Parusovoe gas 2027OAO Tomskgazprom Myldzhinskoye gas condensate 2019ООО Krasnoyarskgazdobycha Sobinskoye oil�gas condensate 2028ОOО Sevmorneftegaz Shtokmanovskoye gas condensate 2043
Prirazlomnoye oil 2043Group Gazprom Neft Muravlenkovskoye gas�oil 2013
Novogodneye gas�oil 2013Priobskoye (southern area) oil 2013
Sporyshevskoye oil 2047Sugmutskoye oil 2050
Sutorminskoye oil�gas condensate 2013Vyngapurovskoye (Yamalo�Nenetski AO) oil�gas condensate 2013Vyngapurovskoye (Khanty�Mansiyski AO) oil�gas condensate 2014
Vyngayakhinskoye gas�oil 2013
GEOLOGICAL EXPLORATION
Gazprom Group is currently engaged in the projects for the exploration of new hydrocarbon deposits in Russiaand abroad. The bulk of this activity is concentrated in six federal districts (FD) of Russian Federation: Ural FD(the Yamalo�Nenetski autonomous region, the Khanty�Mansiyski autonomous region, and the Sverdlovskregion), North�Western FD (the Nenets autonomous region and the Republic of Komi), Southern FD (theAstrakhan region, the Krasnodar area, and the Stavropol area), Privolzhsky FD (the Orenburg region), SiberianFD (the Tomsk region, the Krasnoyarsk area, and the Irkutsk region), Far Eastern FD (Kamchatka, Chukotka andTaymyr). Foreign projects include Gazprom’s activities in Central Asia, India, Vietnam, Venezuela, Libya, Algeria;the question of entering oil and gas projects in Bolivia is being negotiated (blocks in Sunchal, Asero, Ipati andAkio), also in Syria, Iran , Indonesia, Iraq.Aiming at the recovery of its hydrocarbon reserves, Gazprom continues implementing its Program for themineral base development for the period up to 2030, which defines the main areas in geological explorationwork and license policy of the Group (exclusive of Gazprom Neft) in Russia. The Program envisages:
maintaining parity between the increase in hydrocarbon reserves and production for the period up to 2010and ensuring the expanded reproduction of reserves later on; carrying out geologic exploration work in the areas of well�established natural gas production (the Nadym�Pur�Tazovsky region and the Precaspian oil�and�gas bearing province) and developing new gas bearingregions (the Yamal Peninsula, the shelf in the Arctic seas, Eastern Siberia, and Russian Far East);carrying out geologic exploration work in the areas of well�established natural gas production (the Nadym�Pur�Tazovsky region and the Precaspian oil�and�gas bearing province) and developing new gas bearingregions (the Yamal Peninsula, the shelf in the Arctic seas, Eastern Siberia, and Russian Far East);increasing natural gas reserves by 23.5 tcm and condensate and oil reserves by 3.4 billion tons in the periodfrom 2002 through 2030.
The implementation of the Program between 2002–2008 resulted in increase of A+B+C1 gas reserves by 3.6 tcmand 132.7 million tonnes of oil and gas condensate through geologic exploration work.

OAO GAZPROM GAZPROM IN FIGURES 2004–2008
12
MAJOR EXPLORATION METRICS (RUSSIA ONLY)
2004 2005 2006 2007 2008Exploration well drilling, thousand m 125.2 136.3 177.7 207.6 284.92D seismic survey, thousand km 8.3 9.8 9.2 6.4 12.43D seismic survey, thousand square km 2.3 3.2 7.9 5.7 6.6Gas reserves growth due to exploration, bcm 378.1 583.4 590.9 592.1 583.4Oil and condensate reserves growth due to exploration, million tons 17.2 33.0 58.8 29.6 61.0Drilling efficiency, tce/m* 3,681.5 5,285.6 4,310.5 3,495.2 2,669.3
* For conversion of 1,000 cubic meters of natural gas and gas condensate into 1 tonn of coal equivalent, the conversion ratios 1.154 and 1.43 are used respectively.
Note: data on Gazprom Neft Group have taken from 2006
NEW FIELDS DISCOVERED BY GAZPROM IN RUSSIA IN 2004–2008
Name of the field Location Type of the filed Year of reserves bookingGrechanoe Krasnodarsky krai gas 2004Yuzhno�Chernoerkovskoye Krasnodarsky krai oil 2004Peschanoe Krasnodarsky krai oil�gas condensate 2004Zapadno�Kazachye Krasnodarsky krai gas 2004Beryambinskoye Krasnodarsky krai gas condensate 2004Ninelskoye Yamalo�Nenetski AO oil 2005Chugoryakhinskoye Kara sea gas condensate 2005Vostochno�Peschanoe Orenburg region oil 2005Severo�Yuguidskoye Komi Republic oil�gas condensate 2005Zapadno�Astrakhanskoye Astrakhan region gas condensate 2005Chikanskoye Irkutsk region gas condensate 2006Akobinskoye Orenburg region gas condensate 2006Karmalinovskoye Stavropolsky krai gas condensate 2006Uzhno�Noyabrskoe Yamalo�Nenetski AO oil 2006Kutymskoye Yamalo�Nenetski AO gas condensate 2007Zapadno�Pestsovoye Yamalo�Nenetski AO gas condensate 2007Vorgenskoe Yamalo�Nenetski AO oil 2007Yuzhno�Karasevskoye Yamalo�Nenetski AO gas condensate 2007Kamovskoe Krasnodarsky krai oil 2008Zapadno�Rozhdestvenskoe Orenburg region oil 2008Valyntoiskoe Yamalo�Nenetski AO oil 2008
RESERVES
Main Differences between Russian Reserves System and International Standards
Gazprom’s hydrocarbon reserves are estimated using both the Russian reserves system and internationalmethodologies developed as part of the Petroleum Resources Management System (PRMS Standards) and bythe US Securities and Exchange Commission (SEC Standards).PRMS was approved by the Society of Petroleum Engineers (SPE), the World Petroleum Council, the AmericanAssociation of Petroleum Geologists, and the Society of Petroleum Evaluation Engineers in March 2007. PRMS –a new international reserve evaluation standard replaced SPE definitions published in 1997. Independent petrole�um engineering companies have been auditing Gazprom’s reserves in accordance with the international standardssince 1997.The Russian reserves system differs significantly from the international standards in particular with respectto the manner in which and the extent to which commercial factors are taken into account in calculatingreserves.
Russian Reserves System
The Russian reserves system is based solely on an analysis of the geological attributes of reserves and takesinto consideration the actual physical presence of hydrocarbons in geological formations or the probability ofsuch physical presence. Explored reserves are represented by categories A, B, and C1; preliminary estimatedreserves are represented by category C2; prospective resources are represented by category C3; and forecastedresources are represented by categories D1 and D2.
OAO GAZPROM GAZPROM IN FIGURES 2004–2008
13
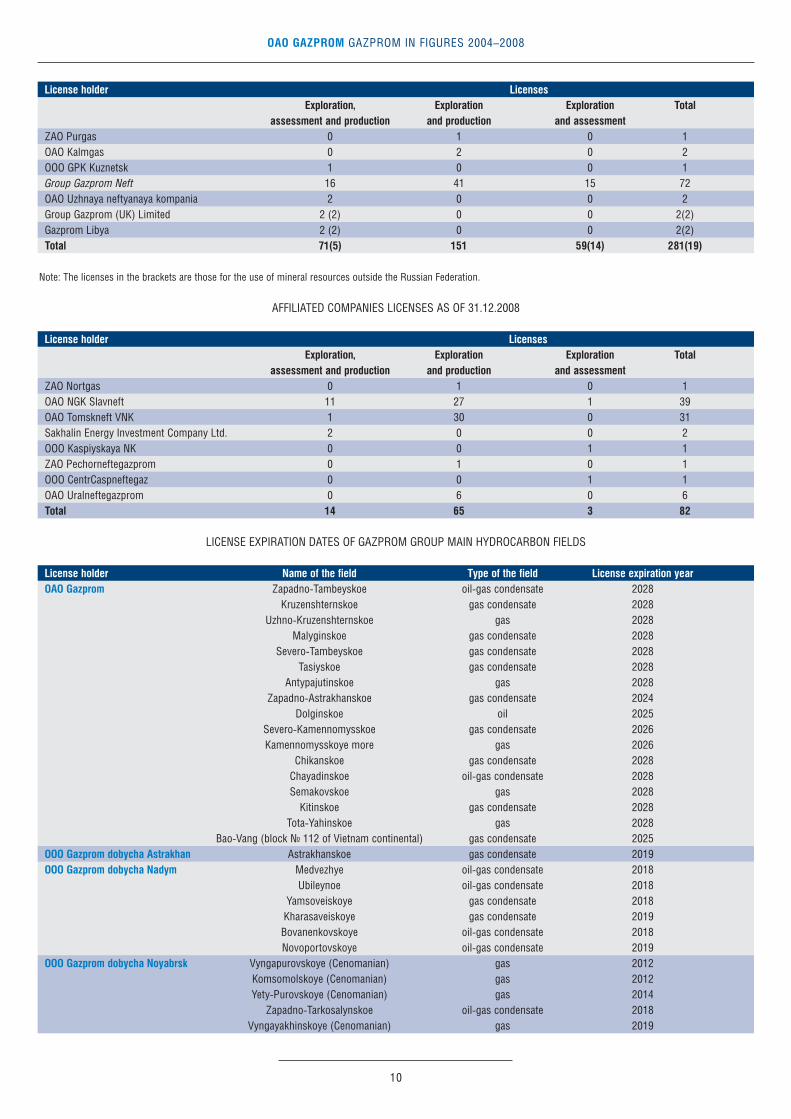
According to the Russian reserves system, explored natural gas reserves in categories A, B and C1 are con�sidered to be fully extractable. For oil and gas condensate reserves special index of extraction is used. Thisindex is calculated taking into account geological and technical factors.Category A reserves are calculated on the part of a deposit drilled in accordance with an approved developmentproject for the oil or natural gas field. They represent reserves that have been analyzed in sufficient detail.Category B represents the reserves of a deposit, the oil or gas content of which has been determined on thebasis of commercial flows of oil or gas obtained in wells at various hypsometric depths. The main parametersand the major features of the deposit that determine the conditions of its development have been studied in suf�ficient detail to draw up a project to develop the deposit.Category C1 represents the reserves of a deposit, the oil or gas content of which has been determined on the basisof commercial flows of oil or gas obtained in wells and positive results of geologic exploration of non�probed wells.Category C1 reserves are computed on the basis of results of geophysical exploration work and production drillingand must have been studied in sufficient detail to yield data from which to draw up either a trial industrial develop�ment project in the case of a natural gas field or a technological development scheme in the case of an oil field.Gazprom’s “proved” reserves are valuated in accordance with SEC International Standards, whereas “probable”and “possible” reserves are valuated in accordance with PRMS International Standards.
PRMS International Standards
When assessing the recoverable reserves PRMS International Standards take into account not only the probabili�ty that hydrocarbons are present in a given geological formation but also the economic viability of recovering thereserves. Exploration and drilling costs, ongoing production costs, transportation costs, taxes, prevailing pricesfor hydrocarbons, and other factors that influence the economic viability of a given deposit are taken into con�sideration.Under PRMS International Standards, reserves are classified as proved, probable and possible.Proved reserves include reserves that are confirmed with a high degree of certainty through an analysis of thedevelopment history and/or volume method analysis of the relevant geological and engineering data. Provedreserves are those that have a better than 90 % chance of being produced based on the available evidence andtaking into account technical and ecnomic factors.Probable reserves are those reserves, in which hydrocarbons have been located within the geological structurewith a lesser degree of certainty because fewer wells have been drilled and/or certain operational tests have notbeen conducted. Probable reserves are those that have a better than 50 % chance of being produced based onthe available evidence and taking into account technical and economic factors.An evaluation of proved and probable natural gas reserves certainly involves multiple uncertainties. The accu�racy of any reserves evaluation depends on the quality of available information and engineering and geologicalinterpretations. Based on the results of drilling, testing, and production after the audit date, reserves may besignificantly restated upwards or downwards. Changes in the price of natural gas, gas condensate or oil mayalso affect proved and probable reserves estimates, as well as estimates of future net revenues and presentworth, because the reserves are evaluated based on prices and costs as of the audit date.
Differences between PRMS International Standards and SEC Standards
Certainty of Existence. Under PRMS International Standards, reserves in undeveloped drilling sites that arelocated more than one standard inter�well distance from a commercial producing well may be classified asproved reserves if there is “reasonable certainty” that they exist.Under SEC Guidelines, it must be “demonstrated with certainty” that reserves exist before they may be clas�sified as proved reserves.Duration of License. Under PRMS Standards, proved reserves are projected to the economic production lifeof the evaluated field. Under SEC Standards, oil and gas deposits may not be classified as proved reservesif they will be recovered after the expiration of the license validity period unless the license holder has theright to renew the license and there is a demonstrated history of license renewal. The Subsoil ResourcesLaw provides that a license holder shall be entitled to request an extension of an existing license whereextractable reserves remain upon the expiration of the primary term of the license, provided that the licenseholder is in material compliance with the license agreement.
Gazprom prepares and submits for government approval development plans for its fields based on the economiclife of the field, even where this life exceeds the primary term of the associated license. Gazprom is in materialcompliance with license agreements, and will be entitled to extend them to the full economic lives of theassociated fields upon the expiration of their primary validity periods. However, the absence of an absolute legalright to extension and a significant demonstrated history of extension makes it uncertain whether extractablereserves Gazprom plans to recover after the expiration of a current license validity period may be consideredproved reserves under SEC Standards. SEC experts have not provided definitive guidance on whether in thesecircumstances such extractable reserves could be considered proved under SEC Standards.
OAO GAZPROM GAZPROM IN FIGURES 2004–2008
14
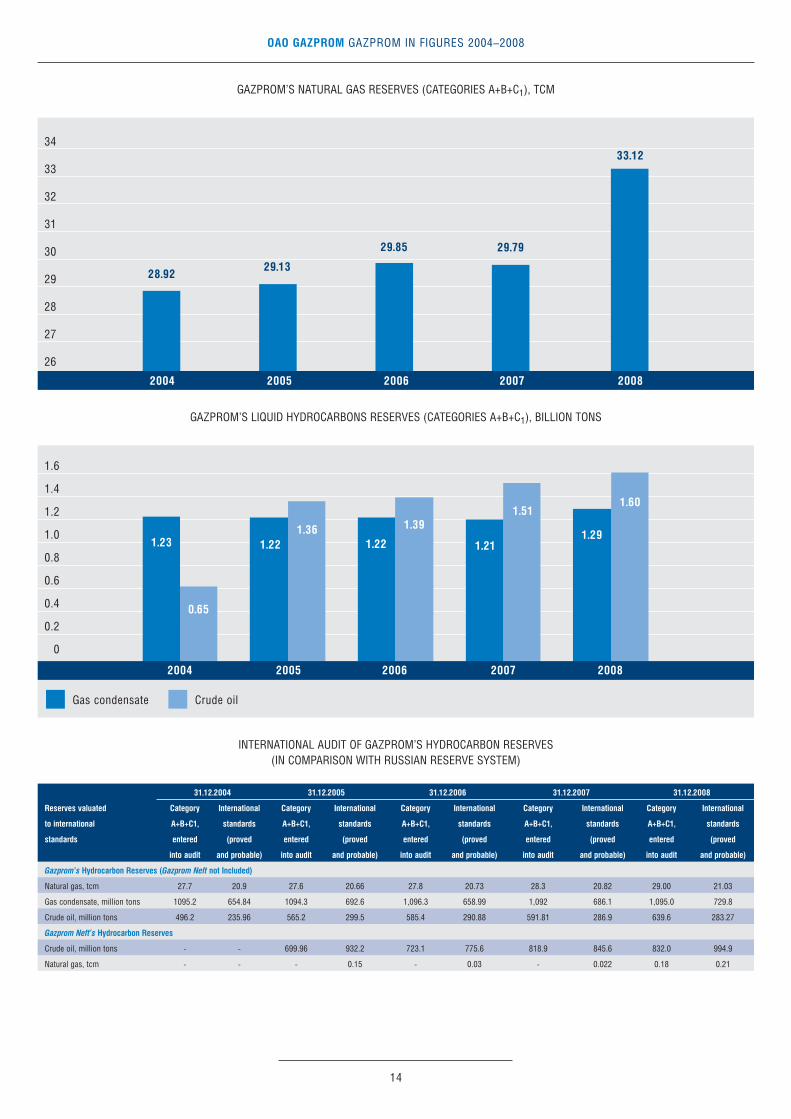
GAZPROM’S NATURAL GAS RESERVES (CATEGORIES A+B+C1), TCM
GAZPROM’S LIQUID HYDROCARBONS RESERVES (CATEGORIES А+В+С1), BILLION TONS
INTERNATIONAL AUDIT OF GAZPROM’S HYDROCARBON RESERVES (IN COMPARISON WITH RUSSIAN RESERVE SYSTEM)
31.12.2004 31.12.2005 31.12.2006 31.12.2007 31.12.2008
Reserves valuated Category International Category International Category International Category International Category International
to international A+B+C1, standards A+B+C1, standards A+B+C1, standards A+B+C1, standards A+B+C1, standards
standards entered (proved entered (proved entered (proved entered (proved entered (proved
into audit and probable) into audit and probable) into audit and probable) into audit and probable) into audit and probable)
Gazprom’s Hydrocarbon Reserves (Gazprom Neft not Included)
Natural gas, tcm 27.7 20.9 27.6 20.66 27.8 20.73 28.3 20.82 29.00 21.03
Gas condensate, million tons 1095.2 654.84 1094.3 692.6 1,096.3 658.99 1,092 686.1 1,095.0 729.8
Crude oil, million tons 496.2 235.96 565.2 299.5 585.4 290.88 591.81 286.9 639.6 283.27
Gazprom Neft’s Hydrocarbon Reserves
Crude oil, million tons � � 699.96 932.2 723.1 775.6 818.9 845.6 832.0 994.9
Natural gas, tcm � � � 0.15 � 0.03 � 0.022 0.18 0.21
34
33
32
31
30
29
28
27
26
2004 2005 2006 2007 2008
28.9229.13
29.85 29.79
33.12
Gas condensate Crude oil
1.6
1.4
1.2
1.0
0.8
0.6
0.4
0.2
0
2004 2005 2006 2007 2008
1.23
0.65
1.221.36
1.22
1.39
1.21
1.51
1.29
1.60

OAO GAZPROM GAZPROM IN FIGURES 2004–2008
15
GAZPROM’S NATURAL GAS RESERVES (CATEGORIES A+B+C1) BY MAJOR FIELDS (AS OF 31.12.2008)
ANNUAL NATURAL GAS RESERVES INCREMENT DUE TO GEOLOGICAL EXPLORATION, BCM
Ural FD – 73.2
Arctic shelf – 14.3
Southern FD – 7.8
Privolzhskiy FD – 2.3
Siberian FD – 1.2
Other territories – 1.2
600
500
400
300
200
100
0
378.1
583.4 590.9 592.1 583.4
2004 2005 2006 2007 2008

OAO GAZPROM GAZPROM IN FIGURES 2004–2008
16
NATURAL GAS RESERVES GROWTH�TO�PRODUCTION RATIO
DRILLING
The construction of exploration and production wells in the fields by order of Gazprom Group’s major gas production, transportation and underground storage subsidiaries is accomplished by: OOO Gazprom burenie(former OOO Burgas), OAO Podzemburgaz, OOO Gazflot, drilling departments within OOO Gazprom PHG, OOO Gazprom transgaz Makhachkala, OOO Gazprom transgaz Ekaterinburg, as well as third�party drilling con�tractors.In September 2007 Gazprom Neft established OOO Gazpromneft�Nefteservis company for management of itsoil services assets. Currently there are 10 services companies under the management of the Group which rendermultiple set of such services as field development, engineering surveys, drilling, pulling wells, geophysicalservices, construction of drilling units, transportation and others. More than that Gazprom Neft takes third partyinternational and Russian organizations such as Shlumberger, Baker Hughes and Halliburton. Gazprom Neftalso enlists the service of such Russian oil services companies as Neftegas Evrazia, Integra and others.
WELL CONSTRUCTION (RUSSIA ONLY), UNITS
Exploration wells Production wells
1 000
800
600
400
200
0
2004 2005 2006 2007 2008
42
453
60
299
66
547
46
795
88
780
1.2
1.1
1.0
0.9
0.8
0.7
0.6
0.5
0.7
1.05 1.06 1.08 1.06
2004 2005 2006 2007 2008

OAO GAZPROM GAZPROM IN FIGURES 2004–2008
17
ANNUAL TOTAL PENETRATION (RUSSIA ONLY), THOUSAND M
MAJOR TRANSACTIONS COMPLETED BY GAZPROM GROUP IN THE FIELD OF HYDROCARBON EXPLORATION AND PRODUCTION IN 2004–2008
Companies whose reserves and production are included into Gazprom Group’s Indicators
OAO Gazprom Neft It is one of the largest Russian vertically integrated oil companies engaged in the oil and gas exploration, production, refining, and sale.In 2005, Gazprom Group acquired 75.68 % of shares of OAO Sibneft (renamed into OAO Gazprom Neft in 2006).In April 2007, Italian company ENI won the auction where 20,0002 % shares of ОАО Gazprom Neft were sold.Gazprom signed a contract for a call option with ENI for a 2 year term that entitles it to purchase 20,0002 % ofGazprom Neft shares. Within the frames of contract realization OAO Gazprom purchased from ENI 20,0002 %of OAO Gazprom neft shares for 4.1 billion of USD. The Group share in OAO Gazprom neft capital increased upto 95,68 %.
OOO SevmorneftegazIt holds licenses to develop the Shtokmanovskoye and Prirazlomnoye fields.As of December 31, 2004, Gazprom owned 58 % of shares of ZAO Sevmorneftegaz (converted into OOO Sevmor�neftegaz in 2007). In March 2005, the Group purchased an additional 42 % shareholding from OAO NK Rosneft�Purneftegaz thus increasing its shareholding in ZAO Sevmorneftegaz up to 100 %.
OAO VostokgazpromOAO Vostokgazprom and its subsidiaries produce hydrocarbon raw materials in the Tomsk region as well asrefine and sell hydrocarbons.In April 2004, Gazprom acquired the additionally issued ordinary shares of OAO Vostokgazprom thus increasingits shareholding in the company up to 99.9 %
OAO SeverneftegazpromIt is a production company that holds the license for the development of the Yuzhno�Russkoye field.In 2003, Gazprom acquired 51 % of shares of OAO Severneftegazprom thus increasing its shareholding in thecompany up to 100 %.Gazprom and BASF completed an asset swap transaction in 2007: BASF received a 25 % shareholding less oneordinary share and one preference share, which jointly represent a 35 % share in costs, risks, and benefits relatedto the operations of OAO Severneftegazprom. Gazprom increased its shareholding in Wingas GmbH from 35 %up to 50 % less one share and received a 49 % shareholding in Wintershall AG that holds licenses for the develop�ment of two Libyan oil concessions C96 and C97.
3,000
2,500
2,000
1,500
1,000
500
0
707539
1,948
2,305
2,769
2004 2005 2006 2007 2008

OAO GAZPROM GAZPROM IN FIGURES 2004–2008
18
ZAO Gazprom neft OrenburgIt is a production company that holds the license for the development of the eastern part of the Orenburgskoyeoil and gas condensate field.In December 2004, the Group acquired a 49 % shareholding in ZAO Stimul (in 2008 it was renamed as ZAO Gazprom neft Orenburg) thus increasing its shareholding in the company up to 100 %.
OOO PurgazdobychaThe company holds the license for the production at the Zapadno�Tarkosalinskoye field.In accordance with the agreement signed by Gazprom and OAO Novatek in November 2004, the Group acquireda 100 % shareholding in OOO Purgazdobycha. In December 2008 the company was reorganized by means ofincorporation with OOO Gazprom dobycha Noyabrsk.
OAO RavninnoyeIn December 2007 OAO Gazprom Neft acquired from TNK�BP which held OAO Ravninnoye holds the license for the development of the Ravninnoye oil field (located in the Yamal�Nenets autonomous region) with oilreserves (categories C1+C2) estimated at 7.2 million tons. In 2008 the company joined OAO Gazpromneft�Noyabrskneftegas which is within Gazprom Neft Group. The license for Ravninnoe field was reissued for OAO Gazpromneft�Noyabrskneftegas.
ZAO Pechora NeftegazIn November 2007, OAO Gazprom Neft established control over OOO Pechora Neftegaz (in 2008 it was reorganizedinto ZAO Pechora Neftegaz) that holds the license to the Severo�Romanonsky licensed area with extractable oilreserves (categories C1+C2) of 6.0 million tons.
ZAO Neftegazovoe predpriyatie OrtyagunskoyeThe Ortyagunsky promising area borders on Gazprom Neft’s Sporyshevskoye and Sredne�Iturskoye fields.Category C3 resources at the area are estimated at 19.7 million tons of oil.OAO Gazprom Neft received a controlling interest in the OOO NPG Ortyagunskoye (in 2008 it was reorganizedinto ZAO Neftegazovoe predpriyatie Ortyagunskoye) in November 2007.
Companies, whose Reserves and Production are Included into the Associated Companies’ Indicators
ZAO NortgazThe company has been operating since 1993 and holds licenses for the development of the Neocomian depositsof the Severo�Urengoyskoye field. The title to 51 % of ordinary shares of ZAO Nortgaz was transferred to theGroup in September 2005. However, in accordance with the company’s foundation documents the said share�holding does not provide Gazprom Group with control over ZAO Nortgaz.
OAO Sibneftegaz The company holds licenses for the exploration and development of hydrocarbons at four licensed areas in theYamal�Nenets autonomous region: the Beregovoye, Pyreynoye, Zapadno�Zapolyarnoye, and Khadyryakhinskoyefields. The aggregate natural gas reserves (categories C1+C2) for these areas are estimated at 407 bcm as of December 31, 2007 and the aggregate gas production potential amounts to some 12 bcm per year. The Beregovoye field was commissioned in April 2007 with a current daily natural gas production of some20 million tons.
In December 2006, a subsidiary AB Gazprombank (ZAO) (currently called Gazprombank (OAO)) acquired a 51 %shareholding in OAO Sibneftegaz. In accordance with the company’s foundation documents such shareholdingdoes not provide Gazprom Group with control over OAO Sibneftegaz.
“Sakhalin�2” ProjectIt is one of the world’s largest comprehensive oil�and�gas projects that covers the development of the Piltun�Astokhskoye oil field and the Lunskoye gas field with reserves (categories C1+C2) totaling 173.4 million tons ofoil and gas condensate and some 634 bcm of natural gas. The “Sakhalin�2” project is regulated by theProduction sharing agreement.In April 2007, Gazprom completed a transaction, through which it acquired a 50 % shareholding plus one sharein Sakhalin Energy Investment Company Ltd. that is the operator of the “Sakhalin�2” project. In December 2008within the frames of “Sakhalin�2” Project export of crude oil started to operate all year round, also on 18 February 2009 the first LNG plant in Russia was commissioned.
OAO Tomskneft VNKOAO Tomskneft VNK holds licenses for the development of fields in the Tomsk region and the Khanty�Mansiiskautonomous region. In December 2007, Gazprom Neft acquired 50 % of shares of the oil company OAO Tomskneft

OAO GAZPROM GAZPROM IN FIGURES 2004–2008
19
VNK from an organization affiliated with OAO Rosneft (OOO Neft Aktiv). The terms and conditions of the trans�action envisage that the company’s owners should coordinate the decisions concerning major issues of itsoperation.
GAZPROM GROUP’S MAJOR PROJECTS IN THE FIELD OF HYDROCARBON SEARCH, EXPLORATION, AND PRODUCTION IN FOREIGN COUNTRIES
India
EXPLORATION DRILLING AND SEISMIC SURVEY REGION IN INDIA (BLOCK 26)
Project purpose and description: Search, exploration and production of hydrocarbons in the block NEC�OSN�97/1 (№ 26) of the Indian shelfin the Bay of Bengal. Project start: 2000The license for the search and exploration of hydrocarbons was provided for the period from 2000 through2010 with further development of the discovered fields for 20 years.Legal basis and participants:Production sharing agreement between the Government of India, OAO Gazprom and Gas Authority of India, Ltd.(GAIL) dated October 3, 2000, as well as the working Agreement signed by OAO Gazprom and GAIL on June 7, 2001. On September 2007, GAIL (Indian partner of OAO Gazprom under the Production sharingagreement within with regard to the development of Block № 26 on the Indian shelf in the Bay of Bengal)addressed OAO Gazprom with the statement that the Gazprom�GAIL consortium had fully completed its min�imum obligations regarding geologic exploration phase II and informed it about its decision not to carry outany further search and exploration work within geologic exploration phase III.Gazprom Group’s share: 100 %Total reserves estimate: 375 million tceProject progress:Phase III of the Program of geologic exploration work involved carrying out 2,824 line km of 2D seismicsurvey within the western part of the block; preparation for drilling the third exploration well NEC�W�1 is nowunderway. The expected incremental growth in natural gas reserves of the block is about 70.7 bcm. It isexpected that the field exploration will be completed and reserves estimated in 2012.
OAO GAZPROM GAZPROM IN FIGURES 2004–2008
20
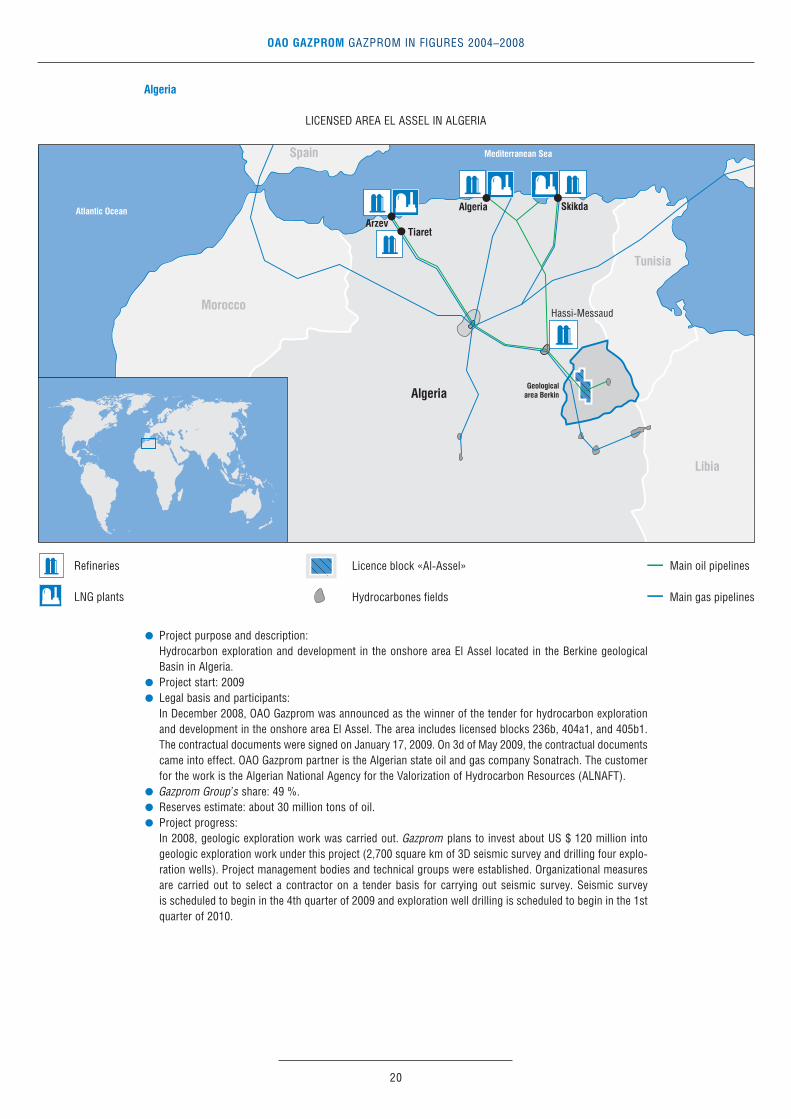
Algeria
LICENSED AREA EL ASSEL IN ALGERIA
Project purpose and description: Hydrocarbon exploration and development in the onshore area El Assel located in the Berkine geologicalBasin in Algeria.Project start: 2009Legal basis and participants: In December 2008, OAO Gazprom was announced as the winner of the tender for hydrocarbon explorationand development in the onshore area El Assel. The area includes licensed blocks 236b, 404a1, and 405b1.The contractual documents were signed on January 17, 2009. On 3d of May 2009, the contractual documentscame into effect. OAO Gazprom partner is the Algerian state oil and gas company Sonatrach. The customerfor the work is the Algerian National Agency for the Valorization of Hydrocarbon Resources (ALNAFT). Gazprom Group’s share: 49 %.Reserves estimate: about 30 million tons of oil.Project progress: In 2008, geologic exploration work was carried out. Gazprom plans to invest about US $ 120 million intogeologic exploration work under this project (2,700 square km of 3D seismic survey and drilling four explo�ration wells). Project management bodies and technical groups were established. Organizational measuresare carried out to select a contractor on a tender basis for carrying out seismic survey. Seismic survey is scheduled to begin in the 4th quarter of 2009 and exploration well drilling is scheduled to begin in the 1stquarter of 2010.
OAO GAZPROM GAZPROM IN FIGURES 2004–2008
21
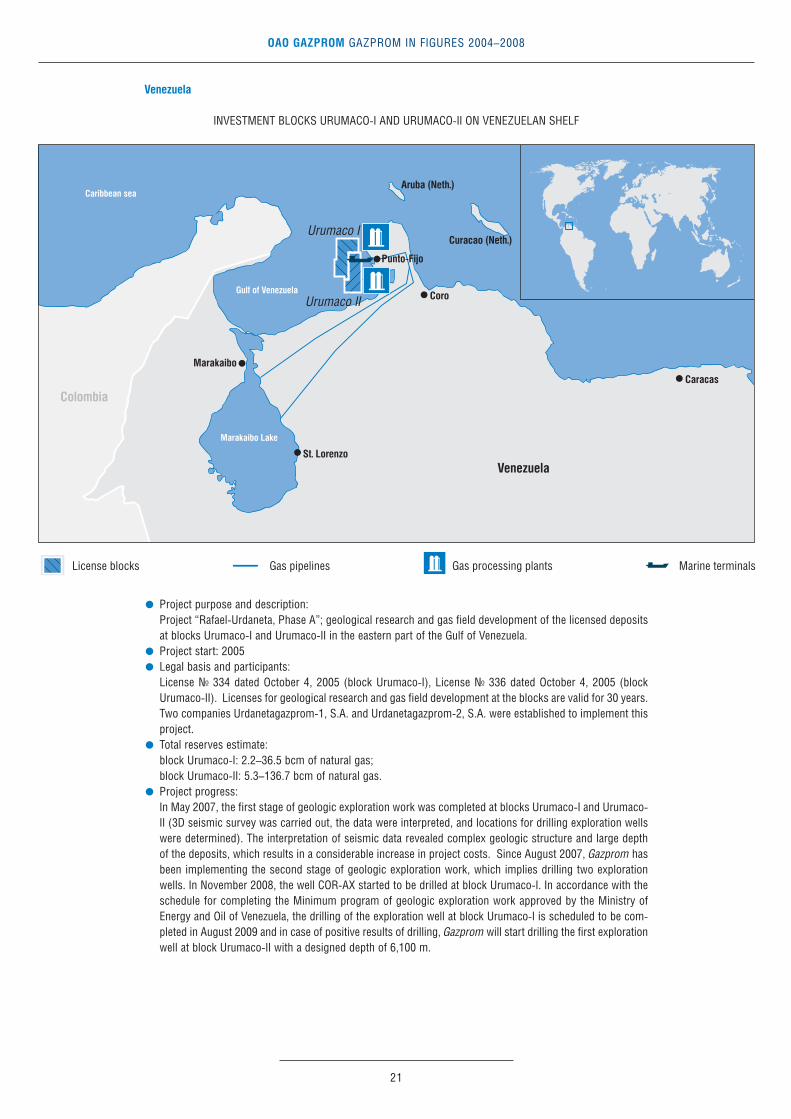
Venezuela
INVESTMENT BLOCKS URUMACO�I AND URUMACO�II ON VENEZUELAN SHELF
Project purpose and description: Project “Rafael�Urdaneta, Phase A”; geological research and gas field development of the licensed depositsat blocks Urumaco�I and Urumaco�II in the eastern part of the Gulf of Venezuela.Project start: 2005Legal basis and participants: License № 334 dated October 4, 2005 (block Urumaco�I), License № 336 dated October 4, 2005 (blockUrumaco�II). Licenses for geological research and gas field development at the blocks are valid for 30 years.Two companies Urdanetagazprom�1, S.A. and Urdanetagazprom�2, S.A. were established to implement thisproject.Total reserves estimate: block Urumaco�I: 2.2–36.5 bcm of natural gas; block Urumaco�II: 5.3–136.7 bcm of natural gas.Project progress: In May 2007, the first stage of geologic exploration work was completed at blocks Urumaco�I and Urumaco�II (3D seismic survey was carried out, the data were interpreted, and locations for drilling exploration wellswere determined). The interpretation of seismic data revealed complex geologic structure and large depthof the deposits, which results in a considerable increase in project costs. Since August 2007, Gazprom hasbeen implementing the second stage of geologic exploration work, which implies drilling two explorationwells. In November 2008, the well COR�AX started to be drilled at block Urumaco�I. In accordance with theschedule for completing the Minimum program of geologic exploration work approved by the Ministry ofEnergy and Oil of Venezuela, the drilling of the exploration well at block Urumaco�I is scheduled to be com�pleted in August 2009 and in case of positive results of drilling, Gazprom will start drilling the first explorationwell at block Urumaco�II with a designed depth of 6,100 m.

OAO GAZPROM GAZPROM IN FIGURES 2004–2008
22
Vietnam
EXPLORATION DRILLING AND SEISMIC SURVEY REGION IN VIETNAM (BLOCK № 112 INCLUDING EXTENSION) AND LOCATION OF BLOCKS № 129�132
Project purpose and description: Search, exploration, production, and sales of hydrocarbons on the Vietnamese shelf in accordance with the pro�duction sharing agreement.Project start: Block № 112 – 2000Blocks № 129�132 – 2008Legal basis and participants: Block № 112. Oil and gas contract concerning Block № 112 of continental shelf of the Socialist Republic of Vietnam dated September 11, 2000 between VNK Petrovietnam, OAO Gazprom, NK Petrovietnam, andZAO Zarubezhneftegaz. Project operator is joint operation company Vietgazprom.Blocks № 129�132. Oil and gas contract concerning Blocks № 129, 130, 131, and 132 between OAO Gazpromand VNK Petrovietnam, GKNG PVEP, and ZAO Zarubezhneftegaz. Project operator is joint operation companyVietgazprom. The oil and gas contract envisages that hydrocarbon search, exploration, production, and saleswill be based on the Production sharing agreement. The contract validity period is 30 years. Seismic surveyat sea is scheduled for 2009. Gazprom Group’s share: 50 %Total reserves and resources estimate:Reserves at Block № 112 (including extension) – over 300 bcm of natural gas and over 600 thousand tons ofcondensate. Category C1 and C2 reserves of the Bao Vang field discovered within the block in 2007 amount to18.6 bcm of hydrocarbon gases and 0.5 million tons of condensate;Reserves at Blocks № 129�132 – 700 tceProject progress: On February 13, 2008, a permit was received from the Government of the Socialist Republic of Vietnam toextend the Oil and Gas Contract over Block № 111/04, where most of the Bao Vang field is locate, which wasdiscovered in 2007. The whole volume (2,000 km) of 2D sea seismic survey was completed in the coastalpart of Blocks № 111/04 and № 112; 588,6 square km of 3D sea seismic survey was carried out in Bao Vangstructure and 311,4 square km of 3D sea seismic survey was carried out in Bao Chang structure. Thedesigned location of well VGP�113�BD�2X was determined.

OAO GAZPROM GAZPROM IN FIGURES 2004–2008
23
Libya
HYDROCARBON EXPLORATION/SURVEY REGIONS AND CONCESSION SITES OF GAZPROM IN LIBYA(LICENSE BLOCKS № 19 AND 64, CONCESSIONS C96 AND C97)
Project purpose and description: Search, exploration, production, and sales of hydrocarbons at licensed areas № 19 and № 64 and within con�cessions C96 and C97 in Libya.Project start: 2007Legal basis and participants: Licensed areas № 19 and № 64 – Production sharing agreement with Libyan National Oil Corporation(“National Oil Company”)Concessions C96 and C97 – participation in concessions belonging to Wintershall AG (project operator) asa result of the completion of an asset swap transaction with BASF.Gazprom Group’s share: Licensed area № 19 – 10 %; Licensed area № 64 – 9.8 %; Concessions C96 and C97 – 49 %.Total reserves estimate: Licensed area № 19 – 300 bcm of natural gas; Licensed area № 64 – 20 million tons of oil;Concessions C96 and C97 – 90 million tons of oil.Project progress: Licensed area № 19The program of 3D seismic survey at this area has been completed and the seismic data are now beingprocessed, same as those received earlier in the course of 2D seismic survey.Comprehensive interpretation of the seismic information is being carried out for the purpose of performinginteractive analysis of the “3D cube” and preparing the final report based on the surveys. Regional summaryis being developed with regard to the geologic and tectonic models of the eastern part of the Pelagic Basin,the nature and characteristics of the oil system.Preparatory work is underway to drill an exploration well. Pipes and other construction materials and sup�plies are being purchased. The drilling is scheduled to begin in 2010.

OAO GAZPROM GAZPROM IN FIGURES 2004–2008
24
Licensed area № 64Onshore field work was carried out that included seismic survey within the program of geologic exploration;the work is expected to be completed in June 2009. VIVID 3D seismic data were processed and compre�hensive interpretation was carried out with regard to 2D/3D seismic survey data and borehole geophysicsdata (about 24,000 km) as well as data on more than 100 wells. The work is primarily aimed at building aregional geologic as well as structural and tectonic model of the territory in the Ghadames Basin.In accordance with the obligations, the geologic exploration cycle in the area involves drilling six explorationwells. The estimated depth of the wells to be drilled is 3,500 to 3,900 m. The drilling is expected to begineither in the end of August or in the beginning of September 2010.Concessions C96 and C97Current oil production amounts to about 2.7–2.8 million barrels per moth. Work is being carried out toincrease oil production at the existing fields. Geologic exploration is also being carried out within conces�sions C96 and C97 in order to discover and commission new oil fields.
Kazakhstan
HYDROCARBON EXPLORATION AND SURVEY REGION IN CASPIAN SEA (THE TSENTRALNOYE FIELD)
Project purpose and description: Search and exploration of hydrocarbon resources in the geological structure Tsentralnaya in the Caspian Sea.Project start: 2003Legal basis and participants: Agreement between the Russian Federation and the Republic of Kazakhstan on the demarcation of theseabed in the northern part of the Caspian Sea for the purpose of exercising sovereign rights to use mineralresources dated July 6, 1998 (the Agreement) and Protocol to the Agreement dated May 13, 2002, whichestablished general principles for the demarcation of the seabed of the Caspian Sea and the development ofthe adjacent sea fields and geological structures including the geological structure Tsentralnaya. For the purpose of implementing the project, the Russian side appointed an authorized company OOO Tsentr�Kaspneftegaz (established by OAO NK Lukoil and OAO Gazprom on a parity basis) whereas the Kazakhstanside appointed OA National Company KazMunayGaz.Gazprom Group’s share: 25 %.Total reserves estimate: category C1 reserves amount to 20.2 million tce and category C2 reserves amountto 149 million tce of hydrocarbon raw materials.

OAO GAZPROM GAZPROM IN FIGURES 2004–2008
25
Project progress: The construction of the first exploration well with a depth of 4,227 m was completed. A new field – theTsentralnoye field – was discovered (the Federal Agency for the use of Mineral Resources issued in November2008 a certificate confirming the discovery of the field). In late 2008, OOO TsentrKaspneftegaz carried out 3D seismic survey and planned the beginning of the construction of the well Tsentralnaya № 2 for 4Q of 2010. OAO Gazprom and OAO NK Lukoil contemplate the issue of establishing a joint venture of OOO TsentrKaspneftegaz and OA NK KazMunayGaz in the form of a limited liability company for the purposeof acquiring rights later on to use mineral resources based on Production sharing agreements at theTsentralnoye field.
Uzbekistan
HYDROCARBON EXPLORATION, SURVEY, AND PRODUCTION AREAS IN UZBEKISTAN (USTYURT REGION)
Project purpose and description: Search, exploration, and production of hydrocarbons in the Ustyurt region of the Republic of Uzbekistan.After completing its geologic exploration work, Gazprom (that holds licenses for the use of mineralresources valid for five years) enjoys exclusive right to negotiate with the Republic of Uzbekistan with regardto the development of the discovered fields based on Production sharing agreements.Project start: 2006Legal basis and participants: Agreement on basic principles for geologic exploration of the investment blocks of the Ustyurt region of theRepublic of Uzbekistan between National Holding Company Uzbekneftegaz and OAO Gazprom datedJanuary 25, 2006. Project operator is ZAO Zarubezhneftegaz.Total reserves estimate:Category C1 and C2 reserves amount to some 120 bcm of natural gas and some 7 million tons of conden�sate. Project progress: In 2006, Management Committee of OAO Gazprom and the Cabinet of Ministers of the Republic ofUzbekistan approved a stage�by�stage Program of geologic exploration work in the Ustyurt region of theRepublic of Uzbekistan for the period from 2006 through 2011 (Geological exploration Program). The projectoperator carried out the whole volume of aerial, gravimetric, and magnetic survey, processing and interpretation

OAO GAZPROM GAZPROM IN FIGURES 2004–2008
26
of 2D seismic survey data, as well as 2D and 3D seismic survey at the seven allocated investment blocks(Shakhpakhtinsky, Agyinsky, Akchalaksky, Urginsky (western part), Kuanyshsky, Aktumsuksky, andNasambeksky blocks).Exploration well № 1, which was drilled on the Shakhpakhtinsky investment block based on the results ofseismic survey carried out within the first stage of the Program, yielded – during its test on May 12, 2009 –the net production of hydrocarbon gas of some 480 mcm per day, which confirms the possibility of discoveringa new field in the Republic of Uzbekistan.
Kyrgyzstan
HYDROCARBON EXPLORATION/SURVEY REGIONS IN KYRGYZSTAN
Project purpose and description:Creation of a basis (resource base) for the operation of a Russian�Kyrgyz joint venture that is being estab�lished. Carrying out geologic exploration work at oil�and�gas promising areas Vostochny Maylisu�IV andKugart in the Republic of Kyrgyzstan. Project start: 2006Legal basis and participants: Agreement on cooperation in the gas industry between OAO Gazprom and the Government of the Republicof Kyrgyzstan dated May 16, 2003; Memorandum on intention to establish a joint Russian�Kyrgyz oil�and�gas company dated January 27, 2006; Agreement on general principles for geologic exploration of oil�and�gas promising areas in the Republic of Kyrgyzstan dated May 14, 2007 between the Government of theRepublic of Kyrgyzstan and OAO Gazprom.Total reserves estimate: 2.1 bcm of natural gas and 500 thousand tons of oil.Project progress: In January 2008, OAO Gazprom completed the feasibility study and developed the stage�by�stage program forgeologic exploration of the agreed�upon oil and gas promising sites and the Russian�Kyrgyz SteeringCommittee was established to supervise the fulfillment of the provisions of the Agreement dated May 14, 2007.In February 2008, OAO Gazprom received licenses for the use of mineral resources at Vostochny Maylisu�IV andKugart. In July 2008, the Stage�by�stage program for geologic exploration at the areas of Kugart and VostochnyMaylisu�IV for the period from 2008 through 2011 was approved, which coordinated top�priority areas, volumesand stages of geologic exploration work at the specified areas, as well as the justified costs for their implemen�tation. In December 2008, the design of geologic exploration work at these areas was completed.

OAO GAZPROM GAZPROM IN FIGURES 2004–2008
27
Tajikistan
HYDROCARBON EXPLORATION/SURVEY REGIONS IN TAJIKISTAN
Project purpose and description: Creation of a basis (resource base) for the operation of a Russian�Tajik joint venture that is being estab�lished. Performance of geologic exploration work at oil�and�gas promising areas Sarikamysh, Sargazon,Rengan, and Zapadny Shaambary in the Republic of Tajikistan. Legal basis and participants: 2006Legal basis and participants:Agreement on strategic cooperation in the gas industry between OAO Gazprom and the Government of theRepublic of Tajikistan dated May 15, 2003; Memorandum on intention to establish a joint Russian�Tajikcompany dated March 28, 2006; Agreement on general principles for geologic exploration of oil�and�gaspromising areas in the Republic of Tajikistan dated June 10, 2008 between the Government of the Republicof Tajikistan and OAO Gazprom.Total reserves estimate: up to 50 bcm of natural gas.Project progress: In August 2008, OAO Gazprom completed the feasibility study and developed the stage�by�stage programfor geologic exploration of the agreed�upon oil and gas promising sites. In September 2008, the Russian�Tajik Steering Committee was established to supervise the fulfillment of the provisions of the Agreementdated June 10, 2008. OAO Gazprom received the license for the right to use subsurface mineral resourcesof Sarikamysh and Zapadny Shaambary.

OAO GAZPROM GAZPROM IN FIGURES 2004–2008
28
HYDROCARBON PRODUCTION
GAZPROM’S NATURAL GAS PRODUCTION, BCM
GAS PRODUCTION IN 2008 BY MAJOR OAO GAZPROM SUBSIDIARIES
550
540
530
520
510
500
552.5555.0 556.0
548.6 549.7
2004 2005 2006 2007 2008
Gazprom dobycha Yamburg – 41.0
Gazprom dobycha Urengoy – 23.6
Gazprom dobycha Nadym – 10.9
Gazprom dobycha Noyabrsk – 9.3
Others – 15.2

OAO GAZPROM GAZPROM IN FIGURES 2004–2008
29
GAZPROM’S LIQUID HYDROCARBONS PRODUCTION, MILLION TONS
GAZPROM GROUP PRODUCTION CAPACITY
2004 2005 2006 2007 2008Producing fields. 78 114 119 122 122Gas production wells 6,652 6,941 7,010 7,154 7,214
including those in operation 6,094 6,401 6,513 6,640 6,723Oil production wells 375 5,018 5,486 5,881 5,932
including those in operation 202 4,372 4,948 5,342 5,444Comprehensive and preliminarygas treatment plants (CGTU and PGTU) 161 169 170 172 173CGTU aggregate design capacity, bcm per year 909.0 939.6 957.8 976.0 991.0Booster compressor stations (BCS) 41 44 44 45 45BCS installed capacity, MW 3 956.1 4,176.1 4,176.1 4,300.1 4,460.1
GAZPROM’S MAJOR PERSPECTIVE FIELDS
Nadym�Pur�Tazovsky Region (Western Siberia)
Zapolyarnoye Field. It is located close to Gazprom’s major fields that are under development. In 2004, theCenomanian deposits of the Zapolyarnoye field characterized by low depth and high productivity of gas wellswere brought to their design capacity of 100 bcm per year. The design annual production volume for thesedeposits was adjusted in 2007 and reached 115 bcm. This natural gas production level is expected to be reachedin 2011. The development of the Zapolyarnoye field made it possible to significantly offset the decreasingproduction at Gazprom’s “old” fields in Western Siberia. The Valanginian deposits of the field are planned to becommissioned in 2009 and reach their design capacity of 15.0 bcm per year in 2011
Kharvutinskaya Area of the Yamburgskoye Field. It is located in the southern part of the Yamburgskoye field. It was commissioned in 1996.A preliminary gas treatment unit was commissioned in 2007 with an annual production capacity of 8.2 bcm.The design capacity of 30 bcm of natural gas per year is planned to be reached at this area in 2010.
Oil Condensate
35
30
25
20
15
10
5
0
2004 2005 2006 2007 2008
0.9
11.1 9.511.5
34.0
11.4
34.0
11.3
32.0
10.9

OAO GAZPROM GAZPROM IN FIGURES 2004–2008
30
LOCATION OF MAIN GAZPROM PERSPECTIVE FIELDS
Achimovsk Deposits of the Urengoyskoye field. The deposits are divided into several areas for their stage�by�stagedevelopment. The area 1A of Achimovsk Deposits of the Urengoyskoye field was commissioned in July 2008. Thearea is being developed by ZAO Achimgaz – a joint venture established together with Wintershall Holding AG.During the period of its trial industrial development this area is expected to provide for the production of some 0.7 bcm of natural gas and 400 thousand tons of gas condensate per year. If the phase is a success, the com�mercial development of the field will begin with a production level of some 7.4 bcm of natural gas and 2.4 milliontons of gas condensate per year. The second area of the Achimovsk deposits of the Urengoyskoye field is intendedto be commissioned in 2008 with a production capacity of 3.5 bcm of natural gas per year.
Yen�Yakhinskoye Field. It was commissioned in 2003. The design annual production levels of 1.8 million tonsof gas condensate and 5 bcm of natural gas were reached in 2007. Effective from 2010, the field is planned tobe developed using the gas reinjection (cycling) technology that provides for the maximum withdrawal of gascondensate.
Yuzhno�Russkoye Field. It is located in Krasnoselkupskiy district of the Yamalo�Nenets Autonomous District ofTyuman oblast. OAO Severneftegazprom holds a license for its development. It was commissioned in 2007. In 2009 the field was brought to its design capacity of 25.0 bcm.
Priobskoe field. The largest field being developed by Gazprom Neft is the Southern part of Priobskoe field.(Khanty�Mansiisk autonomous district).The active development of this field started in 2004. By the year 2008production at this filed was more than 23% from the total amount of Gaprom Neft production and as expectedthis indicator will reach 30.4 % by 2010.
Yamal Peninsula
The explored reserves of the fields on the Yamal Peninsula amount to over 10 tcm of natural gas and over 500 million tons of oil and gas condensate. In particular, 58 % of natural gas and over 60 % of oil and gas condensate are concentrated at the major fields in the region, i.e. the Bovanenkovskoye, Kharasaveiskoye andNovoportovskoye fields, Gazprom Group holding licenses for their development. Gazprom and the administration

OAO GAZPROM GAZPROM IN FIGURES 2004–2008
31
of the Yamalo�Nenetski autonomous region developed the Program for comprehensive commercial developmentof hydrocarbon deposits on the Yamal Peninsula and the adjacent waters. The Program is aimed at developingthe state policy underlying the investment, capital construction, and taxation as well as the regulatory basis toensure the necessary environment for the development of the Yamal Peninsula.The design natural gas production capacity of the Bovanenkovskoye field is defined as 115 bcm per year. In thelong�term prospective, the design natural gas production capacity is to increase up to 140 bcm per year.
Shelf in the Arctic Seas
Shtokmanovskoye Gas Condensate Field. It is located in the central part of the Barents Sea to the north�westfrom the Yamal Peninsula and 650 km to the north�east from the city of Murmansk. The development plan forthis field envisages a production level of 71 bcm per year. There is a potential of its increase up to 95 bcm peryear. After the completion of the first development stage the design production capacity is expected to be 23.7 bcm of natural gas per year; natural gas will start being supplied through pipelines since 2013; LNG willstart being supplied in a volume up to 7.5 million tons per year since 2014. Natural gas is planned to be supplied both through the UGSS and as LNG to remote markets. In 2007, Gazprom signed framework agree�ments with Total and StatoilHydro with regard to the basic principles of cooperation in the development of thefirst phase of the Shtokmanovskoye gas condensate field.In 2008 a company of special purpose Stockman development AG was established for development, building,project planning, financing and exploitation of the first phase objects of Schtockmanovskoe field. Its mainshareholders are OAO Gazprom 51%, French company Total 25% and Norwegian company Statoilhydro 24%.
Prirazlomnoye Oil Field. It is located on the shelf of the Pechora Sea. The plans include installing a sleetproofocean drilling platform and starting production at the field in 2010; the design production capacity of 6.6 mil�lion tons per year is to be reached in 2012.
Obskaya and Tazovskaya Bays
There are a number of hydrocarbon fields located in the Obskaya and Tazovskaya bays in the Yamalo�Nenetskiautonomous region of the Tyumen region. In accordance with the Program for developing hydrocarbon reserveson the shelf belonging to the Russian Federation for the period up to 2030 approved in 2005, the annual naturalgas production on the shelf in the Obskaya and Tazovskaya bays and the adjacent land can reach up to 82 bcm.The aggregate reserves (categories C1 and C2) on the shelf in the region amount to 1.3 tcm of natural gas and 12.6 million tons of liquid hydrocarbons. Gazprom holds licenses for hydrocarbon production at Severo�Kamennomysskoye, Kamennomysskoye�morye, Obskoye fields, geologic examination licenses for theChugoryakhinskaya area and also exploration and production licenses for Semakovskoye, Antipayutinskoe andTota�Yachinskoe fields partialy located in Tazovakaya Bay. The development of the region is planned to begin withthe commissioning of the Kamennomysskoye�morye field in 2015 with a design natural gas production capacityof 15.3 bcm per year.
Volga Region
Astrakhanskoye Field. It is located in the Volga estuary. Judging by its total reserves (categories C1+C2) of 3.4 tcm, its reservoirs are capable of yielding a production volume of 50–60 bcm of natural gas per year.Currently, its production is constrained at 12 bcm per year mostly due to environmental limitations as well asthe need to use expensive technologies. In order to increase production volumes the opportunities are contemplated that envisage the development of the Astrakhanskoye field using the technology of pumping acidgases into the reservoir, which will allow decreasing hazardous emissions considerably and eliminating problemsrelated to the storage and sale of associated sulfur.
Eastern Siberia and Russian Far East
Eastern Siberia and Russian Far East, including the coastal shelf, accumulate considerable natural gas reservesestimated at some 10 tcm.In 2003, a decision was taken to view the following as OAO Gazprom top�priority objective in the Russian East:arranging for the measures to participate in contests and auctions for the right to use mineral resources, carryout geologic exploration work, and develop hydrocarbon fields in the Krasnoyarsk area, Irkutsk region, Sakhalinregion, Republic of Sakha (Yakutia), and Khabarovsk area, establishing interaction with the current players inthe natural gas market in the region, as well as devising and implementing efficient projects for the supply ofnatural gas to ultimate consumers.In accordance with the Eastern Program approved by the Government in 2007, the Island of Sakhalin is one ofthe top�priority regions for fullscale commercial development in Russian Far East.

OAO GAZPROM GAZPROM IN FIGURES 2004–2008
32
Gazprom’s key objectives in developing its operations at Sakhalin are to establish its own resource base andcreate and develop the gas transportation system connecting Sakhalin, Khabarovsk, and Vladivostok. Geologicexploration work is carried out in the Krasnoyarsky krai and the Irkutsk region. In 2008, the Government of theRussian Federation took a decision to transfer to Gazprom the Chayandinskoye oil and gas condensate fieldlocated in the Republic of Sakha (Yakutia) with natural gas reserves (categories C1+C2) of 1.24 tcm and theKirinskoye gas condensate field located on the Sakhalin shelf with natural gas reserves (categories C1+C2) of 75.4 bcm.
TRANSPORTATION AND UNDERGROUND STORAGE
Gazprom began to construct its gas pipelines more than 60 years ago, the Saratov – Moscow gas pipeline beingits first one. Most parts of the gas transportation system were constructed in the period from 1970 to 1990.Currently, Gazprom owns and operates the Unified Gas Supply System, which provides for the collection, trans�portation, storage, and supply of almost all natural gas to the regions of the Russian Federation, Europe, andFSU countries.
LENGTH OF TRUNK PIPELINES AND PIPELINE BRANCHES (IN SINGLE�LANE MEASURING), THOUSAND KM
PIPELINE ANNUAL PUTTING INTO OPERATION, KM
162
160
158
156
154
152
150
148
152.8
155.0
156.9
158.2
159.5
2004 2005 2006 2007 2008
1,700
1,500
1,300
1,100
900
700
500
1,0141,402
1,526
1,157
1,381
2004 2005 2006 2007 2008

OAO GAZPROM GAZPROM IN FIGURES 2004–2008
33
TRUNK PIPELINES STRUCTURE BY TUBES DIAMETER, %
GAZPROM GAS TRANSPOTRATION SYSTEM INSTALLED EQUIPMENT
2004 2005 2006 2007 2008Pipeline compressor stations 207 210 217 218 219Gas pumping units 3,537 3,587 3,629 3,641 3,695 including:
gas turbine units and gas 2,853 2,903 2,947 2,962 3,017 engine�compressors electric drive units 684 684 682 679 678
Installed capacity of pumping units, thousand MW 39.4 40.2 41.0 41.4 42.0
TOTAL AMOUNT OF GAS RECEIVED BY GAS TRANSPORTATION SYSTEM, BCM
1,420 mm – 34.3
1,220 mm – 16.2
1,020 mm – 10.8
Less than 820 – 38.7
720
710
700
690
680
670
660
714.3
2004 2005 2006 2007 2008
684.4
699.7
717.8
706.7

OAO GAZPROM GAZPROM IN FIGURES 2004–2008
34
EURASIAN GAS TRANSPORTATION SYSTEM
GAZPROM’S GAS TRANSPORTATION PROJECTS
SRTO – Torzhok
Purpose: Transportation of natural gas from the fields located in northern areas of the Tyumen Region to thecity of Torzhok that will make it possible to increase gas supply to the consumers in the North�Westernregion of Russia and gas export through the Yamal�Europe pipeline.Design characteristics: A length of 2,200 km and a design capacity varying from 20.5 to 28.5 bcm per yearat different parts.Project progress: The whole linear part of the gas pipeline was commissioned in 2006. Two compressor stations were commissioned in 2008 with an aggregate capacity of 155 MW. The construction is planned tobe completed in 2011.
Gryazovets – Vyborg
Purpose: Gas supply to the North�West of Russia and the Nord Stream gas pipeline.Design characteristics: A length of 917 km. 7 compressor stations with an aggregate capacity of 1,180 MW.Project progress: As of 31.12.2008 473.7 km of the linear part of the gas pipeline were commissionedincluding 165.3 in 2008.The contract was signed with “Roils�Royce” company which was acknowledged tobe the winner of competitive tender for delivery during the year 2010 of 6 gas�pumping units 52 MW eachand 2 gas�pumping units 27 MW each to a compressor station “Portovaya” of trunk pipeline.

OAO GAZPROM GAZPROM IN FIGURES 2004–2008
35
Nord Stream
Purpose: Transportation of Russian natural gas to Western European countries.Design characteristics: A length of 1,223 km, pipe diameter of 1,220 mm, operation pressure up to 220 bar,and a capacity of up to 55 bcm of natural gas per year.Project progress: In June 2008 all necessary approvals from OAO Gazprom managerial bodies and Germanpartners were obtained and the deal on entering Gasunie company (Netherlands) the number of shareholdersof Nord Stream AG company which was founded in 2005 for engineering, building, operation and NordStream pipe line managing.As a result of that the shares in Nord Stream AG has been distributed in the following wasy: ОАО Gazprom –51 %, Wintershall Holding AG and EON Ruhrgas – 20 % each, Gasunie – 9 %. Nord Stream AG company prepared and sent to concerned entities the environment impact assessment report. Contracts were con�cluded for delivery of large�diametre pipes for the first line of the pipe�line, pipe�laying works, production ofconcrete weight coatings and logistics supply.
Expansion of Urengoy Gas Transportation Unit
Purpose: Transportation of the increasing volumes of natural gas produced by Gazprom and independentproducers at the fields that are under development in the Nadym�Pur�Tazovsky region.Design characteristics: A length of 400 km, three compressor stations with an aggregate capacity of 272 MW.Project progress: 378.1 km of the linear part of the gas pipelines and 3 compressor stations with capacityof 224 MW were commissioned included 76.4 km of the linear part of the gas pipelines and also 4 aggre�gates with total capacity of 64MW at Purtazovskaya CS commissioned in 2008.
Precaspian Gas Pipeline
Purpose: Transportation of Turkmen and Kazakh naural gas through the territories of Turkmenistan, Kazakhstan,and Russia.Design characteristics: A production capacity of 20 bcm of natural gas per year.Project progress: In September 2008 OAO Gazprom, AO NK KazMunayGaz and GK Turkmengas signed anagreement on main principals of cooperation of Precaspean pipe line building, Regulation on coordinatingcommittee, regulation on project managing group and bases task for project feasibility study.
Murmansk – Volkhov Gas Pipeline
Purpose: Supply of natural gas from the Shtokmanovskoye field to the consumers in the North�Westernregion of Russia and gas export within the Nord Stream project.Design characteristics: A length of 1,365 km and a production capacity of 28–50 bcm (depending upon theproduction volume at the Shtokmanovskoye field). The commissioning is scheduled for 2013.Project progress: ОАО Giprospetsnaz realizes development of project documentation, primary acquisitionand its reconciliation have been completed. Engineering surveys are being done.
Bovanenkovo – Ukhta and Ukhta – Torzhok Gas Pipelines
Purpose: Transportation of natural gas from the fields in the Yamal Peninsula to the central regions ofRussia.Design characteristics: Bovanenkovo – Ukhta: a length of 1,100 km and a design capacity of 140 bcm ofnatural gas per year. Ukhta – Torzhok: a length of 1,300 km and a design capacity of 81.5 bcm of naturalgas per year.Project progress: In August 2008 the building of underwater line through Baidiratskaya guba, the mostcomplicated part of Bovanenkovo – Ukhta gas pipe line system was
Gas transportation system Sakhalin�Khabarovsk�Vladivostok
Purpose: Meeting gas demand if consumers of Khabarovsk, Primorskiy krais and Sakhalin Oblast. Design characteristics: The main technical decisions of gas transportation system are supposed laying of1,586 кm of gas pipe line with 1,220 mm diameter for the whole rout. While operating at full capacity thevolume of gas transmitted is supposed to be 30 bcm. Project progress: In 2008 design works were performed.

OAO GAZPROM GAZPROM IN FIGURES 2004–2008
36
UNDERGROUND GAS STORAGE
A system of underground gas storage facilities provides for the regulation of seasonal fluctuations in naturalgas supply, additional natural gas supply in case of sudden cold spells, technical breakdowns in the UGSS,and other critical situations, as well as for the safety of export supplies and long�term natural gas reservation.
CHARACTERISTICS OF GAZPROM’S UGSF LOCATED IN RUSSIA
2004 2005 2006 2007 2008
Underground gas storage facilities 24 24 25 25 25
Total active capacity, bcm 62.38 64.25 64.65 64.94 65.2
Compressor station 19 19 17 17 17
Gas pumping units 243 247 220 230 232
Gas pumping units installed capacity, MW 991.4 1,009.8 694.3 758.6 778.6
Number of development wells 2,473 2,509 2,588 2,618 2,615
VOLUME OF GAS PUMPED INTO AND RETRIEVED FROM RUSSIAN UGSF, BCM
Gazprom implements its Program of work for the period from 2005 through 2010 related to the undergroundgas storage in the Russian Federation, which is aimed at bringing UGSF daily output up to 700 mmcm.
Gas pumped Gas retreived
60
50
40
30
20
10
0
2004 2005 2006 2007 2008
42.637.9
46.342.8
50.4 48.243.0 41.7
51.6
36.1

OAO GAZPROM GAZPROM IN FIGURES 2004–2008
37
GAZPROM’S OPERATIONAL AND PROSPECTIVE UGSFS IN RUSSIA
MAXIMUM DAILY RETRIEVAL FROM UGSF LOCATED IN RUSSIA IN THE BEGINNING OF RETRIEVAL SEASON, MMCM
In order to improve the reliability of export deliveries the Group uses underground facilities and participates inconstruction of new underground facilities abroad.
700
600
500
400
300
200
100
0
550 568600 608 620
2004 / 2005 2005 / 2006 2006 / 2007 2007 / 2008 2008 / 2009

OAO GAZPROM GAZPROM IN FIGURES 2004–2008
38
OPERATIONAL UGSFS GAZPROM USES AND PROSPECTIVE UGSF PROJECTS GAZPROM PARTICIPATES ABROAD
VOLUME OF GAS PUMPED INTO FOREIGN UGSF, BCM
Latvia Germany Austria United Kingdom France
1.6
1.4
1.2
1.0
0.8
0.6
0.4
0.2
0
2005 2006 2007 2008
1.5
0.40.4
0.1
1.6
1.1
0.40.3
0.1
1.1
0.9
0.4
1.31.4
0.9
0.5
0.3

OAO GAZPROM GAZPROM IN FIGURES 2004–2008
39
ELECTRIC POWER SUPPLY TO UGSS TECHNOLOGIC FACILITIES
OAO Gazprom owns power generating assets to ensure reliable and continuous electric power supply to UGSStechnologic facilities. Reliable power supply of all field production project sites, gas transportation and gaspocessing sites is one of the terms providing stable operation of OAO Gazprom gas transportation system.As of December 2008 the following items were in the service:
more than100.8 thousand km of electric power lines; more than 20 thousand of power transformers 6–220 кV;1,858 of power stations, with a unit capacity of 500 kW or more each;6.7 thousand of boilers and heat regenerators
In 2008 the total amount of electric power consumption at OAO Gazprom objects was 18.9 billion of kWh, theout put at own production capacities was – 1.35 billion of kWh. Consumption of heat power for technical needsin 2008 was 24.7 million of Gcal.In 2008 within the frames of new construction and reconstruction plans the following objects of power gener�ation were commissioned:
6 power stations for own usage with total aggregate capacity 59.8 МW2 electric substations of 110/10 кV;5 closed distribution devices with a voltage of 10 кV (at CS Purtazovskaya, CS Alexandrov gai, CS Mikunskaya,KS Omskaya, CA Novoyubileynaya);11 centralized boilers with total capacity of 64 MW (on the bases of Kharasaveyskoe gas�condensate field;CS Novoyubileynaya, Novogryazovetskaya, Alexandov Gay, Omskaya)29 separate boilers with total capacity of 13.5 MW (at CS Mikunskaya, Provodninskaya, Propolyarnaya,Peregrebnenskaya).
TECHNOLOGICAL COMMUNICATIONS AND AUTOMATION OF TECHNOLOGICAL PROCESSES CONTROL
The unified technological communications network is an integral part of OAO Gazprom multi�level managementsystem. It provides for reliable, state�of�the�art, and high�quality transfer of all types of information in the interestof the company’s operation.In 2008, Gazprom restored and constructed 3,247 km of digital radio�relay communications lines, 686 km of cablecommunication lines, 664 km of radio cable lines, 1,536 km of fiber�optic communications lines, transmittingsystem SpectralWave 40/80 with length of 771km alongside of “Yamal�Europe” gas pipe line. 17 automatictelephone stations were also commissioned.As of 21.12.2008 OAO Gazprom unified technological communications network currently includes:
82.7 thousand km of cable lines of communication;28.6 thousand km of multi�channel radio�relay lines;912 communications centers;492 base and 28.1 subscriber trunking radio stations;a satellite communications network consisting of Yamal�100 and Yamal�200 responders and 271 earth stations 872 automatic telephone stations with a total capacity of 344, 394 numbers;unified departmental network for data transmission.
The following was performed at the natural gas production and transportation facilities in 2008: automation systems and automatic systems for technological processes control were commissioned at gas transportation unit 16 of Pestsovaya area of Urengoi gas condensate field, booster comressor station (2nd phase) of Zapadno�Takosalinskiy GM, booster comressor station (2nd phase) of Yamsoveyskoe gas con�densate field, CS at Central Production Facility�1,2 of Urengoi oil ans gas condensate field, 2nd experimentalarea of gas transportation unit 22 of Atchimov deposits of Urengoi oil ans gas condensate field, gas trans�portation unit at Alexandov Gay CS.38 wells of Kharvutinskaya area of Yamburg field, 15 additional wells of Yamburg field, 3 wells of the secondexperimental area of gas transportation unit 22 of Atchimov deposits of Urengoi oil ans gas condensate fieldand 9 wells of Astrakhan gas�condensate field were equipped with remote control systems.
As for gas transportation in 2008, 33 modular systems and 10 craft automatic systems were commissioned atnew built linear compressor stations Miunskaya, Privodninskaya, Novogryazovetskaya, Voskresenskaya,Taezhnaya, Priozernaya and Oktyabrskaya. Complex acceptance inspections of process automated control system at Kholm�Zhirkovskaya CS were realized. Remote control was introduced at 5,501 km of pipe lines, 11 control poins, 123 linear controlled points at gas pipe lines and 47 CP of teleautomatics at gas�distributionstation were commissioned, Reconstruction of 55 modular systems, 26 craft automatic systems, 62 fire extin�guisher systems and gas contamination systems was realized.

OAO GAZPROM GAZPROM IN FIGURES 2004–2008
40
REFINING AND PRODUCTS
NATURAL AND ASSOCIATED PETROLEUM GAS PROCESSED BY GAZPROM, BCM
Note. Due to deconsolidation, Sibur Holding Group’s results are not included in Gazprom Group’s results effective from the 2nd half of 2008.
CRUDE OIL AND UNSTABLE CONDENSATE PROCESSED BY GAZPROM, MILLION TONS
REFINED AND PETROCHEMICAL PRODUCTS MANUFACTURED BY GAZPROM GROUP*
2004 2005 2006 2007 2008
OAO Gazprom gas processing and gas production subsidiaries Stable condensate and oil, thousand tons 3,256.2 3,728.7 3,792.8 3,653.0 3,413.8
Stripped dry gas, bcm 25.0 26.5 26.0 26.5 26.5
Liquefied hydrocarbon gases, thousand tons 1,854.0 1,881.9 1,837.7 2,109.8 2,037.2
Motor gasoline, thousand tons 2,005.1 2,242.7 2,158.8 2,141.8 2,132.3
Diesel fuel, thousand tons 1,732.1 1,640.8 1,442.9 1,429.3 1,394.1
Fuel oil, thousand tons 392.8 380.8 380.5 394.2 389.7
Jet fuel, thousand tons 15.0 50.9 150.2 133.9 161.4
Helium, thousand cubic meters 3,452.3 1,636.4 3,838.1 4,874.0 5,037.9
Odorant, tons 2.7 3.1 3.0 2.8 3.0
Wide liquid fractions and fractions of multiple
component hydrocarbons, thousand tons 398.4 541.6 881.4 587.5 554.6
Excluding Sibur Holding Including Sibur Holding
50
45
40
35
30
25
2004 2005 2006 2007 2008
44.0
32.433.9 33.5
33.3 33.3
46.347.3
44.0
38.4
45
40
35
30
25
20
15
10
5
0
11.3
16.1
36.438.2
40.1
2004 2005 2006 2007 2008
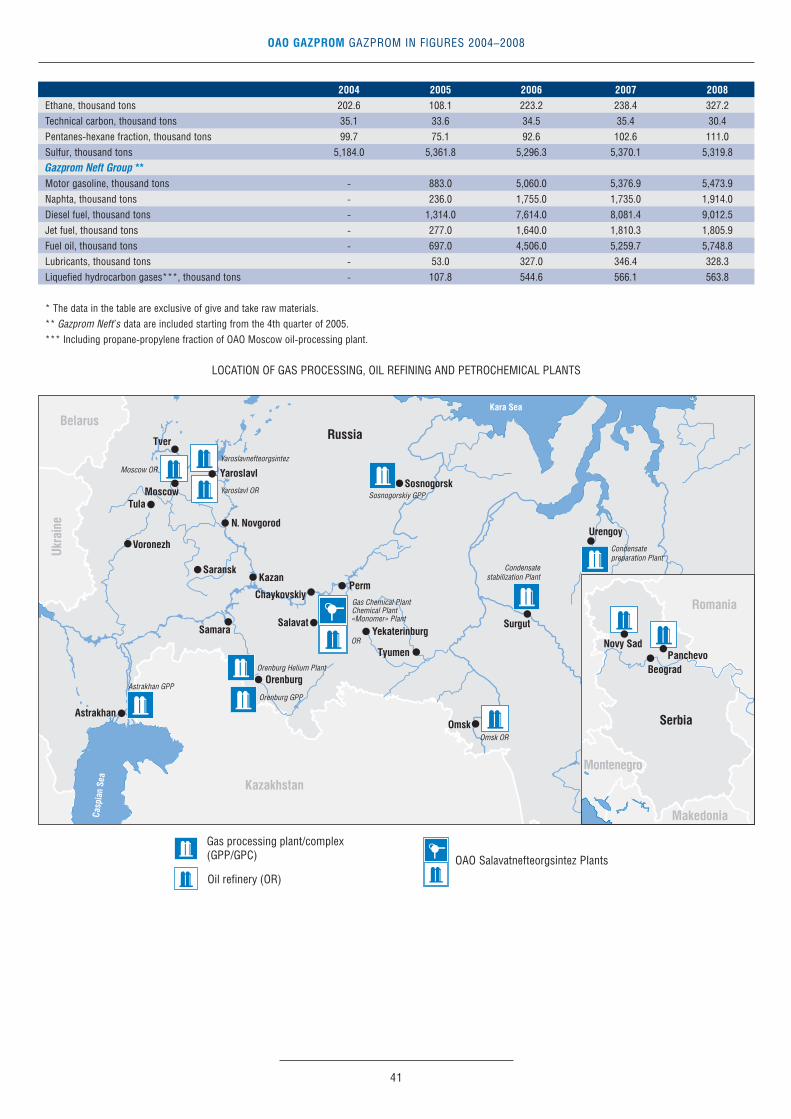
OAO GAZPROM GAZPROM IN FIGURES 2004–2008
41
2004 2005 2006 2007 2008
Ethane, thousand tons 202.6 108.1 223.2 238.4 327.2
Technical carbon, thousand tons 35.1 33.6 34.5 35.4 30.4
Pentanes�hexane fraction, thousand tons 99.7 75.1 92.6 102.6 111.0
Sulfur, thousand tons 5,184.0 5,361.8 5,296.3 5,370.1 5,319.8
Gazprom Neft Group **Motor gasoline, thousand tons � 883.0 5,060.0 5,376.9 5,473.9
Naphta, thousand tons � 236.0 1,755.0 1,735.0 1,914.0
Diesel fuel, thousand tons � 1,314.0 7,614.0 8,081.4 9,012.5
Jet fuel, thousand tons � 277.0 1,640.0 1,810.3 1,805.9
Fuel oil, thousand tons � 697.0 4,506.0 5,259.7 5,748.8
Lubricants, thousand tons � 53.0 327.0 346.4 328.3
Liquefied hydrocarbon gases***, thousand tons � 107.8 544.6 566.1 563.8
* The data in the table are exclusive of give and take raw materials.
** Gazprom Neft’s data are included starting from the 4th quarter of 2005.
*** Including propane�propylene fraction of OAO Moscow oil�processing plant.
LOCATION OF GAS PROCESSING, OIL REFINING AND PETROCHEMICAL PLANTS

OAO GAZPROM GAZPROM IN FIGURES 2004–2008
42
GAS
PRO
CESS
ING,
OIL
REF
ININ
G AN
D PE
TRO
CHEM
ICAL
S PL
ANTS
Nam
e Co
mpa
nyLo
catio
nYe
ar o
fAn
nual
cap
acity
of
proc
essi
ng/
Mai
n pr
oduc
tses
tabl
ishm
et
Pro
duct
ran
ge p
rodu
ctio
nas
of
31.1
2.20
08O
AO G
azpr
om g
as p
roce
ssin
g an
d ga
s pr
oduc
tion
subs
idia
ries
As
trak
han
gas
ОО
О G
azpr
om
Astr
akha
n19
8612
.0 b
cm o
f na
tura
l gas
Dry
nat
ural
gas
, sta
ble
cond
ensa
te,
proc
essi
ng p
lant
(G
PP)
doby
cha
Astr
akha
n7.
3 m
illio
n to
ns o
f ga
s co
nden
sate
,liq
uefie
d ga
s, w
ide
frac
tion
and
crud
e oi
lof
ligh
t hy
droc
arbo
ns (
WFL
H),
gaso
line,
die
sel f
uel,
fuel
oil,
sul
fur
O
renb
urg
GPP
ОО
О G
azpr
om d
obyc
ha
Ore
nbur
g19
7437
.5 b
cm o
f na
tura
l gas
Dry
nat
ural
gas
, sta
ble
cond
ensa
te,
Ore
nbur
g6.
2 m
illio
n to
ns o
f ga
s co
nden
sate
lique
fied
gas,
WFL
H, g
as s
ulfu
r, o
dora
ntan
d cr
ude
oil
Ore
nbur
g H
eliu
m P
lant
ОО
О G
azpr
om d
obyc
ha
Ore
nbur
g19
7815
.0 b
cm o
f na
tura
l gas
Hel
ium
gas
eous
and
liqu
efie
d,
Ore
nbur
gdr
y na
tura
l gas
, liq
uefie
d ga
s, e
than
e,
WFL
H, p
enta
ne�h
exan
e fr
actio
n (P
HF)
Sosn
ogor
sky
GPP
ОО
О G
azpr
om
Sosn
ogor
sk,
1946
Dry
nat
ural
gas
, sta
ble
cond
ensa
te, l
ique
fied
gas,
pere
rabo
tka
Kom
i Rep
ublic
natu
ral
mot
or g
asol
ine,
tec
hnic
al
Ure
ngoy
Con
dens
ate
ОО
О G
azpr
om
Ure
ngoy
1985
De�
etha
nize
d ga
s co
nden
sate
, sta
ble
Prep
arat
ion
Plan
t pe
rera
botk
aga
scon
dens
ate,
liqu
efie
d ga
s, m
otor
gas
olin
e,
dies
el f
uel,
gas
cond
ensa
te li
ght
dist
illat
e Co
nden
sate
О
ОО
Gaz
prom
Su
rgut
1985
Stab
le g
as c
onde
nsat
e (o
il), m
otor
gas
olin
e,
Stab
iliza
tion
Plan
tpe
rera
botk
adi
esel
fue
l, TS
�1 je
t en
gine
fue
l, liq
uefie
d ga
s,
WFL
H, P
HF,
gas
con
dens
ate
light
dis
tilla
teO
AO S
alav
atne
fteo
rgsi
ntez
Oil
proc
essi
ng p
lant
OAO
Sal
avat
�Sa
lava
t19
53
11.7
mill
ion
tons
of
oil
Unl
eade
d ga
solin
e N
orm
al�8
0, R
egul
ar�9
2,
neft
eorg
sint
ezan
d ga
s co
nden
sate
Prem
ium
�95,
gas
olin
es in
com
plia
nce
with
the
Euro
pean
sta
ndar
ds (
Reg
ular
Eur
o�92
/4,
Prem
ium
Eur
o�95
/4),
gas
con
dens
ate
dist
ilate
,oi
l tol
uol,
fuel
oil,
isop
enta
ne�i
soam
ylen
e fr
actio
n,oi
l ben
zol,
oil s
olve
nt, a
bsor
bent
�ker
osen
e,di
sel f
uel,
raw
mat
eria
ls f
or p
rodu
ctio
n of
oil
road
bitu
men
, tec
hnic
al s
ulph
er, o
il bi
tum
ens,
bro
ad
frac
tion
of li
ght
hydr
ocar
bons
, dem
erca
ptan
ized
st
able
gas
con
dens
ate,
cat
alys
ts“M
onom
er”
plan
tO
AO S
alav
at�
Sala
vat
1991
,30
0 th
ousa
nd t
ones
of
ethy
lene
Oil
benz
ol, p
ropy
lene
, eth
ylen
e, s
tyro
le, h
eavy
ne
fteo
rgsi
ntez
base
d on
cap
aciti
es14
4 th
ousa
nd t
ones
of
prop
ylen
epi
roly
sis
resi
n, p
enta
ne�i
sopr
ene
cycl
open
tadi
ene
of 1
960t
h–80
th45
.7 t
hous
and
tone
s of
pol
yeth
ylen
ean
d bu
tyle
ne�b
utad
iene
fra
ctio
n, p
olys
tyre
ne o
fba
se g
rade
s, s
hock
�res
ista
nt p
olys
tyre
ne p
late
,po
lyet
hyle
ne o
f ba
se g
rade
sN
atur
al g
as c
hem
ical
pla
ntO
AO S
alav
at�
Sala
vat
2007
,38
.4 t
hous
and
tone
s of
pla
stic
izer
sM
ore
than
20
nam
es o
f pr
oduc
tion,
incl
udin
gne
fteo
rgsi
ntez
base
d on
cap
aciti
es17
3 th
ousa
nd t
ones
a
carb
amid
e, li
quid
am
mon
ia, a
qua
amm
onia
,of
195
0th–
1980
thof
pro
pyl c
arbi
nol
oxig
en t
echn
ical
, car
bon
diox
ide,
nitr
ogen
53
9.9
thou
sand
ton
es o
f am
mon
iate
chni
cal,
prop
yl a
nd is
opro
pyl c
arbi
nol,
630
thou
sand
ton
es o
f ca
rbam
ide
plas
ticiz
ers,
pht
halic
anh
ydri
deCh
emic
al p
lant
OAO
Sal
avat
�Sa
lava
t19
6531
.2 t
hous
and
tone
s So
lutio
n of
sod
ium
nitr
ite, s
ulfir
ic n
atri
um
neft
eorg
sint
ezof
sod
ium
nitr
ate
tech
nica
l, di
met
hyla
min
e17
.0 t
hous
and
tone
s of
dim
ethy
lam
ine
3 bc
m o
f na
tura
l gas
12.3
mill
ion
tons
of
uns
tabl
e co
nden
sate
(dee
than
izat
ion)
10.9
mill
ion
tons
of
unst
able
co
nden
sate
, inc
ludi
ng d
eeth
aniz
ed
(sta
biliz
atio
n)
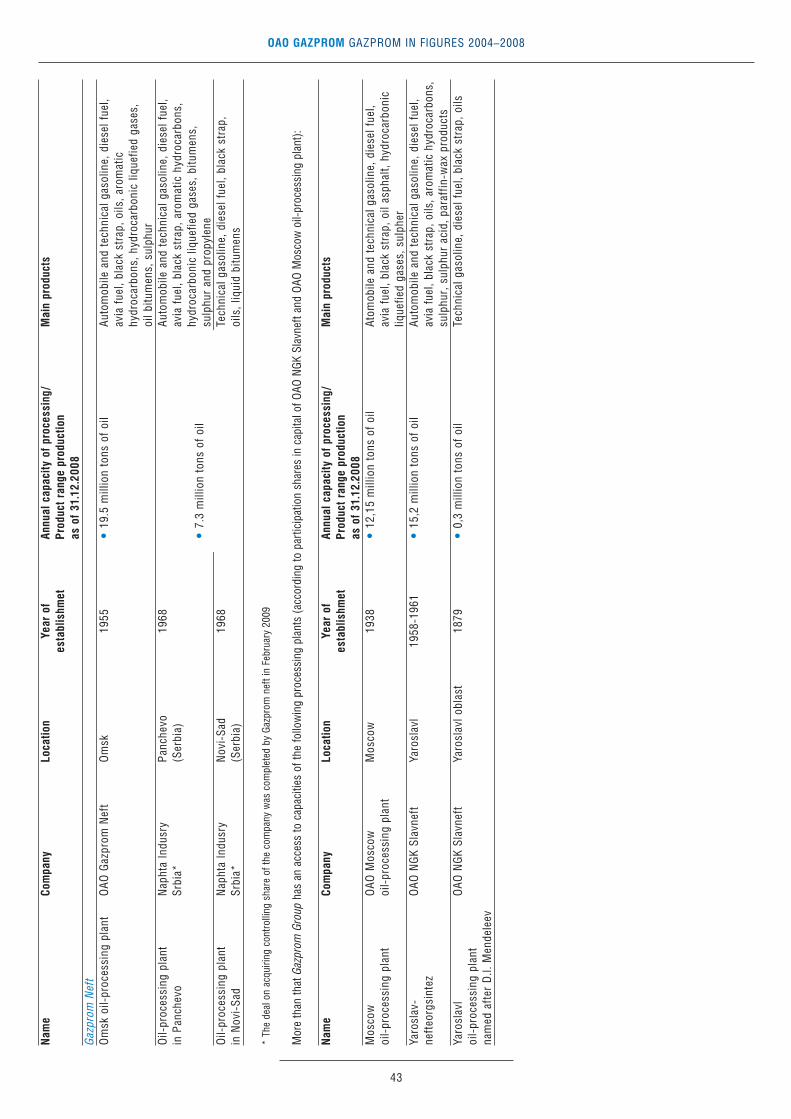
OAO GAZPROM GAZPROM IN FIGURES 2004–2008
43
Nam
e Co
mpa
nyLo
catio
nYe
ar o
fAn
nual
cap
acity
of
proc
essi
ng/
Mai
n pr
oduc
tses
tabl
ishm
et
Pro
duct
ran
ge p
rodu
ctio
nas
of
31.1
2.20
08G
azpr
om N
eft
Om
sk o
il�pr
oces
sing
pla
ntO
AO G
azpr
om N
eft
Om
sk19
5519
.5 m
illio
n to
ns o
f oi
lAu
tom
obile
and
tec
hnic
al g
asol
ine,
die
sel f
uel,
avia
fue
l, bl
ack
stra
p, o
ils, a
rom
atic
hy
droc
arbo
ns, h
ydro
carb
onic
liqu
efie
d ga
ses,
oil b
itum
ens,
sul
phur
Oil�
proc
essi
ng p
lant
N
apht
a In
dusr
y Pa
nche
vo19
68
Auto
mob
ile a
nd t
echn
ical
gas
olin
e, d
iese
l fue
l,in
Pan
chev
oSr
bia*
(Ser
bia)
avia
fue
l, bl
ack
stra
p, a
rom
atic
hyd
roca
rbon
s,
hydr
ocar
boni
c liq
uefie
d ga
ses,
bitu
men
s,
sulp
hur
and
prop
ylen
eO
il�pr
oces
sing
pla
nt
Nap
hta
Indu
sry
Nov
i�Sa
d 19
68
Tech
nica
l gas
olin
e, d
iese
l fue
l, bl
ack
stra
p,
in N
ovi�
Sad
Srbi
a*(S
erbi
a)oi
ls, l
iqui
d bi
tum
ens
* Th
e de
al o
n ac
quiri
ng c
ontro
lling
sha
re o
f the
com
pany
was
com
plet
ed b
y Ga
zpro
m n
eft i
n Fe
brua
ry 2
009
Mor
e th
an th
at G
azpr
om G
roup
has
an a
cces
s to
cap
aciti
es o
f the
follo
win
g pr
oces
sing
pla
nts
(acc
ordi
ng to
par
ticip
atio
n sh
ares
in c
apita
l of O
AO N
GK S
lavn
eft a
nd O
AO M
osco
w o
il�pr
oces
sing
pla
nt):
Nam
e Co
mpa
nyLo
catio
nYe
ar o
fAn
nual
cap
acity
of
proc
essi
ng/
Mai
n pr
oduc
tses
tabl
ishm
et
Pro
duct
ran
ge p
rodu
ctio
nas
of
31.1
2.20
08M
osco
w
ОАО
Mos
cow
M
osco
w
1938
12,1
5 m
illio
n to
ns o
f oi
lAt
omob
ile a
nd t
echn
ical
gas
olin
e, d
iese
l fue
l, oi
l�pr
oces
sing
pla
ntoi
l�pr
oces
sing
pla
ntav
ia f
uel,
blac
k st
rap,
oil
asph
alt,
hydr
ocar
boni
c liq
uefie
d ga
ses,
sul
pher
Yaro
slav
�О
АО N
GK
Slav
neft
Yaro
slav
l19
58�1
961
15,2
mill
ion
tons
of
oil
Auto
mob
ile a
nd t
echn
ical
gas
olin
e, d
iese
l fue
l,ne
fteo
rgsi
ntez
av
ia fu
el, b
lack
str
ap, o
ils, a
rom
atic
hyd
roca
rbon
s,
sulp
hur,
sul
phur
aci
d, p
araf
fin�w
ax p
rodu
cts
Yaro
slav
l О
АО N
GK
Slav
neft
Ya
rosl
avl o
blas
t18
79
0,3
mill
ion
tons
of
oil
Tech
nica
l gas
olin
e, d
iese
l fue
l, bl
ack
stra
p, o
ilsoi
l�pr
oces
sing
pla
nt
nam
ed a
fter
D.I.
Men
dele
ev
7.3
mill
ion
tons
of
oil

OAO GAZPROM GAZPROM IN FIGURES 2004–2008
44
MARKETING
Domestic Market
GAZPROM GROUP GAS SALES TO RUSSIAN CONSUMERS, BCM
GAZPROM GAS SALES STRUCTURE IN RUSSIA BY GROUPS OF CONSUMERS IN 2008
Natural gas produced by Gazprom Group’s companies is primarily sold to Russian consumers at state�regulatedprices. The regulated wholesale gas price change parameters are defined by the Government of the Russian Federation.Specific regulated wholesale prices, differentiated by consumer type and by price bands which take into accountthe distance from the gas production regions to the consumer, are approved by the Federal Tariff Service(Russian FTS). Retail gas prices for household consumers are fixed by local administration of subjects of theRussian Federation.Prior to January 1, 2005, wholesale gas prices were differentiated by seven price bands. As a result of furtherimprovement of territorial price differentiation, aimed at price covering production and transportation costs, thenumber of price bands was increased. As of 2007, Russian FTS fixed wholesale gas prices using the saidparameters for 13 price bands with differentiation by categories of consumers.
300
250
200
305.7 307.0
316.3
307.0
287.0
2004 2005 2006 2007 2008
Power generation – 32.5
Metallurgy – 6.5
Agrochemistry – 7.0
Cement industry – 1.6
Household consumers – 16.8
Utility sector – 10.7
Other – 24.9
�1.1 % +0.4 % +3.0 % �2.9 % �6.5 %

OAO GAZPROM GAZPROM IN FIGURES 2004–2008
45
AVERAGE WHOLESALE GAS PRICES FOR CONSUMERS IN THE RUSSIAN FEDERATION (EXCEPT GAS SOLD TO HOUSEHOLD CONSUMERS), ROUBLES PER 1,000 CUBIC METERS (NET OF VAT)
Price band from 01.01.2004 from 01.01.2005 from 01.01.2006 from 01.01.20070 526
I 634 619 677 779
II 739 745 815 937
III 828 879 960 1,104
IV 871 985 1,080 1,242
IVа 923 1,041 1,198
V 912 1,005 1,104 1,270
VI 937 1,033 1,136 1,306
VII 1,040 1,148 1,320
VIII 1,088 1,202 1,382
IX 1,119 1,241 1,427
X 1,154 1,284 1,477
Xа 1,304* 1,673
XI 1,160 1,295 1,489
Gas transferred through
Barnaul – Biysk – Gorno�Altaisk gas pipeline
(section 87th km – Gorno�Altaisk) 1,673
Gas transferred by Nyuksenitsa�Arkhangelsk
gas pipeline (section 147th km – Mirny) 2,360
* Effective from August 1, 2006, the price was RR 1,455 per 1,000 cubic meters
AVERAGE WHOLESALE GAS PRICES FOR HOUSEHOLD CONSUMERS IN THE RUSSIAN FEDERATION, ROUBLES/1,000 CUBIC METERS (NET OF VAT)
Price band from 01.01.2004 from 01.01.2005 from 01.04.2005 from 01.01.2006 from 01.01.2007
0 464
I 492 579 619 677 779
II 536 616 660 726 835
III 576 671 720 794 913
IV 588 720 773 857 986
IVа 678 730 833 958
V 600 725 778 863 992
VI 610 730 783 870 1,001
VII 736 792 883 1,015
VIII 744 802 896 1,030
IX 752 810 907 1,043
X 764 822 920 1,058
Xа 920** 1,196
XI 728.5* 789.1* 920 1,058
Gas transferred through
Barnaul – Biysk – Gorno�Altaisk gas pipeline
(section 87th km – Gorno�Altaisk) 1,427
Gas transferred by Nyuksenitsa�Arkhangelsk
gas pipeline (section 147th km – Mirny) 1,836
* Adjusted for the prices for the settlements that had suffered from the flood in 2002
** Effective from August 1, 2006, the price was RR 1,040 per 1,000 cubic meters
The ultimate regulated wholesale gas price includes the following regulated components: wholesale gas price,a transportation tariff and a marketing and sales services fee. Gazprom receives its natural gas sale revenuesat the wholesale regulated price. The regulated transportation tariff is paid to the gas distribution companies,which transport gas through their networks to the consumers, and the marketing and sales services fees arepaid to the regional gas sales companies. The wholesale gas price for household consumers is 24 % below thewholesale gas price level for other consumers.In certain cases, the retail prices for household consumers may also include gas network maintenance andrepair fee charged by utility or municipal organizations. Gas pricing for household consumers have some unique

OAO GAZPROM GAZPROM IN FIGURES 2004–2008
46
features: the existence of privileged categories of consumers; in the absence of metering devices at individualapartments gas fees are generally calculated in accordance with the established norms.Effective 2008, new differentiation of wholesale gas prices was introduced that envisages 67 price bands.Average wholesale gas price for industrial consumers in 2008 was RR1,699.2 per 1,000 cubic meters (net of VAT)and gas price for household consumers was RR1,288.8 per 1,000 cubic meters.From 2007 for the purpose of informing the natural gas market participants about the principles underlying thecalculation of wholesale gas prices that are to be used after 2011 Russian FTS began to calculate indicative gasprices, which are calculated using a formula intended to ensure the equal profitability from gas sales in theexternal and domestic market. The indicative prices calculated for 2007–2008 were on average 2.2–2.9 timeshigher than average regulated prices.
REGULATED VS. INDICATIVE WHOLESALE GAS PRICES
Indicator 2007 20083rd quarter 4th quarter 1st quarter 2nd quarter 3rd quarter 4th quarter
Average wholesale gas price, calculated
by equal profitability formula,
Roubles per 1,000 cubic meters 3,982 3,878 3,758 3,837 4,281 4,844
Average regulated wholesale gas price,
Roubles per 1,000 cubic meters 1,355 1,357 1,699 1,695 1,697 1,697
Equal profitability price /
regulated price ratio, x 2.94 2.86 2.21 2.26 2.52 2.85
External Market
GAZPROM’S GAS SALES ABROAD, BCM
GAZPROM’S GAS SALES IN EXTERNAL MARKETS
2004 2005 2006 2007 2008
Volume, Share of Volume, Share of Volume, Share of Volume, Share of Volume, Share of
bcm total, % bcm total, % bcm total, % bcm total, % bcm total, %
CIS and Baltic States 65.7 30.0 76.6 32.9 101.0 38.5 100.9 37.5 96.5 34.4
Far abroad 153.2 70.0 156.1 67.1 161.5 61.5 168.5 62.5 184.4 65.6
300
250
200
150
100
50
0
218.9
+18.5 % +6.3 % +12.8 % +2.6 % +4.3 %
232.7
262.5 269.4280.9
2004 2005 2006 2007 2008

OAO GAZPROM GAZPROM IN FIGURES 2004–2008
47
VOLUME AND STRUCTURE OF OAO GAZPROM’S GAS SALES FAR ABROAD IN 2008, BCM AND %
VOLUME AND STRUCTURE OF GAZPROM’S GAS SALES IN CIS AND BALTIC STATES IN 2008, BCM AND %
Germany – 20.6 %
Turkey – 12.9 %
Italy – 12.1 %
Great Britain – 11.3 %
France – 5.9 %
Hungary – 4.8 %
Czech Republic – 4.3 %
Poland – 4.3 %
Netherlands – 3.6 %
Others – 20.2 %
Ukraine – 58.2 %
Belorussia – 21.9 %
Kazakstan – 9.9 %
Lithiania – 2.9 %
Others – 7.1 %
38.0
23.8
22.4
56.221.1
9.6
2.8
6.8
20.9
10.9
8.9
8.0
6.7
36.9
7.9
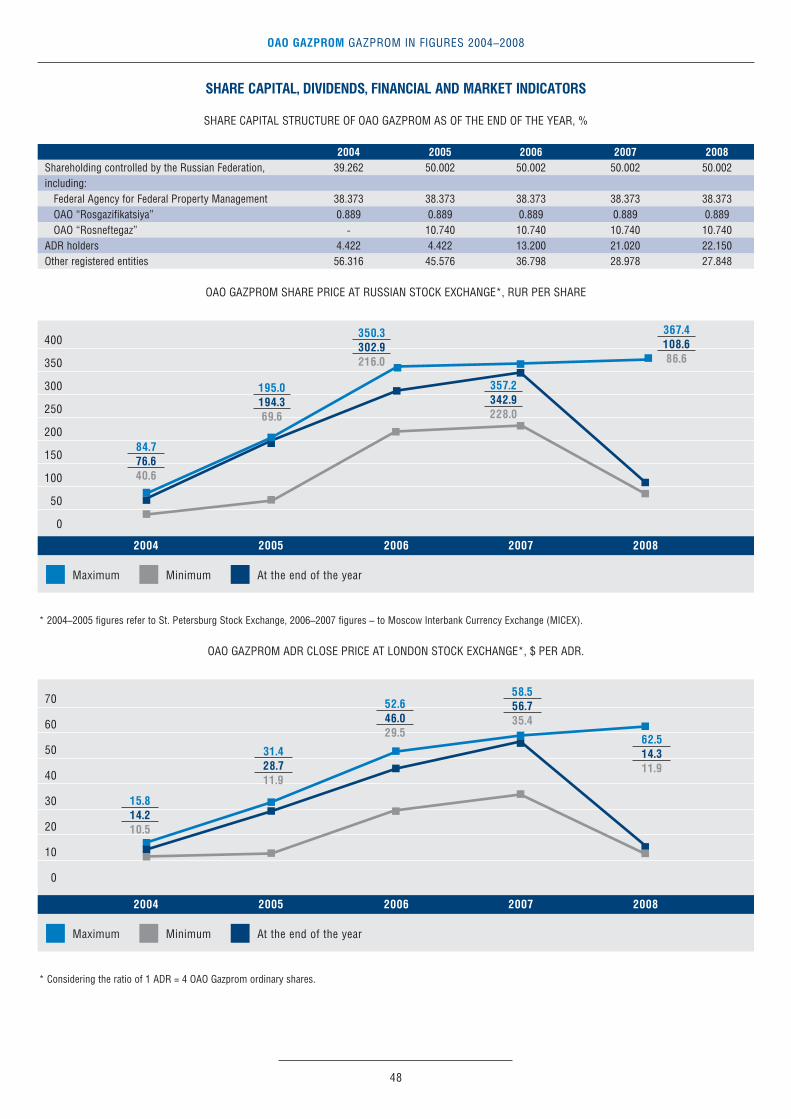
OAO GAZPROM GAZPROM IN FIGURES 2004–2008
48
SHARE CAPITAL, DIVIDENDS, FINANCIAL AND MARKET INDICATORS
SHARE CAPITAL STRUCTURE OF OAO GAZPROM AS OF THE END OF THE YEAR, %
2004 2005 2006 2007 2008Shareholding controlled by the Russian Federation, 39.262 50.002 50.002 50.002 50.002including:
Federal Agency for Federal Property Management 38.373 38.373 38.373 38.373 38.373OAO “Rosgazifikatsiya” 0.889 0.889 0.889 0.889 0.889OAO “Rosneftegaz” � 10.740 10.740 10.740 10.740
ADR holders 4.422 4.422 13.200 21.020 22.150Other registered entities 56.316 45.576 36.798 28.978 27.848
OAO GAZPROM SHARE PRICE AT RUSSIAN STOCK EXCHANGE*, RUR PER SHARE
* 2004–2005 figures refer to St. Petersburg Stock Exchange, 2006–2007 figures – to Moscow Interbank Currency Exchange (MICEX).
OAO GAZPROM ADR CLOSE PRICE AT LONDON STOCK EXCHANGE*, $ PER ADR.
* Considering the ratio of 1 ADR = 4 OAO Gazprom ordinary shares.
Maximum Minimum At the end of the year
400
350
300
250
200
150
100
50
0
2004 2005 2006 2007 2008
84.776.640.6
195.0194.369.6
350.3302.9216.0
357.2342.9228.0
367.4108.686.6
Maximum Minimum At the end of the year
70
60
50
40
30
20
10
0
2004 2005 2006 2007 2008
15.814.210.5
31.428.711.9
52.646.029.5
58.556.735.4
62.514.311.9

OAO GAZPROM GAZPROM IN FIGURES 2004–2008
49
OAO GAZPROM AVERAGE MARKET CAPITALIZATION , BLN.$
* The average market capitalization of OAO Gazprom for 2006 and previous years was calculated in accordance with OAO Gazprom Dividend policy as the sum of the arithmetic
average of the daily market capitalization of the internal market and the arithmetic average of the daily market capitalization of the external market. Due to the liberalization of
OAO Gazprom share market and the leveling of prices for OAO Gazprom shares and ADRs starting from 2007 the figure is determined as the average annual close price of shares
at MICEX at the average annual exchange rate of the Central Bank of Russia multiplied by the total number of OAO Gazprom shares issued.
DIVIDEND GROWTH, RUR PER SHARE
300
250
200
150
100
50
0
54.2
+101 %+68 %
+162.6 % +8.2 %�6.9 %
91.1
239.3259.0
241.1
3.0
2.5
2.0
1.5
1.0
0.5
0
1.19
+72.5 %+26.1 %
+69.3 % +4.7 %
�86.5 %
1.5
2.54 2.66
0.36
2004 2005 2006 2007 2008 (recommended)
2004 2005 2006 2007 2008

OAO GAZPROM GAZPROM IN FIGURES 2004–2008
50
OAO GAZPROM FINANCIAL AND MARKET RATIOS
2004 2005 2006 2007 2008Return on equity, %* 8.70 6.08 9.40 7.73 3.62Return on assets, %* 6.41 4.79 7.55 6.08 2.8Return on sales, %* 23.85 29.09 30.87 27.41 35.72Current liquidity ratio * 3.04 3.35 2.95 2.80 2.72Quick ratio * 2.52 2.67 2.35 2.34 2.26Equity/assets ratio * 0.74 0.79 0.80 0.79 0.77Debt to capital ratio, % 23.7 20.23 16.90 19.84 21.54P/E ratio(domestic OAO Gazprom share market) 11.29 22.65 20.83 22.51 14.86P/E ratio(external OAO Gazprom share market) 14.49 24.06 20.83 22.51 14.86Market capitalization, $ bln 54.24 91.13 239.33 259.0 241.1
* Calculated in accordance with the Regulation on information disclosure by securities issuers approved by Order of the Russian Federal Financial Market Service
№ 06�117/pz�n dated October 10, 2006.
BUSINESS PROPERTY
Number of Gazprom Group’s corporate immovable property items exceed 80 thousand, including 60 thousanditems that are owned by the head company OAO Gazprom. Corporate immovable property are located on morethan 700 thousand plots.Thus, since the initiation of a large scale work of OAO Gazprom property rights state registration the number ofproperty items increased by 25%. However the property rights state registration works were performed in 2008ahead of time and as of now OAO Gazprom property right are registered for 83.5% of all immovable propertyitems.The remaining items for the major part represent newly commissioned items, title to which is to be registeredgradually in line with the documents preparation; as well as property items commissioned prior to enactmentof Federal Law on Immovable property rights and transactions state registration, documents of title for whichrequire adaptation in accordance with the effective legislation (through judicial procedures if applicable).
OAO GAZPROM IMMOVABLE PROPERTY RIGHTS STATE REGISTRATION
* Share of registered items
In 2008 works for OAO Gazprom rights re�registration for land plots in accordance with the require�ments ofFederal Law on Land Code enactment continued. For the year the number of items, rights for land plots underwhich are registered in accordance with the requirements of the effective legislation, exceeded 20%.
60,000
50,000
40,000
30,000
20,000
10,000
0
11,279
20.9 %*
25,122
35,000
45,120
53,082
2004 2005 2006 2007 2008
64.8 %* 75.2 %* 83.5 %*46.5 %*

OAO GAZPROM GAZPROM IN FIGURES 2004–2008
51
ENERGY SAVING
In 2006 the implementation of OAO Gazprom energy saving program for the period from 2004 through 2006was completed. Gazprom’s total saving of fuel and energy resources amounted to 12.5 million tons of coalequivalent in the said period.In 2007 a new OAO Gazprom energy saving program for the period from 2007 through 2010 was approved. The total saving of the fuel and energy resources by Gazprom’s subsidiaries involved in the Program amountedto 2.8 million tons of coal equivalent in the reporting period (compared to the planned 2.4 million tons of coalequivalent).
FUEL AND ENERGY SAVING IN GAZPROM IN 2004�2008.,TCE THOUSANDS
Natural gas Power energy Heat energy
4,500
4,000
3,500
3,000
2,500
2,000
1,500
1,000
500
0
2004 2005 2006 2007 2008
39.3171.4
4,012.1
4,222.8 4,028.14,236.3
3,607.3
2,798.3
46.8148.0
3,833.3
33.195.2
4,108.0
27.388.4
3,491.6
29.381.5
2,687.5

OAO GAZPROM GAZPROM IN FIGURES 2004–2008
52
PERSONNEL
PERSONNEL STRUCTURE OF GAZPROM GROUP’S MAJOR GAS PRODUCTION, TRANSPORTATION, UNDERGROUND STORAGE AND PROCESSING SUBSIDIARIES IN 2004–2008
2004 2005 2006 2007 2008
Number of employees as of year�end, in thousands 251.8 247.1 232.2 222.0 221.3
including, %:
management 9.1 9.1 9.1 9.3 9.5
specialists 19.5 20.1 21.2 22.2 22.9
workers 66.9 66.3 65.0 63.1 63.4
other employees 4.5 4.5 4.7 5.4 4.2
EDUCATIONAL LEVEL OF EMPLOYEES OF GAZPROM GROUP’S MAJOR GAS PRODUCTION, TRANSPORTATION, UNDERGROUND STORAGE AND PROCESSING SUBSIDIARIES IN 2004–2008, %
2004 2005 2006 2007 2008
Management:higher and post�graduate 69.8 72.7 75.5 77.3 79.3specialized secondary 26.3 24.0 21.7 19.7 18.3
Specialists:higher and post�graduate 64.4 67.7 70.4 73.3 75.8specialized secondary 30.9 28.1 25.7 23.0 20.7
Workers:higher and post�graduate 8.6 9.7 10.8 12.1 12.7specialized secondary 23.6 24.5 24.9 26.0 25.9
AGE STRUCTURE OF EMPLOYEES OF GAZPROM GROUP’S MAJOR GAS PRODUCTION, TRANSPORTATION,UNDERGROUND STORAGE AND PROCESSING SUBSIDIARIES IN 2004–2008, %
2004 2005 2006 2007 2008
Under 30 17.7 17.1 16.9 16.8 16.730–40 years 26.7 26.5 26.8 27.0 27.140–50 years 36.4 36.1 35.7 34.0 32.8Over 50 19.2 20.3 20.6 22.2 23.4