
IMPROVING SECONDARY TASK EFFICIENCY AS AN INDIRECT MEANS TO ...

1876-6102 © 2015 Published by Elsevier Ltd. This is an open access article under the CC BY-NC-ND license (http://creativecommons.org/licenses/by-nc-nd/4.0/).Peer-review under responsibility of KES Internationaldoi: 10.1016/j.egypro.2015.12.180
Energy Procedia 83 ( 2015 ) 258 – 268
ScienceDirect
7th International Conference on Sustainability in Energy and Buildings
The energy efficiency management at urban scale by means of integrated modelling.
Amos Ronzinoa*, Anna Oselloa, Edoardo Pattia, Lorenzo Bottacciolia, Chiara Dannaa, Andrea Linguaa, Andrea Acquavivaa, Enrico Maciia, Michelangelo Grossob, Gianluca
Messinac, Gaetano Rasconàc aPolitecnico di Torino, corso Duca degli Abruzzi 24, Torino 10129. Italy
bST-Polito s.c.ar.l., corso Duca degli Abruzzi 24, Torino 10129, Italy cST-Polito s.c.ar.l., via Franco Gorgone 39/41, Catania 95121, Italy
Abstract
Innovative technologies such as ICTs (Information and Communications Technologies) are recognized as being a key player against climate change and the use of sensors and actuators can efficiently control the whole energy chain in the Smart Thermal Grids at district level. On the other side, advances on 3D modelling, visualization and interaction technologies enable user profiling and represent part of the holistic approach which aims at integrating renewable energy solutions in the existing building stock. To unlock the potentiality of these technologies, the case study selected for this research focuses on interoperability between Building Information Models (BIM), GIS (Geographic Information System) models and Energy Analysis Models (EAM) for designing Renewable Energy Strategies (RES) among the demonstrator. The objectives aim at making a whole series of data concerning the energy efficiency and reduction at district level usable for various stakeholders, by creating a District Information Model (DIM). The described system also integrates BIM and district level 3D models with real-time data from sensors to analyse and correlate buildings utilization and provide real-time energy-related behaviours. An important role is played by the energy simulation through the EAM for matching measured and simulated data and to assess the energy performance of buildings starting from a BIM model or shared data. With this purpose interoperability tests are carried out between the BIM models and quasi-steady energy analysis tools in order to optimize the calculation of the energy demand according to the Italian technical specification UNI TS 11300. Information about the roofs slope and their orientation from the GIS model are used to predict the use of renewable energy – solar thermal and PV – within the selected buildings (both public and private) of the demonstrator in Turin, Italy.
* Corresponding author. Tel.: +390110905335
E-mail address: [email protected]
Available online at www.sciencedirect.com
brought to you by COREView metadata, citation and similar papers at core.ac.uk
provided by Elsevier - Publisher Connector

Amos Ronzino et al. / Energy Procedia 83 ( 2015 ) 258 – 268 259
The expected results are a consistent reduction in both energy consumption and CO2 emissions by enabling a more efficient energy distribution policies, according to the real characteristics of district buildings as well as a more efficient utilization and maintenance of the energy distribution network, based on social behaviour and users attitudes and demand. In the future the project will allow open access with personal devices and A/R visualization of energy-related information to client applications for energy and cost-analysis, tariff planning and evaluation, failure identification and maintenance, energy information sharing in order to increase the user’s awareness in the field of energy consumption. © 2015 The Authors. Published by Elsevier Ltd. Peer-review under responsibility of KES International.
Keywords: BIM; District Information Model; interoperability; urban energy management; RES
1. Introduction
In the last years the European Commission has enhanced policies for developing strategies to promote ICTs (Information and Communications Technologies) for energy efficiency in buildings at urban level, asking the Member States to ensure minimum energy performance requirements of buildings in order to achieve cost optimal levels. Within the smart cities context, real-time data concerning energy consumption are needed at district level, considering both the building and people sub-levels. In this regard pervasive sensors and actuators can efficiently control the whole energy chain while advances on 3D modeling, visualization and interaction technologies enable user profiling and real-time feedback to promote energy efficient behaviours. Therefore data coming from such different sources and devices need to be merged into a common database for the energy management of the district. By using middleware technologies the different data can be processed and made accessible to different users.
In order to move forward the Smart City vision, ICT is recognized as a key player [1] to enhance energy optimization in cities [2]. At building level, monitoring and control solutions have been developed as well as user awareness policies to promote green behaviours [3]. Real-time information about environmental characteristics and energy consumption can be accessed from pervasive devices deployed in the building. At district level, information about district heating/cooling and power grid can be accessed as well by sensor networks. In this context, heterogeneous devices are involved for the monitoring and the management process of buildings and grids. Hence allowing the exchange of information between such different devices is an issue that can be overcome thanks to middleware technologies. Indeed, middleware technologies can help in enabling the interoperability across heterogeneous data-sources, either hardware or software, and in providing an abstract view of their functionalities. Once the interoperability is enabled, the information from the miscellaneous data-sources can be linked and merged into a common “smart digital archive” for the energy management of the district. In this scenario, different actors playing in the Smart City context can access this information or push new data. On top of that, ICT revolution in Building Information Modelling (BIM) [4] enables digital organization of building characteristics and parameters. Hence, making district energy production and consumption data available jointly with BIM information to client application and control policies would increase the energy efficiency at urban level. For instance, more performing policies can be developed taking advantages from building performance and characteristics. The adopted software infrastructure fosters to extend Near zero energy buildings strategies at district level, considering that Near zero energy districts are the next frontier in energy efficiency and sustainability.
The proposed methodology mainly aims at making the energy demand of buildings rational, which involves the optimization of load profiles and set-points. This is expected to determine a reduction in energy request of buildings and load shift. The positive impacts for producers are represented by the reduction of peak request (peak shaving) and, consequently, the possibility to connect new users to the energy distribution network even in saturated areas. The positive impacts for users are a reduction of the total energy demand and the possibility to shift part of the load in hours characterized by lower energy costs.
In the presented paper the DIMMER (District Information Modelling and Management for Energy Reduction) project’s architecture is shown, describing how the core – represented by the middleware infrastructure – is able to manage both real data from sensors and simulated data from numerical models. In particular, two energy models
© 2015 Published by Elsevier Ltd. This is an open access article under the CC BY-NC-ND license (http://creativecommons.org/licenses/by-nc-nd/4.0/).Peer-review under responsibility of KES International
260 Amos Ronzino et al. / Energy Procedia 83 ( 2015 ) 258 – 268
involved in the interoperability process are described at urban and building level: the GIS-integrated solar radiation calculation method and the EAM interoperability process with the BIM platform.
2. The DIMMER Software infrastructure
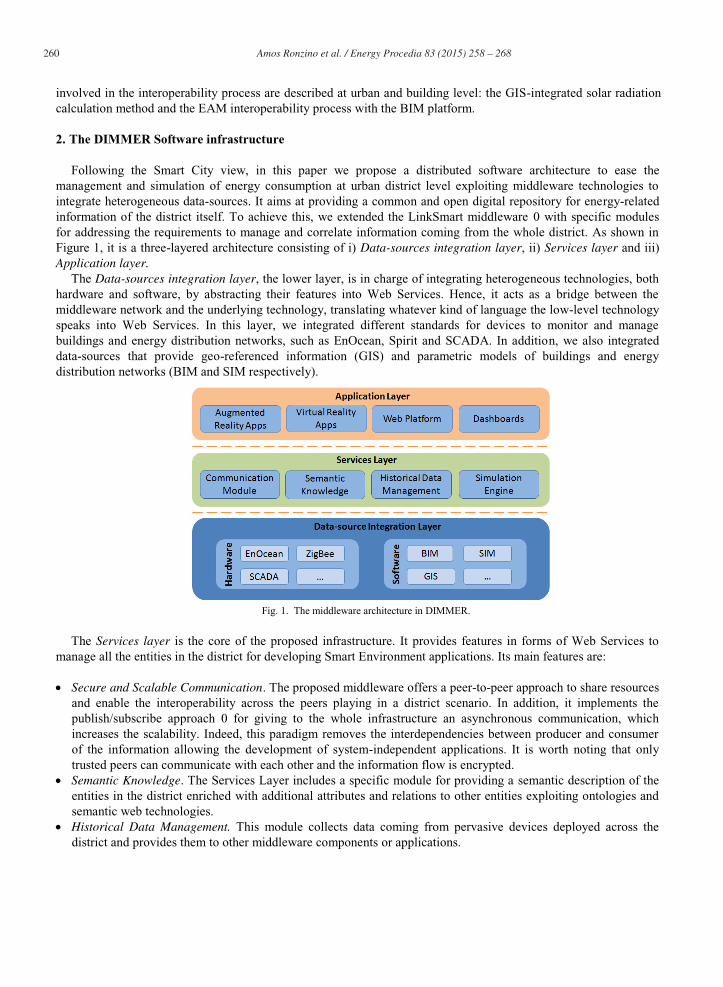
Following the Smart City view, in this paper we propose a distributed software architecture to ease the management and simulation of energy consumption at urban district level exploiting middleware technologies to integrate heterogeneous data-sources. It aims at providing a common and open digital repository for energy-related information of the district itself. To achieve this, we extended the LinkSmart middleware 0 with specific modules for addressing the requirements to manage and correlate information coming from the whole district. As shown in Figure 1, it is a three-layered architecture consisting of i) Data-sources integration layer, ii) Services layer and iii) Application layer.
The Data-sources integration layer, the lower layer, is in charge of integrating heterogeneous technologies, both hardware and software, by abstracting their features into Web Services. Hence, it acts as a bridge between the middleware network and the underlying technology, translating whatever kind of language the low-level technology speaks into Web Services. In this layer, we integrated different standards for devices to monitor and manage buildings and energy distribution networks, such as EnOcean, Spirit and SCADA. In addition, we also integrated data-sources that provide geo-referenced information (GIS) and parametric models of buildings and energy distribution networks (BIM and SIM respectively).
Fig. 1. The middleware architecture in DIMMER.
The Services layer is the core of the proposed infrastructure. It provides features in forms of Web Services to
manage all the entities in the district for developing Smart Environment applications. Its main features are:
Secure and Scalable Communication. The proposed middleware offers a peer-to-peer approach to share resources and enable the interoperability across the peers playing in a district scenario. In addition, it implements the publish/subscribe approach 0 for giving to the whole infrastructure an asynchronous communication, which increases the scalability. Indeed, this paradigm removes the interdependencies between producer and consumer of the information allowing the development of system-independent applications. It is worth noting that only trusted peers can communicate with each other and the information flow is encrypted.
Semantic Knowledge. The Services Layer includes a specific module for providing a semantic description of the entities in the district enriched with additional attributes and relations to other entities exploiting ontologies and semantic web technologies.
Historical Data Management. This module collects data coming from pervasive devices deployed across the district and provides them to other middleware components or applications.

Amos Ronzino et al. / Energy Procedia 83 ( 2015 ) 258 – 268 261
Simulation engine. It exploits data from other middleware components and from the Data-source integration layer for simulating energy optimization policies at district level. In addition, it implements features to estimate the energy production of renewables that might be deployed in the district.
Finally, the Application layer provides a set of tools, API and Web Services to develop applications for post-processing energy-related information of the district and increasing user-awareness exploiting for instances Augmented and Virtual reality or web platforms and dashboards.
3. Energy management at district level
3.1. Data collection system
“Smart” distribution systems, not limited to the electrical grid but also including, e.g., natural gas and remote heating, are based on the use of ICT to improve the efficiency, reliability, economics and sustainability of the production and distribution of energy and goods. Differently from traditional systems where there is a single-direction flow going from a central provider, through the network, to the users, today’s technologies superimpose a bidirectional information layer enabling data collection and interchange among the users and the provider. This ICT layer is based on two main ingredients, i.e., integrated communications, and sensing and measurement devices; more advanced applications may also include control systems, different kinds of interfaces and decision support.
The design and development of “smart” distribution systems and policies at district level require a precise characterization of the target buildings and districts, and the user behaviour. Considering, as an example, remote heating, this activity is based on thermal modeling of buildings, on the analysis of district heating network and consumption data and on the direct observation of environmental parameters such as temperature and humidity. The gathered information is useful to validate the model predictions and to define real-time monitoring and control systems, so as to determine the best strategies for both single users and the community.
At the bottom end of the ICT structure, the basic components of “smart” sensing (and/or actuating) systems are microcontrollers (low-power, high-performance), communication devices (reliable and energy-efficient radio transceivers, e.g., Bluetooth Low Energy or sub-GHz), integrated low-cost sensors and actuators (electronic or based on Micro Electromechanical – MEMS – technology) and energy storage and/or harvesting devices. The monitoring devices, sensing both distribution network and environmental parameters, are useful at district level when they are sufficiently pervasive in the property units, so that they can help developing a complete and clear picture of the technological, economic and social behaviour of the targeted distribution system. This in turn generates a potentially large and continuous flow of data. These data have to be transferred and elaborated by suitably sized network links and data centers, which then can make them available to distribution managers, policy makers and customers.
In the case of remote heating, for each building or property unit, the network manager can provide information about inward and outward water flow and temperature, exploiting sensors available in heat exchangers. For collecting local environmental information, low-power, self-configurable wireless mesh sensor networks can be used. Fig. 2.a shows the block diagram of a battery-operated sensor node able to sense data and transmit them to a cloud-connected gateway. In this case, the node components were selected for their reliable performance and low power consumption: a processing unit based on ultra-low power ARM Cortex-M3 core, a sub-GHz wireless transceiver, and a MEMS environmental sensing module (HTS221 from STMicroelectronics [7]) The nodes run on the Contiki OS, an open source, highly portable, networked, multi-tasking operating system for memory- and energy-constrained systems. Fig. 2.b presents a comprehensive view of the developed cloud-connected mesh network.Similar node and network architectures can be used in different “smart” distribution systems, with the modification of hardware parts and software applications, according to the specific requirements of each use case scenario.

262 Amos Ronzino et al. / Energy Procedia 83 ( 2015 ) 258 – 268
Sensing
Temp/humHTS221
Processing
STM32L
Comm.
RF868MHz
Energy storage
AA/AAA battery
a) b)
Internet
Fig. 2. Block diagram of a sensor node (a) and the developed mesh network (b)
3.2. Renewable energy systems
The integration of renewable sources in the urban contest is becoming crucial in the development of smart cities in particular the usage of solar radiation. GIS presents an important tool for complex processing of spatial information in urban context. Traditionally GIS have been used to perform environmental analysis using 3D surfaces. Since the recent arising of the interest in developing energy policies and exploiting renewable energies in the cities, similar systems can be used to run analysis at the service of these aims. Estimation of solar potential requires sophisticated modelling tools and spatial data representing the complexity of urban environment. Understanding the rooftops solar potential is crucial for planning the development of renewable energy sources such as PV and solar thermal and for formulating financing scheme and new policies. Different methodologies have been developed to evaluate the solar potential of cities such as the use of statistical information on buildings and population [8], image analysis [9], 3D reconstruction from LiDAR point clouds [10]. The use of GIS tools for the mapping of solar potential is consolidated [11], as demonstrated by the solar cadasters of some cities (for example New York, Boston, Bolzano, Morgex) available on the internet. The actual available services are limited in the level of detail in the rooftop modelling, in the extraction of the features and in the energetic analysis.
The data processing step is divided in two parts: the realization of three-dimensional models and a second step of analysis taking in account the real morphology of the buildings and the weather conditions.
The solar radiation received by the surfaces is strongly influenced by their size, slope and orientation. An accurate DSM (Digital Surface Model) of the area is needed in order to perform correct analysis of this features. For this reason the first step consists in the generation of the 3D model. For this aim aerial images with their external and internal orientation parameters, were processed using photogrammetry techniques and Structure from Motion software. The best results in city modeling are achievable using the traditional photogrammetry techniques, which is a manual stereoscopic plotting. This elaboration is time consuming and requires continuous human interaction. In particular, it is possible to obtain an accurate 3D map in Z-Map software and convert it, using a homemade software DDSMtoDXF, in a Dense Digital Surface Model and in a dense Point Cloud. Through the SfM software tools, the aerial images are processed automatically. In this case, the images have been processed to test the method, using two different tools: the commercial low-cost software Agisoft PhotoScan and the open source suite Apero – MicMac [12]. In both cases, the aerial images and their external and internal orientation parameters have been used in order to orient the images, to generate the point cloud, to reconstruct the dense digital surface model and finally the orthophoto. The batch processing methods require a few hours to generate the final results. The results obtained with automatic photogrammetry techniques present some noisy areas in correspondence to shadowed zones and dark roofs. Further investigation of the integration of photogrammetry techniques with LiDAR information will be conducted in order to achieve a more reliable DDSM [13].

Amos Ronzino et al. / Energy Procedia 83 ( 2015 ) 258 – 268 263
Fig. 3. 3D point cloud – DSM – Ortophoto (generated with MicMac)
From the detailed digital model of the urban land scape is possible to extract information on the aspect and the
slope of the rooftops. The algorithm used for the extraction of this information is r.slope.aspect of the open source software GRASS GIS. The data extracted from the manual restitution DSM are less noisy with respect to automatic DSM in particular in flats roofs. With the slope, orientation and elevation maps is possible to calculate the solar radiation map with the command r.sun in GRASS GIS [14]. This command perform the simulation of all the components of global radiation for a given day or hour of the year in clear sky condition considering Linke turbidity. The test conducted on the manual and automatic DSM prove the reliability of the tool with respect to UNI 10349 [15] for the city of Turin for clear-sly condition as shown in Fig 4. The selected days of the test correspond to the equinox and solstice days. Further integration in the analysis of the historical meteorological data will be used in order to assess a real sky irradiation of the rooftops. From the real sky irradiation model and the extraction of real available surface an energetic analysis of the production of PV and Solar Thermal systems will be performed at the district level. The analysis will be conducted with a high level of detail in terms of geometrical features and variation of solar radiation.
Fig. 4. Solar radiation with manual DSM and MicMac DSM (left) and Results comparison (right)
The produced information will be integrated into the DIMMER infrastructure with a Web based GIS. GIS will permit public authorities and private users to interrogate the map, which will give information on the available surface, geometrical features and possible solar production of each rooftop in the district. The information produced in the data processing (clear sky irradiation map) will be stored inside a specific database (Processedmap-DB) like
264 Amos Ronzino et al. / Energy Procedia 83 ( 2015 ) 258 – 268
the weather information (weather-DB) such as irradiation and temperature. The Web GIS application will communicate through the middleware with a simulator that will calculate the real sky condition and will produce an energetic and economic analysis. The simulator trough the middleware will receive as input the information of clear sky irradiation and available surface from the Processedmap-DB and will calculate the real sky radiation using the meteorological data acquired from the weather-DB.
4. BIM and interoperability
At building level, BIM has received much attention in recent years due to its possibility of developing a new methodology of design, construction and facility management based on information exchange. This process is achieved through the interoperability among software that is defined as “the need to pass data between applications, and for multiple applications to jointly contribute to the work at hand” [16]. In this way a single building model can be used to perform all the simulations needed for its design and operation like lighting and thermal analysis, without the necessity to remodel it in any applications. On the other hand, this process is still not easy on account of the shortage of complete technical standards.
Detailed technical standards are required to unambiguously define the requirements of specific information exchanges as users of the exchange standards will do so with various types of software. At present, data exchanges between two applications are typically carried out in four ways:
direct; proprietary links between specific BIM tools; proprietary file exchange formats, primarily dealing with geometry; public product data model exchange formats like IFC (Industry Foundation Class), or XML – based exchange
format.
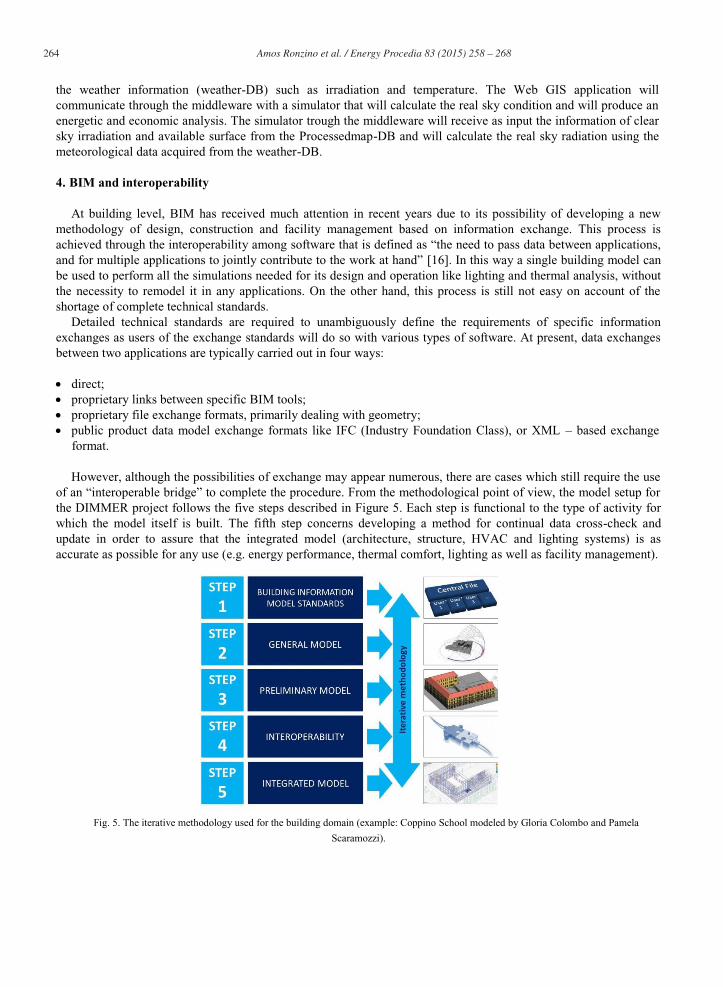
However, although the possibilities of exchange may appear numerous, there are cases which still require the use of an “interoperable bridge” to complete the procedure. From the methodological point of view, the model setup for the DIMMER project follows the five steps described in Figure 5. Each step is functional to the type of activity for which the model itself is built. The fifth step concerns developing a method for continual data cross-check and update in order to assure that the integrated model (architecture, structure, HVAC and lighting systems) is as accurate as possible for any use (e.g. energy performance, thermal comfort, lighting as well as facility management).
Fig. 5. The iterative methodology used for the building domain (example: Coppino School modeled by Gloria Colombo and Pamela
Scaramozzi).
Amos Ronzino et al. / Energy Procedia 83 ( 2015 ) 258 – 268 265
It is obvious that the steps described are dependent on each other and the models must be continuously revised in connection with subsequent in-depth studies.
4.1. BIM-EAM interoperability
With regard to the building domain, during the renovation or the energy refurbishment phase all the geometrical and dimensional data related to materials and technological components must be accessible in order to evaluate the different performances of the construction, such as the energy one. The actors of the design and construction teams in the various sectors – architecture, structures, MEP (Mechanical, Electrical and Plumbing), work progress, calculations of quantities, energy – traditionally develop their own specific models separately and then integrate them into a single platform [17]. The basic premise for a different methodology compared to the described one is based on a multidisciplinary collaboration during the life cycle of the building, in order to extract, insert or develop data within the information process related to the different phases [18]. Because each instrument BIM has its own structure for the management of the requested data, this necessary cooperation cannot exist without the availability of specific formats of digital data, represented for example by IFC and gbXML.
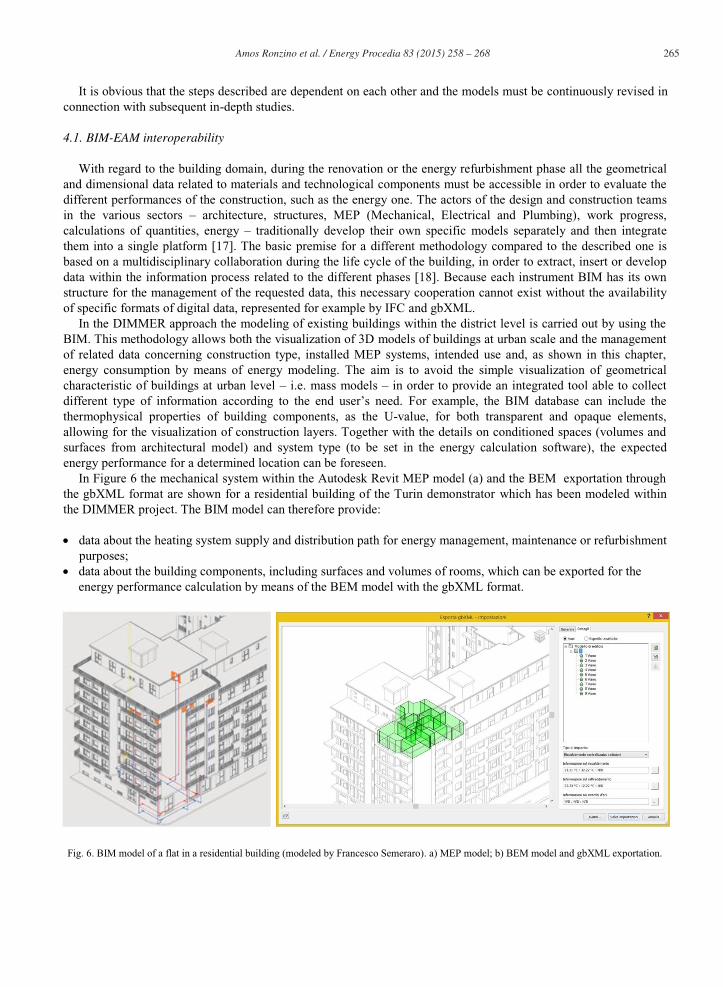
In the DIMMER approach the modeling of existing buildings within the district level is carried out by using the BIM. This methodology allows both the visualization of 3D models of buildings at urban scale and the management of related data concerning construction type, installed MEP systems, intended use and, as shown in this chapter, energy consumption by means of energy modeling. The aim is to avoid the simple visualization of geometrical characteristic of buildings at urban level – i.e. mass models – in order to provide an integrated tool able to collect different type of information according to the end user’s need. For example, the BIM database can include the thermophysical properties of building components, as the U-value, for both transparent and opaque elements, allowing for the visualization of construction layers. Together with the details on conditioned spaces (volumes and surfaces from architectural model) and system type (to be set in the energy calculation software), the expected energy performance for a determined location can be foreseen.
In Figure 6 the mechanical system within the Autodesk Revit MEP model (a) and the BEM exportation through the gbXML format are shown for a residential building of the Turin demonstrator which has been modeled within the DIMMER project. The BIM model can therefore provide:
data about the heating system supply and distribution path for energy management, maintenance or refurbishment purposes;
data about the building components, including surfaces and volumes of rooms, which can be exported for the energy performance calculation by means of the BEM model with the gbXML format.
Fig. 6. BIM model of a flat in a residential building (modeled by Francesco Semeraro). a) MEP model; b) BEM model and gbXML exportation.

266 Amos Ronzino et al. / Energy Procedia 83 ( 2015 ) 258 – 268
The EAM (Energy Analysis Model) has the aim to define the energy needs of a building or a district. The model
should include the analysis of energy needed for the common services and needs of the single users. The need of the single user should be further ranked in: energy needed for heating and cooling, for Domestic Hot Water (DHW), lighting and for different appliances. There are a number of available tools to provide an EAM. The tools differ in many ways: in their thermodynamic models, their graphical user interfaces, their purpose of use and their ability to exchange data with other software. Once the adequate simulation tool is identified, the model has to be developed. Simulation models are approximate imitations of real-world systems that necessarily introduce some simplifications and thus some behavioral differences. Simulation is used to verify that the model accurately represents the real system with respect to the metrics representing the research goal. Validation is thus performed in parallel with the calibration of the model, which usually implies an iterative, step-by-step process aiming at tuning its behaviour.
The EAM generated as a result of the importing process can rely on two different categories of software, depending on the aim of the energy analysis and therefore on the calculation method:
simplified method, for energy performance calculation in quasi-steady regime (i.e. for energy certificates, national standards, energy audit, etc.);
detailed method, for energy performance calculation in transient regime.
Since the demonstrator is composed by few buildings, representative of the urban building stock, the simulated need to be validated through the measured data from sensors – indoor/outdoor temperatures, heat exchanger in the district heating substation, etc. (see 3.1) – in order to match real and calculated data for a better prediction of the energy consumption, which will be extrapolated to the wider district. For this purpose an interoperability test between Autodesk Revit and both the simplified (Edilclima EC770) and the detailed method (DesignBuilder) has been carried out in order to assess the reliability of the process, as shown in Figure 7.
The simulation results on energy consumption, as well as the evaluation of the energy production from renewable sources (see 3.2), are managed by the middleware infrastructure to provide information about the actual situation of the buildings performance at district level, identifying the most energy-consuming urban areas. Moreover, these data will be used to evaluate refurbishment scenarios by changing the construction parameters within the BIM and gathering information on the cost of the intervention (involved surfaces, components, etc.).
Fig. 7. The interoperability test carried out between Autodesk Revit and the energy calculation software.
a) Edilclima EC770; b) DesignBuilder.
Amos Ronzino et al. / Energy Procedia 83 ( 2015 ) 258 – 268 267
5. Conclusions
Since today a general need to develop strategies for sustainable energy management in future smart cities is required, building and district data quality, availability and access must be increased. In order to support the management of data from different and independent sources such as district heating, smart sensing, building energy models and renewable energy systems, a middlewere technology has been provided in the DIMMER approach for existing buildings. Since city district data can influence the choice of supply systems, energy sources, resulting energy cost and primary energy demand, this methodology allows to create more efficient local energy management scenarios.
Within this research activity low-power, self-configurable wireless mesh sensor networks have been developed to collect local environmental information, implementing smart sensing strategies. Among the different data sources, those deriving from BIM enable the 3D visualization of buildings, the management of the related information and provide details for the energy modeling phase. Currently the selected buildings of the Turin demonstrator have been modeled through the BIM technology, also performing interoperability tests towards Energy Analysis Models (Edilclima EC700, DesignBuilder). Anyway, at the current state of the art interoperability needs to be improved and based more on common standard for both data hierarchy/contents and format of data exchange. Since the rooftops solar potential is crucial for planning the development of renewable energy sources, such as PV and solar thermal, and for formulating financing scheme and new policies, a methodology for calculating the solar radiation map by retrieving data on the slope, orientation and elevation maps of rooftops has been assessed.
Future work will integrate BIM and GIS data querying and visualization for different users (i.e. stakeholders, energy managers and citizen), implementing the middlewere data collection from all the sources. A decision support system through a web-based platform for interactive and cooperative development of energy management scenarios in city districts for different users – both private and public – will be made available at the end of the DIMMER project. In the final stages virtual and augmented reality will be implemented too, playing a key role for the data visualization by using devices like tablets and smartphones.
Acknowledgment
This research is funded by EU FP7 SMARTCITIES 2013 District Information Modelling and Management for Energy Reduction - DIMMER.
References
[1] Jin J, Gubbi J, Marusic S, Palaniswami M. An Information Framework for Creating a Smart City Through Internet of Things. In: IEEE Internet of Things Journal; 2014. 1.2 112-121. [2] Zanella A, Bui N, Castellani A, Vangelista L, Zorxi M. Internet of Things for Smart Cities. In: IEEE Internet of Things Journal; 2014. [3] Patti E, Acquaviva A, Jahn M, Pramudianto F, Tomasi R, Rabourdin D, Virgone J, Macii E. Event-Driven User-Centric Middleware for Energy Efficient Buildings and Public Spaces. In: IEEE Systems Journal; 2014. 99:1-10. [4] Garagnani S, Cinti S, Luciani S, Mingucci R. Building Information Modelling: digital technology serving architectural design. In: Disegnarecon; 2011. vol. 4. [5] LinkSmart middleware [Online]. Available: https://linksmart.eu/redmine; 2015. [6] Eugster PT, Felber PA, Guerraoui R, Kermarrec AM. The many faces of publish/subscribe. ACM CSUR; 2013. [7] STMicroelectronics, HTS221 Capacitive digital sensor for relative humidity and temperature, http://www.st.com/web/en/catalog/sense_power/FM89/SC1718/PF260067 [8] Wiginton, L. K., H. T. Nguyen, and Joshua M. Pearce. Quantifying rooftop solar photovoltaic potential for regional renewable energy policy. Computers, Environment and Urban Systems; 2010. 34.4 345-357. [9] Bergamasco L, Asinari P. Scalable methodology for the photovoltaic solar energy potential assessment based on available roof surface area: further improvements by ortho-image analysis and application to Turin (Italy). Solar Energy; 2011. 85.11 2741-2756. [10] Brito MC, Gomes N, Santos T, Tenedòrio JA. Photovoltaic potential in a Lisbon suburb using LiDAR data. Solar Energy; 2012. 86.1 283-288. [11 Nex F, Remondino F, Agugiaro G, De Flippi R, Poletti M, Furlanello C, Menegon S, Dallago G, Fontanari S. 3D Solarweb: A solar cadaster in the Italian Alpine landscape. ISPRS-International Archives of the Photogrammetry, Remote Sensing and Spatial Information Sciences; 2013. 1.2 173-178. [12] Pierrot Deseilligny M, Clery I. Apero, an open source bundle adjusment software for automatic calibration and orientation of set of images.

268 Amos Ronzino et al. / Energy Procedia 83 ( 2015 ) 258 – 268
ISPRS-International Archives of the Photogrammetry, Remote Sensing and Spatial Information Sciences; 2011. 38.5. [13] Bastonero E, Donadio E, Chiabrando F, Spanò A. Fusion of 3D models derived from TLS and image-based techniques for CH enhanced documentation. In: ISPRS Annals of the Photogrammetry, Remote Sensing, Spatial Information Science; 2014. 2.5 73-80. [14] Hofierka J, Suri M. The solar radiation model for Open source GIS: implementation and applications. In: Proceedings of the Open source GIS-GRASS users conference; 2002. [15] UNI 10349:1994, Riscaldamento e raffrescamento degli edifici - Dati Climatici. [16] Eastman C, Teicholz P, Sacks R, Liston K. BIM handbook: A guide to building information modelling for owners, managers, designers, engineers, and contractors. John Wiley and Sons, Inc; 2008. [17] Meridian. BIM and Project Management – Advancing Integrated Project Delivery on Capital Building Programs. CABA; 2008. [18] Stumpf A, Kim H, Jenicek E. Early Design Energy Analysis Using Building Information Modelling Technology. USA; 2011.


