
The Energy and Fuel Data Sheet...The Energy and Fuel Data Sheet W1P1 – Revision 1 Iain Staffell,...
11
The Energy and Fuel Data Sheet W1P1 – Revision 1 Iain Staffell, University of Birmingham, UK [email protected] March 2011 Length, Area, Volume 1 mile = 1.609344 km 1 foot = 30.48 cm 1 inch = 2.540 cm 1 imperial gallon = 4.54609 L 1 US gallon = 3.785411784 L 1 imperial pint = 0.56826125 L 1 US pint = 0.473176473 L 1 barrel of oil = 158.987294928 L Pressure 1 atmosphere = 1.01325 bar 1 atmosphere = 101.325 kPa 1 atmosphere ≈ 14.6959494 psi 1 atmosphere ≈ 760 torr (mmHg) 1 psi = 6,894.757 Pa Weight, Mass 1 short ton = 0.90718474 tonnes 1 long ton = 1.016046909 tonnes 1 pound = 0.45359237 kg 1 kg = 9.80665 Newtons 44.010 kg of CO₂ = 12.011 kg of C Speed 1 mph = 0.44704 m/s 1 km/h = m/s Time 1 day = 86400 seconds 1 year = 8760 hours Energy, Power 1 1 kWh = 3.6 MJ 1 Btu = 1055.056 J 1 therm = 105.5056 MJ 1 calorie = 4.1868 J 1 tonne of oil equivalent (toe) = 41.868 GJ (LHV) 1 barrel of oil (LHV) ≈ 5.70 GJ (IEA def.) 5.86 GJ (global avg.) 1 mechanical hp ≈ 745.7 W 1 PS ≈ 735.5 W 1 Alternate definitions exist for many of these units, the ISO standards were chosen where possible.
Transcript of The Energy and Fuel Data Sheet...The Energy and Fuel Data Sheet W1P1 – Revision 1 Iain Staffell,...

The Energy and Fuel Data Sheet
W1P1 – Revision 1 Iain Staffell, University of Birmingham, UK [email protected]
March 2011
Length, Area, Volume 1 mile = 1.609344 km 1 foot = 30.48 cm 1 inch = 2.540 cm
1 imperial gallon = 4.54609 L
1 US gallon = 3.785411784 L
1 imperial pint = 0.56826125 L 1 US pint = 0.473176473 L
1 barrel of oil = 158.987294928 L
Pressure
1 atmosphere = 1.01325 bar 1 atmosphere = 101.325 kPa 1 atmosphere ≈ 14.6959494 psi 1 atmosphere ≈ 760 torr (mmHg)
1 psi = 6,894.757 Pa
Weight, Mass 1 short ton = 0.90718474 tonnes 1 long ton = 1.016046909 tonnes
1 pound = 0.45359237 kg 1 kg = 9.80665 Newtons
44.010 kg of CO₂ = 12.011 kg of C
Speed 1 mph = 0.44704 m/s
1 km/h = m/s
Time 1 day = 86400 seconds
1 year = 8760 hours
Energy, Power1 1 kWh = 3.6 MJ
1 Btu = 1055.056 J
1 therm = 105.5056 MJ
1 calorie = 4.1868 J
1 tonne of oil equivalent (toe)
= 41.868 GJ (LHV)
1 barrel of oil (LHV)
≈ 5.70 GJ (IEA def.) 5.86 GJ (global avg.)
1 mechanical hp ≈ 745.7 W
1 PS ≈ 735.5 W
1 Alternate definitions exist for many of these units, the ISO standards were chosen where possible.

General Properties for Some Common Fuels This data is aggregated from 26 sources in order to give a representative view of each fuel’s properties, with global scope and no specific application. The tables on the following pages give the data presented in each source, which can be used to represent more specific situations (e.g. automobile fuels in Europe).
Density at STP
(kg/m3)
Ratio of HHV to LHV energy
content
Net Calorific Value / LHV Gross Calorific Value / HHV Carbon Intensity (g CO2-eq /
MJ LHV) (MJ/L) (MJ/kg) (MJ/L) (MJ/kg)
Crude Oil 856 ± 24 1.052 ± 0.001 36.84 ± 1.05 43.05 ± 1.40 38.76 ± 1.10 45.30 ± 1.47 73.5 ± 2.6
Petrol / Gasoline 741 ± 4 1.063 ± 0.015 32.70 ± 0.44 44.15 ± 0.74 34.77 ± 0.47 46.94 ± 0.70 70.8 ± 4.4
Diesel 837 ± 8 1.063 ± 0.011 35.94 ± 0.45 42.91 ± 0.46 38.19 ± 0.47 45.60 ± 0.49 74.3 ± 2.3
Fuel Oil 959 ± 17 1.058 ± 0.008 39.21 ± 1.09 40.87 ± 0.94 41.50 ± 1.15 43.26 ± 1.00 77.8 ± 2.1
LPG 533 ± 18 1.077 ± 0.008 24.67 ± 0.80 46.28 ± 0.74 26.57 ± 0.86 49.84 ± 0.80 63.9 ± 2.1
Kerosene 807 ± 6 1.053 ± 0.001 35.24 ± 0.41 43.69 ± 0.51 37.10 ± 0.43 45.99 ± 0.54 72.0 ± 1.8
Hydrogen
(35 MPa) 23.65 ± 0.09
1.183 ± 0.001
2.837 ± 0.003
119.95 ± 0.13
3.355 ± 0.004
141.88 ± 0.16 0 (70 MPa) 39.69 ± 0.16 4.761 ± 0.005 5.631 ± 0.006 (liquid) 72.41 ± 0.72 8.685 ± 0.010 10.273 ± 0.011
(kg/m3) (HHV / LHV) (MJ/kg) (MJ/kg) (g/MJ LHV)
Coal 1.050 ± 0.004 - 25.75 ± 2.64 - 27.05 ± 2.77 95.7 ± 7.0
(kg/m3) (HHV / LHV) (MJ/m3) (MJ/kg) (MJ/m3) (MJ/kg) (g/MJ LHV)
Natural Gas 0.768 ± 0.039 1.109 ± 0.003 35.22 ± 2.22 45.86 ± 3.95 39.05 ± 2.47 50.84 ± 4.38 56.9 ± 3.4
Hydrogen (1 atm.) 0.0838 ± 0.0008 1.183 ± 0.001 10.05 ± 0.01 119.95 ± 0.13 11.88 ± 0.01 141.88 ± 0.16 0
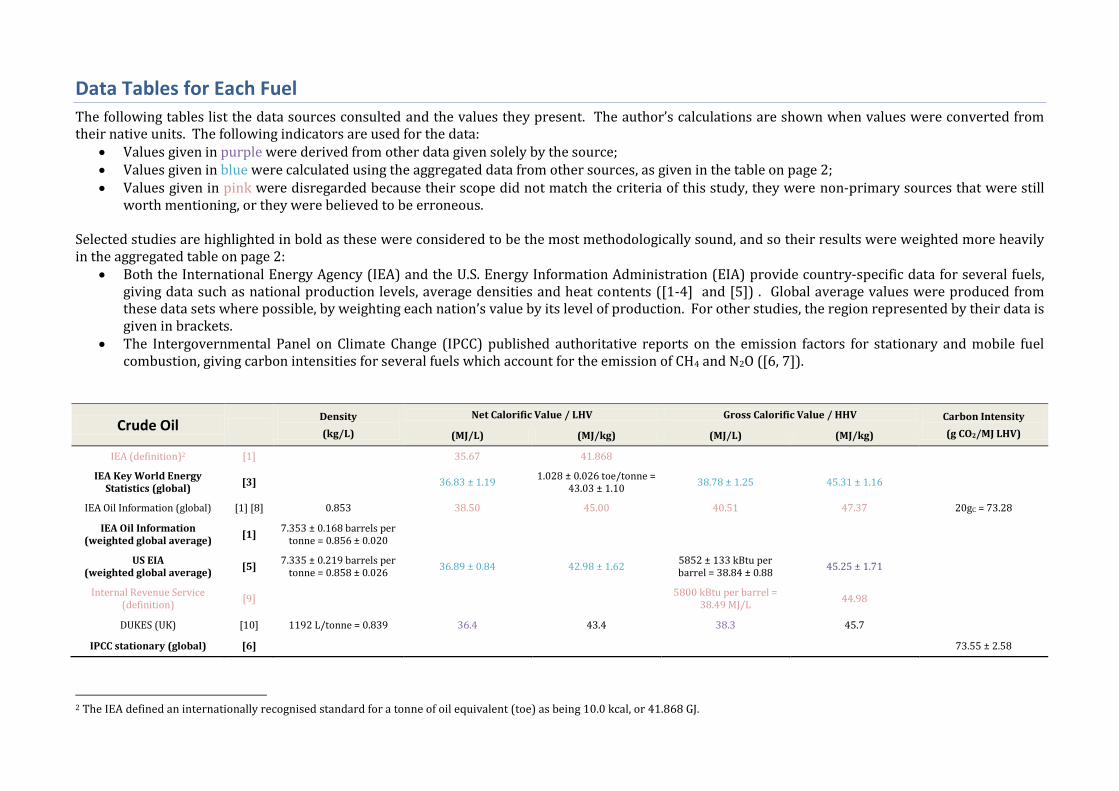
Data Tables for Each Fuel
The following tables list the data sources consulted and the values they present. The author’s calculations are shown when values were converted from their native units. The following indicators are used for the data:
Values given in purple were derived from other data given solely by the source; Values given in blue were calculated using the aggregated data from other sources, as given in the table on page 2; Values given in pink were disregarded because their scope did not match the criteria of this study, they were non-primary sources that were still
worth mentioning, or they were believed to be erroneous. Selected studies are highlighted in bold as these were considered to be the most methodologically sound, and so their results were weighted more heavily in the aggregated table on page 2:
Both the International Energy Agency (IEA) and the U.S. Energy Information Administration (EIA) provide country-specific data for several fuels, giving data such as national production levels, average densities and heat contents ([1-4] and [5]) . Global average values were produced from these data sets where possible, by weighting each nation’s value by its level of production. For other studies, the region represented by their data is given in brackets.
The Intergovernmental Panel on Climate Change (IPCC) published authoritative reports on the emission factors for stationary and mobile fuel combustion, giving carbon intensities for several fuels which account for the emission of CH4 and N2O ([6, 7]).
Crude Oil Density
(kg/L)
Net Calorific Value / LHV Gross Calorific Value / HHV Carbon Intensity
(g CO2/MJ LHV) (MJ/L) (MJ/kg) (MJ/L) (MJ/kg)
IEA (definition)2 [1] 35.67 41.868
IEA Key World Energy Statistics (global)
[3] 36.83 ± 1.19 1.028 ± 0.026 toe/tonne =
43.03 ± 1.10 38.78 ± 1.25 45.31 ± 1.16
IEA Oil Information (global) [1] [8] 0.853 38.50 45.00 40.51 47.37 20gC = 73.28
IEA Oil Information (weighted global average)
[1] 7.353 ± 0.168 barrels per
tonne = 0.856 ± 0.020
US EIA (weighted global average)
[5] 7.335 ± 0.219 barrels per
tonne = 0.858 ± 0.026 36.89 ± 0.84 42.98 ± 1.62
5852 ± 133 kBtu per barrel = 38.84 ± 0.88
45.25 ± 1.71
Internal Revenue Service (definition)
[9] 5800 kBtu per barrel =
38.49 MJ/L 44.98
DUKES (UK) [10] 1192 L/tonne = 0.839 36.4 43.4 38.3 45.7
IPCC stationary (global) [6] 73.55 ± 2.58
2 The IEA defined an internationally recognised standard for a tonne of oil equivalent (toe) as being 10.0 kcal, or 41.868 GJ.

Petrol / Gasoline Density
(kg/L)
Net Calorific Value / LHV Gross Calorific Value / HHV Carbon Intensity
(g CO2/MJ LHV) (MJ/L) (MJ/kg) (MJ/L) (MJ/kg)
IEA (Europe) (America) (Pacific)
[2] 32.6 33.2 33.0
44.0 44.8 44.6
34.7 35.3 35.1
46.8 47.6 47.4
IEA (global) [1] [8] 0.741 33.16 44.75 34.90 47.10 18.9 gC = 69.25 gCO₂
U.S. Energy Information Administration (USA)
[11] 8.53 barrels/tonne =
0.737
DUKES (UK) [10] 1362 L/tonne = 0.734 32.82 44.7 34.58 47.1 3.135 kg/kg (HHV) = 66.56 (HHV) = 70.13
DEFRA (UK)3 [12] 1354 L/tonne = 0.739 33.03 44.72 34.76 47.07 2317 g/L = 70.15
IPCC stationary (global) [6] 69.55 ± 3.12
IPCC mobile (global) [7] 71.15 ± 5.22
ORNL Bioenergy (USA) [13] 1356 L/tonne = 0.737 115,000 Btu/galUS = 32.05 43.46 125,000 Btu/galUS = 34.84 47.24 2.42 kgC/galUS =
2.34 kg CO₂/L = 73.1
JEC (EU) [14, 15] 0.745 32.2 43.2 3.17 kg/kg = 73.4
GREET 1.8 (USA) (conventional gasoline)
[16] 2,819 g/galUS = 0.745 116,090 Btu/galUS = 32.36 43.45 124,340 Btu/galUS = 34.66 46.54 86.3% carbon ratio
= 72.8
Transportation Energy Data Book (USA)
[17] 6.2 lb/galUS = 0.743 115,400 Btu/galUS = 32.16 43.29 125,000 Btu/galUS = 34.84 46.90 19.34 MT/Quad =
67.17 (HHV) = 71.84
College of the Desert (USA) [18] 44.5 47.5
3 Government statistics derived from data given in the Digest of UK Energy Statistics (DUKES) and the Standard Assessment Procedure (SAP 2005).

Diesel Density
(kg/L)
Net Calorific Value / LHV Gross Calorific Value / HHV Carbon Intensity
(g CO2/MJ LHV) (MJ/L) (MJ/kg) (MJ/L) (MJ/kg)
DUKES (UK) [10] 1195 L/tonne = 0.837 35.90 42.9 38.16 45.6 3.164 kg/kg HHV =
69.39 (HHV) = 73.75
DEFRA (UK) [12] 1203 L/tonne = 0.831 36.04 43.36 37.94 45.64 2629 g/L = 72.94
IPCC stationary (global) [6] 74.35 ± 1.47
IPCC mobile (global) [7] 75.39 ± 2.84
ORNL Bioenergy (USA) [13] 0.849 130,500 Btu/galUS = 36.37 42.84 2.77kgC/galUS =
2.68 kg CO₂/L = 73.7
JEC (EU) [14, 15] 0.832 35.9 43.1 3.16 kg/kg = 73.3
Determined for C15.35H28.68 [19] 0.832 35.70 42.92
GREET 1.8 (USA) [16] 3,206 g/galUS = 0.847 129,488 Btu/galUS = 36.19 42.61 138,490 Btu/galUS = 38.60 45.58 87.1% carbon ratio
= 74.9
Transportation Energy Data Book (USA)
[17] 128,700 Btu/galUS = 35.87 42.83 138,700 Btu/galUS = 38.66 46.16
College of the Desert (USA) [18] 35.59 42.5 37.52 44.8
Note: when a source gave multiple options for diesel fuels, the data for low or ultra-low sulphur diesel were chosen.
Fuel Oil Density
(kg/L)
Net Calorific Value / LHV Gross Calorific Value / HHV Carbon Intensity
(g CO2/MJ LHV) (MJ/L) (MJ/kg) (MJ/L) (MJ/kg)
IEA (Europe) (America) (Pacific)
[2] 38.4 38.6 40.9
40.0 40.2 42.6
40.6 40.8 43.3
42.3 42.5 45.1
IEA (global) [1] [8] 0.944 38.40 40.68 40.42 42.82 21.1 gC = 77.31
U.S. Energy Information Administration (USA)
[11] 6.66 barrels/tonne =
0.944
DUKES (UK) [10] 1024 L/tonne = 0.977 39.84 40.8 42.48 43.5 3.216 kg/kg HHV =
73.93 (HHV) = 78.82
DEFRA (UK) [12] 1033 L/tonne = 0.968 39.86 41.18 41.96 43.34 77.99
IPCC stationary (global) [6] 77.65 ± 2.02
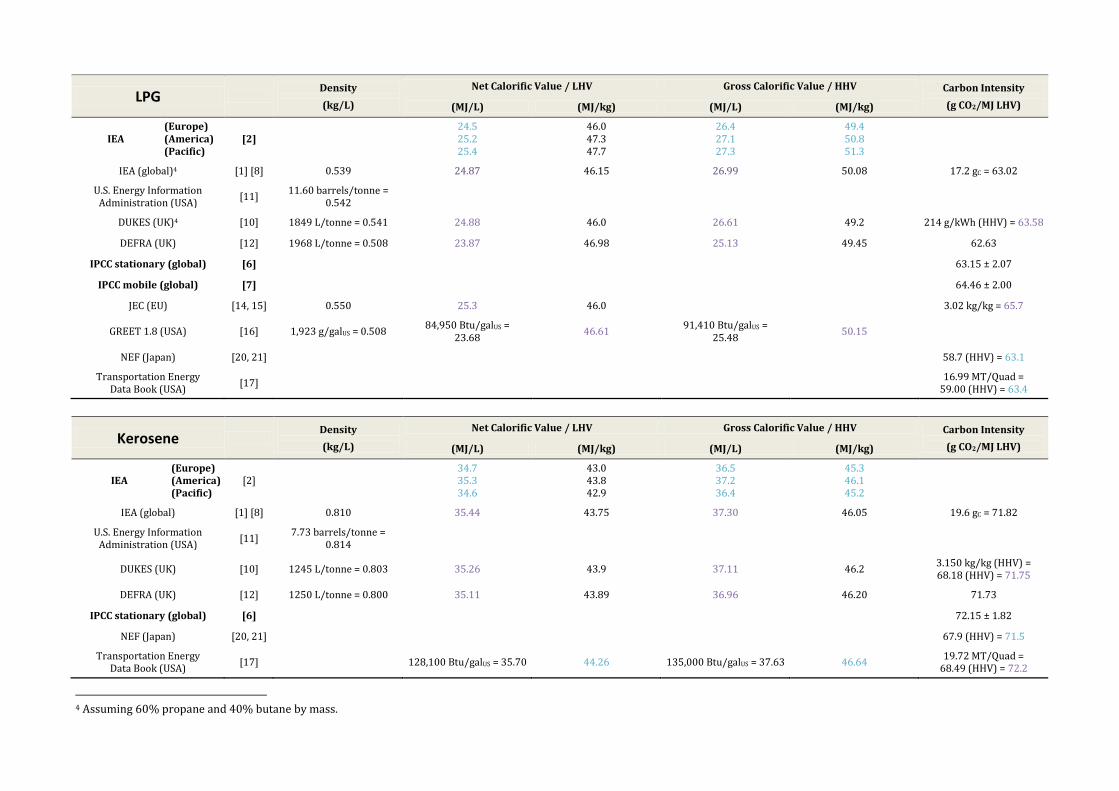
LPG Density
(kg/L)
Net Calorific Value / LHV Gross Calorific Value / HHV Carbon Intensity
(g CO2/MJ LHV) (MJ/L) (MJ/kg) (MJ/L) (MJ/kg)
IEA (Europe) (America) (Pacific)
[2] 24.5 25.2 25.4
46.0 47.3 47.7
26.4 27.1 27.3
49.4 50.8 51.3
IEA (global)4 [1] [8] 0.539 24.87 46.15 26.99 50.08 17.2 gC = 63.02
U.S. Energy Information Administration (USA)
[11] 11.60 barrels/tonne =
0.542
DUKES (UK)4 [10] 1849 L/tonne = 0.541 24.88 46.0 26.61 49.2 214 g/kWh (HHV) = 63.58
DEFRA (UK) [12] 1968 L/tonne = 0.508 23.87 46.98 25.13 49.45 62.63
IPCC stationary (global) [6] 63.15 ± 2.07
IPCC mobile (global) [7] 64.46 ± 2.00
JEC (EU) [14, 15] 0.550 25.3 46.0 3.02 kg/kg = 65.7
GREET 1.8 (USA) [16] 1,923 g/galUS = 0.508 84,950 Btu/galUS =
23.68 46.61
91,410 Btu/galUS = 25.48
50.15
NEF (Japan) [20, 21] 58.7 (HHV) = 63.1
Transportation Energy Data Book (USA)
[17] 16.99 MT/Quad =
59.00 (HHV) = 63.4
Kerosene Density
(kg/L)
Net Calorific Value / LHV Gross Calorific Value / HHV Carbon Intensity
(g CO2/MJ LHV) (MJ/L) (MJ/kg) (MJ/L) (MJ/kg)
IEA (Europe) (America) (Pacific)
[2] 34.7 35.3 34.6
43.0 43.8 42.9
36.5 37.2 36.4
45.3 46.1 45.2
IEA (global) [1] [8] 0.810 35.44 43.75 37.30 46.05 19.6 gC = 71.82
U.S. Energy Information Administration (USA)
[11] 7.73 barrels/tonne =
0.814
DUKES (UK) [10] 1245 L/tonne = 0.803 35.26 43.9 37.11 46.2 3.150 kg/kg (HHV) = 68.18 (HHV) = 71.75
DEFRA (UK) [12] 1250 L/tonne = 0.800 35.11 43.89 36.96 46.20 71.73
IPCC stationary (global) [6] 72.15 ± 1.82
NEF (Japan) [20, 21] 67.9 (HHV) = 71.5
Transportation Energy Data Book (USA)
[17] 128,100 Btu/galUS = 35.70 44.26 135,000 Btu/galUS = 37.63 46.64 19.72 MT/Quad =
68.49 (HHV) = 72.2
4 Assuming 60% propane and 40% butane by mass.

Natural Gas Density
(kg/m³)
Net Calorific Value / LHV Gross Calorific Value / HHV Carbon Intensity
(g CO2/MJ LHV) (MJ/m³) (MJ/kg) (MJ/m³) (MJ/kg)
IEA (global) [3] 35.14 ± 2.19 45.75 ± 3.68 38.95 ± 2.43 50.71 ± 4.08
IEA [8] 15.3 gC = 56.06
US EIA (weighted global average)
[5] 34.64 45.11 38.40 50.00
DUKES (UK production) (UK consumption)
[10] 36.0 35.6
46.9 46.4
40.0 39.6
52.1 51.6
184 g/kWh (HHV) = 51.11 (HHV) = 56.82
DEFRA (UK) [12] 1340651 L/tonne =
0.7459 35.64 47.78 39.60 53.09 57.17
IPCC stationary (global) [6] 56.15 ± 2.07
IPCC mobile (global) [7] 58.96 ± 4.13
JEC (Europe) (Russia) (Netherlands)
[15] 0.791 0.727 0.827
35.7 35.8 31.4
45.1 49.2 38.0
39.5 39.7 34.8
50.0 54.5 42.1
56.4 55.1
GREET 1.8 (USA) [16] 22.0 g/ft³ = 0.777 983 Btu/ft³ = 36.6 47.14 1,089 Btu/ft³ = 40.6 52.23 72.4% carbon ratio
= 56.3
ORNL Bioenergy (USA) [13] 930 Btu/ft³ = 34.7 45.1 1027 Btu/ft³ = 38.3 49.8 14.4 gC/MJ = 52.8
NEF (Japan)(13A gas) [20, 21] 51.25 g/MJ HHV = 56.8
Combustion (global) [22] 35.16 45.76 38.90 50.64
Transportation Energy Data Book (dry gas)
[17] 1027 Btu/ft³ = 38.3 49.8 14.47 MT/Quad =
50.25 (HHV) = 55.69

Hydrogen Density
(kg/m³)
Net Calorific Value / LHV Gross Calorific Value / HHV
(MJ/m³) (MJ/kg) (MJ/m³) (MJ/kg)
NIST
20°C, 101.325 kPa 20°C, 35 MPa 20°C, 70 MPa 20 K, 101.325 kPa
[23, 24]
0.0837547 23.6507 39.6931 72.4073
JEC (EU) [14, 15] 0.0893 10.73 10.06
120.1
GREET 1.8 [16] 2.55 g/ft³ = 0.09005 290 Btu/ft³ = 10.81
10.05 119.99
343 Btu/ft³ = 12.78 11.89
141.92
Transportation Energy Data Book (USA)
[17] 0.08988 10.02 113,400 Btu = 119.64 11.86 134,200 Btu = 141.59
US Department of Energy (USA) [18] 0.08519 10.04 119.93 11.88 141.86
Glenn Research Centre (USA) [25] 0.08513 10.04 10.05
119.93 51,596 Btu/lb = 120.01
11.88 11.89
141.86 61,031 Btu/lb = 141.96
M. Mikkola 0°C, 1 atm 20K, 1 atm
[26] 0.08987
70.99 10.78 / 10.05 8515 / 8685
119.96 12.74 / 11.88
10065 / 10267 141.79
Data for the density and volumetric energy density of hydrogen was based on various definitions of the gas state (temperature, pressure) within the different sources. This was corrected for by adopting a single reference for the gas state, and using the gas density of 0.0837547 kg/m³ to recalculate the volumetric energy densities in all references. Density data is taken solely from the NIST equation of state calculator for STP conditions as defined by NIST (20°C and 101.325 kPa). Typical conditions for hydrogen fuel cell vehicles are also given for reference (as used in the summary table on page 2). Note that NIST gives the density of hydrogen as being 0.0898851 kg/m³ at 0°C and 1 atmosphere, which is the a commonly quoted value in other sources [23].5
5 http://webbook.nist.gov/cgi/fluid.cgi?ID=C1333740&Action=Page%20 is a more direct URL to the thermophysical properties of hydrogen.

Coal Grade and End Use Net Calorific Value / LHV
(MJ/kg)
Gross Calorific Value / HHV
(MJ/kg)
Carbon Intensity
(g CO2/MJ LHV)
IEA (definition)6 [2] 29.31
IEA Key World Energy Statistics (weighted global average)7
[3] All 0.563 ± 0.064 toe/tonne =
23.56 ± 2.67 24.75 ± 2.81
IEA (global) [8] All 26.13 gC = 95.76
IEA Coal Information (weighted global average)8
[2] Anthracite, coking and other
bituminous coals 27.49 ± 1.19 28.87 ± 1.25
IEA Energy Prices & Taxes (weighted global average)9
[4] Steam coal for electrical
power generation 25.86 ± 2.68 27.16 ± 2.82
US EIA (weighted global average)10
[5] All 18.65 ± 3.64 19.59 ± 3.82
DUKES (UK) [10] All UK consumers UK power stations
24.5 23.8
25.8 25.0
2.301 kg/kg (HHV) = 90.61 (HHV) = 95.30
DEFRA (UK) [12] Hard coals 28.98 30.50 86.49
IPCC stationary (global) [6] Coking, bituminous and sub-
bituminous coals used in centralised power stations
95.59 ± 5.33
JEC (EU) [15] 29.4 30.88 96.3
GREET 1.8 (USA) [16] Bituminous 22,460,600 Btu/ton = 26.12 23,445,900 Btu/ton = 27.27 75.5% carbon ratio = 105.9
ORNL Bioenergy (USA) [13] Bituminous 27–30 746 gC/kg = 91.1–101.2
Transportation Energy Data Book (USA)
[17] All US production
All US consumption
21,352,000 Btu/ton = 24.83
21,015,000 Btu/ton = 24.44
26.04 MT/Quad = 90.43 (HHV) = 94.98
25.98 MT/Quad = 90.23 (HHV) = 94.77
These values aim to represent power-station grade hard coal, typically defined as anthracite, coking coal and other bituminous coals.
6 The IEA defined an internationally recognised standard for a tonne of coal equivalent (tce) as being 7.0 kcal, or 29.3076 GJ. 7 Covers output from the top ten producing countries, accounting for 87% of global production. 8 Covers consumption from 30 countries (with the notable exception of China), accounting for 35% of global consumption. 9 Covers consumption from 24 countries (with the notable exception of China), accounting for 32% of global consumption. 10 Covers output from 71 countries, accounting for virtually all global production. This was discounted as it included significant amounts of lower grade lignite and peat production.

Data Sources for Other Fuels Many of the cited sources gave data on alternative fuels which are not listed above, including:
Biodiesel [14, 16, 17, 19]; Syndiesel [14-16]; ETBE/MTBE [14-16]; Ethanol blends [8, 14-17, 19]; Methanol [8, 14-18]; Naphtha [14-17]; Peat [8].
References
[1] International Energy Agency, Oil Information. 2010: Paris. URL: http://wds.iea.org/wds/pdf/documentation_oil_2010.pdf [2] International Energy Agency, Coal Information. 2010: Paris. URL: http://wds.iea.org/wds/pdf/documentation_Coal_Information_2010.pdf [3] International Energy Agency, Key World Energy Statistics. 2010: Paris. URL: http://www.iea.org/textbase/nppdf/free/2010/key_stats_2010.pdf [4] International Energy Agency, Energy Prices & Taxes: Quarterly Statistics, Fourth Quarter. 2009: Paris. [5] U.S. Energy Information Administration. International Energy Statistics. 2011 [cited Feb 2011]; URL:
http://www.eia.gov/cfapps/ipdbproject/IEDIndex3.cfm [6] National Greenhouse Gas Inventories Programme, Stationary Combustion, in 2006 IPCC Guidelines for National Greenhouse Gas Inventories, S.
Eggleston, L. Buendia, K. Miwa, T. Ngara, and K. Tanabe, Editors. 2006, IGES: Japan. URL: http://tinyurl.com/m6v3bs. [7] National Greenhouse Gas Inventories Programme, Mobile Combustion, in 2006 IPCC Guidelines for National Greenhouse Gas Inventories, S. Eggleston,
L. Buendia, K. Miwa, T. Ngara, and K. Tanabe, Editors. 2006, IGES: Japan. URL: http://tinyurl.com/kt8h2p. [8] International Energy Agency, CO2 Emissions from Fuel Combustion. 2010: Paris. URL: http://wds.iea.org/wds/pdf/doc_co2_2008.pdf [9] U.S. Internal Revenue Service, Nonconventional Source Fuel Credit, in Part III - Administrative, Procedural, and Miscellaneous. 1999. URL:
http://www.irs.gov/pub/irs-drop/n-99-18.pdf [10] I. MacLeay, K. Harris, and A. Annut, Annex A: Energy and commodity balances, conversion factors and calorific values, in Digest of UK Energy Statistics.
2010, National Statistics. [11] U.S. Energy Information Administration. Units Conversion. 2009 [cited Feb 2011]; URL:
http://www.eia.gov/cfapps/ipdbproject/docs/unitswithpetro.cfm

[12] DEFRA, Act on CO2 Calculator: Data, Methodology and Assumptions Paper. V1.2. 2008: London. URL: http://tinyurl.com/ppu9yz [13] Bioenergy Feedstock Information Network. Bioenergy Conversion Factors. 2005 [cited Nov 2009]; URL:
http://bioenergy.ornl.gov/papers/misc/energy_conv.html [14] R. Edwards, J.-F. Larivé, V. Mahieu, and P. Rouveirolles, Well-to-Wheels Analysis of Future Automotive Fuels and Powertrains in the European Context:
Tank-to-Wheels report (version 3). 2008, JRC, EURCAR and CONCAWE. URL: http://tinyurl.com/yk38c6a [15] R. Edwards, J.-F. Larivé, V. Mahieu, and P. Rouveirolles, Well-to-Wheels Analysis of Future Automotive Fuels and Powertrains in the European Context:
Well-to-Tank Appendix 1: Description of individual processes and detailed input data (version 2c). 2007, JRC, EURCAR and CONCAWE. URL: http://ies.jrc.ec.europa.eu/uploads/media/WTT_App_1_010307.pdf
[16] M. Wang, GREET 1, version 1.8c.0 (Fuel-Cycle Model). 2009, Center for Transportation Research, Argonne National Laboratory: Center. URL: http://tinyurl.com/m6oo5z
[17] S.C. Davis, S.W. Diegel, and R.G. Boundy, Transportation Energy Data Book. 28th ed. 2009: ORNL, U.S. Department of Energy. [18] W. Lanz, Module 1: Hydrogen Properties, in Hydrogen Fuel Cell Engines and Related Technologies. 2001, US Department of Energy. URL:
http://tinyurl.com/mbkc6u. [19] W. Sawady, H. Timmermann, R. Reimert, and E. Ivers-Tiffée., Process Analysis of a Liquid Fuel-Based SOFC System, in European Fuel Cell Forum. 2008:
Lucerne, Switzerland. [20] New Energy Foundation, 固 体 酸 化 物 形 燃 料 電 池 実 証 研 究 (Solid Oxide Fuel Cell Empirical Research). 2009. URL:
http://sofc.nef.or.jp/topics/pdf/2009_sofc_houkoku.pdf (in Japanese) [21] New Energy Foundation, 平成 20 年度定置用燃料電池大規模実証事業報告会資料. (Report data from the Large Scale Residential Fuel Cell
Demonstration Project in 2008). 2009. URL: http://happyfc.nef.or.jp/pdf/20fc.pdf (in Japanese) [22] F. El-Mahallawy and S.E.-D. Habik, Fundamentals and Technology of Combustion. 2002: Elsevier Science. [23] E.W. Lemmon, M.O. McLinden, and D.G. Friend, Thermophysical Properties of Fluid Systems, in NIST Chemistry WebBook, NIST Standard Reference
Database Number 69, P.J. Linstrom and W.G. Mallard, Editors. 2011, National Institute of Standards and Technology: Gaithersburg, USA. URL: http://webbook.nist.gov (accessed Feb 2011).
[24] J.W. Leachman, R.T. Jacobsen, S.G. Penoncello, and E.W. Lemmon, Fundamental Equations of State for Parahydrogen, Normal Hydrogen, and Orthohydrogen. Journal of Physical and Chemical Reference Data, 2009. 38(3): p. 721-748.
[25] M. Domingez, Chapter 6 - Hydrogen, in Glenn Safety Manual. 2010, NASA Glenn Research Center. URL: http://tinyurl.com/66c5yvn. [26] M. Mikkola. Hydrogen. 2002 [cited Feb 2011]; URL: http://www.tkk.fi/Units/AES/projects/renew/fuelcell/posters/hydrogen.html. Helsinki
University of Technology.


