The Emissions Gap Report 2012 Where do we need to be in 2020 and beyond? What do countries need to...
15
The Emissions Gap Report 2012 Where do we need to be in 2020 and beyond? What do countries need to do to make it happen? London 21 November, 2012 ♦ Joseph Alcamo Chief Scientist, UNEP
-
Upload
anissa-beasley -
Category
Documents
-
view
212 -
download
0
Transcript of The Emissions Gap Report 2012 Where do we need to be in 2020 and beyond? What do countries need to...

The Emissions Gap Report 2012Where do we need to be in 2020 and beyond?
What do countries need to do to make it happen?
London ♦ 21 November, 2012
Joseph AlcamoChief Scientist, UNEP

2
Three policy developments …A target (or limit) …
Staying below an increase of 2 degrees Celsius (1.50 C) A means to get there …
Country pledges to control emissions (pegged to 2020)
Durban: A plan for a climate treaty … Agreed to by 2015; into effect by 2020
Three questions … Is there a gap between …
What we are aiming for … and where we are heading ?
Can the gap be bridged – and what will it take? Can we wait until 2020 to start stringent emission reductions?
Moving forward on global climate policy

3
The Emissions Gap reports
2010 Cancun Climate Summit UNEP “Emissions Gap” report
United Nations Environment Programme with the European Climate Foundation & National Institute of Ecology, Mexico
2011 Durban Climate Summit UNEP “Bridging the Emissions Gap” report
United Nations Environment Programme with the European Climate Foundation & Ministry of Environment, South Africa
2012 Doha Climate Summit UNEP “Emissions Gap 2012” report
United Nations Environment Programme with the European Climate Foundation
55 scientists, 43 institutions, 22 countries

4
1. Meeting a temperature target depends largely on cumulative emissions
2. Different pathways of emissions correspond to same cumulative emissions
What are we aiming for? Pathways to stay within the 2oC target

5
Year
Now (2010) ≈ 49 GtCO2e/yr
39 emissions pathwaysLikely chance of complying with 2oC target:
What are we aiming for?Post-2020 goals for staying within 2oC target
In 2030 37 Gt CO2e/yr (33-44) - 23% rel. to 2010 emissions 1990 emissions
In 2050 21 Gt CO2e/yr (18-25) - 56% rel. to 2010 emissions - 42% rel to 1990 emissions
Global Greenhouse Gas Emissions
Gt/year CO2-equiv.
Pledge case
s
13 10 11 8
Different pledge cases GtCO2e/yr Gap
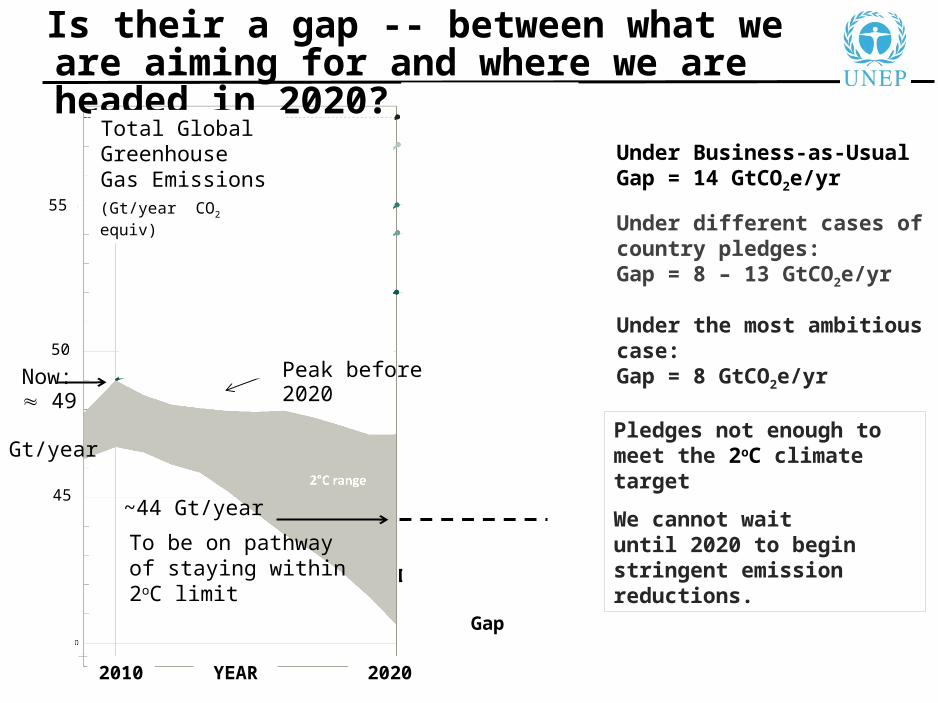
Under Business-as-UsualGap = 14 GtCO2e/yr
Under different cases of country pledges:Gap = 8 – 13 GtCO2e/yr
Under the most ambitious case:Gap = 8 GtCO2e/yr
Pledges not enough to meet the 2oC climate target
We cannot wait until 2020 to begin stringent emission reductions.
Now: 49 Gt/year
~44 Gt/year
To be on pathway of staying within 2oC limit
45
55
45
50
2010
Business as usual, Gap = 14
Is their a gap -- between what we are aiming for and where we are headed in 2020?
2020YEAR
Pledge case
s
Total Global Greenhouse Gas Emissions
Peak before 2020
(Gt/year CO2 equiv)

7
What happens if we don’t close the gap in 2020?
If ambition of pledges not increased: trajectory to + 3.0 to 5.0oC
What if we start later to meet the 2.0 oC target?
“Later action scenarios”: Higher emissions over near term, require sharper reductions afterwards Lower short-term costs, but …
Negative emissions throughBioenergy + Carbon Capture and Storage
A bigger gamble …
• Higher costs of mitigation
• Greater climate impacts
• Reliance on non-proven technology Negative emissions

8
Power
Industry
Transport
Buildings
Forestry
Waste
Agriculture
Business-as-usual
2.2 – 3.9
1.5 – 4.6
1.7 – 2.5
1.4 – 2.9
0.8
1.3 – 4.2
1.1 – 4.3
= 17 ± 3Total Emission Reduction Potential
The Gap in 2020 = 14 (relative to business-as-usual)
Year20202010
Total Greenhouse Gas Emissions
Potential in sectors big enough to bridge the gap.
Emission reduction potential (Gt/year equivalent CO2)
Gt/year CO2e
Gt/year CO2e
How can the 2020 gap be bridged?Bottom-up sectoral studies

Transportation
Vehicle Performance Standards
• Japan, EU, USA, Canada, China, Australia and South Korea:
• Light-duty fleets: > 50% reduction in GHG emissions by 2025 rel to 2000.
9
Bus Rapid Transit
• 16 countries
• GHG emissions in Mexico City: 143 kt CO2e/yr avoided due BRT (Metrobus) system
How can the 2020 gap be bridged?Some action on the ground
Potential: - 1.7 to - 2.5 Gt CO2e in 2020
Reduce energy use, increase energy security, reduce traffic congestion, security, reduce air pollution
Example policies:

e.g. Appliance Standards and Labels
• > 75 countries
• Avoided GHG emissions 125 MtCO2e/yr (2020) from SEAD* 17 states
• Potential global reductions GHG emissions: 0.7 Gt CO2e (2020)
Buildings
Potential: -1.4 to - 2.9 Gt CO2e in 2020
Reduce energy use and costs, energy security, safety
* Super Efficient Equipment and Appliance Deployment Initiative
Example policy:
How can the 2020 gap be bridged?Some action on the ground

Forestry – Reducing deforestation
Potential: - 1.3 to - 4.2 Gt CO2e in 2020
• Protected areas Brazil: 46% of Amazon, Costa Rica: 24% of land area.
• Satellite-based monitoring Brazil: enforcement of deforestation policies
• Economic instruments: Costa Rica: Payments for ecosystem services
Many countries, including Brazil and Costa Rica
Preservation of culture, ecotourism, biodiversity, watershed protection
Brazil: Avoided GHG emissions: ~ 0.6 Gt CO2e (2005-2009); ~ 2.8 Gt CO2e (2006-2011)
Costa Rica: Currently: Near zero deforestation & related emissions
Example policies:
How can the 2020 gap be bridged?Some action on the ground

12
Currently produced energy-inefficient vehicles will still be on the road in 2020
Energy-wasteful buildings now under construction will last 100 years
Power plants are being constructed with fuel efficiency below what is technically feasible, and will have lifetime of >25 years
Losing opportunities …“Lock in” of high emission technologies, structures
and processes

13
Conclusions
But cannot wait until 2020 for stringent emission reductions to begin. To meet the two degree target:
• Global emissions already more than 10% above emissions level in 2020 consistent with 2oC target, and growing
• Global emissions must peak before 2020
• Pledges not enough, still gap in 2020 8 - 13 Gt CO2e
For a climate agreement that begins in 2020 …To meet the two degree target:
• Global emissions in 2030 must return to around their 1990s level
• Global emissions in 2050, > 40% below 1990 levels, > 50% below 2010 levels
New in this report
• Looking beyond 2020, current global emissions, consequences of not closing the gap

The Gap can be narrowed … with action in the negotiations
• Minimizing use of surplus emission credits & land use related credits
• Pursuing more ambitious (“conditional”) pledges
The Gap can be bridged … by realizing large potential in each sector
But “lock in” of high emission technologies, structures and processes losing time + opportunities to close the gap.
• Emission reductions by scaling up policies that fulfil local and national self-interest: Saving energy, saving costs, reducing traffic congestion, reducing air pollution …
• Technical potential for reductions in 2020 (17 Gt CO2e /yr ) big enough to close the gap (14 Gt CO2e /yr)
Conclusions

The Emissions Gap Report 2012Where do we need to be in 2020 and beyond?
What do countries need to do to make it happen?
London ♦ 21 November, 2012
Joseph AlcamoChief Scientist, UNEP