
The Emerging Role of Management Information Systems · PDF filemanagement information systems....
265
U.S. Department of Justice National Institute of Corrections The Emerging Role of Management Information Systems
Transcript of The Emerging Role of Management Information Systems · PDF filemanagement information systems....
U.S. Department of Justice
National Institute of Corrections
The Emerging Role of Management
Information Systems

U.S. Department of JusticeNational Institute of Corrections
320 First Street, NWWashington, DC 20534
Morris L. ThigpenDirector
Larry SolomonDeputy Director
George M. KeiserChief, Community Corrections/Prisons Division
Madeline OrtizProject Manager
National Institute of CorrectionsWorld Wide Web Site
http://www.nicic.org

Enhancing Prison Classification Systems:The Emerging Role of Management
Information Systems
Tim Brennan, Ph.D.
David Wells
Jack Alexander, Ph.D.
Northpointe Institute for Public Management, Inc.201 East 17th Street
Traverse City, MI 49684
July 2004
NIC Accession Number: 019687

This report was funded by the National Institute of Corrections Prisons Division under cooperative agree-ment #99P10GIL1 with the Northpointe Institute for Public Management. Points of view or opinions stat-ed in this document are those of the authors and do not necessarily represent the official position or policiesof the U.S. Department of Justice.
iii
We thank the staff of each state department of corrections who responded to our ini-tial project survey. In particular, a strong note of gratitude is due to the seven depart-ments and their staffs for allowing us to visit them and for providing access to theirmanagement information systems. In each case, we received high levels of cooper-ation and input from these departments. It is our hope that this report may be usefulto them and their peers in the ongoing development and implementation taskspertaining to automated classification systems and their underlying informationinfrastructure.
The following persons were the primary contacts in each of these departments: ScottHromas, Director of Research, Colorado Department of Corrections; Fred Roesel,Bureau Chief, Classification and Central Records, and Deloye Henry, CorrectionalProgram Administrator (Administrator for Institutional Classification Automation),Florida Department of Corrections; Stan Repko, Director, Office of Policy and Plan-ning, and Bill Cashel, Assistant Chief, Bureau of Correctional Information andClassification Services, New Jersey Department of Corrections; Teresa Knapp-David, Director, Office of Classification and Movement, New York State Depart-ment of Correctional Services; Robert Brinson, Chief Information Officer, NorthCarolina Department of Correction; Nathaniel Hughes, Division Director, Classifi-cation and Inmate Records, and Meesim Lee, Chief, Offender Information Services,South Carolina Department of Corrections; and James E. Thatcher, Chief of Classi-fication and Treatment, Washington Department of Corrections.
Chris Miller of the Northpointe technical staff and John Carr, Los Angeles CountySheriff’s Department, provided helpful technical advice and reviews that strength-ened the report.
We sincerely acknowledge Dr. Susan Hunter for her commitment to the develop-ment of the literature on classification systems. It was under Susan’s leadership andguidance during her tenure as Chief of the National Institute of Corrections PrisonsDivision that the project described in this report came to fruition.
Finally, we thank Sammie Brown, who served as the project manager, for her con-tinual advice and prompting to reach for excellence in all phases of the project.
AcknowledgmentsAcknowledgments

v
This report examines how information technology (IT) and computational develop-ments may enhance the productivity of prison classification. Classification is datadependent. It requires high-quality data and sufficient computational capacity tomake and evaluate classification decisions. Classification productivity is catego-rized into two main components (efficiency and effectiveness), each with severalsubcomponents. Each component is examined to assess how advances in IT andcomputer power may enhance productivity. Case studies were conducted in sevenprisons that had shown innovations in classification, management information sys-tems, and information technology.
Several conclusions emerged. First, criminal justice databases are slowly becomingmore integrated and classification should gain profoundly from the speed, compre-hensiveness, and integrity of the data. Second, prison classification is showing atrend toward more comprehensive systems, broader information, and multiple goals.This shift will increase the demands on IT for comprehensive data. Third, severalknowledge-structuring software technologies are emerging with the potential tosubstantially improve the classification system. Higher quality data combined withmore powerful classification algorithms may produce a substantial jump in classifi-cation productivity. Several data mining and artificial intelligence techniques arementioned in this context. Fourth, the management of change and innovationremains a challenge, and the final chapter deals with lessons learned regardingimplementation and change management—especially with regard to IT andclassification.
Abstract

vii
Acknowledgments ..............................................................................................iii
Abstract ................................................................................................................v
List of Exhibits ....................................................................................................xi
Executive Summary ..........................................................................................xix
Chapter 1. Current Status of MIS Support for Prison Classification:A Brief Review ....................................................................................................1
Introduction.................................................................................................1
General Status of MISs and IT in Prison Classification.............................2
Critical Data Gaps for Classification and Decisionmaking........................4
MIS Analytical Capacity To Support Policy and Management Analysis .................................................................................5
Primary Goals of This Project ....................................................................6
Conclusion ..................................................................................................7
Chapter 2. MIS Software, IT, and Classification Productivity ......................9
Introduction.................................................................................................9
Prison Classification as “Knowledge Work” ..............................................9
Classification Productivity ........................................................................10
Strategies for Using IT To Improve Classification Productivity ..............10
Conclusion ................................................................................................16
Chapter 3. Offender Classification Roles and Data Requirements .............17
Introduction...............................................................................................17
Trends........................................................................................................17
Changing Roles and Growing Importance of Classification ....................20
Conclusion ................................................................................................24
Contents
Chapter 4. Automated Prison Classification System Features and Functions ....................................................................................25
Introduction...............................................................................................25
Critical Design Components of Automated Classification Systems ........26
General Classification Process Overview .................................................27
System Information Content .....................................................................27
System Functionality ................................................................................49
Outputs and Reports..................................................................................61
Conclusion ................................................................................................67
Chapter 5. Software Design Principles and the User Interface ...................69
Introduction...............................................................................................69
User Interface............................................................................................70
Conclusion ................................................................................................82
Chapter 6. Evaluating Classification MISs .....................................................83
Introduction...............................................................................................83
System Assessment Guide: Definitions ....................................................84
Tabulating the System Assessment Score .................................................84
Instrument Scoring and Definition Guidelines for Outputs and Reports ...............................................................................................84
Tabulating Output/Report System Assessment Score...............................84
Conclusion ................................................................................................95
Chapter 7. Integrating Criminal Justice System MISs ..................................97
Introduction...............................................................................................97
Ad Hoc System Interfaces ........................................................................98
Data Integration Principles .....................................................................101
Integration Components..........................................................................101
viii
Contents

Integration Implementation Strategies ....................................................104
Conclusion ..............................................................................................105
Chapter 8. New Directions in Classification Factors and Information Content..............................................................................................................107
Introduction.............................................................................................107
Contribution of the MIS to Classification Effectiveness ........................107
Criticisms of Prison Classification Data Coverage.................................108
Classification Types, Goals, and Approaches .........................................109
Weakness of Theory in Internal and External Classification..................122
Conclusion ..............................................................................................123
Chapter 9. Advances in Analytical Capacities of IT To Strengthen Prison Classification ........................................................................................125
Introduction.............................................................................................125
Data Warehouses: Integrated Databases .................................................126
OLAP ......................................................................................................128
Automated Error Analysis: Quality Control of Classification Decisions .................................................................................................130
Data Mining and Advanced Technologies ..............................................133
Conclusion ..............................................................................................138
Chapter 10. Implementing New Technology and Managing Change .........139
Introduction.............................................................................................139
Widespread Innovation: Transitioning to the New World ......................139
Organizational Change Capacity: Key to Success in Managing Change ....................................................................................................142
Key Strategies for Implementation and Change Management ...............144
Conclusion ..............................................................................................153
Notes .................................................................................................................155
ix
Enhancing Prison Classification Systems
References .........................................................................................................157
Appendix A: Washington Department of Corrections Summary ...............165
Appendix B: Florida Department of Corrections Summary.......................175
Appendix C: New Jersey Department of Corrections Summary................191
Appendix D: North Carolina Department of Correction Summary ..........205
Appendix E: South Carolina Department of Corrections Summary .........217
Appendix F: New York Department of Correctional Services Summary ..233
Appendix G: Colorado Department of Corrections Summary ...................245
x
Contents

xi
Exhibit 4–1. General Classification Flow.........................................................28
Exhibit 4–2. Data Dictionary Entry for Data Entry Element “Religion”.........30
Exhibit 4–3. Suicide Prevention Screen (New Jersey DOC)............................31
Exhibit 4–4. Detainer and Warrant History Screen (Washington DOC)..........33
Exhibit 4–5. Demographic Information Intake Screen (Colorado DOC) ........33
Exhibit 4–6. Commitment Order Screen (New Jersey DOC) ..........................34
Exhibit 4–7. Commitment Order Administrative Caseload Screen (New Jersey DOC).......................................................................35
Exhibit 4–8. Custody Classification Screen (Florida DOC) ............................36
Exhibit 4–9. Substance Abuse Assessment/Treatment Priority Screen (Florida DOC)..............................................................................38
Exhibit 4–10. Program Eligibility and Needs Inventory Screen (Northpointe MIS) .......................................................................38
Exhibit 4–11. Sample Bed Identification Screen (New York DOCS) ................39
Exhibit 4–12. Transportation System Menu Screen (South Carolina DOC) .....40
Exhibit 4–13. Transfer Request Screen (South Carolina DOC).........................41
Exhibit 4–14. Inmate Risk and Needs Gang Data Screen (Florida DOC).........42
Exhibit 4–15. Inmate Risk and Needs Screen (Page 1) (Florida MIS) ..............43
Exhibit 4–16. Inmate Risk and Needs Screen (Page 2) (Florida DOC).............43
Exhibit 4–17. Inmate Management Plan Screen (Page 1) (Florida DOC).........45
Exhibit 4–18. Inmate Management Plan Screen (Page 2) (Florida DOC).........45
Exhibit 4–19. Offender Assignment Screen (New Jersey DOC) .......................46
Exhibit 4–20. Substance Abuse Program Participation Screen (Florida DOC)..............................................................................46
Exhibit 4–21. Inmate Status Review Screen (New Jersey DOC).......................48
Exhibit 4–22. Risk Assessment Criminal History Screen (Example) ................50
Exhibit 4–23. Sentence Details Screen (New Jersey DOC)...............................53
List of Exhibits
Exhibit 4–24. Initial Custody Assessment Screen (Northpointe MIS)...............54
Exhibit 4–25. Add Transfer Request Screen (South Carolina DOC).................55
Exhibit 4–26. Bed Summary Screen (South Carolina DOC) .............................56
Exhibit 4–27. Bus Route Summary Screen (South Carolina DOC)...................56
Exhibit 4–28. Inmate Facility Screen (Washington DOC).................................57
Exhibit 4–29. Classification Summary Contact Log Screen (Florida DOC) .....58
Exhibit 4–30. Custody Reclassification Screen (North Carolina DOC) ............60
Exhibit 4–31. Release Notification Status Screen (Washington DOC)..............60
Exhibit 4–32. Required Data Missing Alert Screen (Northpointe MIS)............61
Exhibit 4–33. Data Validity Alert Screen (Northpointe MIS) ............................62
Exhibit 4–34. Agency Staff Output Data Needs ................................................63
Exhibit 4–35. Mainframe to PC Ad Hoc Reporting Schematic (South Carolina DOC) .................................................................66
Exhibit 4–36. Web-Based Ad Hoc Report Generator (North Carolina DOC) ...66
Exhibit 4–37. Web-Based Ad Hoc Report Generator (North Carolina DOC) ...67
Exhibit 5–1. Advantages and Disadvantages of Command-Line Interfaces ....73
Exhibit 5–2. Advantages and Disadvantages of Menus, Toolbars,and Popups...................................................................................74
Exhibit 5–3. Main Menu Screen (New Jersey DOC).......................................75
Exhibit 5–4. Transportation System Menu Screen (South Carolina DOC) .....75
Exhibit 5–5. Inmate Summary Menu Screen (Northpointe MIS) ....................76
Exhibit 5–6. Open/Create Record Menu Screen (Northpointe MIS) ...............76
Exhibit 5–7. Inmate Summary Screen (Northpointe MIS)...............................77
Exhibit 5–8. Toolbar on Commitment Order Screen (New Jersey DOC)........77
Exhibit 5–9. Tab Menu Options on Initial Classification Medical Observations Screen (Northpointe MIS) .....................................77
xii
List of Exhibits

Exhibit 5–10. Popup Menu on Sentence Adjustment Screen (New Jersey DOC).......................................................................78
Exhibit 5–11. Custom Report Builder Wizard (North Carolina DOC)..............78
Exhibit 5–12. Custom Report Builder Add/Remove Variable Wizard (North Carolina DOC) .................................................................79
Exhibit 5–13. Report Output Wizard Screen (North Carolina DOC) ................79
Exhibit 5–14. Offender Summary Popup Help Screen (Northpointe MIS) .......80
Exhibit 5–15. Housing Screen With OOUI (Northpointe MIS).........................82
Exhibit 6–1. Activities and Organizational Levels for MIS/Classification System Analysis ...........................................................................83
Exhibit 6–2. Scoring Definitions for MIS/Classification System Assessment ......................................................................85
Exhibit 6–3. System Assessment Guide: MIS Classification-Related Functions......................................................................................86
Exhibit 6–4. Scoring Definitions for Outputs/Reports .....................................91
Exhibit 6–5. System Assessment Guide: Outputs/Reports...............................92
Exhibit 7–1. Interagency Data Transfer Examples...........................................99
Exhibit A–1. WDOC Population, by Commitment Crime and Sentence Length: September 30, 2000......................................................167
Exhibit A–2. OBTS Detainer/Warrant History Screen (Washington DOC) ...169
Exhibit A–3. OBTS Inmate/Facility Screening Screen...................................171
Exhibit A–4. Minimum Custody Placement Overrides...................................173
Exhibit A–5. Contribution to Initial Custody Classification, by Factor:January 1, 1997, Through June 30, 1997 ..................................174
Exhibit A–6. WDOC Population, by Initial Custody Classification,Subsequent Infractions, and Time to Second Infraction:1996............................................................................................174
Exhibit B–1. Substance Abuse Priority Screen (Florida DOC) ......................178
Exhibit B–2. Inmate File Review Screen (Florida DOC) ...............................178
xiii
Enhancing Prison Classification Systems
Exhibit B–3. Custody Classification Screen (Florida DOC) ..........................179
Exhibit B–4. Classification Contact Log Screen (Florida DOC)....................180
Exhibit B–5. Classification Appointment Log Screen (Florida DOC) ...........181
Exhibit B–6. Inmate Risk and Needs Gang Data Screen (Florida DOC).......183
Exhibit B–7. Offender Management Comments Screen (Florida DOC) ........183
Exhibit B–8. Inmate Risk and Needs Assessment Screen (Part 1) (Florida DOC)............................................................................184
Exhibit B–9. Inmate Risk and Needs Assessment Screen (Part 2) (Florida DOC)............................................................................184
Exhibit B–10. Inmate Management Plan Screen (Part 1) (Florida DOC) ........185
Exhibit B–11. Inmate Management Plan Screen (Part 2) (Florida DOC) ........187
Exhibit B–12. Offender Management Comments Screen (Florida DOC) ........188
Exhibit B–13. Inmate Program Description Screen (Florida DOC) .................188
Exhibit B–14. Substance Abuse Program Participation Screen (Florida DOC)............................................................................188
Exhibit B–15. Program Enrollment by Inmate Screen (Florida DOC).............189
Exhibit C–1. Main Menu, Booking Submenu Screen (New Jersey DOC).....194
Exhibit C–2. Main Menu, Classification Submenu Screen (New Jersey DOC).....................................................................195
Exhibit C–3. Booking Assign Offender Demographics Screen (New Jersey DOC).....................................................................195
Exhibit C–4. Admission Details Screen (New Jersey DOC) ..........................196
Exhibit C–5. Inmate Profile Codes Configuration Screen (New Jersey DOC).....................................................................196
Exhibit C–6. Physical-Marks, Field Code Popup Screen (New Jersey DOC).....................................................................197
Exhibit C–7. Medical Intake Suicide Assessment Screen (New Jersey DOC).....................................................................198
Exhibit C–8. Commitment Order Offenses, Offender Sentences Screen (New Jersey DOC).....................................................................198xiv
List of Exhibits
Exhibit C–9. Commitment Order Debits/Credits Screen (New Jersey DOC).....................................................................199
Exhibit C–10. Sentence Details Screen (New Jersey DOC).............................200
Exhibit C–11. Offender Sentence Adjustment Screen (New Jersey DOC) ......200
Exhibit C–12. Sentence Adjustment Field Code Popup Screen (New Jersey DOC).....................................................................201
Exhibit C–13. Case Review Screen (New Jersey DOC)...................................201
Exhibit C–14. Offender Work/Program Assignment Screen (New Jersey DOC).....................................................................202
Exhibit C–15. E-Mail Messaging Screen (New Jersey DOC) ..........................203
Exhibit C–16. Multitransaction Look-Up Screen (New Jersey DOC)..............203
Exhibit D–1. Offender Population Unified System (OPUS) Overview (North Carolina DOC) ...............................................................208
Exhibit D–2. Inmate Sentence Structure, Unaudited Flag Screen (North Carolina DOC) ...............................................................209
Exhibit D–3. External Movements Screen (North Carolina DOC).................209
Exhibit D–4. Custody Reclassification Screen (North Carolina DOC) ..........210
Exhibit D–5. Gain/Loss History Screen (North Carolina DOC).....................211
Exhibit D–6. Inmate Summary Record Screen (North Carolina DOC)..........211
Exhibit D–7. Detainers/Custody Actions Screen (North Carolina DOC) .......212
Exhibit D–8. NCDOC Web Site Offender Information Main Menu ..............212
Exhibit D–9. ASQ Main Menu (North Carolina DOC) ..................................213
Exhibit D–10. ASQ Select Conditions Screen (North Carolina DOC).............214
Exhibit D–11. Select Offender Variables Screen (North Carolina DOC) .........214
Exhibit D–12. Select Variable Values Screen (North Carolina DOC)...............215
Exhibit D–13. Report Output Screen (North Carolina DOC) ...........................215
Exhibit D–14. Select Variables Screen (North Carolina DOC).........................216
xv
Enhancing Prison Classification Systems

Exhibit D–15. Report Output Screen (North Carolina DOC) ...........................216
Exhibit E–1. Transportation System Menu (South Carolina DOC) ...............220
Exhibit E–2. Add a Transfer Request Screen (South Carolina DOC)............221
Exhibit E–3. Add Transfer Request: Medical Appointment Screen (South Carolina DOC) ...............................................................221
Exhibit E–4. List of Inmates With Active Transfer Requests Screen (South Carolina DOC) ...............................................................222
Exhibit E–5. Bed Summary Screen (South Carolina DOC) ...........................222
Exhibit E–6. Approval of a Transfer Request Screen (South Carolina DOC) ...............................................................223
Exhibit E–7. Bus Route Summary Screen (South Carolina DOC).................223
Exhibit E–8. Pickup/Dropoff Report Screen (South Carolina DOC) .............224
Exhibit E–9. Create a Scenario Screen (South Carolina DOC)......................225
Exhibit E–10. Create a Choice Screen (South Carolina DOC) ........................226
Exhibit E–11. Create a Rule, Static Data Screen (South Carolina DOC) ........226
Exhibit E–12. Create a Rule, Dynamic Data Screen (South Carolina DOC) ...............................................................227
Exhibit E–13. Create a Rule, Static and Dynamic Qualifiers Screen (South Carolina DOC) ...............................................................228
Exhibit E–14. Classify, Select Report Type Screen (South Carolina DOC) ....228
Exhibit E–15. Classify Report Output Screen (South Carolina DOC).............229
Exhibit E–16. Classify, Drill-Down Feature Screen (South Carolina DOC) ...229
Exhibit E–17. Classify, Report Output Option Screen (South Carolina DOC) ...............................................................230
Exhibit E–18. Classify, Report Output Charting Screen (South Carolina DOC) ...............................................................230
Exhibit E–19. Simulation Scenario Options Screen (South Carolina DOC)....231
Exhibit E–20. Simulation Report Output Screen (South Carolina DOC) ........232
xvi
List of Exhibits

Exhibit F–1. NYDOCS Population, by Commitment Crime and Sentence Length: September 30, 2000......................................................235
Exhibit F–2. Separation System Overview Screen (New York DOCS) .........237
Exhibit F–3. Separation System Relationship Identification Screen (New York DOCS) .....................................................................238
Exhibit F–4. Separation System Comment Screen (New York DOCS) .........238
Exhibit F–5. Separation Referral Form (New York DOCS) ...........................239
Exhibit F–6. Separation System Access Levels (New York DOCS) ..............240
Exhibit F–7. Disciplinary Incident Summary Screen (New York DOCS) .....241
Exhibit F–8. Initial Security Classification Production (New York DOCS) .....................................................................242
Exhibit F–9. Outstanding Transfer Orders Report (New York DOCS) ..........243
Exhibit F–10. Report Showing Inmates Without Automated Initial Security Classification Guidelines (New York DOCS)............................243
Exhibit F–11. NYDOCS Population, by Security Classification and Type of Facility: December 11, 2000......................................................244
Exhibit G–1. CODOC Population, by Commitment Crime:June 30, 1999 .............................................................................247
Exhibit G–2. Admission Data Summary, Criminal History Felonies and Misdemeanors (Colorado DOC)................................................249
Exhibit G–3. Admission Data Summary, Escape History (Colorado DOC) ........................................................................249
Exhibit G–4. Admission Data Summary, Mittimus (Colorado DOC) ............250
Exhibit G–5. CODOC Initial Classification Audit ..........................................251
Exhibit G–6. CODOC Initial Classification Production Process ....................252
Exhibit G–7. Master Program Schedule Screen (Colorado DOC)..................254
Exhibit G–8. Master Program Scheduling Quota Screen (Colorado DOC) ........................................................................254
xvii
Enhancing Prison Classification Systems
xix
Overview and Goals
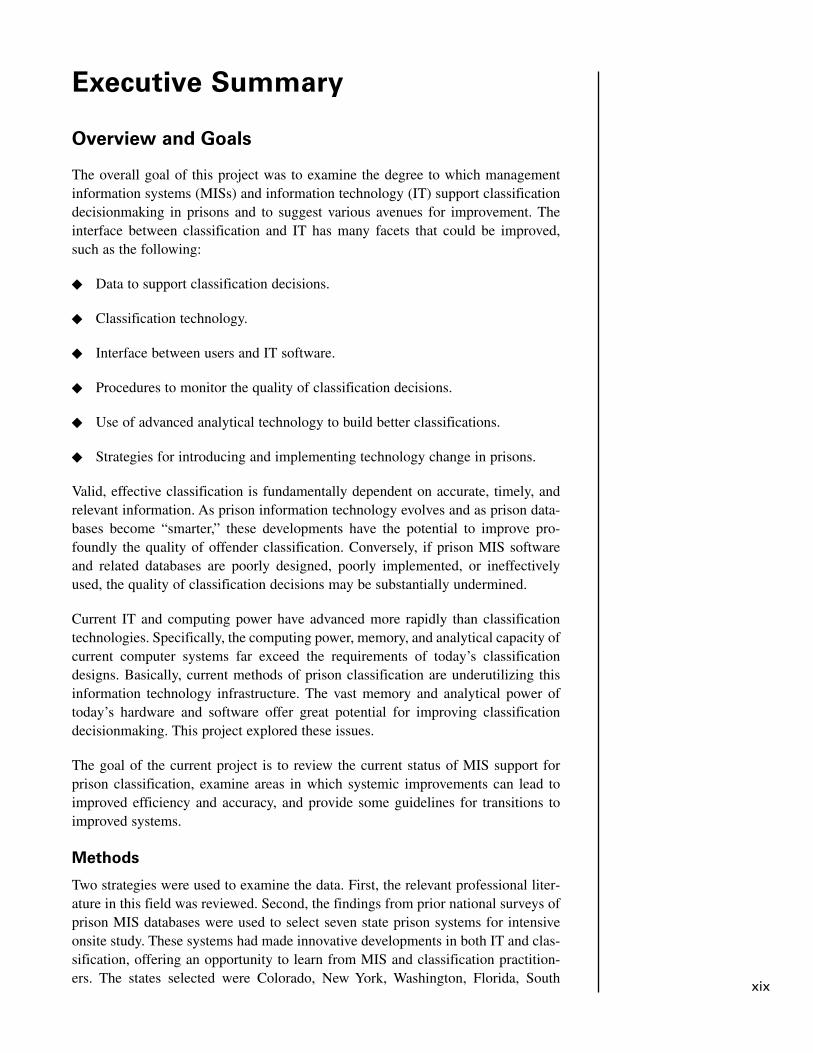
The overall goal of this project was to examine the degree to which managementinformation systems (MISs) and information technology (IT) support classificationdecisionmaking in prisons and to suggest various avenues for improvement. Theinterface between classification and IT has many facets that could be improved,such as the following:
� Data to support classification decisions.
� Classification technology.
� Interface between users and IT software.
� Procedures to monitor the quality of classification decisions.
� Use of advanced analytical technology to build better classifications.
� Strategies for introducing and implementing technology change in prisons.
Valid, effective classification is fundamentally dependent on accurate, timely, andrelevant information. As prison information technology evolves and as prison data-bases become “smarter,” these developments have the potential to improve pro-foundly the quality of offender classification. Conversely, if prison MIS softwareand related databases are poorly designed, poorly implemented, or ineffectivelyused, the quality of classification decisions may be substantially undermined.
Current IT and computing power have advanced more rapidly than classificationtechnologies. Specifically, the computing power, memory, and analytical capacity ofcurrent computer systems far exceed the requirements of today’s classificationdesigns. Basically, current methods of prison classification are underutilizing thisinformation technology infrastructure. The vast memory and analytical power oftoday’s hardware and software offer great potential for improving classificationdecisionmaking. This project explored these issues.
The goal of the current project is to review the current status of MIS support forprison classification, examine areas in which systemic improvements can lead toimproved efficiency and accuracy, and provide some guidelines for transitions toimproved systems.
Methods
Two strategies were used to examine the data. First, the relevant professional liter-ature in this field was reviewed. Second, the findings from prior national surveys ofprison MIS databases were used to select seven state prison systems for intensiveonsite study. These systems had made innovative developments in both IT and clas-sification, offering an opportunity to learn from MIS and classification practition-ers. The states selected were Colorado, New York, Washington, Florida, South
Executive Summary
xx
Executive Summary
Carolina, North Carolina, and New Jersey (see appendixes A–G for summarydescriptions).
The following sections review the critical areas of the report and summarize themain findings and key issues.
Current Status of MIS and Classification
The current status of prison databases that support classification procedures, usingpertinent findings from the national surveys, is discussed in chapter 1. Althoughsome prison MISs have electronic access to many data elements needed for classi-fication, there is much variation in data access, implementation success, staff expert-ise, and so on. The level of progress is extremely varied across different prisons.
In almost all prison systems, there is a flurry of activity to upgrade IT systems. Thecurrent situation reflects widespread change in both hardware and software. Fur-thermore, many correctional agencies are engaged in similar challenges, such asbuilding integrated criminal justice databases, shifting from older mainframes tomore current hardware and software, and upgrading procedures for data analysisand report generation. Some of the more popular changes include the introductionof internal classification systems, classification instruments and procedures that arevalid for women offenders, reentry classification and risk and needs instruments,and the automation of classification algorithms.
A Framework for Improving Classification Productivity:The
Many Roles of IT
Chapter 2 offers a framework to clarify how IT can enhance the productivity ofclassification. Productivity of classification is separated into two overlappingdimensions:
• Effectiveness: The quality, usefulness, and validity of classification decisions.
• Efficiency: How available prison resources (staff, computers, etc.) are managedand used. Includes ease of use, speed of operations, effective use of staff skills,ease of learning, ease of navigating screens, and so on.
IT is deeply implicated in supporting both dimensions of productivity. Improve-ments in memory capacity, analytical procedures, software interface, and so on, canenhance each dimension.
The Many Functions of Prison Classification:Their Diverse
Information Requirements
To clarify the information requirements of prison classification, professionals mustfirst understand the multiple functions of these classification systems. A narrow oroversimplified perspective on the purposes of classification may result in overlook-ing key data requirements. Thus, chapter 3 reviews the general purposes of prisonclassification and examines the information requirements of each purpose.

xxi
Enhancing Prison Classification Systems
Prison MISs/databases must provide sufficient data coverage of key results variablesto support data acquisition functions and the analytical procedures to produce use-ful management reports. Each major prison goal (e.g., public or prisoner safety,equity, discipline) is linked to classification processes that require the measurementof specific data elements for each unit of time. The data form the foundation fornumerous management reports that support planning, results monitoring, and poli-cy analysis. Managers must understand fully the classification functions to ensurethat the MIS is not underutilized or only partially implemented.
Features and Functions of an Automated Prison Classification
Chapter 4 provides a detailed examination of the various features and functions ofan automated prison classification system. It is largely based on the various site vis-its to the seven selected prison systems. It describes numerous innovations and pro-cedures that are incorporated into these prisons’ MIS and software used to supportclassification operations. This chapter also presents a description of a generic sys-tem workflow for prison classification that is common to all prison classificationoperations. Advances in MIS technology have expanded the options for organizing,viewing, retrieving, and reporting data required for day-to-day line staff and man-agement decisions. Current MIS software can empower staff with the ability to cre-ate and revise statistical reports as needed, given that system features and functionsare responsive to user needs and the particular circumstances in play at the individ-ual agency. Training and competence building are critical to user development of adeeper understanding of statistical reports and the issues of valid measurement.Increased competence and more powerful and accessible software should encourageprison managers to make greater use of these reporting capabilities, stay betterinformed, and be more effective in meeting agency objectives.
Interface Designs and Basic Principles
Chapter 5 reviews software interface designs for automated classification and sup-porting MIS functions. Many prisons are engaged in a paradigm shift from oldercommand-driven interfaces to “friendlier” graphical user interfaces (GUIs). In manyprison systems, classification staff may identify problems in the user interface (e.g.,screen designs, navigation procedures) and can recommend revisions or modifica-tions. Interface design is critical as it can either support efficiency or be cumber-some for users.
Computer technology drives user-interface (UI) design. One danger of recentadvances is that they may force humans to use unnatural cognitive processes. Manyproblems with modern UI designs appear to originate from well-intentioned, intel-ligent, and capable software engineers’ attempts to improve approaches that areinconsistent with how people think and operate. A refocus on user goals and work-ing styles seems to be the essence of recent advances (Cooper, 1995). Whereas theuser must focus on job-related tasks, the software designer must look beyond theseto identify the user’s goals. The design process for supporting prison classificationwork should respond to goals, user patterns and needs, and requirements for dataintegrity, portability, and learnability.
xxii
Executive Summary
These requirements vary widely in different prison contexts and from application toapplication. The software designer must explore these user-centered stipulations. Ina prison context, the driving force behind the design of new software must be thegoals of its users (prison line staff, operations managers, administration, policy-makers, and planners). Recently developed software innovations that support prisonclassification suggest that user-centered and graphical/visual interfaces should con-tinue to be incorporated into MIS software, although clearly these advances are in astate of rapid evolution and vary widely across prisons.
Designing a Self-Evaluation Assessment Chart
Chapter 6 focuses primarily on classification software. It presents a self-evaluationassessment chart that can be used to rate the comprehensiveness, functionality, andusability of a prison’s current MIS and classification software and thus to provideprison systems with a practical evaluation tool to guide their assessment of theirown systems.
Challenge of Building Integrated Criminal Justice Databases
Many prison systems are currently engaged in integrating various databases fromdifferent criminal justice agencies. This issue is one of the current major changesthat is engaging the time and energy of MIS staff and administrators. Such integra-tion aims to produce more comprehensive data, reduce redundant data entry, andensure higher data integrity. All of these are critical for classification operations.Chapter 7 describes this challenge and offers a strategy for integration. Barriers tointegration are identified through examples of agency autonomy and mistrust, diver-gent coding procedures, different levels of development of automation, and the useof different computer vendors. Techniques for data exchange are reviewed. Finally,several principles of data integration are discussed in the context of prisonclassification.
The fundamental advantage of database integration from the perspective of classifi-cation decisionmaking is increased accessibility of key data elements to classifica-tion staff. Cross-verification of risk and needs data is also aided by the ability totransfer data electronically. Thus, the emergence and development of integratedinteragency databases have tremendous potential for strengthening the integrity andcoverage of classification data, which in turn strengthens the predictive validity andusefulness of prison classifications.
Individual criminal justice agencies can no longer simply maintain their own isolat-ed MIS needs without also considering integration with other agencies. The crimi-nal justice system is a continuum of offender-based information processes thatoperate more efficiently when linked together. The traditional approach of main-taining a series of disconnected and independent databases has consistently led toinformation processing bottlenecks. Integrated information systems seem inevitableand hold particular promise for prison classification and all other forms of criminaljustice data integration and analysis. Classification and risk assessment units in jails,

xxiii
Enhancing Prison Classification Systems
prisons, probation, and parole are in a key position because they have been the focusof information integration efforts. In this role, classification and assessment havealready grappled with many of the issues that are involved in assessing data integri-ty, verification processes, and the integration of diverse data elements in makinghigh-risk decisions regarding offenders.
The final three chapters of this report propose improvements in three critical areasto strengthen prison classification systems.
New Directions in Classification Factors
Classifications can be vastly improved by selecting more valid and relevant classi-fication factors. Chapter 8 addresses the problem of finding more powerful, valid,and relevant classificatory information for prison classifications. The MIS databaseis critical in providing the relevant classification factors. A database becomes“smarter” to the degree that it contains relevant classification factors and eliminatesirrelevant factors.
Current prison classification systems have been criticized for oversimplification andnarrowness of their information coverage and for the use of irrelevant factors. Addi-tionally, different prison classification systems (external classification, internal clas-sification, reclassification, community reentry classification) have quite differentpurposes and may require different risk factors. The chapter reviews the informationrequirements and emerging trends in selecting variables for these classificationfunctions. Several specific systems for internal and community reentry classifica-tion are evaluated, including the Adult Internal Management System, the Level ofService Inventory, the Client Management Classification, the system for Correc-tional Offender Management Profiling for Alternative Sanctions, Megargee’s Min-nesota Multiphasic Personality Inventory (MMPI) typology, and others. Eachmethodology is evaluated for validity and reliability.
Although there is movement toward more comprehensive classification systems andmore powerful predictive and explanatory factors, most prison systems have a longway to go in the search for optimal classification factors. The more powerful mem-ories and fast search procedures of today’s computers and MISs will enhance theability of classification procedures to use multiple factors and support the increasedinformation content of emerging classification routines. This increased technicalcapacity should promote the discovery of and convergence on more powerful clas-sification factors.
Prison classification is in an exploratory phase of searching for more comprehensiveand effective classification factors. The United States may be at the thresholdof considerable development of more effective prison classifications. The conver-gence of richer and more informative databases, coupled with a great rise in the ana-lytical power of computer systems, should accelerate the design of effective prisonclassifications.
xxiv
Executive Summary
New Directions in the Analytical Capacity of Prison MISs
In addition to improved risk factors, another vibrant area of innovation is the devel-opment of improved analytical capacity of the MIS. The computational power ofcomputers has evolved dramatically, offering many opportunities to improve theways in which classification data are organized with far more powerful analytic,graphical, and reporting capacities. Chapter 9 discusses advances in these areas.Many of these were being implemented in the prison systems selected for this study.Specifically, innovative developments in the following areas are discussed:
� The emergence of the data warehouse concept: To improve the comprehensive-ness, scope, and validity of databases.
� Online Analysis and Programming (OLAP): To improve production and dis-semination of management reports.
� Automated error analysis: To track quality control of classification decisions.
� Data-mining and artificial intelligence procedures: To provide more sophisti-cated methods to create predictive and other kinds of classification systemsoptimized for particular correctional decision needs.
Examples of all of the above technologies are given to illustrate their applicabilityin improving prison classification.
Building Strategies for Change Management When Introducing
New Information Technologies
The rapid evolution of information processing hardware and the constant flurry ofprison software innovation in IT place a premium on the change-management skillsof managers. Unfortunately, many prisons have considerable difficulty in effective-ly implementing new information technologies. Thus, it is critical that technicalinnovations are introduced in a careful and effective manner. Chapter 10 develops aframework and guidelines for management of technical change in correctional con-texts. Using the general literature on change management (with special reference toIT) and lessons learned from the seven prisons studied in this project, this chapterdescribes four stages of implementation and numerous subtasks in each. These maybe useful to prison managers in achieving more successful implementation of newIT hardware or software to build an excellent information infrastructure for prisonclassifications.
Key elements in change management include developing an implementation teamto identify key issues and garner the support of staff and management for thechange, addressing organizational capacity for change, planning adequate overlapof systems to ensure a smooth transition, securing staff feedback and incorporatingimprovements on an ongoing basis, and assessing the success of the changes interms of increased efficiency and goal attainment. The prisons that were selected forstudy in this project employed many of these strategies, which contributed to their
xxv
Enhancing Prison Classification Systems
success in the process of transition and to the continued high level of functioning oftheir MIS and classification operations.
Recommendations and Conclusions
Recommendations presented in detail in the chapters converge on several maingoals that are critical to the rapid evolution of correctional classification procedures:
� To upgrade the quality, coverage, and salience of classification data.
� To upgrade the computational methods used to build classification systems.
� To upgrade the statistical and graphics reporting software for correctional man-agers to analyze their databases and “mine” them for more effective manage-ment reports focused on their information needs.
For example, the authors recommend the use of a broader set of correctional dataand risk factors that characterize recent classification systems. The search for morecomprehensive and salient classification variables, however, must be guided bydevelopments in criminological theory and evaluation research. To manage theseexpanded data, the authors recommend the implementation of data warehouses,faster search engines, faster computer processing, and more intuitive GUIs. In chap-ter 9, the authors recommend the use of several advanced data analytic techniquesto allow more productive use of these databases both for making classification deci-sions and for monitoring the quality and impact of these decisions. Several data ana-lytic advances are recommended, including advances in OLAP, data-miningtechniques of particular relevance to classification (e.g., inductive decision trees andadvanced clustering methods), and more effective management reporting and analy-sis software.
Current Status of MIS Support forPrison Classification: A Brief Review
Introduction
This project examines the ways in which information technology (IT) and manage-ment information systems (MISs) can enhance classification procedures in prisonsand other adult correctional agencies. Classification is central in guiding decision-making for many aspects of offender processing. In its decision-support function,classification is highly dependent on the quality and timeliness of data. An exami-nation of how the prison information infrastructure supports classification decisionsrevealed that this infrastructure retains many embedded conventions from the pre-computing era—that is, many practices and procedures reflect manual proceduresand highly simplified classification practices. Some profound inefficiencies andoversimplifications in classification are prevalent. This situation implies tremendousopportunities for change. The United States is perhaps in the early stages of a waveof innovation in using IT to help support the more complex classifications and deci-sionmaking that are required to run correctional agencies in an efficient and ethicalmanner.
This chapter briefly reviews the main findings of several recent national studies onthe current status of prison MISs and emphasizes the critical importance of automa-tion for prison classification. An MIS supports classification in many ways, includ-ing retrieval of key classification risk and needs factors and other relevantinformation, and is critical for several other functions (e.g., special keep-separatealerts and warnings, efficient data entry, automation of classification algorithms) fordaily tracking and monitoring of inmates and for documenting decisions. Classifi-cation, in turn, drives many subsidiary processing decisions such as those pertain-ing to bed placement, housing, disciplinary procedures, scheduling and alerts,transportation arrangements, and release dates.
Classification procedures depend on the MIS/IT system for the quality, scope, andtimeliness of data. Improvements in the information infrastructure can enhance theproductivity of classification in both efficiency (increasing speed) and validity(fewer classification errors). The system should also support staff’s ability to mon-itor whether their classification decisions are implemented in accordance with pol-icy and provide data with which to evaluate the general impact of classificationdecisions on the overall functioning of the prison.
oneChapter
1

“Although it has long
been considered
problematic, many
states used classifica-
tion systems that had
not been validated for
women offenders.”
Analytical restrictions
and data gaps weaken
the degree to which
an MIS can support
case-level classifica-
tion decisions or pro-
vide the statistical
analysis to support
management in
strategic planning and
results monitoring.
A recent national survey of prison systems in all 50 states examined whether theirMISs could provide the needed data for classification decisions (National Instituteof Corrections [NIC], 1999). A related survey by the Bureau of Justice Statistics(BJS) in 1998 also examined the data coverage in these state prison systems. Thesesurvey findings provide an important background to the present study. The sectionsbelow summarize the main findings from these surveys regarding prison MISs andIT in their ability to support classification procedures (NIC, 1999; BJS, 1998;Fowler, 1999). (See also Hardyman et al., 2002.)
General Status of MISs and IT in Prison Classification
A consensus finding of these reports was that the overall impact and effectivenessof IT in prisons and corrections in general have so far not met expectations. Fowler(1999) suggested that IT in many correctional agencies is restricted to word pro-cessing and data entry and retrieval on a case-by-case basis, using unconnecteddatabases and often obsolete hardware. She acknowledged that, although updatedsoftware and more powerful computers are being continually introduced, theseinvestments often have little impact on critical decisions regarding offenders. The1999 NIC survey results were consistent with these findings and confirmed thatmany items of data that are critical for classification are still collected and storedmanually or are often missing and that many systems have a very limited ability toproduce management and statistical reports for analyzing the impact and results ofclassification functions.
Several major observations are described below.
Developmental Lag in Corrections
A common observation is that IT and MISs in corrections have lagged behind par-allel systems in law enforcement and the courts (Fowler, 1999). The 1999 NICreport, although identifying several excellent prison MISs, generally supportedFowler’s comment regarding developmental lag. This lag, in part, results from cor-rectional priorities of security, control, and transactional processing of individualoffenders rather than management or analytical functions (see Hardyman et al.,2002).
Aging or Obsolete Mainframe Systems
Many state prison systems struggle with dated and inefficient mainframe systemsand “unfriendly” software. A generic problem for these older systems is that theescalation of demands for aggregated analyses, broader data requirements, andmany new functions have accrued over time. These older systems, in manyinstances, have reached their performance limits and now require substantialupgrades; the alternative is to abandon them because they are too expensive to main-tain and too limited in their functionality.
2
Chapter 1
Absence of Automated Classification
The NIC (1999) survey reported that only 19 state departments of corrections(DOCs) had automated the computation of inmates’ classification scores. Automa-tion saves staff time, reduces errors, and produces greater consistency in classifica-tion decisions. Yet these functions are done manually in most prisons. Automatedcomputation of classification scores has been implemented successfully in most ofthe systems identified for this study (see appendixes). These systems were in Col-orado, Florida, Illinois, Minnesota, New York, New Jersey, North Carolina, Okla-homa, Oregon, South Carolina, Vermont, and Washington (NIC, 1999).
Development of MISs and IT
To counterbalance the problems previously described, the NIC (1999) and BJS(1998) surveys emphasized the rapid development that currently characterizes mostprison MISs/IT systems. The 1999 NIC report, for example, indicated that virtuallyall state prison systems were planning upgrades to both hardware and MIS software.This drive to improve IT was occurring equally in those systems that were laggingand in systems that had already introduced advanced automation and IT.
Variability Across Prison Systems
Another finding was great variability in automation and MIS/IT capacities acrossprisons. The 1999 NIC survey found much variation in the ability of each prisonsystem’s MIS to provide critical data, in relative analytical capacity, in the ability toproduce management reports, and in staffs’ ability to use IT procedures. For exam-ple, some prison systems had only partially automated their manual files and werefocused on individual case tracking. At the other extreme, some systems had com-prehensive coverage of key data, effective inmate tracking, a broad range of man-agement reports, and sophisticated analytical procedures.
In many cases, the automation of manual procedures perpetuated inefficient andineffective approaches (e.g., inadequate coding, oversimplified classification algo-rithms). Essentially, design flaws in and inadequacies of traditional manual proce-dures were embedded in new, automated IT software without critical review.
Data Integration Across Justice Agency Databases
A challenge in many state prison systems is to exchange data with and receive datafrom other justice agency databases, minimize redundant data entry, and build morecomprehensive databases. This can enhance efficiency of data collection, increaseaccuracy, and reduce classification errors. The 1999 NIC survey showed that staff inmany prison systems must reenter many critical data elements that had already beencollected for paper records. Among the more disturbing findings from a classifica-tion perspective was that only 16 DOCs indicated that they received criminal histo-ry data electronically from other criminal justice agencies and that only 28 DOCswere able to download data from the National Crime Information Center (NCIC)
3
Current Status of MIS Support for Prison Classification: A Brief Review
National Criminal History System. Data integration across diverse criminal justicedatabases is a high priority for many state prison systems (NIC, 1999, p. 6).
Critical Data Gaps for Classification andDecisionmaking
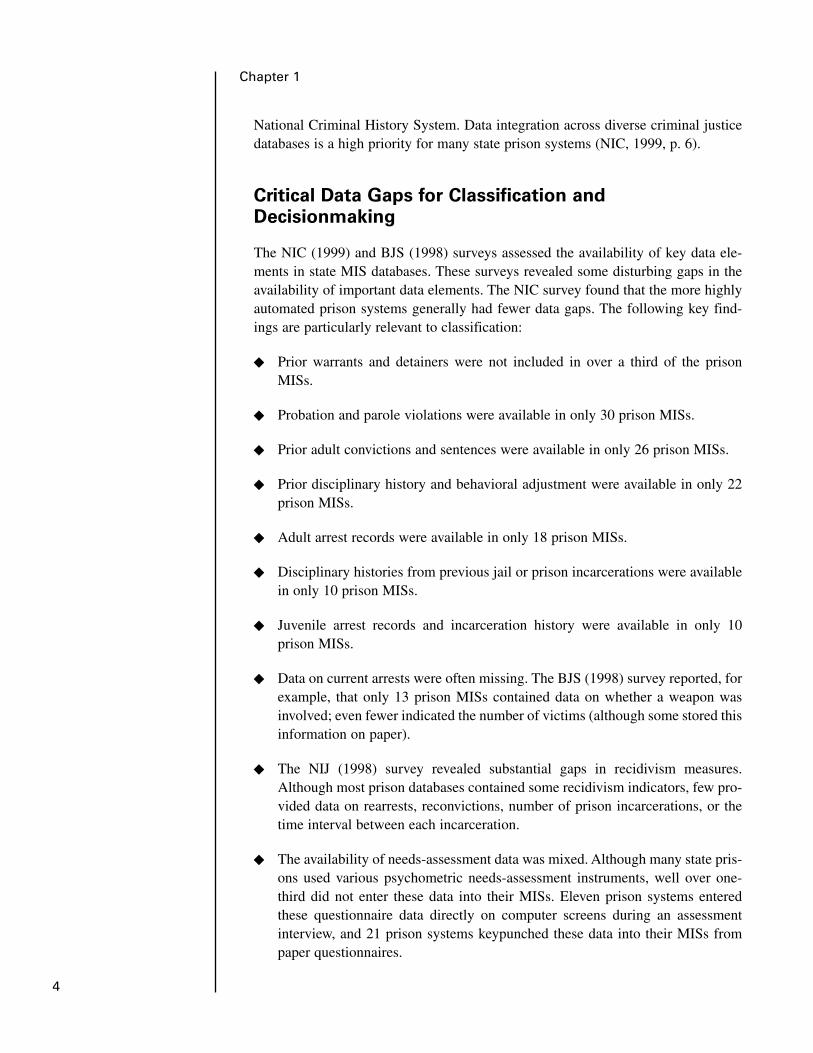
The NIC (1999) and BJS (1998) surveys assessed the availability of key data ele-ments in state MIS databases. These surveys revealed some disturbing gaps in theavailability of important data elements. The NIC survey found that the more highlyautomated prison systems generally had fewer data gaps. The following key find-ings are particularly relevant to classification:
� Prior warrants and detainers were not included in over a third of the prisonMISs.
� Probation and parole violations were available in only 30 prison MISs.
� Prior adult convictions and sentences were available in only 26 prison MISs.
� Prior disciplinary history and behavioral adjustment were available in only 22prison MISs.
� Adult arrest records were available in only 18 prison MISs.
� Disciplinary histories from previous jail or prison incarcerations were availablein only 10 prison MISs.
� Juvenile arrest records and incarceration history were available in only 10prison MISs.
� Data on current arrests were often missing. The BJS (1998) survey reported, forexample, that only 13 prison MISs contained data on whether a weapon wasinvolved; even fewer indicated the number of victims (although some stored thisinformation on paper).
� The NIJ (1998) survey revealed substantial gaps in recidivism measures.Although most prison databases contained some recidivism indicators, few pro-vided data on rearrests, reconvictions, number of prison incarcerations, or thetime interval between each incarceration.
� The availability of needs-assessment data was mixed. Although many state pris-ons used various psychometric needs-assessment instruments, well over one-third did not enter these data into their MISs. Eleven prison systems enteredthese questionnaire data directly on computer screens during an assessmentinterview, and 21 prison systems keypunched these data into their MISs frompaper questionnaires.
4
Chapter 1
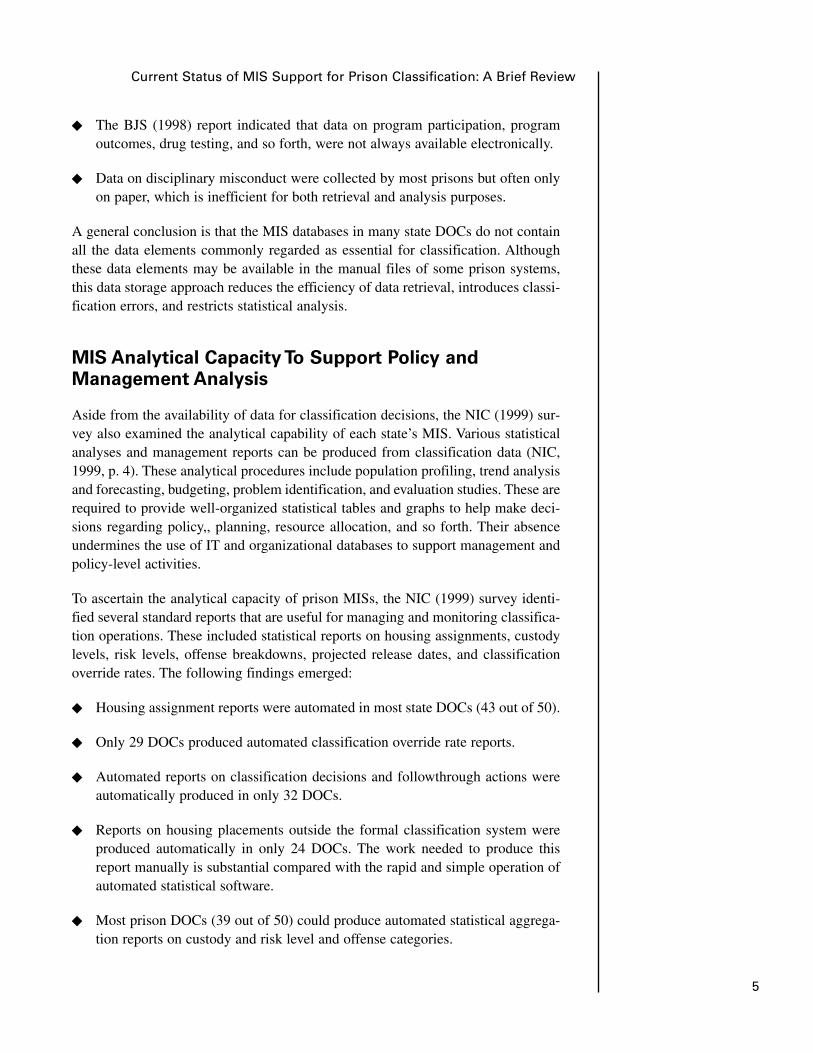
� The BJS (1998) report indicated that data on program participation, programoutcomes, drug testing, and so forth, were not always available electronically.
� Data on disciplinary misconduct were collected by most prisons but often onlyon paper, which is inefficient for both retrieval and analysis purposes.
A general conclusion is that the MIS databases in many state DOCs do not containall the data elements commonly regarded as essential for classification. Althoughthese data elements may be available in the manual files of some prison systems,this data storage approach reduces the efficiency of data retrieval, introduces classi-fication errors, and restricts statistical analysis.
MIS Analytical Capacity To Support Policy andManagement Analysis
Aside from the availability of data for classification decisions, the NIC (1999) sur-vey also examined the analytical capability of each state’s MIS. Various statisticalanalyses and management reports can be produced from classification data (NIC,1999, p. 4). These analytical procedures include population profiling, trend analysisand forecasting, budgeting, problem identification, and evaluation studies. These arerequired to provide well-organized statistical tables and graphs to help make deci-sions regarding policy,, planning, resource allocation, and so forth. Their absenceundermines the use of IT and organizational databases to support management andpolicy-level activities.
To ascertain the analytical capacity of prison MISs, the NIC (1999) survey identi-fied several standard reports that are useful for managing and monitoring classifica-tion operations. These included statistical reports on housing assignments, custodylevels, risk levels, offense breakdowns, projected release dates, and classificationoverride rates. The following findings emerged:
� Housing assignment reports were automated in most state DOCs (43 out of 50).
� Only 29 DOCs produced automated classification override rate reports.
� Automated reports on classification decisions and followthrough actions wereautomatically produced in only 32 DOCs.
� Reports on housing placements outside the formal classification system wereproduced automatically in only 24 DOCs. The work needed to produce thisreport manually is substantial compared with the rapid and simple operation ofautomated statistical software.
� Most prison DOCs (39 out of 50) could produce automated statistical aggrega-tion reports on custody and risk level and offense categories.
5
Current Status of MIS Support for Prison Classification: A Brief Review

� Bedspace projections using statistical procedures were automated in only 13systems.
� Automated reports and calculations on projected release dates were generatedelectronically in 36 DOCs. These calculations incorporate anticipated creditsfor good time, program participation, and other key factors. These projectionsare of great value in helping to predict facility population size over time.
The reports selected in the NIC (1999) survey clearly did not cover all possiblereports being produced by state prison MISs. The survey nonetheless offers a broadprogress indicator of the states’ ability to generate MIS statistical reports andreflects the analytical capacity of these systems. The report also noted that moststates were engaged in active planning to develop additional statistical managementreports and to upgrade their statistical and analytical capacity.
Primary Goals of This Project
The general goal of this project is to explore the ways in which IT and MIS soft-ware can enhance the productivity of prison classification functions. This explo-ration may require rethinking current classification approaches and procedures totake advantage of increases in computing power, memory, and analytical capabili-ties. The following points briefly describe the specific goals of this project:
� To learn from successful MISs and classifications in selected state correc-tional systems. Using the findings of the NIC (1999) survey, the authors select-ed several leading state prison systems for site visits. Summary descriptions ofthe systems at these sites illustrate innovative developments in prisoner classi-fication, MISs, and related IT. The aims were to understand the strengths ofthese systems, to learn from their management styles, and to clarify the imple-mentation strategies that produced these innovations. These lessons are set forthin the remaining chapters of this report.
Brief descriptions of these systems cover the technical design, operations, andquality of implementation of classification systems and information infrastruc-tures (see appendixes A–G). The authors emphasize the selection and coverageof data elements used to measure correctional policies and goals related to clas-sification and those used to monitor the impact and success of classification.The capacity of each agency to assess outcomes and performance and to con-duct impact monitoring falls within the evaluation.
� To identify critical processes whereby prison information systems supportclassification. Critical enhancements to a prison MIS that allow it to supportand enhance classification are identified. These enhancements address the fol-lowing topics:
6
Chapter 1

❖ Information requirements of prison classification: Chapter 3 covers basicrequirements (content validity, information coverage, data reliability, veri-fication and auditing, and selection of risk factors).
❖ Self-assessment procedures: Chapter 6 reports on a simple self-assessmentinstrument developed to guide prison managers in evaluating their MIS forquality of classification support.
❖ Implementation strategies for introducing innovative change in IT: Chapter10 integrates lessons learned from the authors’ studies of selected leadingprison systems and from the literature on technological innovation. Thisculminates in an implementation roadmap for prison managers introducingchanges to their MIS/classification procedures.
� To compile key technical advances in the design of comprehensive classifi-cation systems. An additional goal is to suggest state-of-the-art advancementsin the design and development of comprehensive prison classification systems.This project does not focus on pure classification research (i.e., new classifica-tion designs, theoretical models, or statistical approaches to classification).However, it offers a rare opportunity for a systematic evaluation of the techni-cal designs and MIS information infrastructure that support correctional classi-fication. Thus the authors suggest revisions and enhancements to the design ofinformation infrastructures that contribute to the evolution and strengthening ofprison classifications.
Conclusion
This chapter has provided an overview of how management information systemsmay support or undermine decisionmaking processes and offender classification inprisons. The accuracy of decisionmaking regarding criminal offenders profoundlydepends on the quality and completeness of the available information—particularlythe availability of key criminogenic risk factors that have both explanatory and pre-dictive powers regarding offending behaviors.
An overall conclusion of several recent surveys is that the effectiveness of prisondatabases in supporting classification decisions has been weakened by several fac-tors: information gaps, poor integration across criminal justice databases, and, insome cases, a deficient analytical capacity that prevents the available data frombeing modeled and integrated in the most powerful manner. On the other hand, thecurrent situation throughout the criminal justice system is characterized by animpressive development in the understanding of different pathways to crime, theidentification of key factors associated with desistance, and the ending of criminalcareers and improved measurement technologies. Also evident are immense gains incomputer memory capacity, the raw analytical power of databases, and the
7
Current Status of MIS Support for Prison Classification: A Brief Review

emergence of sophisticated statistical and quantitative models that may dramatical-ly enhance predictive and explanatory abilities to support criminal justice decision-making. Basically, criminal justice databases are becoming smarter, with largermemories and more analytical capacity.
8
Chapter 1

MIS Software, IT, and ClassificationProductivity
Introduction
How can MIS software and IT enhance prison classification productivity? Thischapter develops a framework for answering this question. In the past two decades,computing power and memory have advanced far more rapidly than prison classifi-cation procedures. Most classification methods currently used in prisons (and virtu-ally throughout corrections) simply use computers to implement manual techniquesthat emerged in the precomputer era and thus make little use of the computationalpower of today’s IT. The vast organizational databases and analytical capacities ofcurrent prison MISs/IT systems offer great potential for improving classificationmethods and monitoring and evaluating classification decisions.
Prison Classification as “Knowledge Work”
Offender classification is knowledge work that involves gathering and analyzingdata to make decisions and generate new information. Contemporary informationtechnologies, including prison MISs/IT systems, are designed to support the pro-ductivity of knowledge workers. Classification staff compile criminal histories,social histories, risk/needs factors, and other data and then—using both implicitmental models and explicit algorithms (usually linear models)—make classificationdecisions. This requires accessing multiple information sources, integrating diverseinformation, and choosing among alternatives. These practices involve significanthuman cognitive activity. Classification decisions affect offender processing, hous-ing, transfer, treatment, and case management/planning, all of which have crucialimplications for both the offender and the prison. Classification and decision-making are followed by communication, explanations, justifications, and followupsto coordinate decisions across organizational units. These tasks, which often mustbe done quickly and under considerable stress, may cause cognitive overload.
In addition, classification staff must perform more mundane data processing andclerical tasks (e.g., producing reports; completing data entry screens; formatting andprinting documents; and communicating decisions by e-mail, by voice mail, and inwriting). The prison MIS/IT system therefore has numerous features and functionsthat can, depending on whether or not they are used properly, either enhance ordiminish staff levels of productivity and cognitive stress in each of these areas.
twoChapter
9
10
Chapter 2
Classification Productivity
The productivity of classification procedures provides a fundamental basis for real-izing most of a prison’s key correctional goals. The productivity of prison classifi-cation can be analyzed in terms of two broad dimensions. The first is the number ofclassification decisions made per time period by each officer. Officers and classifi-cation departments in different prisons can have quite different productivity rates.Work rates may differ among officers because of factors such as individual skills,training levels, and motivation. However, work rates may also vary based on MIS/ITsupport factors such as human-computer interface and screen design, functionalityof classification software, design of numerical algorithms, and users’ computerskills.
Individual styles of organizing and managing work influence productivity. A highlymotivated officer may search longer and more deeply for critical risk and back-ground factors, engage in more vigilant verification of criminal or social historydata, or conduct more probing classification interviews. This officer expends morecognitive energy, time, and effort and considers more criminological factors in theinformation search. This officer may appear less efficient. In contrast, a classifica-tion officer who oversimplifies the task and makes little use of available IT mayappear more efficient. Clearly, the quantity of classification decisions per unit oftime cannot be the sole criterion of productivity.
The second dimension of classification productivity—the quality, or validity, ofclassification decisions—can have a more profound impact on productivity than thequantity of work. Classification errors and poor decisionmaking can be tremen-dously costly to a prison. Violence against inmates or staff, escapes, disciplinary dis-order, and waste of prison resources can all result from classification errors and theinappropriate commingling of offenders. Poor classification decisions can createmultiple costs that dwarf the initial cost of conducting a careful and valid classifi-cation. For example, a single lawsuit resulting from an erroneous classificationmight involve millions of dollars, consume a huge amount of staff and managementtime, and impose great emotional stress on staff.
Strategies for Using IT To Improve ClassificationProductivity
The two broad dimensions of classification productivity are the following:
� Effectiveness: The quality, utility, or validity of classification decisions.
� Efficiency: Management and use of resources (staff, computers, etc.) for maxi-mum utility.
11
MIS Software, IT, and Classification Productivity
Subsidiary aspects of these two dimensions govern the specific ways in which theproductivity of prison classification officers may be enhanced.
Strategies for Improving Classification Effectiveness
The fundamental validity of classification decisions may be enhanced in severalways. For example, higher accuracy and fewer errors may be achieved by usingmore comprehensive classification factors, more valid factors, and more powerfulclassification algorithms or by enhancing staff skills and providing staff with morepowerful IT tools and technical classification and implementation resources. IT andMISs can enhance the validity of classification decisions by implementing the fol-lowing recommendations:
� Using deeper, more comprehensive, and more valid classification risk factors:Most current prison classification methods, particularly for initial custody andsecurity arrangements, use a very narrow or restricted set of classification fac-tors primarily because most current prison classification methods were devel-oped for manual use and were thus constrained by the limits of humaninformation processing (see Austin, 1993; Brennan, 1987a, 1993; Jones, 1995;Palmer, 1992; Sechrest, 1987). These systems were designed to place minimaldemands on staff for information coverage, search processes, and computation-al complexity. These classification methods have been challenged for theirrestricted choice of risk factors, overly simplistic scoring algorithms, lack ofcomprehensiveness, inadequate depth, and poor validity. Palmer (1992),MacKenzie (1988), Sechrest (1987), and others have been critical of the impov-erished coverage of prevailing prison classification systems for treatment plan-ning and content validity.1
The existing, more powerful MISs/IT systems can be reengineered to provide amore comprehensive and broader range of relevant risk and needs factors, insti-tutional disciplinary behaviors, and other crucial risk factors. Revamped IT sys-tems can improve the organization of critical data, minimize cognitive overloadby presenting data more clearly, and quicken data retrieval.
� Using more advanced classification methods: A second approach to enhancingclassification validity and reducing errors involves the use of more powerfulanalytical classification computer algorithms to integrate risk and needs datainto higher validity decisions. Several extremely powerful classification tech-niques have only become feasible with advances in computing power during thepast decade. These new classification algorithms (inductive decision trees, neu-ral networks, pattern recognition, clustering methods, signal-detection analysis)far exceed most current correctional classification procedures in enabling moreinformative classification systems, strong decision support for individualoffenders, and systematic measures of the quality of classification decisions.
12
Chapter 2
These technologies have rarely been applied to offender classification proce-dures in prisons but offer the promise of profound advances in both predictivevalidity and comprehensive coverage of variables. Recent examples include thework of Quinsey et al. (1998) and Brennan and Oliver (2000) in using complexpattern recognition to build typologies of offenders based on broad coverage ofthe key risk and needs factors.
More powerful computation and advanced software have also helped to in-crease the ability to monitor the quality of classification decisions using signal-detection theory (SDT) and related methods (see Harvey et al., 1992; Quinseyet al., 1998; Brennan and Harvey, 2000). SDT offers the correctional managersignificant advances for assessing and monitoring the quality of classificationdecisions, conducting error analyses, and setting classification thresholds toguide decisionmaking.
Systematic quantitative analysis of classification errors has been almost totallyignored in current classification practice in criminal justice institutions except,perhaps, for initial concern with the predictive validity of any new classificationinstrument. SDT has only recently been introduced into criminal justice appli-cations and is not yet routinely used in correctional institutions (Brennan andHarvey 2000; Mossman, 1994; Quinsey et al., 1998).
� Providing more useful management and statistical reports including advancedgraphics: Another area of improvement for advanced IT is the production of tar-geted and timely statistical management reports for all stakeholders whose workdepends on classification. Recent innovations include report-generating proce-dures and improved analytical capacities that offer easy-to-use yet flexible ana-lytics and reporting. These should allow classification managers to make moreeffective use of the vast classification databases that are compiled in most pris-ons. More timely and targeted reports can vastly improve the ability of the clas-sification manager to monitor the quality and impact of classification decisionsand thus support continuous improvement of the classification process.
Advanced IT can improve reports in two fundamental ways: (1) by incorporat-ing more powerful statistical analysis procedures to summarize raw data andtransform them into actionable strategic knowledge—South Carolina, for exam-ple, is experimenting with complex dynamic systems models for prison popula-tion forecasting, and other systems are examining various forms of advancednonlinear trend analyses—and (2) by providing managers with graphic repre-sentations of management data. Data overload is a serious problem; graphic out-puts such as trend lines and three-dimensional charts can summarize andpresent vast amounts of complex data and communicate the basic findings moredirectly than raw statistical tables.
� Incorporating knowledge engineering tools: Classification validity ultimatelydepends on the quality of the data on which it is based. Verification and error
13
MIS Software, IT, and Classification Productivity
checking are critical for minimizing errors that may arise from erroneous data.For example, incomplete criminal histories will almost inevitably result in false-negative classification errors. Although cross-verification techniques havelong been emphasized in correctional classification (Brennan, 1987b), theyheretofore involved human inspection that placed extreme demands on staff andmanagement time.
Recent advances in knowledge engineering techniques have greatly improvedthe ability of MIS software to check data integrity and inconsistency and detectanomalies (Han and Kamber, 2001). New technology allows computers toinspect their own databases. Outlier patterns and “strange cases” that mayreflect data errors or data inconsistencies can now be automatically identifiedand flagged by the computer. Brennan and Oliver (2001) used knowledge engi-neering tools to identify multiple contradictions in offender classification datathat might reflect lying, data entry errors, missing data, and anomalies. Thesehave been programmed into the Correctional Offender Management Profilingfor Alternative Sanctions (COMPAS) MIS to flag offenders whose data recordssuggest lying, poor data, or a high likelihood of false-positive or false-negativeclassification errors.
Strategies for Improving Classification Efficiency
Efficiency, which is the second main dimension of classification productivity, alsocan be improved by several MIS strategies. To achieve efficiency gains, MIS/ITsoftware may be designed to achieve the following goals/strategies:
� To reduce time, effort, and errors of routine staff work by improving interfacedesigns.
� To reduce learning time for MIS/IT procedures by implementing clearerdesigns.
� To reduce time and effort by speedier production and improved formatting ofoutput reports and other documents.
� To minimize unnecessary expansion of work for specific stages of classificationdecisionmaking.
� To reduce staff time/effort spent searching for data by using more efficientsearch procedures.
� To reduce the time, effort, and costs of communicating and coordinating classi-fication decisions with other relevant staff and prison units by creating andusing more effective communication devices.

� To reduce information overload and related stress and inefficiencies throughappropriate information compression techniques and simplified managementreports and graphics.
The section below describes these strategies.
Improving interface design to reduce staff time, effort, and errors. Prison clas-sification requires interaction with both manual and computerized databases. Pro-cedures for entering, retrieving, integrating, and communicating data can either besimple and efficient or create stress, frustration, and significant errors. Prisonwidestandards for common protocols and nomenclatures and carefully designed naviga-tion procedures may all help to reduce stress, errors, and the time required to com-plete the task.
Classification forms and screens are key tools for staff, and their designs can beintuitive, logical, and coherent or cumbersome and counterintuitive. Simple key-board macros can facilitate switching between applications, and frequently con-ducted multiple computer operations can be represented by a single template oricon. Default options can be introduced so that the speed of entering classificationdata is optimized (e.g., cursor movement can be designed to save time and reduceerrors). Although these improvements may result in only minimal time saved in anysingle operation, the cumulative time savings over repeated uses by many staffmembers can be substantial.
Reducing learning time for MIS changes. All MISs/IT software systems incurlearning costs. Any software changes will create some stress, because staff mustlearn new procedures to complete routine classification tasks accurately. New soft-ware design and implementation efficiency is therefore a critical element that shouldbe addressed in the design phase. “Help” facilities and online tutorials should beaccessible to shorten the learning curve.
Standardizing routine classification tasks and output reports. Standardizing allforms, classification procedures, and report formats will reduce staff time and effort.Standardized procedures allow for efficiency of learning and use. Repeated or stan-dardized output reports can be produced using templates and software macros.These save repetitive steps and use standardized formatting. Each prison classifica-tion unit has several reports (e.g., population breakdowns by custody levels, disci-plinary rates by custody levels) that are regularly required. Macros are often used inbuilding routine statistical reports on a periodic basis (weekly, monthly, quarterly,etc.). Most of the prison MISs/IT systems that were reviewed contained variousmacros for producing management and statistical reports, including quarterly clas-sifications status reports, quarterly disciplinary reports, and 12-month trend lines forselected performance indicators.
Minimizing unnecessary expansion of classification tasks. Given that some clas-sification tasks have no clear stopping points (e.g., information search or decision-making stage), the unnecessary expansion of these tasks is a danger. MIS/ITprocedures may provide feedback to serve as stopping rules for these tasks (e.g., anupper limit on information searches for critical risk and needs factors, or probability
14
Chapter 2

calculations of class membership when successive risk factors are added toan offender profile). Individual work-scheduling software also may help reduceexpansion by introducing time-based stopping rules to limit open-ended classifica-tion activities. Although they are now being used in other production industries,these procedures have not yet been introduced into corrections.
Designing efficient search procedures to minimize search time. Efficiency isenhanced by any reduction in search time for information retrieval tasks. This hasbeen an ongoing concern for correctional data retrieval systems, and there appearsto be continuing improvement in this area. Classification staff must repeatedlysearch very large databases. Effective MIS/IT search algorithms must provide fastsearches and rapid information processing to reach classification decisions with ahigh probability of correct classification. Search software (engines) is widely usedto locate individual inmates, particular data elements, and so on, in large databases.A hit occurs when a name or keyword combination is encountered in the database.Highly complex combinations of features also can be used to specify search crite-ria. Increasingly, search engines provide relevance scores for each hit to increaseefficiency.
Implementing easier-to-use analytical procedures for comprehensive prisondatabases. Highly complex and very large multidimensional databases acrossdiverse criminal justice agencies, or “data warehouses,” are increasingly beingdeveloped in the prison context. Several prison systems in this study (e.g., Wash-ington’s, South Carolina’s) mentioned the Online Analysis and Programming(OLAP) procedure as a new technical development they were planning to imple-ment to enhance analytical capacities in conducting exploratory analyses of multi-dimensional prisonwide databases and generating reports (see chapter 9).
Reducing time and effort for communication and coordination with otherprison units. Effective communication among prison staff and classification unitsregarding the implications of the offender’s classification level for treatment, trans-port, housing, and security of the offender is critical to effective management.Delays, errors, and communication gaps undermine both efficiency and coordina-tion between the classification unit and other prison operations. Effective MISs/ITsystems should offer tools to upgrade communication and coordination among staffmembers and units. The MIS/IT system is increasingly critical in supporting thesecoordination and communication functions. Technologies such as e-mail, fax, groupcoordination software for real-time communication with multiple units (e.g., elec-tronic face-to-face meetings), shared online scheduling, and shared access to deci-sions in real time are examples of higher levels of communication and coordinationavailable through expanded MISs. Lotus Notes is an example of a program that wasbeing used by the prison systems identified in this study. Another example is col-laborative authoring software, which allows different personnel to work concurrent-ly on the same report.
Reducing stress and errors caused by information overload. A single offendercan generate an enormous amount of information. The human capacity to processand remember all salient data elements is limited, which can result in overload. 15
MIS Software, IT, and Classification Productivity

“Although it has long
been considered
problematic, many
states used classifica-
tion systems that had
not been validated for
women offenders.”
Handling the myriad
data elements associ-
ated with prison clas-
sification can produce
information overload,
resulting in stress and
costly errors and inef-
ficiencies. MIS/IT
can address informa-
tion overload by
offering various data
compression proce-
dures, identifying
critical features, pro-
viding automatic
reminders and warn-
ings, and so on, that
reduce stress and
errors.
One approach to reducing administrative staff overload is to provide highly com-pressed management reports that summarize the most crucial prison data for eachjob category (e.g., averages, group trends for major prison policy and achievementgoals). The disadvantage of information loss in global aggregated reports can bebalanced by the application of new statistical technologies that “drill down” into thedata to explore particular managerial or policy hunches or queries. Data compres-sion and exploration procedures can be easily accomplished by current statisticalprocedures on virtually any prison database. A first step in moving beyond globalaverages is to allow simple cross-tabulations of data (e.g., custody by race or gen-der). Most current statistical packages in an OLAP environment allow multidimen-sional cross-tabulations to facilitate the exploration (or drilling down) of successivequeries. Appropriate software and reporting procedures can facilitate sequentialqueries and analyses of complex data collected by a classification unit and therebyenhance administrative policy decisions.
Conclusion
This chapter has indicated, in general terms, the ways that MIS/IT system develop-ments can enhance productivity of prison classification. Classification productivitycan be separated into two broad dimensions: effectiveness and efficiency. MISs/ITsystems use several strategies (e.g., data retrieval, data analysis, search processes,communication/coordination with other units) to improve both dimensions of clas-sification tasks. With the rapid increase in computing capacity, MISs/IT systems arebecoming more vital in supporting both dimensions and in incorporating innovativeclassification methods. Some of the innovations introduced by the prison systemsidentified in this study (e.g., New Jersey’s internal classification system, South Car-olina’s population forecasting simulation procedures) are not possible without thecomputational capacities of their MISs/IT systems.
Given the present state of development of prison classification systems, however,the power of MISs/IT systems is largely underutilized. Classification procedures inmany prison systems too often represent the automation of simple systems origi-nally designed for manual operations. These classification systems make little useof the vast data storage and analytical capacity of current MISs/IT systems.
New computer-based analytical procedures for classification continue to emerge.Advanced techniques are available for both creating classifications and supportinghuman decisionmaking (e.g., artificial intelligence algorithms, inductive decisiontrees, fuzzy clustering, pattern recognition). A category of error-analysis methodshas been developed for evaluating and monitoring the quality of classification deci-sions (signal-detection methods, judgment analysis, etc.). Powerful data integrationprocedures are now available so that criminal justice databases can become trulycomprehensive and support more detailed policy-level decisionmaking (OLAP, datamining, dynamic systems modeling and forecasting, etc.). Examples of some ofthese techniques are evident in the prisons visited in this study (e.g., South Caroli-na’s shift from the “Old World” to the “New World” of computing architectures; ITplans of several of the prison systems in this study that involved OLAP, data ware-housing concepts, and advanced statistical procedures).
16
Chapter 2

Introduction
Identifying the precise data requirements of classification operations is importantwhen exploring how current computing technology can enhance classification pro-cedures. Offender classification systems have varying and demanding data require-ments. This chapter clarifies the multiple roles of classification and the specifickinds of information and data needed for each of those roles.
Every classification decision is driven by data and thus relies on an information sup-port system. For the past two decades, correctional agencies have shifted away fromthe subjective judgments of correctional officers and toward data-driven objectiveclassifications. The deficiencies of older information systems may be quite seriousand, at worst, may undermine classification effectiveness, or validity. Upgrading theclassification process imposes data requirements on the information system. Find-ing an adequate interface between classification and the information system is a keychallenge for most prisons.
Trends
Two broad trends have increased the information demands that classification impos-es on prison MISs/databases. A clear understanding of these trends is requisite toplanning MIS enhancements.
Evolution Toward Greater Complexity
The policy orientation of prison classification systems and the associated technicaldesign are changing rapidly. Nationwide, prisons, jails, and other correctional insti-tutions are being forced—through litigation, new research, fiscal concerns, andovercrowding—to upgrade the validity, reliability, objectivity, and overall quality oftheir classification decisions. Innovations include designing internal classificationsystems for internal management of offenders, developing risk and needs classifi-cation instruments that are valid for female offenders, and incorporating more treat-ment and rehabilitative factors into treatment classifications. This evolution ofclassification methods toward greater complexity inevitably increases the demandfor a broader range of criminogenic risk factors and a more intensive informationprocessing capacity (Brennan, 1999; Clements, 1996; Jones, 1995).
Offender Classification Roles andData Requirements
threeChapter
17

“Although it has long
been considered
problematic, many
states used classifica-
tion systems that had
not been validated for
women offenders.”
Although many
respondents discussed
clear differences
between men and
women offenders in
terms of their needs
and risks to institu-
tional and public safe-
ty, very few states had
incorporated these
differences into their
objective prison clas-
sification systems.
18
Chapter 3
In addition, litigation, which often focuses on technical criteria, is raising the bar fortechnical standards for classification. These include more objective and standard-ized data, verification procedures, risk factors with demonstrated validity, and high-er psychometric reliabilities (Brennan, 1987a; Tonry, 1987). This trend towardtechnically defensible criteria increases the information processing burdens on clas-sification procedures and prison staff.
Although some prison classification systems are highly innovative, most currentapproaches remain extremely oversimplified (Austin, 1983; Brennan, 1993;MacKenzie, 1988). The most widely used security- and risk-based classificationsuse simple logically or statistically designed point scales and a small set of behav-ioral and legal risk factors such as criminal history, disciplinary and escape history,seriousness of current offense, substance abuse, and some social stability factors(Austin, 1983; Clear, 1988; Wright, Clear, and Dickson, 1984). Historically, thesesystems worked in a manual format because they had minimal computationalrequirements. They were efficient and able to cope with busy and overcrowded cor-rectional settings and were an improvement when they were introduced.
Simple additive points-based classification procedures, however, have been increas-ingly challenged on practical, financial, scientific, and ethical grounds. The weak-nesses of these custody and security classification procedures include low predictivevalidity, low psychometric reliability, poor content validity, and limited ability toprovide staff with useful guidance on managing offenders (Brennan, 1993; Clear,1988; MacKenzie, 1988). During the 1980s, several more comprehensive multifac-tor and behavioral systems were offered but were used only sporadically (Andrewsand Bonta, 1994; Austin, Baird and Neuenfeldt, 1993; Megargee and Bohn, 1979).Many newer systems provide richer coverage of criminogenic factors but havefailed the tests of practicality and efficiency. The result has been implementationchallenges in overworked correctional institutions. Complex systems such as Hare’sPsychopathy Checklist (PCL) or Quinsey’s Violence Risk Appraisal Guide(VRAG), for example, place high demands on staff time and skills and, in the con-text of overcrowded prisons, increase the difficulty of successful implementationand staff acceptance. Despite these difficulties, the general trend is toward increasedcomprehensiveness and complexity of classification methods.
Shift Toward Comprehensive Multiple-Purpose Classification
The broadening of the purposes and policies that offender classifications must sup-port has caused an escalation in data needs. MacKenzie (1988) described this trendas a paradigm shift in prison classification. This broadening of purposes hasincreased the range of data required, and many MISs/database systems have simplynot kept pace with information demands. Perhaps the most critical deficiency is theweak coverage of key risk factors and treatment-relevant variables, which can pro-duce inadequate content validity. The purposes of offender classification comprisea complex mix of practical, scientific, and legal goals:

19
Offender Classification Roles and Data Requirements
� To provide the basis for communication and stable nomenclature.
� To support inmate and staff safety.
� To support discipline and order through appropriate separations.
� To support fairness and equity through valid and consistent classification.
� To support the right to appropriate housing.
� To support treatment, rehabilitation, and community reentry.
� To support resource planning and allocation.
Comprehensive classification now includes more goals than were once defined byeither line staff or management (Alexander, 1986; Brennan, 1987b; Fowler andRans, 1982; Solomon and Baird, 1981). Traditionally, a single “one-size-fits-all”offender classification was expected to fulfill all organizational purposes and goals.The fallacy of this approach has been recognized not only in corrections but in mostpeople-processing institutions (Lipsky, 1980; Prottas, 1979). Many prisons now useseparate classification procedures for initial intake, internal custody and security,reclassification, case management and treatment planning, and community reentry,a reflection of the recent trend toward complexity and comprehensiveness.
The emergence of internal classification in prisons is an interesting aspect of thetrend toward multiple classification purposes (MacKenzie, 1988; NIC, 2001). Inter-nal classification systems guide internal management, housing, work assignment,and programming of inmates by emphasizing interpersonal behavioral patterns andneeds profiles (Austin, Baird, and Neuenfeldt, 1993). Internal classification systemsdo not replace risk-based predictive systems but may be used in a complementarymanner for various management purposes. Another issue is whether internal classi-fication systems for women offenders should differ from those for male offenders(Brennan, 1999; Brennan and Austin, 1997).
The data requirements for internal classification are substantially broader than thosefor traditional security and risk systems. Recent developments in both internal andexternal classification systems exhibit this broader scope of classification variables(e.g., Client Management Classification [CMC]; see Megargee and Bohn, 1979).Similarly, the Level of Supervision Inventory (LSI), COMPAS, and VRAG all havebroad multifactor information coverage to guide classification decisions for multi-ple correctional purposes.

20
Chapter 3
Changing Roles and Growing Importance ofClassification
Understanding the multiple roles of prison classification helps to clarify the infor-mation requirements. During the past two decades, objective offender classificationhas been a primary management, legal, and political issue. Courts, practitioners, andprofessional associations have recognized the importance of valid and reliableoffender classification. Failure to appreciate its many roles may undermine attemptsto specify the ranges of data elements needed in an MIS.
Administrative, classification, and MIS/IT staff often fail to appreciate the multiplepurposes of classification (Fowler and Rans, 1982; Harris and Smith, 1993). Manyare unaware of the links between classification and most major correctional policiesand organizational goals. Consequently, classification is often oversimplified,underutilized for certain purposes (planning, monitoring, population control, etc.),and poorly integrated with MIS and other prison operations. Harris and Smith(1993) implied that any failure by correctional management to appreciate the mul-tiple roles of classification results in weak implementation and underutilizationcharacterized by failure to request, collect, or analyze the needed data.
The major practical roles and purposes of classification are described below. Eachpurpose or policy goal has specific data requirements for initial classificationdecisionmaking and for outcomes or performance monitoring.
Inmate and Staff Safety
A priority of most correctional facilities is to provide a safe environment for inmatesand staff (Alexander, l986). This demands valid identification of violent offendersand custody classes and an effective set of validated risk factors, separation of pred-ators from potential victims, and appropriate supervision. Suicide screening, a sub-goal of this general aim, similarly requires data to identify inmates at high risk forsuicide and thus to guide the selection of appropriate surveillance and treatment.
Public Safety
Public safety relies on valid classification focused on dangerousness and recidivismrisk for security and community reentry decisions. Data elements for recidivism riskfactors may be quite different from those for institutional dangerousness. Classifi-cation levels must be matched with security constraints, release recommendations,appropriate community constraints, and supervision. Escape-risk data also arerequired for classification. This goal demands many valid and relevant risk factorsfrom the MIS/database. False-negative errors may produce intense media attention,public anger, and a loss of public confidence. The classification validity and integ-rity of the risk factor data are critical for this goal.
21
Offender Classification Roles and Data Requirements
Rehabilitation and Reintegration
Classification for reintegration into the community requires data on both risk andneeds assessment to match inmates to treatment programs and graded access to thecommunity. These classification decisions must balance public safety with the goalsof successful rehabilitation and reintegration. Critical purposes include the protec-tion of the prisoner’s rights to avoidance of deterioration, access to appropriate pro-grams, detention in the least restrictive environment commensurate with theirassessed risk to both the prison community and the community at large, and the low-est level of isolation from the community. These multifaceted goals clearly requirea broad set of social and criminogenic risk factors as well as carefully collectedtreatment needs, social supports, and other relevant criminogenic factors (seeAndrews and Bonta, 1994; Van Voorhis, 1994). These complex goals place severedemands on the comprehensiveness of classification factors included in the MISdatabase. The scientific criteria of critical importance include content validity, con-struct validity, and coverage of the most valid criminogenic factors.
Equity, Fairness, and Consistency
These important correctional, legal, and ethical goals rely almost completely on twokey criteria: the validity and the reliability of classification (Tonry, 1987). Litigationhas identified classification as a foundation for consistent and equitable placementsfor both housing and program access (Gettinger, 1982). Fairness requires (1) thaterrors, bias, and prejudice be minimized; (2) that careful constraints guide subjec-tive discretion; and (3) that the classification have demonstrated validity. Equity andfairness are the basis for parity concerns pertaining to female inmates (Brennan,1999; Zaplin, 1998). Invalid classification and poor data invariably undermine con-sistency, fairness, and equity.
Protection of the Right to Appropriate Treatment
Classification is the primary process that identifies the treatment needs of prisonersfor housing level; work assignments; vocational, educational, and mental health;and medical and other program needs. A range of data elements is required for mak-ing these classification decisions and monitoring program delivery. Classificationassessments are a key step in protecting detainees from “deliberate indifference”and ensuring their right to adequate treatment. The courts have identified classifica-tion as a basis for the right to protection from violent assault and the fear of violence(Tonry, 1987). Classification must achieve valid separations of risk levels to supportsensible housing assignments.
Efficiency and Rationality in Resource Use
Classification is a key management tool for administrators and planners in achiev-ing fiscal efficiency and avoiding a waste of prison resources. The courts identifiedclassification as “a prerequisite for the rational allocation of whatever program
22
Chapter 3
opportunities exist within the institution” (Gettinger, 1982). Classification supportsrational resource allocation, governs staff assignments, and plays an increasinglyvisible role in the architectural planning of new facilities. An MIS/database mustprovide key data on offender needs, security, and surveillance to match bed avail-ability and treatment allocations. The MIS must have sufficient statistical capacityto provide detailed classification and needs breakdowns for planning and projectionpurposes. Classification errors can waste resources, reduce efficiency, and degradeplans that are based on these data. One NIC (1984) report indicated:
The increasing demand for both security and program resources,coupled with the probability that the availability of both willdecrease, calls for an especially efficient and effective classifica-tion decision that will make the most advantageous use of physi-cal, financial, and human resources. (p. 9)
Each correctional institution must have an MIS to support its ability to monitorwhether inmates are appropriately matched to needed services or whether keyresources are squandered by wasteful overclassification in which inmates are heldat needlessly high levels of security relative to their risks.
Management Planning
Classification provides many of the data required for the statistical bases for plans,budgets, staff requirements, programs resources, and physical space requirements(Brennan and Wells, 1992; Fowler and Rans, l982; MacKenzie, 1988). The capabil-ities of the MIS/IT system enhance staff’s ability to provide statistical breakdowns,trends, and projections for the inmate population across subgroups and time. Clas-sification data also support simulation studies, projections of various subpopula-tions, and differentiated levels of need for various resources and services. The basisfor virtually all statistical tables and planning projects is a set of classification pro-cedures (Bowker and Star, 1999). As classification data become more comprehen-sive and complex, they force the information system (IS) to upgrade its analyticcapacities. In the next few years, corrections is likely to witness the mutual evolu-tion of both classification methods and the analytical capacity of an IS to make bet-ter use of these large comprehensive databases.
Orderly and Routine Processing
Because of resource limitations, prisons and jails, like all people-processingbureaucracies, cannot plan for, respond to, or cope with individual cases (Prottas,1979). All of these institutions are designed to deal with “classes” of clients. This isas true of hospitals as of prisons (Bowker and Star, 1999; Lipsky, 1980). Classifica-tion is an organizing process that simplifies and organizes the diversity of offendersentering a prison. Until detainees are classified, a bureaucracy cannot deal withthem (Lipsky, 1980; Prottas, 1979). Institutional responses are designed to deal withcategories of clients/inmates according to an institution’s procedures. Classification
and reclassification support institutional order by providing a consistent, objective,and rational basis to guide inmate movement, rehousing, treatments, and programs.
Social Control and Discipline
Social control and discipline are critical correctional goals. Classification con-tributes to stability and order through inmate identification and separation and theestablishment of appropriate surveillance levels. It helps control inmate behavior bygoverning access to rewards and punishments (e.g., misbehavior is punished byreclassifying to a less privileged level; good behavior is rewarded by reclassifyingto a more privileged level). Classification thus influences inmate behavior (Prottas,1979) and conveys and enforces behavioral expectations. Information requirementsfor this purpose are quite extensive; all prisons maintain disciplinary records ondetainees. These data are an intrinsic component of the information infrastructure.
Monitoring Prison Goal Achievement, Results, and
Accountability
Classification data contribute greatly to monitoring the accomplishment of correc-tional policy goals. The MIS/database is of profound importance in this role. Fowlerand Rans (1982, p. 23) asserted that classification is the “ultimate accountabilitytool” and stated that many classification data can be used to monitor the degree towhich most major correctional goals are achieved. Performance monitoring in keyareas is intimately linked to the performance of the classification system. Monitor-ing outcomes and results requires an MIS that allows collection, storage, process-ing, and retrieval of classification data. The MIS in turn must have sufficientanalytical capacity to conduct statistical analyses and generate reports and graphs tocommunicate these data. Data elements that reflect various correctional policy goals(e.g., inmate safety, grievances, access to programs, efficiency/waste, least restric-tive custody, public safety) are routinely collected and added to the prison database.For example, the goal to impose the least restrictive custody is measured partiallyby overclassification error rates and by the percentage of inmates housed in securi-ty levels higher than needed (Austin, 1983). A goal of most MISs and automatedclassification systems is to produce statistics that reflect the degree to which thesepolicy goals are being met.
Liability Protection
A good classification system is a powerful means of avoiding public embarrass-ment, maintaining good public relations, and avoiding damaging litigation (NIC,1985). A classification error (e.g., a false-negative classification) that leads to a vio-lent incident may devastate the public image of a facility. Valid classification, accu-rate and verified data, and adequate training and supervision are the main defensesagainst these errors. Objective classification systems also provide justification anddocumentation for processing and placement decisions. These are basic requisites inlegal disputes. Objective data elements and computed fields collected by classifica-tion and stored in the MIS/database are critical in protecting the institution againstlitigation.
23
Offender Classification Roles and Data Requirements
24
Chapter 3
Conclusion
Periodic or continuous collection of critical data contributes to the monitoring andassessment of a prison’s performance. Prison MISs/databases must provide suffi-cient data coverage of key results variables to support these functions and the ana-lytical procedures to produce useful management reports. Each major prison goal(e.g., public or prisoner safety, equity, discipline) is linked to classification process-es that require the measurement of specific data elements for each unit of time. Inthis way, management reports can be produced to support planning, results moni-toring, and policy analysis. Managers must fully understand classification functionsto ensure that the MIS is not underutilized or only partially implemented.
Automated Prison ClassificationSystem Features and Functions
fourChapter
25
Introduction
To automate prison classification effectively, technical and administrative staff mustunderstand the major goals of classification and build them into the functionality ofthe software. This chapter examines critical features and functions of automatedclassification that should be included in the MIS. The ultimate purpose for design-ing the software is to promote efficiency and accountability in support of the day-to-day classification tasks of both line and management staff. To illustrate thediversity of approaches to and MIS support for classification, this chapter alsoreviews selected software design features that had been implemented in the variousprison systems visited for this study.
The main features and functions of an effective classification MIS include thefollowing:
� Attention to all stages of the classification procedure: The automation of clas-sification functions should facilitate all of the basic processes that must beaccomplished in any prison classification. This includes, for example, identify-ing all inmates due for review at each of the successive stages of classification,identifying inmates who are overdue for classification, printing inmate classifi-cation notices, and generating hard copies of all classification actions. All deci-sions resulting from classification and related inmate-processing decisions, onboth an inmate-specific and aggregate basis, must be well documented.
� Efficient access, retrieval, and organization of data: Classification proceduresuse a large amount of high-quality, verified data that must be accessed in a time-ly fashion, easily stored, and retrieved as needed. This includes data on previ-ous incarcerations, current offense and legal status, prior criminal anddisciplinary history, sentencing, medical/mental health, and special needs.Automation facilitates timely retrieval of data in a well-organized, easily acces-sible format.
� Management of housing assignments and inmate movement: Automation shouldassist the classification/housing officer in maintaining a dynamically updatedinventory of available facilities and beds to house and transfer classified inmatesbetween locations in a manner consistent with the prison’s policies. The system

should track and document all inmates who are not housed at the appropriatelevel (which may occur periodically for reasons such as overcrowding). In theseand similar instances, the system must provide timely and proper notification,monitoring, and alerts to make appropriate housing adjustments as beds becomeavailable.
� Statistical management reports for monitoring operations and quality control:A well-designed automated classification system should provide various“canned” and ad hoc reports as well as statistical capabilities and report-generation procedures to address operations monitoring and quality control.These include indexes such as aggregate security and custody-level profiles,classification staff workload, override rates and reasons, mishoused-inmatesummaries, and late-classification summaries.
Critical Design Components of AutomatedClassification Systems
A well-developed classification (or other) MIS should adequately address the fol-lowing four critical design components. The degree to which the software address-es these components will directly affect its use and acceptance by staff.
1. Information content: This refers to the range and kind of information collectedand stored in the MIS to support classification and related inmate and agencymanagement decisions. The information needs of the classification instrumentsand inmate, facility, and management decisions must be incorporated fully intosuccessive stages of MIS design. The MIS should include a “data dictionary” todefine precisely all classification-related data elements.
2. Functionality: Functionality refers to the way the MIS collects, stores, retrieves,organizes, and presents data. Effective automation starts with an MIS designthat promotes timely and efficient user management of data. For example, mostsecurity and custody classification instruments include data elements from theinmate’s disciplinary history. A well-designed classification MIS must collectand store this information so that when an inmate’s disciplinary historybecomes relevant to a decision, the software automatically organizes and pre-sents this information by date and severity to assist in determining current/pastinstitutional adjustments.
3. User interface: The user interface governs the interaction between the user andthe software. The user must navigate multiple menus, screens, and other func-tions of an MIS. The user interface must be easy to navigate, understand, andlearn. Its design must often distinguish between different classes of users andthe different types of data they enter. It should record the time of each data inputand use intuitive codes or definitions (preferably online) for all coded fields atthe specific data input field. Automated edits can help prevent missing data andminimize inconsistency and data entry errors. Movement (navigation) between
26
Chapter 4
The ability to inter-
face with other crimi-
nal justice MISs is
becoming increasing-
ly important for
cross-verification,
efficiency, and
comprehensiveness
of coverage of classifi-
cation data.
27
Automated Prison Classification System Features and Functions
screens and between databases must be logically consistent with the workflow.Information flow within and between screens must be logical (see chapter 5).
4. Outputs and reports: Outputs and management reports are produced from theinformation stored in the system. Carefully designed outputs should provideusers with information to support classification processes and decisions. Out-puts include various lists and data summaries produced while the user is inter-acting with the system in day-to-day operations and statistical and managementreports that are produced from aggregated data for a given time period (e.g.,weekly, monthly). For example, in the first category, reclassifications shouldtrigger the electronic (screen) or hardcopy printout of a list of inmates due forreview. The presentation formats (screen or hard copy) of rosters and summariesmust support multiple stakeholders. Examples of reports include periodic hous-ing discrepancy reports and statistical breakdowns of classification levels forselected subpopulations. A well-designed classification MIS must provide com-prehensive statistical and monitoring reports to meet the needs of line staff,administrators, supervisors, planners, and policymakers.
General Classification Process Overview
This section provides a brief outline of the system workflow that typically charac-terizes prison classification systems. Reviews of seven state prison classificationsystems inform this general overview of sequencing, classification, and inmate-processing functions.
At the most general level, initial classification determines the level of security andthe kind of facility required for a new inmate, which triggers facility assignment andtransfer. Custody classification occurs at the new facility; this process determinesthe level of supervision required. Custody classification shifts the focus to internalprocessing decisions such as housing and program assignments. Similarly, programneeds guide program and work assignments. More detailed internal classificationsystems implemented recently incorporate deeper concerns regarding interpersonalrelations, skills and needs, and program and treatment placements (NIC, 2001).2
Exhibit 4–1 illustrates the general sequence of steps in classification, which canserve as a roadmap for MIS design.
System Information Content
The MIS must provide comprehensive, accurate, reliable, timely, and user-friendlyinformation to support classification decisions in the workflow described above.The three components of MIS content are as follows:
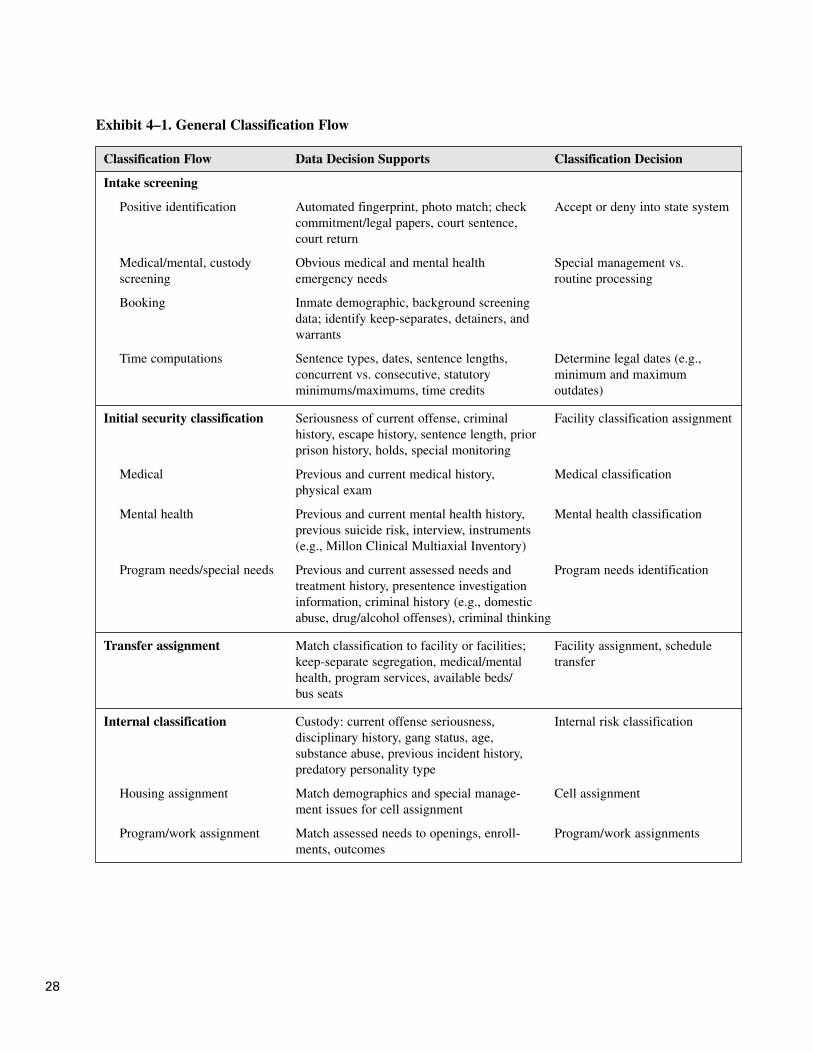
28
Classification Flow Data Decision Supports Classification Decision
Intake screening
Positive identification Automated fingerprint, photo match; check Accept or deny into state system commitment/legal papers, court sentence,court return
Medical/mental, custody Obvious medical and mental health Special management vs.screening emergency needs routine processing
Booking Inmate demographic, background screeningdata; identify keep-separates, detainers, andwarrants
Time computations Sentence types, dates, sentence lengths, Determine legal dates (e.g.,concurrent vs. consecutive, statutory minimum and maximum minimums/maximums, time credits outdates)
Initial security classification Seriousness of current offense, criminal Facility classification assignmenthistory, escape history, sentence length, prior prison history, holds, special monitoring
Medical Previous and current medical history, Medical classificationphysical exam
Mental health Previous and current mental health history, Mental health classification previous suicide risk, interview, instruments(e.g., Millon Clinical Multiaxial Inventory)
Program needs/special needs Previous and current assessed needs and Program needs identification treatment history, presentence investigationinformation, criminal history (e.g., domesticabuse, drug/alcohol offenses), criminal thinking
Transfer assignment Match classification to facility or facilities; Facility assignment, schedule keep-separate segregation, medical/mental transfer health, program services, available beds/bus seats
Internal classification Custody: current offense seriousness, Internal risk classificationdisciplinary history, gang status, age,substance abuse, previous incident history,predatory personality type
Housing assignment Match demographics and special manage- Cell assignmentment issues for cell assignment
Program/work assignment Match assessed needs to openings, enroll- Program/work assignments ments, outcomes
Exhibit 4–1. General Classification Flow

29
Classification Flow Data Decision Supports Classification Decision
Reclassification Mitigating or aggravating circumstances New classification and facility/(external and internal) including new disciplinaries, change in legal housing assignment
status, change in balance of sentence, newneeds identification, program participation/completion, other new information; match new classification to new housing assignment
Community/prerelease Criminal history, escape history, probation/ Temporary release; early release risk assessment parole violation history, substance abuse or parole recommendation
severity, employment/education history,social stability, criminal cognitions, balanceof sentence remaining
Release Sentence calculation, release-date review, Final inmate release, victimdetainers, victim notification/registration notifications, and offenderinformation (e.g., sex offender registration), registrationsfinancial obligations
Exhibit 4–1. General Classification Flow (continued)
1. Manageable, complete data: All data fields must be easily entered and clearlylabeled and must contain data needed at each phase and ancillary phase of clas-sification and related inmate management decisions.
2. Data dictionary: There must be a data dictionary that defines all fields. Defini-tions must be operational and unambiguous, identifying the source of theinformation, whether it is verified, how, and by whom. For example, the defini-tion of the inmate name field should reflect that there may be one name on thearrest; another on the commitment paper; and others on other arrest, conviction,and personal documents. At admission, an inmate may give another name bywhich he or she wishes to be known and may request and be granted a legalname change. The data dictionary must provide clear rules for determiningwhich name to enter. Exhibit 4–2 is an example of a data dictionary entry.
3. Data entry procedures: Procedures must identify and document who is respon-sible for entering data and when the data are to be entered.
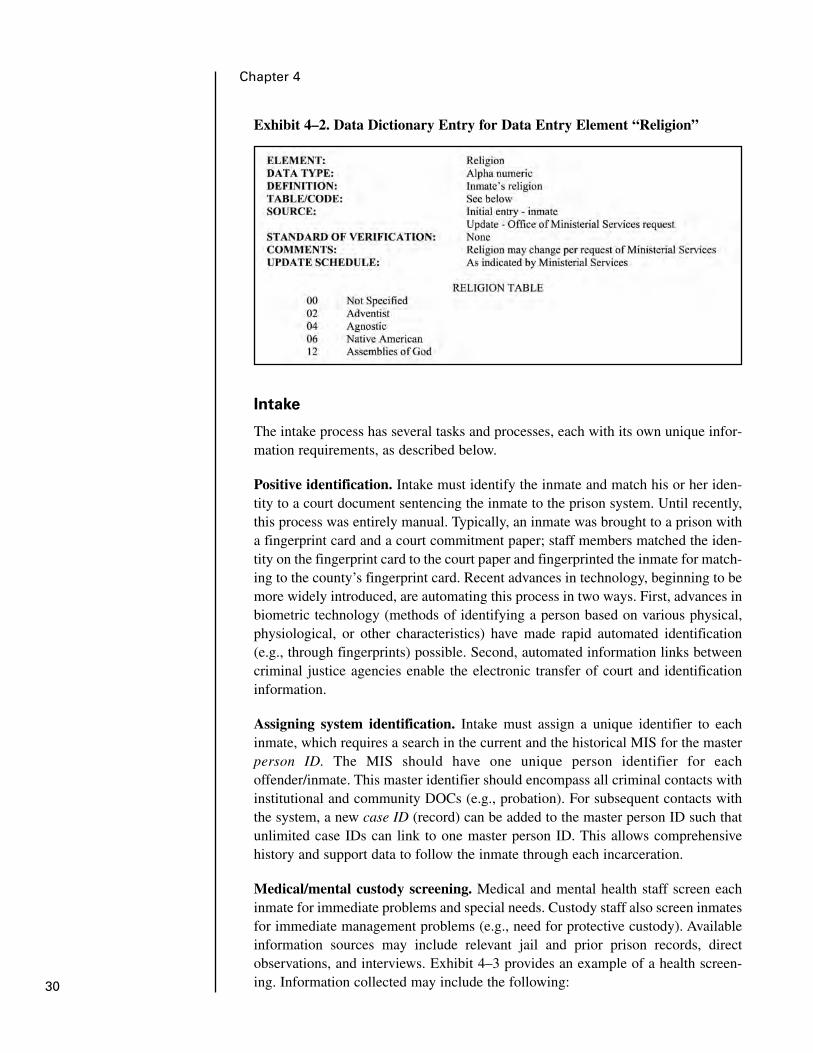
30
Chapter 4
Exhibit 4–2. Data Dictionary Entry for Data Entry Element “Religion”
Intake
The intake process has several tasks and processes, each with its own unique infor-mation requirements, as described below.
Positive identification. Intake must identify the inmate and match his or her iden-tity to a court document sentencing the inmate to the prison system. Until recently,this process was entirely manual. Typically, an inmate was brought to a prison witha fingerprint card and a court commitment paper; staff members matched the iden-tity on the fingerprint card to the court paper and fingerprinted the inmate for match-ing to the county’s fingerprint card. Recent advances in technology, beginning to bemore widely introduced, are automating this process in two ways. First, advances inbiometric technology (methods of identifying a person based on various physical,physiological, or other characteristics) have made rapid automated identification(e.g., through fingerprints) possible. Second, automated information links betweencriminal justice agencies enable the electronic transfer of court and identificationinformation.
Assigning system identification. Intake must assign a unique identifier to eachinmate, which requires a search in the current and the historical MIS for the masterperson ID. The MIS should have one unique person identifier for eachoffender/inmate. This master identifier should encompass all criminal contacts withinstitutional and community DOCs (e.g., probation). For subsequent contacts withthe system, a new case ID (record) can be added to the master person ID such thatunlimited case IDs can link to one master person ID. This allows comprehensivehistory and support data to follow the inmate through each incarceration.
Medical/mental custody screening. Medical and mental health staff screen eachinmate for immediate problems and special needs. Custody staff also screen inmatesfor immediate management problems (e.g., need for protective custody). Availableinformation sources may include relevant jail and prior prison records, directobservations, and interviews. Exhibit 4–3 provides an example of a health screen-ing. Information collected may include the following:
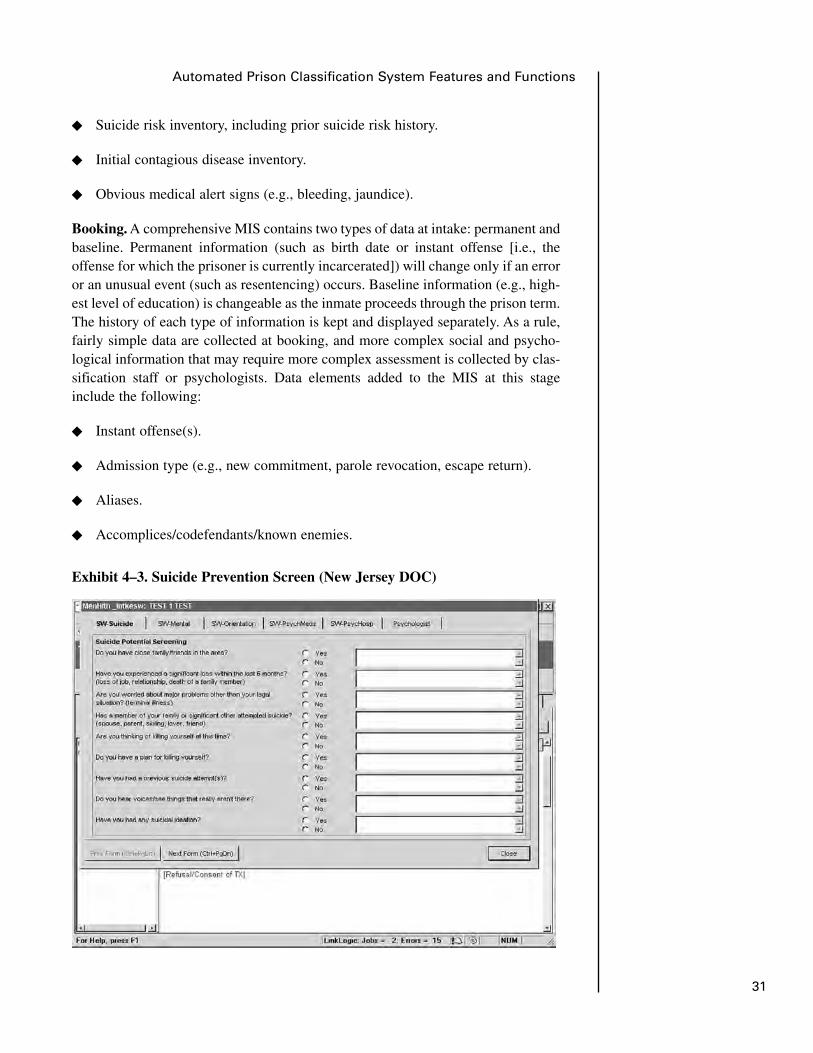
31
Automated Prison Classification System Features and Functions
� Suicide risk inventory, including prior suicide risk history.
� Initial contagious disease inventory.
� Obvious medical alert signs (e.g., bleeding, jaundice).
Booking. A comprehensive MIS contains two types of data at intake: permanent andbaseline. Permanent information (such as birth date or instant offense [i.e., theoffense for which the prisoner is currently incarcerated]) will change only if an erroror an unusual event (such as resentencing) occurs. Baseline information (e.g., high-est level of education) is changeable as the inmate proceeds through the prison term.The history of each type of information is kept and displayed separately. As a rule,fairly simple data are collected at booking, and more complex social and psycho-logical information that may require more complex assessment is collected by clas-sification staff or psychologists. Data elements added to the MIS at this stageinclude the following:
� Instant offense(s).
� Admission type (e.g., new commitment, parole revocation, escape return).
� Aliases.
� Accomplices/codefendants/known enemies.
Exhibit 4–3. Suicide Prevention Screen (New Jersey DOC)
32
Chapter 4
� Warrants, detainers, outstanding charges, and upcoming court dates (exhibit 4–4).
� Citizenship status.
� Demographics (e.g., age, race, sex, place of birth, religion) (exhibit 4–5).
� Social data (e.g., education, employment, military service, family members,residence).
� Physical data (e.g., height, weight).
� Gang affiliations or threat groups.
� Initial medical/mental health.
� Special needs (e.g., developmental disabilities, physical disabilities).
� Language competency.
� Emergency contact.
� Personal information for mail, visitation, and telephone.
� Smoker/nonsmoker.
� Prior county jail incarceration information (i.e., classification, disciplinaryadjustment. mental health and medical problems).
� Intake officer’s name and date and time of intake.
Time computations. Time computations are complex functions, sometimes per-formed by the classification unit, that require automation to minimize errors andgenerate projections. These determine release dates and are critical for program eli-gibility. The information must be reviewed and analyzed to determine minimum andmaximum outdates. MIS data collected for this task must include the following:
� Sentence dates, lengths, and types.
� Concurrent versus consecutive sentences.
� Statutory minimums/maximums.
� Time credits.

33
Automated Prison Classification System Features and Functions
Exhibit 4–4. Detainer and Warrant History Screen (Washington DOC)
Exhibit 4–5. Demographic Information Intake Screen (Colorado DOC)
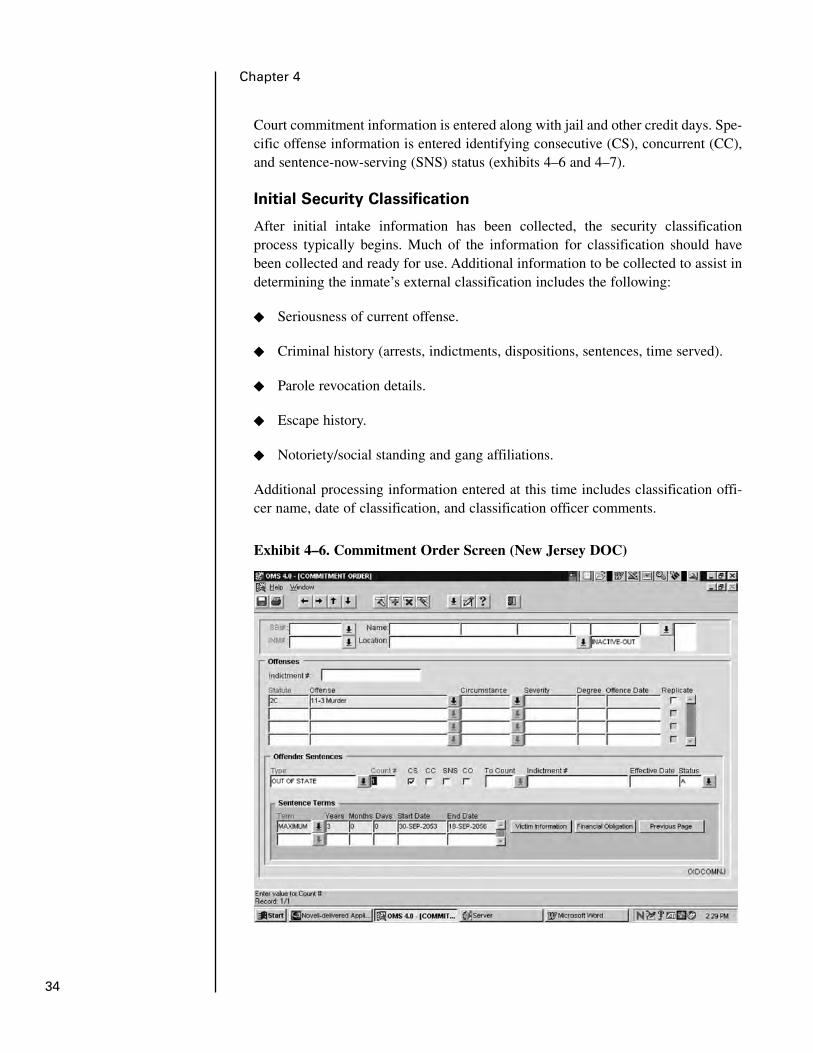
34
Chapter 4
Court commitment information is entered along with jail and other credit days. Spe-cific offense information is entered identifying consecutive (CS), concurrent (CC),and sentence-now-serving (SNS) status (exhibits 4–6 and 4–7).
Initial Security Classification
After initial intake information has been collected, the security classificationprocess typically begins. Much of the information for classification should havebeen collected and ready for use. Additional information to be collected to assist indetermining the inmate’s external classification includes the following:
� Seriousness of current offense.
� Criminal history (arrests, indictments, dispositions, sentences, time served).
� Parole revocation details.
� Escape history.
� Notoriety/social standing and gang affiliations.
Additional processing information entered at this time includes classification offi-cer name, date of classification, and classification officer comments.
Exhibit 4–6. Commitment Order Screen (New Jersey DOC)

35
Automated Prison Classification System Features and Functions
The final security classification determination, typically made by a supervisor orcommittee, considers all relevant information to confirm or override the recom-mended classification assignment. Although the above information provisions areroutinely supported by the MIS, additional data entry tasks include the following:
� Aggravating/mitigating circumstances of the case.
� Final classification designation.
� Override designation and reason (if applicable).
� Supervisor/committee name or identifier.
� Final classification.
� Classification decision review date.
� Comments.
Exhibit 4–7. Commitment Order Administrative Caseload Screen (NewJersey DOC)
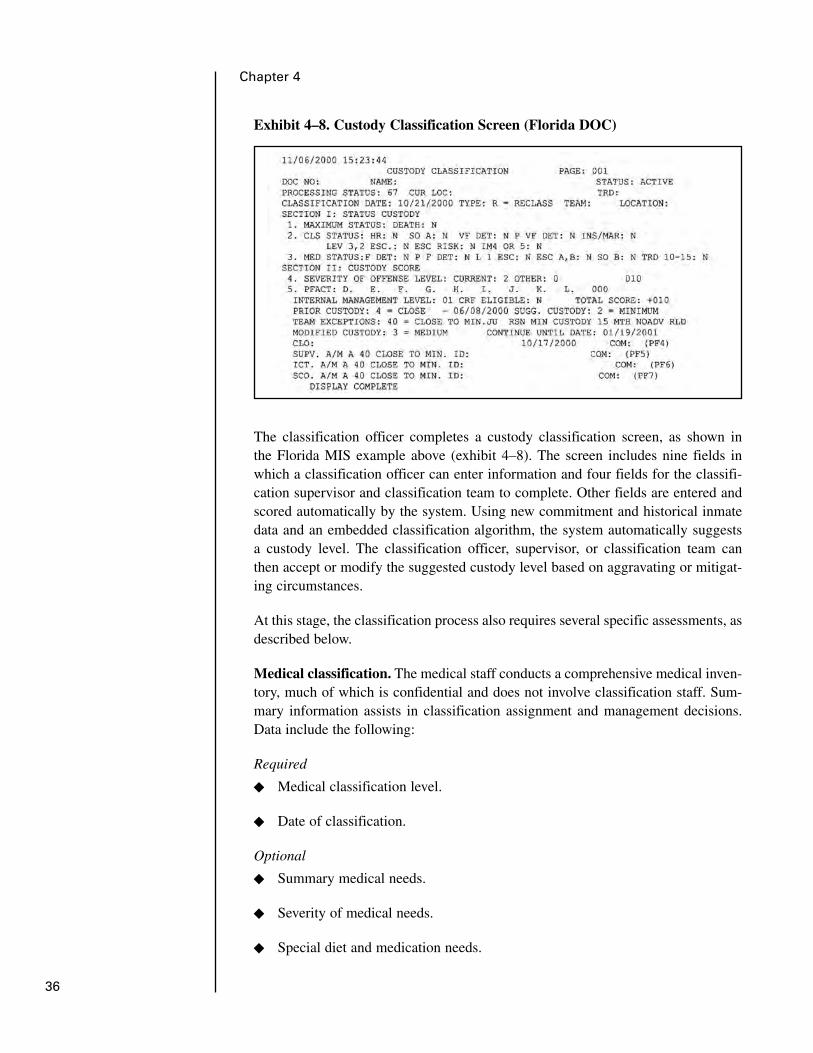
36
Chapter 4
Exhibit 4–8. Custody Classification Screen (Florida DOC)
The classification officer completes a custody classification screen, as shown inthe Florida MIS example above (exhibit 4–8). The screen includes nine fields inwhich a classification officer can enter information and four fields for the classifi-cation supervisor and classification team to complete. Other fields are entered andscored automatically by the system. Using new commitment and historical inmatedata and an embedded classification algorithm, the system automatically suggestsa custody level. The classification officer, supervisor, or classification team canthen accept or modify the suggested custody level based on aggravating or mitigat-ing circumstances.
At this stage, the classification process also requires several specific assessments, asdescribed below.
Medical classification. The medical staff conducts a comprehensive medical inven-tory, much of which is confidential and does not involve classification staff. Sum-mary information assists in classification assignment and management decisions.Data include the following:
Required
� Medical classification level.
� Date of classification.
Optional
� Summary medical needs.
� Severity of medical needs.
� Special diet and medication needs.
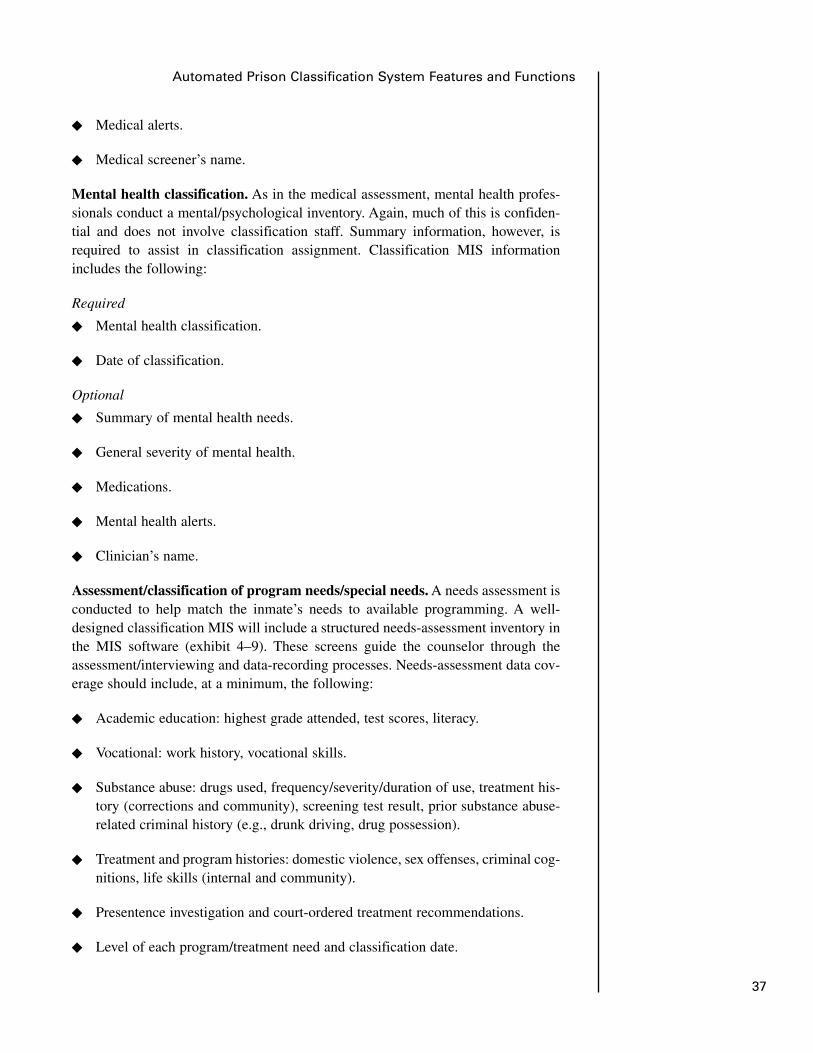
� Medical alerts.
� Medical screener’s name.
Mental health classification. As in the medical assessment, mental health profes-sionals conduct a mental/psychological inventory. Again, much of this is confiden-tial and does not involve classification staff. Summary information, however, isrequired to assist in classification assignment. Classification MIS informationincludes the following:
Required
� Mental health classification.
� Date of classification.
Optional
� Summary of mental health needs.
� General severity of mental health.
� Medications.
� Mental health alerts.
� Clinician’s name.
Assessment/classification of program needs/special needs. A needs assessment isconducted to help match the inmate’s needs to available programming. A well-designed classification MIS will include a structured needs-assessment inventory inthe MIS software (exhibit 4–9). These screens guide the counselor through theassessment/interviewing and data-recording processes. Needs-assessment data cov-erage should include, at a minimum, the following:
� Academic education: highest grade attended, test scores, literacy.
� Vocational: work history, vocational skills.
� Substance abuse: drugs used, frequency/severity/duration of use, treatment his-tory (corrections and community), screening test result, prior substance abuse-related criminal history (e.g., drunk driving, drug possession).
� Treatment and program histories: domestic violence, sex offenses, criminal cog-nitions, life skills (internal and community).
� Presentence investigation and court-ordered treatment recommendations.
� Level of each program/treatment need and classification date.
37
Automated Prison Classification System Features and Functions
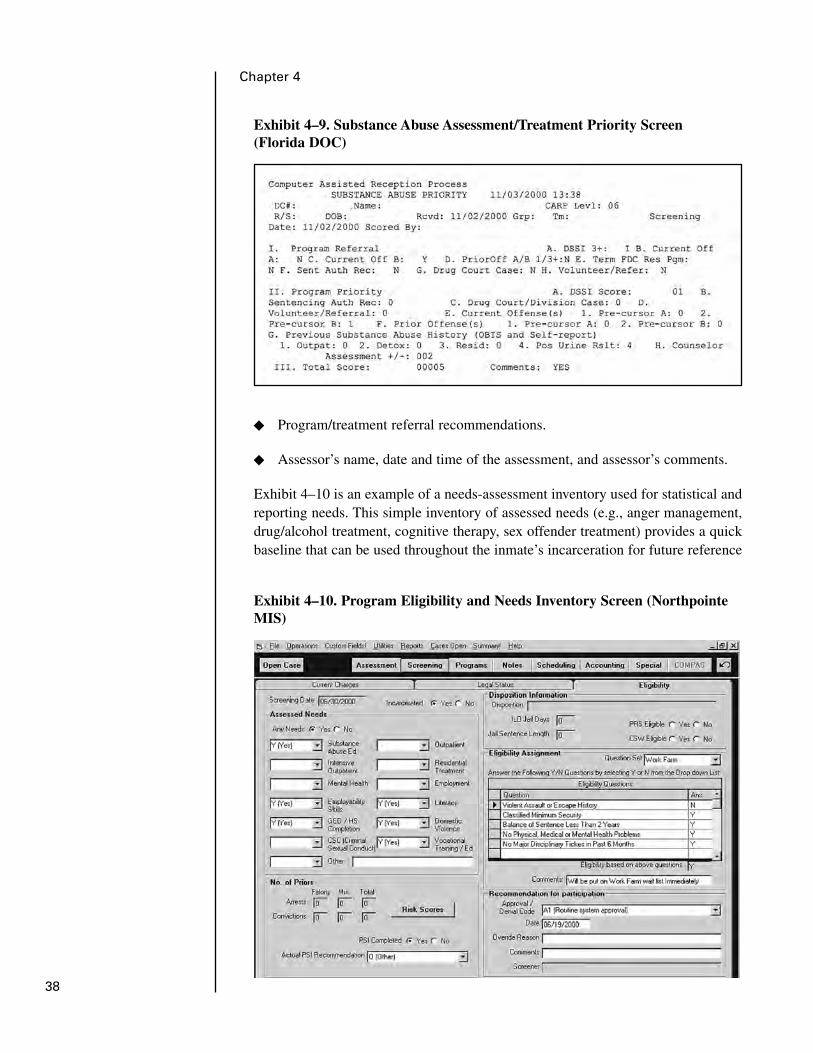
38
Chapter 4
Exhibit 4–9. Substance Abuse Assessment/Treatment Priority Screen (Florida DOC)
� Program/treatment referral recommendations.
� Assessor’s name, date and time of the assessment, and assessor’s comments.
Exhibit 4–10 is an example of a needs-assessment inventory used for statistical andreporting needs. This simple inventory of assessed needs (e.g., anger management,drug/alcohol treatment, cognitive therapy, sex offender treatment) provides a quickbaseline that can be used throughout the inmate’s incarceration for future reference
Exhibit 4–10. Program Eligibility and Needs Inventory Screen (NorthpointeMIS)

39
Automated Prison Classification System Features and Functions
and for treatment referral status. The MIS can automatically provide eligibility sta-tus for each program or work assignment. A structured eligibility matrix enablesobjective eligibility recommendations based on department policy, documents theeligibility determination, and provides for overrides with a documented reason.
Transfer Assignment
After the above classification processes are completed, the inmate must be assignedto a specific facility. In some cases, only one facility may be appropriate; at the otherextreme, several prisons that offer the same security level may have available bed-space, but they may have different program options. Transfer priority must also beassigned. Priorities and assignments must then be matched with facility andbus/transfer availability. Data inputs must include the following:
� Bed and bus-seat availability.
� Target transfer facility or facilities.
� Transfer request target date(s).
� Priority transfer status.
� Transfer type (e.g., initial classification, reclassification, medical).
� Actual transfer date.
� Transport options (e.g., bus number).
� Destination facility arrival date.
Exhibit 4–11. Sample Bed Identification Screen (New York DOCS)

40
Chapter 4
Exhibit 4–12. Transportation System Menu Screen (South Carolina DOC)
For a transfer scheduling/assignment system to be fully automated (and for a hous-ing assignment system to work), every prison bed must be documented in the MIS(exhibit 4–11).
The current location of each inmate must be automatically tracked and routinelyupdated. Tracking an inmate’s location can be more complex than tracking the basicbed assignment. For instance, an inmate may be assigned a bed and be temporarilyout (e.g., in court). Current technologies have enabled tracking and logging of aninmate’s movement throughout the facility. Information processing technologiesthat facilitate tracking include barcoded ID cards or bracelets that are swipedthrough monitoring stations as inmates move through the facility.
Exhibit 4–12 illustrates the components of a transfer scheduling system. Exhibit4–13 shows the “Add a Transfer Request” screen from the South Carolina MIS,which logs transfer requests in the system’s transfer queue.
Internal Classification
All prisons must sort inmates according to internal risk to minimize risks of vio-lence and exploitation of weaker by stronger inmates. Decisions involve selectinginmates for work outside the perimeter or in the administration building and for sin-gle cells, double cells, and dorms. However, few states have formal, objective inter-nal custody classification systems. It is safe to assume that all states have formalprocedures for identifying protective custody cases; a few use psychological or

41
Automated Prison Classification System Features and Functions
Exhibit 4–13. Transfer Request Screen (South Carolina DOC)
behavioral instruments (e.g., the Adult Inmate Management System [AIMS]) toidentify predatory and vulnerable inmate types.
Because formal custody classification systems are of recent origin (see Hardymanet al., 2002; see also chapter 8), their information requirements are not widely estab-lished and there is no clear consensus as to what data elements are required. As inexternal classification assignments, most of the needed information should havealready been collected, stored, and made ready for use by classification staff. At thepresent state of development of internal classification systems, data elementsinclude the following:
Minimum mandatory data elements
� Gang membership and affiliations.
� Protective custody indicators.
� Medical/mental health alerts.
� Seriousness of current offense.
� Prison institutional behavior and disciplinary history.
Optional additional data elements
� Sentence length.

42
Chapter 4
� Family and community ties.
� Classification officer name, date, and comments.
One example of a formal internal classification system is the Florida Risk and NeedsModel (RNM). Low-risk inmates with relatively little time left to serve are in highdemand for competing work interests within the prison (e.g., outside work crews,work release, and other programs). RNM attempts objective quantification of cus-tody and of all needs and treatment requirements of the inmate so that classificationcan authoritatively adjudicate between the competing interests within the prison.The gang module compiles gang data for initial and subsequent security threatgroup (STG) membership information (exhibit 4–14). Data entry coding categorizesthe information (e.g., A = inmate indicated membership, B = inmate allies with agang, C = enemies of inmate’s gang).
Exhibit 4–15, also from the Florida RNM, illustrates how the system compiles andautomatically scores outside influences, attitude and motivation, internal manage-ment, and restructuring potential (RP). Outside influences are entered using valuesof A through C or D for each item. The system then enters a corresponding pointvalue (0, 1, 2, or 3) and automatically totals this section.
Exhibit 4–16, from the same RNM, inventories the inmate’s attitude and motivationto work and participate in programs. Entries are coded from A (recommended toparticipate in any programs during incarceration) through D (not recommended toparticipate in any programs during incarceration). Inmate programs and workassignments (i.e., items 2 and 3 on the screen) are then entered. The classificationofficer then subjectively rates the inmate’s interest and motivation (item 4, based onthe interview and personal interaction) as good, fair, or poor. Section IV of thisscreen requires verification of any violent felony during the current incarceration
Exhibit 4–14. Inmate Risk and Needs Gang Data Screen (Florida DOC)
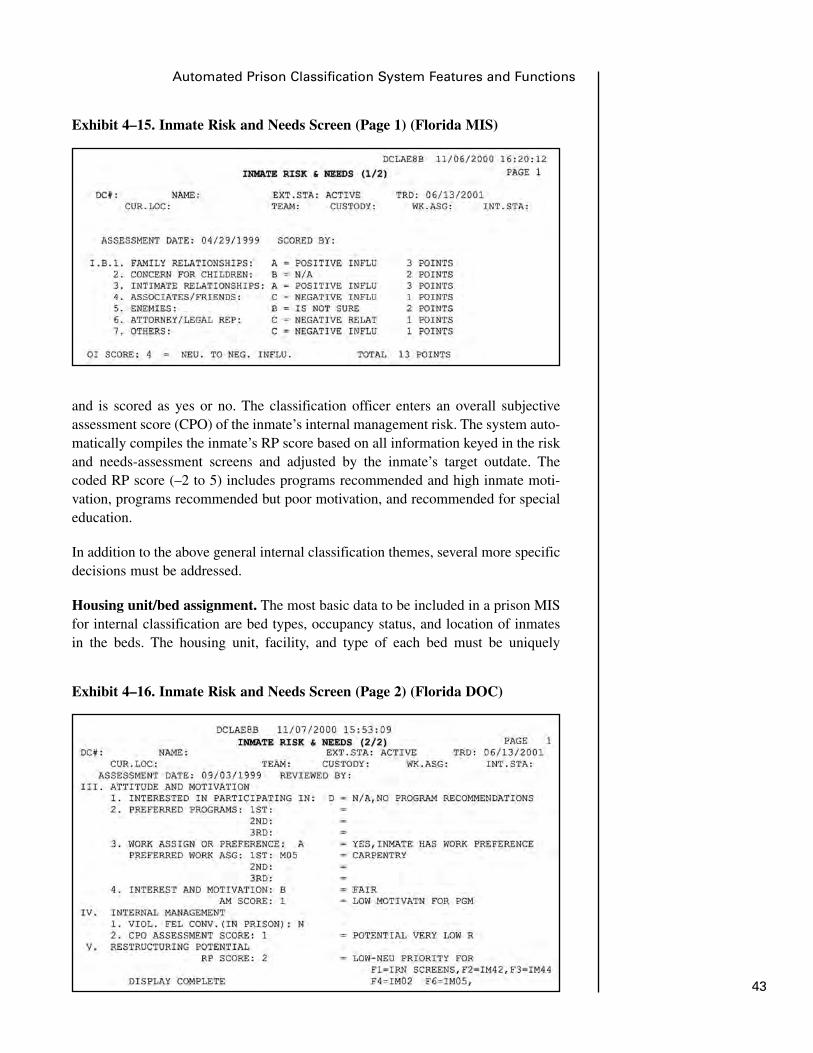
43
Automated Prison Classification System Features and Functions
Exhibit 4–15. Inmate Risk and Needs Screen (Page 1) (Florida MIS)
Exhibit 4–16. Inmate Risk and Needs Screen (Page 2) (Florida DOC)
and is scored as yes or no. The classification officer enters an overall subjectiveassessment score (CPO) of the inmate’s internal management risk. The system auto-matically compiles the inmate’s RP score based on all information keyed in the riskand needs-assessment screens and adjusted by the inmate’s target outdate. Thecoded RP score (–2 to 5) includes programs recommended and high inmate moti-vation, programs recommended but poor motivation, and recommended for specialeducation.
In addition to the above general internal classification themes, several more specificdecisions must be addressed.
Housing unit/bed assignment. The most basic data to be included in a prison MISfor internal classification are bed types, occupancy status, and location of inmatesin the beds. The housing unit, facility, and type of each bed must be uniquely
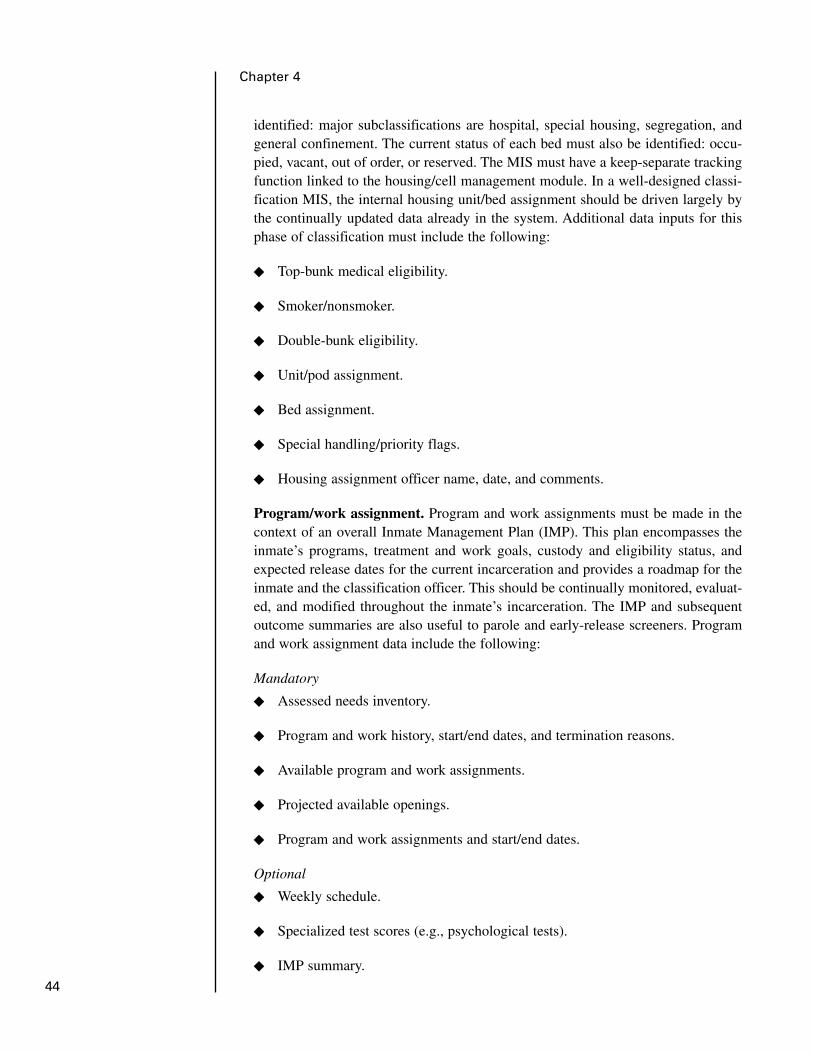
identified: major subclassifications are hospital, special housing, segregation, andgeneral confinement. The current status of each bed must also be identified: occu-pied, vacant, out of order, or reserved. The MIS must have a keep-separate trackingfunction linked to the housing/cell management module. In a well-designed classi-fication MIS, the internal housing unit/bed assignment should be driven largely bythe continually updated data already in the system. Additional data inputs for thisphase of classification must include the following:
� Top-bunk medical eligibility.
� Smoker/nonsmoker.
� Double-bunk eligibility.
� Unit/pod assignment.
� Bed assignment.
� Special handling/priority flags.
� Housing assignment officer name, date, and comments.
Program/work assignment. Program and work assignments must be made in thecontext of an overall Inmate Management Plan (IMP). This plan encompasses theinmate’s programs, treatment and work goals, custody and eligibility status, andexpected release dates for the current incarceration and provides a roadmap for theinmate and the classification officer. This should be continually monitored, evaluat-ed, and modified throughout the inmate’s incarceration. The IMP and subsequentoutcome summaries are also useful to parole and early-release screeners. Programand work assignment data include the following:
Mandatory
� Assessed needs inventory.
� Program and work history, start/end dates, and termination reasons.
� Available program and work assignments.
� Projected available openings.
� Program and work assignments and start/end dates.
Optional
� Weekly schedule.
� Specialized test scores (e.g., psychological tests).
� IMP summary.
44
Chapter 4
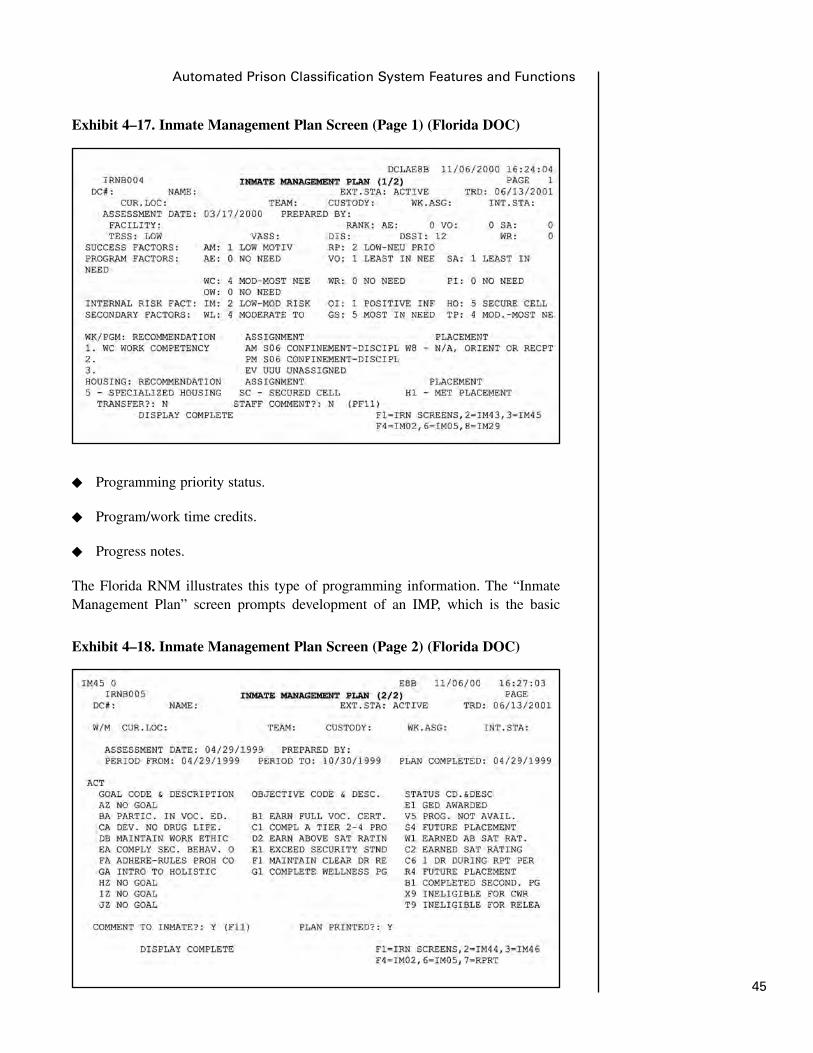
45
Automated Prison Classification System Features and Functions
Exhibit 4–17. Inmate Management Plan Screen (Page 1) (Florida DOC)
� Programming priority status.
� Program/work time credits.
� Progress notes.
The Florida RNM illustrates this type of programming information. The “InmateManagement Plan” screen prompts development of an IMP, which is the basic
Exhibit 4–18. Inmate Management Plan Screen (Page 2) (Florida DOC)

46
Chapter 4
Exhibit 4–20. Substance Abuse Program Participation Screen (Florida DOC)
means by which key classification decisions are made and documented and bywhich progress is tracked throughout the inmate’s incarceration in the system(exhibits 4–17 and 4–18). The IMP is reviewed at least annually and comprises pri-mary work or program recommendations, housing recommendations, and goals andobjectives to be achieved during incarceration. The site summary appendixes pro-vide additional detailed information about these screens.
Screen 2 of the IMP documents the objectives for the inmate’s next reporting periodbased on previous goals and current progress toward meeting each goal.
Exhibit 4–19. Offender Assignment Screen (New Jersey DOC)

47
Automated Prison Classification System Features and Functions
Exhibit 4–19, from the New Jersey system, illustrates recording and tracking ofinmates’ current work assignments and schedule, work assignment history, andcompensation status information.
Exhibit 4–20, from the Florida MIS, shows an inmate “Substance Abuse ProgramParticipation” data entry screen for alcohol and drug programs.
Reclassification
A key process in a well-designed, objective classification is routine classificationreview. This may or may not result in a change in the inmate’s classification. As withinitial security/custody classification and housing/transfer decisions, reclassificationshould be supported by data collected routinely over time. Accurate, verified dataon disciplinary behaviors, program performance and attendance, and updated legalstatus are important. This component of the classification process in an automatedsystem is facilitated by the functionality (data organization features) of the software.However, the system user must record reclassification decisions and any otherchange in housing. Data inputs should include the following:
� Scores for each item on the reclassification instrument.
� Override (yes/no) and override reason.
� Classification review date and reason.
� New external security classification.
� New internal custody classification.
� New facility assignment.
� New cell/unit assignment.
� Transfer order and actual transfer date and time.
� Special handling/priority flags.
� Classification officer’s name and comments.
The New Jersey classification MIS offers a useful example of reclassification(exhibit 4–21). It provides all pertinent information including an easy-to-use reclas-sification screen that inventories the last review type, result, reason, and date andother relevant factors.
Community/Prerelease Risk Assessment
The process of screening and assessing inmates for early release into the communityis increasingly viewed as an appropriate and important component of the classifica-tion unit. In a well-designed classification MIS, the classification team should be

48
Chapter 4
informed about all aspects of the inmate’s social history, vocational and skills back-ground, and incarceration history.
Assessment for risk of community placement and offender and case managementstrategies follows logically given conceptual linkages and information overlap withinitial and internal classifications. (The roles of institutional classification and com-munity risk assessment are discussed in chapter 3.) As previously mentioned, com-munity risk classification requires a broader inventory of risk, criminogenic, andneeds factors (exhibit 4–22). Screening for community risk is increasingly seen asrequiring a different assessment instrument with its own validation and reliabilityscrutiny. (See also chapter 8.) Many of these data (e.g., age, criminal history) can beaccessed in the existing MIS design. Additional data elements covering both risksand strengths may include the following:
� Peer and criminal associates.
� Criminal personality factors.
� Criminal cognitions/thinking styles.
� High-crime residential environment.
� Social support versus isolation/loneliness.
Exhibit 4–21. Inmate Status Review Screen (New Jersey DOC)
� Family criminality.
� Social stability factors.
� Work/education opportunities on release.
� Financial status.
� History of community noncompliance (technical violations).
� Community/prerelease risk instrument scores and decisions.
� Override (yes/no) and override reason.
� Officer’s name and assessment date.
Release
The final inmate release decision requires a review of time computations and thescheduled release date, other agency holds and warrants, compliance requirementsregarding victim notifications, and offender registration lists. Data inputs, many pre-viously entered in the system, must cover these factors to support this function:
� Sentence dates and lengths.
� Concurrent versus consecutive sentences.
� Statutory minimums/maximums.
� Time credits.
� Victim/sex offender notification list.
� Holds and warrants information.
� Parole date and conditions.
� Release date and reason.
� Officer’s name.
� Comment.
System Functionality
Data must be stored, moved, and displayed as output by the MIS to support theworkflow and the user interface (see chapter 5). The display of information on ascreen, the sequencing of screens, and the links between systems and databases all
49
Automated Prison Classification System Features and Functions

50
Chapter 4
must support the workflow and the immediate function. The ability of an MIS tomove and combine information electronically (its functionality) affects three mainactivities:
1. Eliminating or minimizing duplicate entries: There is no need to enter aninmate’s date of birth more than once. Paper documents can therefore bepreprinted with the inmate’s date of birth.
2. Applying rules to combine data: The possibilities are almost endless. Two appli-cations are as follows:
◆ Dates and cases can be sorted and combined by numerous rules (e.g., sched-uling to create lists of inmates and decisions that are due or overdue).
◆ Risk factors can be scored and combined mathematically in classificationinstruments using various algorithms.
3. Quickly moving data to decision points: The system should automate the move-ment of information, raw or combined, as follows:
◆ From one location to another. For instance, a classification recommendationcan be sent electronically from the referring facility to the central officereviewing unit.
Exhibit 4–22. Risk Assessment Criminal History Screen (Northpointe MIS)
51
Automated Prison Classification System Features and Functions
◆ From one work process to another. For instance, a medical classificationcan be moved to a transfer screen. In addition, the MIS can automaticallypopulate certain data fields intuitively (e.g., officer’s name and date fields).
The functionality of any MIS is limited by several constraints. The most importantof these are the following:
1. MIS content: Data coverage is a fundamental constraint. For instance, if the dis-ciplinary system or the inmate’s location is not in the MIS, functionality in thisarea will be severely limited.
2. Hardware access and availability: For instance, if caseworkers have pooraccess to a terminal, moving information among them with speed or precisionmay be impossible.
3. Programming capability: Unavailable programming resources can result inpoor data manipulation, missing key management reports, and severely cur-tailed development flexibility.
4. Lack of system integration: Software module/database integration affects theflow of data between systems.
Electronically available preincarceration information can be easily shared and trans-ferred among relevant units and made accessible by the department MIS. Informa-tion about legal dates, current offense(s), criminal history, escapes, and disciplinaryhistory should likewise be easily accessible by the classification system modules.Information about security, custody, medical/mental health, programs, classifica-tions, and an inmate’s current location should be easily accessible to the transfermodule. Data on sentences and jail time should be easily accessible by the timecomputation module. Program needs should be linked to program enrollments.
The sections below present brief examples of software design functionality that sup-ports classification and related management processes.
Intake
Identification procedures and acceptance issues. Current advances in computingand increased memory facilitate inclusion of automated biometrics and fingerprintidentification, which can be matched to state and national records to verify aninmate’s identity. An automated cross-reference to aliases can attach alias data to themaster person record.
Electronic capture of a photo image (mug shot) and data on scars, marks, and tat-toos can be coordinated with other identifying information. Photo image data can besearched for other useful characteristics (e.g., hair color, complexion, identifyingmarks), for future query or reference, and for matching in investigations. In a fully
integrated MIS design, court commitment identification data are electronicallytransferred and automatically populate appropriate fields in the intake screens oncepositive identification has been established and the inmate’s record has been creat-ed. Legal status can be evaluated using decision logic software that is designed intothe MIS, which can also include an inventory of required information for both iden-tification and acceptance criteria. As acceptance criteria are compiled, the systemcan automatically recommend eligibility for acceptance into the prison system.
Assigning system identification. A master person identification system is a keycomponent of a prison MIS. Each inmate is assigned a unique identifier. If theinmate comes through the prison system repeatedly, the same master identifier isattached to the current incarceration record, typically with an added suffix or prefix.Each inmate will have only one master record with unlimited associated case/incarceration records. Each case record is unique and stored permanently in the sys-tem. If the inmate has not been in the system before, the system automaticallyassigns a unique person identifier.
Booking. A key function of the MIS is to assist users by automatically populatingfields, organizing data, and calculating values. For example, instant offense infor-mation and court dates may be imported from an integrated court MIS. Parole rev-ocation details should also automatically populate the appropriate fields in intakescreens. Criminal history and detainer data ideally would be accessed and trans-ferred by direct interface with state, national, and international criminal history andLaw Enforcement Information Network (LEIN) databases automatically once a pos-itive identification is established.
The MIS design should organize current offense and criminal history information tofacilitate classification decisions and related processes by providing fields in whichto record offense category (e.g., assault, fraud, drug) and crime class (e.g., felonytype, misdemeanor, federal). This helps categorize offense histories forstatistical/analytical purposes (e.g., automated calculation of classification riskscore).
The system should compute and store the inmate’s age based on date of birth. Stat-ic demographic data (e.g., gender, race, current/prior gang membership/affiliation,family history, substance use/abuse, medical/mental health, special needs) from pre-vious records automatically populate the current case record fields of the bookingscreen. In addition, the MIS should automatically search for previous, known ene-mies who are still in the prison and link them to the inmate’s current record. Design-ing this function into the MIS significantly increases the reliability/consistency of the data and the efficiency of the intake and booking processes.
Time computation. Time computation is a main challenge and often reflects thestrength or weakness of MIS functionality. This is a complex process that can bedone more accurately and quickly by an MIS software algorithm than by a person.However, sentencing laws are imperfect and changeable. Sentencing policies maybe inconsistent with each other or with prison policies and may not foresee all con-tingencies. Furthermore, sentencing law is constantly changing, which requires52
Chapter 4
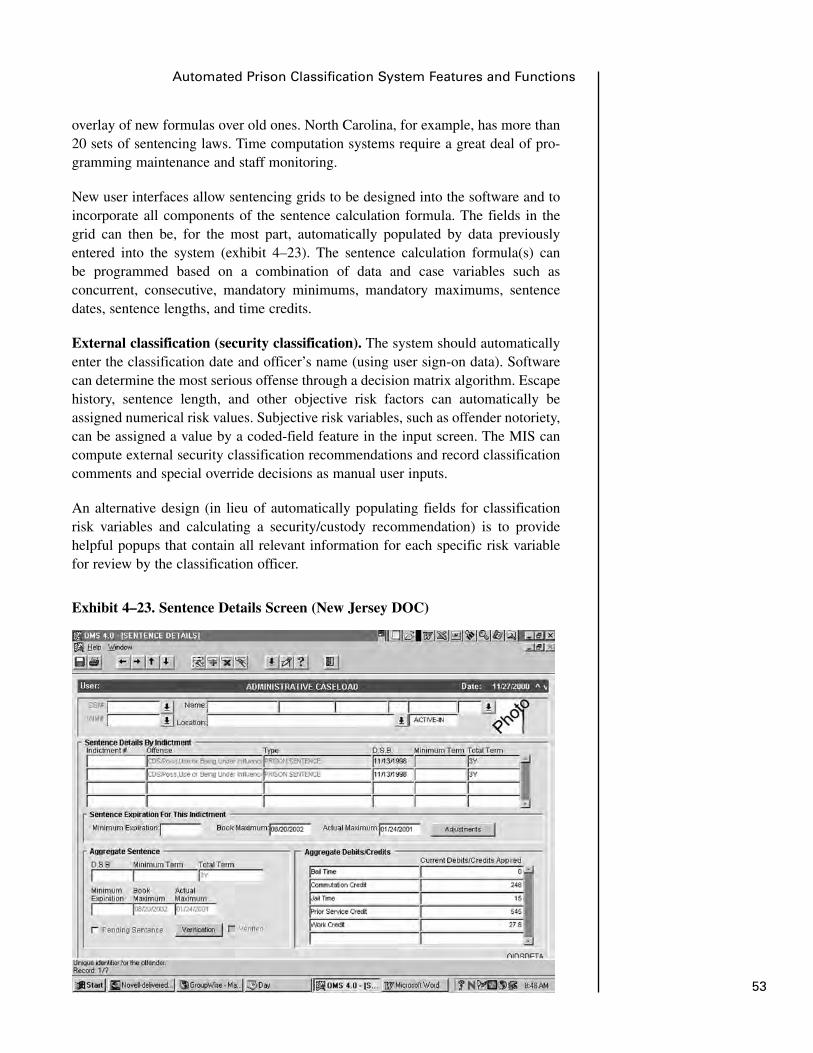
53
Automated Prison Classification System Features and Functions
overlay of new formulas over old ones. North Carolina, for example, has more than20 sets of sentencing laws. Time computation systems require a great deal of pro-gramming maintenance and staff monitoring.
New user interfaces allow sentencing grids to be designed into the software and toincorporate all components of the sentence calculation formula. The fields in thegrid can then be, for the most part, automatically populated by data previouslyentered into the system (exhibit 4–23). The sentence calculation formula(s) canbe programmed based on a combination of data and case variables such asconcurrent, consecutive, mandatory minimums, mandatory maximums, sentencedates, sentence lengths, and time credits.
External classification (security classification). The system should automaticallyenter the classification date and officer’s name (using user sign-on data). Softwarecan determine the most serious offense through a decision matrix algorithm. Escapehistory, sentence length, and other objective risk factors can automatically beassigned numerical risk values. Subjective risk variables, such as offender notoriety,can be assigned a value by a coded-field feature in the input screen. The MIS cancompute external security classification recommendations and record classificationcomments and special override decisions as manual user inputs.
An alternative design (in lieu of automatically populating fields for classificationrisk variables and calculating a security/custody recommendation) is to providehelpful popups that contain all relevant information for each specific risk variablefor review by the classification officer.
Exhibit 4–23. Sentence Details Screen (New Jersey DOC)
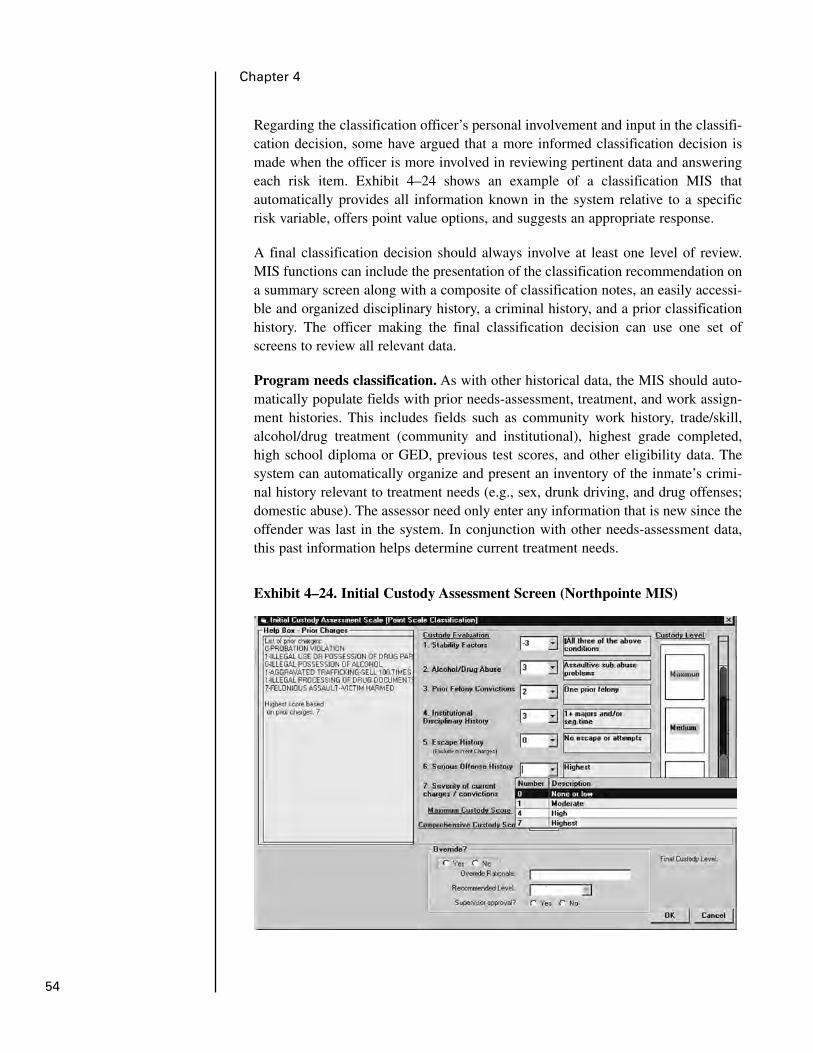
54
Chapter 4
Regarding the classification officer’s personal involvement and input in the classifi-cation decision, some have argued that a more informed classification decision ismade when the officer is more involved in reviewing pertinent data and answeringeach risk item. Exhibit 4–24 shows an example of a classification MIS thatautomatically provides all information known in the system relative to a specificrisk variable, offers point value options, and suggests an appropriate response.
A final classification decision should always involve at least one level of review.MIS functions can include the presentation of the classification recommendation ona summary screen along with a composite of classification notes, an easily accessi-ble and organized disciplinary history, a criminal history, and a prior classificationhistory. The officer making the final classification decision can use one set ofscreens to review all relevant data.
Program needs classification. As with other historical data, the MIS should auto-matically populate fields with prior needs-assessment, treatment, and work assign-ment histories. This includes fields such as community work history, trade/skill,alcohol/drug treatment (community and institutional), highest grade completed,high school diploma or GED, previous test scores, and other eligibility data. Thesystem can automatically organize and present an inventory of the inmate’s crimi-nal history relevant to treatment needs (e.g., sex, drunk driving, and drug offenses;domestic abuse). The assessor need only enter any information that is new since theoffender was last in the system. In conjunction with other needs-assessment data,this past information helps determine current treatment needs.
Exhibit 4–24. Initial Custody Assessment Screen (Northpointe MIS)
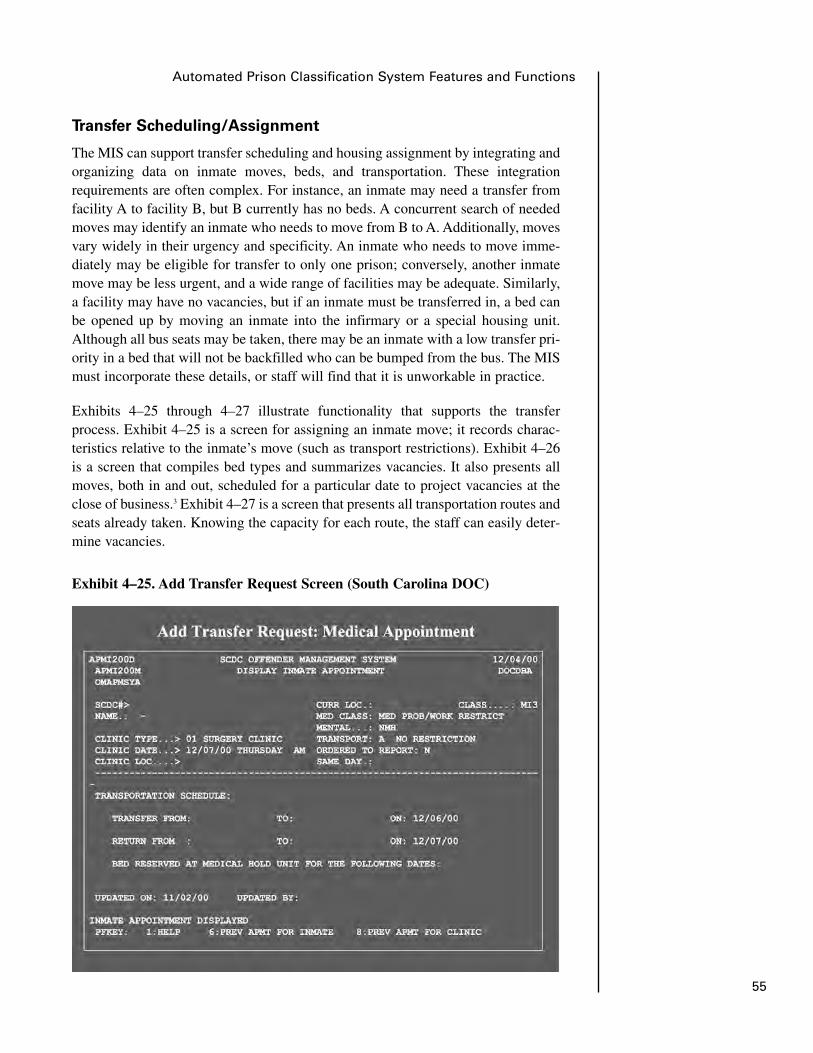
55
Automated Prison Classification System Features and Functions
Transfer Scheduling/Assignment
The MIS can support transfer scheduling and housing assignment by integrating andorganizing data on inmate moves, beds, and transportation. These integrationrequirements are often complex. For instance, an inmate may need a transfer fromfacility A to facility B, but B currently has no beds. A concurrent search of neededmoves may identify an inmate who needs to move from B to A. Additionally, movesvary widely in their urgency and specificity. An inmate who needs to move imme-diately may be eligible for transfer to only one prison; conversely, another inmatemove may be less urgent, and a wide range of facilities may be adequate. Similarly,a facility may have no vacancies, but if an inmate must be transferred in, a bed canbe opened up by moving an inmate into the infirmary or a special housing unit.Although all bus seats may be taken, there may be an inmate with a low transfer pri-ority in a bed that will not be backfilled who can be bumped from the bus. The MISmust incorporate these details, or staff will find that it is unworkable in practice.
Exhibits 4–25 through 4–27 illustrate functionality that supports the transferprocess. Exhibit 4–25 is a screen for assigning an inmate move; it records charac-teristics relative to the inmate’s move (such as transport restrictions). Exhibit 4–26is a screen that compiles bed types and summarizes vacancies. It also presents allmoves, both in and out, scheduled for a particular date to project vacancies at theclose of business.3 Exhibit 4–27 is a screen that presents all transportation routes andseats already taken. Knowing the capacity for each route, the staff can easily deter-mine vacancies.
Exhibit 4–25. Add Transfer Request Screen (South Carolina DOC)
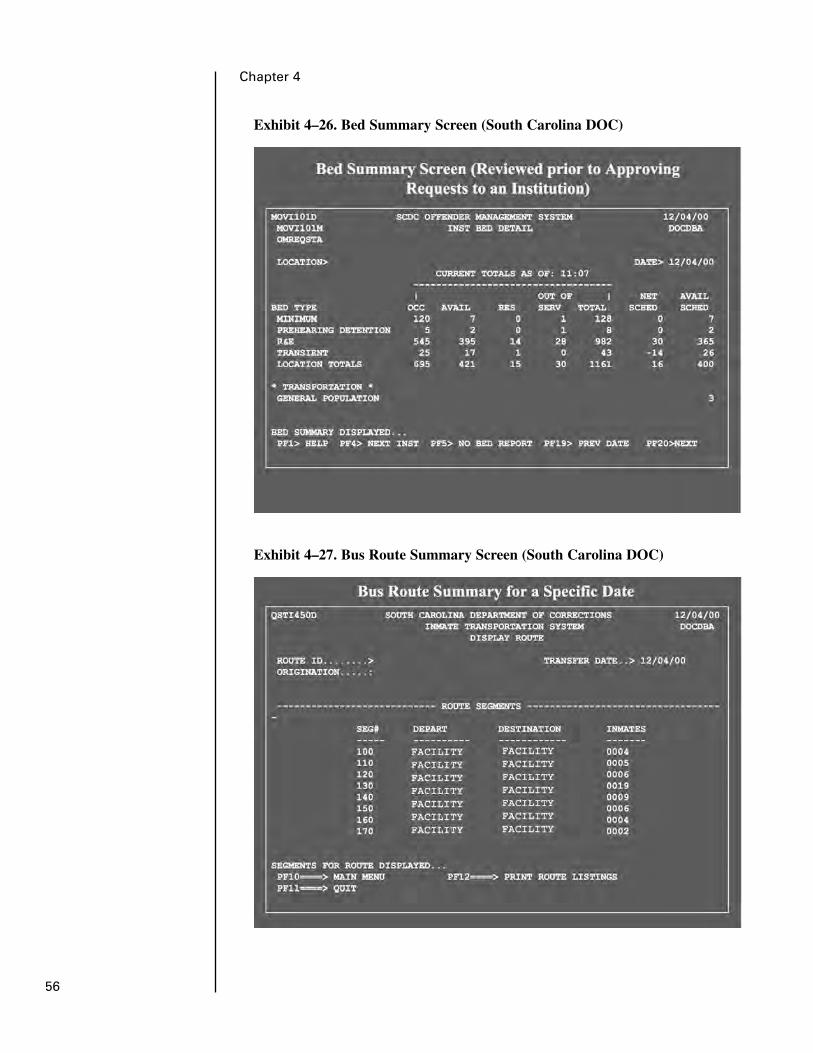
56
Chapter 4
Exhibit 4–27. Bus Route Summary Screen (South Carolina DOC)
Exhibit 4–26. Bed Summary Screen (South Carolina DOC)
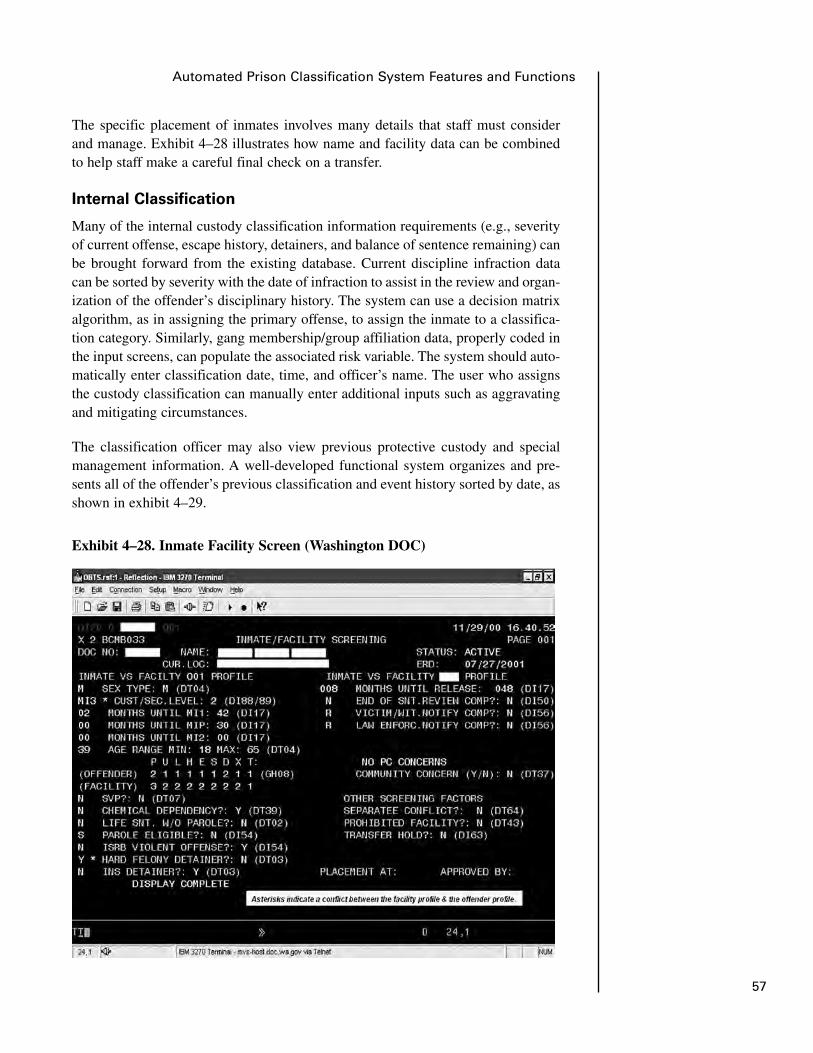
57
Automated Prison Classification System Features and Functions
The specific placement of inmates involves many details that staff must considerand manage. Exhibit 4–28 illustrates how name and facility data can be combinedto help staff make a careful final check on a transfer.
Internal Classification
Many of the internal custody classification information requirements (e.g., severityof current offense, escape history, detainers, and balance of sentence remaining) canbe brought forward from the existing database. Current discipline infraction datacan be sorted by severity with the date of infraction to assist in the review and organ-ization of the offender’s disciplinary history. The system can use a decision matrixalgorithm, as in assigning the primary offense, to assign the inmate to a classifica-tion category. Similarly, gang membership/group affiliation data, properly coded inthe input screens, can populate the associated risk variable. The system should auto-matically enter classification date, time, and officer’s name. The user who assignsthe custody classification can manually enter additional inputs such as aggravatingand mitigating circumstances.
The classification officer may also view previous protective custody and specialmanagement information. A well-developed functional system organizes and pre-sents all of the offender’s previous classification and event history sorted by date, asshown in exhibit 4–29.
Exhibit 4–28. Inmate Facility Screen (Washington DOC)
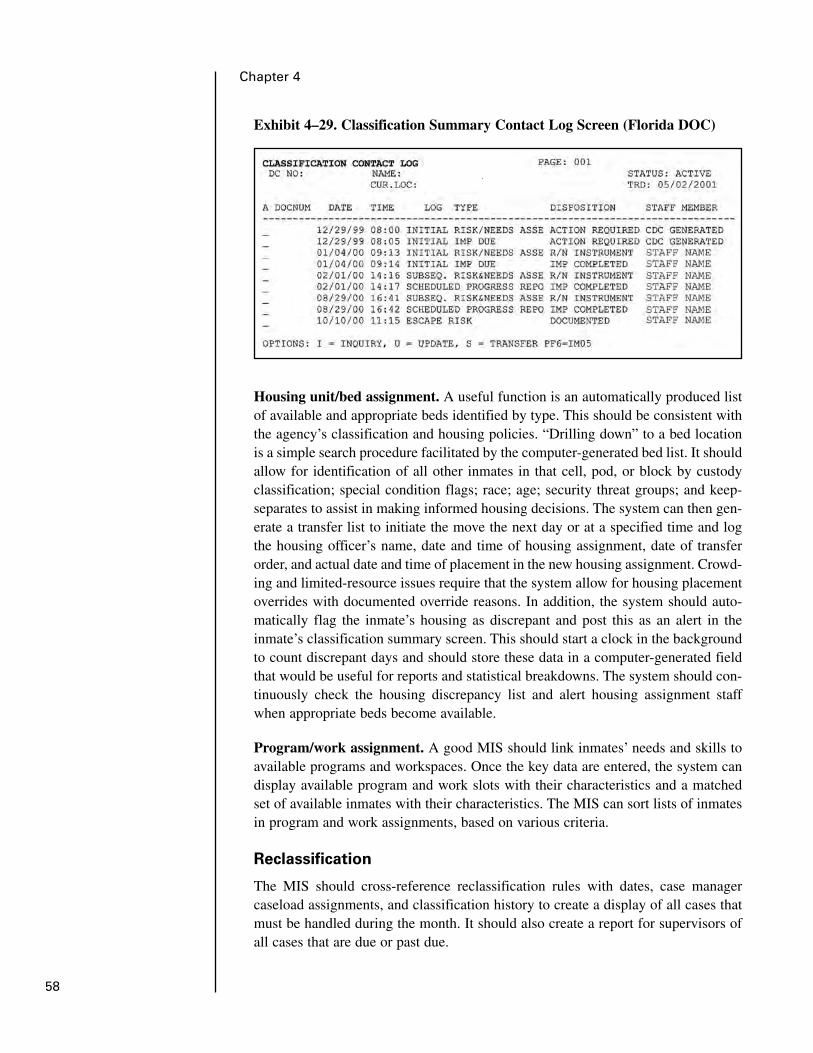
58
Chapter 4
Housing unit/bed assignment. A useful function is an automatically produced listof available and appropriate beds identified by type. This should be consistent withthe agency’s classification and housing policies. “Drilling down” to a bed locationis a simple search procedure facilitated by the computer-generated bed list. It shouldallow for identification of all other inmates in that cell, pod, or block by custodyclassification; special condition flags; race; age; security threat groups; and keep-separates to assist in making informed housing decisions. The system can then gen-erate a transfer list to initiate the move the next day or at a specified time and logthe housing officer’s name, date and time of housing assignment, date of transferorder, and actual date and time of placement in the new housing assignment. Crowd-ing and limited-resource issues require that the system allow for housing placementoverrides with documented override reasons. In addition, the system should auto-matically flag the inmate’s housing as discrepant and post this as an alert in theinmate’s classification summary screen. This should start a clock in the backgroundto count discrepant days and should store these data in a computer-generated fieldthat would be useful for reports and statistical breakdowns. The system should con-tinuously check the housing discrepancy list and alert housing assignment staffwhen appropriate beds become available.
Program/work assignment. A good MIS should link inmates’ needs and skills toavailable programs and workspaces. Once the key data are entered, the system candisplay available program and work slots with their characteristics and a matchedset of available inmates with their characteristics. The MIS can sort lists of inmatesin program and work assignments, based on various criteria.
Reclassification
The MIS should cross-reference reclassification rules with dates, case managercaseload assignments, and classification history to create a display of all cases thatmust be handled during the month. It should also create a report for supervisors ofall cases that are due or past due.
Exhibit 4–29. Classification Summary Contact Log Screen (Florida DOC)
Additionally, triggers or warnings should be programmed into the MIS, flagging aninmate for review based on aggravating or mitigating circumstances and other rele-vant factors. These may include disciplinary conviction, change in legal status,change in balance of sentence threshold, program completion, and change in med-ical or mental health classification.
The MIS should automatically score the reclassification instrument and allow staffto input their professional judgment and their agreement or disagreement with thenumerically scored recommendation. Exhibit 4–30 shows a reclassification screen.
As an inmate’s security or custody classifications change over time, the systemshould automatically calculate and store a computer-generated field for length oftime classified at each custody/security level (minimum, medium, and maximum).This serves several useful purposes, including the production of system-generatedreports or statistics showing current length of time by an inmate at a particular clas-sification status (current date – classification date = time at current classification sta-tus) or the average time served by the population in minimum, medium, ormaximum security. Analysts can then statistically profile the inmate population’slength of incarceration at any classification/custody level (classification change orrelease date – current classification date = total time at a classification status). Thisis useful in determining the actual number of beds needed at each security level asthe number of inmates classified in that a particular security status (i.e., minimum,medium, maximum, or super maximum) and their time spent at that security statusare needed for accurate analysis.
Community/Prerelease Risk Assessment
Associates, the social environment to which the inmate will return, social supports,family criminality, criminal cognitions, stability factors, work/education opportuni-ties on release, financial status, psychopathy, mental health, and history of commu-nity noncompliance are all relevant to decisions regarding community risk.Therefore, all of these factors should be organized and presented by the MIS. Stat-ic data populate the risk variables, supplemented by offender self-report data. Vari-ous procedures for predicting statistical risk, such as multiple regression, logisticregression, and pattern recognition, can be used to compute the predictor scales forcommunity risk.
Release
A well-designed system supports the release process by organizing release infor-mation for staff (exhibit 4–31). The system can compile time computations; flagholds, detainers, and warrant information; and send queries for updated hold,detainer, and warrant checks. In addition, the system can check whether victimsmust be notified and automatically print the notification letter for signature. Thesystem can automatically alert the officer if an offender registration is warranted(e.g., for sex offenders), generate the registration, and pass it on to the appropriatesystem (with signed manual copies to follow). When the final release date and rea-son are entered, a useful function is the calculation and storage of an “overall length
59
Automated Prison Classification System Features and Functions

60
Chapter 4
Exhibit 4–31. Release Notification Status Screen (Washington DOC)
of stay” field for statistical use. At release, the system posts the release event withinmate summary data to the DOC Web site for use by staff, law enforcement, andthe public.
Integration of the prison and parole MISs facilitates automatic creation of a parolecase record on release. This parole case record is automatically populated with per-tinent information that is usually in the prison MIS. Automated interagency messagesystems alert parole administration and the appropriate field office of the inmate’srelease and pending or scheduled contact.
Exhibit 4–30. Custody Reclassification Screen (North Carolina DOC)
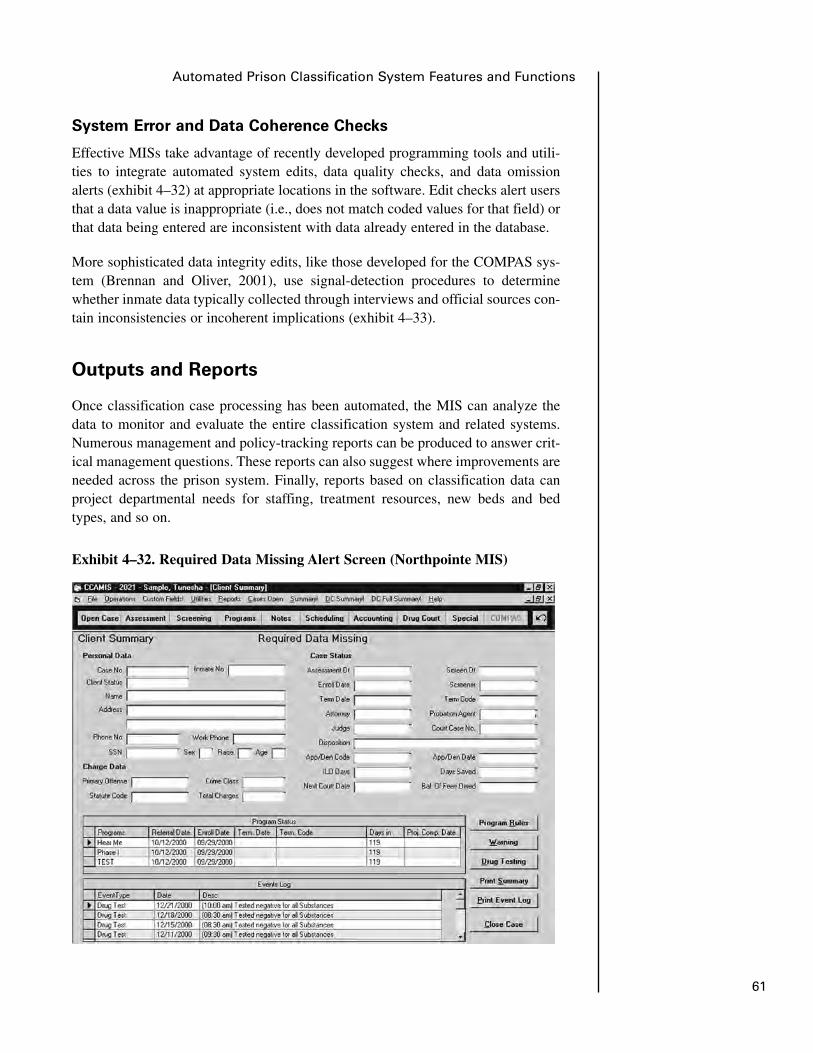
61
Automated Prison Classification System Features and Functions
System Error and Data Coherence Checks
Effective MISs take advantage of recently developed programming tools and utili-ties to integrate automated system edits, data quality checks, and data omissionalerts (exhibit 4–32) at appropriate locations in the software. Edit checks alert usersthat a data value is inappropriate (i.e., does not match coded values for that field) orthat data being entered are inconsistent with data already entered in the database.
More sophisticated data integrity edits, like those developed for the COMPAS sys-tem (Brennan and Oliver, 2001), use signal-detection procedures to determinewhether inmate data typically collected through interviews and official sources con-tain inconsistencies or incoherent implications (exhibit 4–33).
Outputs and Reports
Once classification case processing has been automated, the MIS can analyze thedata to monitor and evaluate the entire classification system and related systems.Numerous management and policy-tracking reports can be produced to answer crit-ical management questions. These reports can also suggest where improvements areneeded across the prison system. Finally, reports based on classification data canproject departmental needs for staffing, treatment resources, new beds and bedtypes, and so on.
Exhibit 4–32. Required Data Missing Alert Screen (Northpointe MIS)
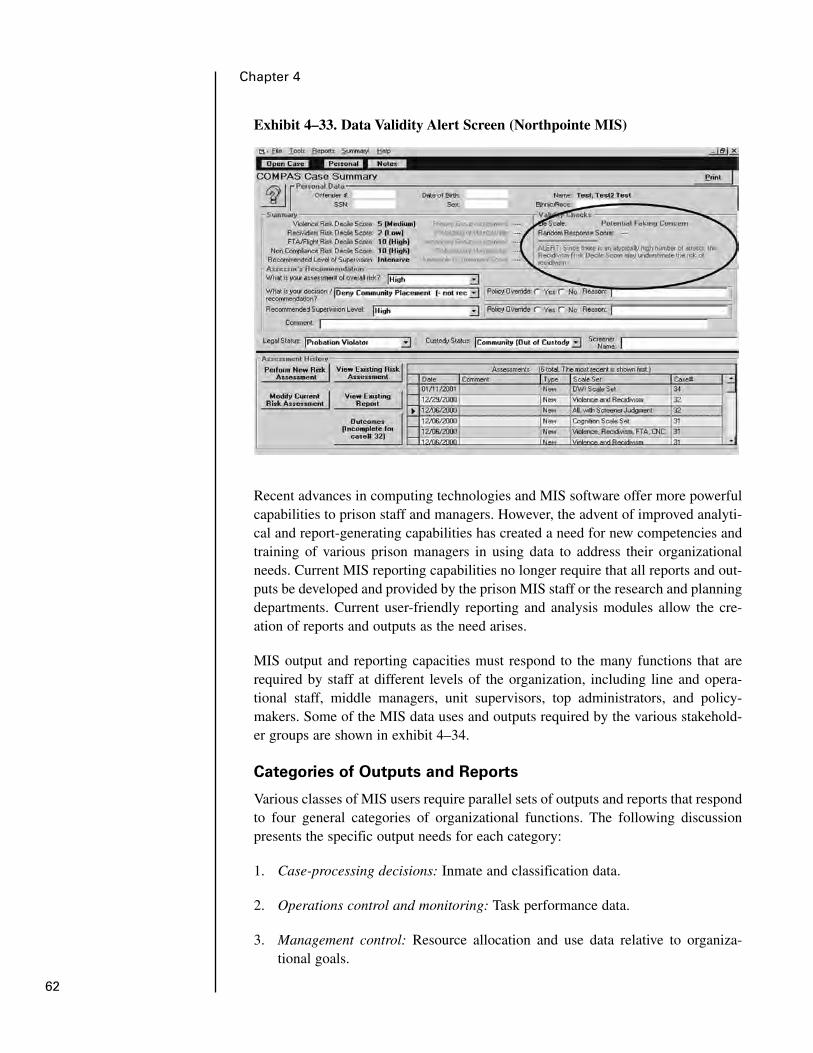
62
Chapter 4
Recent advances in computing technologies and MIS software offer more powerfulcapabilities to prison staff and managers. However, the advent of improved analyti-cal and report-generating capabilities has created a need for new competencies andtraining of various prison managers in using data to address their organizationalneeds. Current MIS reporting capabilities no longer require that all reports and out-puts be developed and provided by the prison MIS staff or the research and planningdepartments. Current user-friendly reporting and analysis modules allow the cre-ation of reports and outputs as the need arises.
MIS output and reporting capacities must respond to the many functions that arerequired by staff at different levels of the organization, including line and opera-tional staff, middle managers, unit supervisors, top administrators, and policy-makers. Some of the MIS data uses and outputs required by the various stakehold-er groups are shown in exhibit 4–34.
Categories of Outputs and Reports
Various classes of MIS users require parallel sets of outputs and reports that respondto four general categories of organizational functions. The following discussionpresents the specific output needs for each category:
1. Case-processing decisions: Inmate and classification data.
2. Operations control and monitoring: Task performance data.
3. Management control: Resource allocation and use data relative to organiza-tional goals.
Exhibit 4–33. Data Validity Alert Screen (Northpointe MIS)

“There is widespread
agreement that incar-
cerated women differ
from their male
counterparts in terms
of their behavior, as
well as issues related
to medical, substance
abuse, mental health,
and family concerns.”
Correctional organi-
zations have become
information driven in
that key decisions
must be justified and
driven by decision-
relevant knowledge.
With the advent of
vast databases, exter-
nal pressures from
legislatures and the
courts to document
performance and
results are mounting.
Budget pressures and
competition for limit-
ed public resources
demand that prison
administrators arm
themselves with the
information necessary
to survive these
policy battles.
63
Automated Prison Classification System Features and Functions
Exhibit 4–34. Agency Staff Output Data Needs
4. Strategic planning and policy analysis: Data relative to organizational objec-tives, resources used to attain those objectives, and policies governing resourceuse and management.
Classification case processing. Classification staff require detailed informationabout specific, named inmates in real time; accuracy of data is paramount. The fol-lowing items are types of output that support this function:
� Inmate labels.
� Schedules and lists of inmates for classification and reclassification.
� Schedules and lists of inmates to process for legislatively mandated initiatives(e.g., DNA, sex offender notification, victim notification).
� Worksheets, such as classification forms, for staff to complete.
� Rosters of program vacancies and inmates awaiting program assignments.
� Preprinted fingerprint cards.
� Rosters of inmates available for movement.
� Housing vacancy reports.
� Preparole reports, for example, on inmates’ institutional adjustment.
Operations control. Control and monitoring of classification-related operations isa main concern of middle management. Reports should be available to track work-load and work quality/efficiency for user-designated time periods (e.g., daily, week-ly, monthly). These time-limited data can be transferred to data analytic charts toestimate trends and exceptions and to produce alerts if a trend line is rising or fallingto a dangerous level. For example, a classification manager may require alerts if thetrend in overrides has risen to excessive levels. Output needs include the following:
� Workflow monitoring.
� Relation of inmate classification to actual housing placement, including dis-crepancy reports.
� Distribution of classification decisions and overrides by the caseworker andfacility.
� Relation of inmates’ program needs to actual program/work assignments.
� Transfer orders that need to be canceled.
� Exception reports, such as enemies in the same prison, data accuracy andcompleteness, inmate releases without victim notification, and sex offendernotification.
Management control. At a higher organizational level, the same data can beprocessed to reflect overall prison operations and the degree to which major prisoncorrectional goals are being met. For example, many of the same operations controland monitoring reports used by unit managers can be aggregated to reflect the oper-ation of the larger organization (e.g., safety charting across the organization).Whereas operations managers use detailed reports on inmate classification andhousing discrepancies to ensure that each discrepancy has an appropriate docu-mented reason, management can use the same report to examine the number ofinmates at a specific classification level and bed availability for that level. Typicalmanagement-level reports might include the following:
� Staff resources (caseload sizes).
� Bed resources (patterns of vacancies, shortfalls).
� Program resources (patterns of vacancies, shortfalls).
� Transportation resources (patterns of empty seats, unnecessary moves).
� Reports of unsuccessful transfers.
� Projections of resource needs, including trends in stock and flow populations byresource variables (e.g., trends in numbers and types of special needs inmates,distribution of security classification types, and education levels).
64
Chapter 4

� Evaluations as needed for measuring the validity and impact of classificationsystems (e.g., evaluations of disciplinary adjustment or completion of appropri-ate programs).
Strategic planning. Strategic planning requires flexible analysis to address multi-ple policy issues. A large range of complex analytical techniques (e.g., simulationprocedures, regression-based forecasting methods, data-mining techniques; seechapter 9) may be required. Strategic tasks include revising organizational objec-tives, forecasting population growth trends to determine resource needs, and devel-oping implementation plans for new programs for specified offender categories.Classification supports strategic planning by providing routine analyses of prisonpopulation subcategories and trends in the size and nature of specific offender clas-sifications. The specification of policy relevant to offender target groups is a criticalcomponent of most alternative sanctioning policies. Classification data must indi-cate which new offender categories are critical to major policy challenges (e.g.,overcrowding and prison population management) or whether offender target cate-gories should be changed. Classification data must also support simulation studieson the impact of policy changes and evaluation studies on program effectiveness forspecified target populations. The range of policy studies is virtually unlimited,which in turn creates the demand for flexible analytical procedures (see chapter 9).
Production of Output Reports
Output reports can be produced in several ways. In the past, traditional mainframesystems often limited outputs to canned reports that had been developed by theprison MIS staff or research department. This restriction is still widespread. Cannedreports typically can be run quickly and routinely without the need for high-levelprogramming skills. A customized or modified report, however, may require time-consuming programming and cause delays, which have produced considerable frus-tration and have in many cases undermined the utility of IT in corrections.
A second approach makes use of relatively user-friendly data analytic packages(e.g., Statview, JMP, Microsoft Excel, and others) and report production packages(e.g., Business Objects Crystal Reports and others) for greater flexibility. Thesethird-party reporting and statistical tools facilitate a somewhat cumbersome butworkable strategy of downloading extract files from the mainframe systems to per-sonal computer (PC) platforms for access by these reporting packages. Exhibit 4–35illustrates this approach as adopted by the South Carolina prison MIS staff. Thisapproach has allowed many prison systems to increase their data analytic andreporting capabilities greatly, introduce more advanced data analytic procedures,and achieve greater flexibility in addressing diverse management and policy prob-lems such as crowding analysis and complex projections and forecasting.
Recently developed MIS graphical user interface (GUI) and object-oriented userinterface (OOUI) applications provide integrated and ad hoc reporting capabilitieswithin the system (see chapter 9 for details of some of the more advanced proce-dures). In addition to generating numerous canned reports, these new systems
65
Automated Prison Classification System Features and Functions
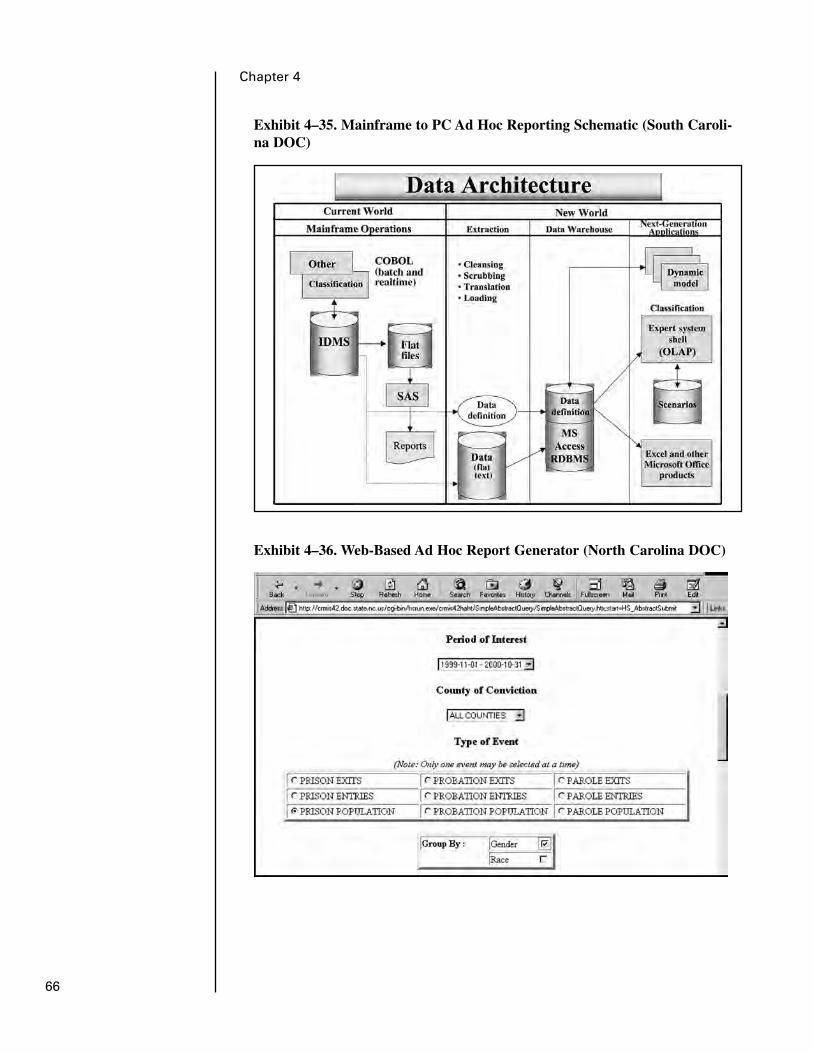
66
Chapter 4
Exhibit 4–35. Mainframe to PC Ad Hoc Reporting Schematic (South Caroli-na DOC)
Exhibit 4–36. Web-Based Ad Hoc Report Generator (North Carolina DOC)
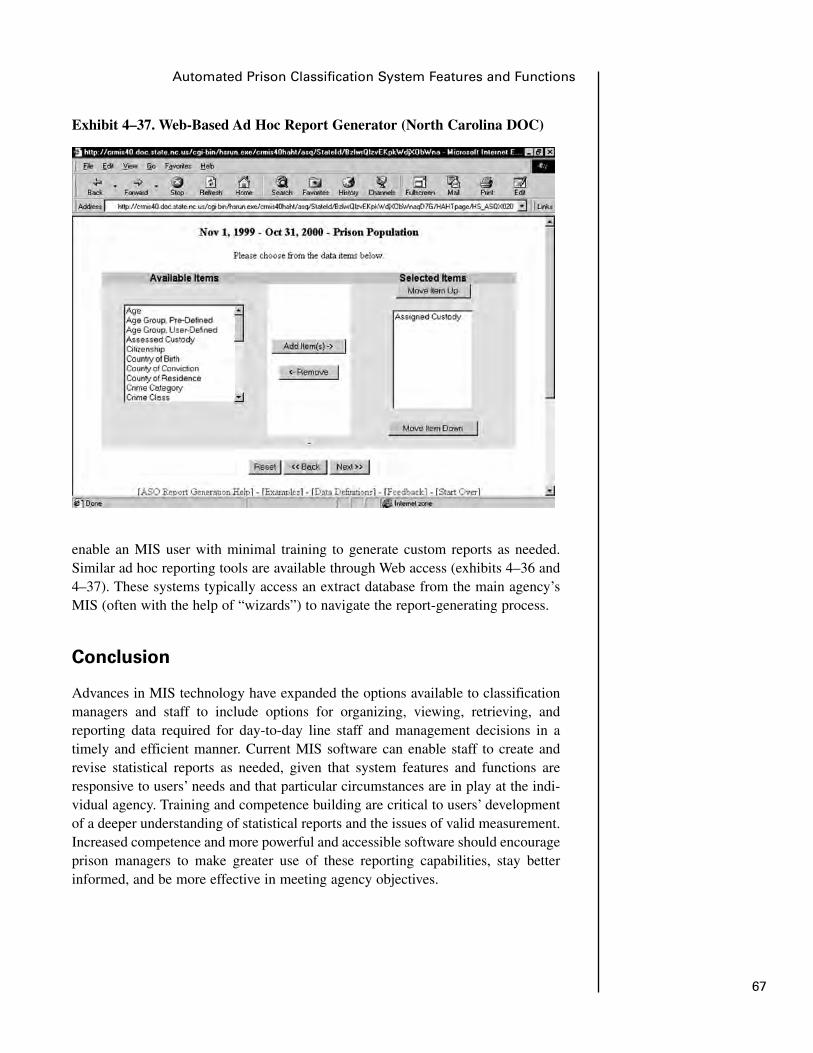
67
Automated Prison Classification System Features and Functions
Exhibit 4–37. Web-Based Ad Hoc Report Generator (North Carolina DOC)
enable an MIS user with minimal training to generate custom reports as needed.Similar ad hoc reporting tools are available through Web access (exhibits 4–36 and4–37). These systems typically access an extract database from the main agency’sMIS (often with the help of “wizards”) to navigate the report-generating process.
Conclusion
Advances in MIS technology have expanded the options available to classificationmanagers and staff to include options for organizing, viewing, retrieving, andreporting data required for day-to-day line staff and management decisions in atimely and efficient manner. Current MIS software can enable staff to create andrevise statistical reports as needed, given that system features and functions areresponsive to users’ needs and that particular circumstances are in play at the indi-vidual agency. Training and competence building are critical to users’ developmentof a deeper understanding of statistical reports and the issues of valid measurement.Increased competence and more powerful and accessible software should encourageprison managers to make greater use of these reporting capabilities, stay betterinformed, and be more effective in meeting agency objectives.

Advances in comput-
ing technology have
created a mindset of
“abundance think-
ing,” particularly in
software design,
which liberates the
designers from wor-
ries about memory,
storage, and cycles
and shifts the focus
to optimizing the
“friendliness,” speed,
and comprehensive-
ness of the user inter-
face (Cooper, 1995).
fiveChapter
69
Software Design Principles and theUser Interface
Introduction
State correctional agencies have been automated to varying degrees for the pastquarter century. This period has witnessed significant investments in hardware andsoftware. Most state DOC systems were automated in 1970s and early 1980smainframe-based MIS infrastructures. These character-based, mainframe systemshave generally served their purpose in automating and managing the data needs oflarge correctional agencies, but many are encumbered by the design limitations ofthe older technologies. These restrictions have become increasingly obvious inrecent years.
These older technologies have in some cases delayed or limited progress in design-ing and implementing newer software designs. In the early days of computing, pro-grammers and systems designers often adopted an attitude that computing resourceswere scarce. Scarcity thinking fueled the broad assumption that there was neverenough computational power, hard-disk space, or random-access memory (RAM).Recent advances have created a world of profusion. Today’s computers are manytimes more powerful and often are underutilized by the demands of current correc-tional software. Hard-disk space, RAM, networking, and so forth, are no longerviewed as major limitations that restrict correctional agency applications.
A dilemma in many correctional agencies is whether to continue to invest in theirmainframe or legacy systems and attempt to incorporate new software technologiesinto them or to jettison the old system in favor of a contemporary computing envi-ronment that satisfies increasing demands for user-friendliness and distributed com-puting. A related financial issue is that unlike legacy mainframes, modern desktopcomputers and much current software are seen as consumable assets rather than asfixed assets. The fundamental problem is not that the current stock of prison main-frame computers and related MIS software cannot perform their designated func-tions but that the technology is advancing so rapidly that current software may lagbehind the productivity gains offered by newer and often cheaper technologies.Maintaining older computers and software in critical mainstream roles longer thanappropriate can be “penny wise and pound foolish” (Cooper, 1995).
Decisions to abandon older technologies may be made earlier and more easily in theprivate sector, but this issue is relevant in current correctional settings. Arguably,some correctional MISs may need to migrate to newer platforms as quickly as pos-sible to take advantage of productivity enhancements available with the new tech-nology. Ironically, migrating to a new platform can sometimes occur more quicklyand inexpensively than attempting to program changes into the legacy systems.
User Interface
Current user-interface (UI) technologies have seen major advancements and sever-al paradigm shifts in their evolution (Mandel, 1997). The most obvious differencesbetween the older mainframe-based computing environments and today’s MicrosoftWindows-based technology are evident in the software application’s UI. UI com-prises input and output devices and the software that supports them. The interfacemay be viewed as including everything that shapes the user’s experience with thecomputer, including documentation, training, and human support (Baecker et al.,1995).
Current desktop computing systems have clearly taken advantage of this new breedof UI software, which has revolutionized the way people at different skill levels canwork with a computer. Much computer software, especially older mainframe andcharacter-based systems, is not intuitive, easy to learn, or easy to use. If usersbecome frustrated or confused when using software, the problem is often the inter-face. UI is thus a critical element in the selection of software solutions for a prisonenvironment. Software must fit users’ skills, learning capacities, work styles, andwork pressures in each agency. An effective software interface enables users to dowhat they want to do, when and how they want to do it; it must not get in the wayof or repeatedly interrupt the workflow. Distractions may undermine the quality ofthe work and users’ productivity.
However, an effective interface is only one aspect of software application design. UIcannot compensate for a flawed or ineffective underlying design or system. This dis-tinction often arises with the decision to update older mainframe systems. Manydevelopment tools may enable the MIS staff to adapt a modern personal computer(PC) user interface to existing mainframe programs, but this may simply result in anugly program with a pretty face.
Many software developers in the past two decades have attempted to improve theirsoftware by adding more functionality to their programs. However, this focus onprogram functions has changed so that current technology has an equal or greaterfocus on the analysis of tasks that users perform. This task-oriented focus is increas-ingly implicit in all aspects of MIS and UI design, including online and hardcopyhelp and documentation (Mandel, 1997).
70
Chapter 5
Software Design Principles
Visual representation, screen design, table design, and so on, are literally only thetip of the iceberg in software design. The second layer of the design iceberg is the“feel” of the interface, including interaction techniques, device mapping, and stan-dard menus, which govern users’ interaction with the software. The most importantcomponents of the system design are those that are embedded in the user interface,such as object properties (e.g., font type, color, size, formatting tools, table struc-ture). Additionally, design features incorporate many recognizable symbols, icons,and so forth, that users can easily remember (e.g., printer and folder icons). Theseicons should correspond to common mental models linked to the structure of theoverall system and users’ specific work tasks.
Mandel (1997) argues that UI design should be based on a thorough knowledge ofusers’ work experience and expectations. Designers should be familiar with thebasic physical, perceptual, and cognitive abilities of users. The selection of designtradeoffs must be based on a knowledge of which features are more important inaccomplishing users’ goals. Design principles may conflict with the basic goals ofthe software. For example, classification line staff may feel that a minimal numberof data elements is adequate for their decisionmaking regarding specific inmates,whereas management may need more complete information for quality control pur-poses (often viewed by staff as unnecessary and requiring extra work). Another fea-ture that may annoy staff is editing routines built into the software to alert staff toincomplete or erroneous data entry. These routines may be seen as causing unnec-essary delays, depending on their efficiency for fast editing.
Mandel (1997) further argues that users should not be limited to only one UI style.No single interface style is optimal for all users at all times. Different interfacestyles may be more appropriate for different tasks and for users at different levels ofexpertise. For these reasons, most current operating systems offer more than oneuser-interface style (e.g., mouse, keyboard, touch screen), allowing users at differ-ent skill levels to customize the software for their own comfort.
The three UI design principles are the following:
� Place users in control of the interface.
� Reduce the memory load for the user.
� Make UI consistent across all programs that will be used.
Development of UI styles has followed the evolution of PC operating systems. UIshould be transparent and should encourage users to interact with objects on thescreen (icons, buttons, menus) rather than using indirect methods such as typingcommands.
71
Software Design Principles and the User Interface
In a transparent UI, users interact with the computer in a fashion similar to the wayin which they perform their ordinary work tasks. This contrasts with interactionsthat are driven by the needs of the computer’s operating system or other factors thathave no clear relation to task goals. For example, a transparent UI for a housing offi-cer would provide an onscreen map of cells with inmates as visible objects in thecells. This contrasts with a UI that requires the user to navigate the computer’s filestorage system by opening folders and directories to find cells and inmate data to beedited on a text command screen.
Interfaces must become more intuitive, predictable, and forgiving than thosedesigned in the mainframe era. A continuing problem is that many current UI mod-els do not take full advantage of the power of current hardware and software tech-nologies and thus are awkward for today’s users. One problem noted in somecurrent DOC MIS software programs is that they are often built on multiple plat-forms with different operating systems and many diverse programs. This makes itdifficult to offer a consistent interface, so that in some cases staff must use severalvery different computers and UIs to accomplish a single task.
Design Principles Placing Users in Control
Mandel (1997) outlines various design principles that place the end user in controlof the workflow:
� Use mode changes judiciously. For example, older mainframe programsdemand that a user shift into a special state to enter records and then into anoth-er to print them. These behavioral states are modes that can be extremely con-fusing and frustrating.
� Allow users to use either the keyboard or the mouse (flexible).
� Allow users to change focus (interruptible).
� Display descriptive messages and text on the screen (helpful).
� Provide immediate and reversible actions and feedback (forgiving).
� Provide meaningful and efficient paths and exits (navigable).
� Accommodate users who have different skill levels (accessible).
� Make UI transparent (facilitative).
� Allow users to customize the interface (accommodating).
� Allow users to manipulate interface objects directly (interactive).
72
Chapter 5
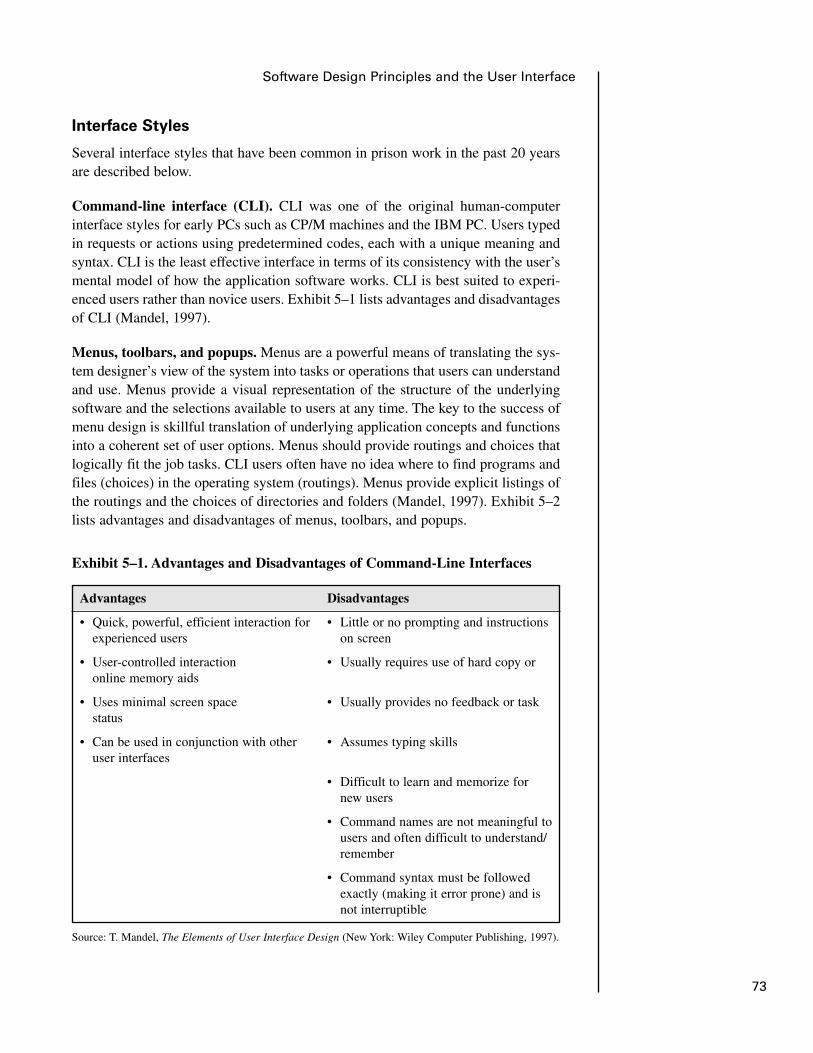
73
Software Design Principles and the User Interface
Interface Styles
Several interface styles that have been common in prison work in the past 20 yearsare described below.
Command-line interface (CLI). CLI was one of the original human-computerinterface styles for early PCs such as CP/M machines and the IBM PC. Users typedin requests or actions using predetermined codes, each with a unique meaning andsyntax. CLI is the least effective interface in terms of its consistency with the user’smental model of how the application software works. CLI is best suited to experi-enced users rather than novice users. Exhibit 5–1 lists advantages and disadvantagesof CLI (Mandel, 1997).
Menus, toolbars, and popups. Menus are a powerful means of translating the sys-tem designer’s view of the system into tasks or operations that users can understandand use. Menus provide a visual representation of the structure of the underlyingsoftware and the selections available to users at any time. The key to the success ofmenu design is skillful translation of underlying application concepts and functionsinto a coherent set of user options. Menus should provide routings and choices thatlogically fit the job tasks. CLI users often have no idea where to find programs andfiles (choices) in the operating system (routings). Menus provide explicit listings ofthe routings and the choices of directories and folders (Mandel, 1997). Exhibit 5–2lists advantages and disadvantages of menus, toolbars, and popups.
Exhibit 5–1. Advantages and Disadvantages of Command-Line Interfaces
Advantages Disadvantages
• Quick, powerful, efficient interaction for • Little or no prompting and instructionsexperienced users on screen
• User-controlled interaction • Usually requires use of hard copy or online memory aids
• Uses minimal screen space • Usually provides no feedback or task status
• Can be used in conjunction with other • Assumes typing skillsuser interfaces
• Difficult to learn and memorize for new users
• Command names are not meaningful to users and often difficult to understand/ remember
• Command syntax must be followed exactly (making it error prone) and is not interruptible
Source: T. Mandel, The Elements of User Interface Design (New York: Wiley Computer Publishing, 1997).
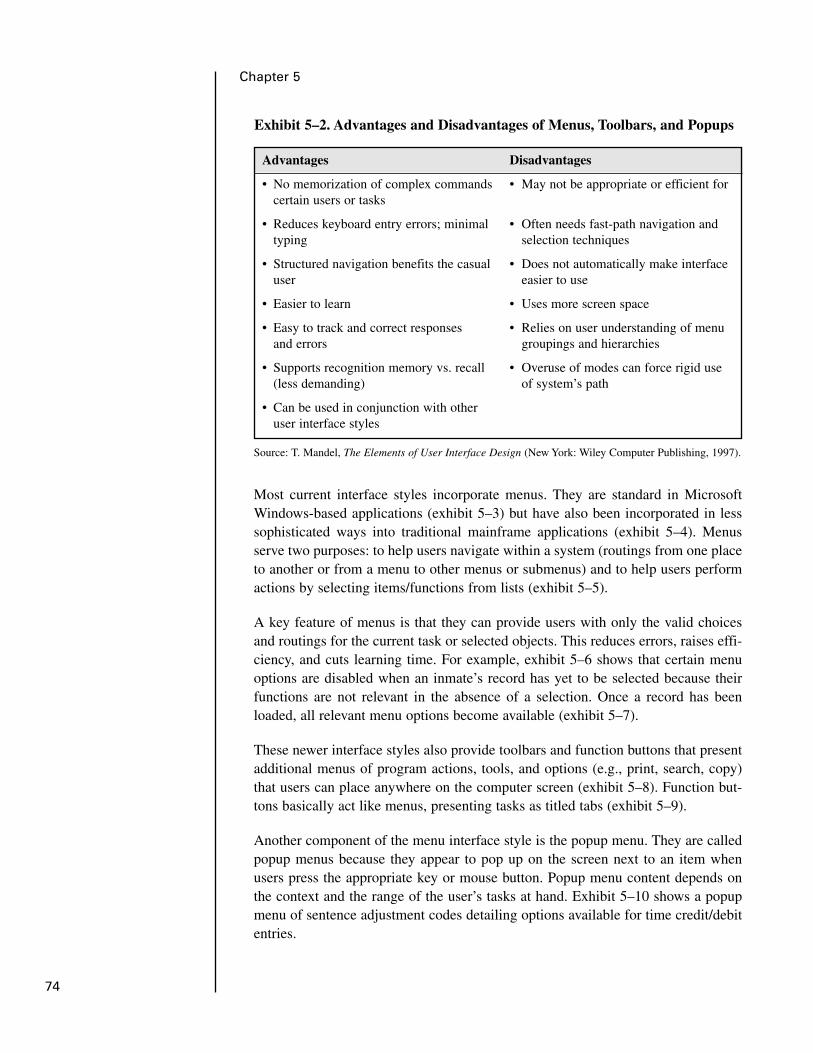
Most current interface styles incorporate menus. They are standard in MicrosoftWindows-based applications (exhibit 5–3) but have also been incorporated in lesssophisticated ways into traditional mainframe applications (exhibit 5–4). Menusserve two purposes: to help users navigate within a system (routings from one placeto another or from a menu to other menus or submenus) and to help users performactions by selecting items/functions from lists (exhibit 5–5).
A key feature of menus is that they can provide users with only the valid choicesand routings for the current task or selected objects. This reduces errors, raises effi-ciency, and cuts learning time. For example, exhibit 5–6 shows that certain menuoptions are disabled when an inmate’s record has yet to be selected because theirfunctions are not relevant in the absence of a selection. Once a record has beenloaded, all relevant menu options become available (exhibit 5–7).
These newer interface styles also provide toolbars and function buttons that presentadditional menus of program actions, tools, and options (e.g., print, search, copy)that users can place anywhere on the computer screen (exhibit 5–8). Function but-tons basically act like menus, presenting tasks as titled tabs (exhibit 5–9).
Another component of the menu interface style is the popup menu. They are calledpopup menus because they appear to pop up on the screen next to an item whenusers press the appropriate key or mouse button. Popup menu content depends onthe context and the range of the user’s tasks at hand. Exhibit 5–10 shows a popupmenu of sentence adjustment codes detailing options available for time credit/debitentries.
74
Chapter 5
Exhibit 5–2. Advantages and Disadvantages of Menus, Toolbars, and Popups
Advantages Disadvantages
• No memorization of complex commands • May not be appropriate or efficient forcertain users or tasks
• Reduces keyboard entry errors; minimal • Often needs fast-path navigation and typing selection techniques
• Structured navigation benefits the casual • Does not automatically make interface user easier to use
• Easier to learn • Uses more screen space
• Easy to track and correct responses • Relies on user understanding of menu and errors groupings and hierarchies
• Supports recognition memory vs. recall • Overuse of modes can force rigid use (less demanding) of system’s path
• Can be used in conjunction with other user interface styles
Source: T. Mandel, The Elements of User Interface Design (New York: Wiley Computer Publishing, 1997).

75
Software Design Principles and the User Interface
Exhibit 5–3. Main Menu Screen (New Jersey DOC)
Exhibit 5–4. Transportation System Menu Screen (South Carolina DOC)
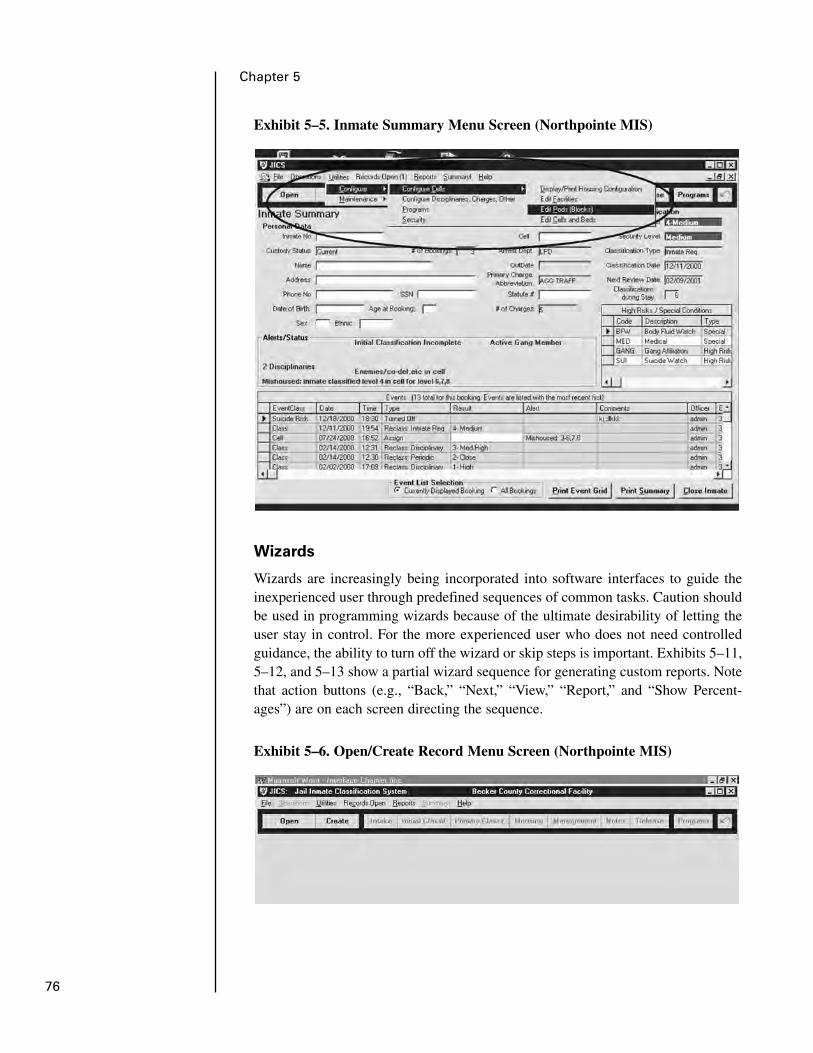
Wizards
Wizards are increasingly being incorporated into software interfaces to guide theinexperienced user through predefined sequences of common tasks. Caution shouldbe used in programming wizards because of the ultimate desirability of letting theuser stay in control. For the more experienced user who does not need controlledguidance, the ability to turn off the wizard or skip steps is important. Exhibits 5–11,5–12, and 5–13 show a partial wizard sequence for generating custom reports. Notethat action buttons (e.g., “Back,” “Next,” “View,” “Report,” and “Show Percent-ages”) are on each screen directing the sequence.
76
Chapter 5
Exhibit 5–5. Inmate Summary Menu Screen (Northpointe MIS)
Exhibit 5–6. Open/Create Record Menu Screen (Northpointe MIS)
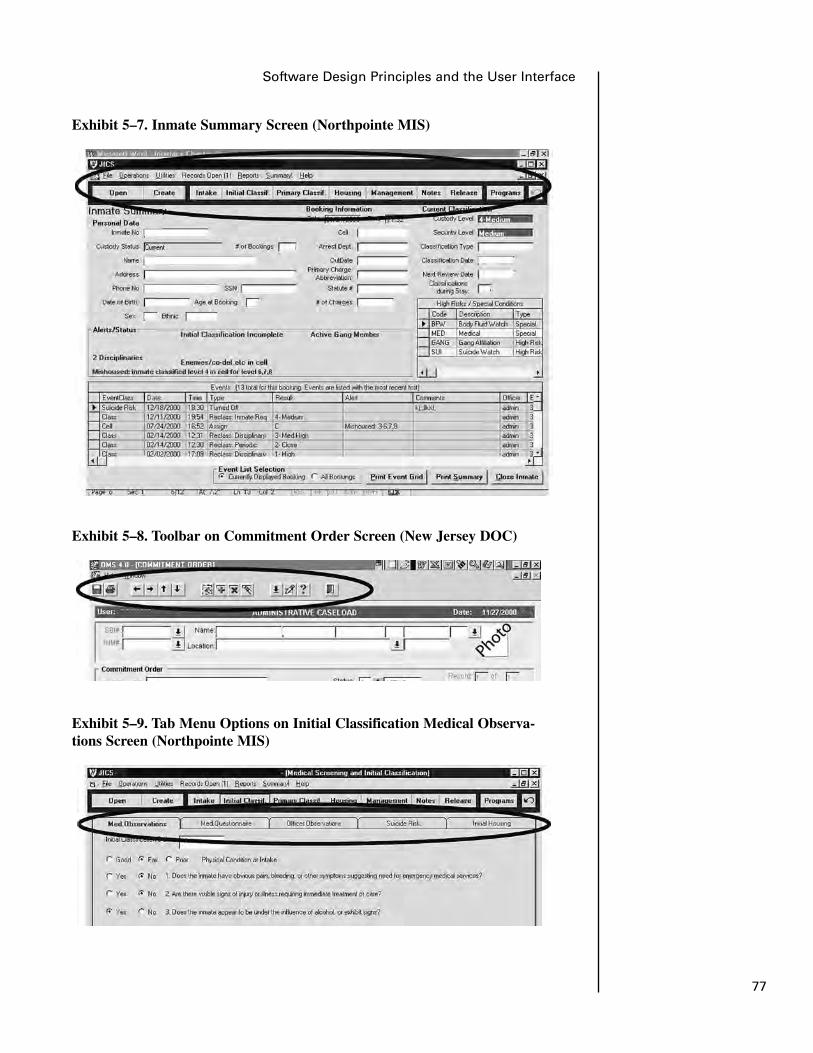
77
Software Design Principles and the User Interface
Exhibit 5–7. Inmate Summary Screen (Northpointe MIS)
Exhibit 5–8. Toolbar on Commitment Order Screen (New Jersey DOC)
Exhibit 5–9. Tab Menu Options on Initial Classification Medical Observa-tions Screen (Northpointe MIS)
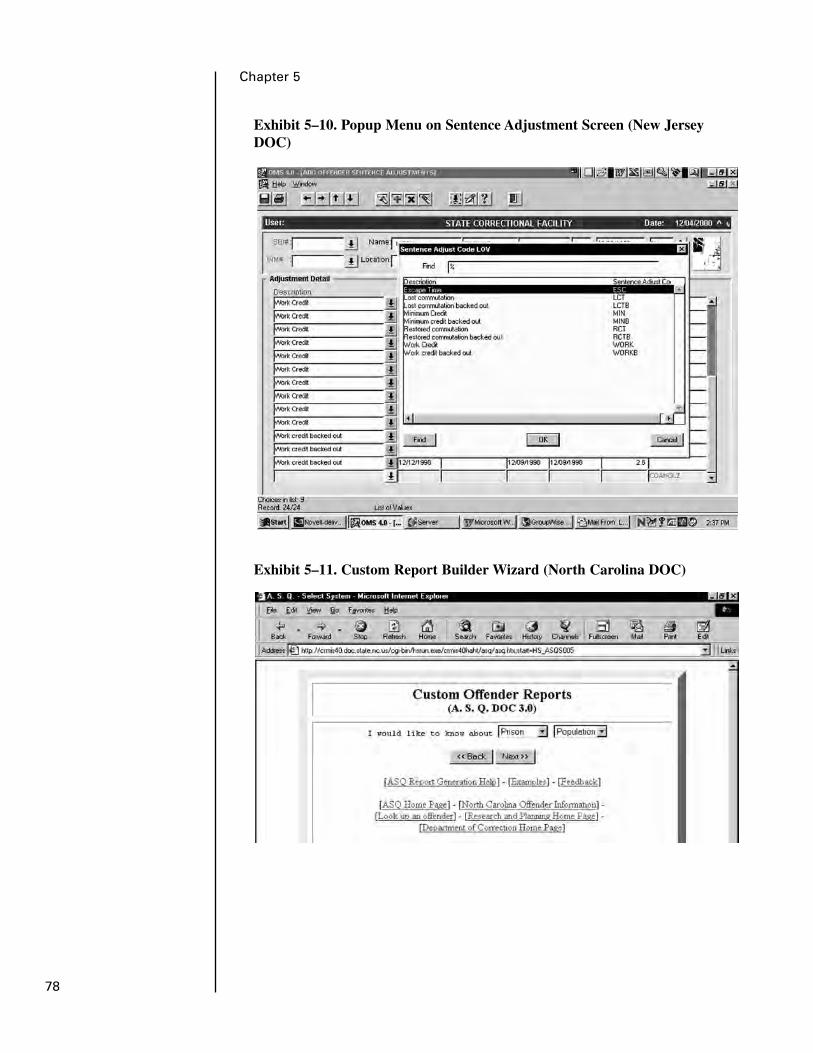
78
Chapter 5
Exhibit 5–10. Popup Menu on Sentence Adjustment Screen (New JerseyDOC)
Exhibit 5–11. Custom Report Builder Wizard (North Carolina DOC)
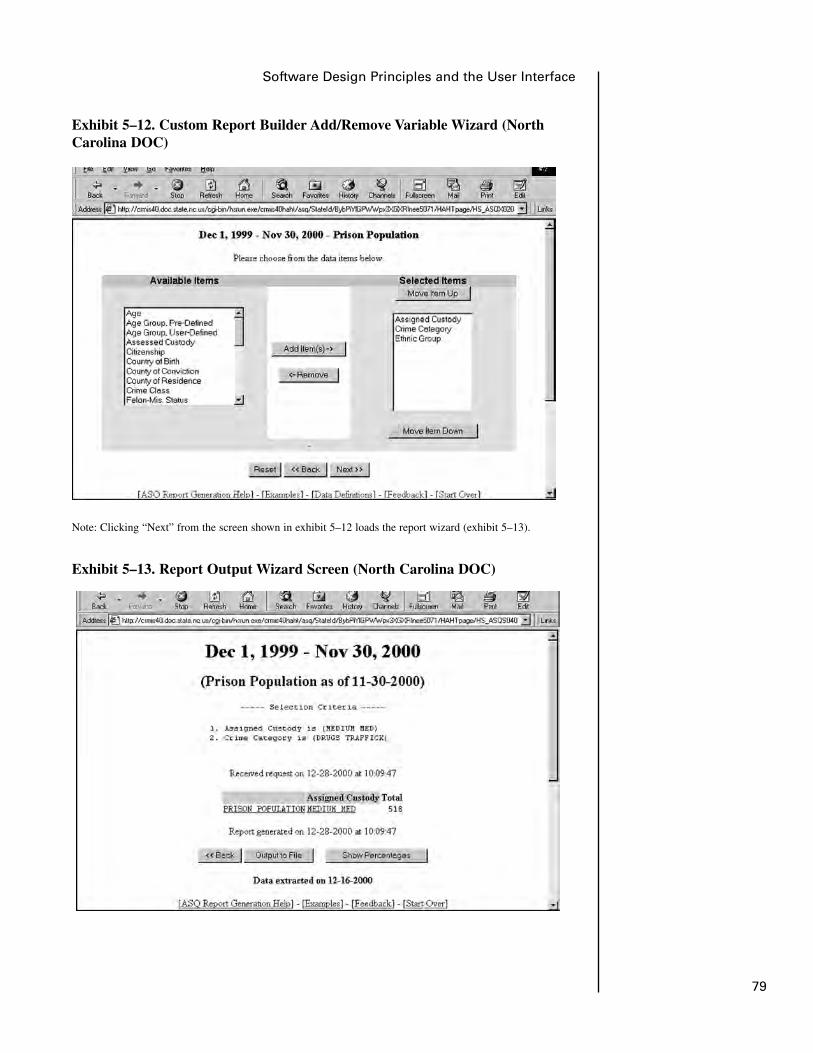
Note: Clicking “Next” from the screen shown in exhibit 5–12 loads the report wizard (exhibit 5–13).
79
Software Design Principles and the User Interface
Exhibit 5–12. Custom Report Builder Add/Remove Variable Wizard (NorthCarolina DOC)
Exhibit 5–13. Report Output Wizard Screen (North Carolina DOC)

Current user interfaces also offer user-friendly help to assist in screen or functionnavigation (exhibit 5–14). Each screen can have a “How to use this screen” guid-ance panel that can be turned off once the user no longer needs it.
Graphical and Object-Oriented User Interfaces
The basic characteristic of GUIs is the integration of many elements to facilitateworking with the software. In simple terms, a GUI is the graphical representation ofand interaction with all of the key elements (e.g., programs, data, and objects) onthe screen. GUIs consist of windows, icons, menus, widgets (visual controls such asbuttons, check boxes, and arrows), and pointers, as shown in the exhibits above. Arange of “GUI-ness” can be programmed into an application’s interface.
In the past few decades, GUIs have made computers more “people literate” insteadof forcing users to become more computer literate. Humans, in general, appear toprocess information better visually than textually. To realize the advantages of com-puter technology, user interaction has become progressively more visual. The issueis not the graphic nature of the program but the level of visual interaction. Cooper(1995) opted to use the term visual user interface (VUI) to describe a major goal ofsoftware design. The ability of the unconscious mind to group objects into patternsusing visual cues enables humans to process visual information quickly and effi-ciently. Understanding and applying this visual model of cognitive processing is a
80
Chapter 5
Exhibit 5–14. Offender Summary Popup Help Screen (Northpointe MIS)
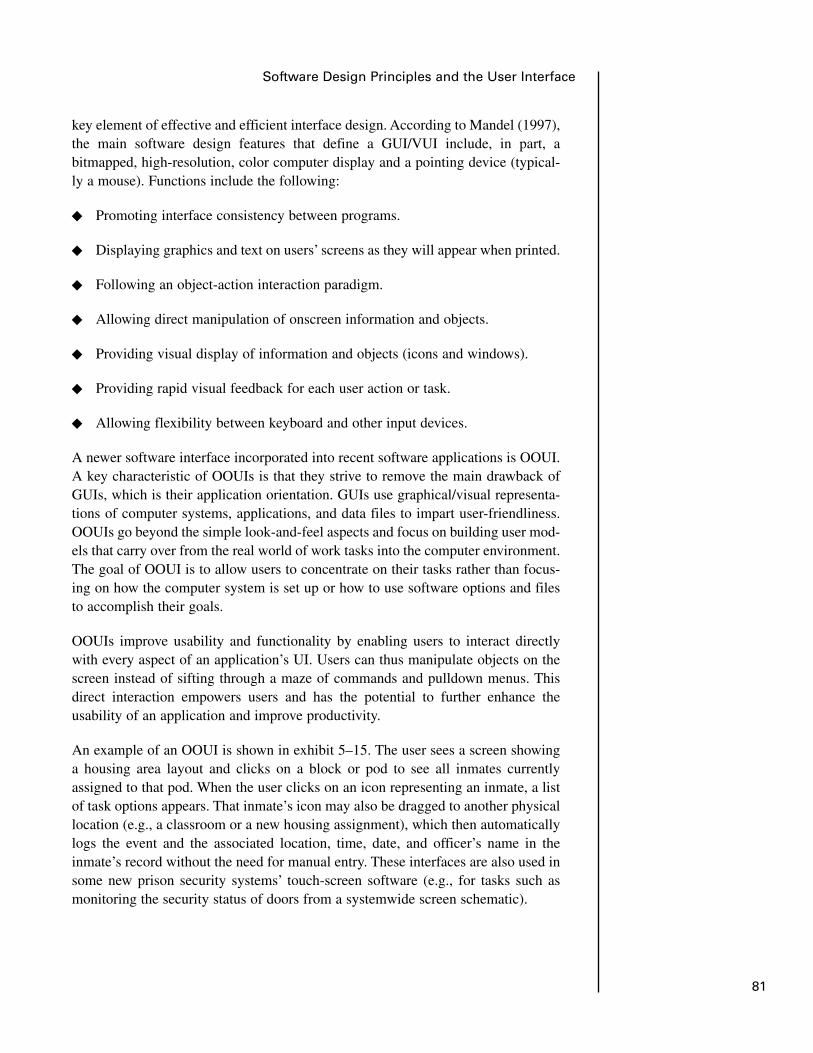
key element of effective and efficient interface design. According to Mandel (1997),the main software design features that define a GUI/VUI include, in part, abitmapped, high-resolution, color computer display and a pointing device (typical-ly a mouse). Functions include the following:
� Promoting interface consistency between programs.
� Displaying graphics and text on users’ screens as they will appear when printed.
� Following an object-action interaction paradigm.
� Allowing direct manipulation of onscreen information and objects.
� Providing visual display of information and objects (icons and windows).
� Providing rapid visual feedback for each user action or task.
� Allowing flexibility between keyboard and other input devices.
A newer software interface incorporated into recent software applications is OOUI.A key characteristic of OOUIs is that they strive to remove the main drawback ofGUIs, which is their application orientation. GUIs use graphical/visual representa-tions of computer systems, applications, and data files to impart user-friendliness.OOUIs go beyond the simple look-and-feel aspects and focus on building user mod-els that carry over from the real world of work tasks into the computer environment.The goal of OOUI is to allow users to concentrate on their tasks rather than focus-ing on how the computer system is set up or how to use software options and filesto accomplish their goals.
OOUIs improve usability and functionality by enabling users to interact directlywith every aspect of an application’s UI. Users can thus manipulate objects on thescreen instead of sifting through a maze of commands and pulldown menus. Thisdirect interaction empowers users and has the potential to further enhance theusability of an application and improve productivity.
An example of an OOUI is shown in exhibit 5–15. The user sees a screen showinga housing area layout and clicks on a block or pod to see all inmates currentlyassigned to that pod. When the user clicks on an icon representing an inmate, a listof task options appears. That inmate’s icon may also be dragged to another physicallocation (e.g., a classroom or a new housing assignment), which then automaticallylogs the event and the associated location, time, date, and officer’s name in theinmate’s record without the need for manual entry. These interfaces are also used insome new prison security systems’ touch-screen software (e.g., for tasks such asmonitoring the security status of doors from a systemwide screen schematic).
81
Software Design Principles and the User Interface
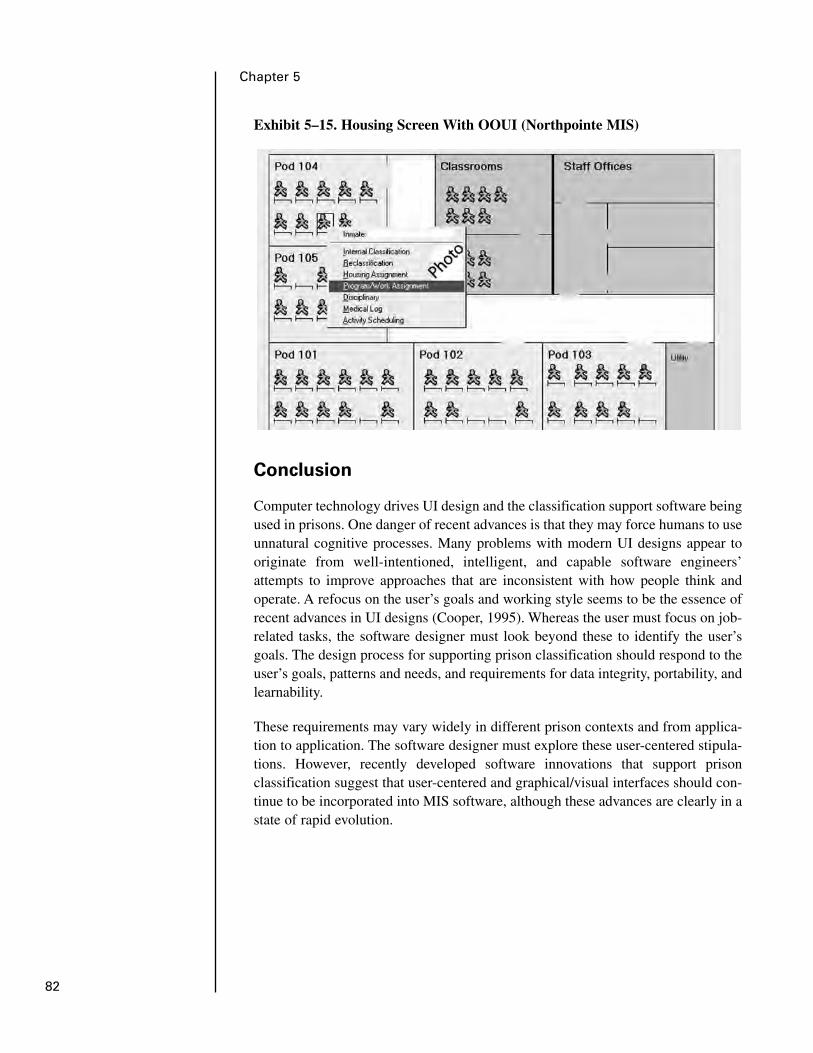
Conclusion
Computer technology drives UI design and the classification support software beingused in prisons. One danger of recent advances is that they may force humans to useunnatural cognitive processes. Many problems with modern UI designs appear tooriginate from well-intentioned, intelligent, and capable software engineers’attempts to improve approaches that are inconsistent with how people think andoperate. A refocus on the user’s goals and working style seems to be the essence ofrecent advances in UI designs (Cooper, 1995). Whereas the user must focus on job-related tasks, the software designer must look beyond these to identify the user’sgoals. The design process for supporting prison classification should respond to theuser’s goals, patterns and needs, and requirements for data integrity, portability, andlearnability.
These requirements may vary widely in different prison contexts and from applica-tion to application. The software designer must explore these user-centered stipula-tions. However, recently developed software innovations that support prisonclassification suggest that user-centered and graphical/visual interfaces should con-tinue to be incorporated into MIS software, although these advances are clearly in astate of rapid evolution.
82
Chapter 5
Exhibit 5–15. Housing Screen With OOUI (Northpointe MIS)

Activities
• Records management • External classification
• Medical/mental health • Internal classification
• Initial classification • Central office classification
• Reclassification • Facility classification
Organizational Levels
• Case processing staff • Quality control managers
• Management control staff • Strategic planning staff
Evaluating Classification MISs
Introduction
This chapter is intended to assist corrections staff in evaluating the comprehensive-ness, functionality, and utility of their agency’s current classification MIS compo-nents and in identifying areas of needed improvement. The automated classificationand MIS features that are listed in the evaluation instruments (see below) may alsobe useful to prison administrators in developing system specifications for requestsfor proposals for the design or purchase of new MIS software and computersystems. Utility is the overarching concept that integrates all the functional compo-nents of the MIS. This chapter provides a practical guide for assessing these systemcomponents.
Before using this system assessment guide, selected groups of 6–10 users repre-senting each of the various prison activities and organizational levels should act asrespondents in gathering these data (exhibit 6–1).
For each function, a first step is to collect hard copies of all relevant computerizedinput and output documents and screens, navigation screens, manuals, data diction-aries, and code tables. The protocol questions below can then be used in assessmentsessions. Each member of the assessment group should score the appropriate sec-tions of the assessment instruments separately. The group can then discuss the rea-sons for any poor assessments and differences in scores.
sixChapter
83
Exhibit 6–1. Activities and Organizational Levels for MIS/ClassificationSystem Analysis
84
Chapter 6
System Assessment Guide: Definitions
Exhibit 6–2 presents scoring definitions for assessment of data support and integri-ty, functionality, timeliness, and UI.
Tabulating the System Assessment Score
Exhibit 6–3 is a sample system assessment guide. This form provides a format forentering the findings of the system reviewers so that the assigned numerical valuescan be manipulated to arrive at a single score for the system in question.
To use the guide, add the total score for each column and enter that score on the“Total column score” line in each column, including the “Total Row Score” column.Count the total number of assessment items scored in the column. If all items arescored, the total is 61. The number of items scored should be the same for each col-umn. Enter that total on the “Total items scored” line in each column. To computethe average column score, divide the total column score by the total number of itemsscored (the average column scores will be between 1 and 3). Row scores may alsobe summed, with scores ranging from a minimum of 5 points to a maximum of 15points, to provide insight into the adequacy of each system component. Total rowscores between 10 and 15 indicate an adequate-to-good system component.
To compute the overall system assessment score, add each of the total columnscores and enter the total on the “Total column score” line in the “Total Row Score”column. Enter the total number of items scored in the assessment on the “Total itemsscored” line (this should be the total items scored in the first column multiplied by5, or 305 if all items are scored). Divide the total of the column scores by the totalnumber of items scored to get the overall MIS classification components score (theoverall score will be between 1 and 3). If all items in the assessment were notscored, acknowledge this when making the final assessment of the system.
Instrument Scoring and Definition Guidelines forOutputs and Reports
Outputs and reports require considerations that differ from those of the overall sys-tem’s and should be addressed separately using their own rating scale, as shown inexhibit 6–4.
Tabulating Output/Report System Assessment Score
Exhibit 6–5 shows an output/report system assessment guide similar to the systemassessment guide shown in exhibit 6–3. The form provides a format for entering thefindings of the reviewers to determine a single score for the output/report system inquestion.
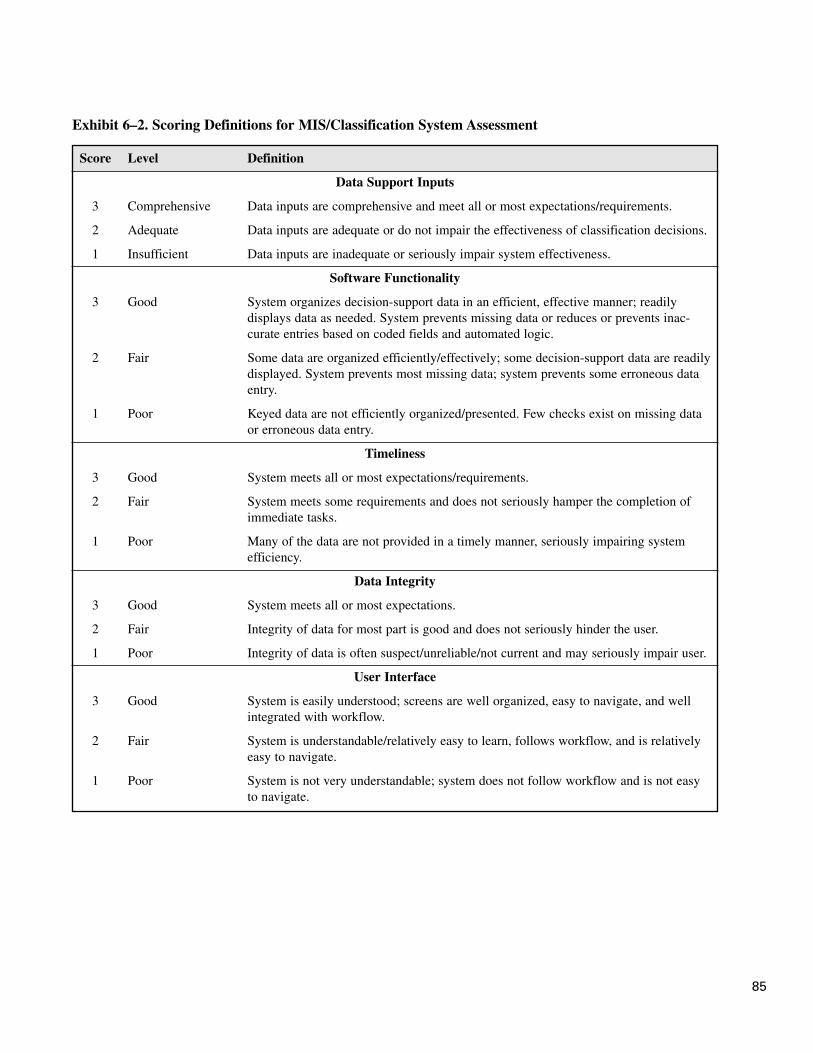
Score Level Definition
Data Support Inputs
3 Comprehensive Data inputs are comprehensive and meet all or most expectations/requirements.
2 Adequate Data inputs are adequate or do not impair the effectiveness of classification decisions.
1 Insufficient Data inputs are inadequate or seriously impair system effectiveness.
Software Functionality
3 Good System organizes decision-support data in an efficient, effective manner; readily displays data as needed. System prevents missing data or reduces or prevents inac-curate entries based on coded fields and automated logic.
2 Fair Some data are organized efficiently/effectively; some decision-support data are readily displayed. System prevents most missing data; system prevents some erroneous data entry.
1 Poor Keyed data are not efficiently organized/presented. Few checks exist on missing data or erroneous data entry.
Timeliness
3 Good System meets all or most expectations/requirements.
2 Fair System meets some requirements and does not seriously hamper the completion of immediate tasks.
1 Poor Many of the data are not provided in a timely manner, seriously impairing system efficiency.
Data Integrity
3 Good System meets all or most expectations.
2 Fair Integrity of data for most part is good and does not seriously hinder the user.
1 Poor Integrity of data is often suspect/unreliable/not current and may seriously impair user.
User Interface
3 Good System is easily understood; screens are well organized, easy to navigate, and well integrated with workflow.
2 Fair System is understandable/relatively easy to learn, follows workflow, and is relatively easy to navigate.
1 Poor System is not very understandable; system does not follow workflow and is not easy to navigate.
Exhibit 6–2. Scoring Definitions for MIS/Classification System Assessment
85

Dat
a Su
ppor
t In
puts
Fun
ctio
nalit
yT
imel
ines
sD
ata
Inte
grit
yU
ser
Inte
rfac
eTo
tal R
owM
IS C
lass
ific
atio
n/R
elat
ed F
unct
ion
(1,2
,or
3)(1
,2,o
r 3)
(1,2
,or
3)(1
,2,o
r 3)
(1,2
,or
3)Sc
ore
Inta
ke
Pos
itiv
e id
enti
fica
tion
1.M
aste
r sy
stem
ID
sea
rch
___
___
___
___
___
___
2.A
utom
ated
fin
gerp
rint
mat
ch__
___
___
___
___
___
_
3.Ph
ysic
al c
hara
cter
istic
s__
___
___
___
___
___
_
4.A
utom
ated
che
ck o
f co
mm
itmen
t/leg
al
pape
rs,c
ourt
sen
tenc
e,co
urt r
etur
n__
___
___
___
___
___
_
5.A
utom
ated
acc
epta
nce
into
or
deni
al f
rom
st
ate
syst
em__
___
___
___
___
___
_
Boo
king
1.In
mat
e de
mog
raph
ics
___
___
___
___
___
___
2.B
ackg
roun
d da
ta__
___
___
___
___
___
_
3.Id
entif
y ke
ep-s
epar
ates
___
___
___
___
___
___
4.Id
entif
y de
tain
ers/
war
rant
s__
___
___
___
___
___
_
Med
ical
/men
tal h
ealt
h sc
reen
ing
1.In
itial
med
ical
/men
tal h
ealth
scr
eeni
ng__
___
___
___
___
___
_
2.Su
icid
e ri
sk s
cree
ning
__
___
___
___
___
___
_
Tim
e co
mpu
tati
ons
1.O
ffen
se in
form
atio
n__
___
___
___
___
___
_
2.Se
nten
ce d
ates
,sen
tenc
e le
ngth
s,co
ncur
rent
/con
secu
tive,
stat
utor
ym
inim
um/m
axim
um__
___
___
___
___
___
_
3.T
ime
cred
its a
t int
ake
___
___
___
___
___
___
4.A
utom
ated
ong
oing
tim
e-cr
edit
adju
stm
ents
___
___
___
___
___
___
86
Exh
ibit
6–3
. Sys
tem
Ass
essm
ent
Gui
de:
MIS
Cla
ssif
icat
ion-
Rel
ated
Fun
ctio
ns
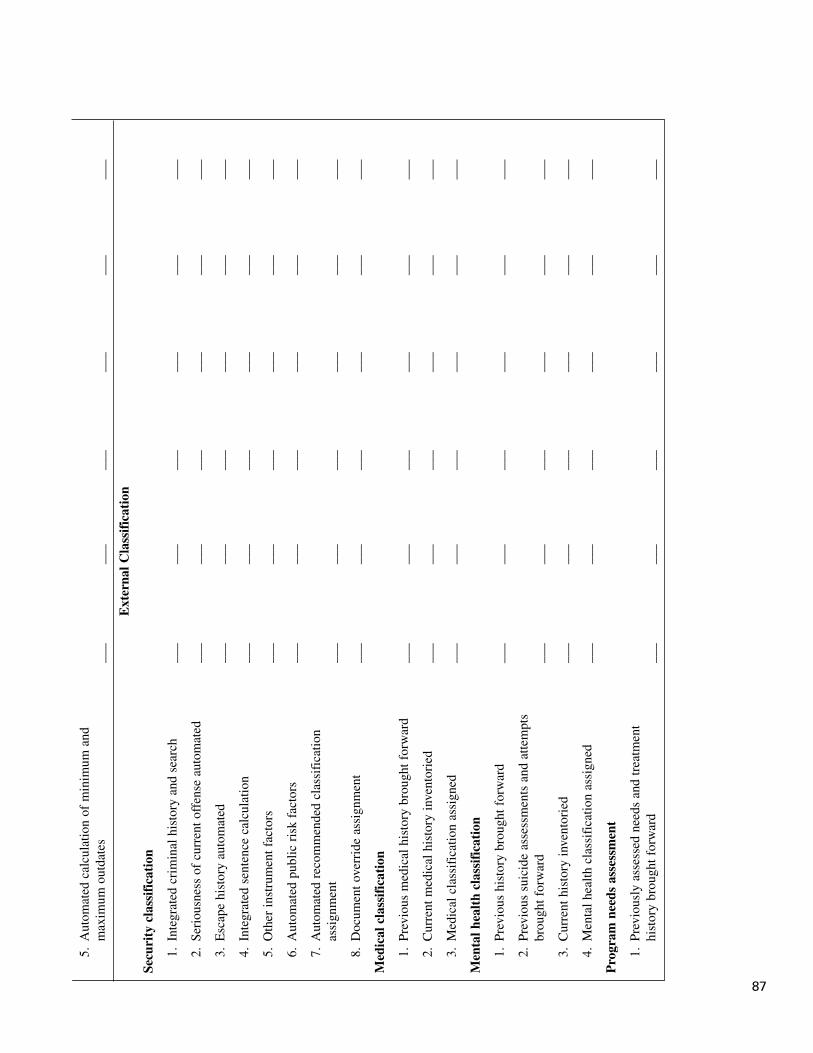
87
5.A
utom
ated
cal
cula
tion
of m
inim
um a
nd
max
imum
out
date
s__
___
___
___
___
___
_
Ext
erna
l Cla
ssif
icat
ion
Secu
rity
cla
ssif
icat
ion
1.In
tegr
ated
cri
min
al h
isto
ry a
nd s
earc
h__
___
___
___
___
___
_
2.Se
riou
snes
s of
cur
rent
off
ense
aut
omat
ed__
___
___
___
___
___
_
3.E
scap
e hi
stor
y au
tom
ated
___
___
___
___
___
___
4.In
tegr
ated
sen
tenc
e ca
lcul
atio
n__
___
___
___
___
___
_
5.O
ther
inst
rum
ent f
acto
rs__
___
___
___
___
___
_
6.A
utom
ated
pub
lic r
isk
fact
ors
___
___
___
___
___
___
7.A
utom
ated
rec
omm
ende
d cl
assi
fica
tion
assi
gnm
ent
___
___
___
___
___
___
8.D
ocum
ent o
verr
ide
assi
gnm
ent
___
___
___
___
___
___
Med
ical
cla
ssif
icat
ion
1.Pr
evio
us m
edic
al h
isto
ry b
roug
ht f
orw
ard
___
___
___
___
___
___
2.C
urre
nt m
edic
al h
isto
ry in
vent
orie
d__
___
___
___
___
___
_
3.M
edic
al c
lass
ific
atio
n as
sign
ed__
___
___
___
___
___
_
Men
tal h
ealt
h cl
assi
fica
tion
1.Pr
evio
us h
isto
ry b
roug
ht f
orw
ard
___
___
___
___
___
___
2.Pr
evio
us s
uici
de a
sses
smen
ts a
nd a
ttem
pts
brou
ght f
orw
ard
___
___
___
___
___
___
3.C
urre
nt h
isto
ry in
vent
orie
d__
___
___
___
___
___
_
4.M
enta
l hea
lth c
lass
ific
atio
n as
sign
ed__
___
___
___
___
___
_
Pro
gram
nee
ds a
sses
smen
t
1.Pr
evio
usly
ass
esse
d ne
eds
and
trea
tmen
t hi
stor
y br
ough
t for
war
d__
___
___
___
___
___
_

Dat
a Su
ppor
t In
puts
Fun
ctio
nalit
yT
imel
ines
sD
ata
Inte
grit
yU
ser
Inte
rfac
eTo
tal R
owM
IS C
lass
ific
atio
n/R
elat
ed F
unct
ion
(1,2
,or
3)(1
,2,o
r 3)
(1,2
,or
3)(1
,2,o
r 3)
(1,2
,or
3)Sc
ore
2.Pr
esen
tenc
e in
vest
igat
ion
info
rmat
ion
brou
ght f
orw
ard
or in
vent
orie
d__
___
___
___
___
___
_
3.C
rim
inal
his
tory
(e.
g.,d
omes
tic a
buse
,dr
ug/a
lcoh
ol o
ffen
ses)
inve
ntor
ied
___
___
___
___
___
___
4.C
urre
nt n
eeds
ass
essm
ent i
nven
tori
ed__
___
___
___
___
___
_
Tra
nsfe
r as
sign
men
t
1.A
utom
atic
ally
mat
ches
inm
ate
to a
ppro
-pr
iate
fac
ility
/fac
ilitie
s ba
sed
on c
lass
ific
a-tio
n an
d av
aila
ble
spac
e__
___
___
___
___
___
_
2.A
lert
s fo
r tr
ansf
er is
sues
(e.
g.,m
edic
al
hold
s,ke
ep-s
epar
ates
)__
___
___
___
___
___
_
3.A
utom
atic
ally
sch
edul
es m
ove
base
d on
tr
ansf
er d
ate,
tran
spor
t sea
t ava
ilabi
lity
___
___
___
___
___
___
4.D
ocum
ents
fac
ility
ass
ignm
ent,
over
ride
if
oth
er th
an a
mat
ched
fac
ility
___
___
___
___
___
___
5.Fl
ags
inm
ate
reco
rd a
s m
isho
used
(i
f ap
plic
able
)__
___
___
___
___
___
_
Inte
rnal
Cla
ssif
icat
ion
Cus
tody
cla
ssif
icat
ion
1.In
vent
orie
s cu
rren
t off
ense
ser
ious
ness
,di
scip
linar
y hi
stor
y,ga
ng s
tatu
s,ag
e,su
bsta
nce
abus
e__
___
___
___
___
___
_
2.Pr
evio
us in
cide
nt h
isto
ry a
utom
ated
; re
com
men
ds c
lass
ific
atio
n as
sign
men
t__
___
___
___
___
___
_
3.D
ocum
ents
ove
rrid
e as
sign
men
t__
___
___
___
___
___
_
88
Exh
ibit
6–3
. Sys
tem
Ass
essm
ent
Gui
de:
MIS
Cla
ssif
icat
ion-
Rel
ated
Fun
ctio
ns (
cont
inue
d)
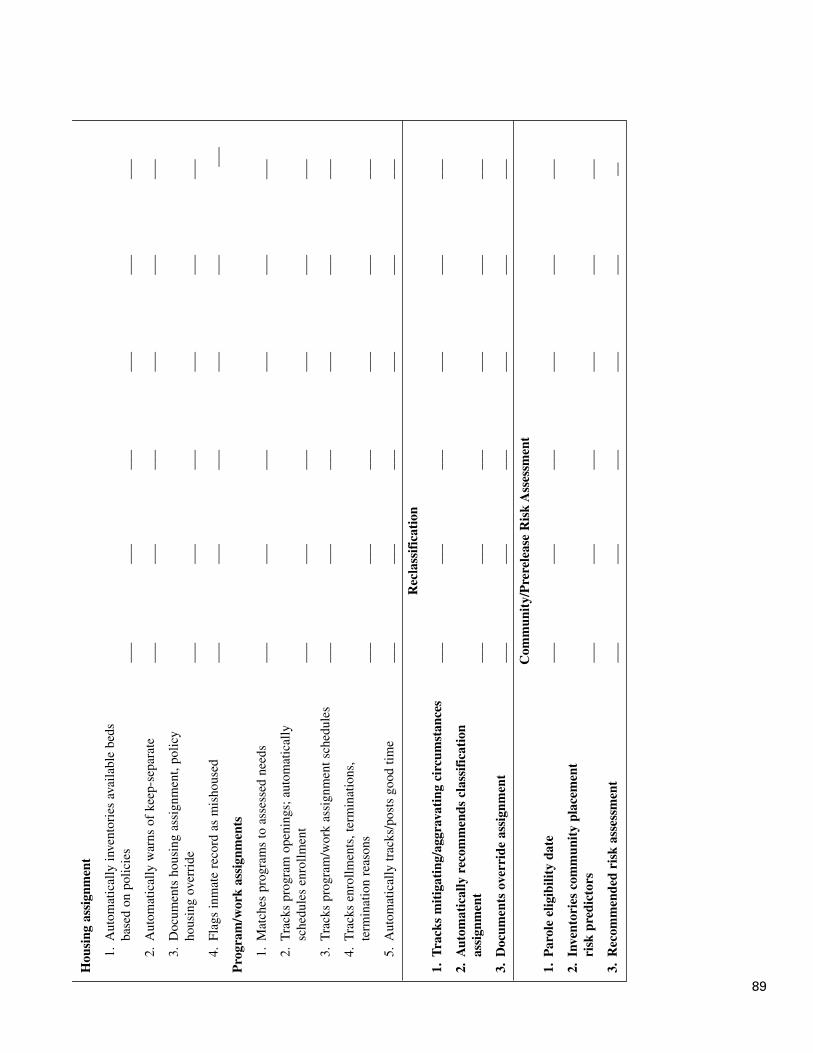
Hou
sing
ass
ignm
ent
1.A
utom
atic
ally
inve
ntor
ies
avai
labl
e be
ds
base
d on
pol
icie
s__
___
___
___
___
___
_
2.A
utom
atic
ally
war
ns o
f ke
ep-s
epar
ate
___
___
___
___
___
___
3.D
ocum
ents
hou
sing
ass
ignm
ent,
polic
y ho
usin
g ov
erri
de__
___
___
___
___
___
_
4.Fl
ags
inm
ate
reco
rd a
s m
isho
used
___
___
___
___
___
___
Pro
gram
/wor
k as
sign
men
ts
1.M
atch
es p
rogr
ams
to a
sses
sed
need
s__
___
___
___
___
___
_
2.T
rack
s pr
ogra
m o
peni
ngs;
aut
omat
ical
ly
sche
dule
s en
rollm
ent
___
___
___
___
___
___
3.T
rack
s pr
ogra
m/w
ork
assi
gnm
ent s
ched
ules
___
___
___
___
___
___
4.T
rack
s en
rollm
ents
,ter
min
atio
ns,
term
inat
ion
reas
ons
___
___
___
___
___
___
5.A
utom
atic
ally
trac
ks/p
osts
goo
d tim
e__
___
___
___
___
___
_
Rec
lass
ific
atio
n
1.T
rack
s m
itig
atin
g/ag
grav
atin
g ci
rcum
stan
ces
___
___
___
___
___
___
2.A
utom
atic
ally
rec
omm
ends
cla
ssif
icat
ion
assi
gnm
ent
___
___
___
___
___
___
3.D
ocum
ents
ove
rrid
e as
sign
men
t__
___
___
___
___
___
_
Com
mun
ity/
Pre
rele
ase
Ris
k A
sses
smen
t
1.P
arol
e el
igib
ility
dat
e__
___
___
___
___
___
_
2.In
vent
orie
s co
mm
unit
y pl
acem
ent
risk
pre
dict
ors
___
___
___
___
___
___
3.R
ecom
men
ded
risk
ass
essm
ent
___
___
___
___
___
__
89

90
Dat
a Su
ppor
t In
puts
Fun
ctio
nalit
yT
imel
ines
sD
ata
Inte
grit
yU
ser
Inte
rfac
eTo
tal R
owM
IS C
lass
ific
atio
n/R
elat
ed F
unct
ion
(1,2
,or
3)(1
,2,o
r 3)
(1,2
,or
3)(1
,2,o
r 3)
(1,2
,or
3)Sc
ore
Rel
ease
1.R
elea
se d
ate
conf
irm
atio
ns__
___
___
___
___
___
_
2.A
utom
ated
vic
tim
not
ific
atio
n__
___
___
___
___
___
_
3.In
stit
utio
nal b
ehav
ior
sum
mar
y pa
ssed
to s
uper
visi
ng a
utho
rity
___
___
___
___
___
___
Tota
l col
umn
scor
e__
___
___
___
___
___
_
Tota
l ite
ms
scor
ed (
61 if
all
scor
ed)
___
___
___
___
___
___
Ave
rage
col
umn
scor
e(t
otal
col
umn
scor
e di
vide
d by
tot
al it
ems
scor
ed)
___
___
___
___
___
___
Exh
ibit
6–3
. Sys
tem
Ass
essm
ent
Gui
de:
MIS
Cla
ssif
icat
ion-
Rel
ated
Fun
ctio
ns (
cont
inue
d)
Not
e:Se
e ex
hibi
t 6–2
for
sco
ring
gui
delin
es.
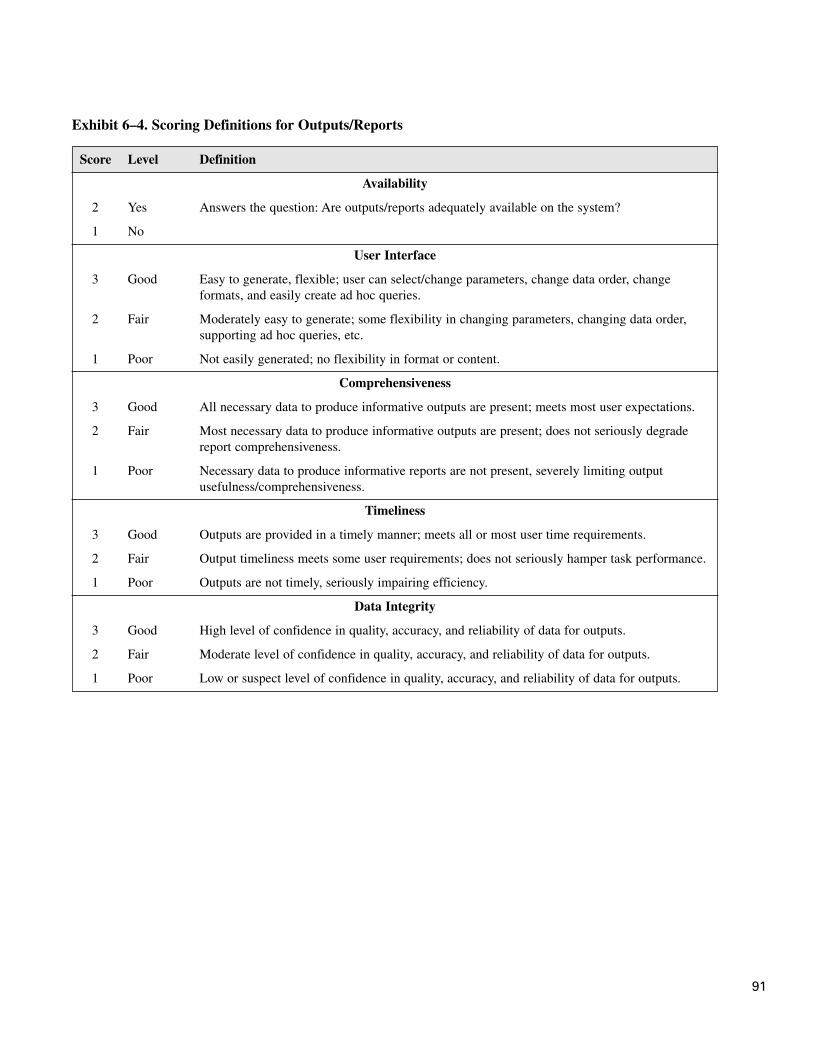
91
Score Level Definition
Availability
2 Yes Answers the question: Are outputs/reports adequately available on the system?
1 No
User Interface
3 Good Easy to generate, flexible; user can select/change parameters, change data order, change formats, and easily create ad hoc queries.
2 Fair Moderately easy to generate; some flexibility in changing parameters, changing data order,supporting ad hoc queries, etc.
1 Poor Not easily generated; no flexibility in format or content.
Comprehensiveness
3 Good All necessary data to produce informative outputs are present; meets most user expectations.
2 Fair Most necessary data to produce informative outputs are present; does not seriously degrade report comprehensiveness.
1 Poor Necessary data to produce informative reports are not present, severely limiting output usefulness/comprehensiveness.
Timeliness
3 Good Outputs are provided in a timely manner; meets all or most user time requirements.
2 Fair Output timeliness meets some user requirements; does not seriously hamper task performance.
1 Poor Outputs are not timely, seriously impairing efficiency.
Data Integrity
3 Good High level of confidence in quality, accuracy, and reliability of data for outputs.
2 Fair Moderate level of confidence in quality, accuracy, and reliability of data for outputs.
1 Poor Low or suspect level of confidence in quality, accuracy, and reliability of data for outputs.
Exhibit 6–4. Scoring Definitions for Outputs/Reports
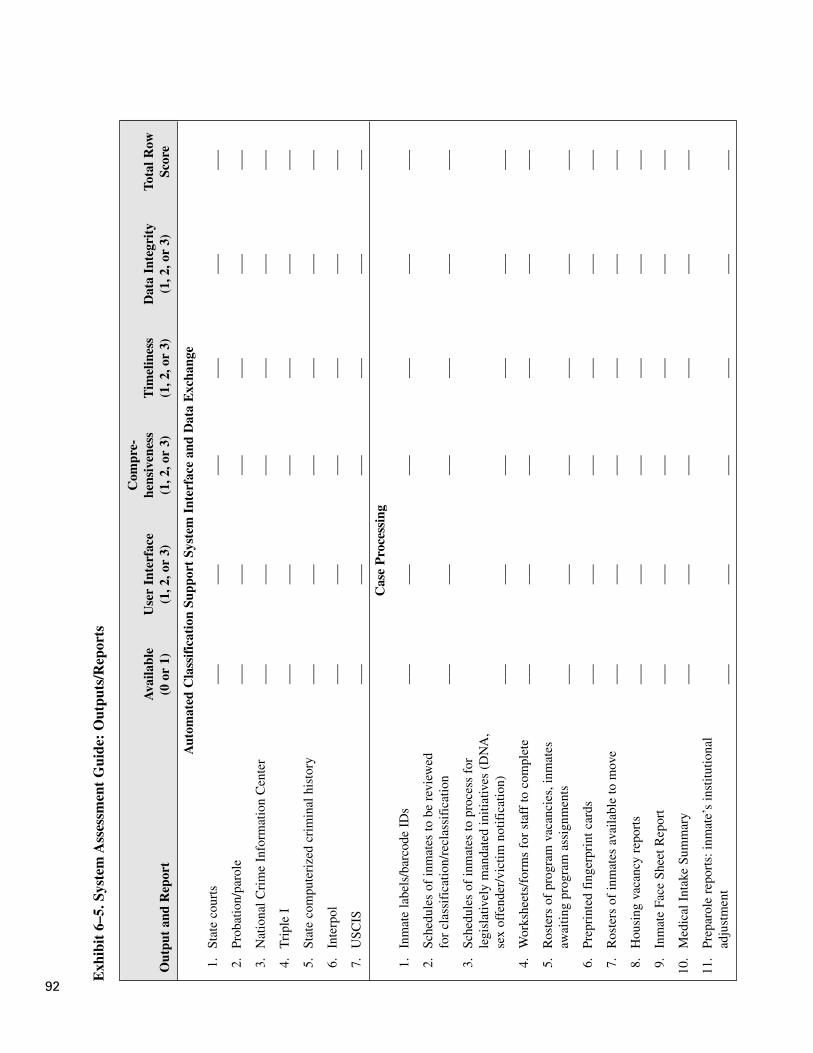
Com
pre-
Ava
ilabl
eU
ser
Inte
rfac
ehe
nsiv
enes
sT
imel
ines
sD
ata
Inte
grit
yTo
tal R
owO
utpu
t an
d R
epor
t(0
or
1)(1
,2,o
r 3)
(1,2
,or
3)(1
,2,o
r 3)
(1,2
,or
3)Sc
ore
Aut
omat
ed C
lass
ific
atio
n Su
ppor
t Sy
stem
Int
erfa
ce a
nd D
ata
Exc
hang
e
1.St
ate
cour
ts__
___
___
___
___
___
_
2.Pr
obat
ion/
paro
le__
___
___
___
___
___
_
3.N
atio
nal C
rim
e In
form
atio
n C
ente
r__
___
___
___
___
___
_
4.T
ripl
e I
___
___
___
___
___
___
5.St
ate
com
pute
rize
d cr
imin
al h
isto
ry__
___
___
___
___
___
_
6.In
terp
ol__
___
___
___
___
___
_
7.U
SCIS
___
___
___
___
___
___
Cas
e P
roce
ssin
g
1.In
mat
e la
bels
/bar
code
ID
s__
___
___
___
___
___
_
2.Sc
hedu
les
of in
mat
es to
be
revi
ewed
fo
r cl
assi
fica
tion/
recl
assi
fica
tion
___
___
___
___
___
___
3.Sc
hedu
les
of in
mat
es to
pro
cess
for
le
gisl
ativ
ely
man
date
d in
itiat
ives
(D
NA
,se
x of
fend
er/v
ictim
not
ific
atio
n)__
___
___
___
___
___
_
4.W
orks
heet
s/fo
rms
for
staf
f to
com
plet
e__
___
___
___
___
___
_
5.R
oste
rs o
f pr
ogra
m v
acan
cies
,inm
ates
aw
aitin
g pr
ogra
m a
ssig
nmen
ts__
___
___
___
___
___
_
6.Pr
epri
nted
fin
gerp
rint
car
ds__
___
___
___
___
___
_
7.R
oste
rs o
f in
mat
es a
vaila
ble
to m
ove
___
___
___
___
___
___
8.H
ousi
ng v
acan
cy r
epor
ts__
___
___
___
___
___
_
9.In
mat
e Fa
ce S
heet
Rep
ort
___
___
___
___
___
___
10.
Med
ical
Int
ake
Sum
mar
y__
___
___
___
___
___
_
11.
Prep
arol
e re
port
s:in
mat
e’s
inst
itutio
nal
adju
stm
ent
___
___
___
___
___
___
Exh
ibit
6–5
. Sys
tem
Ass
essm
ent
Gui
de:
Out
puts
/Rep
orts
92
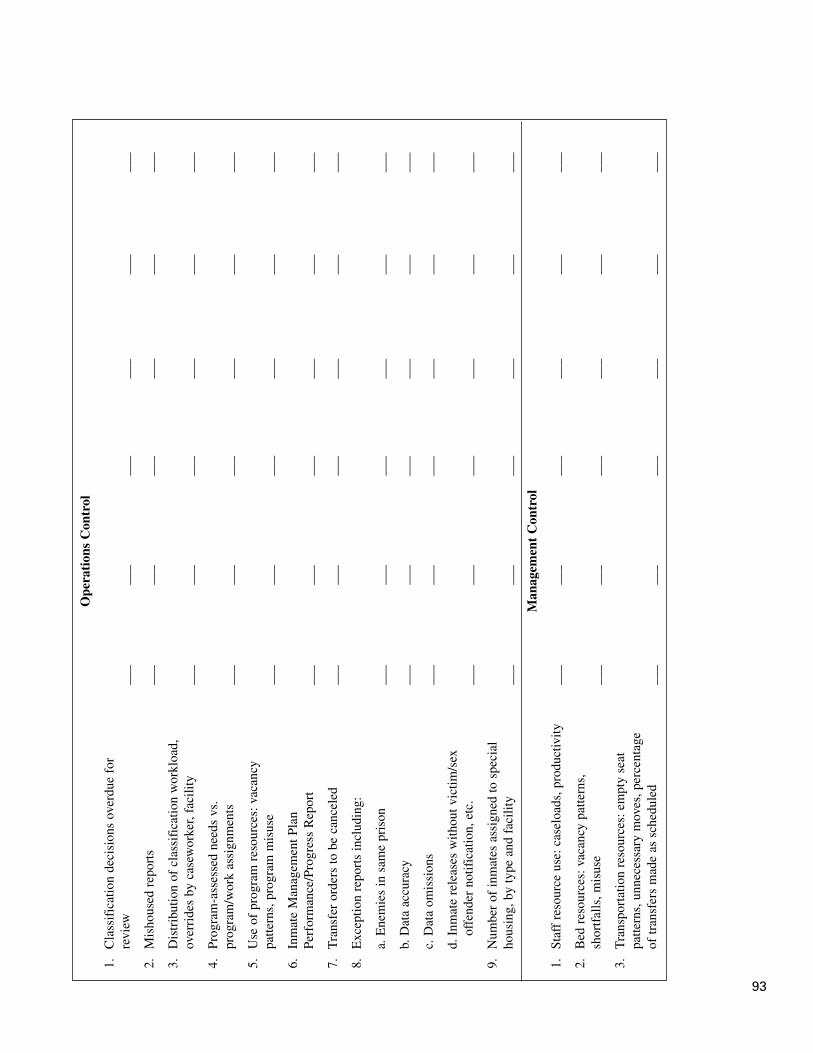
Ope
rati
ons
Con
trol
1.C
lass
ific
atio
n de
cisi
ons
over
due
for
revi
ew__
___
___
___
___
___
_
2.M
isho
used
rep
orts
___
___
___
___
___
___
3.D
istr
ibut
ion
of c
lass
ific
atio
n w
orkl
oad,
over
ride
s by
cas
ewor
ker,
faci
lity
___
___
___
___
___
___
4.Pr
ogra
m-a
sses
sed
need
s vs
. pr
ogra
m/w
ork
assi
gnm
ents
___
___
___
___
___
___
5.U
se o
f pr
ogra
m r
esou
rces
:vac
ancy
pa
ttern
s,pr
ogra
m m
isus
e__
___
___
___
___
___
_
6.In
mat
e M
anag
emen
t Pla
nPe
rfor
man
ce/P
rogr
ess
Rep
ort
___
___
___
___
___
___
7.T
rans
fer
orde
rs to
be
canc
eled
___
___
___
___
___
___
8.E
xcep
tion
repo
rts
incl
udin
g:
a.E
nem
ies
in s
ame
pris
on__
___
___
___
___
___
_
b.D
ata
accu
racy
___
___
___
___
___
___
c.D
ata
omis
sion
s__
___
___
___
___
___
_
d.In
mat
e re
leas
es w
ithou
t vic
tim/s
ex
offe
nder
not
ific
atio
n,et
c.__
___
___
___
___
___
_
9.N
umbe
r of
inm
ates
ass
igne
d to
spe
cial
ho
usin
g,by
type
and
fac
ility
___
___
___
___
___
___
Man
agem
ent
Con
trol
1.St
aff
reso
urce
use
:cas
eloa
ds,p
rodu
ctiv
ity
___
___
___
___
___
___
2.B
ed r
esou
rces
:vac
ancy
pat
tern
s,sh
ortf
alls
,mis
use
___
___
___
___
___
___
3.T
rans
port
atio
n re
sour
ces:
empt
y se
at
patte
rns,
unne
cess
ary
mov
es,p
erce
ntag
e of
tran
sfer
s m
ade
as s
ched
uled
__
___
___
___
___
___
_
93

94
Com
pre-
Ava
ilabl
eU
ser
Inte
rfac
ehe
nsiv
enes
sT
imel
ines
sD
ata
Inte
grit
yTo
tal R
owO
utpu
t an
d R
epor
t(0
or
1)(1
,2,o
r 3)
(1,2
,or
3)(1
,2,o
r 3)
(1,2
,or
3)Sc
ore
4.U
se o
f pr
ogra
m a
nd w
ork
reso
urce
s__
___
___
___
___
___
_
5.D
orm
itory
Cap
acity
Rep
ort:
actu
al v
s.
desi
gn; l
awfu
l cap
acity
___
___
___
___
___
___
6.R
esou
rce
need
pro
ject
ions
a.T
rend
s (n
umbe
rs,t
ypes
) sp
ecia
l-ne
eds
inm
ates
)__
___
___
___
___
___
_
b.T
rend
s in
dis
trib
utio
n of
sec
urity
cl
assi
fica
tion
type
s__
___
___
___
___
___
_
c.T
rend
s in
edu
catio
n le
vels
___
___
___
___
___
___
Stra
tegi
c P
lann
ing
1.Po
pula
tion
fore
cast
ing
___
___
___
___
___
___
2.In
tern
al p
olic
y si
mul
atio
ns (
e.g.
,cha
nge
in c
lass
ific
atio
n va
riab
les)
___
___
___
___
___
___
3.St
affi
ng a
naly
sis/
proj
ectio
ns__
___
___
___
___
___
_
4.L
egis
lativ
e im
pact
ana
lysi
s (e
.g.,
man
dato
ry s
ente
nces
,det
erm
inat
e se
nten
cing
)__
___
___
___
___
___
_
Tota
l col
umn
scor
e__
___
___
___
___
___
_
Tota
l ite
ms
scor
ed (
42 if
all
scor
ed)
___
___
___
___
___
___
Ave
rage
col
umn
scor
e (t
otal
col
umn
scor
e di
vide
d by
tot
al it
ems
scor
ed)
___
___
___
___
___
___
Exh
ibit
6–5
. Sys
tem
Ass
essm
ent
Gui
de:
Out
puts
/Rep
orts
(co
ntin
ued)
USC
IS =
Uni
ted
Stat
es C
itize
nshi
p an
d Im
mig
ratio
n Se
rvic
es (
form
erly
Im
mig
ratio
n an
d N
atur
aliz
atio
n Se
rvic
e)N
ote:
Tota
l col
umn
scor
e fo
r av
aila
bilit
y is
exc
lude
d fr
om c
ompu
tatio
n of
ove
rall
outp
uts/
repo
rts
syst
em a
sses
smen
t sco
re.
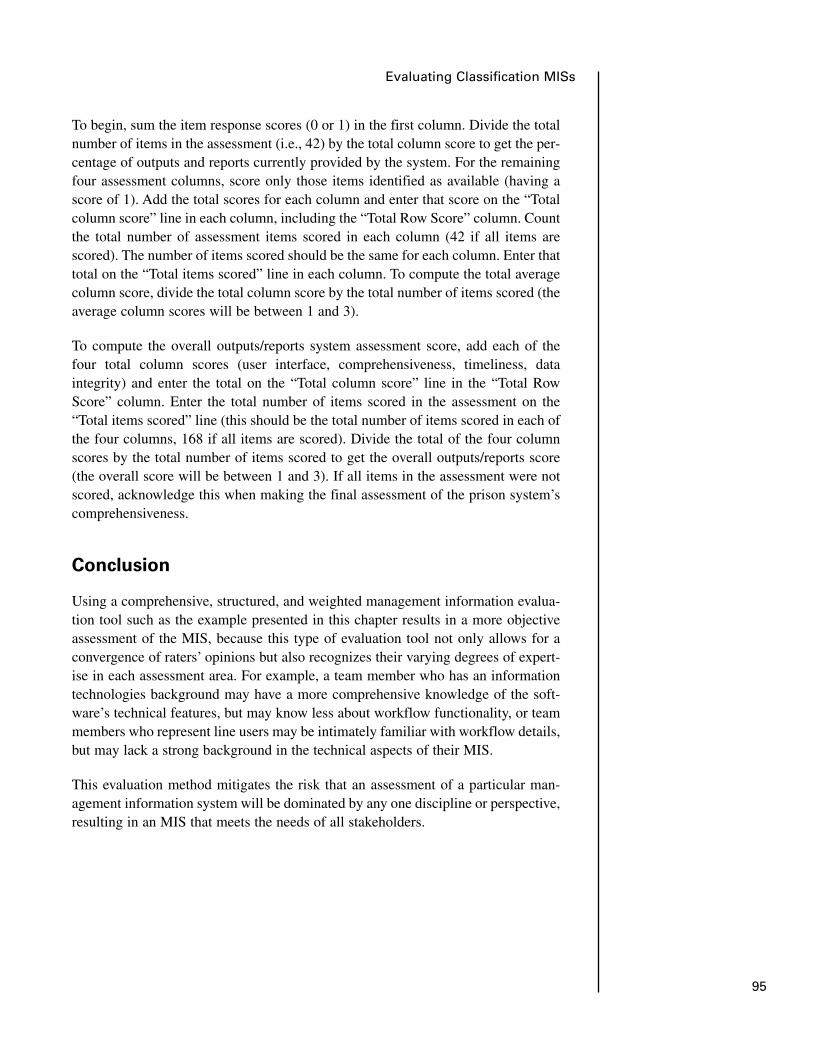
To begin, sum the item response scores (0 or 1) in the first column. Divide the totalnumber of items in the assessment (i.e., 42) by the total column score to get the per-centage of outputs and reports currently provided by the system. For the remainingfour assessment columns, score only those items identified as available (having ascore of 1). Add the total scores for each column and enter that score on the “Totalcolumn score” line in each column, including the “Total Row Score” column. Countthe total number of assessment items scored in each column (42 if all items arescored). The number of items scored should be the same for each column. Enter thattotal on the “Total items scored” line in each column. To compute the total averagecolumn score, divide the total column score by the total number of items scored (theaverage column scores will be between 1 and 3).
To compute the overall outputs/reports system assessment score, add each of thefour total column scores (user interface, comprehensiveness, timeliness, dataintegrity) and enter the total on the “Total column score” line in the “Total RowScore” column. Enter the total number of items scored in the assessment on the“Total items scored” line (this should be the total number of items scored in each ofthe four columns, 168 if all items are scored). Divide the total of the four columnscores by the total number of items scored to get the overall outputs/reports score(the overall score will be between 1 and 3). If all items in the assessment were notscored, acknowledge this when making the final assessment of the prison system’scomprehensiveness.
Conclusion
Using a comprehensive, structured, and weighted management information evalua-tion tool such as the example presented in this chapter results in a more objectiveassessment of the MIS, because this type of evaluation tool not only allows for aconvergence of raters’ opinions but also recognizes their varying degrees of expert-ise in each assessment area. For example, a team member who has an informationtechnologies background may have a more comprehensive knowledge of the soft-ware’s technical features, but may know less about workflow functionality, or teammembers who represent line users may be intimately familiar with workflow details,but may lack a strong background in the technical aspects of their MIS.
This evaluation method mitigates the risk that an assessment of a particular man-agement information system will be dominated by any one discipline or perspective,resulting in an MIS that meets the needs of all stakeholders.
95
Evaluating Classification MISs

Integrating Criminal Justice SystemMISs
Introduction
As noted in chapter 1, one of the main goals of criminal justice agencies at the fed-eral, state, and local levels is information systems integration. Efficiency require-ments and legislative mandates drive the need to share accurate and completeinformation in a timely and secure manner. Many agencies are developing plans forcomprehensive, integrated justice information systems.
Integrated database systems improve the quality of classification and decision-making information by reducing redundant data entry; broadening access to infor-mation, which is especially useful for classification; enhancing timely access todata; capturing data when they are most likely to be accurate and complete; andcross-verifying data.
Interagency MIS integration generally refers to the ability to access and share criti-cal data at key decision points. The functions normally considered in integrationefforts between agencies include the following:
� Requesting information from local, regional, state, and national databases toassess the criminal justice status of a person (e.g., to determine whether a per-son is currently wanted by another jurisdiction, has charges pending in anotherjurisdiction, is currently under some form of correctional supervision, or has acriminal history at the state or national level).
� Transferring data automatically between agencies, contingent on actions takenin the originating agency (e.g., when an inmate is released or scheduled forrelease, the prison MIS should “push” information to the parole office for usein case management, intake, supervision, or risk assessment and classification).
� Retrieving information from other systems (e.g., populating a prison MIS withoffender information captured in the jail or from court sentencing information).
Several barriers exist to information integration. Different databases may haveinconsistent data structures. Data element coding and definitions may be irreconcil-able. Many criminal justice agencies are responsible for their own data and may bereluctant to depend on another agency’s data or may have concerns regarding dataaccuracy and integrity. Agencies often differ in their emphases on detailed informa-tion or highly specific data coding structures. Finally, the level of IT development
sevenChapter
97
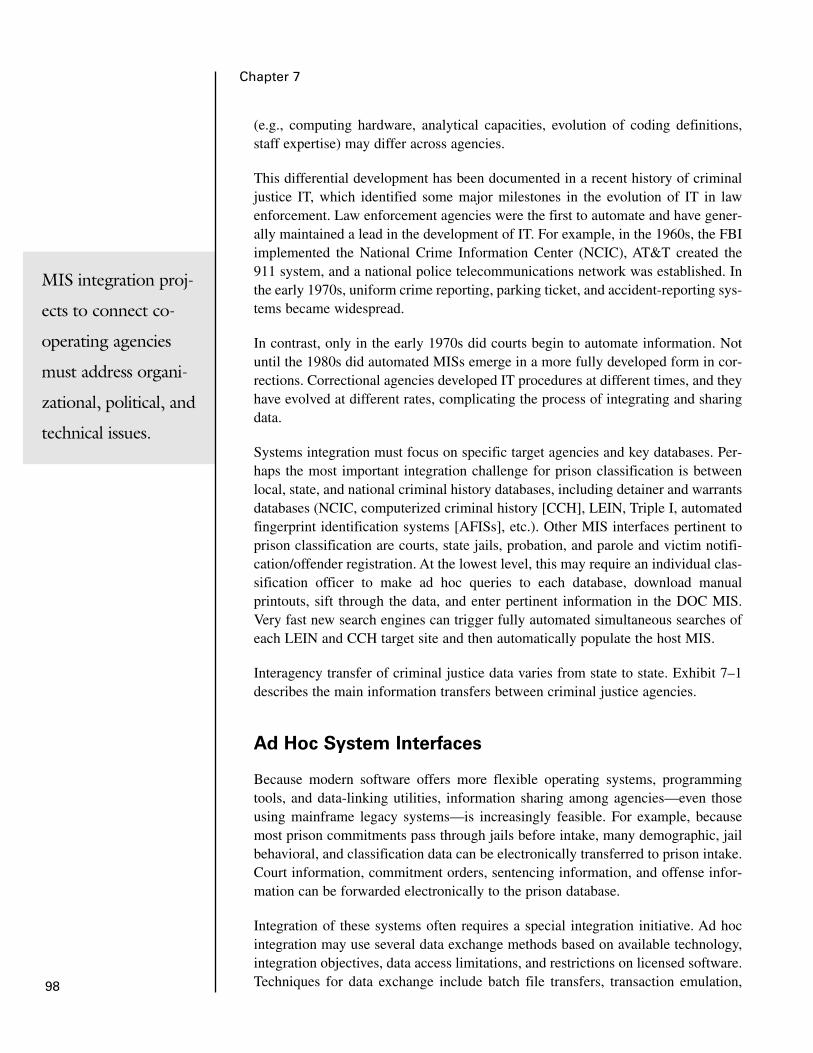
(e.g., computing hardware, analytical capacities, evolution of coding definitions,staff expertise) may differ across agencies.
This differential development has been documented in a recent history of criminaljustice IT, which identified some major milestones in the evolution of IT in lawenforcement. Law enforcement agencies were the first to automate and have gener-ally maintained a lead in the development of IT. For example, in the 1960s, the FBIimplemented the National Crime Information Center (NCIC), AT&T created the911 system, and a national police telecommunications network was established. Inthe early 1970s, uniform crime reporting, parking ticket, and accident-reporting sys-tems became widespread.
In contrast, only in the early 1970s did courts begin to automate information. Notuntil the 1980s did automated MISs emerge in a more fully developed form in cor-rections. Correctional agencies developed IT procedures at different times, and theyhave evolved at different rates, complicating the process of integrating and sharingdata.
Systems integration must focus on specific target agencies and key databases. Per-haps the most important integration challenge for prison classification is betweenlocal, state, and national criminal history databases, including detainer and warrantsdatabases (NCIC, computerized criminal history [CCH], LEIN, Triple I, automatedfingerprint identification systems [AFISs], etc.). Other MIS interfaces pertinent toprison classification are courts, state jails, probation, and parole and victim notifi-cation/offender registration. At the lowest level, this may require an individual clas-sification officer to make ad hoc queries to each database, download manualprintouts, sift through the data, and enter pertinent information in the DOC MIS.Very fast new search engines can trigger fully automated simultaneous searches ofeach LEIN and CCH target site and then automatically populate the host MIS.
Interagency transfer of criminal justice data varies from state to state. Exhibit 7–1describes the main information transfers between criminal justice agencies.
Ad Hoc System Interfaces
Because modern software offers more flexible operating systems, programmingtools, and data-linking utilities, information sharing among agencies—even thoseusing mainframe legacy systems—is increasingly feasible. For example, becausemost prison commitments pass through jails before intake, many demographic, jailbehavioral, and classification data can be electronically transferred to prison intake.Court information, commitment orders, sentencing information, and offense infor-mation can be forwarded electronically to the prison database.
Integration of these systems often requires a special integration initiative. Ad hocintegration may use several data exchange methods based on available technology,integration objectives, data access limitations, and restrictions on licensed software.Techniques for data exchange include batch file transfers, transaction emulation,
MIS integration proj-
ects to connect co-
operating agencies
must address organi-
zational, political, and
technical issues.
98
Chapter 7
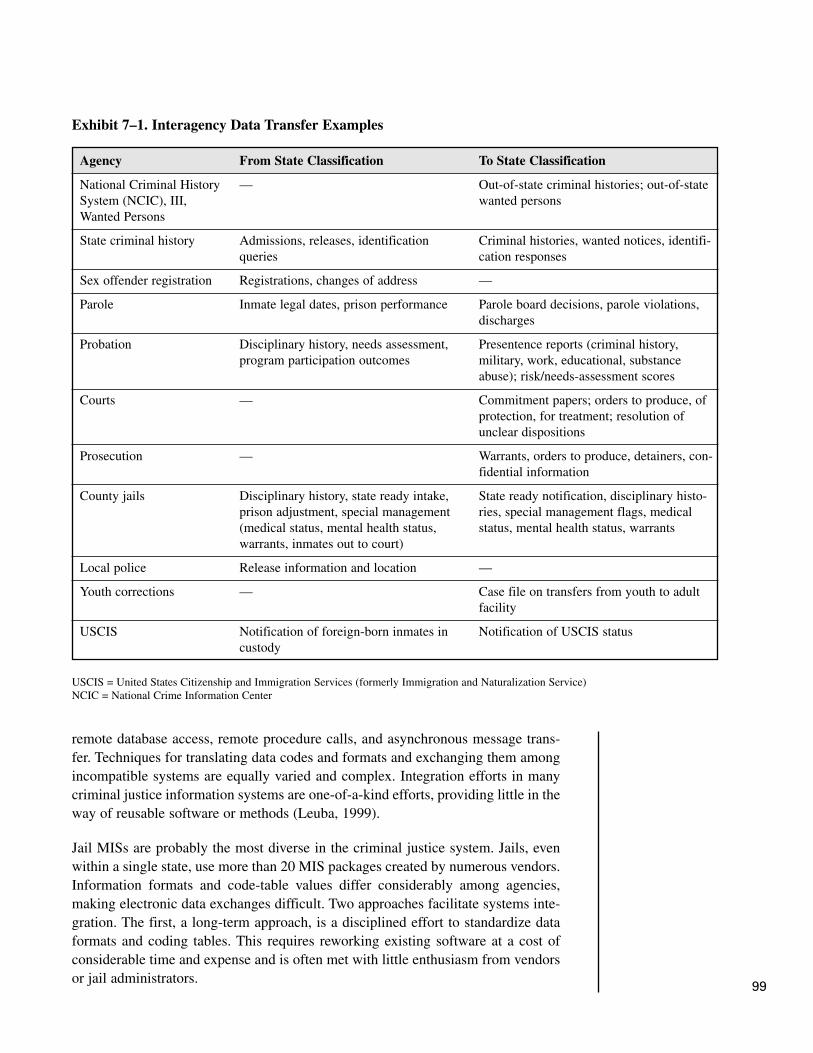
remote database access, remote procedure calls, and asynchronous message trans-fer. Techniques for translating data codes and formats and exchanging them amongincompatible systems are equally varied and complex. Integration efforts in manycriminal justice information systems are one-of-a-kind efforts, providing little in theway of reusable software or methods (Leuba, 1999).
Jail MISs are probably the most diverse in the criminal justice system. Jails, evenwithin a single state, use more than 20 MIS packages created by numerous vendors.Information formats and code-table values differ considerably among agencies,making electronic data exchanges difficult. Two approaches facilitate systems inte-gration. The first, a long-term approach, is a disciplined effort to standardize dataformats and coding tables. This requires reworking existing software at a cost ofconsiderable time and expense and is often met with little enthusiasm from vendorsor jail administrators.
99
Agency From State Classification To State Classification
National Criminal History — Out-of-state criminal histories; out-of-state System (NCIC), III, wanted personsWanted Persons
State criminal history Admissions, releases, identification Criminal histories, wanted notices, identifi-queries cation responses
Sex offender registration Registrations, changes of address —
Parole Inmate legal dates, prison performance Parole board decisions, parole violations,discharges
Probation Disciplinary history, needs assessment, Presentence reports (criminal history,program participation outcomes military, work, educational, substance
abuse); risk/needs-assessment scores
Courts — Commitment papers; orders to produce, of protection, for treatment; resolution of unclear dispositions
Prosecution — Warrants, orders to produce, detainers, con-fidential information
County jails Disciplinary history, state ready intake, State ready notification, disciplinary histo-prison adjustment, special management ries, special management flags, medical(medical status, mental health status, status, mental health status, warrantswarrants, inmates out to court)
Local police Release information and location —
Youth corrections — Case file on transfers from youth to adult facility
USCIS Notification of foreign-born inmates in Notification of USCIS statuscustody
Exhibit 7–1. Interagency Data Transfer Examples
USCIS = United States Citizenship and Immigration Services (formerly Immigration and Naturalization Service)NCIC = National Crime Information Center

A less daunting, less expensive approach is for the state oversight agency to identi-fy a smaller set of standard classification data elements to be passed by each jail toa central repository (a shorter term ad hoc solution). For example, the MichiganOffice of Community Corrections developed a standardized, objective jail classifi-cation. Standard reporting fields and code values were developed in a standard elec-tronic reporting format. Using state community corrections funds offered to eachcounty and local jail as an incentive, each of the several jail software vendors devel-oped compatible data conversion routines to extract the standard reporting elementsand convert them to the standard reporting format. This resulted in common datatransfer from each jail to the state central data repository. The primary uses ofMichigan’s system, thus far, have been data analysis and policy planning. However,these data could be made available to prison intake and reception centers through aninterface with the DOC MIS. South Carolina is embarking on a similar project withthe specific objective of integrating the centralized jail data into its MIS.
Although ad hoc interfaces are probably the most practical at the present time formany criminal justice MISs, some agencies are planning for and in some casesattempting to implement architecturally integrated MISs. According to the SearchInstitute at the time of writing, at least 31 states had institutionalized the integrationof criminal justice information systems. The SEARCH Web site (www.search.org)provides an updated profile of states’ information and database integration efforts.SEARCH has designed a model of the organizational structure and functions forstate IT governance boards. The key implementation features are listed below.
Organizational issues
� Include key stakeholders in criminal justice information.
� Include an executive sponsor.
Functional issues
� Develop a strategic plan that sets priorities.
� Identify and break down barriers to integration.
� Coordinate funding for the strategic plan.
� Define data requirements (who needs what information, why it is needed, andwho should enter it).
� Establish standards for hardware, software, and data structures.
Nationally, the Office of Justice Programs (OJP) has initiated efforts to coordinateactivities of criminal justice standards-setting bodies to develop a national consen-sus on technical and data integration standards. OJP’s goal is to develop the Nation-al Integration Resource Center to coordinate local, state, and federal data integrationefforts to upgrade the comprehensiveness of the classification data that are used injails, prisons, and other agencies.
100
Chapter 7

Data Integration Principles
Several principles can be incorporated into state integration efforts:
� Data are best captured at the originating point rather than reconstructed “down-stream.”
� Data should be captured once and used many times to leverage existingresources and improve data quality.
� The integrated system should be driven by the operational systems of partici-pating agencies and should not be separate from agency systems.
� The capabilities for automatic query should be constructed so that, for example,additional automatic reporting can be implemented easily when additional datarequirements are identified.
Agencies remain free to seek their own IT solutions. Adoption of integration stan-dards throughout criminal justice may motivate software developers to incorporatethese standards into their applications so that individual MIS modules, regardless ofagency or vendor, could be integrated using standardized data definitions, formats,and communication links. Modular interface designs use well-defined standardinterfaces and interchangeable components to facilitate the reuse of both softwaredesigns and standard interface techniques. Each step in this direction lowers costsand shortens implementation schedules.
Integration Components
Leuba (1999) identified three components of the integration architecture for crimi-nal justice information systems:
1. Workflow: The focus of initial integration design efforts on workflow charac-teristics of participating criminal justice agencies across organizational bound-aries.
Workflow analysis establishes the “how” and “what” of information flowbetween agencies. Several factors must be considered. In some instances, spe-cific data from a source system need to be handed off to a destination system ata single point in time (e.g., intake). In other instances, data may be required ona recurring basis, based on a “triggering event” such as a court appearance. Inthis scenario, updates to the court system related to a scheduled hearing auto-matically trigger the transmission of a specific message to the prison system.This message would contain the data required to retrieve or update an inmate’srecord in the prison system database and add the pending court hearing to thisrecord.
101
Integrating Criminal Justice System MISs
Data exchange interfaces may be unidirectional or bidirectional. Prison infor-mation systems may send or receive data. For example, an inmate’s transfer toa county jail may require the electronic transfer of data from the prison to thelocal jail system. Workflow analysis assists in determining interface direction,content, and events that trigger the transfer of data.
2. Data: The reconciliation of data formats and code values on a system-by-system, case-by-case basis to enable communication among the processes of thecriminal justice system.
Data analysis is also critical in systems integration. Data standards are evolvingto facilitate future systems integration. A recent example is the set of NCIC2000 Standards and Specifications, which ensure that AFIS, criminal history,inmate management, and related systems data at the federal, state, and local lev-els are defined and formatted consistently and clearly. As older prison MISs areenhanced or replaced with new technology, new standards may help ensure thatdata interfacing can be accomplished without excessive financial resources fordata conversion and mapping. More broadly based technology standards fordata exchange, such as extensible markup language (XML) data standards, canalso facilitate the exchange of data and documents between justice agencies.
Data standards are still evolving, and although they offer a long-term strategyfor systems integration, they do not always solve short-term problems. Mostcurrent prison MISs were designed and implemented without considering data-exchange requirements. Data attributes (e.g., length, type) and coded values forreference tables tend to vary significantly among applications based on the ageof the system, the system designers’ preferences, and the technical environment.
In this kind of heterogeneous environment, mapping data and defining conver-sion rules between systems can be a monumental task. Whereas mapping racecodes may be relatively straightforward, mapping other fields such as chargetables and address fields is often particularly onerous. In many instances, thisinvolves the resolution of one to many mappings between code-table values.Other challenges include (1) finding key identifiers that are continually presentin a consistent format to match the records of source and destination systemsand (2) addressing missing or optional data in the source system that arerequired by a receiving system. The data analysis and conversion processes arefrequently hampered by limited or nonexistent data dictionaries and the gener-al weakness of data documentation, particularly in older mainframe systems.
The importance of data analysis as a factor in system design cannot be overem-phasized. These requirements should be specified before defining the technicalarchitecture. Some developers tend to select middleware/software tools first andthen analyze systems integration requirements. This is risky because the toolsselected may not be appropriate for meeting system requirements.
102
Chapter 7
Systems integration is
evolving beyond sim-
ple sharing of struc-
tured data among
database applications.
Technology exists to
exchange documents,
mug shots, and other
kinds of data. This
evolution further
strengthens the data-
bases on which classi-
fication relies. The
use of industry stan-
dards is particularly
important in this
arena.
3. Technology: The definition of the means for data interchange techniques amongcase-processing database systems and the definition or standardization of mes-saging architecture for actual data transfer. The messaging architecture includesspecifications of message triggers, formats, contents, and delivery methods forintersystem communications.
The technology component must be well aligned with the workflow and dataanalysis components. There are many technical approaches to the developmentof push, pull, and query strategies for system interfaces. Several commerciallyavailable middleware packages facilitate implementation of systems interfaces.Middleware supports the processing, conversion, and routing of messagesbetween systems using asynchronous transfer data packets. If the need for datatransfer is immediate, tools are available to support near real-time data transfer.An adequate network infrastructure is also required to support this type ofinterface.
The development of data warehouses strengthens prison classification becauseof the broader range of data they provide. Middleware can support both datawarehousing and direct system-to-system interfaces. Data warehousing typi-cally involves the replication, conversion, and storage of data from multiple jus-tice agency databases to a single integrated database that can be queried by allparticipating agencies. A data warehouse approach moves criminal history datainto a single repository to eliminate multiple queries with different UIs acrossseveral systems. Once agreement has been reached on what data can and shouldbe shared among agencies, triggering events can be defined to send data auto-matically from law enforcement, prosecutorial, court, and correctional systemsto the criminal history data warehouse. Middleware can transform the data andcreate a consolidated database for query access. Some prisons and larger jails(e.g., those operated by the Los Angeles County Sheriff’s Department) are usingmiddleware and relational database technology to enable the cost-effectivedevelopment of this type of system integration strategy. On one hand, thesetechnologies make it easier to maintain and enhance the interfaces as the sys-tems environment changes. A customized development approach, on the otherhand, can be cost prohibitive and difficult to maintain.
Middleware can also enable direct system-to-system interfacing, which requiresdata translation and formatting of messages between different technical envi-ronments. Source systems must send data based on predefined triggers (e.g.,release or scheduled court hearing). The middleware must then reformat androute the data to the receiving system using a communication protocol under-standable to that system. This approach ensures that data are already staged andavailable for the receiving system in a usable format before they are needed.
Another approach is to retrieve data dynamically from the source system asneeded. For example, at intake, an identifier can be used to search foreign sys-tems for data related to that inmate. This approach can be difficult to implement
103
Integrating Criminal Justice System MISs

when technical environments differ across agencies, and it may also introducesystem performance problems. Dynamic retrieval of data from foreign systemsusually occurs only when the source and destination systems use similar tech-nical environments (e.g., two Oracle databases or two mainframe MISs).
Classification user requirements, mediated by the existing technical environment,should drive the selection of a systems integration strategy. On completion of theclassification workflow and data analysis, the integration strategy can be determinedand middleware and other technical tools selected. The use of a system developmentmethodology to design, construct, test, and implement systems interfaces is impor-tant to the success of these projects.
Integration Implementation Strategies
Successful implementation of information systems integration requires careful plan-ning and effective organization. Multiple jurisdictions must articulate a vision,define the scope and objectives of their project, establish an effective organization-al structure, recruit initiative sponsors, secure funding, develop comprehensivestrategic plans, and address technical and policy issues to enable the sharing ofinformation within and among agencies. Several noteworthy examples of inter-agency classification data integration projects are discussed below.
An automated identification verification system is often a great practical advance-ment. In the past, states fingerprinted admissions, sent the fingerprint cards to thestate’s centralized data bank, and eventually received notice of the inmate’s identi-fication. Now several states send fingerprints electronically to the data bank andreceive identification almost immediately. In Colorado, DOC has worked with otheragencies in the Colorado Integrated Criminal Justice Information System to createa system in which mittimus information is sent electronically directly from the Judi-cial Department’s information system to the DOC system. Warrants soon will besent directly from the district attorneys’ information system to DOC. New Jersey hasan automated, standardized, statewide objective jail classification (OJC) system.Statewide integration of classification data elements has several key advantages:
� Automatic notification of state offenders’ admission to and departure from anycounty jail in the state.
� Standardized discipline reports on state inmates in county jails.
� Standardized and uniform dates for DOC objective classification.
� Statistical and characteristic reports on state inmates housed in country jails.
Design and implementation of the New Jersey OJC took 3 years and required thecooperation of many agencies. The New Jersey County Jail Wardens Associationestablished the OJC User Requirements Committee to work with the DOC Classifi-cation Bureau and the Administrative Office of the Courts Information System
104
Chapter 7
Division to create the instrument design and software requirements. The committeeadapted an objective jail classification instrument that had been developed with NICfunding. The state’s Criminal Justice Information Systems Policy Board coordinat-ed funding for the project. NIC provided assistance for the design phase, for train-ing, and for validation of the instrument.
New York’s Statewide Criminal Justice Data Dictionary project was a similarstatewide integration process that began in 1984. The common data dictionary, nowin its eighth edition, has almost 400 data elements. The New York State Division ofCriminal Justice Services Integrated System Development Unit (DCJSISD) coordi-nated the project, which involved more than 20 state and local criminal justice agen-cies organized into three functional area teams (law enforcement, courts, andcorrections) and a liaison committee consisting of the leaders of each area team andrepresentatives of DCJSISD. Each area team identified data elements that were col-lected by its agencies and required transfer to other agencies. Each agency describedits definition and use of each element. Following agreement on a draft dictionaryentry, the members took the entry to their agencies for approval. The entry was thensubmitted to the other two area teams for review and approval. The liaison commit-tee resolved outstanding issues, and the new element was entered into the diction-ary. Participating agencies were free to define data elements according to their ownneeds, provided they transferred the elements to other agencies in conformance withthe data dictionary definitions.
Conclusion
The fundamental advantage of database integration from the perspective of classifi-cation decisionmaking is increased accessibility to key data elements. Cross-verification of risk and needs data is also aided by the ability to transfer data elec-tronically. Thus the emergence and development of integrated interagency databas-es have tremendous potential for strengthening the integrity and coverage ofclassification data, which in turn strengthens the predictive validity and usefulnessof prison classifications.
Individual criminal justice agencies can no longer simply maintain their own isolat-ed MISs without considering integration with other agencies. The criminal justicesystem is a continuum of offender-based information processes that operate moreefficiently when linked. The traditional approach of maintaining disconnected andindependent databases has consistently led to information processing bottlenecks.Even when agencies have automated their internal case management systems, trans-ferring a case to the next agency in the legal process often involves preparing andsubmitting paper-based case files containing many redundant forms.
Information systems integration seems inevitable. This process holds particularpromise for prison classification and all other forms of criminal justice data inte-gration and analysis. Classification and risk assessment units in jails, prisons, pro-bation, and parole are in a particularly key position in this process because they have
105
Integrating Criminal Justice System MISs

traditionally been the focus of information integration efforts. In this familiar role,classification and assessment have already grappled with many of the issues that areinvolved in assessing data integrity, verification processes, and the integration ofdiverse data elements when making high-risk decisions regarding offenders.
106
Chapter 7
“Content validity of
classification” refers
to the coverage of
key risk and crimino-
genic factors. Ade-
quate content validity
is a scientific and ethi-
cal prerequisite to the
use of classification to
guide critical human
decisions. Decision
errors are more likely
when key classifica-
tion factors are
missing.
New Directions in ClassificationFactors and Information Content
Introduction
This chapter presents current directions in the selection of key classification vari-ables that should be contained in MIS databases, addresses how prisons are search-ing for better classificatory factors, and introduces the complex topic contentvalidity of classification. A more powerful MIS allows the use of more classificato-ry variables and thus increases the information content of a classification. Past liti-gation has implied that all relevant classification factors should be included incorrectional classifications (Brennan, 1987b; Tonry, 1987). The implication is thatcritical classification factors should not be overlooked. It is incumbent on the MISto provide the key classification factors. To the degree that key variables are miss-ing, classification validity, usefulness, and effectiveness are impaired.
Content validity is a major foundation of effective classification. Classification sys-tem designers inevitably must decide which variables should be included. Contentvalidity is ultimately based on the purpose(s) of a classification. Each type of prisonclassification process (e.g., external, internal, treatment, reentry) relies on factorsthat are relevant to its unique purposes. As noted previously, the trend toward mul-tiple purposes and more comprehensive classifications inevitably demands a broad-er coverage of key variables. This vastly increases the role of the MIS.
Contribution of the MIS to Classification Effectiveness
As correctional agencies adopt more comprehensive, multidimensional classifica-tions for internal management, treatment purposes, and community reentry, the roleof the MIS and IT will expand dramatically. The simpler classifications of the past20 years have profoundly underutilized the enormous memory and analytical powerof today’s computers. However, the newer, more comprehensive classifications,almost by necessity, rely more on the computing power that makes complex classi-fications feasible. An early example of this trend was Megargee’s Minnesota Multi-phasic Personality Inventory (MMPI) typology, which incorporates computationsthat are impossible for a human being. Megargee and colleagues developed a spe-cial computer program to help staff match inmates to the most appropriate class.Without this algorithm, staff simply are unable to classify a new offender into thecorrect profile type. This system has 10 separate classes, defined in a multidimen-sional space of 10 factors.
eightChapter
107
Prison MISs support more effective classification systems in the following ways:
� A powerful automated MIS allows more comprehensive coverage of classifica-tion factors. This requires faster search engines, speedier data retrieval, moreextensive data storage, computation of scale scores, summarization and identi-fication of inmate profiles, and graphical outputs for simplified profilerepresentation.
� In more complex prison classifications, matching prisoners to their profile typesis too demanding for human computation. The present manual system relies onthe simplicity of current offender classification systems. To find “best fit” clas-sifications, the analytical capacity of the MIS is critical in computing probabil-ities of membership scores, computing distances and matching measures, andsummarizing this information to relieve staff of its computational requirements.
� Prison managers require powerful state-of-the-art procedures to monitor thequality of classification work. Monitoring the quality and fairness of classifica-tion decisions is important for political, ethical, and public safety reasons. Theanalysis of error patterns and the quality of classification decisions is feasibleonly with computers. Thus, procedures to analyze error patterns (e.g., signal-detection methods and receiver-operator characteristics analyses) are likely tobecome widespread and perhaps politically required to monitor and demon-strate the validity of classification procedures. These procedures place intensecomputational demands on the MIS (Brennan and Harvey, 2000; Mossman,1994; Quinsey et al., 1998). Classification managers will require powerful MISsoftware to conduct error analyses to reveal false positives and negatives, over-ride rates, hit rates, and so on. Computational power is also needed to produceappropriate statistical indices to monitor the accuracy of a prison’s classificationprocedures.
Criticisms of Prison Classification Data Coverage
As noted elsewhere, many articles in the prison classification literature reveal con-cerns about the poor content validity (information coverage) of prison classificationsystems (Brennan, 1987b). For example, MacKenzie (1988) argued that the justicemodels of classification had a devastating impact on content validity, producingclassifications with poor coverage of salient variables that provided little guidancein managing or treating offenders. Sechrest (1987) similarly complained that mostcorrectional classifications suffered from narrowness, oversimplification, and anabsence of theoretical guidance.
The current oversimplification of classification in corrections has occurred for sev-eral reasons, including failure to appreciate the full range of classification purposes,weak guidance from criminological theory, inadequate validation research, and thebelief that “nothing works” regarding treatment (Brennan, 1987a; Quinsey et al.,1998; Sechrest, 1987). In addition, the “just deserts” correctional philosophy widely
108
Chapter 8
adopted during the 1980s emphasized a narrow set of legalistic and behavioral vari-ables and restricted the use of relevant social and psychological factors (Austin,1983; Palmer, 1992). Unfortunately, the simple classifications that resulted werealmost useless for inmate management, treatment, and case planning.
Finally, the unavoidable practical constraint of staff overload forced prisons todesign oversimplified systems. Specifically, information overload was such a seri-ous problem that most prior prison classifications were designed for very simple andefficient manual processing, thus the coverage of variables was very restricted. Theemergence of powerful computerized information processing has removed this con-straint. Several powerful classification algorithms are now available that incorporatemultiple classification risk and needs factors into classification decisions, imposingalmost no stress on staff (see chapter 9).
Classification Types, Goals, and Approaches
The discussion below is based on the following types of prison classifications:
� External classification and reclassification.
� Internal classification for management and programming.
� Classifications to predict violence and dangerousness (which may have impli-cations for both external and internal classification).
� Classifications for community reentry, treatment, and rehabilitation.
The potential range of risk and needs factors in prison classifications is enormous.This review is selective and guided in part by the prisons that were examined in thisstudy. However, the discussion also includes exciting developments not evident inthese systems, such as the work of Quinsey et al. (1998) in classification of violentoffenders, Cooke’s (1998) work on behavioral classification, and other recentdevelopments.
The desire of different prison systems to create their own customized classificationswas evident in the classification variables used in each prison system. Each adopt-ed slightly different philosophies, correctional goals, training and theoretical back-grounds, and so on, to produce unique systems. The prison systems consistentlydemonstrated the trend toward more comprehensive internal classifications, broad-er sets of social and psychological factors, and a renewed interest in treatment andreentry classifications.
External Classification
The goals and purposes of external classification systems were consistent acrossprisons, but they were written and operationalized in different ways. External clas-sification guides decisions regarding the security level and the institution to which
109
New Directions in Classification Factors and Information Content

an inmate is assigned: minimum-security inmates should be assigned to minimum-security facilities. However, in many prisons, the need for special programs or serv-ices is also factored into external classification. Related purposes involve the safetyof the community, facility, staff, and other inmates. Violent, predatory, and high-riskoffenders are identified and separated from nonviolent offenders and assigned to set-tings that have a higher security level.
Typical classification factors used to assess security levels include the following:
� Severity of current offense.
� Severity of prior convictions.
� Escape history.
� History of violence.
� Length of sentence.
� Time to parole eligibility.
� Pending charges and detainers.
� Disciplinary history.
� Risk-group membership (e.g., gangs).
� Stability factors (work, residential, family, etc.).
� Substance abuse problems.
� Current age.
These factors are numerically scored and summed to give a simple additive scale.The scale then uses “cutting points” to separate high-, medium-, and low-securityinmates. Typically, two cutting points (or threshold levels) are applied to producethree classes, although applying three cutting points to produce four security levelsis simple. Thus, a high cutting point can be used to separate “max 1” from “max 2”prisoners. In most prisons, these decision thresholds are established on logicalgrounds rather than by using statistical analyses. Thus, the prevailing current prac-tice is to choose cutting points on policy grounds so that serious and repeat violentoffenders are placed in high security.
Some external classifications (e.g., in Oregon, Missouri, and other states) distin-guished public risk from institutional risk, and different risk factors were used tocompute scale scores for both aspects of risk. Institutional risk involves higherweighting for a history of disciplinary infractions, serious violent infractions, andother factors thought to predict internal disciplinary problems and threats to safety.
110
Chapter 8

Public risk involves higher weighting for factors that are believed to predict escapeor recidivism, particularly regarding dangerous and violent crimes.
In most prisons, the variables needed for external classifications were available elec-tronically in the MIS/database to minimize data retrieval burdens on staff. Manyclassification instruments were scored by computer to save staff time and minimizeerrors.
In the prisons reviewed by the research team, both discretionary and mandatory staffoverrides of the formal point scales were allowed. These overrides were based onvarious anomalous, or unusual, factors identified through observation of or inter-views with inmates. Typically, overrides are monitored and reviewed by superviso-ry staff.
Generally, external classification required assessment of a range of treatment needs,including mental health, medical, dental, and other program or treatment needs. Insome external classification systems (e.g., in Florida), features such as medical,mental, and dental health were incorporated explicitly into the external classifica-tion rules because of limited access to these services in specific facilities.
Reclassification
Reclassification aims to update an inmate’s initial security placement periodically,based on behavioral adjustments, recent disciplinary behaviors, and the need forspecific program/work options. The prevailing reclassification approaches rarelyuse personality, attitudes, or other criminogenic factors but rely on simple checkliststhat largely replicate the initial external security classifications. The advantages ofthis approach include simplicity, ease of use, minimal data entry and retrievalrequirements, and an emphasis on recent behavior.
The approaches to reclassification in most systems (e.g., in Washington and Col-orado) relied strongly on the initial external classification level, with minor modifi-cations of the instrument to emphasize recent behavior. In Colorado, for example,classification factors were divided into part A (history of institutional violence,recent institutional violence, severity of current offense, number of current convic-tions, offenses resulting in death, and severity of prior convictions) and part B(detainers/pending charges, escape history, number and type of disciplinary reports,and time to parole eligibility). Several of these factors (e.g., time to parole eligibil-ity, recent violent and disciplinary behaviors, details of pending charges/detainers)are dynamic, which gives inmates an opportunity to reduce their custody levels.
Internal Classification
Internal classification has more complex purposes and requires a more comprehen-sive set of classification factors than external classification. The purposes of inter-nal classification involve the management, treatment, and work assignment ofinmates within a facility. Thus, needs assessment, treatment and housing assign-ments, inmate compatibility, and interpersonal relationship styles take priority over
111
New Directions in Classification Factors and Information Content

risk assessment and are needed to match inmates with compatible cellmates. Suc-cessful matching of cellmates is important because of crowding, the use of double-cell housing (even in situations requiring higher security), and the use of dormitoriesfor prisoners requiring lower security. Thus, internal classification differentiatesprisoners for safe, trouble-free housing at a common custody level and for produc-tive work assignments.
All prison systems in this study had developed and implemented internal classifica-tions. Internal classifications emerged because of the inadequacy and subjectivity ofprevailing reclassification decisions and weak guidance from external classificationfor housing, program, and work assignment decisions (Hardyman et al., 2002). Theproblems of inappropriate commingling, biased housing decisions, poor compati-bility of cellmates, and endless internal transfers created the need for this kind ofclassification.
Most of the prisons visited for this study had computerized data entry, retrieval,tracking, and monitoring for internal classifications. More comprehensive coverageof classification factors creates a greater burden on staff for data collection. TheMIS must store all key risk and needs factors used in the internal classification. Datacoding procedures are also more complex, as many of these classification factorsrefer to specific historical time periods (e.g., in New Jersey, disciplinary historieswere considered for the previous 2-year period), and the MIS coding proceduresmust be sensitive to these time frames and the dates of infractions.
Prison systems have developed their own unique approaches by prioritizing purpos-es and selecting different classification factors for their internal systems. New Jer-sey, for example, prioritized the identification of inmates appropriate for therapeuticcommunities, mental health programs, and programs for emotionally disturbed ordisabled prisoners. They also emphasized the need to expand work opportunities toincrease the number of inmates provided with appropriate work assignments.Another priority was to identify and appropriately house inmates with affiliations tospecific gangs or other risk groups.
Florida developed a detailed inventory of risk and needs factors to drive internalclassification (described in chapter 4). Florida prisons addressed the difficult topicof responsiveness and aimed to assess inmates’ critical attitudes, motivation to par-ticipate in programs, and potential to gain from participation (i.e., restructuringpotential). Yet, providing appropriate housing and compatible cellmates and match-ing inmates’ risks/needs to program and work assignments were the fundamentalpurposes guiding that system.
Washington had similar basic goals but chose different classification factors. Theyemphasized case management as a tool to improve matching, gain control overinmate movement and discipline, reduce escape risk and other destructive behav-iors, and guide the development of programs to be more responsive to offenders’needs. They adopted the LSI as a classification system for both risk and needs
112
Chapter 8
assessment and also used other instruments that focus on violence and interperson-al relationships (e.g., the Buss-Durkee Hostility Inventory).
Internal prison classification systems, despite having common goals, are designedin different ways by different prisons. Different risk and needs inventories, such asAIMS, LSI, and the Prisoner Management Classification (PMC) are thus selected tosupport this task. The nation’s prisons are using a wide range of experimental inter-nal classification approaches. Because classifications for treatment and programsare linked to the design of internal classifications, the work of Palmer (1992),Sechrest (1987), Quinsey et al. (1998), and others is highly relevant in designingthese internal classifications.
Another reason for the wide array of internal classification approaches is theabsence of theory to guide the selection of variables. Relevant theories of offenderclassification would provide coherent guidance in designing new approaches forboth external and internal classifications.
Some interesting theoretical developments have been reported in the criminologyliterature that may improve the design of classification systems in prisons and othercorrectional agencies. These include criminal lifestyle theories, theories of desis-tance from crime (Sampson and Laub, 1995), criminal opportunity and routineactivities theory (Horney, Marshall, and Osgood, 1995), psychopathy and criminalpersonality theory (Brannigan, 1997; Hare, 1996; Gottfredson and Hirschi, 1990),social learning theory and crime (Andrews and Bonta, 1994), and genetic markertheory (Carey, 1989). Developments based on this research will likely suggest morepowerful classification factors. Thus corrections may be at the threshold of dramaticimprovements in selecting classification factors that will yield substantial improve-ments in prison classifications.
The discussion below describes some major design efforts in internal classificationprocedures that are being introduced into current practice in prisons.
AIMS—assessing prisoner behavior. AIMS, first developed in 1983 for use in theFederal Bureau of Prisons, continues to attract much attention in today’s prisons asan internal classification method (NIC, 2001). The information content of AIMSoriginally consisted of five behavioral scales constructed through factor analysis:aggressive-psychopathic, manipulative, situational/normal, inadequate/dependent,and neurotic/anxious (Quay, 1987). These scales allow each prisoner to be classifiedinto five behavioral categories according to his or her highest scale score.
AIMS has several advantages for internal classification purposes. First, it assessesobservable inmate behavior using simple checklists. These behavioral checklistshave high relevance for prison classification because they were developed with theinput of prison officers and therefore have good face validity (i.e., they make logi-cal sense to the user). Second, prison staff, who have had the most frequent interac-tions with prisoners, do the ratings. Third, it is relatively efficient becauseclassification can be done quickly without imposing a great burden on staff time.
113
New Directions in Classification Factors and Information Content
114
Chapter 8
Fourth, it uses direct observations of behavior. This contrasts with most clinical tests(e.g., the Millon inventory, MMPI), which focus on attitudes, personality character-istics, motivations, and other nonbehavioral factors.
However, several critical problems are associated with AIMS. The first concerns itsfactor structure and factorial validity. Some confusion exists about exactly what isassessed by AIMS. Cooke (1998), for example, reported that the first two dimen-sions (aggression and manipulation) tend to collapse into a single factor that hecalled antiauthority. A second problem is that the neurotic/anxious factor has anambiguous factor structure and is not clearly interpretable. These definitional prob-lems were also found in the use of AIMS for internal classification in both the Mis-souri and South Dakota prison systems (NIC, 2001). A third and the most seriousproblem of AIMS is its procedure for classifying an inmate using the highest scalescore. This confuses a scaling dimension with a “category” of persons. For exam-ple, a prisoner could score high on two or more scales with insignificant differencesbetween these scores. AIMS forces the inmate into the highest scale score andignores other behavioral tendencies. As Cooke (1998) noted, this problem is not justa theoretical quibble but has profound implications for predictive validity. A fourthproblem is low predictive validity. At least one recent study has found an unaccept-ably high false-positive error rate for the aggressive category (NIC, 2001). A fifthproblem, which has led to a reconsideration of its use for internal classification insome prisons, is an unacceptably poor interrater reliability.
Despite these problems, the AIMS approach to behavioral assessment is simply tooimportant to abandon. There are several ongoing efforts to improve the system. Amajor research effort in Scottish prisons reevaluated AIMS. The result was a modi-fied factor structure and improved interrater reliability and predictive validity(Cooke, 1998). Cooke’s new scale is referred to as the “Prison Behavior RatingScale.” The new factor structure found three as opposed to five fundamentalfactors: (1) antiauthority, which collapses Quay’s first two dimensions; (2) anx-ious/depressed; and (3) dull/confused. These refinements are consistent with deci-sions by American prisons to simplify the system by using three categories ratherthan five (NIC, 2001). The interrater reliabilities in the Scottish approach indicatedthat the intraclass correlation coefficients were .78, .68, and .59, respectively, for theabove scales, indicating that improvements are still needed, particularly for thedull/confused scale.
However, a profoundly important finding in Cooke’s work was that the antiauthori-ty scale—the strongest and most reliable scale—had a significant correlation withHare’s Psychopathy Checklist. The importance of this finding is that prison staffmay be able to use behavioral ratings to identify psychopathic prisoners who repre-sent the highest risks to both the institution and the community.
PMC/CMC System. Another method that continues to attract attention as an inter-nal management classification and treatment programming system is PMC. Severalprisons are actively developing PMC as an internal classification. PMC was origi-nally developed in Wisconsin to provide decision support for probation services
(Lerner, Arling, and Baird 1986). Following various revisions, it was renamed“CMC” and widely disseminated with support from NIC (see Hardyman et al.,2002).
This system has broad coverage of risk and needs factors and consequently requiresan extensive interview with each offender. The data handling and processing tasksare fairly demanding. CMC assesses background factors; criminal and social histo-ries; family factors; relationships with staff, inmates, and peers; and a range of atti-tudinal and psychological factors. It has both a risk assessment scale and a longercomponent that deals with treatment needs. An important feature that is often miss-ing in structured interviews is an assessment of postrelease plans. In addition, fol-lowing the semistructured interview, staff provide several behavioral ratings on thedemeanor, attitude, behavioral traits, and subjective evaluations of the seriousnessof some needs. This is reminiscent of the postinterview ratings used by Quinsey etal. (1998) in their correctional assessment interview of prisoners.
Comprehensive information gained in this process is used to assign an offender toone of four classes: limit setting, casework control, selective intervention (treatmentand situational), or environmental structure. Prisoners assigned to the first two class-es are viewed as more aggressive, presenting more serious management problems.Prisoners assigned to the latter two classes are viewed as less aggressive and dis-ruptive, requiring lower levels of supervision.
The interview takes approximately 45 minutes (depending on interview style) and,in addition to requiring intensive training and creating data handling burdens, hascontributed to considerable implementation problems. During the past decade,many correctional systems introduced PMC and then abandoned it because of timeand cost (interviewing and scoring demands) issues. In addition, some agencies useonly the risk assessment scale and abandon the more comprehensive social and psy-chological section.
Notwithstanding these problems, various evaluation studies have suggested thatCMC can successfully identify predators, separate predators from victims, andreduce institutional disciplinary problems (Hardyman et al., 2002; Harris, 1994).Another strength of CMC is its detailed case planning, programming, and manage-ment guidelines for each offender, which are of considerable value to correctionalofficers.
Behaviorally based internal classifications. Behavioral assessment for internalclassification remains popular and was chosen as a strategy by several prison sys-tems in this study (e.g., in Florida and New Jersey). In contrast to AIMS, behavioralassessments do not use psychometric measures or formal scaling instruments butrely on simple behavioral measures (e.g., disciplinary infractions, program andwork performance, in-custody behavioral interactions with staff or other inmates)already commonly used in prisons. These measures are highly relevant to managingand processing inmates In addition, some behavioral classification systems use sim-ple additive point systems to suggest changes in housing or program arrangements.
115
New Directions in Classification Factors and Information Content
Behavioral assessments, like reclassification procedures, typically focus on a unit oftime (e.g., the past 12 months) and thus are legitimately regarded as dynamic meas-ures of adjustment.
Common classification factors used in this approach include level and frequency ofaggression against staff or other inmates, seriousness of misconduct, days spent indisciplinary segregation, gang affiliations, and current program and work perform-ance. In some prisons, these factors are augmented with others, such as age and seri-ousness of current offense.
Megargee’s MMPI typology. This clinical system has been used as an internalclassification (although not in any of the prison systems that participated in thisstudy). It was originally introduced in 1977 to categorize offenders into 10 typesderived by cluster analysis of MMPI personality profiles. Megargee and Carbonell(1998) claimed that more than 100 separate evaluation studies had demonstratedthat this typology makes useful contributions to offender management and treatmentdecisions in federal, state, and local correctional organizations.
Much current effort is directed at refining this system. New developments include anew standardization based on the MMPI–2 and new rules for classifying offendersaccording to the 10 types. In addition, Megargee and colleagues are modifying thissystem for female offenders (Megargee and Carbonell, 1998). Their researchappears to confirm the same basic types as those in the initial development(Megargee and Bohn, 1979).
The 10 types have neutral names (e.g., Able, Baker, Charlie) to minimize bias asso-ciated with descriptive labeling. Able, for example, is impulsive, manipulative,charming, and often able to adjust well to institutional life. Baker is inadequate, anx-ious, and underachieving; lacks sociability; has authority conflicts; and so on. Treat-ment implications have been developed for each type (Megargee and Bohn, 1979).
Considerable controversy surrounds the performance and validity of this system.Different researchers report different levels of interrater reliability, and there isdoubt about whether some specific types (e.g., Baker, Delta, George) can be identi-fied reliably or even exist (Van Voorhis, 1994). Van Voorhis reviewed the degree towhich different types have been replicated by various studies. The conclusions aremixed, and only a few types seem to have been replicated unequivocally by otherresearchers. These studies also have not supported one another in their findingsregarding predictive validity; some found good predictive validity and others foundno significant results.
The problems of Megargee’s MMPI typology appear to originate in the initial clus-ter analytic procedures used to create the basic profiles. To create the typology,Megargee used Ward’s cluster analysis, which is known to artificially fragment pop-ulations into too many clusters. These artificial boundaries, by definition, are unre-liable and contingent on the sample being used. Second, the Ward procedure forestimating the true number of clusters (i.e., a graph of error levels in successive
116
Chapter 8
clustering solutions) is known to be inefficient (Brennan, 1980; Milligan, Soon, andSokol, 1983). The Ward clustering procedure used by Megargee has been supersed-ed by more advanced and effective methods (Gordon, 1999; Jain and Dubes, 1988).
Despite these controversies, the Megargee typology represents a profound advancein using powerful data classification algorithms on clinical personality data. It is oneof the few systems that is solidly based on modern classification technology andsound psychometric measurement. Its major deficiency may be the lack of internalexplanatory coherence within each type stemming from the possibility that the clin-ical personality dimensions are of limited relevance for building an explanatory ortreatment-relevant classification. Specifically, the typology’s basis in personalitymay miss other profound causal factors and factors that are linked specifically tocriminal behaviors (e.g., social learning, criminal cognitions and beliefs, criminalopportunities). The most profound deficit of the Megargee system is that its contentvalidity is too narrow and is focused on mental health rather than on criminalbehavior.
Classifications To Predict Violence and Dangerousness
The need for improved classification risk factors for predicting violence was a dom-inant theme in all the prisons examined in this study. For example, Washington isexperimenting with the Buss-Durkee Hostility Inventory, and others are experi-menting with AIMS to identify and classify violent prisoners. Nationwide, prisonofficials and policymakers are constantly seeking improved risk predictors for vio-lence and disciplinary problems. The traditional risk factors for predicting violencehave generally focused on prior criminal history of violence. Although these areclearly still useful, they are being augmented with other risk factors to improve pre-dictive accuracy and reduce classification errors. This section reviews some newdirections in identifying and classifying violent inmates and predicting theirbehavior.
Assessing and identifying the psychopath. Much recent assessment researchfocuses on prisoners characterized by psychopathy. This group appears responsiblefor a high percentage of violent crime and rule violations while incarcerated (Hare,1996; Rice, 1997). The development of classification tools to identify psychopathsis an area of considerable activity, and new practical approaches are emerging (Fish-bein, 2000). These kinds of data will inevitably enter into prison MIS databases.This category is likely to be extensive and hard to measure but critical in its impli-cations for crime control, institutional order, and public safety.
The basic personality dimensions underlying psychopathy (aside from criminalactivity) include impulsivity, risk taking and sensation seeking, manipulation anddeceitfulness, absence of guilt, a callous attitude toward victims, anger/quick tem-per, dominance, and an ability to charm others. Currently, the most widely usedassessment instrument is Hare’s PCL. This has been demonstrated to predict bothviolence and recidivism. Drawbacks include the time required for a full assessment(about 2 hours) and the advanced interviewing skills required.
117
New Directions in Classification Factors and Information Content

Briefer approaches to assessing these dimensions are also emerging. For example,several of the personality dimensions underlying psychopathy (e.g., impulsivity,sensation seeking, absence of guilt) can be measured by shorter paper-and-penciltests that may offer more efficient approaches for identifying selected personalityaspects of psychopathy (Bandura, 1996). For example, a factor analytic scale adapt-ed from Bandura’s dimensions, as used in the COMPAS system, found that thesemeasures were reliable and valid (Brennan and Oliver, 2000). Additionally, as notedearlier, the first factor of the AIMS behavioral checklist correlated significantly withHare’s PCL among Scottish prisoners (Cooke, 1998), suggesting that psychopathymay be identifiable using brief behavioral ratings. However, no final consensusexists in this area of assessment, and PCL apparently continues to be the dominantinstrument.
Physiological measures and psychopathy. Another direction in assessing psy-chopathy uses physiological measures (Fishbein, 2000; Raine, 1993). Excitingprogress is being made using physiological responses (e.g., skin conductance, heartrate changes in certain situations, stress levels, anxiety levels) that appear to differ-entiate psychopaths from other offenders (Raine, 1993). The psychopath tends toexperience less fear, anxiety, stress, and emotionality than others and evinces otherphysiological differences under certain test conditions. Fishbein (2000), in review-ing these approaches, argues that these approaches may have considerable diagnos-tic usefulness.
Additionally, some theories suggest that specific cognitive functions (e.g., decision-making, impulse control) mediate between underlying physiology and observablebehaviors. The key issues appear to involve cognitive functions linked to self-control. This supports the widespread assertion in the criminology literature that lowself-control forms the basis for a theory of criminal personality (Gottfredson andHirschi, 1990).
Other new approaches to assessing psychopathy focus on everyday cognitive func-tioning (e.g., daily planning, problem solving, daily functioning, the ability to beaware of and monitor social behavior, and control over emotional arousal [Royall,Manhurin, and Gray, 1992; Wilson 1997]). Fishbein (2000) suggested that thesetests are inexpensive, easy to administer, effective in identifying psychopathy, anduseful for guiding cognitive rehabilitation programs. Typically, these tests measurebehavioral performance in problem-solving situations, memory and planning abili-ty, and the ability to shift mental patterns in new situations.
The possible emergence of efficient and more valid tests for psychopathy has impor-tant implications for inmate housing decisions, surveillance decisions, treatmentplanning, and reducing violence and discipline problems. These tests also have thepotential to reduce or control violence and recidivism when prisoners are releasedto the community. A limitation is that many of these tests require more than 1 hourto complete. They also may require administration by highly skilled technicians,preferably psychologists, who may be unavailable or too costly in many correction-al contexts.
118
Chapter 8

119
New Directions in Classification Factors and Information Content
Classification for Reentry Into the Community
Several prison systems in this study were actively experimenting with classifica-tions for community reentry, case management, and rehabilitative arrangements.These purposes differ from those of internal and external classifications and requirean even broader coverage of both risk and needs factors, although they do overlapwith the earlier types of classification. Similar classification factors may be used forinternal and community reentry classifications. Washington, for example, has givencareful consideration to using LSI, AIMS, and CMC for better internal control aswell as reentry classifications.
The boundary between internal classification and reentry classification is blurredbecause they share a focus on treatment, interpersonal relations, social skills, per-sonality, risk of violence, and so on. They may also utilize overlapping risk andneeds factors (Hardyman et al., 2002; Van Voorhis, 1994). The systems described inthis section can be used for internal classification or reintegration purposes.
Several of these assessment systems are offered by private companies as proprietarysoftware, including LSI (Multi-Health, Inc.), the Jesness Inventory (Multi-Health,Inc.), COMPAS (Northpointe, Inc.), and the Millon Clinical Multiaxial Inventory(National Computer Systems, Inc.). Some of these systems are offered as stand-alone software packages in which a complete classification system is integrated intoan underlying MIS database (e.g., COMPAS); others are offered as automated test-ing services.
LSI. This is the most widely used instrument for reintegrating offenders into thecommunity. For example, it is routinely used by both Washington and ColoradoDOCs. In Washington, it is being evaluated both for use in internal classification andfor guiding case management and supervision plans for transition to community liv-ing (NIC, 2001). LSI was originally developed in Canada and implemented by theMinistry of Correctional Services in Ontario to assess the risk and needs of proba-tioners and parolees (Andrews and Bonta, 1994).
LSI consists of 54 items that assess recidivism risk and 10 subscales dealing withcriminal history, education/employment, financial problems, family/marital, accom-modation problems, leisure/recreation problems, peers, alcohol/drug problems,emotional/personal, and attitudes/orientation. Each item is scored as 0 or 1. The 54items are summed to provide an overall risk score. A semistructured interview for-mat is used to collect these data. On average, each interview requires a minimum of45 minutes and often more than 1 hour. The semistructured format requires consid-erable training to achieve acceptable consistency across raters. A substantial litera-ture exists on LSI, much of it using Canadian samples. Key issues regarding thisassessment tool are described below.
Reliability. The overall scale (54 items) achieves an acceptable internal reliability,producing α coefficients ranging from .70 to .80 across studies. Subscale reliabili-ties are less impressive. Some of these fall below .50 into an unacceptable range(Arens et al., 1996). Interrater reliability is of perhaps greater importance for LSI
and other instruments that rely on semistructured interviewing (which allows inter-viewers to judge more subjectively). Few studies have examined interrater reliabil-ity for LSI. One early study by Andrews (1982) reported interrater correlationcoefficients between .80 to .94. However, some researchers have expressed concernregarding the interrater reliability of LSI (O’Keefe, Klebe, and Hromas, 1998), andresearch is clearly needed on LSI with American samples.
Factorial validity. Factorial validity examines whether the rational or theoreticalstructure of a test’s scales is replicated when empirically tested, usually using fac-tor analytic procedures. Although LSI is presented as containing 10 specific scales,several factor analyses of the full set of LSI items have failed to replicate thesescales. For example, Arens et al. (1996), in a Colorado study, failed to replicate theexpected factor structure. In a subsequent study, O’Keefe, Klebe, and Hromas(1998, p.4) concluded that “there was no support for any underlying dimensions ofthe LSI. Three studies, involving five separate analyses, aimed at establishing theunderlying structure produced no concordance of findings.” Thus, the proposed the-oretical structure of LSI appears in doubt, and the factorial validity of its subscaleshas not been established.
Predictive validity. The predictive validity of LSI is generally assessed for the over-all scale instead of the specific subscales because of concerns about the reliabilityof the subscales (O’Keefe, Klebe, and Hromas, 1998). Studies by Canadianresearchers report impressive predictive validity for various samples and outcomebehaviors (Andrews and Robinson, 1984; Loza and Simourd, 1994). Yet, whenswitching to American samples, these impressive results have not always held up.For example, for Colorado offenders, LSI was not predictive of either program ter-mination status (r = .10), or institutional misconduct (r = .16) (Philbrick, Gati, andGuisti, 1993). O’Keefe, Klebe, and Hromas (1998) had similarly mixed results inpredictive studies of parole outcomes and community corrections offenders andcould only partially replicate the Canadian findings.
Buss-Perry Hostility and Aggression Scale. At the time of this study, Washingtonwas using the Buss-Perry Hostility and Aggression Scale as part of its communityplacement classification procedure. The scale assesses several dimensions of hostil-ity and aggression (e.g., verbal aggression, physical aggression, anger, and hostili-ty) (Buss and Perry, 1992). Several versions of the scale have been developed sinceits first appearance about 30 years ago. The most recent version, published in 1992as the Buss-Perry Aggression Questionnaire, is a refinement of the earlier version,which had 66 true/false items.
This scale aims to identify the aggressive, angry, and socially hostile inmate. It thuscan contribute both to internal classification and to assessments of the risk of vio-lence in a community placement. Unfortunately, little research on the predictivevalidity of this instrument in correctional settings has been reported.
120
Chapter 8
Reliability. The internal consistency reliability of the scale is satisfactory. The fourscales range from a low α of .72 to a high of .85. The total scale has an impressiveα of .89.
Validity. This scale has strong concurrent validity; that is, it correlates highly withimpulsivity, competitiveness, and assertion. Additionally, these hostility scales cor-relate significantly with the COMPAS violence scale in a study of jail prisoners(Brennan and Oliver, 2000), providing evidence of concurrent validity for bothinstruments.
COMPAS. This automated risk/needs instrument was designed for community re-entry decisions and case management planning. It assesses four risks (violence,recidivism, community failure, and flight) using logistic and ordinary least squaresregression models. It uses a broad range of social, psychological, and behavioralrisk factors to produce a detailed inmate profile. Additionally, it includes severalinternal validity tests to assess data integrity. An embedded-lie test identifies offend-ers who may be misrepresenting their responses. The instrument also includes a testof the coherence/incoherence of each prisoner’s data. Both of these validity tests usesignal-detection techniques to pinpoint data quality problems (Brennan and Oliver,2000).
COMPAS has been statistically validated in prisons, probation, jails, parole, andcommunity corrections. National norms have been developed. A user manualdescribes these design features and various reliability and validity studies (Brennanand Oliver, 2000).
Although superficially similar to LSI, COMPAS has a different focus, different pre-diction methodologies, different risk and needs factors, and four separate risk equa-tions rather than a single overall risk scale. Its comprehensive set of risk factorsappears to have both practical and theoretical relevance for community reentry. Itsrisk and needs factors include criminal involvement; history of violence, communi-ty failure, and noncompliance; criminal associates; substance abuse; residentialinstability; financial problems; criminality of family; criminal cognitions; criminalopportunity/lifestyle; residence in a high-crime area; vocational and educationalproblems; and others.
Jones (1995) argued that risk assessment systems in corrections should be guidedby current criminological theory and should include theoretically relevant risk fac-tors. COMPAS has adopted this strategy and includes several theoretically basedcriminogenic dimensions from several major theories of crime (e.g., social learning,criminal lifestyle and criminal careers, social control and criminal cognitions). Thisstrategy should increase its relevance for treatment interventions. These scalesinclude the following:
� Criminal opportunity, based on Sampson and Laub’s (1995) lifestyle theory ofcriminality and routine activities theory.
121
New Directions in Classification Factors and Information Content

� Socialization failure, based on Lykken’s (1995) theory of sociopathy.
� Criminal cognitions, based on Bandura’s (1996) theory of moraldisengagement.
Reliability. The COMPAS scales have high internal reliabilities, with Cronbach αaround .80 for the four main risk scales and .70 for most of the needs and back-ground scales. However, two of the needs scales have weak reliabilities and areundergoing further development. Test-retest reliability studies are in progress andthus have not yet been published.
Factorial validity. Data from several jurisdictions have shown that the factorialstructure of COMPAS conforms to expected theoretical structures. The factor analy-ses indicate that all scales are unidimensional, with significant factor loadings intheoretically expected directions (Brennan and Oliver, 2000).
Validity. Considerable evidence of concurrent, construct, and predictive validity hasaccumulated in more than 20 validation studies in different jurisdictions, includingjails, prisons, and parole departments, mostly in the United States. For example, theCOMPAS violence risk scale correlates significantly with the Buss-Durkee aggres-sion scales. A recent study of New York probationers found that the predictive valid-ity of the COMPAS recidivism scale (using a 12-month followup) reached highlysignificant levels (using signal detection and receiver operator characteristics [ROC]analysis), with an area under the curve (AUC) close to 0.80. This is comparable tothe results of Quinsey et al. (1998) in predicting recidivism with their time-consuming VRAG inventory (Brennan and Oliver, 2000).
A potential drawback to any comprehensive assessment is the time required to com-plete an interview, which typically averages 45–60 minutes. However, the COMPASsoftware allows an agency to select only those scales of high interest to the agency.This flexibility allows customization of the assessment to the assessment staff’stime available without losing validity of the key risk scales.
Weakness of Theory in Internal and ExternalClassification
A basic problem with the construction of databases for most current external andinternal classifications and most classifications for reentry is that they make almostno use of criminological theory. Correctional classification to date has been domi-nated by an atheoretical approach (Jones, 1995; Palmer, 1992). Bonta (1997) notesthat most existing risk assessment and classification methods are driven by blindempiricism; that is, the selection of classification factors is based on guesswork,conventional wisdom, or data-driven empirical correlation with selected behaviors(e.g., parole outcomes, recidivism). There is virtually no attempt using coherent ortheory-based explanations to justify the selection of classification factors.
122
Chapter 8
There is a limit to this atheoretical approach, and at some point, the need arises totranscend these classifications and incorporate coherent theoretical guidance inselecting effective classification factors to improve predictive power and guideinterventions. Bonta (1997) argued that most atheoretical classification systemsreach an upper limit of predictive validity with correlations around .30. Another pro-found disadvantage of systems with weak explanatory coherence is that they offerlittle guidance for interventions or treatment.
LSI, COMPAS, and the Jesness and Millon inventories are exceptions. Each usesexplicit theory. The first two use criminological theory, and the latter two rely onpsychological theory. As criminological theory evolves, criminal justice databaseswill probably become “smarter” by including more powerful explanatory factors.These systems will be able to purge irrelevant “noise.” This evolution should have aprofound impact on improving both the predictive power and intervention guidanceoffered by correctional classification systems.
Conclusion
Although there is movement toward more comprehensive classification systems andmore powerful predictive and explanatory factors, most prison systems have a longway to go in the search for optimal classification factors. In addition, the more pow-erful memories and fast search procedures of today’s computers and MISs willenhance the ability of classification procedures to use multiple factors and theincreased information content of emerging classification routines. This increasedtechnical capacity should promote the discovery and use of more powerful classifi-cation factors.
The examination of numerous classification factors in current prison systems sug-gests that prison classification is in an exploratory phase of searching for more com-prehensive and effective classification factors. This contrasts with almost twodecades of simplistic and reductionistic classifications that relied on a severely lim-ited or restricted selection of factors (MacKenzie, 1988; Palmer, 1992). Correctionsmay be at the threshold of considerable development in the discovery of more effec-tive prison classifications. The convergence of richer and more informative data-bases, coupled with a great rise in the analytical power of computer systems, shouldaccelerate the design of effective prison classifications.
123
New Directions in Classification Factors and Information Content

Advances in Analytical Capacitiesof IT To Strengthen PrisonClassification
Introduction
This chapter examines technical innovations in the analytical capacities of IT thatmay have profound implications for developing more effective prison classifica-tions. In terms of the productivity framework offered in chapter 2, this chapterfocuses on the effectiveness (validity, quality, and utility) of classification. The ana-lytic capacity of an MIS is a major factor in supporting the quality and power of aclassification. However, IT is an enormous field, with recent developments in artifi-cial intelligence, data mining, pattern recognition, and several other statistical tech-niques that have great relevance to classification and decisionmaking.
Prison managers do not have to be statisticians or software experts to make use ofthese emerging technologies. In fact, many of these techniques are more intuitivethan conventional statistical procedures and offer exciting possibilities for improve-ment by using prison databases to achieve higher quality and more valid classifica-tions. The days of simplistic linear additive systems that have dominated currentprison classification techniques may soon be relegated to history as profoundlymore powerful classification techniques become available.
It is beyond the scope of this chapter to review all of the newly emerging technolo-gies that may contribute to prison classification. Only a few of these were beingexplored in the prison systems examined in this study. This chapter narrows thefocus to developments with the highest relevance to prison classification and adoptsa user perspective in discussing new analytical technologies. Specifically, this chap-ter is written not for statisticians, computer programmers, or hardware specialistsbut for the correctional managers who wish to understand the options, directions,and policy strategies offered by these new technologies. This chapter avoids statis-tical and computer jargon but describes how these new techniques can help correc-tional agencies to reach more valid classification decisions.
Some of the new analytical tools that are addressed in this chapter had already beenexamined or even implemented in the prison systems studied in this project. For
nineChapter
125
example, the following tools were actively under development in the identifiedprison MISs:
� Data warehouses (comprehensive, integrated MIS databases).
� OLAP.
� Artificial intelligence and expert systems for new classification systems.
� Data-mining technologies.
These technologies were mentioned in the South Carolina prison MIS plans forshifting from “Old World” to “New World” data architectures and for introducingmore advanced analytical technologies. Other prisons (e.g., in Colorado, South Car-olina, and Washington) were introducing data warehouses, OLAP, and advanced ornext-generation applications in their MIS planning processes.
Data Warehouses: Integrated Databases
The data warehouse is an innovation of the 1990s with strong implications for theway data are organized to support classification and other complex decision-supportfunctions. The fundamental purpose of the data warehouse is to provide data that arecomprehensive, clean, reliable, and relevant to the decision task at hand. The datashould be verified for the following characteristics:
� Correctness (high likelihood of being true).
� Consistency and reliability (i.e., there is only one version of each data element).
� Relevancy (the selected data elements pertain to management problems anddecisions).
Additionally, the data warehouse software concept typically links the database topowerful but easy-to-use state-of-the-art data analytic tools for OLAP, data mining,and producing management reports efficiently.
Importance of the Data Warehouse for Classification
The data warehouse may profoundly strengthen classification by greatly improvingthe basic data on which classification procedures are based. It provides more com-prehensive coverage of key risk factors and related classification variables at ahigher level of integrity than an ordinary MIS. Integrated data from jail, court, andprosecutors results in more complete classification profiles. Additionally, the verifi-cation and validation procedures of the data warehouse should produce data that aremore accurate and reliable, which in turn should improve the quality of any classi-fication based on the data.
126
Chapter 9

Evolution of the Data Warehouse
In the 1970s, the name Decision Support System (DSS) described knowledge-basedsoftware systems that supported upper management decisionmaking and operationsmonitoring. DSSs attempted to integrate easy-to-use but powerful analytical toolswith an integrated correctional database to address management and policy prob-lems. Report-generation software was included in these systems in the hope thatprison managers would produce and design their own statistical managementreports. It was assumed that the analytical procedures were simple enough thatprison managers and administrators could use these systems with minimal depend-ence on data processing specialists. This concept, however, was perhaps overly opti-mistic: middle managers in many correctional systems had difficulty using thesesystems. Factors included inadequate time, sophistication, and technical skills toachieve good or useful results. Typical complaints were that the software was diffi-cult to use and that the canned reports were inadequate.
As a result of these failures, newer data management and analytical software calledExecutive Information Systems (EISs) emerged. These further simplified the com-putational and analytical procedures compared with the earlier DSS procedures.Again, a key assumption was that this approach would encourage correctionaladministrators to develop sufficient competence to analyze prison data to monitor,predict, forecast, and produce management reports. However, problems emergedbecause of the inadequate relevance or breadth of the available databases. Althoughthe analytical software was becoming more useful, the databases often did not con-tain the full range of data needed for organizational processes and units. The datawarehouse concept emerged as an attempt to improve the coverage of data elementscompared with that offered by DSS technologies.
The following considerations are relevant to the content of a comprehensive data-base in the data warehouse concept:
� Operational data versus policy-relevant data: Current operational data, includ-ing classification data, are often inadequate for managerial and policy analysispurposes because the data cannot easily capture the major trends in a prisonpopulation or address certain kinds of managerial queries. To offset this inade-quacy, many of the data elements entering the data warehouse are transformedand summarized so that complex queries can be handled more readily.
� Time horizon of data: In the traditional environment of a transactional process-ing system (TPS), many classification decisions are made online; therefore, datahave to be accurate at the moment when a decision is being made. However, adata warehouse has a longer time horizon, typically 5–10 years. OperationalTPS databases typically cover less time, and cases are often purged when a pris-oner leaves the system. The longer time horizon of the data warehouse allowsmore insightful analysis of population changes, forecasts, and trends; statisticalsimulations of the impact of new classifications; and so on.
127
Advances in Analytical Capacities of IT To Strengthen Prison Classification
� Nonvolatile data: Typically, traditional TPS databases recurrently incur numer-ous data updates (e.g., of classification levels, legal status, disciplinary history).In contrast, data warehouse data are typically stable and often organized acrosstime periods. The data warehouse allows for an aging process in which olderdata are aggregated into statistical breakdowns. Transformations are oftenimposed on current operational data to create summary classification statisticsfor specific time periods (e.g., weekly disciplinary averages, average daily pop-ulations over time). Summary statistics are often missing from TPS operationaldata.
� Flow of data from operations to the data warehouse: Typically, data flow fromthe operational prison MIS through a cleaning and validation process beforethey are entered in a data warehouse. Validation is critical because a major func-tion of the data warehouse is to support policy decisionmaking and planning.
� Costs of building a data warehouse: Data warehouses are extremely expensive,often in the range of several million dollars. Their development may extend overseveral years, with a focus on the integration of criminal histories, jail data,court and prosecutor data, and so forth, and may involve both prison program-ming staff and outside consultants.
OLAP
The importance of OLAP for classification is that it allows many kinds of dataanalysis procedures to be used to monitor the process and quality of classificationand its impacts without the risk of data overload. Overload is prevented by the sta-tistical aggregation of data using cross-tabulations, trends, and graphical displays innumerous report formats.
At the time of this study, several states (e.g., Colorado, South Carolina) were intro-ducing OLAP technology to upgrade the MIS analytical capacity of their currentprison systems, typically in the context of data warehouses because the two gener-ally go together. OLAP enables correctional managers to access overall institution-al data using flexible, simplified, but powerful analysis and reporting techniques.For example, a prison manager may want to examine admission trends for the pre-vious 36 months across several modes of inmate entry and compare these trends byoffense category and external classification levels. The manager can drill down intoeach mode of inmate entry using a series of sequential cross-tabulations to examinethe percentage breakdowns by custody classification, gang membership, and so on.Findings can be organized as time-series charts or monthly bar charts.
Data analytical tools should facilitate timely data-driven decisions regarding variouspolicy and planning issues. The OLAP approach aims to provide easy-to-use yetpowerful statistical, graphics, and report-generation software. Prison databases mustoften be analyzed in multiple dimensions or user-designated “slices” of time. Otherbreakdowns may include population analyses by custody classification, ethnic
128
Chapter 9

129
Advances in Analytical Capacities of IT To Strengthen Prison Classification
group, prison module or building, or specific program. In almost all analytical exer-cises, raw data (usually on prisoners) are aggregated into selected categories that arethen compared using statistical tests of significance or examined for trends acrosstime.
OLAP tools generally are organized into separate modules for data exploration, cal-culated fields, forecasting, graphics, and reports. They may also include libraries ofcanned management reports that enable managers to rapidly review preselectedreports and data fields. OLAP tools are designed to provide prison managers with asuite of statistical analyses and graphical reporting procedures and enable the designof new reports that may be added to a cumulative report library. As noted previous-ly, some dependency on database administrators to simplify the user front-end soft-ware or to design particularly complex reports may always remain. A databaseprofessional may be needed to format the underlying database, create names forvariables that are more intuitive and understandable to users, and provide the front-end user with a ready-to-use tool. Thus, database staff may remain indispensable.
Statistical analysis is facilitated by selecting a preestablished analytical model (e.g.,cross-tabulations or forecasting) and then dragging and dropping the desired vari-ables into icons that represent the dependent and independent variables. For exam-ple, gender, age, and custody classification may be dragged and dropped into therows and columns of a cross-tabulation table or bar graph. Sequential drilling down,or “slicing and dicing” the population data using sequential cross-tabulation, is asimilar process. OLAP technology increasingly provides various graphing formats(e.g., pie charts, bar charts, scatter plots, trend lines, multidimensional plots).
At the time of this study, few correctional agencies were using OLAP. There appearsto be much variation in the degree to which more advanced analytical procedureshave been implemented to support administrative and managerial functions.
Major Categories of OLAP Tools
At the high end of the OLAP spectrum are fully developed, multidimensional data-base servers with user-friendly front ends that are seamlessly integrated with pow-erful statistical packages, graphics procedures, and spreadsheet and reportproduction software. These include tools for various analyses that may be requiredby prison administrators (e.g., means and percentages, cross-classifications, drill-down procedures for multiple cross-tabulations, trend graphs and forecasting tech-niques, and a full range of graphics procedures). Data processing staff may berequired to design and program the database to provide the particular views of thedata and management reports desired by the end user. These expensive systems aresupported by several large commercial vendors (e.g., Oracle, Sybase, Informix) andare generally found only in the private sector.
A second category of OLAP tools is sometimes called Relational OLAP (orROLAP). ROLAP stores institutional data in a conventional relational database.MIS staff create a metadata layer between the underlying database and a front-end
analytical tool to separate the end user from the full complexities of the underlyingdatabase. The front-end tool and the simplified metalayer enable prison managers towork more easily with the underlying database to conduct statistical queries, pro-duce graphical reports, and so forth.
A third category of OLAP is the rapidly evolving PC-based desktop software withintegrated data analysis and reporting functionalities that can work in parallel withquery and management reporting tools. Commercial vendors offering this softwareinclude Business Objects, Cognos, and Powerplay. This appears to be the categoryof choice of the Colorado MIS staff, who were experimenting with Business Objectsat the time of the site visit. This represents the ongoing and rapid evolution of querytools; software for data access, multidimensional analysis, statistical, and graphicalprocedures; and reporting capacities. This OLAP category avoids the need for acostly multidimensional server and special programming of a complex metadatalayer yet still provides a user-friendly environment for complex analyses andreporting.
Effectiveness of OLAP and EIS Procedures
A critical question in all decision-support approaches is whether prison managerscan make effective use of these systems. The complexity of data and analysesrequired by prison managers has increased greatly. The political, social, legal, andinternal management environments of prison organizations have all expanded sothat the databases that support them must provide a great variety of and complexityin data support.
Delays, weak implementation, and frequently the ambivalence of prison adminis-trators suggest either a potential lack of enthusiasm or a lack of the basic skills need-ed to use these technologies. Most prisons have not fully installed OLAP proceduresfor decision support at either the administrative or the managerial levels. Further-more, those who have started this process have had only limited success in diffus-ing the technology across middle-management levels. Yet, the potential payoffs aresignificant, and this approach may likely represent a long-term trend in the emerg-ing uses of data in prisons.
Automated Error Analysis: Quality Control ofClassification Decisions
Another technical development that could provide a considerable advantage toprison classification is the analysis of error patterns in classification and otherprison data using state-of-the-art statistical error analysis procedures. These proce-dures, although technically available, were not being used in any of the prisonsexamined. Analysis of error patterns uses several coefficients to measure the accu-racy of classification decisions and of the underlying risk and needs data that areused to reach these decisions. Systematic monitoring of errors could provide a pow-erful motivation for the further improvement of prison classification procedures andmight help managers improve overall unit performance. 130
Chapter 9
Discussions of recent advancements in error analysis and validation technologyusing SDT and ROC analysis have started appearing in the criminology literature(Brennan and Harvey, 2000; Mossman, 1994; Quinsey et al., 1998; Rice, 1997).This technology has been described as the best and most sophisticated approach toanalyzing the validity and quality of human judgment for classification decisions(Hammond, 1996). SDT offers accurate and unambiguous information with whichto monitor the performance and accuracy of classification operations and decisions.Most of the raw data needed to conduct SDT are already routinely contained inmost prison MISs; adding other data elements to the organizational database isunnecessary.
Although widely used in other professions (e.g., medicine, meteorology), SDT isunderutilized in criminal justice and only recently has started being incorporatedinto correctional classification (see Brennan and Harvey, 2000; Quinsey et al.,1998). SDT technology is used to meet classification and diagnostic challengeswhere high-quality decisions are required and errors are critical (e.g., detection ofcancer, diagnostic classifications for AIDS, x-ray diagnoses, sonar detection, weath-er forecasting).
Measuring Error and Predictive Accuracy of Prison Classification
Systems
A starting point for all quality control in classification, including SDT, is the meas-urement of error. Most prison risk classifications that have a predictive purpose rou-tinely classify offenders into high- or low-risk categories. The proportion ofprisoners placed into the high-risk category is often called the selection ratio. Typi-cally, over a selected time interval, recording sufficient behavioral outcome data todetermine whether the prediction was justified is possible.
In custody classification, the outcome is typically inmate adjustment or behavioralproblems. In community placement, the outcome is typically behavioral perform-ance in the community (e.g., rearrest, program performance). Most prisons collectvarious outcome data on offender behavioral infractions, program performance, andso on. These data are used as input in SDT methods. According to Hammond(1996), classification decision outcomes generally fall into one of four groups:
1. Correct hits/true positives: The violent or high-risk offender is correctly identi-fied and subsequent behavior confirms the classification.
2. Misses/false negatives: The violent or high-risk offender is misclassified as lowrisk and is therefore missed. This error is dangerous to a prison and the inmateswho are housed with the person who was misclassified as low risk.
3. Correct low risks/true negatives: The low-risk offender is correctly classified aslow risk.
4. False alarms/false positives: The low-risk offender is falsely classified as highrisk. This appears to be the most common kind of misclassification in correc-tional decisionmaking.
131
Advances in Analytical Capacities of IT To Strengthen Prison Classification

Accurate records of each inmate’s behavior enable a prison MIS to compute the rateof these classificatory outcomes. SDT, however, can produce additional measures ofquality that are extremely useful. A complete assessment of classification qualitymay require several indices of predictive accuracy and error. Some of the more tra-ditional indices for assessing the quality of classification include the following:
1. Sensitivity: Sensitivity, a synonym for hit rate, indicates the percentage of high-risk offenders who are correctly identified. This index indicates the reliability ofthe classification procedures for identifying the high-risk offender.
2. False alarm rate: This is the proportion of low-risk offenders who are incor-rectly classified as violent or high risk. The false alarm rate is a very importantmeasure of the degree to which the classification is unfair or inaccurate or thedegree to which a classification system is overrestrictive (and hence wasteful ofprison resources).
3. Specificity: This index is defined as the false alarm rate subtracted from 1.Specificity may be intuitively understood as a measure of accuracy for identi-fying true low-risk offenders. For example, a classification system may be quitegood at identifying the high-risk offender yet very poor at correctly identifyingthe low-risk offender. Thus, both sensitivity and specificity are typicallyrequired to have a good understanding of the true performance of a classifica-tion system.
4. Positive predictive value: This is the probability that an offender classified ashigh risk is truly high risk. In essence, positive predictive value is a measure ofthe “believability” of a classification procedure, or the degree to which it can betrusted when it classifies an offender as high risk.
Many other numerical indices are available to assess various aspects of the qualityand validity of a classification system (Caulkins et al., 1996). However, all of thesemeasures are to some degree dependent on, or influenced by, the base rate of thebehavior being predicted and the selection ratio of the instrument. The value of SDTis that in addition to producing the above coefficients, it can also assess the accura-cy of a classification system without relying on the base rates and selection ratios.Its major coefficient, AUC, varies between 0.0 and 1.0, with 0.50 indicating randomaccuracy and 1.0 indicating perfect accuracy. The best accuracies being achieved inthe correctional field are about 0.80 (Quinsey et al., 1998).
Using SDT To Establish Classification Decision Thresholds
Aside from providing improved measures of classification quality and accuracy,another key contribution of SDT is that it can be used to set decision thresholds forpredictive classification instruments. Prison administrators and planners can there-by set accuracy levels for specific kinds of classification goals (e.g., a specific“believability,” accuracy level, probability of detecting high risks to public safety, orfalse-positive error rate). SDT can assist administrators in discerning the tradeoffsamong different kinds of errors.
132
Chapter 9

This use of SDT has not yet been implemented in criminal justice agencies. How-ever, this technology has much to offer the criminal justice policymaker, and it maybe just a matter of time before these practices are implemented (see Brennan andHarvey 2000; Harvey et al., 1992).
Data Mining and Advanced Technologies
In the past decade, the field of data mining has grown enormously in the private sec-tor. This technique offers many advanced exploratory statistical classification tech-niques that can aid the prison administrator or planner. Data-mining procedures canbe incorporated into prison classification procedures because many of them arefocused explicitly on classification and prediction. This section reviews some spe-cific data-mining techniques that are highly relevant to classification.
The increased use of data-mining techniques emerged in parallel with that of thedata warehouse. The motivation was clearly that these large multidimensional data-bases required more powerful exploratory statistical techniques to realize fully thevalue of the warehouse.
Beyond Averages
Population averages, means, and percentages are traditionally provided as the firststep in and the basis for producing most statistical management reports. However,most managers need to dig deeper than these averages and discover more importantpredictive relationships and patterns that are often hidden behind averages. Forexample, the most violent or disruptive inmates are far different from the “average”offender and do not exhibit “average” behaviors.
Data-mining and artificial intelligence (AI) procedures are of great importance inthe search for nonaverage patterns, relationships, and important offender subgroups.Many pattern-seeking exploratory and predictive models have been incorporatedinto data-mining software, which is appearing as front-end packages attached todata warehouses. Many of these techniques are highly effective for developingadvanced multidimensional classifications and may augur significant advances inprison classification.
Automated Querying Using Data-Mining Techniques
In conventional statistical and management analysis, the analyst can create queriesby which to discover information contained in the database. The prison managermay personally direct the search for new patterns. In contrast, data mining and AIoffer smart programs that automatically search the database to find patterns that canbe used in building classifications or predictions. The formulation of queries can bedifficult when using a large multidimensional database. Each offender is describedby a bewildering array of criminal history, demographic, social history, personality,and risk/needs variables. In a conventional OLAP, the prison manager must createqueries to explore these complex data. In contrast, the data-mining approach
133
Advances in Analytical Capacities of IT To Strengthen Prison Classification
includes sophisticated techniques that explore data independently to discover pat-terns linked to a general query (e.g., Why has contraband increased in this prisonduring the past 6 months? or What kinds of prisoners are most and least disruptive?).
Flanagan (1983) used a data-mining technique (predictive attribute analysis) toexamine the kinds of prisoners who exhibit high or low rates of disciplinary prob-lems. He produced a predictive tree that illustrated this exploratory process in whichseveral subclasses of prisoners were associated with very high or very low rates ofdisciplinary infractions. For example, his predictive classification found that themost disruptive class of inmates had a pattern of being under age 25, being chargedwith nonhomicide offenses, and having a history of drug problems. In contrast, thebest-behaved inmates were older than 25, had no drug problems, and had beencharged with a homicide. Conventional cross-classifications would have requiredinnumerable search and query procedures to identify these patterns.
Predictive attribute analysis was a very early tree analysis procedure. The rate ofdevelopment of data-mining procedures is so fast that this procedure is now obso-lete and has been replaced by more powerful decision-tree procedures. Monahan etal. (2001) offer a useful recent review of more contemporary methods for statisticaltrees.
Knowledge Discovery: Hidden Subcategories and Patterns in
the Data Warehouse
The data warehouse stores vast amounts of information and thus may hide impor-tant offender profiles that may be relevant to offender classification. Data-miningand analytical procedures allow underlying patterns to be identified, extricated, andexamined for their classification implications. Once these patterns are discerned andclarified, the manager’s goal is to transform them into reliable and productive busi-ness or policy rules. The search for underlying data structures is sometimes calledknowledge discovery.
A basic assumption of the data-mining movement is that much information is hid-den in the vast data warehouses and that this information can contribute to theunderstanding of complex relationships between offenders, their characteristics,institutional processing, treatments, and outcomes. The huge relational databases inmost prisons are therefore seen as ripe targets for exploratory data analytical toolsand data-mining procedures. The analyst searches for “nuggets” of critical relation-ships and patterns that remain hidden in the “rows” and “columns” of these data-bases. Flanagan’s (1983) study of patterns linked to prison disciplinary problems isa good example of this search. These patterns consist of complex multivariate inter-actions, underlying trends, and hidden types of offenders on which predictions, clas-sifications, and policy decisions can be based.
Major Data-Mining-Analysis Goals
This section examines several basic data-mining purposes that may help in classifi-cation development.
134
Chapter 9
Discovery procedures—generating underlying or hidden classifications. Dis-covery techniques can be applied to a prison database to find underlying offenderclasses or target groups that may be relevant to special treatment or processing. Theuser does not necessarily start with a predetermined hypothesis regarding specificpatterns or classification structures that may emerge. An example of this approachused in a prison was offered by Quinsey et al. (1998) in using clustering techniquesto discover eight types of prisoner need profiles in a large sample of prisoners. Forexample, their fourth pattern, which accounted for 11 percent of the prison popula-tion, had high scores for violence recidivism, aggression, and institutional manage-ment problems. The analysis yielded a recommendation for maximum perimeterarrangements and high internal security for this type. The researchers concludedthat the great heterogeneity of their prison population could be clarified by cluster-ing techniques.
Predictive modeling for predictive purposes. Other new data-mining techniquescan be used for predictive classifications of offenders. In these techniques, prior pat-terns are identified and then used to estimate the risk of some future behavior (e.g.,recidivism, parole failure). This introduces the distinction between independentvariables (predictors) and dependent variables (outcomes) and also requires tech-niques such as signal detection to evaluate predictive accuracy. A vast number ofinnovative techniques are available in contemporary data-mining and statisticalpackages; describing them is beyond the scope of this report. However, illustrativeuses of neural networks, logistic regressions, predictive decision trees, survivalanalysis, clustering, and so on, can be found in numerous publications (see Brennanand Oliver, 2000; Caulkins et al., 1996; Clear, 1988; Jones, 1995; Quinsey et al.,1998; Rice, 1997).
Discovery of unusual, exceptional, or anomalous cases. An interesting use of pat-tern analytic methods is to discover subclasses of offenders that do not fit into anygeneral pattern. These are the rare, unusual, or anomalous offenders who mayrequire special attention. Brennan and Oliver (2000), illustrating this analysis, dis-covered that a small set of anomalous cases in a population of New York probation-ers was characterized by high levels of lying. This hidden class was discoveredindependently by both K-means pattern recognition and by the lie test (i.e., theseoffenders had high scores on the lie test of the COMPAS system).
Automated pattern matching to classify offenders. Automated assignment tech-niques for matching new offenders to an existing classification system are a class ofnumerical techniques with great importance for classification. Megargee and Bohn(1979) illustrated the need for these computational systems. Computers can retainin memory the basic features of any multidimensional classification of offenders.When an offender must be classified, these procedures automatically compare theprisoner with preexisting classes and assign (or match) the offender to the closestclass. The “nearest neighbor” method has often been used for this task, althoughgreater accuracy is achieved by the K-nearest neighbor, which simply matches thenew case to a larger number of current, typical members of each of the preexistingclasses (Brennan and Camilli, 1982).
135
Advances in Analytical Capacities of IT To Strengthen Prison Classification
Knowledge-Discovery and Data-Mining Tools
Many knowledge-discovery and data-mining tools have emerged in the last decade.These include conventional multivariate procedures such as factor and principalcomponents analysis and multiple and stepwise regression methods. In addition tothese traditional procedures, many AI and data-mining procedures have becomeavailable. These include expert systems, pattern recognition, several families ofclustering techniques, inductive decision trees, and neural networks.
Data-mining tools are offered by most of the major database vendors. For example,Oracle has acquired Thinking Machines, which is one of the more advanced data-mining software companies. Oracle intends to use these procedures to extend itsdata warehouse platforms to improve the ad hoc query process using advanced data-mining software within a common Internet platform. Thinking Machines’ data-mining procedure, called Darwin, combines neural networks, predictive decisiontrees, and case-based reasoning and is optimized for analysis of massive volumes ofindividual transaction and demographic data that typically occur in a large prisoncontext.
Software Selection Challenge
In the future, prison MIS/IT managers will have the task of choosing among themany vendors and specific technologies for data-mining and AI software products.Because these procedures are much more complex than simple query and cross-tabulation, this can be a difficult decision. Yet, only a few fundamental data explo-ration and verification procedures form the basis of these software packages. Thissection reviews some major classes and uses of these methods pertaining toclassification.
Neural networks for prediction and classification. Neural networks can be usedfor prediction, for building classification systems, and for identifying and classify-ing new inmates. Across several disciplines, these procedures have demonstratedpowerful predictive classification abilities, such as predicting bankruptcy, detectinginsurance fraud, diagnosing medical conditions, and predicting bond ratings. Neur-al networks often outperform conventional linear models.
Yet, neural networks have rarely been used for criminal justice classification pur-poses. Caulkins et al. (1996) reported an exception in the use of a neural network topredict criminal recidivism in a sample of released federal prisoners. However, acomparison of the neural network with standard linear models revealed no predic-tive advantage for the new procedure. Caulkins concluded that this failure was dueto inadequate data and not to any intrinsic failure of the neural network. An impor-tant lesson from this result is that statistical methods by themselves cannot over-come the limitations of poor data and low validity.
Thus, a limit on predictive accuracy will always exist because of data limitations,irrespective of the statistical procedure. However, Brennan and Harvey (2000) used
136
Chapter 9

signal-detection methods in a reanalysis of the Caulkins et al. (1996) data and con-firmed that the neural network had a slight but consistent predictive advantage overlinear additive models. The strength of neural network models is their ability todetect and incorporate complex relationships between predictor variables, includingnonlinearities, interactions, and type effects. In essence, neural networks extractmore information from the data than conventional linear additive techniques.
Clustering and pattern recognition as a basis for classification. Many clusteringand pattern recognition methods are available and are included as standardapproaches in most data-mining software (Brennan, 1993; Han and Kamber, 2001).Clustering and pattern recognition are used in creating classification systems. Theyare designed to identify patterns and regularities within a database and provide thefoundation for empirical classifications. They are ideal for exploring large multidi-mensional databases in the search for type patterns.
Applications for prison use are rare, but several examples have entered into practice.Quinsey et al. (1998), for example, used a clustering procedure to develop a classi-fication system for violent prisoners based on risk and needs patterns. Brennan andOliver (2000) used both hierarchical clustering and K-means clustering to developa behavioral classification of prisoners for the COMPAS system using criminal his-tories of a large sample of New York offenders. Megargee and Bohn’s (1979) MMPIclassification system was built using Ward’s hierarchical clustering procedure andhas been widely used as an internal classification system (see chapter 8).
Inductive decision trees. In criminal justice, there is a long history of using induc-tive or statistics-based decision trees for predictive classifications (Gottfredson andGottfredson, 1980, 1985; Simon, 1972; Wilkins and MacNaughton-Smith, 1964).However, these existing applications mainly used early and relatively ineffectivetree-building procedures (e.g., predictive attribute analysis, association analysis, andothers). Consequently, they did not perform well, and the tree procedures haverarely been used as newer technologies have come into play. An exception is aninteresting classification system developed by Monahan et al. (2001), which used adecision tree to predict violence.
A new generation of powerful inductive decision-tree procedures has emerged in thepast decade, including CART (Salford Systems), CHAID (SPSS), and others. Theseare only beginning to be exploited in correctional classification systems. However,they have a high potential for developing predictive classifications and are widelyused in the private sector for this purpose. The advantage of the more recentdecision-tree procedures is that they can help identify the most important predictiverisk factors among the hundreds of basically irrelevant variables that may exist in adata warehouse. In addition, this decision-tree approach can identify complex inter-actions among predictive variables.
137
Advances in Analytical Capacities of IT To Strengthen Prison Classification

Conclusion
Collectively, several innovations have the potential to improve the quality and per-formance of prison classification systems dramatically. These improvements are inseveral broad areas: data quality, statistical techniques for building classifications,quality control monitoring, and management reporting capabilities. Virtually all ofthese improvements are heavily dependent on large computer memories, fast com-putation, and more sophisticated software.
Larger, more comprehensive databases alone may ensure that more of the key dataelements for valid classification are available in a verified, accurate, and timelymanner. This improvement in comprehensive databases will interact with the secondgeneral trend, that is, the emergence of more powerful statistical, AI, and othernumerical techniques for building classification systems. These classification meth-ods can be linked to the specific purposes of prison managers (e.g., predictingrecidivism and the risk of rule infractions). No consensus exists regarding which ofthe various exploratory data techniques (e.g., clustering, neural networks) willemerge as the most useful or how much of an improvement they are over standardlinear techniques, given current data limitations. Apparently, all of these methodshave the potential to help build more informative and valid offender classificationsystems.
Additionally, computerized techniques such as SDT that provide feedback on thequality of prison classification systems may alert prison managers and others inthe criminal justice system to various ways to improve the quality of offenderclassifications.
All of these techniques, however, require training and competence building amongprison managers and administrators. Many of these techniques, although highlymathematical, do not require that the prison manager or user be trained in statisticalor mathematical procedures. Experience from the business community suggests thatthese methods can be understood intuitively and used effectively to solve real-worldproblems without a thorough understanding of the underlying mathematics. Thecorrectional expertise of the prison manager thus will remain paramount and willdrive queries and determine how these new techniques will be used to solve correc-tional problems. Implementation problems (competence, acceptance, training), nottechnical problems, may determine the ultimate contribution of these new analyti-cal methods.
138
Chapter 9

Implementing New Technology andManaging Change
Introduction
The prison administrators and managers encountered during interviews for thisstudy were profoundly aware that IT had become fundamental to success in today’scorrectional environment. Prison databases and IT software were clearly seen ascrucial resources for case-specific decisionmaking as well as for institutionwideplanning, policy analysis, and results measurement. Managers in each prison visit-ed for the study were concerned with upgrading procedures to collect, organize,retrieve, and exploit their growing databases. They were also highly aware of theneed for selective access to and communication of this information across the insti-tution. Interviews revealed professional motivation to introduce changes to applythis knowledge base efficiently, cost effectively, and skillfully at all organizationallevels.
This chapter examines lessons learned regarding the procedures, politics, and plan-ning of change in MIS and classification procedures. As noted elsewhere, MIS andclassification evolve in parallel. More powerful MIS and computational capacitiesfacilitate more advanced classification, and advances in classification methods andtheory impose new demands on the MIS. Advances in one area prompt changes andadvances in the other.
Widespread Innovation:Transitioning to the NewWorld
The findings of this study support those of the NIC (1999) survey that most stateDOCs are deeply engaged in a broad range of technical improvements. This sectionenumerates the main changes that were observed being implemented in the linkeddomains of MISs and classification.
New World of Data Architecture
At the time of this study, the South Carolina prison system best exemplified manyof the changes occurring among prison MISs. However, some broad aspects of theshift from Old to New World data architectures were evident in many of the systemsstudied:
tenChapter
139
� Introduction of the data warehouse concept: Several prisons were engaged inthe development of comprehensive, integrated databases, often involving thedata warehouse concept (e.g., in Washington, South Carolina, and Colorado).
� Use of OLAP software in conjunction with a data warehouse: Some prison sys-tems were upgrading their analytical and reporting capacity with commercialanalysis and report-generation software packages (e.g., Colorado’s had selectedBusiness Objects as an OLAP vehicle to improve data analytical capacities andproduce statistical reports).
� Use of expert systems and AI for classification: Few of the prison systemsexamined had actually introduced AI procedures for data analysis and classifi-cation support at the time of the study (e.g., South Carolina’s use of an expertsystem shell in the context of an OLAP development).
� Application of next-generation statistical analysis applications: Various power-ful analytical techniques have become available in the last few years for fore-casting, data mining, simulating, and other activities that are highly relevant toprison management, classification, and policy analyses. These techniques canbuild new classifications and help to evaluate and monitor quality and errorlevels.
Specific Agendas for Change
In addition to the broad directions described above, the following specific goals andagendas were noted among state DOC MISs. These techniques were being used toupgrade the effectiveness and efficiency of classification procedures.
� New classification systems for community reentry: New classification and riskassessment techniques were being explored in several prisons (e.g., in Colorado,Washington, New Jersey). The transition of prisoners to community settings,early release, and work release are high-stakes classification decisions with seri-ous implications for public safety, surveillance, case management, and treat-ment planning. Reentry decisions rely on far more comprehensive informationthan that offered by most external or internal classification systems. The avail-able classification instruments that focus on these more comprehensiveapproaches include LSI and COMPAS (Brennan and Oliver, 2000).
� Classifications for women inmates: Because of concerns about the validity ofcurrent risk classifications for female offenders, some prison systems (e.g., inColorado) were exploring separate classification systems for women. Thisinvolves several legal, criminological, psychological, and treatment issues thathave not yet been resolved and represent difficult implementation challenges(Brennan, 2000; Brennan and Austin, 1997; Zaplin, 1998).
� New and automated internal classifications: Internal classifications are still notwidely implemented in state prisons; however, many prison systems are inter-ested in developing classification methods for internal decisions. Several of the
140
Chapter 10

prisons in this study had already designed, tested, and implemented new inter-nal classification systems (NIC, 2001). Some prison systems (e.g., in Colorado,Oregon) were automating more aspects of their external and internal classifica-tion processes to improve the efficiency of inmate tracking, data entry andretrieval, needs prioritization, inmate program and work activities monitoring,and housing and case plan integration tracking. The goal is to automate match-ing each inmate to the most appropriate housing, work, and program assign-ments. Another goal of automation is to integrate external and internalclassification into a single system.
� Comprehensive coverage of key classification variables: Many states are plan-ning to add variables to their MIS databases (see chapter 8). This was illustrat-ed by South Carolina’s new risk/needs assessment, Colorado’s introduction ofthe Millon inventory, and the use of AIMS for internal classification in severalprisons.
� Improved performance-based measures: Objective measures of results areneeded to monitor progress toward prisons’ policy goals. Because classificationdirectly supports many correctional goals, valid and reliable performance indi-cators are needed to evaluate and monitor classification performance. Thisimplementation challenge was evident in several prisons that were developingmeasures of the impact of new internal classification systems.
� Broadened range of management and statistical reports: Prisons are focusingon designing a broader range of management and statistical reports to increasethe information flow to middle managers. Success in this area may have pro-found implications for accountability and resource allocation, particularly asbetter results and workload measures are developed for the MIS. OLAP proce-dures should allow prisons to experiment with and ultimately broaden the rangeof management reports customized to their particular needs.
� Introduction of enhancements in screen design, interface, and navigation: Analmost constant flurry of small design changes was a common theme among allthe prison systems examined. These small fixes typically responded to sugges-tions from classification staff regarding ineffective or inefficient screen designor keystrokes required for navigation. Typically, such small changes were chan-neled to data processing committees for rating according to the amount of workinvolved, benefit-cost considerations, and so on.
� Development of integrated statewide criminal justice databases: Many stateDOCs were involved in intense efforts to integrate data from law enforcement,courts, probation, and other sources. Driving these changes was the needfor timely, high-quality data and improved analytical capacities to supportdecisionmaking at line and management levels.
Such widespread innovation and change underlines the need for implementationskills among prison management. OLAP and other procedures reflect a profound
141
Implementing New Technology and Managing Change

Managers skilled in
coalition building
who also possess
technical skills and a
motivation to change
can make a critical
difference. Skills in
planning and in
conceptualizing the
benefits and roles of
classification and the
advantages of IT
innovation can
strengthen organiza-
tional capacity for
innovation.
shift from static to dynamic database technologies and require nearly instantaneousaccess, storage, analysis, and communication. All of these technical features wereunder development in the prison systems examined. Electronic databases, new ana-lytical procedures, and telecommunications appear to be converging rapidly. Datacan now be extracted dynamically from the MIS and analyzed rapidly, and theresults can be communicated in real time to correctional officers at many locationsin a facility.
Organizational Change Capacity: Key to Success inManaging Change
Every enterprise possesses a certain capacity for change. Each correctional facilityhas an organizational context with a given level of support for change in IT andclassification procedures. Although some agencies have a highly positive organiza-tional culture that facilitates change, others are characterized by inertia, rigidity, andresistance to change (Brennan, 1999; Ellickson and Petersilia, 1983; Harris andSmith, 1993). Implementing technical innovations may be possible in one prison butvery difficult in another. Prison managers who are interested in innovation andchange must be highly aware of their organization’s adaptive capacity. The discus-sion below identifies some factors that characterize the more innovativeorganizations.
Management Skills: Planning, Vision, and Technical Skills
Successful implementation of new technologies appears to be based in part on thepresence of technically competent and sophisticated staff, particularly at the man-agement and data processing levels. These staff can assess more accurately thepotential of new technology and its alignment with their institution’s goals and seemto possess the management skills to plan effective implementations.
Political Skills of Senior Managers and IT Staff
Changing classification or the MIS often requires interdepartmental agreements,interorganization referral adjustments, and careful policy coordination betweendepartments. This occurs because changes to classification and MIS technologiesare system transforming (Bushe and Shani, 1991); that is, they can ramify through-out the organization. These changes often cannot be achieved by top-down, chain-of-command orders and may require well-developed social and political skills.Coalition building, collective planning, and the ability to maintain momentum forthe duration of the project are critical.
Culture of Openness to Innovation
Some prisons are elementally resistant to change. In these prisons, the burden ofproof always falls on those proposing a change; anything new is viewed as an attackon the current administrative hierarchy. The combination of powerful but conserva-tive leaders, rigid hierarchical bureaucracy, and routine procedures clearly makes
142
Chapter 10

any innovation more challenging (Morgan, 1986). Many studies have shown thathierarchical, chain-of-command organizations are often resistant to change (Mor-gan, 1986). Other research has established that a barrier to change in some organi-zations is a culture that creates and rationalizes rigidity, resistance, and apathytoward innovation (Harris and Smith, 1993). When confronted with pressure tochange, strong resistance and counterpressures protect the political legitimacy of thestatus quo. Such organizations can be so inflexible that they do not allow innovationwithout tremendous upheavals.
Entrenched resistance is often exemplified in attempts to change the data content ofa prison MIS. Even simple changes in coding data elements or the exclusion of adata element can be met with incredible resistance. Classification forms and dataentry procedures reflect current reality or business as usual, and attempts to redesignthem seem to trigger power struggles and resistance. Change, in some prisons, issimply not possible in the face of such inertia.
In contrast, several of the prison systems examined in this study displayed a stronginterest and openness to innovative approaches in both classification and MIS tech-nologies and a strong interest in excellence. For example, virtually all were amongthe early adopters of internal classification methods (NIC, 2001) and participated inthe transition to New World data architectures described by the South Carolina staff.Apparently, implementation in these prison systems also was effective because ofthe presence of change agents in leadership positions who appeared to have a goodunderstanding of the organizational context (resistance, skills requirements, etc.) inwhich implementation must be orchestrated.
Role of Leadership in Achieving Consensus
Another characteristic of exemplary systems is leadership, political skills, and tech-nical skills (and resources) strong enough to achieve consensus. Some prison sys-tems are so politicized that it is difficult to achieve consensus on virtually anychange. Pettigrew, Ferlie, and McKee (1992) reported that public-sector agenciesare, if anything, more politicized than private corporations.
When consensus is impossible, capacity for change is diminished. Effective changerequires the commitment of many stakeholders and the political will to assignresources to a new project. An inability to obtain consensus among critical stake-holders may cripple the implementation if some well-placed administrators or man-agers decide to sabotage the innovation or minimize the resources allocated to it.Managers must assess the degree of politicization in the organization and attempt tobuild productive coalitions.
Resources for Change
The successful introduction of innovations in classification or IT requires theassignment of appropriate and adequate resources (e.g., local leadership, technicalstaff, consultants, computer hardware and software) to the project. The concept oforganizational readiness includes the ability to marshal appropriate resources.
143
Implementing New Technology and Managing Change
Key Strategies for Implementation and ChangeManagement
Johnson and Fredian (1986) noted that managing complex organizational change isone of the most difficult and frustrating tasks for managers in any organization. Inthe prisons examined in this study, administrators and managers often faced daunt-ing challenges in implementing new software and hardware and obtaining resourcesand training. In criminal justice, several factors (agency size, multiple facility sites,budget constraints, entrenched procedures, etc.) make the process of implementingorganizational and procedural change very complex. Each prison system has aturnover rate in its procedures, particularly in IT, as a result of leapfrogging newtechnologies. The turnover rate is perhaps fed by the failure of older MISs to addressmany of today’s problems, by staff dissatisfaction with the current MIS, and by thecontinual emergence of rapidly improving software and hardware.
This section offers a strategy for implementing new technology and managingchange in a correctional setting. It includes four overlapping phases and subtasks tobe accomplished in roughly sequential order. Note that this precise order is notalways required and that some feedback loops and deviations are often necessary(Brennan, 1999; Walton, 1989). The strategies described below integrate Walton’s(1989) process framework and three broad themes of the Pettigrew, Ferlie, andMcKee (1992) model of strategic change.
Phase 1: Preimplementation
The major tasks of this phase include recognizing any classification deficiencies orMIS problems, building a supportive coalition of stakeholders, mobilizingresources, building a compelling vision to motivate and guide change, and strength-ening the agency’s capacity for change as described below.
1. Recognizing the problem: This involves justifying the existence of the problemand the need for change. Every successful innovation appears to be backed bypowerful managers or “change agents” who advocate, explain, and justify thechange.
Examples of problem recognition in the prisons examined in this study includethe absence of an internal classification system, the need to automate internalclassification, classification of female prisoners at higher security levels thanwarranted, and the need for a broader coverage of criminal history variables.Key managers in particular must understand the rationale for the change and thecosts or inefficiencies of the present approach and clearly articulate the reasonsfor the proposed change (including the benefits and the costs of doing nothing).
2. Building a supportive coalition: Successful change seldom occurs without abase of political support. In the prisons examined, there appeared to be carefulgroundwork for building appropriate agreements among and coalitions ofconcerned managers. New Jersey, for instance, paved the way for large-scale
144
Chapter 10
Unified commitment
among organizational
leadership and major
stakeholders is the
ideal platform from
which to launch
major changes.
Obtaining the sup-
port of key people
who have influence
and authority is a pri-
ority. Soliciting such
support at the begin-
ning of the process
involves major stake-
holders and early
agenda-setting and
design decisions.
change in classification by securing all critical agreements and coalitions earlyin the process. Similarly, Colorado’s efforts to automate tracking procedures forthe new internal classification were preceded by efforts to secure the participa-tion and commitment of senior administrators in the central office who wereseen as critical to the project. Leaders of Florida’s project to design a new riskand needs assessment directly sought staff participation. Managers created asubstantial opportunity for staff suggestions and input into the design andrefinement of new procedures. This helped in designing the procedure andachieving buy-in from an important segment of the prison staff.
3. Involving a broad base of stakeholders: Classification procedures and MISsinfluence many departments, managers, and prison policies and thus have manystakeholders (e.g., security, classification, and MIS staff). These stakeholdersmust all be given a direct participatory role, which strengthens buy-in and com-mitment. People are more likely to resist if they feel excluded, and their parti-cipation usually improves the overall design of any new system. All of theexemplary prison systems appeared able to involve all main stakeholders andgive them meaningful participatory roles.
4. Specifying the deficiencies of current practices: The change agents (i.e., allmembers of the project team) must fully appreciate the performance deficits ofthe current classification procedures. For example, the weaknesses of traditionalsubjective approaches to internal classification decisions were fully elaboratedin the goal statements of several of the prisons examined.
5. Developing a vision of desired goals/benefits: Commitment among key man-agers is easier to obtain if a clear understanding of the desired goals and bene-fits exists. A written vision statement prepared by a high-level steeringcommittee can provide direction and motivation. Resource acquisition is easierwhen all major stakeholders are aware of and agree on the intended goals of thechanges proposed.
6. Developing performance requirements for the new system: The coalition ofstakeholders should develop a wish list of key performance requirements for thenew procedure or MIS modifications. Specific design criteria (e.g., predictivevalidity, consistency, reliability) for internal and external classification systemsare promulgated in various NIC and American Correctional Association (ACA)publications and are discussed elsewhere in this report. That many prisons con-ducted pilot studies for new internal classification systems reflects the impor-tance of the preliminary evaluation of performance criteria.
7. Mobilizing new organizational teams or committees to manage change: Normalstaffing arrangements are seldom geared to the tasks of managing, designing,and implementing complex change. Thus, it is often necessary to set up newstructures to enhance the adaptive capacity of the agency. When a prison con-templates introducing major innovations in either classification or the MIS, itcan strengthen its adaptive capacity by forming special teams or committees of
145
Implementing New Technology and Managing Change

change agents. All of the prisons in this study formed strong implementationand planning teams with effective leadership. Typical change structures includethe following:
� A transition manager (change agent or leader).
� A steering committee (high-level administrators).
� An implementation team (key stakeholders, technical staff, etc.).
� A change monitor (to review the change process).
� Expert outside help (consultants, experienced peers, etc.).
Implementation teams generally are involved in the management of design,training, troubleshooting, coordinating, and maintaining the momentum of theprocess. The project manager provides leadership, continuity, and coordinationwith upper-level administrators. This person is critical to the whole effort andmust often assume the role of change agent to consistently maintain the pro-ject’s momentum. The project manager should be selected on the basis ofrespect from peers, management and political skills, and so on.
New Jersey’s prison system exemplifies these tactics. Following the initialsecuring of commitments from senior leadership for its classification designproject, the state formed a high-level task force to provide overall direction andresources. The state also formed a project team consisting of major stakehold-ers to coordinate the pilot test, revise the instrument, and formulate a strategicplan for the whole process. Similar committee structures were formed in mostof the other successful prison systems.
External consultants can often strengthen the capacity for change by providingspecialized expertise. The use of such consultants was a common feature ofthese exemplary systems. For example, a key ingredient in the success of theSouth Carolina DOC effort to design advanced applications was collaborationwith university researchers who had high-level skills in new data architectures,expert systems, and advanced simulation methods. Similarly, the Florida DOCconsulted with university researchers who had expertise in psychometric meas-urement for the design of its new risk and needs assessment.
8. Evaluating preliminary design and alignment issues: The design of new classi-fication procedures or MIS data structures or capacities is principally based onperformance requirements. Different classification procedures must be designedbased on different priorities. The Washington DOC, for example, when consid-ering any change to MIS or classification software, has an elaborate multilay-ered sequence of committee reviews of the purposes, feasibility, and otherspecifications for all software changes.
146
Chapter 10

Clear performance specifications and goals are thus required to direct the designof any new classification or MIS change. This places substantial responsibilityon prison managers to be clear about the goals and purposes of any change. Typ-ically, the implementation team assumes primary responsibility for this task.Alignment refers to the degree to which an innovation (either to MIS softwareor classification methods) is a good fit with prison goals and policies, staff com-petence, and the overall organizational culture. A pilot test is critical in assess-ing the degree of fit and determining whether the innovation has any designflaws.
9. Competence building and planning for training programs: In each prison visit-ed, there was a strong focus on building competence among staff. Major policyand procedural changes require new skills, perspectives, and understandings.When prison managers have a poor understanding of classification, they may beunaware of design flaws (e.g., invalid risk factors, inappropriate weighting offactors, erroneous cutting points) in the proposed system. The history of cor-rectional classification is littered with failures resulting from design flaws inclassification methods (see Brennan, 1987b; Megargee and Bohn, 1979; Palmer,1992).
Training plans are also required in any situation of rapid technological or pro-cedural change that may render current organizational knowledge obsolete.With rapid change, the organization’s inventory of skills and procedural knowl-edge enters a state of decay (Pettigrew, Ferlie, and McKee, 1992). Retrench-ment skills and effective training programs cannot be ignored. A secondimplication of a high turnover rate is that many prisons must be willing to aban-don or phase out their older systems while simultaneously introducing newsystems.
10. Developing (and continually refining) a project plan: The NIC (2001) study ofnew internal classifications emphasized the importance of constant planning,realistic goals, measurable objectives, and continual updating. The implementa-tion team must develop and maintain a tentative implementation plan, prefer-ably in writing. Specific and realistic tasks, milestones, and responsibilitiesmust be identified. Without a written plan, confusion, chaos, and stagnation mayexist. The plan should be brief and clear and should designate specific respon-sibilities. It should outline the main changes, why they are important, who willmake them, how long each will take, and the sequence in which they will becompleted.
An interesting feature of MIS planning in prisons, as noted by Fowler (1999),is the role of long-term plans in guarding against the distractions of today’s ITinnovations. She argued that prisons must develop a long-term IT plan that,although innovative and open to change, avoids the continual acquisition of themost recent technology. She saw this style of continual upgrading as a recipe forwasteful accumulation of underutilized hardware and software. This practicemay result in data processing and programming staff’s being constantly
147
Implementing New Technology and Managing Change

engaged in learning new IT procedures and unable to service currentrequirements.
In the prisons observed in this study, achieving this balance between old andnew IT was an ongoing challenge. Most of the prisons appeared to have reacheda comfort level with sufficient continuity of their IT procedures while steadilyintroducing changes. Fowler (1999) suggested that existing systems should notbe discarded too quickly in favor of new technological “chic.”
Phase 2: Finalizing Design, Conducting a Rigorous Pilot Test,
and Identifying Design Flaws
The design of new classification or MIS software governs the success or failure ofits implementation. Undetected design flaws can ruin the effectiveness of any inno-vation. For example, the NIC 2001 study reported that some prison systems hadstalled in using AIMS because of a specific weakness in interrater reliability. Clear-ly, before a new system enters routine practice, it must be thoroughly pilot tested toascertain whether it has any design flaws and can, in fact, achieve the desired goals.The identification and correction of design flaws is the essential task of this phase.This phase may involve the following subtasks:
1. Finalizing performance requirements: This builds on the preliminary work ofthe stakeholders and implementation team in the preimplementation phase. Fullspecification of performance requirements is critical because these will be test-ed empirically in the pilot study.
2. Finalizing the design or adopting a design from another jurisdiction: In the caseof classification, some prisons may select several candidate methods and evalu-ate and compare them in a pilot study. For example, AIMS, LSI, COMPAS, andother classification approaches have been evaluated in pilot testing by prisonsystems. No single classification model is universally accepted (NIC, 2001).Each of the prisons examined in this study appeared to desire a unique or cus-tomized approach to classification.
3. Training staff in new prototype (provisional) procedures: Before the pilot test,staff must be trained in the new procedures. The training curriculum mustexplain the role of classification or the new MIS capabilities, new technical pro-cedures, strengths and weaknesses of new classifications, legal requirements,and professional standards (e.g., ACA principles, NIC principles, or Megargeestandards).
4. Designing and conducting a pilot test: The pilot test assesses whether all per-formance requirements of the new classification or MIS are met. In the case ofclassification procedures, the pilot test must assess the statistical validity andreliability of the new system on real data collected in the prison. This test of newclassification methods may vary in level of completeness and sophistication(Alexander and Austin, 1992; Brennan, 1993).
148
Chapter 10

5. Assessing alignment: The overall fit, or alignment, of the new procedures mustbe examined (Walton, 1989). This assessment uses both the pilot test and aprocess analysis of how the staff use and respond to the new procedures in real-life conditions. Alignment is a broad concept in that it assesses whether a newprocedure is well coordinated with staff skills, agency mission, personnel poli-cies, and so on. For example, one prison preferred PMC over AIMS becausestaff felt that the AIMS requirements for separating violent from nonviolentoffenders were too rigid. Such preferences go beyond the pilot test by reflectingthe multiple factors involved in the consideration of alignment (Brennan, 1999).
Alignment in prison classification is often difficult to achieve, given that a clas-sification must meet multiple policy goals simultaneously. There may be noeasy way to meet all policy priorities with a single classification. A new classi-fication system may be misaligned if it is too restrictive or too liberal, if it takestoo long to complete, if the skill requirements go beyond the level of the staffwho will use it (e.g., if it requires complex psychological assessment), or if ithas unclear implications for prisoner management. Thus, achieving alignmentinvolves difficult technical decisions.
6. Introducing refinements: A need for refinements often emerges from the pilottest and the analysis of alignment. Refinements should be introduced until thenew procedure has the best possible fit. For example, Scottish prisons made var-ious modifications to AIMS to improve its fit with their specific concerns.
Phase 3: Implementation
Implementation means introducing the innovation into routine use. This initiates anew phase in which the emphasis shifts from design to detailed project manage-ment. In the prison systems examined in this study, many changes were introduced:new internal classifications, modified external classifications, automation of classi-fication, and new risk and needs assessments. The following are the lessons learnedin this “go live” phase of implementation:
1. Maintain a continuous implementation plan: The implementation plan contin-ues to specify all details of who does what at each phase as new procedures areintroduced into routine operations. It should provide flexibility to meet unex-pected difficulties. For example, specific changes in staff job designs may beexpected and should be discussed with relevant staff. Longer interviews may berequired for internal classification, and staff must adjust to such changes andview additional tasks as legitimate components of their jobs. Implementation ofvirtually any change to routine operations must be continually responsive to theemerging dynamic situation. Problems should be identified and resolved earlierrather than later.
2. Develop mechanisms to monitor progress: This may include Gantt charts formonitoring progress and procedures to maintain good communication patternsand identify and resolve conflicts. All parties, especially top administrators,
149
Implementing New Technology and Managing Change

Conversion strategies
must allow for unin-
terrupted workflow
during the transition
from old to new sys-
tems to minimize the
impact on the consis-
tency and validity
of classification
decisions.
must be routinely apprised of progress, successes and failures, and problem res-olution. Virtually all of the prisons involved in this study were extremely care-ful in this area of implementation.
3. Engage in problem identification and adaptive problem solving: The participa-tion of line users and other stakeholders must be encouraged, and managementshould maintain a stance that is receptive to their suggestions. Rigid top-downplanning or design cannot predict all problems that may emerge when new clas-sification or IT procedures are being introduced. The initial design of most newcorrectional procedures (e.g., an objective classification) is seldom flawless.Senior managers and external consultants are not omniscient in predicting allproblems or glitches. Problems and possible solutions often are recognized onlywhen line staff start using the new procedures in daily operations.
4. Implement strategies for conversion from old to new systems: The current clas-sification procedures are often continued while the new system is phased in;occasionally, the two will operate simultaneously during a period of transition.With new classification and MIS methods, it may be prudent to maintain a back-up until the new system is thoroughly mastered. Fowler (1999) commented thatit is imperative to maintain the quality of current, routine operations whileimportant upgrades are being introduced. Extreme care should thus be focusedon maintaining the consistency and validity of classification decisions. Planningshould aim for minimal disruption of normal facility activities during thechangeover. Careful supervision is needed as classification staffs develop con-fidence and skills in the new procedures.
5. Provide communication, participation, and support: Maintaining the supportand commitment of all stakeholders is imperative during this phase because ofthe potential for high stress. Procedures for communication, reports, participa-tion, and input must be maintained, with occasional reminders by the imple-mentation team leader of the benefits and goals of the changes being introduced.
6. Build competence through training: Successful implementation of new andcomplex classifications or MIS procedures always requires new skills (e.g., nav-igating new screens, using new analytical procedures) that must be imparted tostaff in this early phase. New skills in supervision procedures also may berequired as the new (especially classification) methods are introduced. Theimplementation team must therefore attend to continuous training and super-vision of management and line staff during this phase to promote learning of,competence in, and comfort with the new procedures. Note that the IT skillsrequired of line and management staff may differ. Management in particularmay require new skills in designing and interpreting statistical reports.
7. Implement organizational adjustments to the new procedures: An often unrec-ognized point is that when new IT processes are introduced, some mutual adap-tation may occur between the new procedure and current organizationalstructures (Pettigrew, Ferlie, and Mckee 1992; Walton, 1989). New IT
150
Chapter 10
procedures may have unexpected consequences that change the way that theprison works or that individual prison staff or managers perform their work.Faster decisionmaking and revised classification procedures may introduce pro-found changes to offender referral patterns and staff workloads, introducepower shifts between staff, or have other unexpected side effects. The preciseeffects cannot always be predicted. Thus, when a prison upgrades its classifica-tion or MIS procedures, it must be alert to the emergence of such problems andable to resolve unexpected organizational challenges.
Phase 4: Postimplementation
When new procedures have been implemented for a reasonable period of time, apostimplementation phase of consolidation, monitoring, and evaluation of the newclassification procedures begins. In this phase, the main tasks involve recognizingproblems, monitoring results, and ensuring that the new procedure is implementedcorrectly and being used with integrity. The last of these often involves formalprocess evaluation studies or may simply require careful supervision by a managerwho understands the procedure’s design and intent. This scrutiny will indicatewhether the new procedures have been fully implemented. If not, it is best to com-plete the implementation process before conducting a formal impact study.
Evaluating and monitoring tasks are often ignored when managers erroneouslyassume that the goals of a new classification will be reached and that procedureswill be used as designed. However, many implementation studies have indicatedthat this is rarely the case (Brennan, 1999; Harris and Smith, 1993; Johnson and Fre-dian, 1986). Managers must recognize that once implementation has occurred, theintegrity with which the new procedure is used must be monitored.
Each of the prison systems in this study devoted special efforts to assessing theimpact of and various followup tasks for each new procedure following implemen-tation. Critical questions are, Does it work? and Are we achieving the desired ben-efits? In some instances, formal impact evaluation studies may be needed to assesswhether the innovation is achieving the desired goals over the longer term.
Major postimplementation tasks include the following:
1. Outcomes assessment: This process examines whether the new classificationsystem reaches its goals and considers the results of the transition to the newsystem. The MIS database must contain the measures of relevant outcomes andgoals of the new procedure. Performance reports and time-based charts shouldbe constructed to assess whether goals are being achieved over time and todetermine which goals are not being attained and why. Routine monitoringreports should be distributed to all key stakeholders. In most criminal justiceagencies, the quantitative data elements necessary to assess outcome measuresare often missing, incomplete, or inadequate. All of the prison systems exam-ined in this study had the challenge of progressively upgrading their resultsmeasurements. Over the longer term, it is prudent to maintain constant vigilanceregarding the integrity of implementing new procedures. 151
Implementing New Technology and Managing Change

2. Process evaluation: This procedure assesses the integrity with which a new pro-cedure, program, or software package is used and examines resistance, non-compliance, user-friendliness, goal sabotage, goal substitution, and so on.Brennan and Austin (1989) provided a review of these procedures for jail clas-sification systems. Process evaluation essentially overlaps with effective super-vision. Supervising managers must be vigilant regarding staff integrity incorrectly using the new procedures. Harris and Smith (1993) commented thatattempts by staff to subvert, replace, or undermine the goals of the innovationmust be identified and quickly resolved by leadership.
3. Problem identification and process revision: On the basis of longer term evalu-ation and monitoring, managers or staff may identify weaknesses of the newclassification or MIS procedures that require modification. This was standardpractice in all of the prison systems examined in this study. Most had formalprocedures by which staff could forward suggestions to a supervisor or to aquality control committee for consideration so that continuous improvementcould be effected.
4. Organizational learning capacity enhancement; process debriefing: A usefulway to learn from experience and promote organizational capacity for change isto provide feedback in debriefing sessions with the implementation team andother stakeholders. These debriefing sessions should assess questions such as,What worked well? Where were the main difficulties? What did we learn aboutimplementing change? and What are we learning from ongoing monitoring ofresults? Another strategy for bolstering organizational learning is to maintaincontinuous written documentation of the total implementation process. Imple-mentation teams interviewed for this study were clearly aware of these strate-gies and were concerned about achieving positive growth in changemanagement.
5. Skills and competence maintenance: Skills maintenance must not be ignored inpostimplementation efforts. Staff turnover creates a continuing need for skillsmaintenance. Supervisors may discern skill deficiencies among the staff. Keyquestions for supervisors include, Has mastery been achieved in all the waysthat the new procedure can be used? and What additional competency needs arepresent? Often managers themselves do not have all of the necessary skills forusing the MIS. Continuing assessment of training needs should be conductedthroughout postimplementation.
6. Design of feedback systems and reports to key stakeholders: Because externalvendors seldom have a deep understanding of correctional facilities, the insightsof prison managers are required to design effective management reports tailoredto the prison’s needs. Classification assessments produce a rapidly expandingdatabase relevant to many prison stakeholders. Carefully designed reportsshould be developed for routine distribution. The prisons in the present studyhad mixed success in this area. Most were able to produce numerous reports, butoften there was dissatisfaction and a need for more customized or specific
152
Chapter 10

reports to meet the exact needs of managers. The limitations of the analyticalcapacity of the current MIS were often a roadblock to generating more usefulor customized reports.
Conclusion
Managing organizational change regarding new or upgraded prison classificationsystems is both difficult and multiphased and has several hazards that can derail orundermine the whole effort. First, implementing any new classification system andits supporting MIS involves making technical changes that affect the prison sys-temically and therefore require well-designed implementation strategies backed upby effective leadership. Second, strong political leadership is required at virtuallyevery implementation phase (as reviewed in this chapter). Thus, technical compe-tence in the design and testing of new technologies must be paralleled by adminis-trative leadership, a strong vision of the required benefits, and the determination toobtain the appropriate resources as well as the competence to successfully introducethe new technologies.
153
Implementing New Technology and Managing Change
Notes
1. Recent trends suggest a renewed interest in more comprehensive classifications.See NIC (2001) and Brennan and Oliver (2000).
2. These have not been implemented in all prisons, although their popularity isrising.
3. Some existing state MISs project as many as 3 business days.
155
157
Alexander, J.A. 1986. “Classification Objectives and Practices.” Crime and Delin-quency 32:323–338.
Alexander, J., and J. Austin. 1992. Handbook for Evaluating Objective Prison Clas-sification Systems. Oakland, CA: National Council on Crime and Delinquency.
Andrews, D.A. 1982. The Level of Supervision Inventory (LSI): The First Follow-Up. Unpublished manuscript.
Andrews, D.A., and J. Bonta. 1994. The Psychology of Criminal Conduct. Cincin-nati, OH: Anderson Press.
Andrews, D.A., and D. Robinson. 1984. The Level of Supervision Inventory, 2ndReport: Report to Research Services (Toronto) of the Ontario Ministry of Correc-tional Services. Ontario, Canada.
Arens, S.A., B. Durham, M. O’Keefe, K. Klebe, and S. Olene. 1996. PsychometricProperties of Colorado Substance Abuse Assessment Instruments. Unpublishedmanuscript.
Austin, J. 1983. “Assessing the New Generation of Prison Classification Models.”Crime and Delinquency 29:561–576.
———. 1993. “Objective Prison Classification Systems: A Review.” In Classifica-tion: A Tool for Managing Today’s Offenders. College Park, MD: American Cor-rectional Association.
Austin, J., C. Baird, and D. Neuenfeldt. 1993. “Classification for Internal Manage-ment Purposes: The Washington Experience.” In Classification: A Tool for Manag-ing Today’s Offenders. College Park, MD: American Correctional Association:71–94.
Baecker, R.M., W. Buxton, J. Grudin, and S. Greenberg. 1995. Readings in Human-Computer Interaction: Toward the Year 2000, 2d ed. San Francisco, CA: MorganKaufmann Publishers: 897–906.
Bandura, A. 1996. “Mechanisms of Moral Disengagement in the Exercise of MoralAgency.” Journal of Personality and Social Psychology 71 (2): 364–374.
Bonta, J. 1997. “Do We Need Theory for Offender Risk Assessment?” Forum onCorrections Research 9 (1): 15–17.
Bowker, G.C., and S.L. Star. 1999. Sorting Things Out: Classification and Its Con-sequences. Cambridge, MA: The MIT Press.
Brannigan, A. 1997. “Self Control, Social Control and Evolutionary Psychology:Towards an Integrated Perspective on Crime.” Canadian Journal of Criminology(October): 403–431.
References

Brennan, T. 1980. Multivariate Taxonomic Classification for Criminal JusticeResearch. Washington, DC: National Institute of Justice.
———. 1987a. “Classification: An Overview of Selected Methodological Issues.”In Prediction and Classification: Criminal Justice Decision Making, edited by D.M.Gottfredson and M. Tonry. Chicago, IL: University of Chicago Press.
———. 1987b. “Classification for Control in Jails and Prisons.” In Prediction andClassification: Criminal Justice Decision Making, edited by D.M. Gottfredson andM. Tonry. Chicago, IL: University of Chicago Press: 323–366.
———. 1993. “Risk Assessment: An Evaluation of Statistical Classification Meth-ods.” In Classification: A Tool for Managing Today’s Offenders. Arlington, VA:American Correctional Association.
———. 1999. “Implementing Organizational Change in Criminal Justice: SomeLessons From Jail Classification Systems.” Corrections Management Quarterly 3(2): 11–27.
———. 2000. “Prisoner Classification.” In Encyclopedia of Women and Crime,edited by N. Rafter. Phoenix, AZ: Oryx Press: 199–200.
Brennan, T., and J. Austin. 1989. Evaluating Jail Classification Systems: A Practi-cal Approach. Longmont, CO: National Institute of Corrections, Jail Division.
———. 1997. Women in Jail: Classification Issues. Longmont, CO: National Insti-tute of Corrections, Jail Division.
Brennan, T., and G.A. Camilli. 1982. Evaluation of Objective Assignment Tech-niques for Criminal Justice Classification: Final Report. Washington, DC: Office ofResearch and Evaluation Methods, National Institute of Justice.
Brennan, T., and L.O. Harvey. 2000. Application of Signal Detection Theory toCriminal Justice Risk Decision Making: Technical Report. Boulder, CO: The Cen-ter for Judgment and Decision Making, Institute for Cognitive Science, Universityof Colorado.
Brennan, T., and W.L. Oliver. 2000. Evaluation of Reliability and Validity of COM-PAS Scales: National Sample. Traverse City, MI: Northpointe Institute for PublicManagement.
———. 2001. Evaluation of the Reliability and Validity of the COMPAS Scales:New York Probation Sample. Traverse City, MI: Northpointe Institute for PublicManagement.
Brennan, T., W.L. Oliver, and D. Wells. 2000. COMPAS Risk/Needs Assessment:User Manual. Traverse City, MI: Northpointe Institute for Public Management.
158
References
Brennan, T., and D. Wells. 1992. “The Importance of Inmate Classification in SmallJails.” American Jails Magazine (June/July).
Bureau of Justice Statistics (BJS). 1998. State and Federal Corrections InformationSystems. NCJ 170016. Washington DC: U.S Department of Justice.
Bushe, G.R., and A.B. Shani. 1991. Parallel Learning Structures: Increasing Inno-vation in Bureaucracies. Reading, MA: Addison-Wesley Publishing.
Buss, A.H., and M. Perry. 1992. “The Aggression Questionnaire.” Journal of Per-sonality and Social Psychology 63:452–459.
Carey, G. 1994. “Genetics and Violence.” In Understanding and Preventing Vio-lence, Volume 2: Biobehavioral Influences, edited by A.J. Reiss, Jr., K.A. Miczek,and J.A. Roth. Washington, DC: National Academies Press: 21–58.
Caulkins, J., J. Cohen, W. Gorr, and J. Wei. 1996. “Predicting Criminal Recidivism:A Comparison of Neural Network Models With Statistical Methods.” Journal ofCriminal Justice 24 (3): 227–240.
Clear, T. 1988. “Statistical Prediction in Corrections.” Research in Corrections1 (1): 1–51.
Clements, C.B. 1996. “Offender Classification: Two Decades of Progress.” Crimi-nal Justice and Behavior 23 (1): 121–143.
Cooke, D. 1998. “The Development of the Prison Behavior Rating Scale.” CriminalJustice and Behavior 25 (4): 482–506.
Cooper, A. 1995. About Face: The Essentials of User Interface Design. New York:Hungry Minds, Inc.
Ellickson, P., and J. Petersilia. 1983. Implementing New Ideas in Criminal Justice.Santa Monica, CA: Rand.
Fishbein, D. 2000. “Violent Inmates: Matching Treatment to Offender.” AmericanJails (December): 41–47.
Flanagan, T.J. 1983. “Correlates of Institutional Misconduct Among State Prison-ers.” Criminology 21 (1): 29–39.
Fowler, L. 1999. “Information Management.” In Prison and Jail Administration:Practice and Theory, edited by P. Carlson and J. Garrett. Gaithersburg, MD: AspenPublishers.
Fowler, L., and L.L. Rans. 1982. Classification Design and Implementation: Tech-nologies and Values. College Park, MD: American Correctional Association.
159
Enhancing Prison Classification Systems

Gettinger, S. 1982. “Objective Classification: Catalyst for Change.” CorrectionsMagazine 8 (3): 24–37.
Gordon, A.D. 1999. Classification. 2d ed. Monographs on Statistics and AppliedProbability, 82. Washington, DC: Chapman and Hall/CRC Press.
Gottfredson, M.R., and T. Hirschi. 1990. A General Theory of Crime. Stanford, CA:Stanford University Press.
Gottfredson, S.D., and D.M. Gottfredson. 1980. “Screening for Risk: A Comparisonof Methods.” Criminal Justice and Behavior 7 (3): 315–330.
———. 1985. “Screening for Risk Among Parolees: Policy, Practice and Method.”In Prediction in Criminology, edited by D.P. Farrington and R. Tarling. Albany:State University of New York Press.
Hammond, K.R. 1996. Human Judgment and Social Policy: Irreducible Uncertain-ty, Inevitable Error, and Unavoidable Injustice. New York: Oxford University Press.
Han, J., and M. Kamber. 2001. Data Mining: Concepts and Techniques. San Fran-sisco, CA: Morgan Kaufmann Publishers.
Hardyman, P.L., J. Austin, J. Alexander, K.D. Johnson, and O.C. Tulloch. 2002.Internal Prison Classification Systems: Case Studies in Their Development andImplementation. Washington, DC: U.S. Department of Justice, National Institute ofCorrections.
Hare, R.D. 1996. “Psychopathy: A Clinical Construct Whose Time Has Come.”Criminal Justice and Behavior 23: 25–54.
Harris, P.M. 1994. “Client Management Classification and Prediction of ProbationOutcome.” Crime & Delinquency 40 (2): 154–174.
Harris, P.W., and S.H. Smith. 1993. “Developing Community Corrections: AnImplementation Perspective.” In Choosing Correctional Options That Work: Defin-ing the Demand and Evaluating the Supply, edited by A. Harland. Beverly Hills,CA: Sage Publications.
Harvey, L.O., K.R. Hammond, C.M. Lusk, and E.F. Mross. 1992. “The Applicationof Signal Detection Theory to Weather Forecasting Behavior.” Monthly WeatherReview 120 (5): 863–882.
Horney, J., I. Marshall, and D.W. Osgood. 1995. “Criminal Careers in the Short-Term: Intra-Individual Variability in Crime and Its Relation to Local Life Circum-stances.” American Sociological Review 60:655–673.
Jain, A.K., and R.C. Dubes. 1988. Algorithms for Clustering Data. EnglewoodCliffs, NJ: Prentice Hall.
160
References
161
Enhancing Prison Classification Systems
Johnson, H.H., and A. Fredian. 1986. “Simple Rules for Complex Change.” Train-ing and Development Journal (August): 47–49.
Jones, P. 1995. “Risk Prediction in Criminal Justice.” In Choosing CorrectionalOptions That Work: Defining the Demand and Evaluating the Supply, edited by A.T.Harland. Beverly Hills, CA: Sage Publications.
Lerner, K., G. Arling, and D. Baird. 1986. “Client Management ClassificationStrategies for Case Supervision.” Crime and Delinquency 32 (3): 254–271.
Leuba, P. 1999. Managing the Integrated System for the Long Term. Paper present-ed at the Symposium on Integrated Justice Information Systems, February 8–10, inWashington, DC.
Lipsky, M. 1980. Street-Level Bureaucracy: Dilemmas of the Individual in PublicServices. New York: Russell Sage Foundation.
Loza, W., and D. Simourd. 1994. “Psychometric Evaluation of the Level of Super-vision Inventory (LSI) Among Male Canadian Federal Offenders.” Criminal Justiceand Behavior 21 (4): 468–480.
Lykken, D.T. 1995. The Antisocial Personality. Hillsdale, NJ: Lawrence ErlbaumAssociates, Inc.
MacKenzie, D.L. 1988. “A Theoretical Revolution in Corrections: Varied Purposesfor Classification.” Criminal Justice and Behavior 15 (1): 125–136.
Mandel, T. 1997. The Elements of User Interface Design. New York: Wiley Com-puter Publishing.
Megargee, E., and M.J.J. Bohn. 1979. Classifying Criminal Offenders: A New Sys-tem Based on the MMPI. Beverly Hills, CA: Sage Publications.
Megargee, E.I., and J.L. Carbonell. 1998. Applying the Megargee Offender Classi-fication System to Women: Comparing the Characteristics of the Types. Paper pre-sented at the annual meeting of the American Society of Criminology inWashington, DC.
Milligan, G.W., S.C. Soon, and L.M. Sokol. 1983. “The Effect of Cluster SizeDimensionality, and the Number of Clusters on Recovery of True Cluster Struc-ture.” IEEE Transactions on Pattern Analysis and Machine Intelligence 5 (1):40–47.
Monahan, J., and H.J. Steadman, E. Silver, P.S. Applebaum, P.C. Robbins, E.P. Mul-vey, L.H. Roth, T. Grisso, and S. Banks. 2001. Rethinking Risk Assessment. Oxford,UK: Oxford University Press.
Morgan, G. 1986. Images of Organization. Beverly Hills, CA: Sage Publications.
Mossman, D. 1994. “Assessing Predictions of Violence: Being Accurate AboutAccuracy.” Journal of Consulting and Clinical Psychology 62 (4): 783–792.
National Institute of Corrections (NIC). 1984. Jail Classification. Washington, DC:NIC.
———. 1985. Prison Classification. Washington, DC: NIC.
———. 1999. Survey of State Criminal History Information Systems, 1999. Wash-ington, DC: Bureau of Justice Statistics.
———. 2001. Jail Classification: Workshop Manual. Longmont, CO: NIC.
National Institute of Justice (NIJ). 1998. Building Knowledge About Crime and Jus-tice: The 1999 Research Prospectus of the National Institute of Justice. NCJ172883. Washington, DC: NIJ.
O’Keefe, M., K. Klebe, and S. Hromas. 1998. Validation of the Level of SupervisionInventory (LSI) for Community Based Offenders in Colorado: Phase II. ColoradoSprings: Colorado Department of Corrections.
Palmer, T. 1992. The Re-emergence of Correctional Intervention. Newbury Park,CA: Sage Publications.
Pettigrew, A., E. Ferlie, and L. McKee. 1992. Shaping Strategic Change: MakingChange in Large Organizations. London: Sage Publications.
Philbrick P., I. Gatti, and L. Guisti. 1993. A Community Corrections Study: The LSIas a Predictor of Program Success? Unpublished study.
Prottas, J.M. 1979. People Processing. Lexington, MA: Lexington Books.
Quay, H.C. 1987. “Classification.” In Psychopathological Disorders of Childhood,3d ed., edited by H.C. Quay and J.S. Wherry. New York: Wiley: 118–183.
Quinsey, V.L., G.T. Harris, M.E. Rice, and C.A. Cormier. 1998. Violent Offenders:Appraising and Managing Risk. Washington, DC: American PsychologicalAssociation.
Raine, A. 1993. The Psychopathology of Crime. San Diego, CA: Academic Press.
Rice, M.E. 1997. “Violent Offender Research and Implications for the Criminal Jus-tice System.” American Psychologist 52 (4): 414–423.
Royall, D.R., R.K. Manhurin, and K.F. Gray. 1992. “Bedside Assessment of Exec-utive Cognitive Impairment: The Executive Interview.” Journal of the AmericanGeriatric Society 40 (12): 1221–1226.
162
References
Sampson, R.J., and J.H. Laub. 1995. “Understanding Variability in Lives ThroughTime: Contributions of Life Course Criminology.” Studies in Crime and Crime Pre-vention 4:143–158.
Sechrest, L. 1987. “Classification for Treatment.” In Prediction and Classification:Criminal Justice Decision Making, edited by D. Gottfredson and M. Tonry. Chica-go: University of Chicago Press.
Simon, F.H. 1972. “Statistical Methods of Making Prediction Instruments.” Journalof Research in Crime and Delinquency 9:46–53.
Solomon, L., and S.C. Baird. 1981. Classification: Past Failures, Future Potential.Corrections Today (May/June): 5–17.
Tonry, M. 1987. “Prediction and Classification: Legal and Ethical Issues.” In Pre-diction and Classification: Criminal Justice Decision Making, edited by D. Got-tfredson and M. Tonry. Chicago, IL: University of Chicago Press.
Van Voorhis, P. 1994. Psychological Classification of the Adult Male Prison Inmate.New York: State University of New York Press.
Walton, R. 1989. Up and Running. Boston, MA: Harvard Business School Press.
Wilkins, L.T., and P. McNaughton-Smith. 1964. “New Prediction and ClassificationMethods in Criminology.” Journal of Research in Crime and Delinquency 1:19–32.
Wilson, B.A. 1997. “Cognitive Rehabilitation: How It Is and How It Might Be.”Journal of International Neuropsychological Society 3:487–496.
Wright, K., T. Clear, and P. Dickson. 1984. “Universal Application of ProbationRisk Assessment Instruments: A Critique.” Criminology 22 (1): 113–134.
Zaplin, R. 1998. Female Offenders: Critical Perspectives and Effective Interven-tions. Gaithersburg, MD: Aspen Publishers.
163
Enhancing Prison Classification Systems

165
Appendix A: WashingtonDepartment of CorrectionsSummary
Washington Department of CorrectionsChief of Classification and TreatmentP.O. Box 41128Olympia, WA 98504–1128360–753–1598
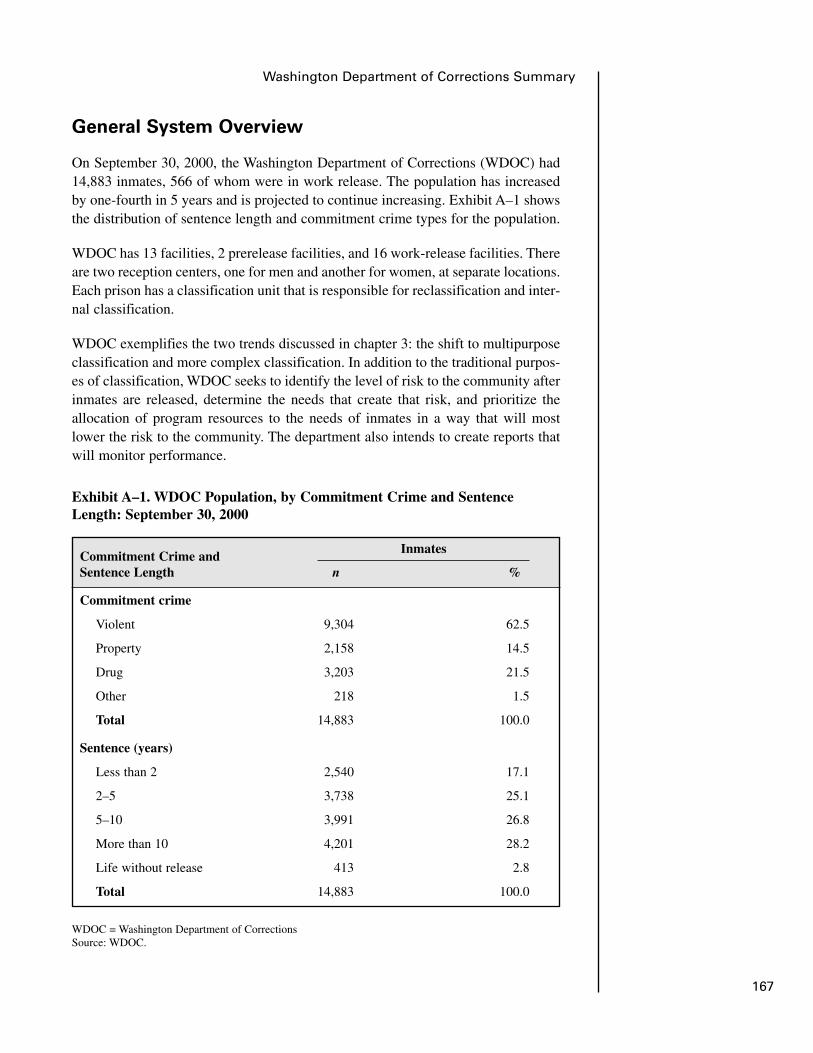
General System Overview
On September 30, 2000, the Washington Department of Corrections (WDOC) had14,883 inmates, 566 of whom were in work release. The population has increasedby one-fourth in 5 years and is projected to continue increasing. Exhibit A–1 showsthe distribution of sentence length and commitment crime types for the population.
WDOC has 13 facilities, 2 prerelease facilities, and 16 work-release facilities. Thereare two reception centers, one for men and another for women, at separate locations.Each prison has a classification unit that is responsible for reclassification and inter-nal classification.
WDOC exemplifies the two trends discussed in chapter 3: the shift to multipurposeclassification and more complex classification. In addition to the traditional purpos-es of classification, WDOC seeks to identify the level of risk to the community afterinmates are released, determine the needs that create that risk, and prioritize theallocation of program resources to the needs of inmates in a way that will mostlower the risk to the community. The department also intends to create reports thatwill monitor performance.
167
Washington Department of Corrections Summary
Exhibit A–1. WDOC Population, by Commitment Crime and SentenceLength: September 30, 2000
WDOC = Washington Department of CorrectionsSource: WDOC.
Commitment Crime andSentence Length n %
Commitment crime
Violent 9,304 62.5
Property 2,158 14.5
Drug 3,203 21.5
Other 218 1.5
Total 14,883 100.0
Sentence (years)
Less than 2 2,540 17.1
2–5 3,738 25.1
5–10 3,991 26.8
More than 10 4,201 28.2
Life without release 413 2.8
Total 14,883 100.0
Inmates

The current automated inmate information system, Offender Based TransactionSystem (OBTS), was borrowed from Florida. It was implemented in 1984. OBTSwas designed to track individual offenders. It has limited flexibility, is not user-friendly, and uses a nonrelational database. Movement from one screen to anotheris always achieved by entering a transaction ID in the upper left corner of a screen.
WDOC is midway through the design of a new information system that is objectbased for greater flexibility and uses a graphical user interface for greater user-friendliness. It includes a data warehouse, which will provide greater reportingcapacity. Fixed-function terminals are being replaced by personal computers.
Process
Intake
This appendix briefly describes general inmate processing that is found in manyother DOCs. WDOC is required to receive inmates when counties are ready to trans-fer them. WDOC picks up county inmates on regularly scheduled trip routes. Thecounties usually, but not always, give 1-day advance notice of an inmate’s transfer.The law requires only that a warrant, judgment, and sentence accompany theinmate. The judgment and sentence provide a complete record of prior Washingtonconvictions.
The inmate often arrives without a presentence report, medical information, orinformation about jail adjustment. The ID officer fingerprints the inmate. The fin-gerprints are sent to the Washington State Patrol, which returns identification inabout 2 months. The inmate is screened for protective custody and mental and med-ical health issues. Personal characteristics, such as weight and height, are entered bythe officer on a form and then entered into the computer by a clerk. If the inmate hasserved a prior term, his or her identification screen will be prefilled and the officerneed only update the data.
Time Computation
On the 2nd or 3rd working day, records office staff enter sentence data. Crime codesare entered, which can then be processed automatically in different routines, such astime computations and custody classification. The records office staff enter com-mitment offense(s) and prior convictions from the judgment and sentence. Then,dates of legal significance (e.g., projected release dates, dates for parole hearings,good-time dates) are computed automatically.
Records office staff also enter warrants and detainers on a special screen (exhibitA–2). This screen is structured so that the type of detainer, authority, and charge arecoded and therefore can be automatically transferred to other screens, such as thecustody review screen.
168
Appendix A
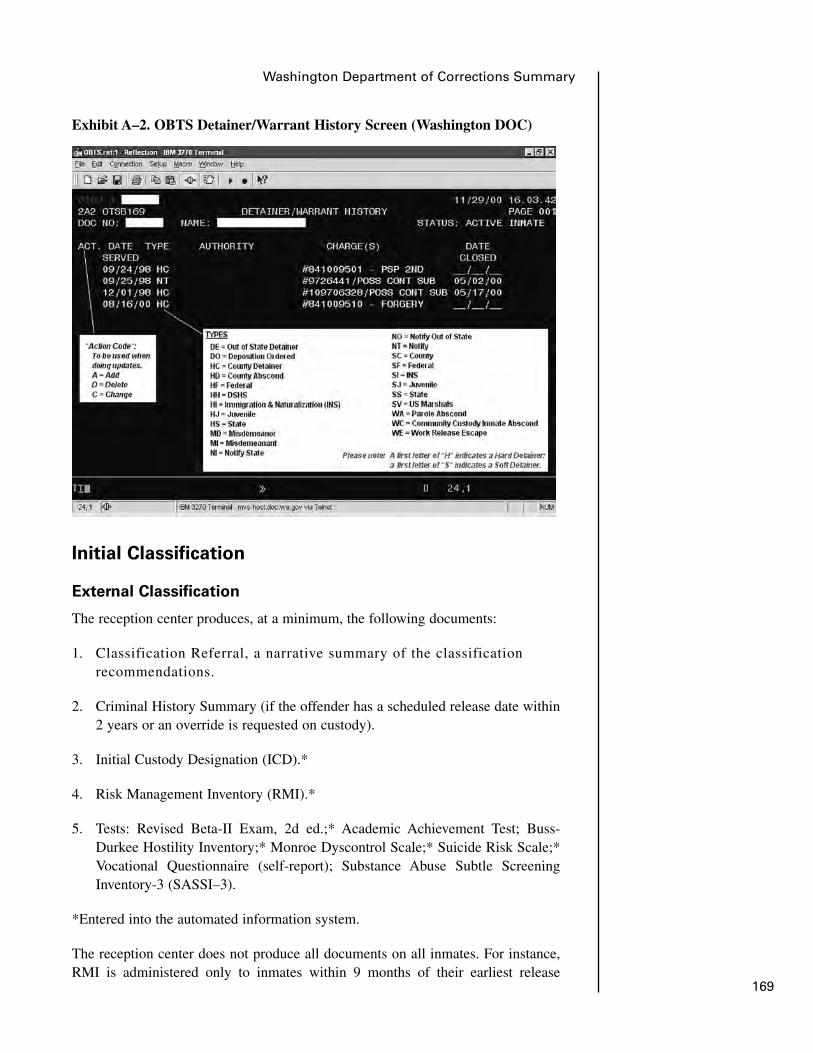
Initial Classification
External Classification
The reception center produces, at a minimum, the following documents:
1. Classification Referral, a narrative summary of the classificationrecommendations.
2. Criminal History Summary (if the offender has a scheduled release date within2 years or an override is requested on custody).
3. Initial Custody Designation (ICD).*
4. Risk Management Inventory (RMI).*
5. Tests: Revised Beta-II Exam, 2d ed.;* Academic Achievement Test; Buss-Durkee Hostility Inventory;* Monroe Dyscontrol Scale;* Suicide Risk Scale;*Vocational Questionnaire (self-report); Substance Abuse Subtle ScreeningInventory-3 (SASSI–3).
*Entered into the automated information system.
The reception center does not produce all documents on all inmates. For instance,RMI is administered only to inmates within 9 months of their earliest release
169
Washington Department of Corrections Summary
Exhibit A–2. OBTS Detainer/Warrant History Screen (Washington DOC)
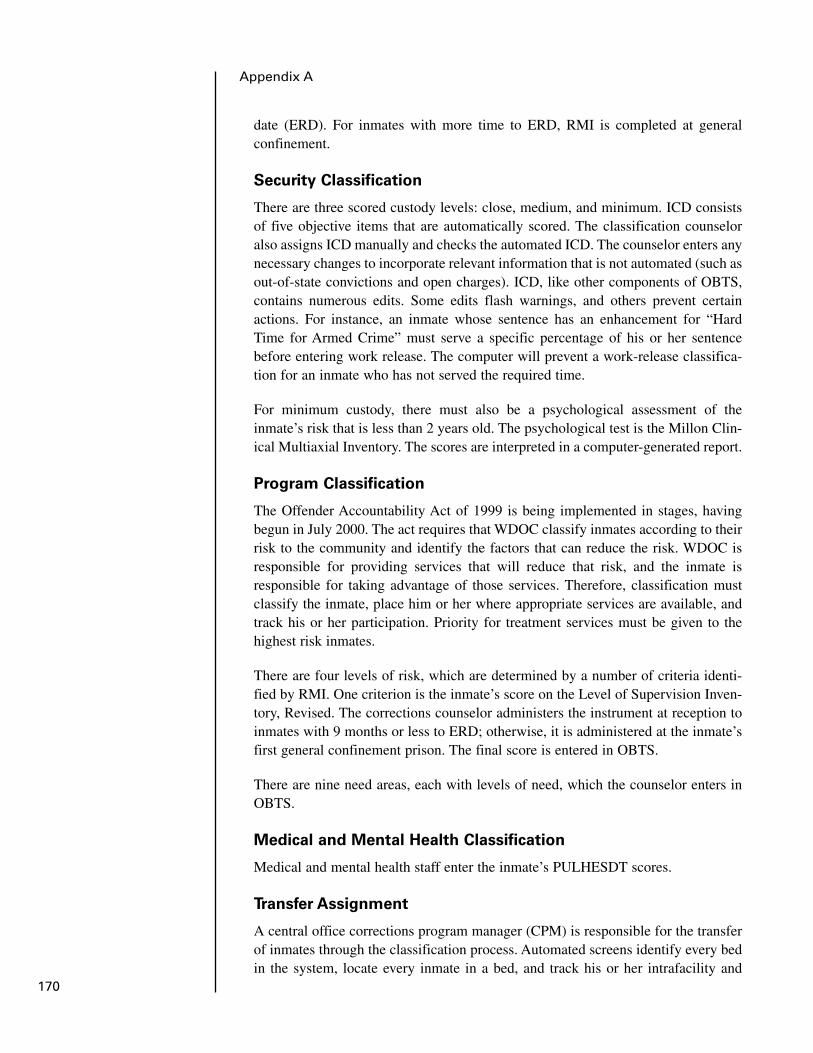
date (ERD). For inmates with more time to ERD, RMI is completed at generalconfinement.
Security Classification
There are three scored custody levels: close, medium, and minimum. ICD consistsof five objective items that are automatically scored. The classification counseloralso assigns ICD manually and checks the automated ICD. The counselor enters anynecessary changes to incorporate relevant information that is not automated (such asout-of-state convictions and open charges). ICD, like other components of OBTS,contains numerous edits. Some edits flash warnings, and others prevent certainactions. For instance, an inmate whose sentence has an enhancement for “HardTime for Armed Crime” must serve a specific percentage of his or her sentencebefore entering work release. The computer will prevent a work-release classifica-tion for an inmate who has not served the required time.
For minimum custody, there must also be a psychological assessment of theinmate’s risk that is less than 2 years old. The psychological test is the Millon Clin-ical Multiaxial Inventory. The scores are interpreted in a computer-generated report.
Program Classification
The Offender Accountability Act of 1999 is being implemented in stages, havingbegun in July 2000. The act requires that WDOC classify inmates according to theirrisk to the community and identify the factors that can reduce the risk. WDOC isresponsible for providing services that will reduce that risk, and the inmate isresponsible for taking advantage of those services. Therefore, classification mustclassify the inmate, place him or her where appropriate services are available, andtrack his or her participation. Priority for treatment services must be given to thehighest risk inmates.
There are four levels of risk, which are determined by a number of criteria identi-fied by RMI. One criterion is the inmate’s score on the Level of Supervision Inven-tory, Revised. The corrections counselor administers the instrument at reception toinmates with 9 months or less to ERD; otherwise, it is administered at the inmate’sfirst general confinement prison. The final score is entered in OBTS.
There are nine need areas, each with levels of need, which the counselor enters inOBTS.
Medical and Mental Health Classification
Medical and mental health staff enter the inmate’s PULHESDT scores.
Transfer Assignment
A central office corrections program manager (CPM) is responsible for the transferof inmates through the classification process. Automated screens identify every bedin the system, locate every inmate in a bed, and track his or her intrafacility and
170
Appendix A
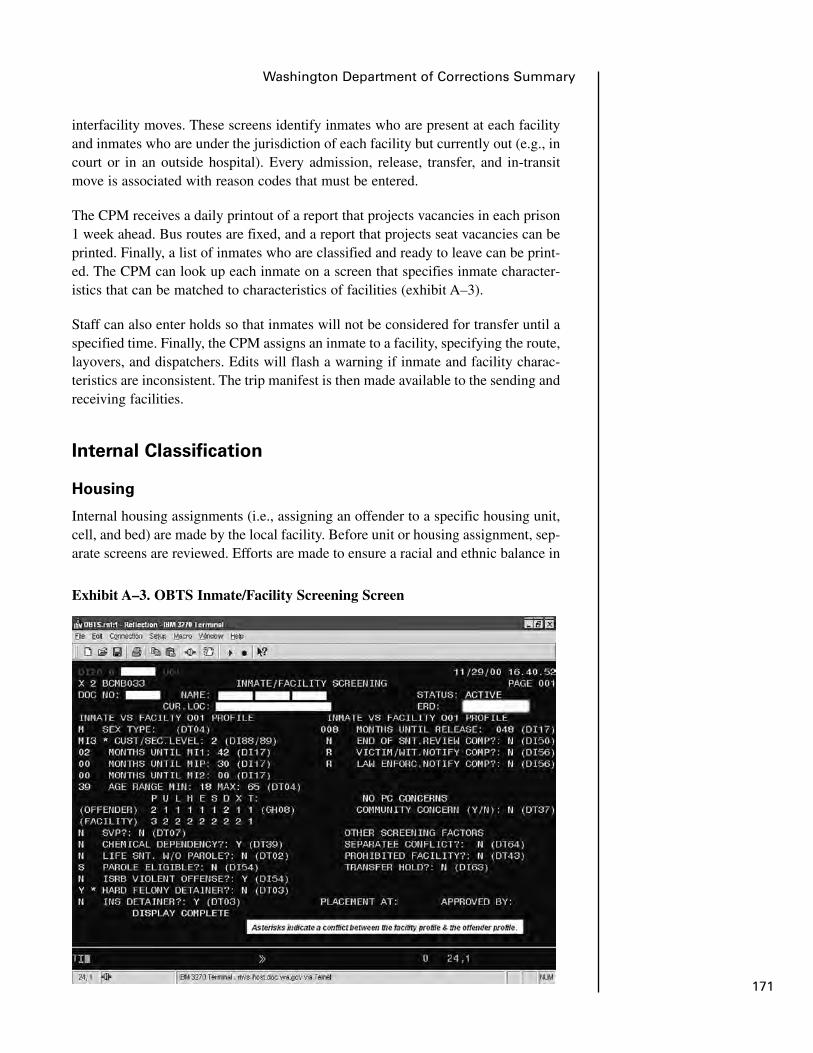
interfacility moves. These screens identify inmates who are present at each facilityand inmates who are under the jurisdiction of each facility but currently out (e.g., incourt or in an outside hospital). Every admission, release, transfer, and in-transitmove is associated with reason codes that must be entered.
The CPM receives a daily printout of a report that projects vacancies in each prison1 week ahead. Bus routes are fixed, and a report that projects seat vacancies can beprinted. Finally, a list of inmates who are classified and ready to leave can be print-ed. The CPM can look up each inmate on a screen that specifies inmate character-istics that can be matched to characteristics of facilities (exhibit A–3).
Staff can also enter holds so that inmates will not be considered for transfer until aspecified time. Finally, the CPM assigns an inmate to a facility, specifying the route,layovers, and dispatchers. Edits will flash a warning if inmate and facility charac-teristics are inconsistent. The trip manifest is then made available to the sending andreceiving facilities.
Internal Classification
Housing
Internal housing assignments (i.e., assigning an offender to a specific housing unit,cell, and bed) are made by the local facility. Before unit or housing assignment, sep-arate screens are reviewed. Efforts are made to ensure a racial and ethnic balance in
171
Washington Department of Corrections Summary
Exhibit A–3. OBTS Inmate/Facility Screening Screen
housing units. Unit staff work with facility records staff to determine the mostappropriate assignment, given the beds that are available.
Programs
The counselor identifies the inmate’s program needs in OBTS and in the inmate’sfile. A screen shows the vacancies in each program, and another screen shows a pro-gram profile, including the program start dates and schedule. The counselor submitsan automated program referral based on the inmate’s program needs and the avail-able programs. The inmate’s attendance and performance are entered in OBTS,where they can be tracked. The inmate’s legal dates are automatically adjusted, andprogram participation is entered.
Reclassification
Security reclassification occurs as needed and at least annually or semiannually,depending on an inmate’s time to ERD. The counselor initiates an automated clas-sification referral, which is approved by the unit team (consisting of counseling andcustody staff), then approved by a review committee and forwarded to the superin-tendent for final decision, unless the referral/reclassification is for communityrelease or maximum security or an override is involved. Minimum placement inwork release is voluntary. There is a custody review that has six items. Scoring isautomated, with the exception of points earned through program participation; thisitem must be scored manually by the counselor. Two items are based on ICD. Oneitem is based on disciplinary behavior. For each infraction, the automated discipli-nary system includes the date committed, the infraction, and the disposition. Oneitem is based on program participation, which is in OBTS. One item is based onactive detainers and warrants, which are also in OBTS.
Community Release
In this report, “community release” refers to a program that places an inmate in thecommunity during the period of incarceration, in contrast to a program that placesan inmate in the community after the period of incarceration (often, but not always,referred to as “parole”). If an inmate meets the custody criteria and timeframe forwork release, a community release plan packet is sent to the work-release centernear the inmate’s proposed residence. The packet contains a minimum of 11 docu-ments that either must be filled out by a counselor or must be copied. The centersends the packet back to the inmate’s facility, where the decision is entered inOBTS.
Movement into work release is managed by the CPM.
Reports
Case-processing reports. The following are examples of case-processing reports:
� Upcoming releases: The records office can print a list of releases for any timeperiod. The list indicates any special action that will need to be taken, such asvictim/witness notification.172
Appendix A
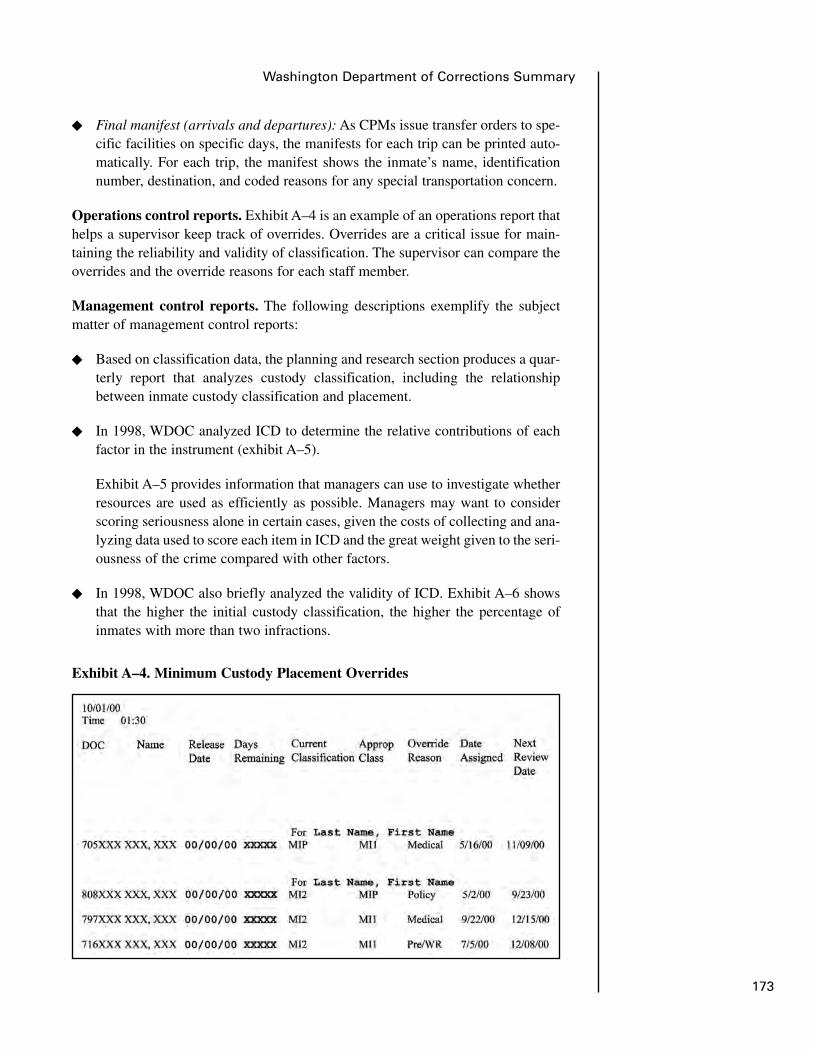
� Final manifest (arrivals and departures): As CPMs issue transfer orders to spe-cific facilities on specific days, the manifests for each trip can be printed auto-matically. For each trip, the manifest shows the inmate’s name, identificationnumber, destination, and coded reasons for any special transportation concern.
Operations control reports. Exhibit A–4 is an example of an operations report thathelps a supervisor keep track of overrides. Overrides are a critical issue for main-taining the reliability and validity of classification. The supervisor can compare theoverrides and the override reasons for each staff member.
Management control reports. The following descriptions exemplify the subjectmatter of management control reports:
� Based on classification data, the planning and research section produces a quar-terly report that analyzes custody classification, including the relationshipbetween inmate custody classification and placement.
� In 1998, WDOC analyzed ICD to determine the relative contributions of eachfactor in the instrument (exhibit A–5).
Exhibit A–5 provides information that managers can use to investigate whetherresources are used as efficiently as possible. Managers may want to considerscoring seriousness alone in certain cases, given the costs of collecting and ana-lyzing data used to score each item in ICD and the great weight given to the seri-ousness of the crime compared with other factors.
� In 1998, WDOC also briefly analyzed the validity of ICD. Exhibit A–6 showsthat the higher the initial custody classification, the higher the percentage ofinmates with more than two infractions.
173
Washington Department of Corrections Summary
Exhibit A–4. Minimum Custody Placement Overrides

Strategic planning reports. Annually, the state projects the total WDOC popula-tion for the next 10 years. Based on these totals and current classification practicesand data, WDOC projects the demand for the number of beds for the following clas-sifications: maximum security, close security, medium security, minimum security,prerelease, and work release.
174
Appendix A
Exhibit A–5. Contribution to Initial Custody Classification, by Factor:January 1, 1997, Through June 30, 1997
Note: Factors shown are those making the greatest contributions to initial custody classification.Source: Washington Department of Corrections.
Contributing Factor Contribution (%)
Seriousness of crime 64
Seriousness of crime and age 73
Seriousness of crime, age, and detainers 82
Exhibit A–6. WDOC Population, by Initial Custody Classification, Subse-quent Infractions, and Time to Second Infraction: 1996
Initial AllClassification Offenders n % 0–90 91–180 181–270 271–365
Close 700 75 11 23 23 19 10
Medium 1,099 45 4 27 11 5 2
Minimum 1,218 30 2 18 11 1 0
WDOC = Washington Department of Corrections*Number of days between initial classification and second infraction.Source: WDOC.
OffendersWith Two
Infractions Days to Second Infraction* (n)

175
Florida Department of CorrectionsBureau Chief for Classification and Central RecordsCorrectional Program Administrator (Administrator for Institutional
Classification Automation)2601 Blair Stone RoadTallahassee, FL 32399850–410–4365
Appendix B: Florida Department of CorrectionsSummary
General System Overview
The Florida prison system comprises 57 institutions, work/forestry camps, and roadprisons housing 71,253 inmates. Florida’s inmate management information system,which incorporates classification, began to take shape in 1982. That early classifi-cation procedure was replaced in 1992 with a validated system. The state replacedthat system with its new Risk and Needs System in 1999 and its Custody Assess-ment and Reclassification System (CARS) in 2000.
Florida’s classification and related inmate management applications are principallybased on its mainframe-driven Offender-Based Information System (OBIS), whichis accessible by each facility. The two classification applications running underOBIS are CARS and the Risk and Needs System. OBIS is supplemented by mini-mainframe systems in each of the five reception and intake centers. The principalapplication is the Computer-Assisted Reception Process (CARP). All three classifi-cation applications are integrated to facilitate data sharing and lookups and to mini-mize redundant data entry. Future plans call for additional local area network (LAN)and wide area network (WAN) personal computer (PC)-based applications such asdrug testing, enhanced visitation tracking, implementing drug interdiction, andidentifying gang activity to augment and integrate with the current systems. Plansalso call for these PC-based applications to incorporate artificial intelligenceengines to identify gang, drug, and contraband patterns throughout the entire prisonsystem and overlay color-coded analysis on global positioning system (GPS) mapsof the system.
System Highlights
CARP
Classification staff in each of the reception centers use CARP. It inventories, in part,information about commitment, demographics, and criminal background to aid theclassification officer in the initial development of an inmate transition plan and todetermine any critical case management factors (e.g., high-profile case, escape risk,detainers, high violence risk). A comprehensive inventory of prior arrests and con-victions is entered for each new inmate, including offense date, agency, offense, anddisposition. Subsequent admissions of the same offender require a complete reviewand update of the previously entered criminal history. Data are passed betweenCARP and OBIS in both real time and batch form. CARP inventories variousassessed needs, including a substance abuse priority determination that prioritizesreferral to available treatment programs (exhibit B–1). CARP’s main menu compo-nents include inmate identification, assessment results (education, special educa-tion, substance abuse, vocational), criminal background, personal background, caseand inmate management, and health services.
177
Florida Department of Corrections Summary
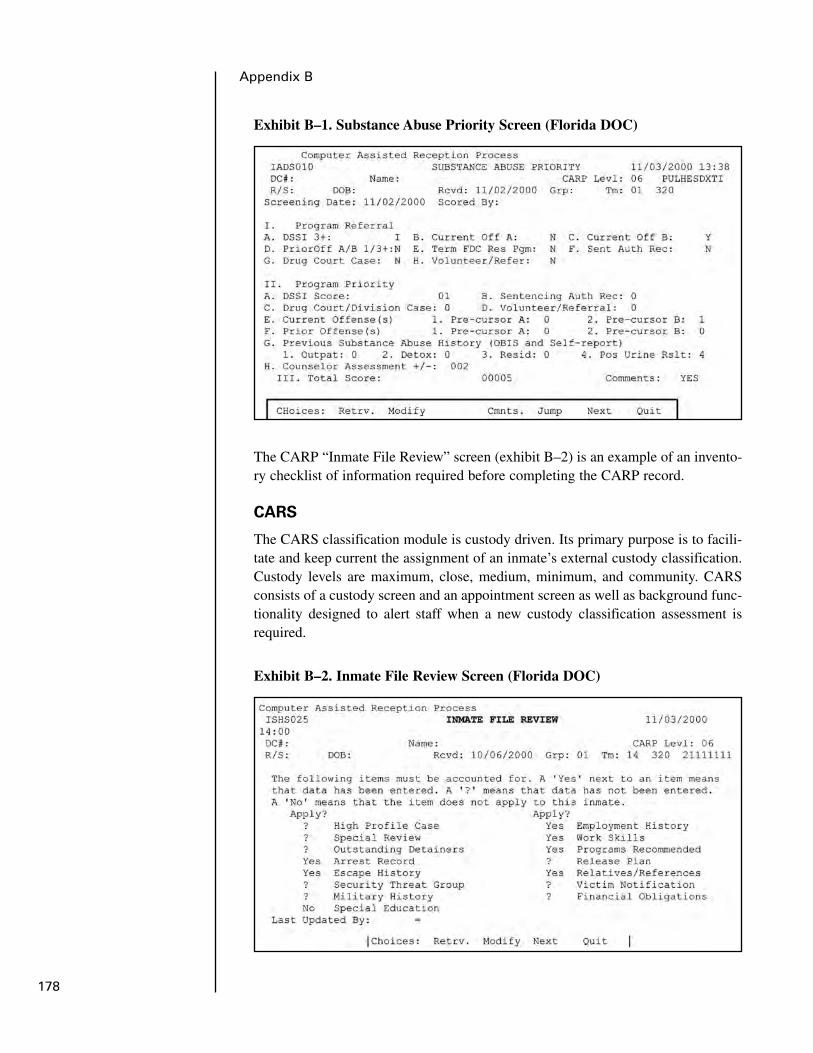
The CARP “Inmate File Review” screen (exhibit B–2) is an example of an invento-ry checklist of information required before completing the CARP record.
CARS
The CARS classification module is custody driven. Its primary purpose is to facili-tate and keep current the assignment of an inmate’s external custody classification.Custody levels are maximum, close, medium, minimum, and community. CARSconsists of a custody screen and an appointment screen as well as background func-tionality designed to alert staff when a new custody classification assessment isrequired.
178
Appendix B
Exhibit B–1. Substance Abuse Priority Screen (Florida DOC)
Exhibit B–2. Inmate File Review Screen (Florida DOC)

The classification officer completes the “Custody Classification” screen (exhibitB–3). Nine fields are completed by a classification officer, four fields are complet-ed by a classification supervisor and institutional classification team (ICT), andnumerous other fields are filled and scored automatically by the system. Based onnew commitment information in conjunction with historical inmate data, the systemautomatically suggests a custody level. The classification officer, supervisor, or ICTcan then accept or modify the suggested custody level based on aggravating or mit-igating circumstances.
This screen is used repeatedly throughout the inmate’s incarceration. The first clas-sification type is “Initial.” All subsequent custody decisions are then coded as“Reclass” (fifth line, “type” field). Each time this screen is used to change or reviewthe inmate’s custody, a log of the previous custody status is created, enabling staffto review the inmate’s running custody classification history (exhibit B–4).
The fourth line in exhibit B–3 contains the “custody processing status” and “tenta-tive release date” (TRD) fields. “Processing status” refers to a particular point in thecustody assignment process from the beginning of an initial custody classificationto final approval (e.g., initial classification, reclassification 90-day review, no mod-ification of custody, high-risk modification, special medical needs modification).The system design also incorporates several automated decision rules in itsfunctionality.
The next section of this screen (exhibit B–3), “Status Custody,” automatically pop-ulates items 1, 2, and 3. These items identify an inmate as being placed at a partic-ular custody or, because of an inmate’s status, do not allow the inmate to fall belowa particular custody regardless of any classification score. “High risk” refers to adesignation of certain categories of inmates who will remain at no less than closecustody. The system keeps track of numerous department policy decision rules and
179
Florida Department of Corrections Summary
Exhibit B–3. Custody Classification Screen (Florida DOC)

automatically scores them if they apply to that inmate. Examples of policy decisionrules include classifications of inmates currently under sentence of death, who willalways be classified as maximum custody (maximum high risk). The classification“close status, high risk” includes inmates formerly under a death sentence, inmatesserving a life sentence, inmates not within 15 years of release, some sex offenders,and violent offenders. “Medium status” refers to felons, inmates with lower levelescape histories, lower level sex offenders, and inmates scheduled for release with-in 10–15 years.
Item 5 on the “Custody Classification” screen (exhibit B–3) refers to program fac-tors. These items are designed to reward with negative points those inmates whomeet certain stability factors and complete specified programs. Unsatisfactorybehavior is sanctioned with positive points. The program automatically brings upthe items and scores all but two automatically, using ongoing inmate informationentered in the system over time. If the inmate does not have a computer-generatedmaximum or close status (computed policy decision rules), the program adds up thepoints and populates the “total score” field. If the inmate has a score of 10 or lower,the program automatically calculates whether the inmate is eligible for a commu-nity residential facility (CRF) (e.g., within so much time to release date, opendetainers, disciplinary in last 90 days, inmate serving his fourth or higher commit-ment). If any items are computed as “yes,” the program sets the “suggested custody”field to “Minimum” and the “CRF Eligible” flag to “no.” If the suggested custodyis minimum, the item(s) triggering CRF ineligibility are listed in the “RSN min cus-tody” field. Suggested custody is the custody recommended by the program basedon the status or numerical score of the inmate. The classification officer can thenmodify the automated suggested custody level, which is then reviewed by the clas-sification supervisor, the ICT, and the state classification office (SCO). The classi-fication officer can then modify the automated suggested custody level, which isthen reviewed by the classification supervisor, ICT, and SCO.
180
Appendix B
Exhibit B–4. Classification Contact Log Screen (Florida DOC)
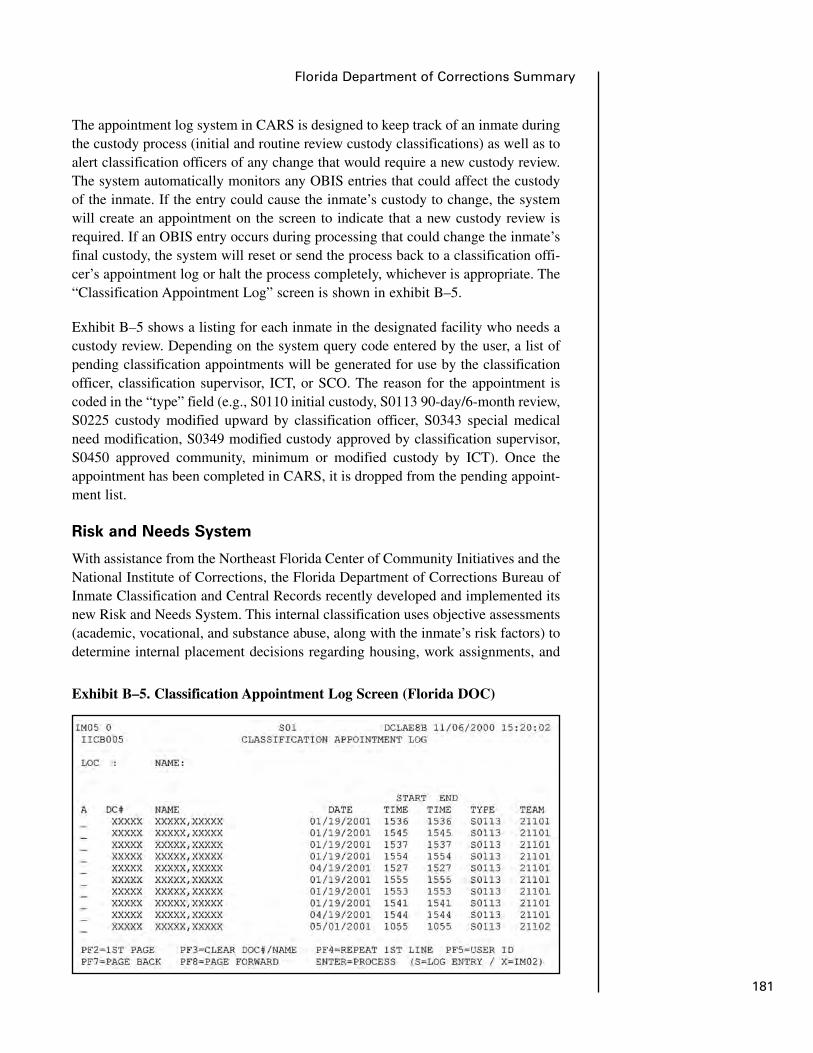
The appointment log system in CARS is designed to keep track of an inmate duringthe custody process (initial and routine review custody classifications) as well as toalert classification officers of any change that would require a new custody review.The system automatically monitors any OBIS entries that could affect the custodyof the inmate. If the entry could cause the inmate’s custody to change, the systemwill create an appointment on the screen to indicate that a new custody review isrequired. If an OBIS entry occurs during processing that could change the inmate’sfinal custody, the system will reset or send the process back to a classification offi-cer’s appointment log or halt the process completely, whichever is appropriate. The“Classification Appointment Log” screen is shown in exhibit B–5.
Exhibit B–5 shows a listing for each inmate in the designated facility who needs acustody review. Depending on the system query code entered by the user, a list ofpending classification appointments will be generated for use by the classificationofficer, classification supervisor, ICT, or SCO. The reason for the appointment iscoded in the “type” field (e.g., S0110 initial custody, S0113 90-day/6-month review,S0225 custody modified upward by classification officer, S0343 special medicalneed modification, S0349 modified custody approved by classification supervisor,S0450 approved community, minimum or modified custody by ICT). Once theappointment has been completed in CARS, it is dropped from the pending appoint-ment list.
Risk and Needs System
With assistance from the Northeast Florida Center of Community Initiatives and theNational Institute of Corrections, the Florida Department of Corrections Bureau ofInmate Classification and Central Records recently developed and implemented itsnew Risk and Needs System. This internal classification uses objective assessments(academic, vocational, and substance abuse, along with the inmate’s risk factors) todetermine internal placement decisions regarding housing, work assignments, and
181
Florida Department of Corrections Summary
Exhibit B–5. Classification Appointment Log Screen (Florida DOC)

programs. Completing the Risk and Needs System requires the collection of infor-mation through a face-to-face interview with the inmate and through official datapreviously entered in OBIS. The information compiled and scored in the Risk andNeeds System serves as the basis for the Inmate Management Plan.
Data gathering and automation in the Risk and Needs System are broken down intofive sections:
1. Internal management: Gang or hate group membership and determination ofany knowledge of other inmates involved in gang or hate group activity.
2. Outside influences: Escape risk associated with personal/family crises and situ-ational factors.
3. Attitude and motivation: General interest in and motivation to participate intreatment programs and work assignments in preparation of the Inmate Man-agement Plan.
4. Internal management/risk assessment: Overall assessment of internal risk basedon current violence and the inmate’s responses to and demeanor regarding theprevious three sections. The interviewer (classification officer) uses the AdultInternal Management System (AIMS) personality types criteria as a basis forscoring the inmate.
5. Restructuring potential (RP): Once data for the previous four sections havebeen entered, the program automatically scores the inmate’s RP based on allpertinent data contained in OBIS. The RP score relies heavily on attitude, moti-vation, and factors suggested as potential indicators for prioritizing the inmate’sprogram placement.
The following are screen shots of the Risk and Needs System. Gang data (exhibitB–6) inventories both initial and subsequent information about membership in asecurity threat group (STG). Data entry coding (A, B, C, etc.) categorizes the infor-mation (e.g., A = inmate indicated membership; B = inmate allies with a gang; C =enemies of inmate’s gang).
Exhibit B–7 shows the “Offender Management Comments” screen pertaining togang affiliation. This screen may be used to enter comments at various stages ofinmate processing.
The following two data entry screens in the Risk and Needs System inventory andautomatically score outside influences, attitude and motivation, internal manage-ment, and RP. In exhibit B–8, outside influences are entered using values A throughC or D for each item. The corresponding point value (0, 1, 2, or 3) is then enteredby the system. The program then automatically sums this section.
Section III of the “Inmate Risk and Needs Assessment” screen (part 2) (exhibit B–9)inventories the inmate’s attitude toward working and participating in programs and
182
Appendix B
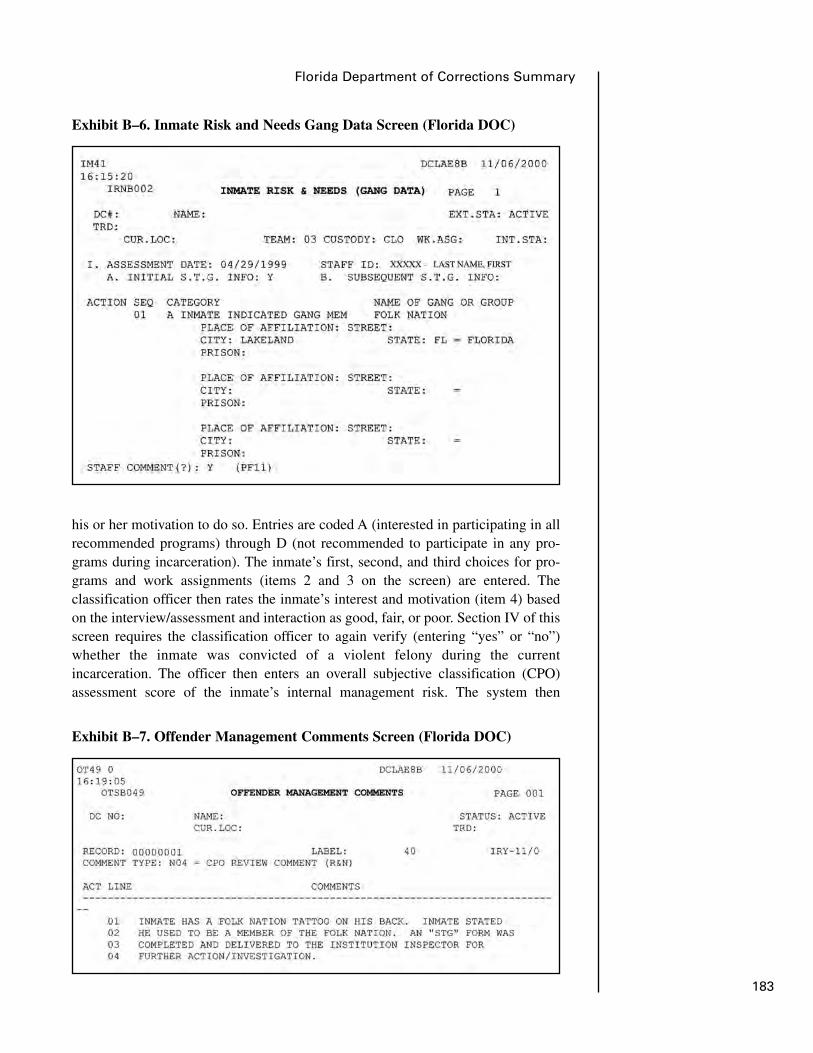
Exhibit B–7. Offender Management Comments Screen (Florida DOC)
his or her motivation to do so. Entries are coded A (interested in participating in allrecommended programs) through D (not recommended to participate in any pro-grams during incarceration). The inmate’s first, second, and third choices for pro-grams and work assignments (items 2 and 3 on the screen) are entered. Theclassification officer then rates the inmate’s interest and motivation (item 4) basedon the interview/assessment and interaction as good, fair, or poor. Section IV of thisscreen requires the classification officer to again verify (entering “yes” or “no”)whether the inmate was convicted of a violent felony during the currentincarceration. The officer then enters an overall subjective classification (CPO)assessment score of the inmate’s internal management risk. The system then
183
Florida Department of Corrections Summary
Exhibit B–6. Inmate Risk and Needs Gang Data Screen (Florida DOC)
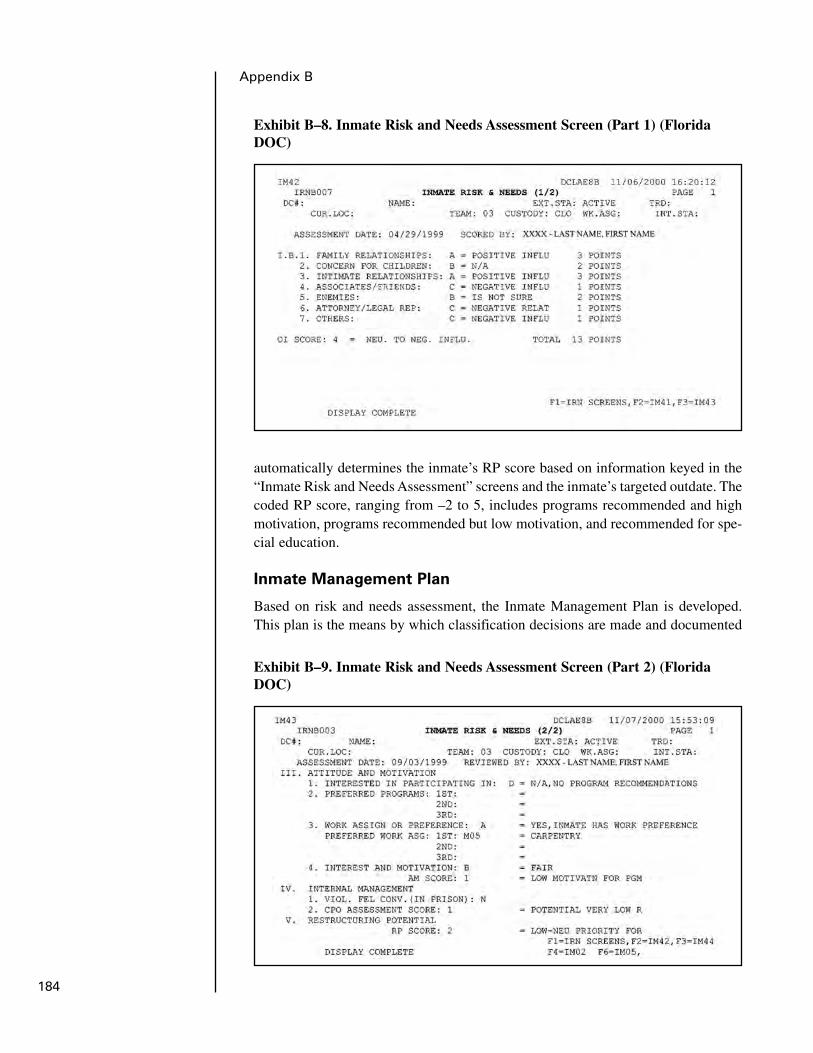
automatically determines the inmate’s RP score based on information keyed in the“Inmate Risk and Needs Assessment” screens and the inmate’s targeted outdate. Thecoded RP score, ranging from –2 to 5, includes programs recommended and highmotivation, programs recommended but low motivation, and recommended for spe-cial education.
Inmate Management Plan
Based on risk and needs assessment, the Inmate Management Plan is developed.This plan is the means by which classification decisions are made and documented
184
Appendix B
Exhibit B–8. Inmate Risk and Needs Assessment Screen (Part 1) (FloridaDOC)
Exhibit B–9. Inmate Risk and Needs Assessment Screen (Part 2) (FloridaDOC)
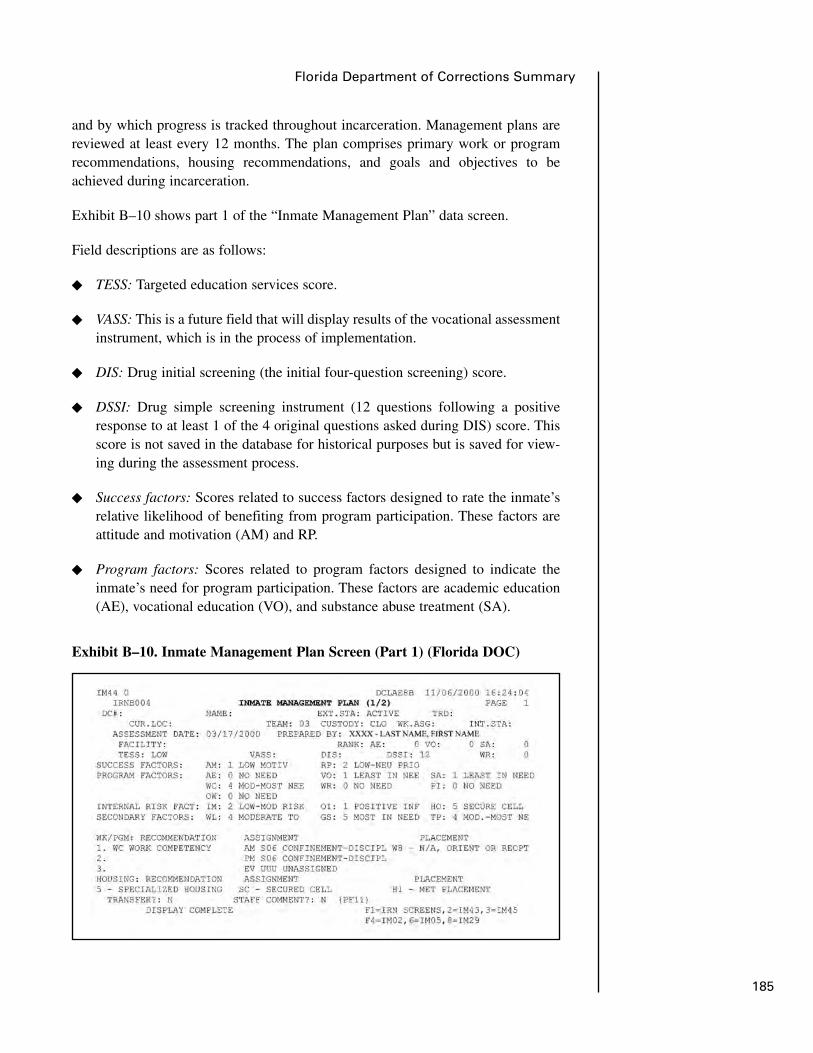
and by which progress is tracked throughout incarceration. Management plans arereviewed at least every 12 months. The plan comprises primary work or programrecommendations, housing recommendations, and goals and objectives to beachieved during incarceration.
Exhibit B–10 shows part 1 of the “Inmate Management Plan” data screen.
Field descriptions are as follows:
� TESS: Targeted education services score.
� VASS: This is a future field that will display results of the vocational assessmentinstrument, which is in the process of implementation.
� DIS: Drug initial screening (the initial four-question screening) score.
� DSSI: Drug simple screening instrument (12 questions following a positiveresponse to at least 1 of the 4 original questions asked during DIS) score. Thisscore is not saved in the database for historical purposes but is saved for view-ing during the assessment process.
� Success factors: Scores related to success factors designed to rate the inmate’srelative likelihood of benefiting from program participation. These factors areattitude and motivation (AM) and RP.
� Program factors: Scores related to program factors designed to indicate theinmate’s need for program participation. These factors are academic education(AE), vocational education (VO), and substance abuse treatment (SA).
185
Florida Department of Corrections Summary
Exhibit B–10. Inmate Management Plan Screen (Part 1) (Florida DOC)
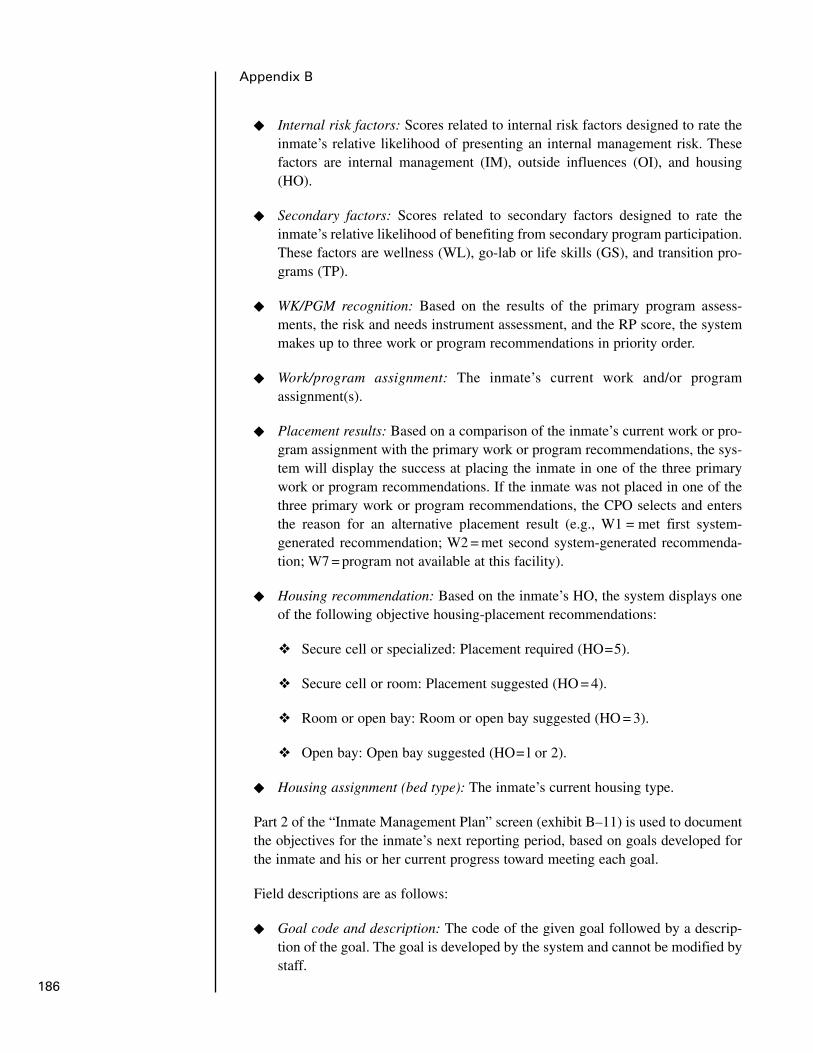
� Internal risk factors: Scores related to internal risk factors designed to rate theinmate’s relative likelihood of presenting an internal management risk. Thesefactors are internal management (IM), outside influences (OI), and housing(HO).
� Secondary factors: Scores related to secondary factors designed to rate theinmate’s relative likelihood of benefiting from secondary program participation.These factors are wellness (WL), go-lab or life skills (GS), and transition pro-grams (TP).
� WK/PGM recognition: Based on the results of the primary program assess-ments, the risk and needs instrument assessment, and the RP score, the systemmakes up to three work or program recommendations in priority order.
� Work/program assignment: The inmate’s current work and/or programassignment(s).
� Placement results: Based on a comparison of the inmate’s current work or pro-gram assignment with the primary work or program recommendations, the sys-tem will display the success at placing the inmate in one of the three primarywork or program recommendations. If the inmate was not placed in one of thethree primary work or program recommendations, the CPO selects and entersthe reason for an alternative placement result (e.g., W1 = met first system-generated recommendation; W2 = met second system-generated recommenda-tion; W7 = program not available at this facility).
� Housing recommendation: Based on the inmate’s HO, the system displays oneof the following objective housing-placement recommendations:
❖ Secure cell or specialized: Placement required (HO=5).
❖ Secure cell or room: Placement suggested (HO = 4).
❖ Room or open bay: Room or open bay suggested (HO = 3).
❖ Open bay: Open bay suggested (HO= l or 2).
� Housing assignment (bed type): The inmate’s current housing type.
Part 2 of the “Inmate Management Plan” screen (exhibit B–11) is used to documentthe objectives for the inmate’s next reporting period, based on goals developed forthe inmate and his or her current progress toward meeting each goal.
Field descriptions are as follows:
� Goal code and description: The code of the given goal followed by a descrip-tion of the goal. The goal is developed by the system and cannot be modified bystaff.
186
Appendix B
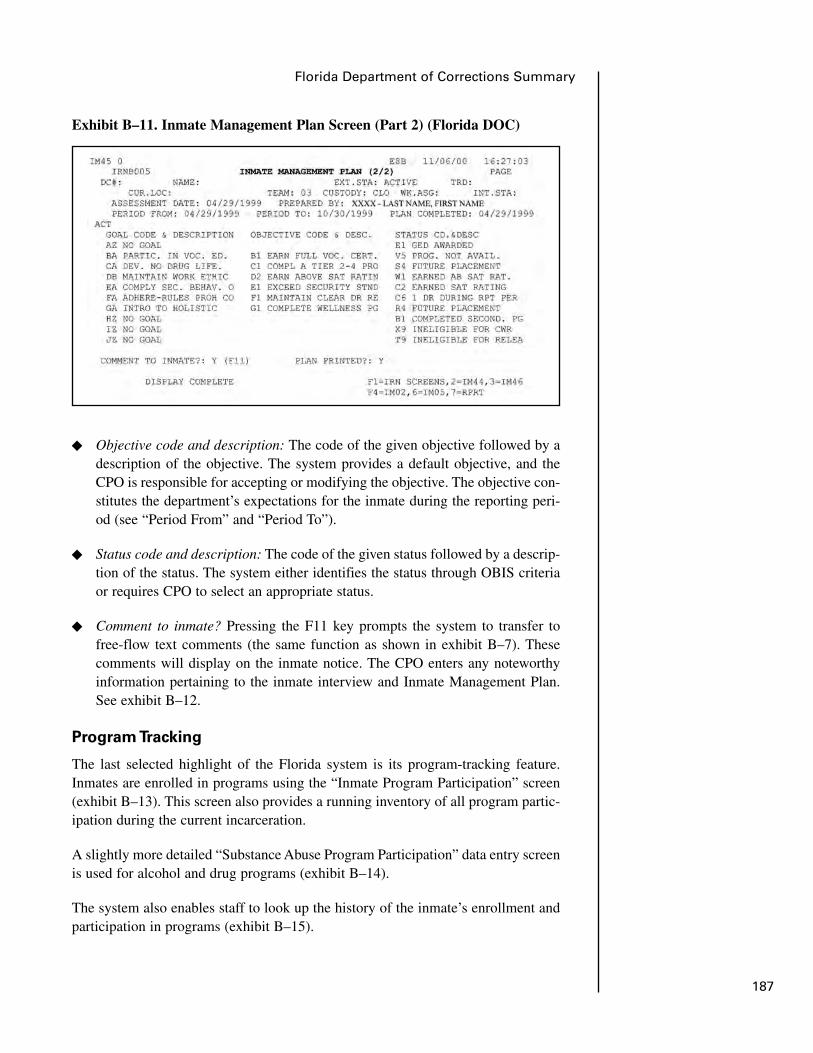
� Objective code and description: The code of the given objective followed by adescription of the objective. The system provides a default objective, and theCPO is responsible for accepting or modifying the objective. The objective con-stitutes the department’s expectations for the inmate during the reporting peri-od (see “Period From” and “Period To”).
� Status code and description: The code of the given status followed by a descrip-tion of the status. The system either identifies the status through OBIS criteriaor requires CPO to select an appropriate status.
� Comment to inmate? Pressing the F11 key prompts the system to transfer tofree-flow text comments (the same function as shown in exhibit B–7). Thesecomments will display on the inmate notice. The CPO enters any noteworthyinformation pertaining to the inmate interview and Inmate Management Plan.See exhibit B–12.
Program Tracking
The last selected highlight of the Florida system is its program-tracking feature.Inmates are enrolled in programs using the “Inmate Program Participation” screen(exhibit B–13). This screen also provides a running inventory of all program partic-ipation during the current incarceration.
A slightly more detailed “Substance Abuse Program Participation” data entry screenis used for alcohol and drug programs (exhibit B–14).
The system also enables staff to look up the history of the inmate’s enrollment andparticipation in programs (exhibit B–15).
187
Florida Department of Corrections Summary
Exhibit B–11. Inmate Management Plan Screen (Part 2) (Florida DOC)
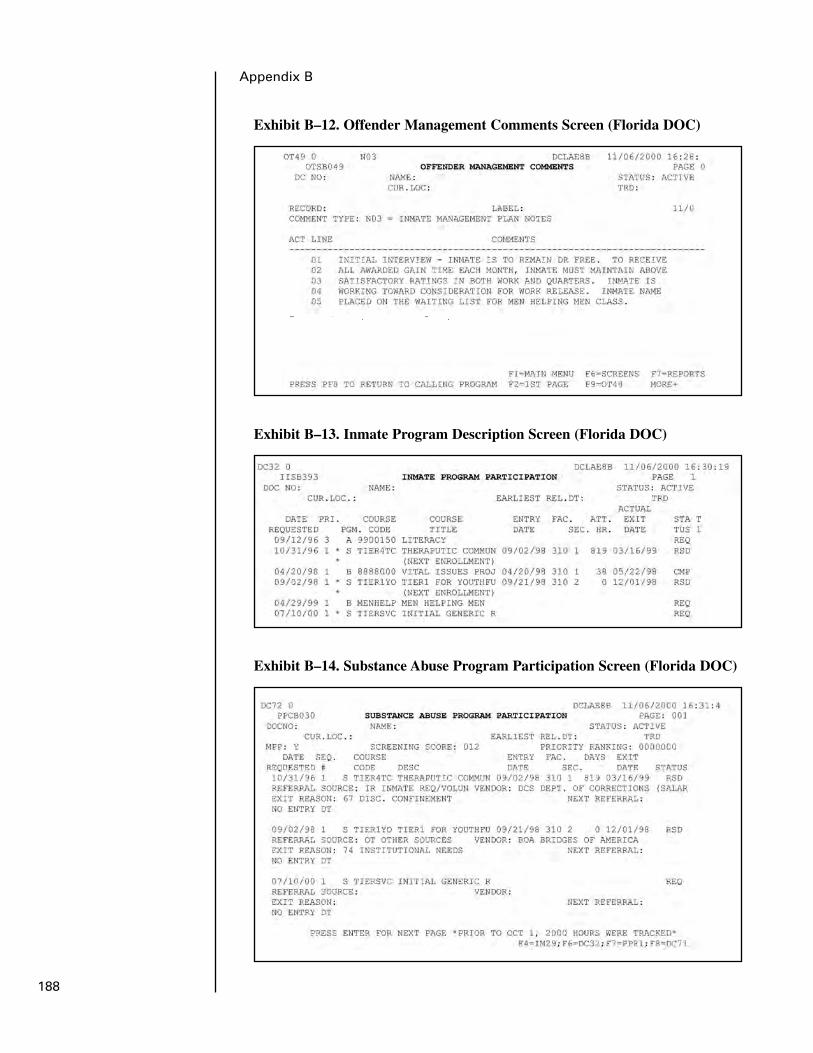
188
Appendix B
Exhibit B–12. Offender Management Comments Screen (Florida DOC)
Exhibit B–13. Inmate Program Description Screen (Florida DOC)
Exhibit B–14. Substance Abuse Program Participation Screen (Florida DOC)

189
Florida Department of Corrections Summary
Exhibit B–15. Program Enrollment by Inmate Screen (Florida DOC)

191
New Jersey Department of CorrectionsDirector, Office of Policy and PlanningAssistant Chief, Bureau of Correctional Information and Classification ServicesP.O. Box 863Trenton, NJ 08625609–984–4578
Appendix C: New JerseyDepartment of CorrectionsSummary

General System Overview
The New Jersey prison system comprises 14 main facilities and approximately30,100 inmates. The New Jersey Department of Corrections (NJDOC) has recentlybeen converting its inmate management system, with phase 1 of the project com-pleted. The old system comprised two major systems: (1) Offender-Based Correc-tional Information System (OBCIS), which was a mainframe system that trackedoffender identification, demographics, characteristics and offender data from intaketo release from parole; and (2) a System 36 Correctional Management InformationSystem (CMIS), which provided detailed incarceration information, including sen-tence tracking, disciplines, and time credits but was not Y2K compliant.
With the completion of phase 1 of the system upgrade, expedited by the need tosolve the Y2K problem, the System 36 CMIS was replaced in November 1999 bythe wide area network/local area network-based (WAN/LAN-based) iTAG system,a commercial inmate-management package created by Syscon Justice Systems.Phase 2 calls for the replacement of OBCIS in 3–5 years. The new iTAG inmate-processing functions include ID and security, classification, housing/movement,release, sentencing, and transportation.
In addition to the main inmate management system components, OBCIS and theiTAG system, New Jersey’s system includes four commercial personal computer(PC)/LAN system modules: Health Services, provided by Medical Logic; CustodyOfficer Scheduling, provided by Interpro; and Oracle Human Resources and Train-ing Administration and Document Imaging, provided by FileNet. These four inmatemanagement system components, along with Inmate Financials, were linked togeth-er by Venture Technology, a systems integrator. These five systems constitute theoverall DOC management information system (DOCMIS).
A unique inmate reception/processing feature in New Jersey is the interaction withthe state’s county jails. Identification teams go to the county jails on aweekly/biweekly basis. Before the inmate arrives at the Central Reception andAssignment Facility (CRAF), the identification officer visits the county jail to inter-view, photograph, and fingerprint the inmate. The identification officer interviewsthe inmate to acquire basic identifying information. The identification officer alsoreceives all court documents. The paperwork is returned to CRAF the same day, andthe data staff enter the information into the iTAG system. At this time, a bookingnumber is also assigned. A classification file is created and kept in the county filesuntil the inmate is either transferred to CRAF or released from the county jail.
System Highlights
A primary feature of the iTAG inmate management system design is the graphicaluser interface, PC-based system that operates in a Microsoft Windows environmentand uses a single relational database. The system offers a good example of thenewer, “friendlier” point-and-click interfaces mentioned previously in this manual.
193
New Jersey Department of Corrections Summary
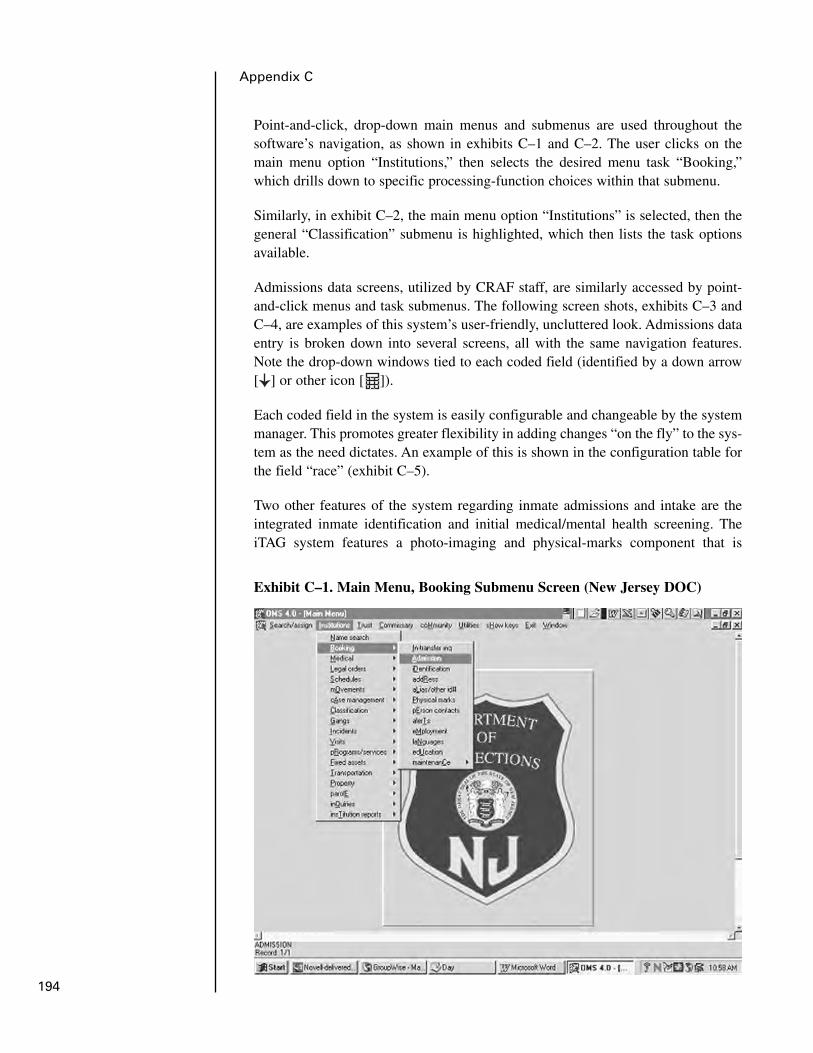
Point-and-click, drop-down main menus and submenus are used throughout thesoftware’s navigation, as shown in exhibits C–1 and C–2. The user clicks on themain menu option “Institutions,” then selects the desired menu task “Booking,”which drills down to specific processing-function choices within that submenu.
Similarly, in exhibit C–2, the main menu option “Institutions” is selected, then thegeneral “Classification” submenu is highlighted, which then lists the task optionsavailable.
Admissions data screens, utilized by CRAF staff, are similarly accessed by point-and-click menus and task submenus. The following screen shots, exhibits C–3 andC–4, are examples of this system’s user-friendly, uncluttered look. Admissions dataentry is broken down into several screens, all with the same navigation features.Note the drop-down windows tied to each coded field (identified by a down arrow[ ] or other icon [ ]).
Each coded field in the system is easily configurable and changeable by the systemmanager. This promotes greater flexibility in adding changes “on the fly” to the sys-tem as the need dictates. An example of this is shown in the configuration table forthe field “race” (exhibit C–5).
Two other features of the system regarding inmate admissions and intake are theintegrated inmate identification and initial medical/mental health screening. TheiTAG system features a photo-imaging and physical-marks component that is
194
Appendix C
Exhibit C–1. Main Menu, Booking Submenu Screen (New Jersey DOC)

195
New Jersey Department of Corrections Summary
Exhibit C–2. Main Menu, Classification Submenu Screen (New Jersey DOC)
Exhibit C–3. Booking Assign Offender Demographics Screen (New JerseyDOC)
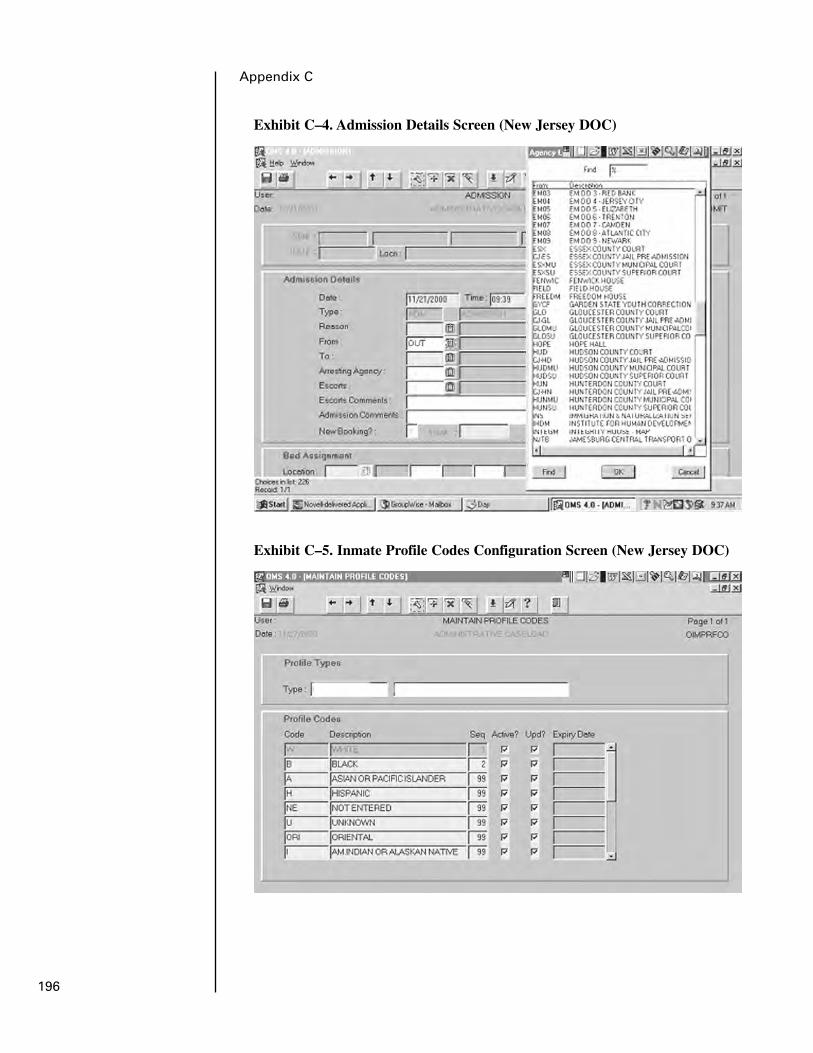
196
Appendix C
Exhibit C–4. Admission Details Screen (New Jersey DOC)
Exhibit C–5. Inmate Profile Codes Configuration Screen (New Jersey DOC)
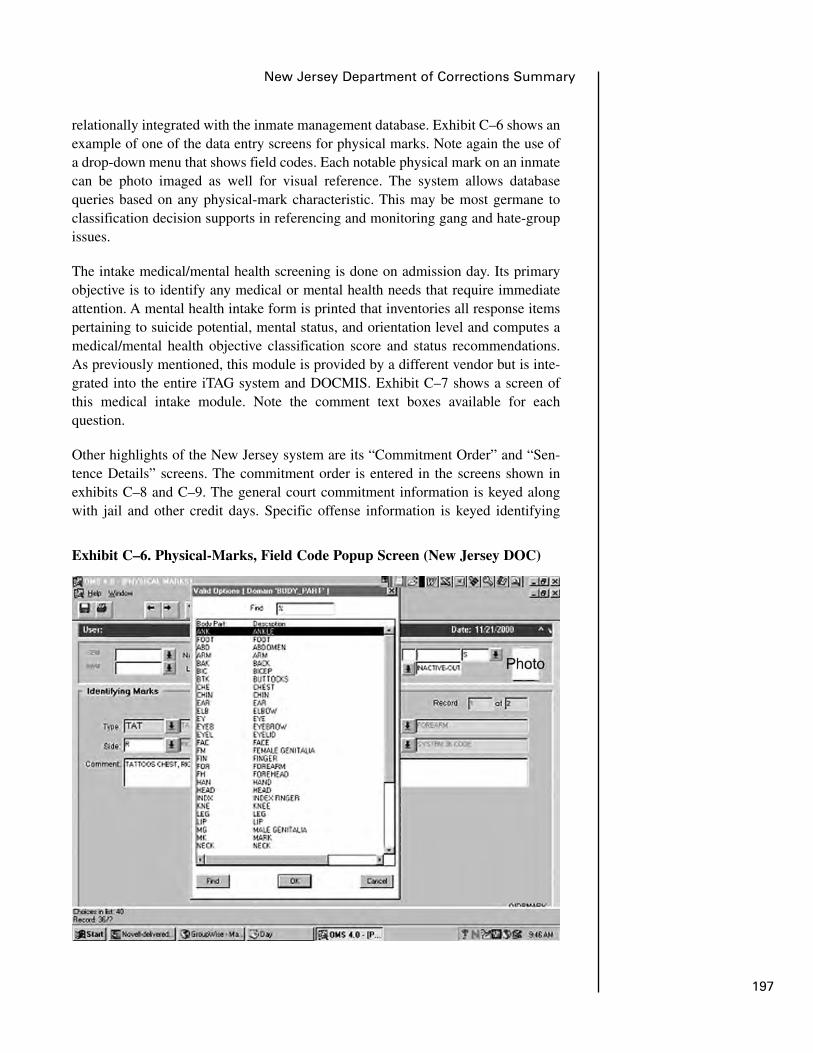
relationally integrated with the inmate management database. Exhibit C–6 shows anexample of one of the data entry screens for physical marks. Note again the use ofa drop-down menu that shows field codes. Each notable physical mark on an inmatecan be photo imaged as well for visual reference. The system allows databasequeries based on any physical-mark characteristic. This may be most germane toclassification decision supports in referencing and monitoring gang and hate-groupissues.
The intake medical/mental health screening is done on admission day. Its primaryobjective is to identify any medical or mental health needs that require immediateattention. A mental health intake form is printed that inventories all response itemspertaining to suicide potential, mental status, and orientation level and computes amedical/mental health objective classification score and status recommendations.As previously mentioned, this module is provided by a different vendor but is inte-grated into the entire iTAG system and DOCMIS. Exhibit C–7 shows a screen ofthis medical intake module. Note the comment text boxes available for eachquestion.
Other highlights of the New Jersey system are its “Commitment Order” and “Sen-tence Details” screens. The commitment order is entered in the screens shown inexhibits C–8 and C–9. The general court commitment information is keyed alongwith jail and other credit days. Specific offense information is keyed identifying
197
New Jersey Department of Corrections Summary
Exhibit C–6. Physical-Marks, Field Code Popup Screen (New Jersey DOC)
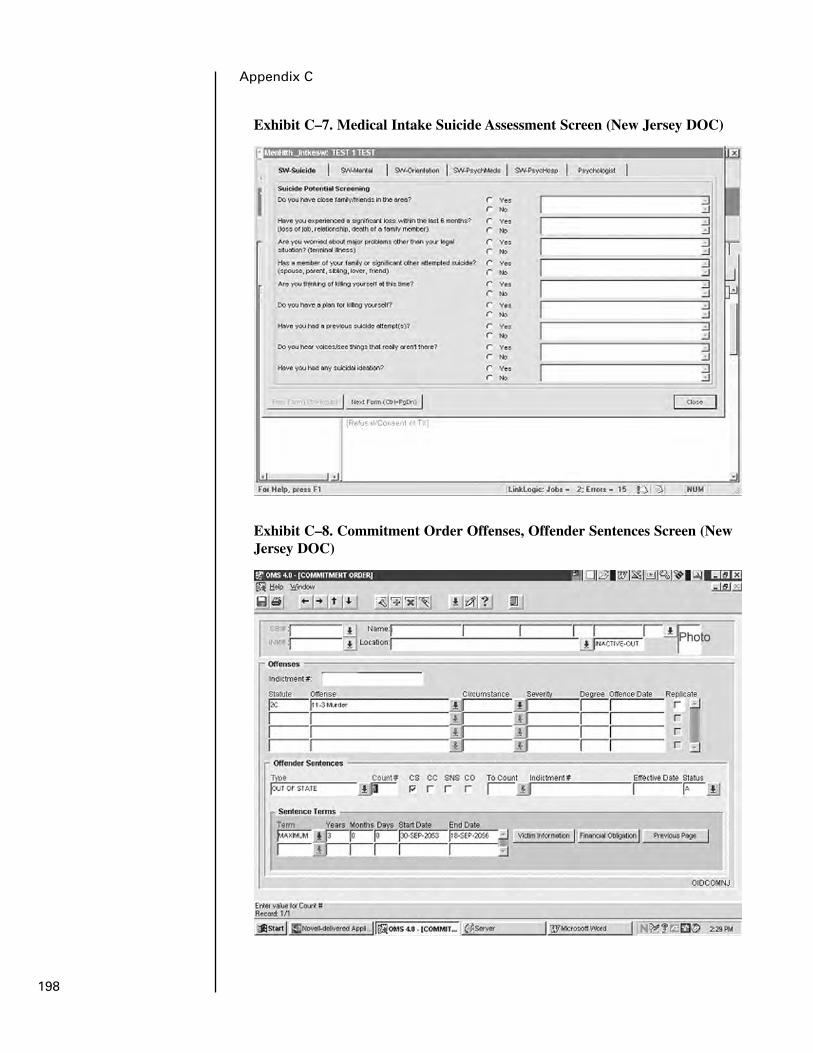
198
Appendix C
Exhibit C–7. Medical Intake Suicide Assessment Screen (New Jersey DOC)
Exhibit C–8. Commitment Order Offenses, Offender Sentences Screen (NewJersey DOC)
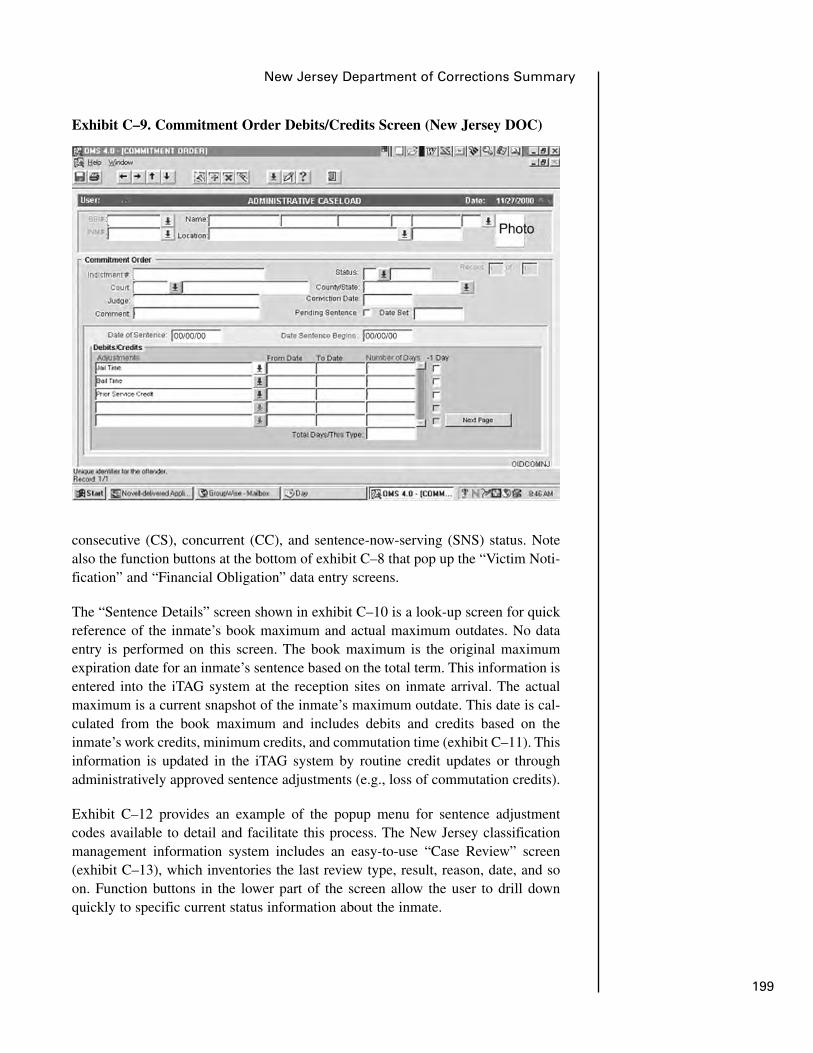
199
New Jersey Department of Corrections Summary
Exhibit C–9. Commitment Order Debits/Credits Screen (New Jersey DOC)
consecutive (CS), concurrent (CC), and sentence-now-serving (SNS) status. Notealso the function buttons at the bottom of exhibit C–8 that pop up the “Victim Noti-fication” and “Financial Obligation” data entry screens.
The “Sentence Details” screen shown in exhibit C–10 is a look-up screen for quickreference of the inmate’s book maximum and actual maximum outdates. No dataentry is performed on this screen. The book maximum is the original maximumexpiration date for an inmate’s sentence based on the total term. This information isentered into the iTAG system at the reception sites on inmate arrival. The actualmaximum is a current snapshot of the inmate’s maximum outdate. This date is cal-culated from the book maximum and includes debits and credits based on theinmate’s work credits, minimum credits, and commutation time (exhibit C–11). Thisinformation is updated in the iTAG system by routine credit updates or throughadministratively approved sentence adjustments (e.g., loss of commutation credits).
Exhibit C–12 provides an example of the popup menu for sentence adjustmentcodes available to detail and facilitate this process. The New Jersey classificationmanagement information system includes an easy-to-use “Case Review” screen(exhibit C–13), which inventories the last review type, result, reason, date, and soon. Function buttons in the lower part of the screen allow the user to drill downquickly to specific current status information about the inmate.

200
Appendix C
Exhibit C–10. Sentence Details Screen (New Jersey DOC)
Exhibit C–11. Offender Sentence Adjustment Screen (New Jersey DOC)

201
New Jersey Department of Corrections Summary
Exhibit C–12. Sentence Adjustment Field Code Popup Screen (New JerseyDOC)
Exhibit C–13. Case Review Screen (New Jersey DOC)
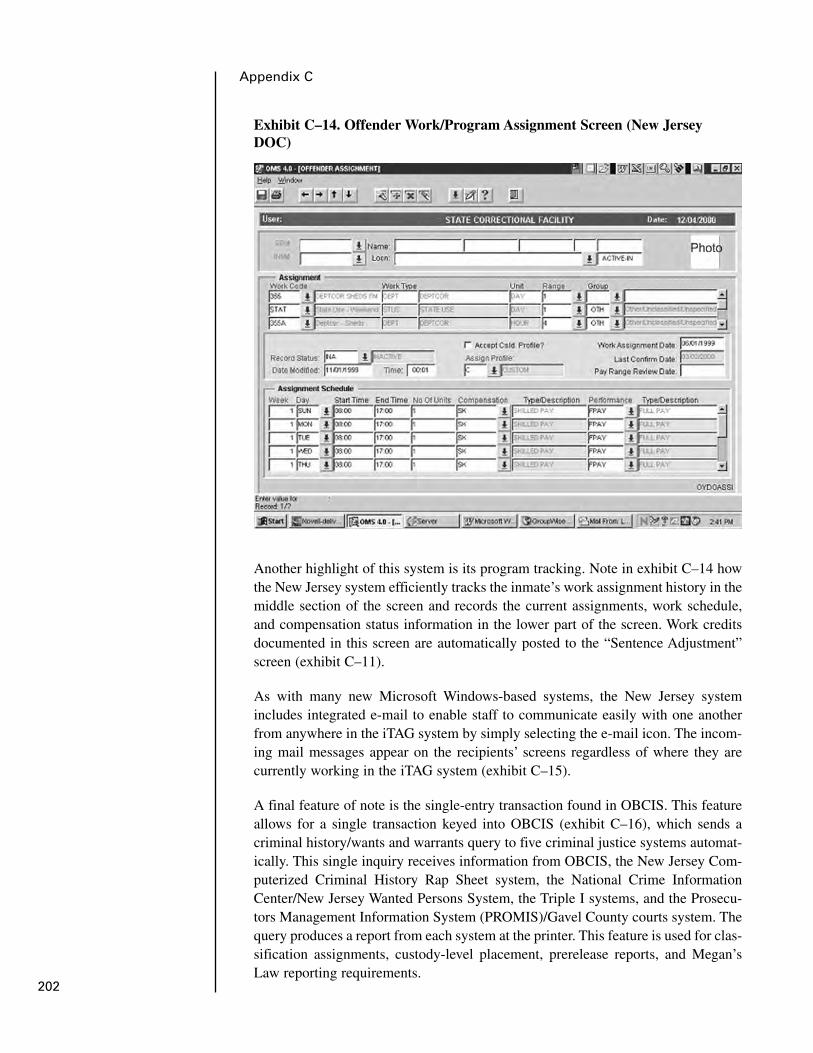
202
Appendix C
Exhibit C–14. Offender Work/Program Assignment Screen (New JerseyDOC)
Another highlight of this system is its program tracking. Note in exhibit C–14 howthe New Jersey system efficiently tracks the inmate’s work assignment history in themiddle section of the screen and records the current assignments, work schedule,and compensation status information in the lower part of the screen. Work creditsdocumented in this screen are automatically posted to the “Sentence Adjustment”screen (exhibit C–11).
As with many new Microsoft Windows-based systems, the New Jersey systemincludes integrated e-mail to enable staff to communicate easily with one anotherfrom anywhere in the iTAG system by simply selecting the e-mail icon. The incom-ing mail messages appear on the recipients’ screens regardless of where they arecurrently working in the iTAG system (exhibit C–15).
A final feature of note is the single-entry transaction found in OBCIS. This featureallows for a single transaction keyed into OBCIS (exhibit C–16), which sends acriminal history/wants and warrants query to five criminal justice systems automat-ically. This single inquiry receives information from OBCIS, the New Jersey Com-puterized Criminal History Rap Sheet system, the National Crime InformationCenter/New Jersey Wanted Persons System, the Triple I systems, and the Prosecu-tors Management Information System (PROMIS)/Gavel County courts system. Thequery produces a report from each system at the printer. This feature is used for clas-sification assignments, custody-level placement, prerelease reports, and Megan’sLaw reporting requirements.
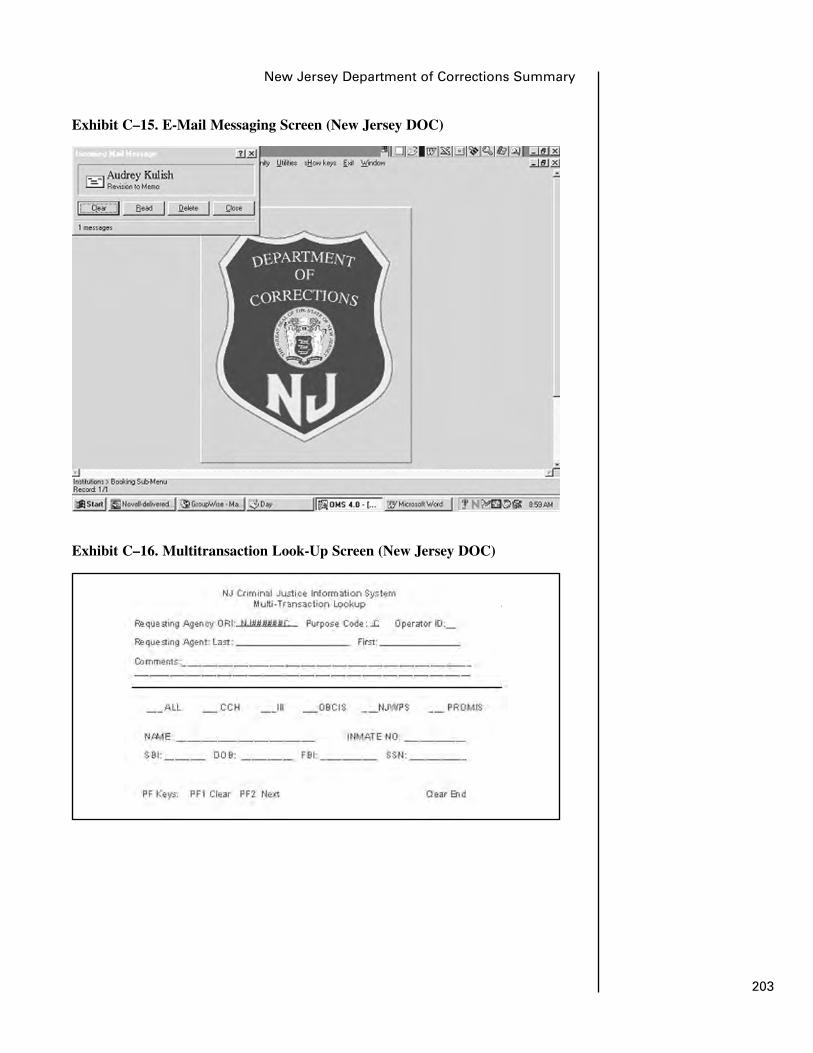
203
New Jersey Department of Corrections Summary
Exhibit C–15. E-Mail Messaging Screen (New Jersey DOC)
Exhibit C–16. Multitransaction Look-Up Screen (New Jersey DOC)

205
North Carolina Department of CorrectionChief Information Officer2020 Yonkers RoadRaleigh, NC 27626919–716–3501
Appendix D: North CarolinaDepartment of CorrectionSummary

General System Overview
The North Carolina prison system consists of approximately 77 facilities, including9 reception/intake centers. The prison population, which consists of approximately32,000 inmates and short-term misdemeanants, has a high turnover rate. In 1993,the North Carolina Department of Correction (NCDOC) was facing accumulatingevidence that the Offender Records System, which was more than 20 years old, hadexceeded its useful life. After careful consideration of the available options at thetime, NCDOC chose to adopt and transfer the Offender-Based Information Systemin operation in Florida.
Renaming the system, the state installed the Offender Population Unified System(OPUS) and applied functional and technical database modifications to meet therequirements of NCDOC. The unmodified Florida system met approximately 70percent of the functional requirements of NCDOC. The remaining 30 percent of thefunctionality was custom developed by the OPUS team. OPUS is a mainframe-based, COBOL, CICS, DB/2, character-based system, with the data residing in asingle, comprehensive, relational database. The vast majority of data fields usecoded values.
NCDOC, having conducted simulations on housing impacts, is changing to newclassification instruments that will be integrated into OPUS. OPUS uses a mastersystem record ID to track all NCDOC offenders/inmates, including prisoners, pro-bationers, and parolees, who come through the system. Consequently, OPUS createsan offender history of every transaction an offender has had since his or her firstcontact with NCDOC.
System Highlights
A highlight of this system is its extensive documentation. Exhibit D–1 shows OPUSand its subsystems. A separate detailed, descriptive, and technical document (avail-able from NCDOC) is maintained for each subsystem. This documentation includesdata flow diagrams, screens, reports, and data dictionaries of all code tables withtheir valid values and descriptions. The documentation also includes general designconcepts that describe the uniform method used to design each of the subsystems.
Probationer data coming into the system use the following OPUS modules: paroleand probation supervision, investigative tracking, offender time computation, court-ordered payments, and alcoholism and chemical dependency. Inmate data princi-pally use the offender reception process, inmate population tracking, and inmatecustody classification modules in conjunction with other support modules.
At intake, if the offender is known to the system, the offender’s prior record appearsand is updated with current information. Personal demographics, medical/dentaldata, offense data, criminal history, sentencing information, substance abuse, edu-cation, and program needs are assessed and entered. Like the Florida system, OPUS
207
North Carolina Department of Correction Summary
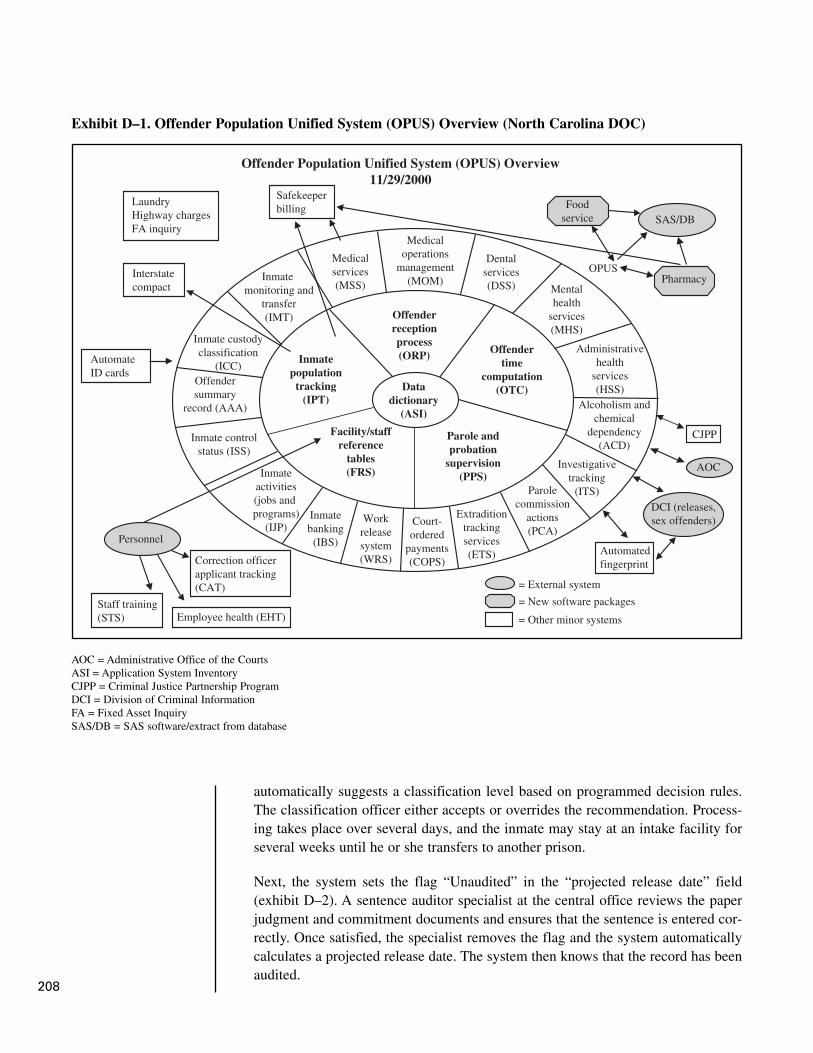
automatically suggests a classification level based on programmed decision rules.The classification officer either accepts or overrides the recommendation. Process-ing takes place over several days, and the inmate may stay at an intake facility forseveral weeks until he or she transfers to another prison.
Next, the system sets the flag “Unaudited” in the “projected release date” field(exhibit D–2). A sentence auditor specialist at the central office reviews the paperjudgment and commitment documents and ensures that the sentence is entered cor-rectly. Once satisfied, the specialist removes the flag and the system automaticallycalculates a projected release date. The system then knows that the record has beenaudited.
208
Exhibit D–1. Offender Population Unified System (OPUS) Overview (North Carolina DOC)
Medicaloperations
management(MOM)
AutomateID cards
Medicalservices(MSS) Mental
healthservices(MHS)
Dentalservices(DSS)
Administrativehealth
services(HSS)
Alcoholism andchemical
dependency(ACD)
Inmate monitoring and
transfer(IMT)
Inmate custodyclassification
(ICC)Offendersummary
record (AAA)
Inmate controlstatus (ISS)
Inmateactivities(jobs and programs)
(IJP)Inmatebanking(IBS)
Workreleasesystem(WRS)
Court-ordered
payments(COPS)
Extraditiontrackingservices(ETS)
Parolecommission
actions(PCA)
Investigativetracking
(ITS)
Offender Population Unified System (OPUS) Overview11/29/2000
Offenderreceptionprocess(ORP) Offender
timecomputation
(OTC)
Parole andprobation
supervision(PPS)
Facility/staffreference
tables(FRS)
Inmatepopulation
tracking(IPT)
Personnel
Correction officerapplicant tracking (CAT)
Employee health (EHT)Staff training(STS)
Interstatecompact
LaundryHighway chargesFA inquiry
Safekeeperbilling
Datadictionary
(ASI)
Foodservice
Pharmacy
SAS/DB
OPUS
DCI (releases,sex offenders)
AOC
CJPP
Automatedfingerprint
= External system
= New software packages
= Other minor systems
AOC = Administrative Office of the CourtsASI = Application System InventoryCJPP = Criminal Justice Partnership ProgramDCI = Division of Criminal InformationFA = Fixed Asset InquirySAS/DB = SAS software/extract from database

OPUS has extensive edit checking (exhibit D–3), so user-induced errors are con-trolled and minimized. This is also facilitated by the use of a single master database,which eliminates record-matching errors between multiple databases that are usedin some systems.
OPUS screen navigation (exhibit D–4) includes the following standard mainframe,character-based protocols, located at the bottom of the screen (not all “F” keyoptions are available on every screen):
� F1 = Displays the OPUS main menu.
� F2 = Displays the “Help” screen for a data file.
209
North Carolina Department of Correction Summary
Exhibit D–2. Inmate Sentence Structure, Unaudited Flag Screen (NorthCarolina DOC)
Exhibit D–3. External Movements Screen (North Carolina DOC)
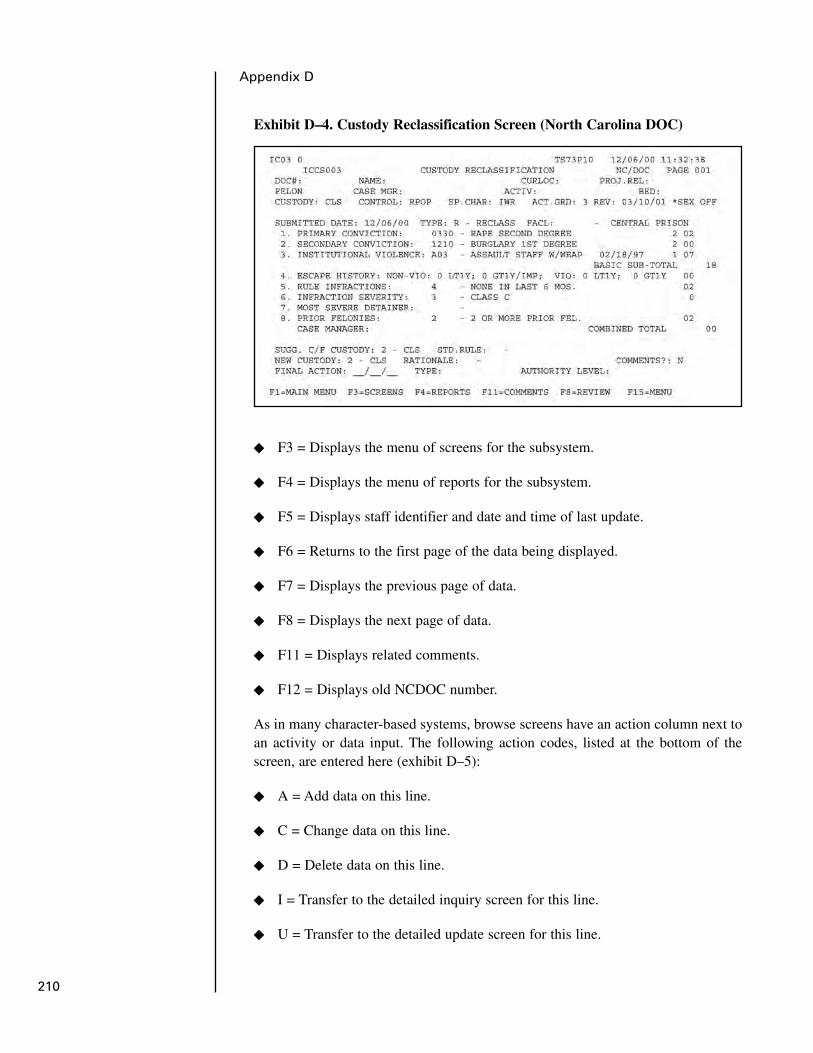
210
Appendix D
Exhibit D–4. Custody Reclassification Screen (North Carolina DOC)
� F3 = Displays the menu of screens for the subsystem.
� F4 = Displays the menu of reports for the subsystem.
� F5 = Displays staff identifier and date and time of last update.
� F6 = Returns to the first page of the data being displayed.
� F7 = Displays the previous page of data.
� F8 = Displays the next page of data.
� F11 = Displays related comments.
� F12 = Displays old NCDOC number.
As in many character-based systems, browse screens have an action column next toan activity or data input. The following action codes, listed at the bottom of thescreen, are entered here (exhibit D–5):
� A = Add data on this line.
� C = Change data on this line.
� D = Delete data on this line.
� I = Transfer to the detailed inquiry screen for this line.
� U = Transfer to the detailed update screen for this line.
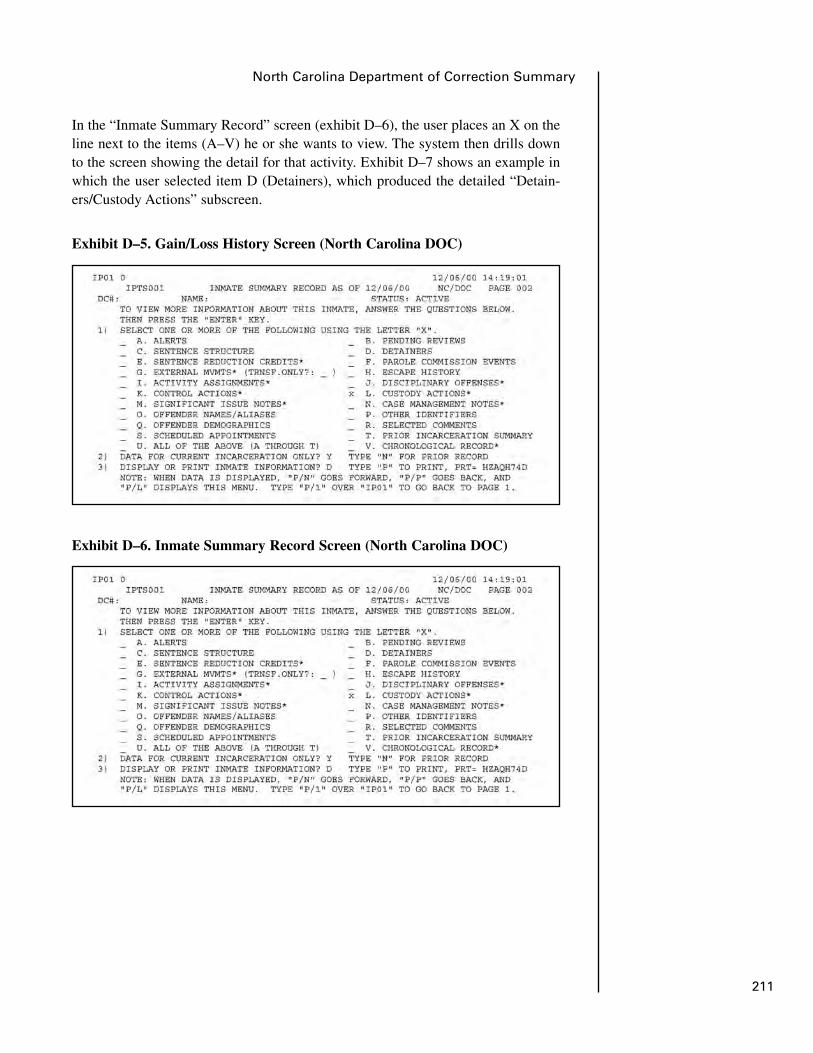
In the “Inmate Summary Record” screen (exhibit D–6), the user places an X on theline next to the items (A–V) he or she wants to view. The system then drills downto the screen showing the detail for that activity. Exhibit D–7 shows an example inwhich the user selected item D (Detainers), which produced the detailed “Detain-ers/Custody Actions” subscreen.
211
North Carolina Department of Correction Summary
Exhibit D–5. Gain/Loss History Screen (North Carolina DOC)
Exhibit D–6. Inmate Summary Record Screen (North Carolina DOC)

NCDOC Web Site
Like most state DOCs, NCDOC has a Web site. The NCDOC Office of Researchand Planning, with the Office of Management Information Systems, has developedan example of what it calls the Automated System Query (ASQ). ASQ offers a pow-erful and flexible system that performs various queries about and produces ad hocreports on individual offenders or populations from a monthly flat file extract of theOPUS database. From the Web site’s main menu, shown in exhibit D–8, the user canselect an ASQ option.
212
Appendix D
Exhibit D–7. Detainers/Custody Actions Screen (North Carolina DOC)
Exhibit D–8. NCDOC Web Site Offender Information Main Menu

The public, as well as DOC personnel, can access ASQ, although the public is pro-hibited from accessing some data. Selecting “Custom offender reports” producesthe screen shown in exhibit D–9. A user-guide menu is provided to allow the userto view current information about the application, review DOC terminology anddata definitions, look at an example of an ad hoc report, and create custom reports.
Selecting menu option 5, “Start Generating Reports,” produces the following screen(exhibit D–10), which begins the user-friendly process of building a report. For anyreport, the fundamental steps include selecting the type of report (i.e., roster or sta-tistic), selecting whom the report will focus on, selecting the content of the report,and selecting how the content of the report will be ordered.
Exhibit D–10 begins guiding the user through the query-building process. The firsttask in selecting whom the report will focus on is to select the time period of incar-ceration for the inmate population of interest. Then, from the template provided, theuser selects the offender population desired in the report (i.e., prison, probation, orparole population, entries, or exits).
The user is then prompted to select from a list of available items/variables (content)desired for tabulation. Multiple variables may be selected and cross-tabulated. Inexhibit D–11, a single variable, “Assigned Custody” (current classification assign-ment), has been added to the selected items list.
The next screen (exhibit D–12) gives the user the option to select any or all codedvalues associated with the variable(s) selected. After selecting from the options, theuser clicks on the “View Report” button to generate the report shown in exhibitD–13.
213
North Carolina Department of Correction Summary
Exhibit D–9. ASQ Main Menu (North Carolina DOC)
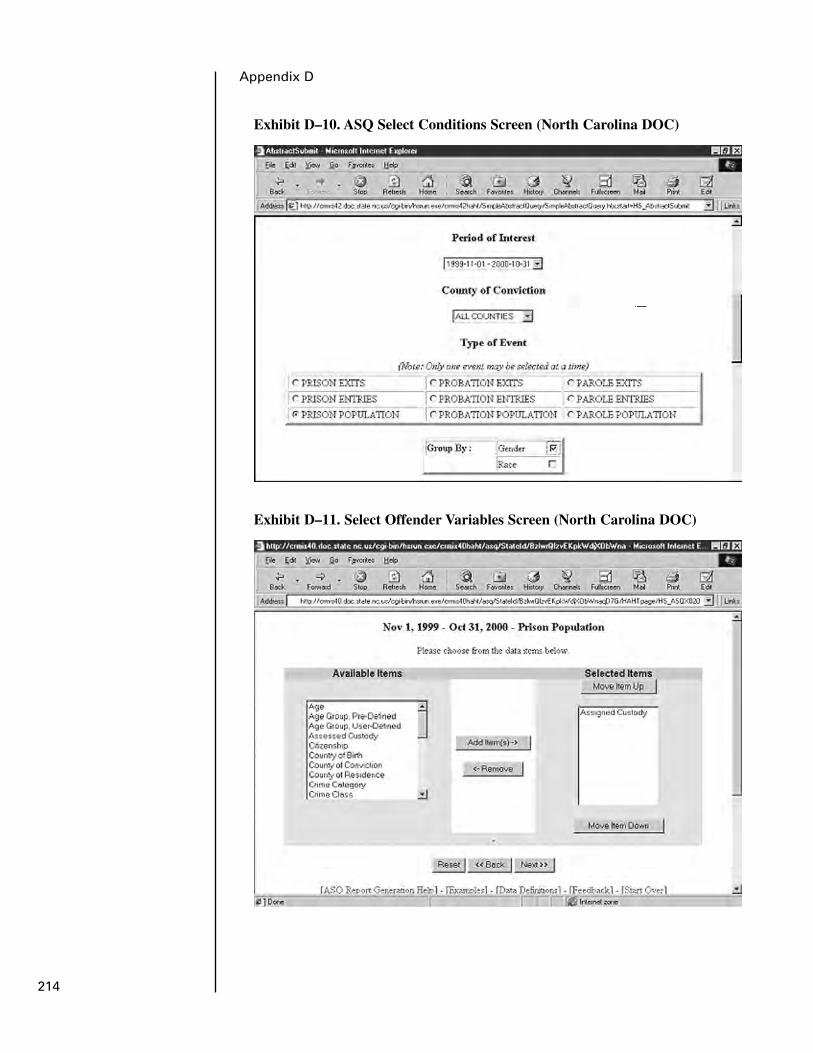
214
Appendix D
Exhibit D–10. ASQ Select Conditions Screen (North Carolina DOC)
Exhibit D–11. Select Offender Variables Screen (North Carolina DOC)

215
North Carolina Department of Correction Summary
Exhibit D–12. Select Variable Values Screen (North Carolina DOC)
Exhibit D–13. Report Output Screen (North Carolina DOC)
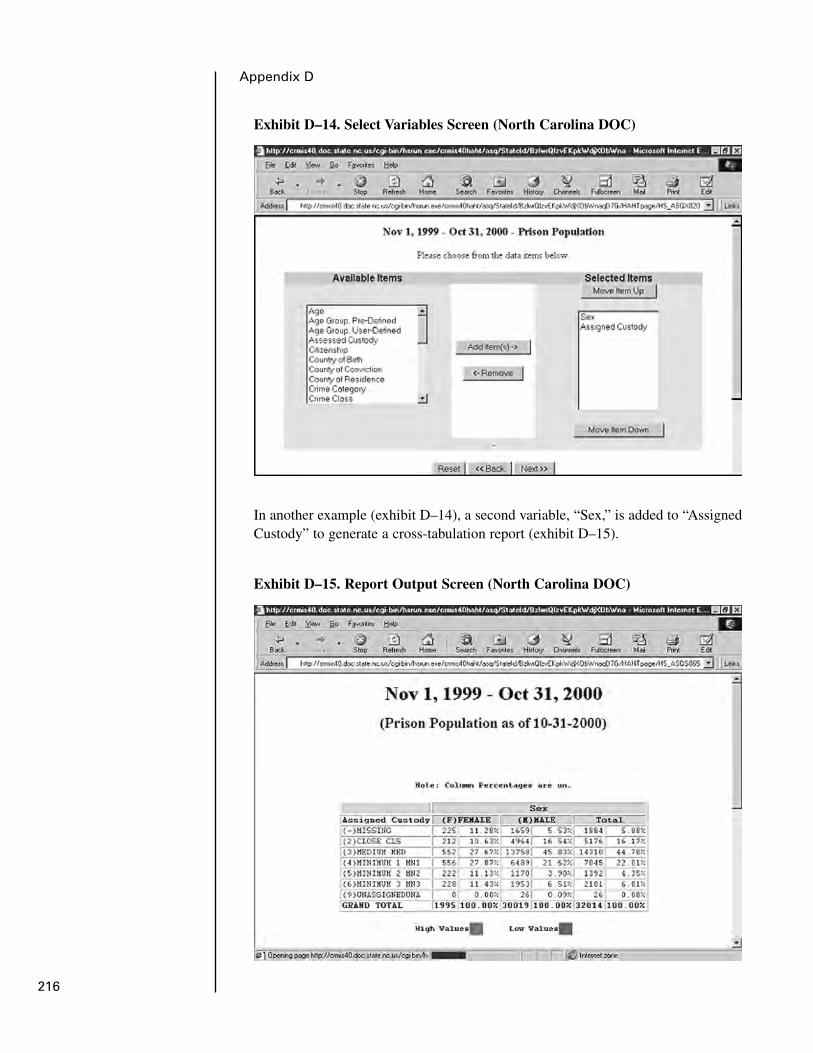
In another example (exhibit D–14), a second variable, “Sex,” is added to “AssignedCustody” to generate a cross-tabulation report (exhibit D–15).
216
Appendix D
Exhibit D–14. Select Variables Screen (North Carolina DOC)
Exhibit D–15. Report Output Screen (North Carolina DOC)

217
South Carolina Department of CorrectionsDivision Director, Classification and Inmate RecordsChief, Offender Information ManagementCentral Office Annex4542 Broad River RoadColumbia, SC803–896–8551
Appendix E: South CarolinaDepartment of CorrectionsSummary
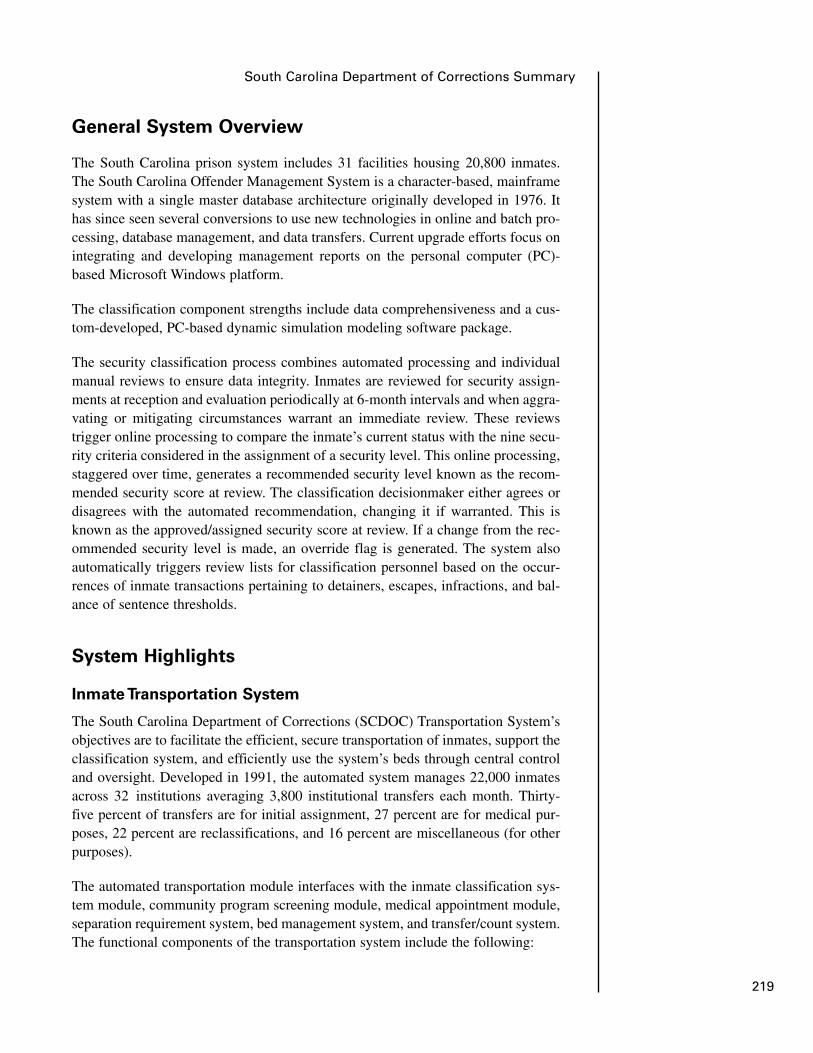
General System Overview
The South Carolina prison system includes 31 facilities housing 20,800 inmates.The South Carolina Offender Management System is a character-based, mainframesystem with a single master database architecture originally developed in 1976. Ithas since seen several conversions to use new technologies in online and batch pro-cessing, database management, and data transfers. Current upgrade efforts focus onintegrating and developing management reports on the personal computer (PC)-based Microsoft Windows platform.
The classification component strengths include data comprehensiveness and a cus-tom-developed, PC-based dynamic simulation modeling software package.
The security classification process combines automated processing and individualmanual reviews to ensure data integrity. Inmates are reviewed for security assign-ments at reception and evaluation periodically at 6-month intervals and when aggra-vating or mitigating circumstances warrant an immediate review. These reviewstrigger online processing to compare the inmate’s current status with the nine secu-rity criteria considered in the assignment of a security level. This online processing,staggered over time, generates a recommended security level known as the recom-mended security score at review. The classification decisionmaker either agrees ordisagrees with the automated recommendation, changing it if warranted. This isknown as the approved/assigned security score at review. If a change from the rec-ommended security level is made, an override flag is generated. The system alsoautomatically triggers review lists for classification personnel based on the occur-rences of inmate transactions pertaining to detainers, escapes, infractions, and bal-ance of sentence thresholds.
System Highlights
Inmate Transportation System
The South Carolina Department of Corrections (SCDOC) Transportation System’sobjectives are to facilitate the efficient, secure transportation of inmates, support theclassification system, and efficiently use the system’s beds through central controland oversight. Developed in 1991, the automated system manages 22,000 inmatesacross 32 institutions averaging 3,800 institutional transfers each month. Thirty-five percent of transfers are for initial assignment, 27 percent are for medical pur-poses, 22 percent are reclassifications, and 16 percent are miscellaneous (for otherpurposes).
The automated transportation module interfaces with the inmate classification sys-tem module, community program screening module, medical appointment module,separation requirement system, bed management system, and transfer/count system.The functional components of the transportation system include the following:
219
South Carolina Department of Corrections Summary
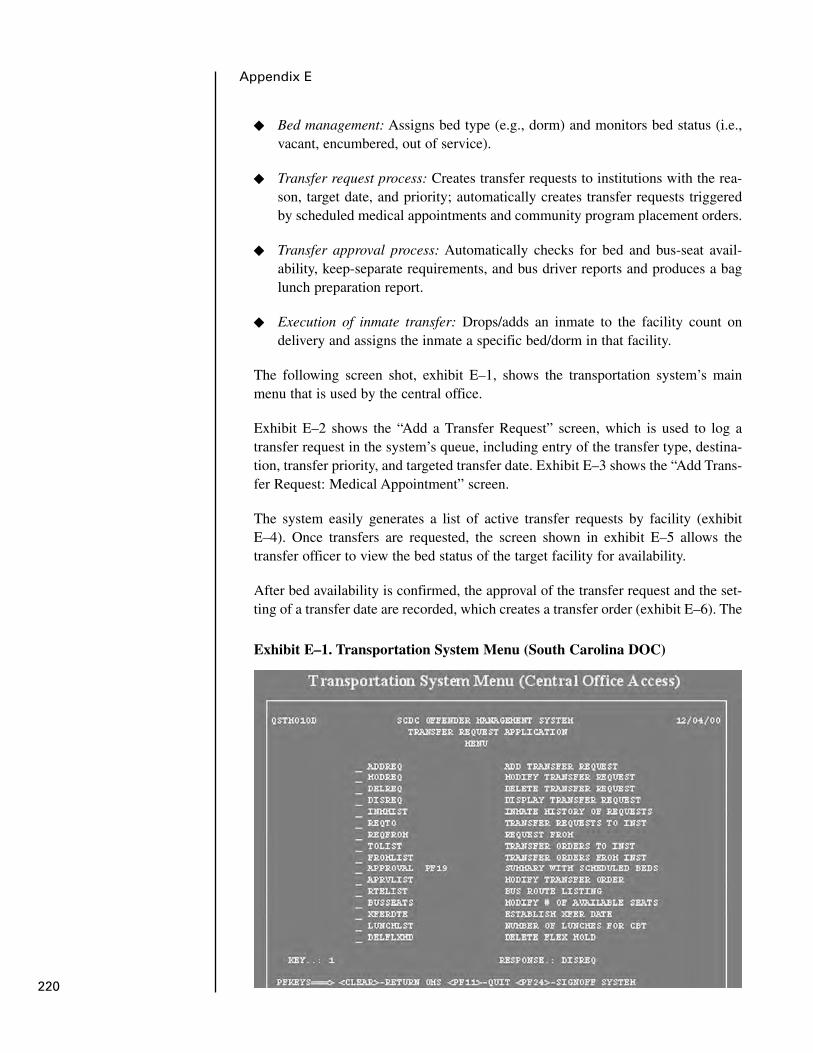
220
Appendix E
� Bed management: Assigns bed type (e.g., dorm) and monitors bed status (i.e.,vacant, encumbered, out of service).
� Transfer request process: Creates transfer requests to institutions with the rea-son, target date, and priority; automatically creates transfer requests triggeredby scheduled medical appointments and community program placement orders.
� Transfer approval process: Automatically checks for bed and bus-seat avail-ability, keep-separate requirements, and bus driver reports and produces a baglunch preparation report.
� Execution of inmate transfer: Drops/adds an inmate to the facility count ondelivery and assigns the inmate a specific bed/dorm in that facility.
The following screen shot, exhibit E–1, shows the transportation system’s mainmenu that is used by the central office.
Exhibit E–2 shows the “Add a Transfer Request” screen, which is used to log atransfer request in the system’s queue, including entry of the transfer type, destina-tion, transfer priority, and targeted transfer date. Exhibit E–3 shows the “Add Trans-fer Request: Medical Appointment” screen.
The system easily generates a list of active transfer requests by facility (exhibitE–4). Once transfers are requested, the screen shown in exhibit E–5 allows thetransfer officer to view the bed status of the target facility for availability.
After bed availability is confirmed, the approval of the transfer request and the set-ting of a transfer date are recorded, which creates a transfer order (exhibit E–6). The
Exhibit E–1. Transportation System Menu (South Carolina DOC)
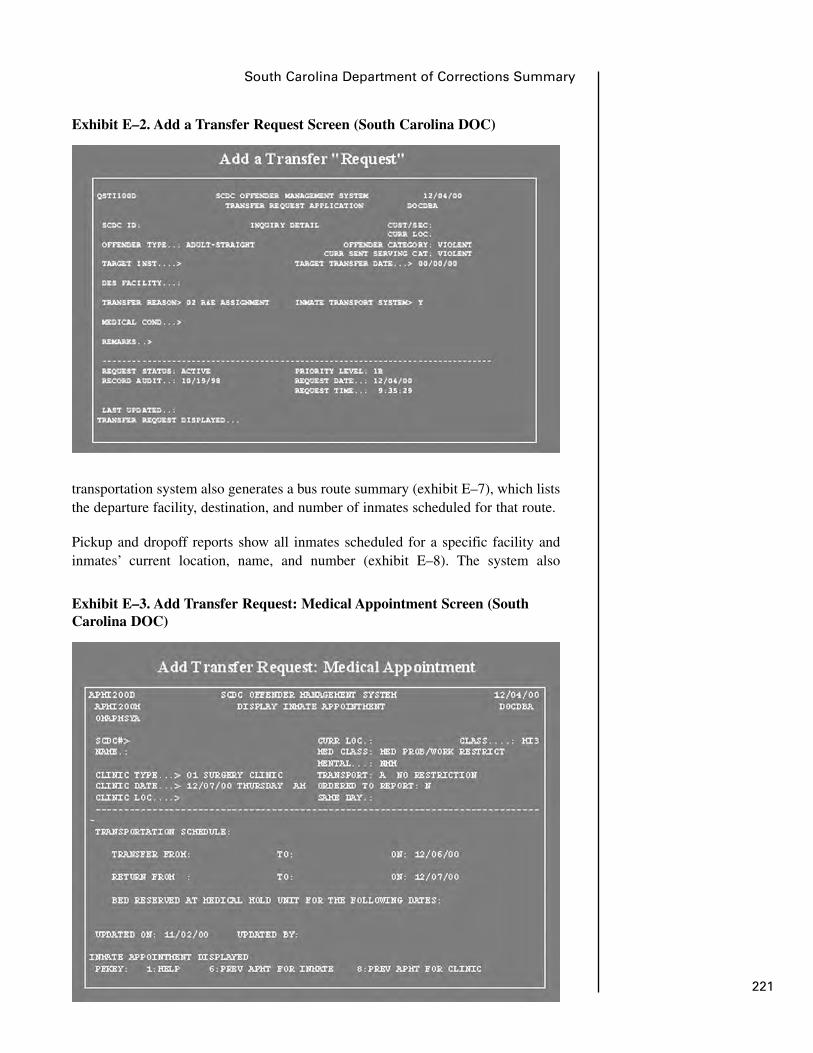
221
South Carolina Department of Corrections Summary
Exhibit E–2. Add a Transfer Request Screen (South Carolina DOC)
Exhibit E–3. Add Transfer Request: Medical Appointment Screen (SouthCarolina DOC)
transportation system also generates a bus route summary (exhibit E–7), which liststhe departure facility, destination, and number of inmates scheduled for that route.
Pickup and dropoff reports show all inmates scheduled for a specific facility andinmates’ current location, name, and number (exhibit E–8). The system also
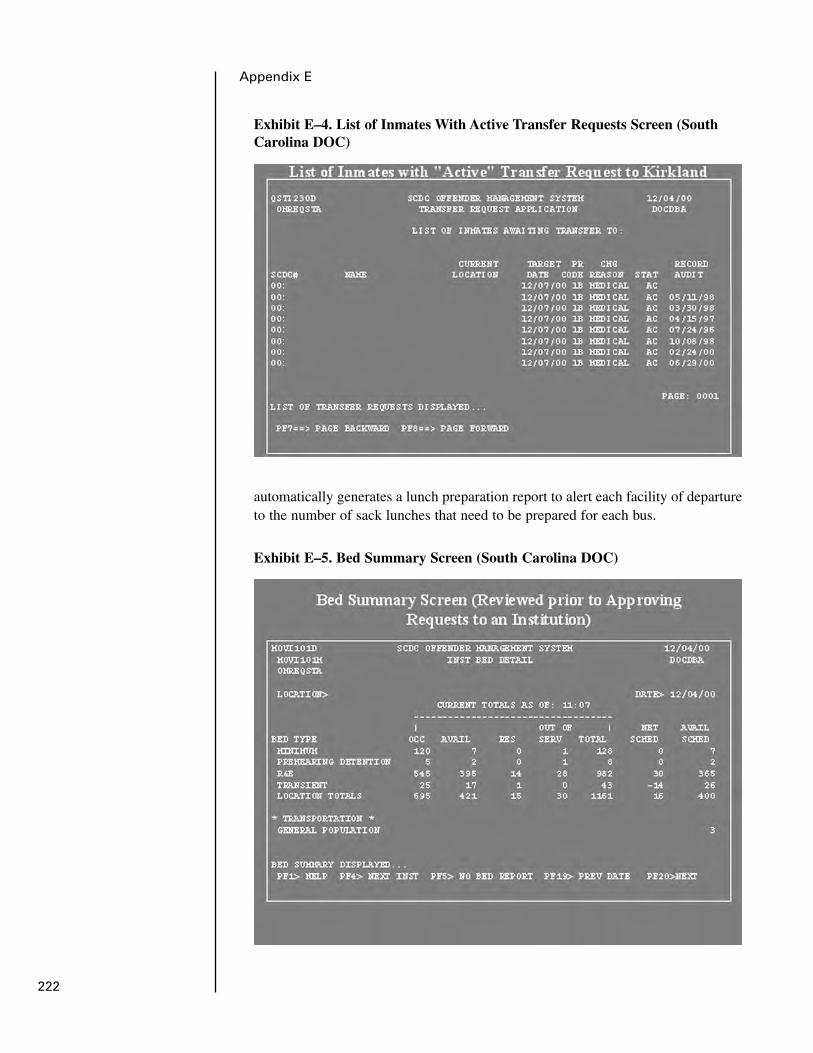
222
Appendix E
Exhibit E–5. Bed Summary Screen (South Carolina DOC)
automatically generates a lunch preparation report to alert each facility of departureto the number of sack lunches that need to be prepared for each bus.
Exhibit E–4. List of Inmates With Active Transfer Requests Screen (SouthCarolina DOC)
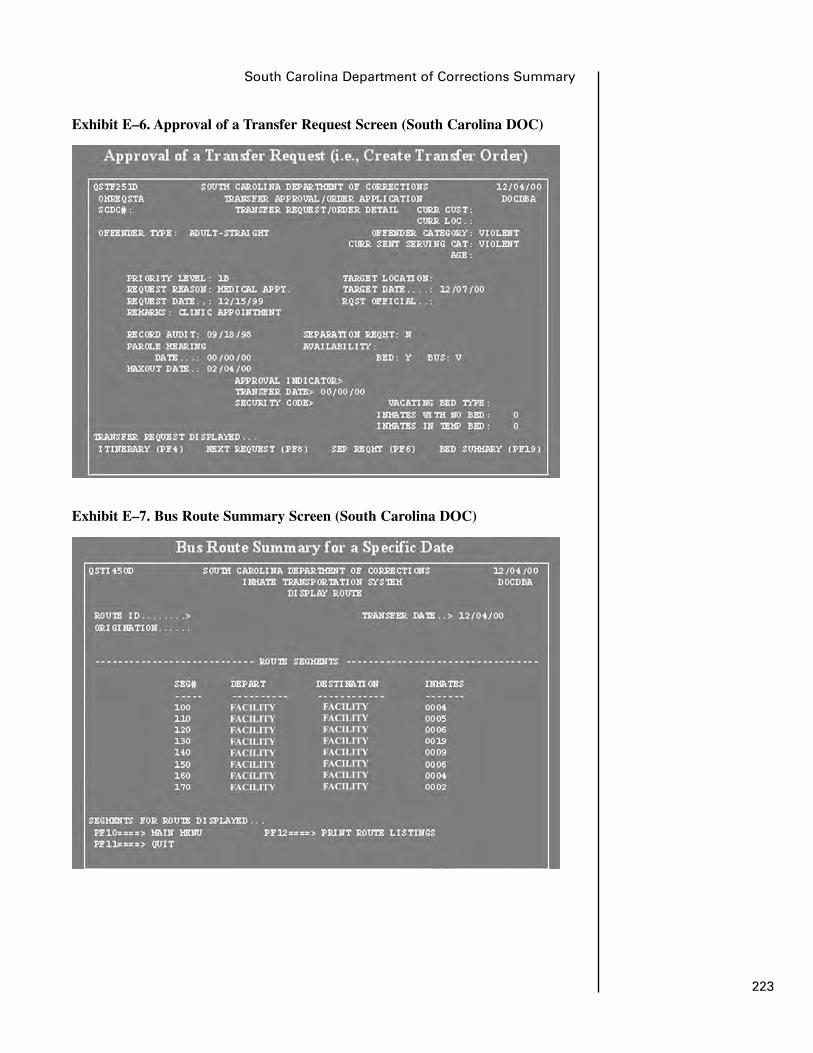
223
South Carolina Department of Corrections Summary
Exhibit E–6. Approval of a Transfer Request Screen (South Carolina DOC)
Exhibit E–7. Bus Route Summary Screen (South Carolina DOC)
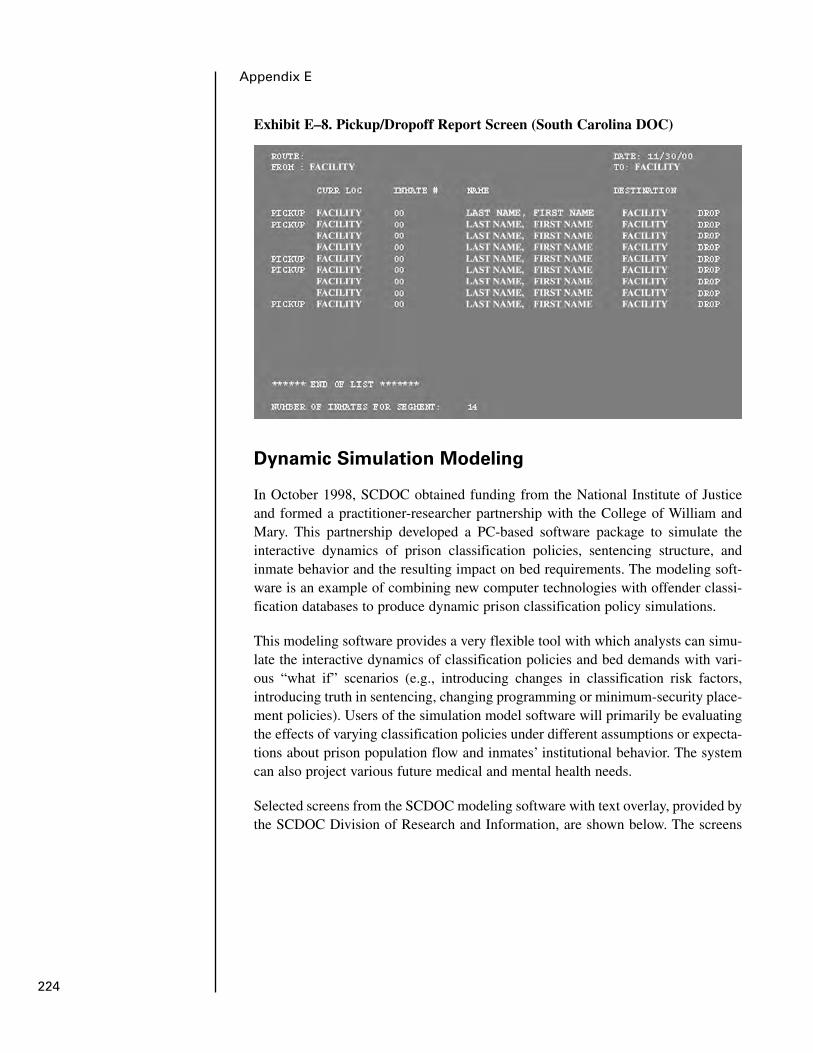
224
Appendix E
Exhibit E–8. Pickup/Dropoff Report Screen (South Carolina DOC)
Dynamic Simulation Modeling
In October 1998, SCDOC obtained funding from the National Institute of Justiceand formed a practitioner-researcher partnership with the College of William andMary. This partnership developed a PC-based software package to simulate theinteractive dynamics of prison classification policies, sentencing structure, andinmate behavior and the resulting impact on bed requirements. The modeling soft-ware is an example of combining new computer technologies with offender classi-fication databases to produce dynamic prison classification policy simulations.
This modeling software provides a very flexible tool with which analysts can simu-late the interactive dynamics of classification policies and bed demands with vari-ous “what if” scenarios (e.g., introducing changes in classification risk factors,introducing truth in sentencing, changing programming or minimum-security place-ment policies). Users of the simulation model software will primarily be evaluatingthe effects of varying classification policies under different assumptions or expecta-tions about prison population flow and inmates’ institutional behavior. The systemcan also project various future medical and mental health needs.
Selected screens from the SCDOC modeling software with text overlay, provided bythe SCDOC Division of Research and Information, are shown below. The screens

225
South Carolina Department of Corrections Summary
illustrate some, but not all, of the basic steps in building a “what if” scenario model(exhibit E–9). The basic steps in developing modeling scenarios are as follows:
1. Create a scenario: What if the number of disciplinaries in a period werechanged to qualify inmates for the work crew program?
2. Assign variables relevant to the scenario: Severity of current offense, numberof disciplinary infractions, sentence time remaining.
3. Establish decision rules: Instructions relevant to processing variable values(e.g., no sex offenders, less than 3 years left to outdate) or building “AND/OR”statements (e.g., inmate must be female and have less than three disciplinariesin the past year).
4. Establish choices: Types of beds in the system; minimum, medium, maximumsecurity; work program. These choices become the categories to which the sce-nario is projecting (number of inmates falling into each choice category in thesimulation scenario output).
5. Classify or run the scenario: A classification scenario specifies the conditionsthat must be met before an inmate is placed in or considered for a particular typeof facility or security level. Accordingly, creating a scenario calls for creatingchoices, rules, variables, and directives.
Exhibit E–9 illustrates the first step in the process.
Exhibit E–9. Create a Scenario Screen (South Carolina DOC)
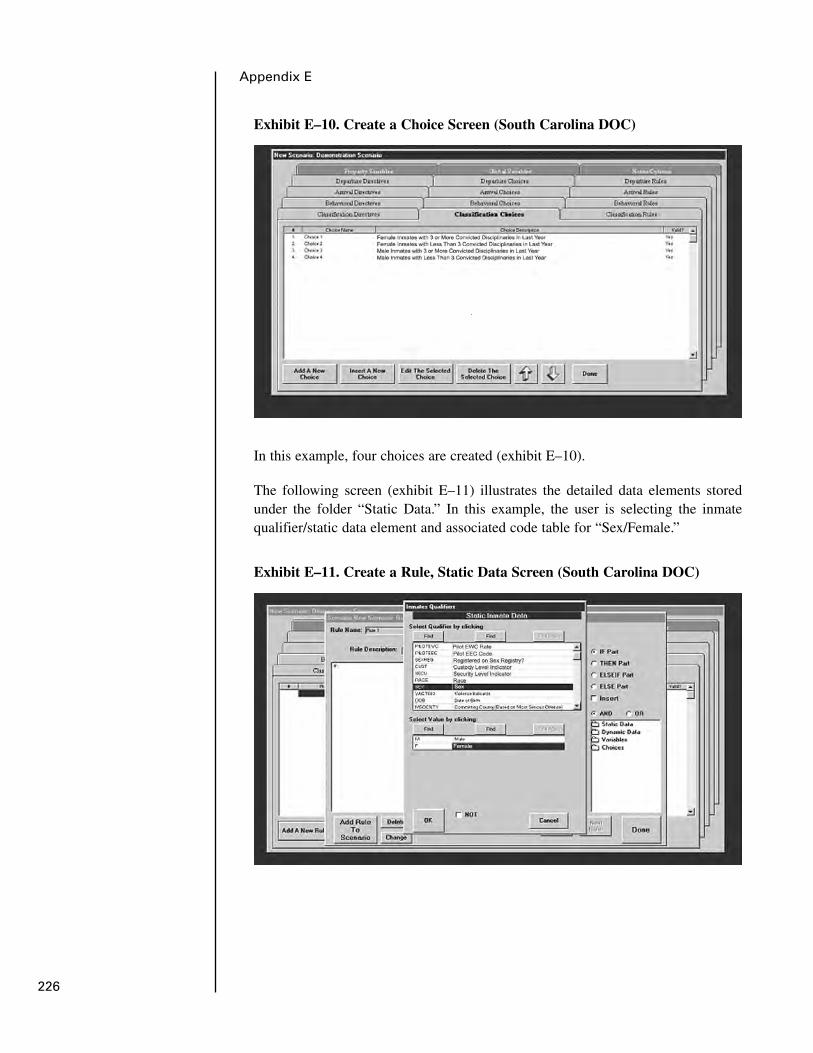
226
Appendix E
In this example, four choices are created (exhibit E–10).
The following screen (exhibit E–11) illustrates the detailed data elements storedunder the folder “Static Data.” In this example, the user is selecting the inmatequalifier/static data element and associated code table for “Sex/Female.”
Exhibit E–10. Create a Choice Screen (South Carolina DOC)
Exhibit E–11. Create a Rule, Static Data Screen (South Carolina DOC)
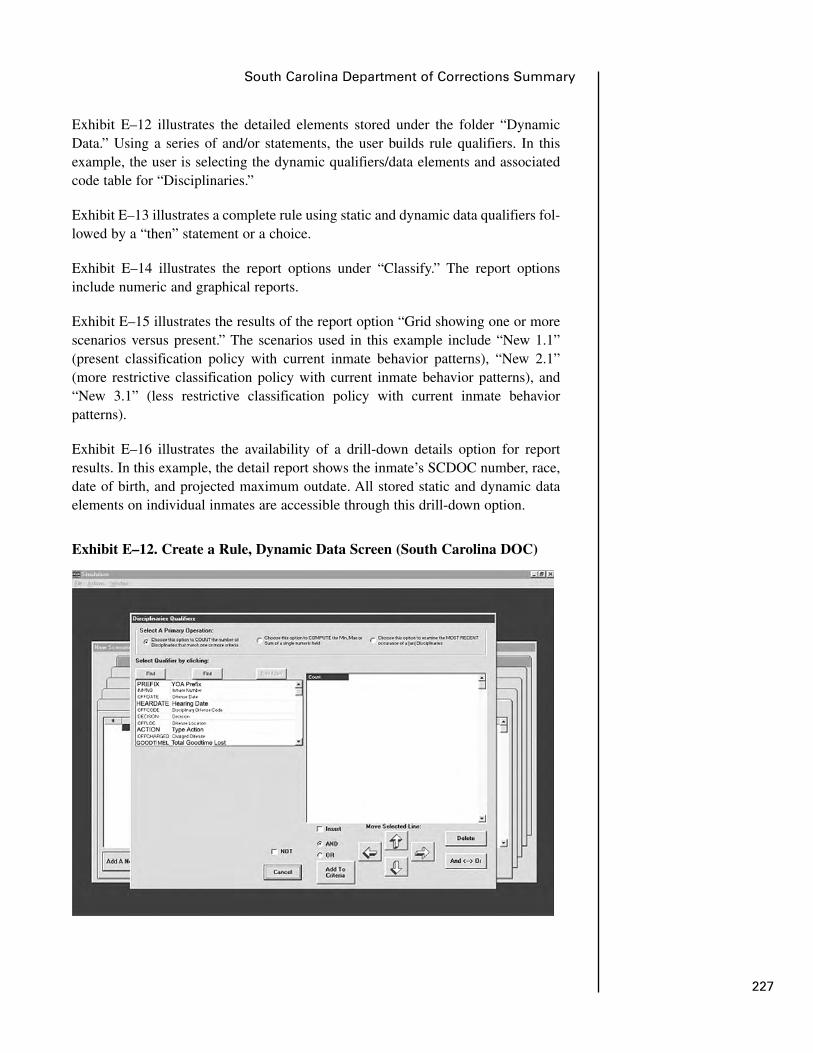
227
South Carolina Department of Corrections Summary
Exhibit E–12 illustrates the detailed elements stored under the folder “DynamicData.” Using a series of and/or statements, the user builds rule qualifiers. In thisexample, the user is selecting the dynamic qualifiers/data elements and associatedcode table for “Disciplinaries.”
Exhibit E–13 illustrates a complete rule using static and dynamic data qualifiers fol-lowed by a “then” statement or a choice.
Exhibit E–14 illustrates the report options under “Classify.” The report optionsinclude numeric and graphical reports.
Exhibit E–15 illustrates the results of the report option “Grid showing one or morescenarios versus present.” The scenarios used in this example include “New 1.1”(present classification policy with current inmate behavior patterns), “New 2.1”(more restrictive classification policy with current inmate behavior patterns), and“New 3.1” (less restrictive classification policy with current inmate behaviorpatterns).
Exhibit E–16 illustrates the availability of a drill-down details option for reportresults. In this example, the detail report shows the inmate’s SCDOC number, race,date of birth, and projected maximum outdate. All stored static and dynamic dataelements on individual inmates are accessible through this drill-down option.
Exhibit E–12. Create a Rule, Dynamic Data Screen (South Carolina DOC)

228
Appendix E
Exhibit E–13. Create a Rule, Static and Dynamic Qualifiers Screen (SouthCarolina DOC)
Exhibit E–14. Classify, Select Report Type Screen (South Carolina DOC)
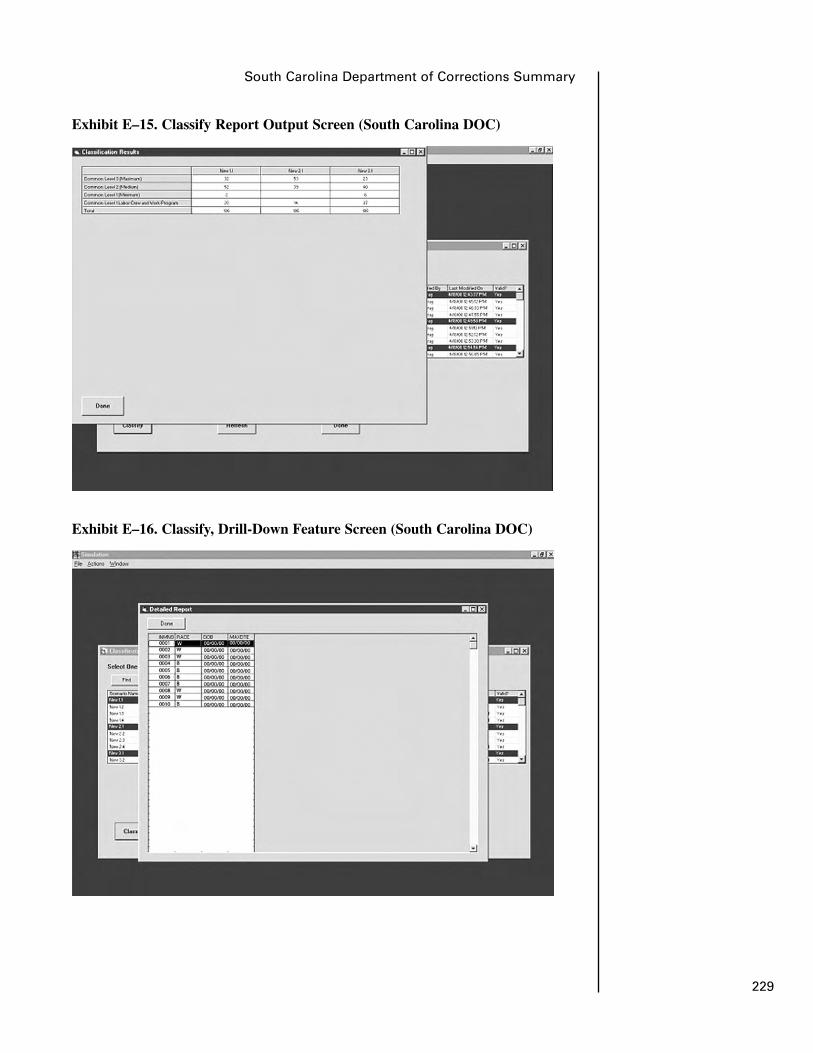
229
South Carolina Department of Corrections Summary
Exhibit E–15. Classify Report Output Screen (South Carolina DOC)
Exhibit E–16. Classify, Drill-Down Feature Screen (South Carolina DOC)

230
Appendix E
Exhibit E–17. Classify, Report Output Option Screen (South Carolina DOC)
Exhibit E–18. Classify, Report Output Charting Screen (South CarolinaDOC)
Exhibit E–17 illustrates the results of the report option “Grid showing contrastingcommon choices of two scenarios.” The scenarios used in this example include“New 1.1” and “New 2.1.” The results from this report can also be accessed in moredetail using the drill-down method.
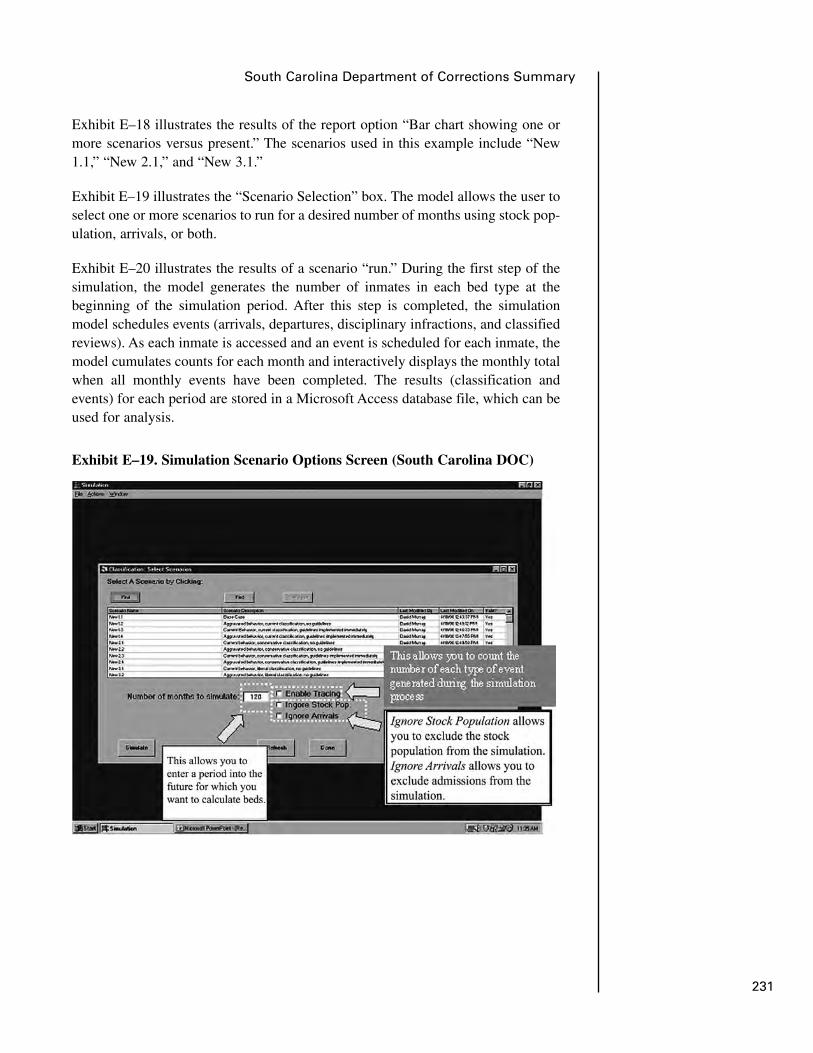
231
South Carolina Department of Corrections Summary
Exhibit E–18 illustrates the results of the report option “Bar chart showing one ormore scenarios versus present.” The scenarios used in this example include “New1.1,” “New 2.1,” and “New 3.1.”
Exhibit E–19 illustrates the “Scenario Selection” box. The model allows the user toselect one or more scenarios to run for a desired number of months using stock pop-ulation, arrivals, or both.
Exhibit E–20 illustrates the results of a scenario “run.” During the first step of thesimulation, the model generates the number of inmates in each bed type at thebeginning of the simulation period. After this step is completed, the simulationmodel schedules events (arrivals, departures, disciplinary infractions, and classifiedreviews). As each inmate is accessed and an event is scheduled for each inmate, themodel cumulates counts for each month and interactively displays the monthly totalwhen all monthly events have been completed. The results (classification andevents) for each period are stored in a Microsoft Access database file, which can beused for analysis.
Exhibit E–19. Simulation Scenario Options Screen (South Carolina DOC)
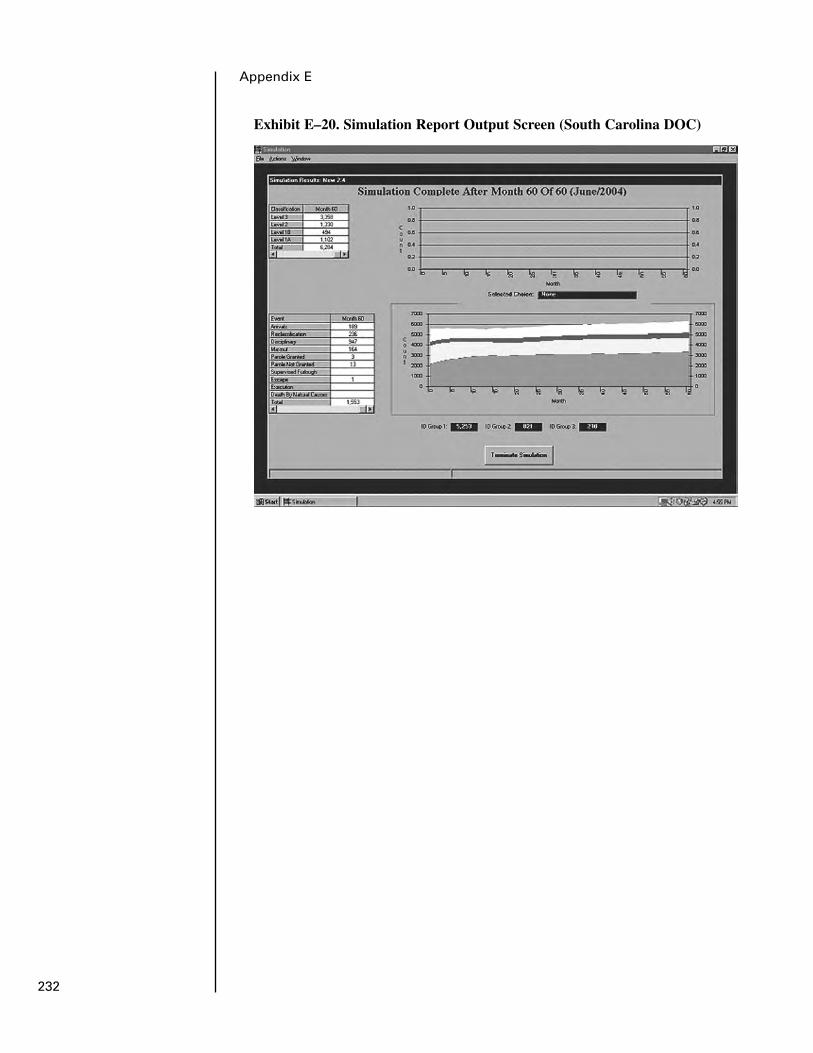
232
Appendix E
Exhibit E–20. Simulation Report Output Screen (South Carolina DOC)

Appendix F: New York Departmentof Correctional Services Summary
233
New York Department of Correctional ServicesDirector, Office of Classification and MovementHarriman Office Building CampusAlbany, NY 12226518–457–6022

Commitment Crime andSentence Length n %
Commitment crime
Violent 41,667 59
Property 5,311 8
Drug 21,500 31
Other 1,849 3
Total 70,327 100
Sentence (years)
Less than 2 8,265 12
2–5 34,530 48
5–10 12,198 17
More than 10 15,334 22
Total 70,327 100
235
New York Department of Correctional Services Summary
General System Overview
On September 30, 2000, the New York State Department of Correctional Services(NYDOCS) had 70,327 inmates in custody. Exhibit F–1 shows the distribution ofsentence length and type of commitment crime for the population.
There are 71 prisons, including 6 reception centers, 4 of which are also classifica-tion centers. One center is for females. Each facility has a guidance unit, which isresponsible for case processing, including internal classification and external reclas-sification. The 71 prisons are divided into regional hubs, each of which has aunit responsible for classification and movement within the region, excludingmaximum-security inmates. A unit in the central office is responsible for interhubclassification and movement, maximum-security inmates, and overall supervisionof classification.
The current management information system was developed in 1989 and wasmost recently upgraded in 1996. NYDOCS is in the process of migrating from amainframe-only environment to one that emphasizes cooperative processingbetween the mainframe and the client-server platforms. The major component inthis migration is replacement of coaxial cabling.
Exhibit F–1. NYDOCS Population, by Commitment Crime and SentenceLength: September 30, 2000
NYDOCS = New York Department of Correctional ServicesNote: Percentages may not sum to 100 because of rounding.Source: NYDOCS.
Inmates
NYDOCS currently operates an IBM OS/390 mainframe within one of New YorkState’s consolidated data centers. This system supports NYDOCS production appli-cation systems. In addition, NYDOCS will have 85 Microsoft Windows NT/4.0servers installed at the central office, 71 correctional facilities, and 4 local officesto support office automation, Lotus/Domino/Notes/intertrack, and file and printservices. NYDOCS is migrating more than 4,500 devices installed at these loca-tions, ranging from model 3270 terminals to model 2867 terminals to Intel PentiumIII workstations. Microsoft Windows NT/4.0 is the standard operating system forpersonal computers (PCs).
The NYDOCS telecommunications network consists of a frame relay wide area net-work (WAN) with multiple Ethernet local area networks (LANs) located at the cen-tral office, 71 correctional facilities, and 4 local offices. The WAN is used tointerconnect these NYDOCS sites across the state to build a common network. Alllocations are connected with a 56 KB circuit. These circuits will be upgraded to T1(1,544 Mbps) circuits. NYDOCS uses the transmission control protocol/Internetprotocol (TCP/IP) over an Ethernet infrastructure to support access to the MicrosoftWindows NT servers from PCs and terminal access to the IBM mainframe.NYDOCS also utilizes its systems network architecture (SNA) network connectingmodel 3270 devices through data link switching. This encapsulates the SNA traffic,enabling it to travel over the TCP/IP network. The Population Management Systemconsists of 24 subsystems, 9 of which relate to classification. The central sub-systems for classification are as follows:
1. State ready: Tracks all inmates declared state ready by the counties.
2. Placement: Matches reception inmates with available beds.
3. Reception/classification: Displays all information collected at reception; calcu-lates time computations and security classification.
4. Locator: Identifies all beds and tracks all inmate movements.
5. Guidance information management: Supports the classification and transferrequest process.
6. Inmate transfer: Supports review of transfer requests.
7. Disciplinary: Records disciplinary charges and dispositions.
8. Separation: Identifies and tracks inmates to be kept separate.
9. Medical: Supports medical classification and other medical processing.
236
Appendix F
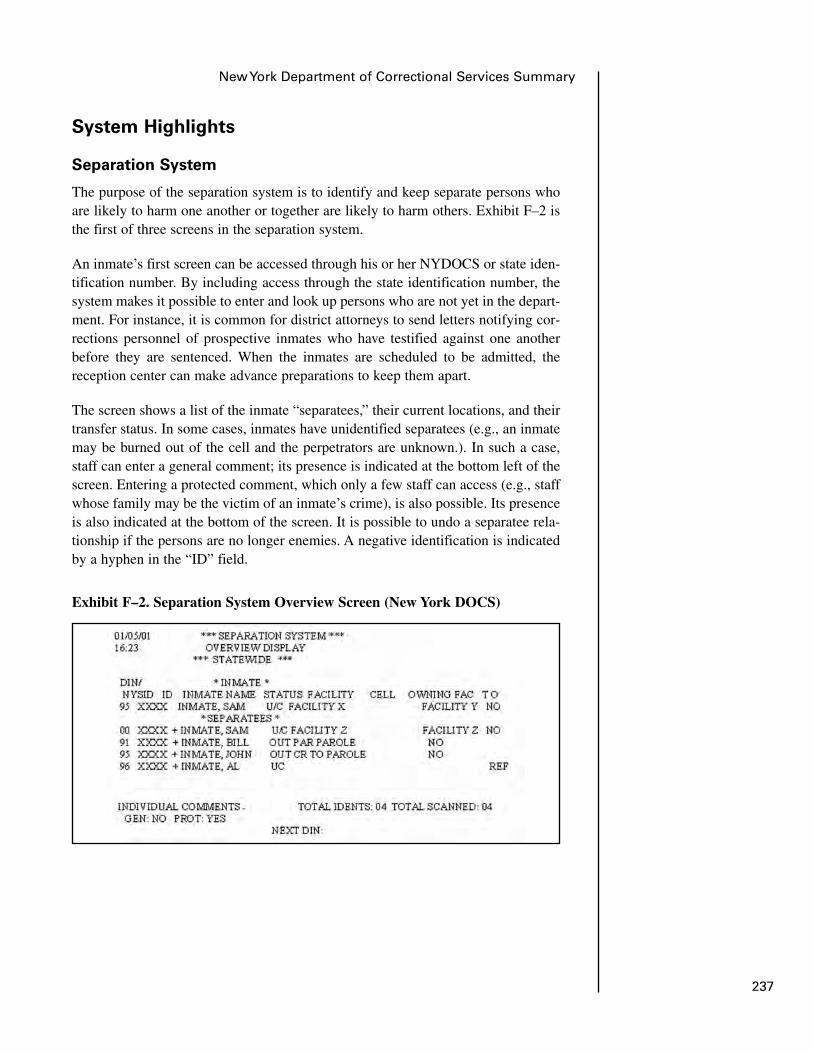
237
New York Department of Correctional Services Summary
System Highlights
Separation System
The purpose of the separation system is to identify and keep separate persons whoare likely to harm one another or together are likely to harm others. Exhibit F–2 isthe first of three screens in the separation system.
An inmate’s first screen can be accessed through his or her NYDOCS or state iden-tification number. By including access through the state identification number, thesystem makes it possible to enter and look up persons who are not yet in the depart-ment. For instance, it is common for district attorneys to send letters notifying cor-rections personnel of prospective inmates who have testified against one anotherbefore they are sentenced. When the inmates are scheduled to be admitted, thereception center can make advance preparations to keep them apart.
The screen shows a list of the inmate “separatees,” their current locations, and theirtransfer status. In some cases, inmates have unidentified separatees (e.g., an inmatemay be burned out of the cell and the perpetrators are unknown.). In such a case,staff can enter a general comment; its presence is indicated at the bottom left of thescreen. Entering a protected comment, which only a few staff can access (e.g., staffwhose family may be the victim of an inmate’s crime), is also possible. Its presenceis also indicated at the bottom of the screen. It is possible to undo a separatee rela-tionship if the persons are no longer enemies. A negative identification is indicatedby a hyphen in the “ID” field.
Exhibit F–2. Separation System Overview Screen (New York DOCS)
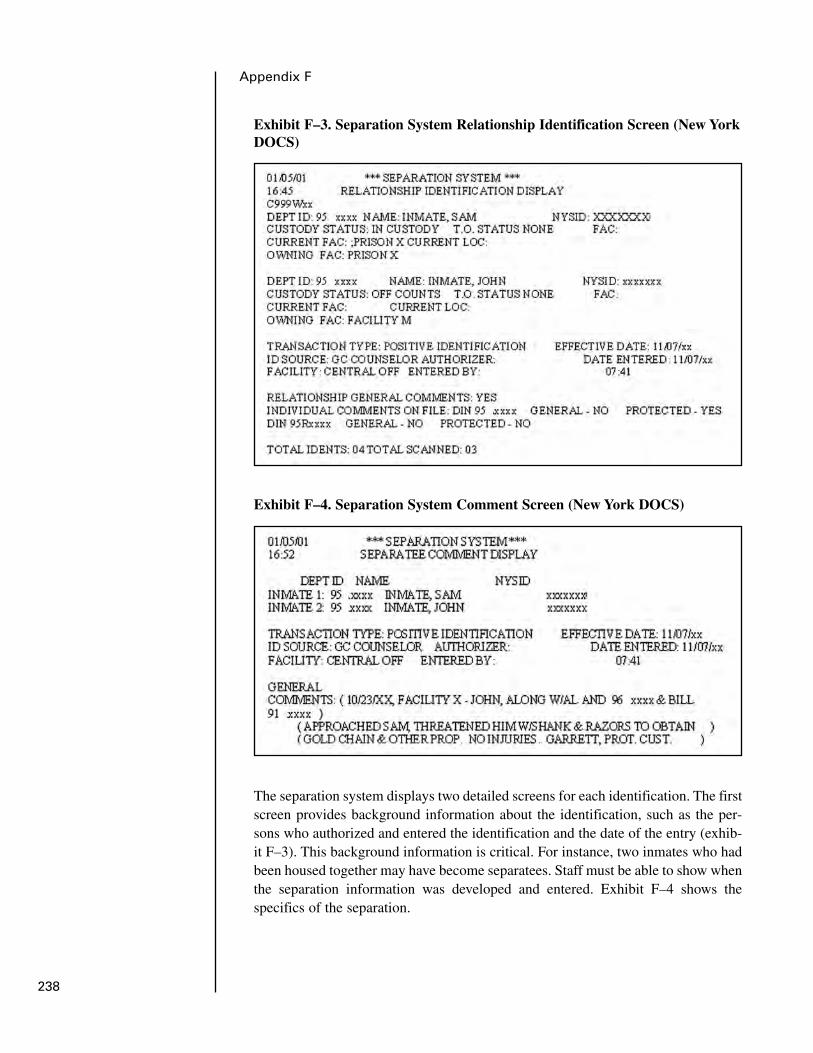
238
Appendix F
The separation system displays two detailed screens for each identification. The firstscreen provides background information about the identification, such as the per-sons who authorized and entered the identification and the date of the entry (exhib-it F–3). This background information is critical. For instance, two inmates who hadbeen housed together may have become separatees. Staff must be able to show whenthe separation information was developed and entered. Exhibit F–4 shows thespecifics of the separation.
Exhibit F–3. Separation System Relationship Identification Screen (New YorkDOCS)
Exhibit F–4. Separation System Comment Screen (New York DOCS)

239
New York Department of Correctional Services Summary
Exhibit F–5. Separation Referral Form (New York DOCS)
Exhibit F–5 shows the e-mail form on which separatee referrals are submitted. Staffmust specify who is involved, what happened, why it happened, where it happened,when it happened, what weapons were used, the severity of the injury or injuries,and what action has been taken by the facility. The staff person must also specifythe source of the information. Access to the separation system is tightly controlled.
Exhibit F–6 displays the access grid. There are 18 levels of access resulting fromcombinations of 6 variables.
Separation data are fed automatically to users who need them to make decisions. Forinstance, when staff review an inmate for transfer, the names of all the facilities thathouse that inmate’s enemies are shown on the transfer review screen. Similarly,hubs cooperate in transporting inmates to medical clinics. When inmates are sched-uled for transport to a clinic, the locations and names of all separatees are shown.
Disciplinary System
Security classification is linked to inmates’ disciplinary behavior. Exhibit F–7shows a screen from the New York disciplinary system. The necessary informationthat is displayed is the date, time, and location of the incident and the hearing;charges; convictions; and dispositions.
Operations control reports. Exhibit F–8 is an extract from a report that analyzesthe distribution of initial security classification decisions and overrides. It presentsproduction for one classification center. The full report presents data for each clas-sification counselor, then sums the data for each classification center, and finallysums the data for all classification centers combined. With this report, supervisors
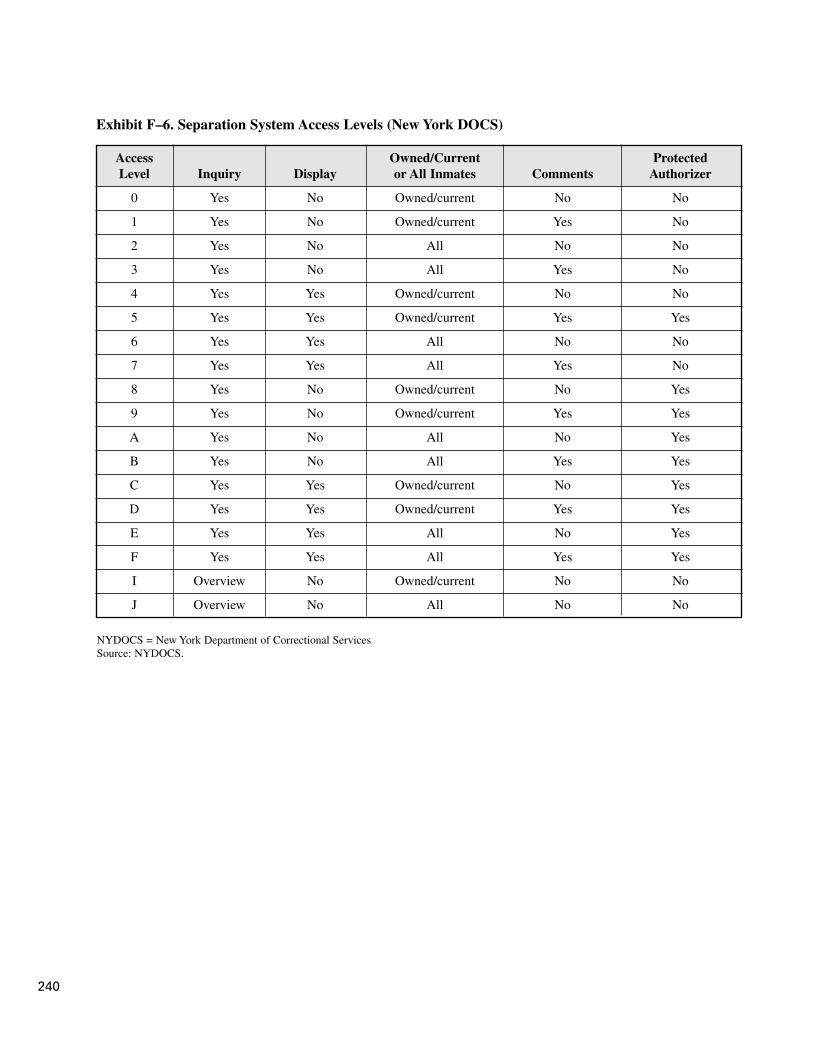
Access Owned/Current ProtectedLevel Inquiry Display or All Inmates Comments Authorizer
0 Yes No Owned/current No No
1 Yes No Owned/current Yes No
2 Yes No All No No
3 Yes No All Yes No
4 Yes Yes Owned/current No No
5 Yes Yes Owned/current Yes Yes
6 Yes Yes All No No
7 Yes Yes All Yes No
8 Yes No Owned/current No Yes
9 Yes No Owned/current Yes Yes
A Yes No All No Yes
B Yes No All Yes Yes
C Yes Yes Owned/current No Yes
D Yes Yes Owned/current Yes Yes
E Yes Yes All No Yes
F Yes Yes All Yes Yes
I Overview No Owned/current No No
J Overview No All No No
Exhibit F–6. Separation System Access Levels (New York DOCS)
NYDOCS = New York Department of Correctional ServicesSource: NYDOCS.
240

241
New York Department of Correctional Services Summary
Exhibit F–7. Disciplinary Incident Summary Screen (New York DOCS)
can compare the number of decisions, the distribution of decisions, and overrides forindividual counselors and classification centers.
Exhibit F–9 is a weekly report that lists transfer orders that are more than 21 daysold. Presumably, if an inmate’s name is placed on a transfer order, the inmate shouldbe transferred. There may well be reasons that a transfer does not occur (e.g., med-ical problems), but these cases need to be monitored. In some cases, the transferorder should be canceled; in others, the transfer should be expedited; and in others,there may be a reason to keep the transfer on hold.
Exhibit F–10 is a monthly report that lists cases between 78 months and 9 monthsto earliest release date that do not have automated initial security classificationguidelines (inmates with more than 78 months or less than 9 months to earliestrelease date are not reclassified). When inmates are reclassified quarterly on theautomated reclassification guideline, several scores are taken from the initial guide-line. If no initial guideline exists, then an automated reclassification guideline can-not be done. Edits to prevent inmates from leaving initial classification without aninitial guideline exist, but some inmates came into the system before 1982, when theinitial guideline was automated. Inevitably, odd cases that defy all normal expecta-tions built into edits get through. In sum, although every case should have an initialguideline, some do not, so monitoring for missing information is important.
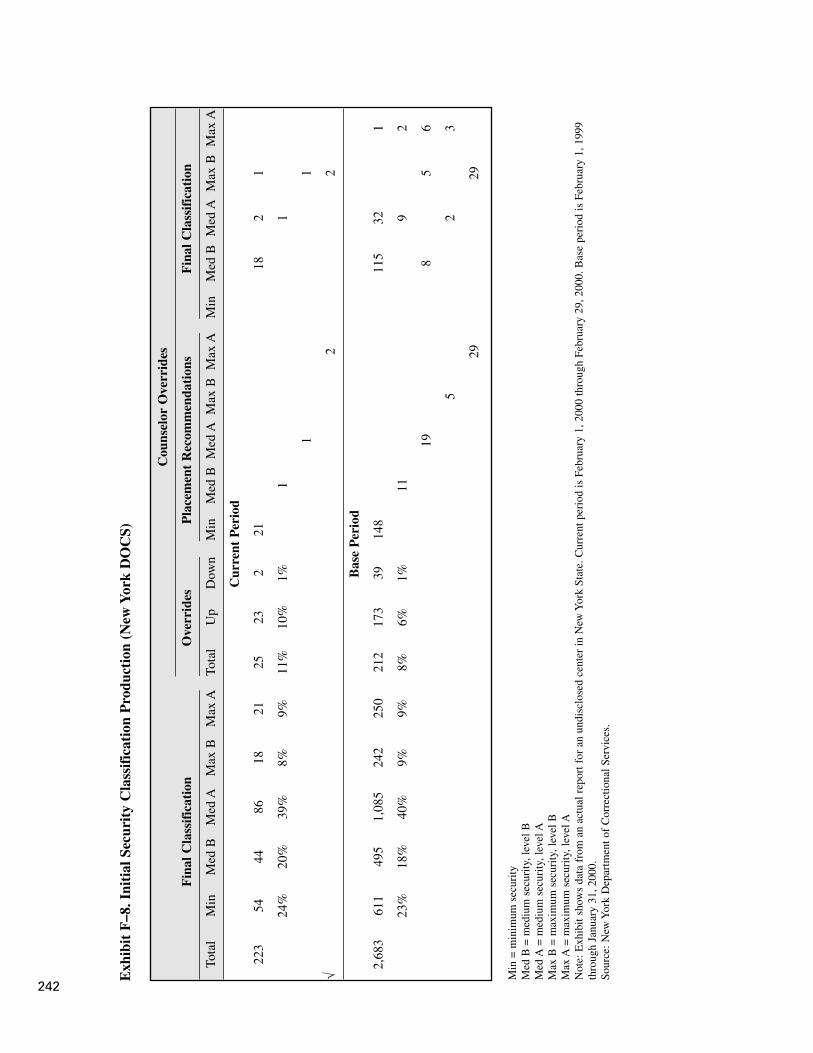
242
Cou
nsel
or O
verr
ides
Fin
al C
lass
ific
atio
nO
verr
ides
Pla
cem
ent
Rec
omm
enda
tion
sF
inal
Cla
ssif
icat
ion
Tota
lM
inM
ed B
Med
AM
ax B
Max
ATo
tal
Up
Dow
nM
inM
ed B
Med
AM
ax B
Max
AM
inM
ed B
Med
AM
ax B
Max
A
Cur
rent
Per
iod
223
5444
8618
2125
232
2118
21
24%
20%
39%
8%9%
11%
10%
1%1
1
11
√2
2
Bas
e P
erio
d
2,68
361
149
51,
085
242
250
212
173
3914
811
532
1
23%
18%
40%
9%9%
8%6%
1%11
92
198
56
52
3
2929
Exh
ibit
F–8
. Ini
tial
Sec
urit
y C
lass
ific
atio
n P
rodu
ctio
n (N
ew Y
ork
DO
CS)
Min
= m
inim
um s
ecur
ityM
ed B
= m
ediu
m s
ecur
ity,l
evel
BM
ed A
= m
ediu
m s
ecur
ity,l
evel
AM
ax B
= m
axim
um s
ecur
ity,l
evel
BM
ax A
= m
axim
um s
ecur
ity,l
evel
AN
ote:
Exh
ibit
show
s da
ta f
rom
an
actu
al r
epor
t for
an
undi
sclo
sed
cent
er in
New
Yor
k St
ate.
Cur
rent
per
iod
is F
ebru
ary
1,20
00 th
roug
h Fe
brua
ry 2
9,20
00. B
ase
peri
od is
Feb
ruar
y 1,
1999
thro
ugh
Janu
ary
31,2
000.
Sour
ce:N
ew Y
ork
Dep
artm
ent o
f C
orre
ctio
nal S
ervi
ces.

243
New York Department of Correctional Services Summary
Exhibit F–10. Report Showing Inmates Without Automated Initial SecurityClassification Guidelines (New York DOCS)
Management reports. Exhibit F–11 is an extract from a weekly report that com-pares the classification of inmates with the classification of the facilities in whichthey are housed. This report is critical for monitoring the efficient use of beds. Foreach type of facility, the report shows the distribution of inmates by their securityclassification. (CASAT [Comprehensive Alcohol and Substance Abuse Treatment]is a type of facility that specializes in substance abuse treatment.)
Exhibit F–9. Outstanding Transfer Orders Report (New York DOCS)
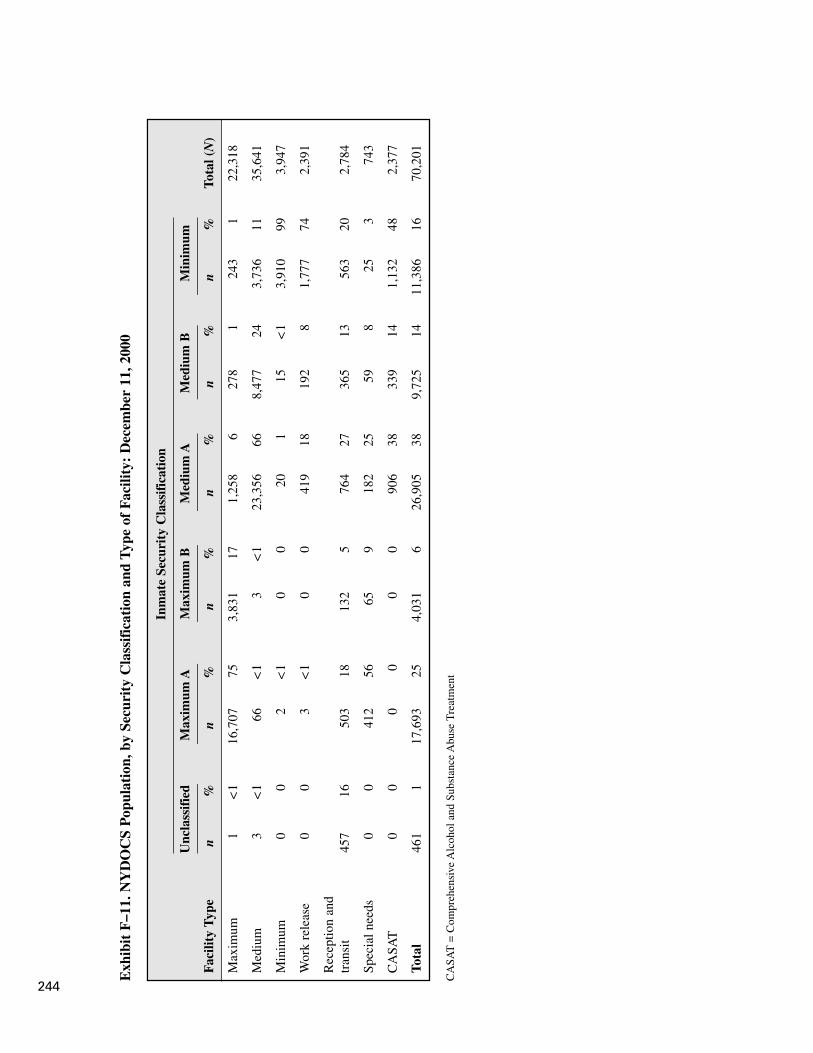
244
Inm
ate
Secu
rity
Cla
ssif
icat
ion
Unc
lass
ifie
dM
axim
um A
Max
imum
BM
ediu
m A
Med
ium
BM
inim
um
Fac
ility
Typ
en
%n
%n
%n
%n
%n
%To
tal (
N)
Max
imum
1<
116
,707
753,
831
171,
258
627
81
243
122
,318
Med
ium
3<
166
<1
3<
123
,356
668,
477
243,
736
1135
,641
Min
imum
00
2<
10
020
115
<1
3,91
099
3,94
7
Wor
k re
leas
e0
03
<1
00
419
1819
28
1,77
774
2,39
1
Rec
eptio
n an
d tr
ansi
t45
716
503
1813
25
764
2736
513
563
202,
784
Spec
ial n
eeds
00
412
5665
918
225
598
253
743
CA
SAT
00
00
00
906
3833
914
1,13
248
2,37
7
Tota
l46
11
17,6
9325
4,03
16
26,9
0538
9,72
514
11,3
8616
70,2
01
Exh
ibit
F–1
1. N
YD
OC
S P
opul
atio
n,by
Sec
urit
y C
lass
ific
atio
n an
d T
ype
of F
acili
ty:
Dec
embe
r 11
,200
0
CA
SAT
= C
ompr
ehen
sive
Alc
ohol
and
Sub
stan
ce A
buse
Tre
atm
ent

Appendix G: Colorado Department of CorrectionsSummary
245
Colorado Department of CorrectionsDirector of Research2862 South Circle DriveColorado Springs, CO 80906719–226–4372
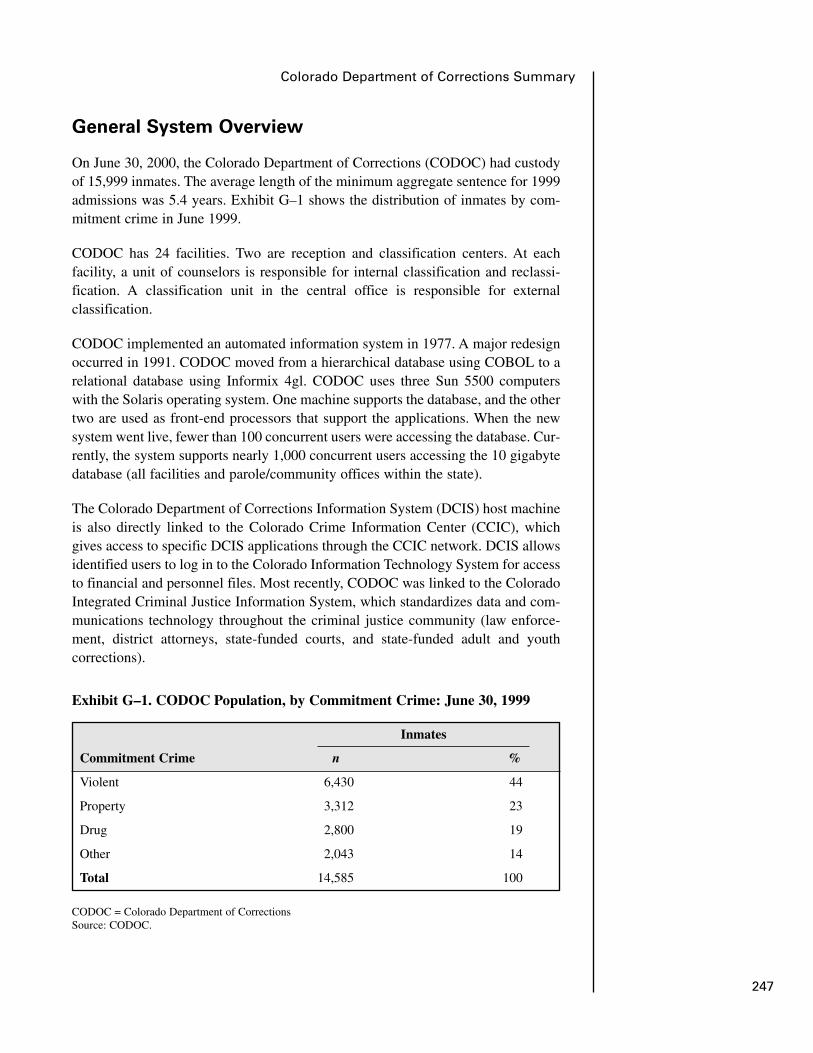
247
Colorado Department of Corrections Summary
General System Overview
On June 30, 2000, the Colorado Department of Corrections (CODOC) had custodyof 15,999 inmates. The average length of the minimum aggregate sentence for 1999admissions was 5.4 years. Exhibit G–1 shows the distribution of inmates by com-mitment crime in June 1999.
CODOC has 24 facilities. Two are reception and classification centers. At eachfacility, a unit of counselors is responsible for internal classification and reclassi-fication. A classification unit in the central office is responsible for externalclassification.
CODOC implemented an automated information system in 1977. A major redesignoccurred in 1991. CODOC moved from a hierarchical database using COBOL to arelational database using Informix 4gl. CODOC uses three Sun 5500 computerswith the Solaris operating system. One machine supports the database, and the othertwo are used as front-end processors that support the applications. When the newsystem went live, fewer than 100 concurrent users were accessing the database. Cur-rently, the system supports nearly 1,000 concurrent users accessing the 10 gigabytedatabase (all facilities and parole/community offices within the state).
The Colorado Department of Corrections Information System (DCIS) host machineis also directly linked to the Colorado Crime Information Center (CCIC), whichgives access to specific DCIS applications through the CCIC network. DCIS allowsidentified users to log in to the Colorado Information Technology System for accessto financial and personnel files. Most recently, CODOC was linked to the ColoradoIntegrated Criminal Justice Information System, which standardizes data and com-munications technology throughout the criminal justice community (law enforce-ment, district attorneys, state-funded courts, and state-funded adult and youthcorrections).
Exhibit G–1. CODOC Population, by Commitment Crime: June 30, 1999
CODOC = Colorado Department of CorrectionsSource: CODOC.
Commitment Crime n %
Violent 6,430 44
Property 3,312 23
Drug 2,800 19
Other 2,043 14
Total 14,585 100
Inmates
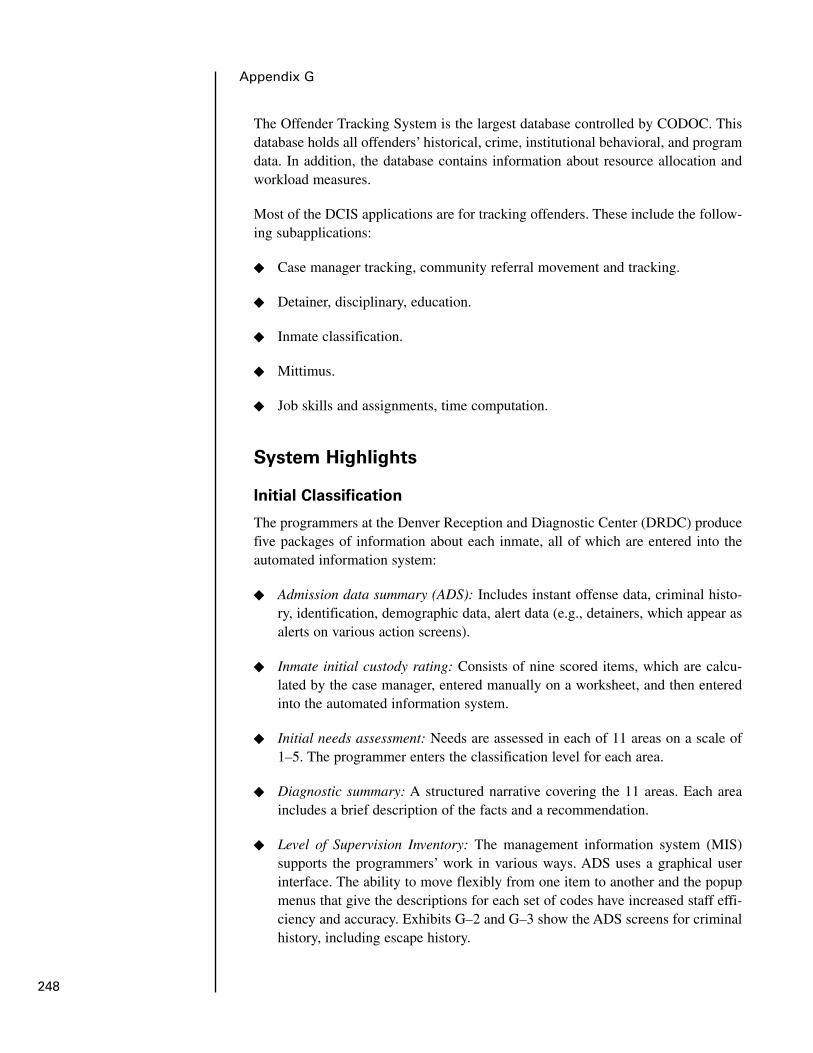
248
Appendix G
The Offender Tracking System is the largest database controlled by CODOC. Thisdatabase holds all offenders’ historical, crime, institutional behavioral, and programdata. In addition, the database contains information about resource allocation andworkload measures.
Most of the DCIS applications are for tracking offenders. These include the follow-ing subapplications:
� Case manager tracking, community referral movement and tracking.
� Detainer, disciplinary, education.
� Inmate classification.
� Mittimus.
� Job skills and assignments, time computation.
System Highlights
Initial Classification
The programmers at the Denver Reception and Diagnostic Center (DRDC) producefive packages of information about each inmate, all of which are entered into theautomated information system:
� Admission data summary (ADS): Includes instant offense data, criminal histo-ry, identification, demographic data, alert data (e.g., detainers, which appear asalerts on various action screens).
� Inmate initial custody rating: Consists of nine scored items, which are calcu-lated by the case manager, entered manually on a worksheet, and then enteredinto the automated information system.
� Initial needs assessment: Needs are assessed in each of 11 areas on a scale of1–5. The programmer enters the classification level for each area.
� Diagnostic summary: A structured narrative covering the 11 areas. Each areaincludes a brief description of the facts and a recommendation.
� Level of Supervision Inventory: The management information system (MIS)supports the programmers’ work in various ways. ADS uses a graphical userinterface. The ability to move flexibly from one item to another and the popupmenus that give the descriptions for each set of codes have increased staff effi-ciency and accuracy. Exhibits G–2 and G–3 show the ADS screens for criminalhistory, including escape history.
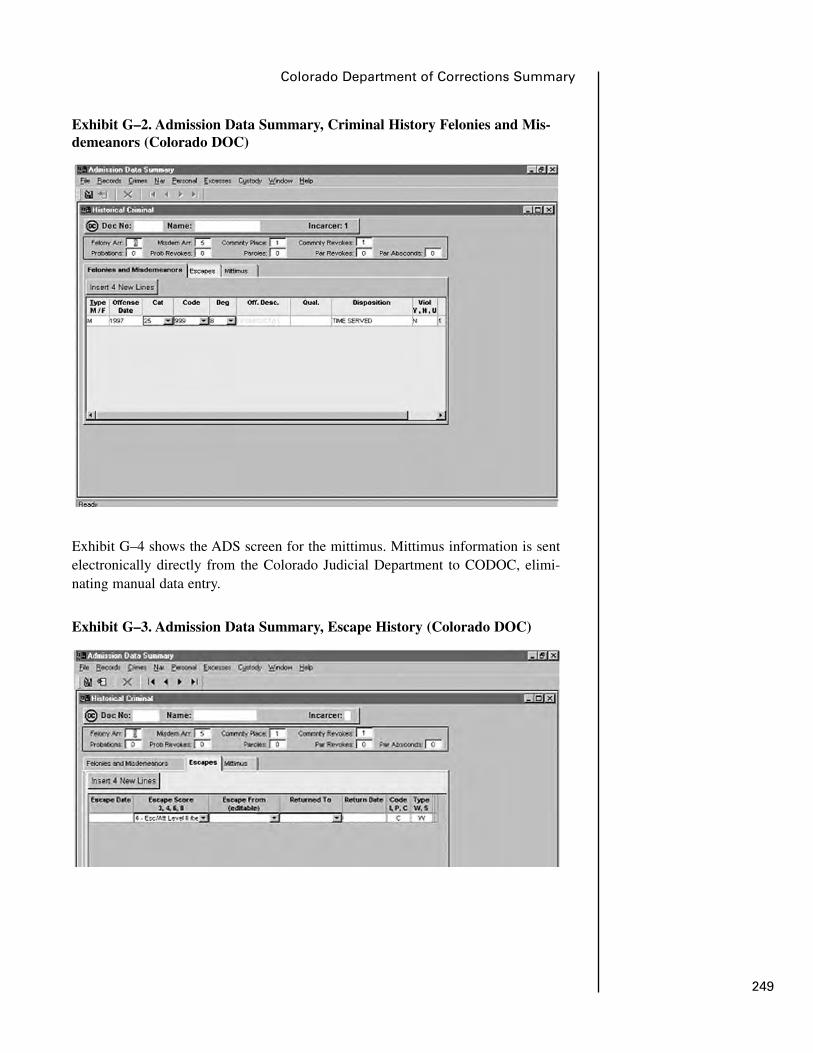
249
Colorado Department of Corrections Summary
Exhibit G–4 shows the ADS screen for the mittimus. Mittimus information is sentelectronically directly from the Colorado Judicial Department to CODOC, elimi-nating manual data entry.
Exhibit G–2. Admission Data Summary, Criminal History Felonies and Mis-demeanors (Colorado DOC)
Exhibit G–3. Admission Data Summary, Escape History (Colorado DOC)
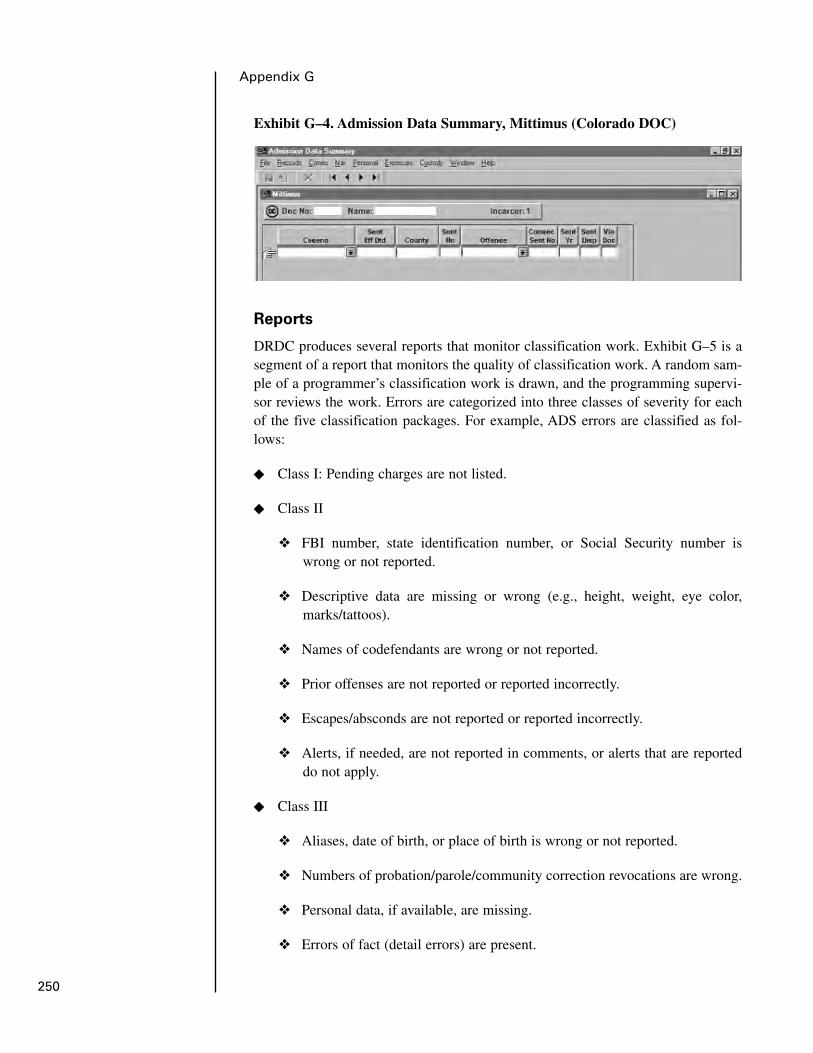
250
Appendix G
Reports
DRDC produces several reports that monitor classification work. Exhibit G–5 is asegment of a report that monitors the quality of classification work. A random sam-ple of a programmer’s classification work is drawn, and the programming supervi-sor reviews the work. Errors are categorized into three classes of severity for eachof the five classification packages. For example, ADS errors are classified as fol-lows:
� Class I: Pending charges are not listed.
� Class II
❖ FBI number, state identification number, or Social Security number iswrong or not reported.
❖ Descriptive data are missing or wrong (e.g., height, weight, eye color,marks/tattoos).
❖ Names of codefendants are wrong or not reported.
❖ Prior offenses are not reported or reported incorrectly.
❖ Escapes/absconds are not reported or reported incorrectly.
❖ Alerts, if needed, are not reported in comments, or alerts that are reporteddo not apply.
� Class III
❖ Aliases, date of birth, or place of birth is wrong or not reported.
❖ Numbers of probation/parole/community correction revocations are wrong.
❖ Personal data, if available, are missing.
❖ Errors of fact (detail errors) are present.
Exhibit G–4. Admission Data Summary, Mittimus (Colorado DOC)
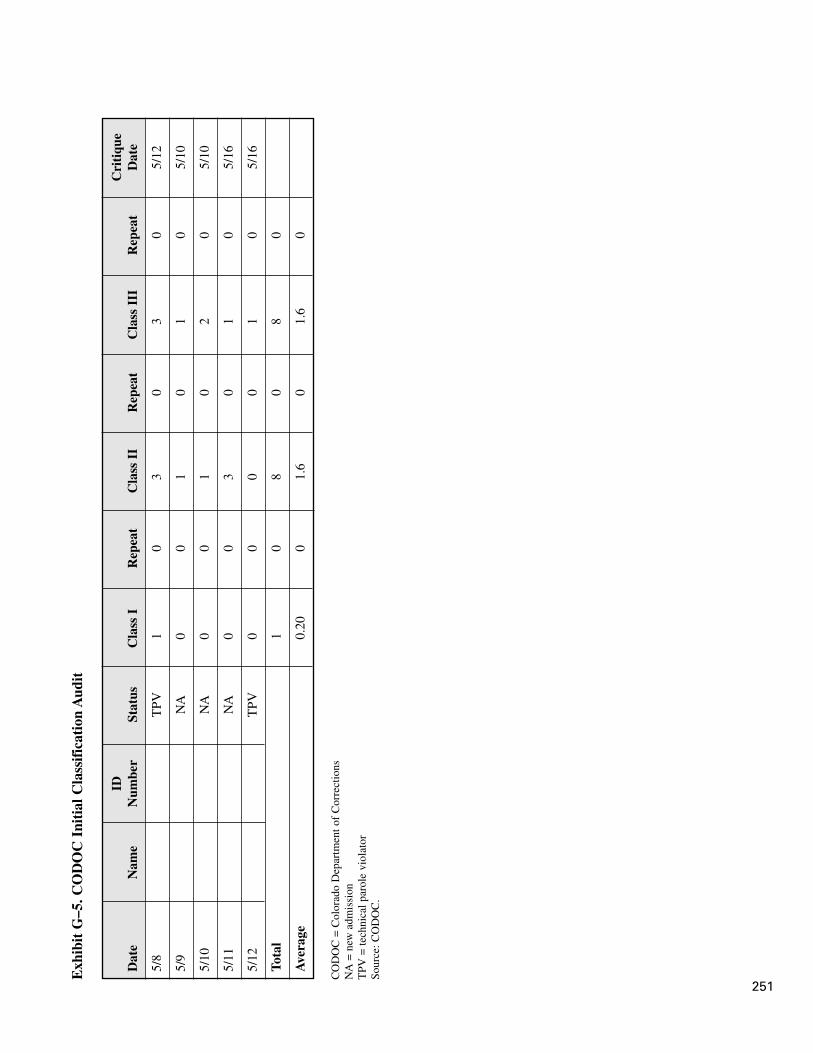
251
Exh
ibit
G–5
. CO
DO
C I
niti
al C
lass
ific
atio
n A
udit
IDC
riti
que
Dat
eN
ame
Num
ber
Stat
usC
lass
IR
epea
tC
lass
II
Rep
eat
Cla
ss I
IIR
epea
tD
ate
5/8
TPV
10
30
30
5/12
5/9
NA
00
10
10
5/10
5/10
NA
00
10
20
5/10
5/11
NA
00
30
10
5/16
5/12
TPV
00
00
10
5/16
Tota
l1
08
08
0
Ave
rage
0.20
01.
60
1.6
0
CO
DO
C =
Col
orad
o D
epar
tmen
t of
Cor
rect
ions
NA
= n
ew a
dmis
sion
TPV
= te
chni
cal p
arol
e vi
olat
orSo
urce
:CO
DO
C.
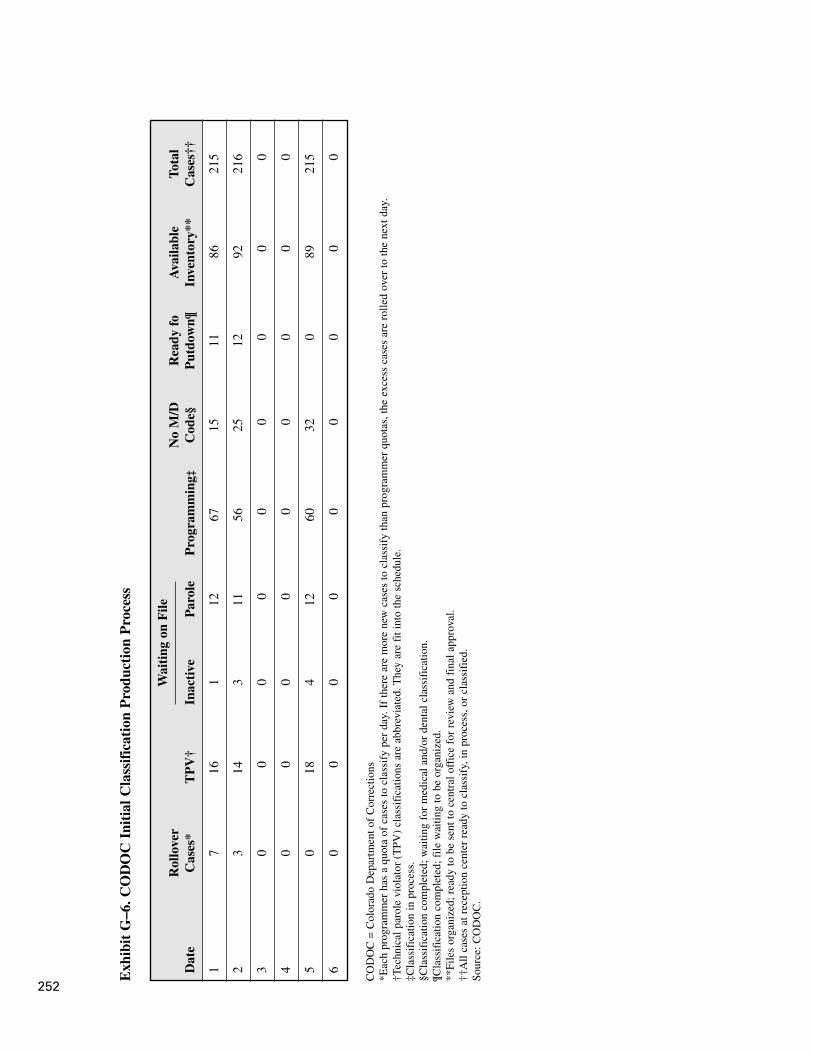
252
Exh
ibit
G–6
. CO
DO
C I
niti
al C
lass
ific
atio
n P
rodu
ctio
n P
roce
ss
Rol
love
rN
o M
/DR
eady
fo
Ava
ilabl
eTo
tal
Dat
eC
ases
*T
PV
†In
acti
veP
arol
eP
rogr
amm
ing‡
Cod
e§P
utdo
wn¶
Inve
ntor
y**
Cas
es††
17
161
1267
1511
8621
5
23
143
1156
2512
9221
6
30
00
00
00
00
40
00
00
00
00
50
184
1260
320
8921
5
60
00
00
00
00
CO
DO
C =
Col
orad
o D
epar
tmen
t of
Cor
rect
ions
*Eac
h pr
ogra
mm
er h
as a
quo
ta o
f ca
ses
to c
lass
ify
per
day.
If
ther
e ar
e m
ore
new
cas
es to
cla
ssif
y th
an p
rogr
amm
er q
uota
s,th
e ex
cess
cas
es a
re r
olle
d ov
er to
the
next
day
.†T
echn
ical
par
ole
viol
ator
(T
PV)
clas
sifi
catio
ns a
re a
bbre
viat
ed. T
hey
are
fit i
nto
the
sche
dule
. ‡C
lass
ific
atio
n in
pro
cess
.§C
lass
ific
atio
n co
mpl
eted
; wai
ting
for
med
ical
and
/or
dent
al c
lass
ific
atio
n.¶C
lass
ific
atio
n co
mpl
eted
; file
wai
ting
to b
e or
gani
zed.
**Fi
les
orga
nize
d; r
eady
to b
e se
nt to
cen
tral
off
ice
for
revi
ew a
nd f
inal
app
rova
l.††
All
case
s at
rec
eptio
n ce
nter
rea
dy to
cla
ssif
y,in
pro
cess
,or
clas
sifi
ed.
Sour
ce:C
OD
OC
.
Wai
ting
on
File

253
Colorado Department of Corrections Summary
Programmers get quick feedback on their work (see “Critique Date” in exhibit G–5),and the audits are incorporated into their annual performance evaluations.
Exhibit G–6 is a segment of a daily report on initial classification productivity. Ini-tial classification is an assembly line (though it need not be impersonal) in which allthe different disciplines (case manager, medical, records management, etc.) aretightly integrated, and each must produce the information that the other needs ontime. The total product must move along on schedule because, for newly admittedinmates to have a bed, old inmates must be classified and moved out.
Exhibit G–6 enables a supervisor to see the size of the classified pool, the backlogof unfinished cases, and the reasons they are unfinished, so that he or she can nudgethe process along before a crisis arises.
Internal Program/Work Assignment
The Master Program Scheduling system (MPS) is an MIS that supports internal pro-gram and work assignments. At initial classification, inmate needs have been meas-ured on nine dimensions (e.g., academic, vocational, substance abuse, work) on a5-point scale. Given this initial classification, MPS structures the information need-ed to match inmate needs with facility resources and needs. MPS has four compo-nents:
� Master program schedule.
� Offender program referral.
� Offender program assignment.
� Offender evaluation.
Exhibit G–7 is an example of a master program schedule. It provides the structurein which a program provider can enter all the necessary information about a pro-gram. In this case, the program is a work program.
The case manager seeking to assign an inmate to a program can determine vacan-cies by querying the MPS quota report. As shown in exhibit G–8, the case managerhas queried all the therapeutic community programs in facility AC. The case man-ager can query a wider or narrower range of programs in the facility.
The case manager can then submit an electronic referral to a program and receivean electronic response. The program provider enters the inmate’s program perform-ance on the “Offender Evaluation” screen, which in turn updates the inmate’s needs.MPS combines individual cases to produce several data summaries in addition to thequota report. Some of them are the following:
� Offender schedule: Displays an inmate’s program schedule for a day or a week.

� Offender list: Displays all programs in which an inmate is enrolled, referred, orwait-listed.
� Program list: Displays the offender list sorted by program instead of inmate.
� Offender skills and needs list: Lists all of an inmate’s skills and needs.
� Facility schedule: Lists all programs at a facility, by hour and day.
254
Appendix G
Exhibit G–7. Master Program Schedule Screen (Colorado DOC)
Exhibit G–8. Master Program Scheduling Quota Screen (Colorado DOC)
User Feedback Form
Please complete and return this form to assist the National Institute of Corrections in assessing the valueand utility of its publications. Detach from the document and mail to:
Publications FeedbackNational Institute of Corrections320 First Street N.W.Washington, DC 20534
1. What is your general reaction to this document?
______Excellent ______Good ______Average ______Poor ______Useless
2. To what extent do you see the document as being useful in terms of:
3. Do you believe that more should be done in this subject area? If so, please specify the types of assistance needed.____________________________________________________________________
4. In what ways could this document be improved? ________________________________________________
5. How did this document come to your attention? ____________________________________________
6. How are you planning to use the information contained in this document?__________________________
7. Please check one item that best describes your affiliation with corrections or criminal justice.If a governmental program, please also indicate the level of government.
_____ Citizen group _____ Legislative body_____ College/University _____ Parole_____ Community corrections _____ Police_____ Court _____ Probation_____ Department of corrections or prison _____ Professional organization_____ Jail _____ Other government agency_____ Juvenile justice _____ Other (please specify)
8. Optional:
Name: ____________________________________________________________________________
Agency: ____________________________________________________________________________
Address: __________________________________________________________________________
Telephone:__________________________________________________________________________
Useful Of some use Not useful
Providing new or important information
Developing or implementing new programs
Modifying existing programs
Administering ongoing programs
Providing appropriate liaisons
Enhancing PrisonClassification Systems
✂


![laudon mis12 ppt07 [โหมดความเข้ากันได้] · PDF fileManagement Information Systems CHAPTER 7: TELECOMMUNICATIONS, THE INTERNET, Telecommunications](https://static.fdocuments.net/doc/165x107/5a773dfc7f8b9a93088db61f/laudon-mis12-ppt07-.jpg)


