Designing Electricity Auctions Natalia Fabra, Nils-Henrik von der

1
PSERC
The Efficiency of Uniform-Price Electricity Auctions:
Evidence from Bidding Behavior in ERCOT
Steve Puller, Texas A&M
(research joint with Ali Hortacsu, University of Chicago)
PSERC Tele-Seminar, March 4, 2008.

2
PSERC
Outline of Presentation
• What makes an electricity market “efficient”?• Do balancing auctions provide incentives for
generators to bid in a manner that promotes efficiency?
• Evidence from ERCOT:– How much inefficiency?– What is the cause of inefficient bidding behavior?
• Implications for two types of stakeholders:– Market monitors– Generators

3
PSERC
What Is an “Efficient” Wholesale Market?
• Price is the marginal cost (MC), or the cost of last MWh required to serve load
• Short run:– If most efficient units not scheduled day-ahead,
signals optimal “reshuffling” of generation to get least cost dispatch.
• Long run:– Signals value/location of new generation

4
PSERC
Problems with Generators Submitting Bids ≠ Marginal Cost
• Typical concern: large generator bidding (INC) substantially above MC– Prices “high”– May withhold low cost units to raise the price
• Small generator bidding (INC) substantially above MC– Prices “high”– Inefficient dispatch
• Any generator bidding (DEC) substantially below MC– Prices too low!– Inefficient dispatch

5
PSERC
Simple Example• Units have MC varying from $30 to $120• Given load, least cost dispatch Price=$80• Generator A:
– Owns $100 unit– Signed bilateral deal so schedules unit day-ahead
• Generator B:– Owns $60 unit– Only scheduled half of capacity day-ahead
• Efficiency: A will DEC, B will INC• Bad outcome:
– A submits a (low) $40 DEC bid– B submits a (high) $120 INC bid

6
PSERC
Market Power in a Balancing Market
• Suppose no further contract obligations upon entering balancing market
• INCremental demand periods– Bid above MC to raise revenue on
inframarginal sales– Just “monopolist on residual demand”
• DECremental demand periods– Bid below MC to reduce output– Make yourself “short” but drive down the
price of buying your short position (monopsony)

7
PSERC
Texas Electricity Market
• ERCOT balancing market opened August 2001• Incumbents
– Implicit contracts to serve non-switching customers at regulated price
• Various merchant generators
8
PSERC
Electricity Market Mechanics• Forward contracting
– Generators contract w/ buyers beforehand for a delivery quantity and price
– Day before production: fixed quantities of supply and demand are scheduled w/ grid operator
– (Generators may be net short or long on their contract quantity)
• Spot (balancing) market– Centralized market to balance realized demand with
scheduled supply– Generators submit “supply functions” to increase or
decrease production from day-ahead schedule

9
PSERC
Balancing Energy Market
• Approx 2-5% of energy traded (“up” and “down”)– “up” bidding price to receive to produce more– “down” bidding price to pay to produce less
• Uniform-price auction using hourly portfolio bids that clear every 15-minute interval
• Bids: monotonic step functions with up to 40 “elbow points” (20 up and 20 down)
• Market separated into zones if transmission lines congested – we focus on uncongested hours

10
PSERC
Who are the Players?

11
PSERC
Price
Quantity
MCi(q)
QCi
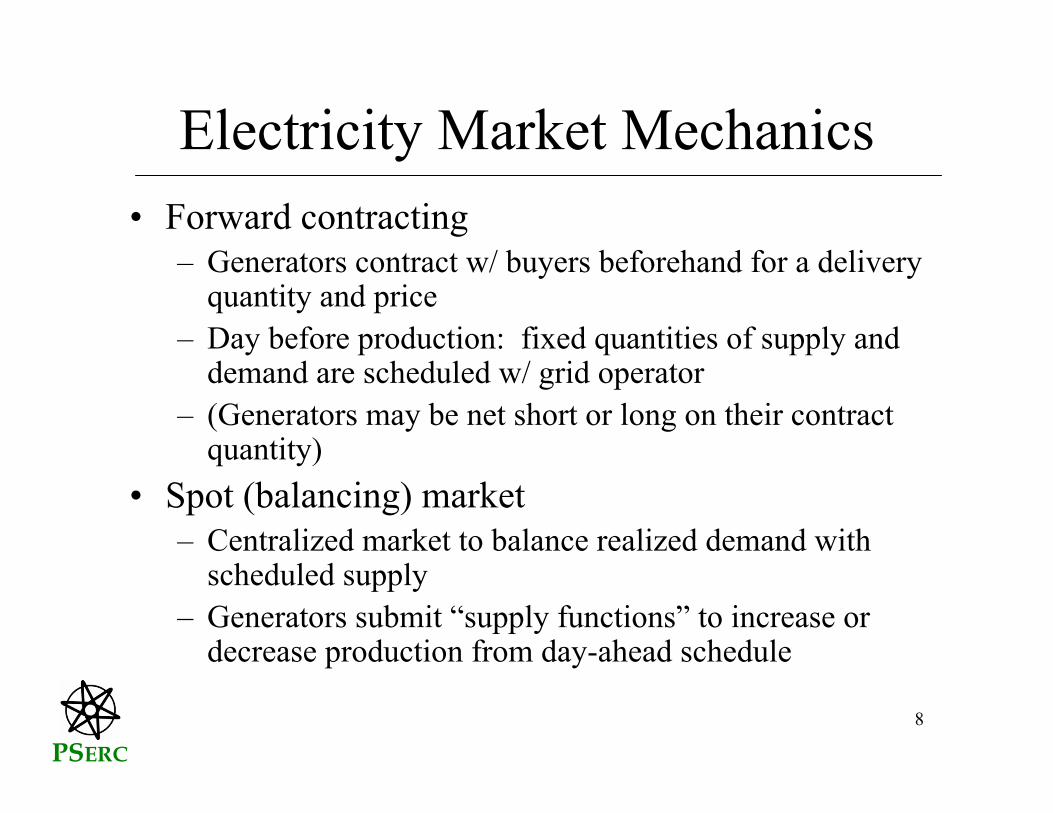
Empirical Strategy
A RD1
MR1
B
MR = Revenue from selling one more MWhMC = Cost of producing one more MWhRD = Max market willing to pay for one more MWh purchased
12
PSERC
Price
Quantity
MCi(q)
QCi
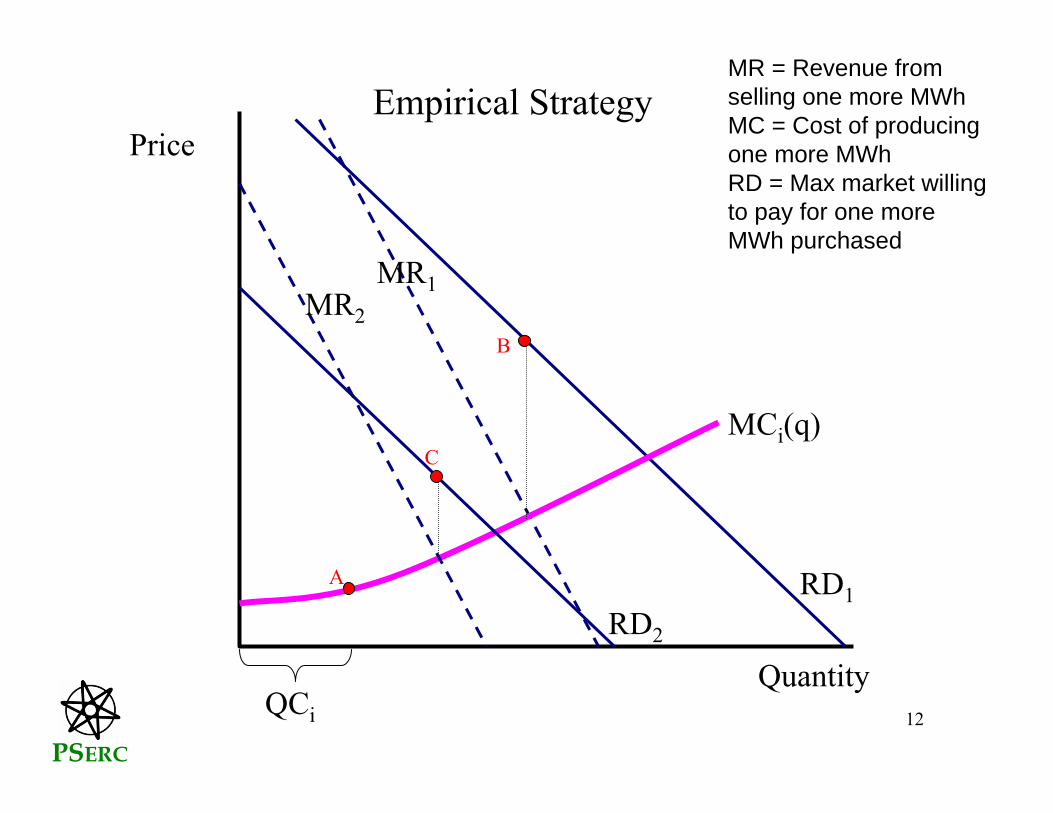
Empirical Strategy
A
C
RD1RD2
MR1MR2
B
MR = Revenue from selling one more MWhMC = Cost of producing one more MWhRD = Max market willing to pay for one more MWh purchased
13
PSERC
Price
Quantity
MCi(q)
QCi
Empirical Strategy
A
C
RD1RD2
MR1MR2
Si* (p)
B
MR = Revenue from selling one more MWhMC = Cost of producing one more MWhRD = Max market willing to pay for one more MWh purchased S = Profit-maximizing bid curve
14
PSERC
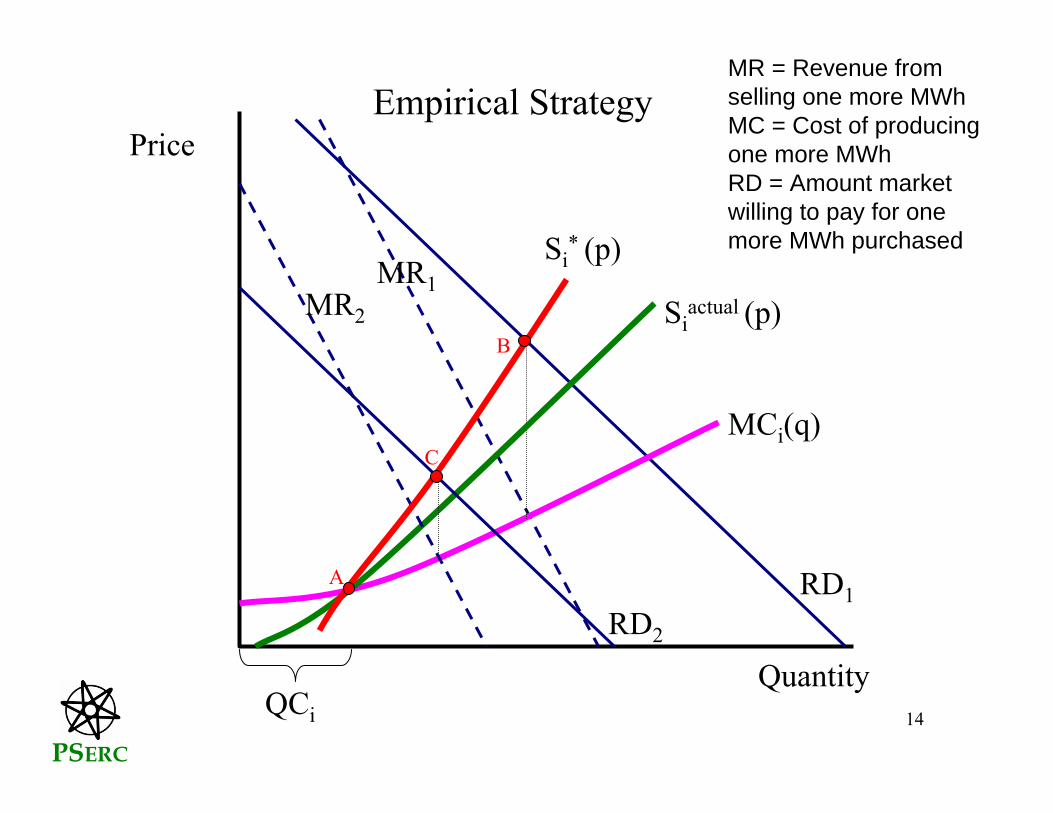
Price
Quantity
Siactual (p)
MCi(q)
QCi
Empirical Strategy
A
C
RD1RD2
MR1MR2
Si* (p)
B
MR = Revenue from selling one more MWhMC = Cost of producing one more MWhRD = Amount market willing to pay for one more MWh purchased

15
PSERC
-2000 -1500 -1000 -500 0 500 1000 15005
10
15
20
25
30
35
40
45
50
Balancing Market Quantity (MW)
Pric
e ($
/MW
h)Reliant on June 4, 2002 6:00-6:15pm
Reliant’sResidual Demand
Reliant’sMC
Reliant’sBid Schedule
Ex Post Optimal Bid
Schedule
16
PSERC
Preview of Results
• Largest firm bids close to benchmarks for optimal bidding
• Small firms significantly deviate, but there’s some evidence of improvement over time
• Efficiency losses from “unsophisticated”bidding at least as large as losses from “market power”

17
PSERC
Uniform-Price Auction Model of ERCOT
• Setup– Static game, N firms, costs of generation Cit(q)– Contract quantity (QCit) and price (PCit)– Total demand – Generators bid supply functions Sit(p)
• Market-clearing price (pc) given by (removing tsubscript from now on):
tt DD ε+=~
∑=
=N
i
ci DpS
1
~)(

18
PSERC
Model (cont’d)
• Ex-post profit:
• Information Structure– Ci(q) common knowledge– Private information:
• QCi
• PCi – but does not affect maximization problem– is unknown
important sources of uncertainty from perspective of bidder i• Rival contract positions (QC-i) and total demand (ε)
D~
π i ic c
i ic c
i iS p p C S p p PC QC= − − −( ) ( ( )) ( )

19
PSERC
Characterization of Bayesian Nash Equilibrium*
)|,(})(ˆ ),({1
)}(ˆ, ~)(ˆ),(Pr{
)}(ˆ, Pr{))(ˆ,(
:),( profilestrategy follow firmsother that given, and )(ˆ functionsupply on lconditiona price, clearing-market of ondistributiyprobabilit thedefine model, auction share (1979) sWilson' Following
)correlated(possibly )|~,( ondistributijoint have ~,
),( :Strategies
iiQC iij
jj
iiij
ijj
iic
i
iiii
iii
ii
QCQCdFDpSQCpS
pSQCDpSQCpS
pSQCpppSpH
QCpSQCpS
QCDQCFDQC
QCpS
i
εεε −×
−∈
−∈
−−
−−
∫ ∑
∑
−
+≥+=
≥+=
≤≡
* NE = A bidding outcome where bidders can’t improve profitability by changing their bid.

20
PSERC
Equilibrium (cont’d)
Bidders choose supply functions to maximize expected profits
max
If is differentiable, necessary condition for pointwise optimality of :
$ ( )
*
* **
*
$ ( ) ( $ ( )) ( ) ( , $ ( ); )
( )
( ( )) ( ( ) ) ( , ( ); )( , ( ); )
S p i i i i ip
p
i i i
i
i i i iS i i
p i i
i
pS p C S p p PC QC dH p S p QC
H(.)S p
p C S p S p QC H p S p QCH p S p QC
− − −
− ′ = −
∫
21
PSERC
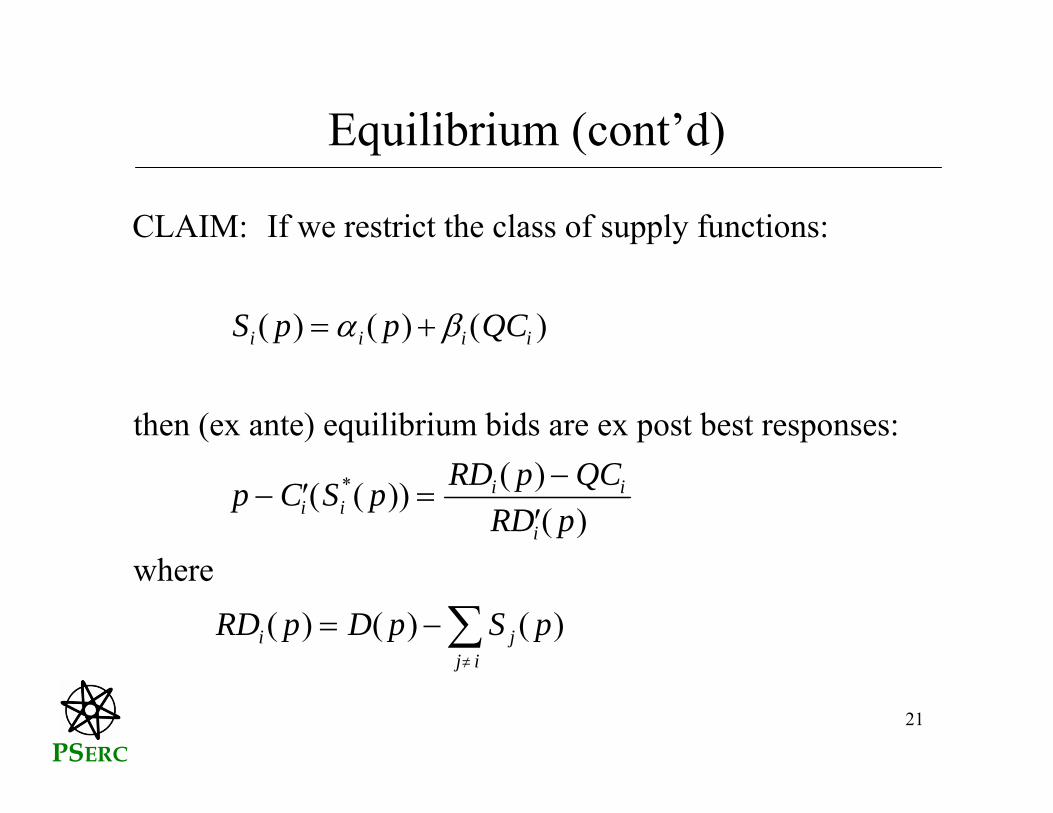
Equilibrium (cont’d)
CLAIM: If we restrict the class of supply functions:
then (ex ante) equilibrium bids are ex post best responses:
where
S p p QC
p C S p RD p QCRD p
RD p D p S p
i i i i
i ii i
i
i jj i
( ) ( ) ( )
( ( )) ( )( )
( ) ( ) ( )
*
= +
− ′ =−′
= −≠∑
α β
22
PSERC
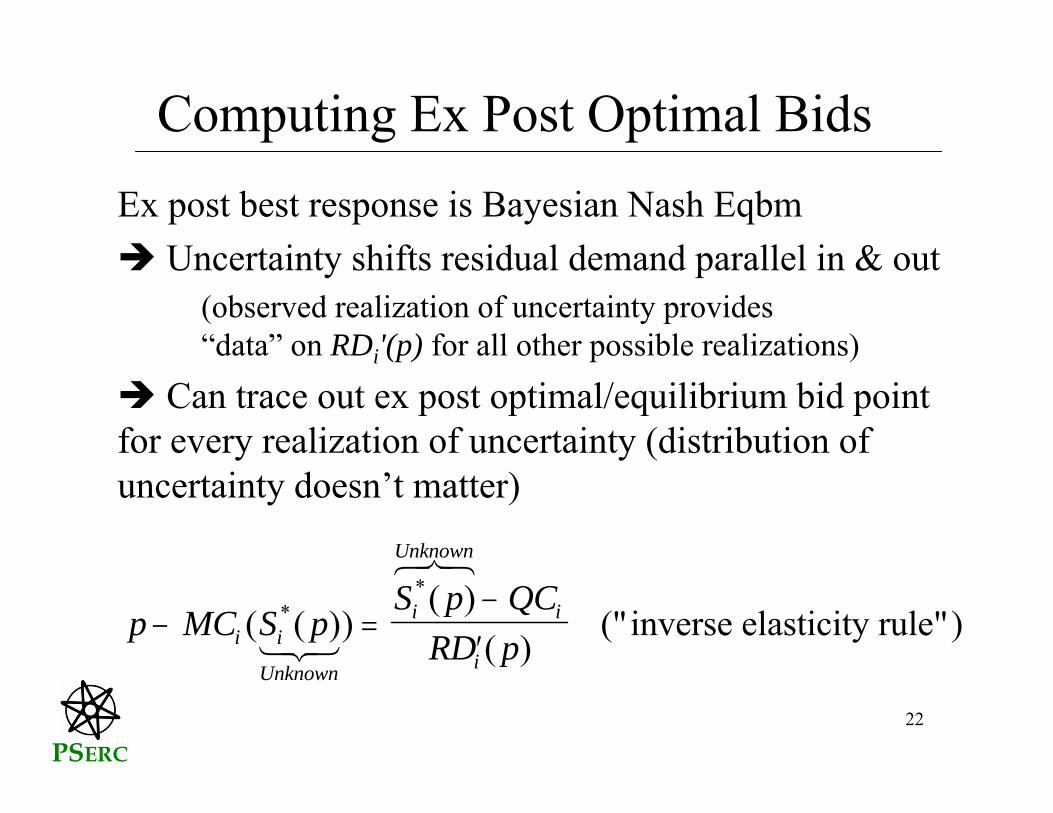
Computing Ex Post Optimal BidsEx post best response is Bayesian Nash Eqbm
Uncertainty shifts residual demand parallel in & out (observed realization of uncertainty provides “data” on RDi'(p) for all other possible realizations)
Can trace out ex post optimal/equilibrium bid point for every realization of uncertainty (distribution of uncertainty doesn’t matter)
p MC S pS p QC
RD pi i
Unknown
i
Unknown
i
i− =
−′
( ( ))( )
( )*
*
123
678
("inverse elasticity rule")

23
PSERC
Sample Bidding Interface

24
PSERC
Data (Sept 2001 thru Jan 2003)• 6:00-6:15pm each day• Bids
– Hourly firm-level bids• Demand in balancing market – assumed perfectly
inelastic• Marginal Costs for each operating fossil fuel unit
• Fuel efficiency – average “heat rates”• Fuel costs – daily natural gas spot prices & monthly
average coal spot prices• Variable O&M• SO2 permit costs
– Each unit’s daily capacity & day-ahead schedule
25
PSERC
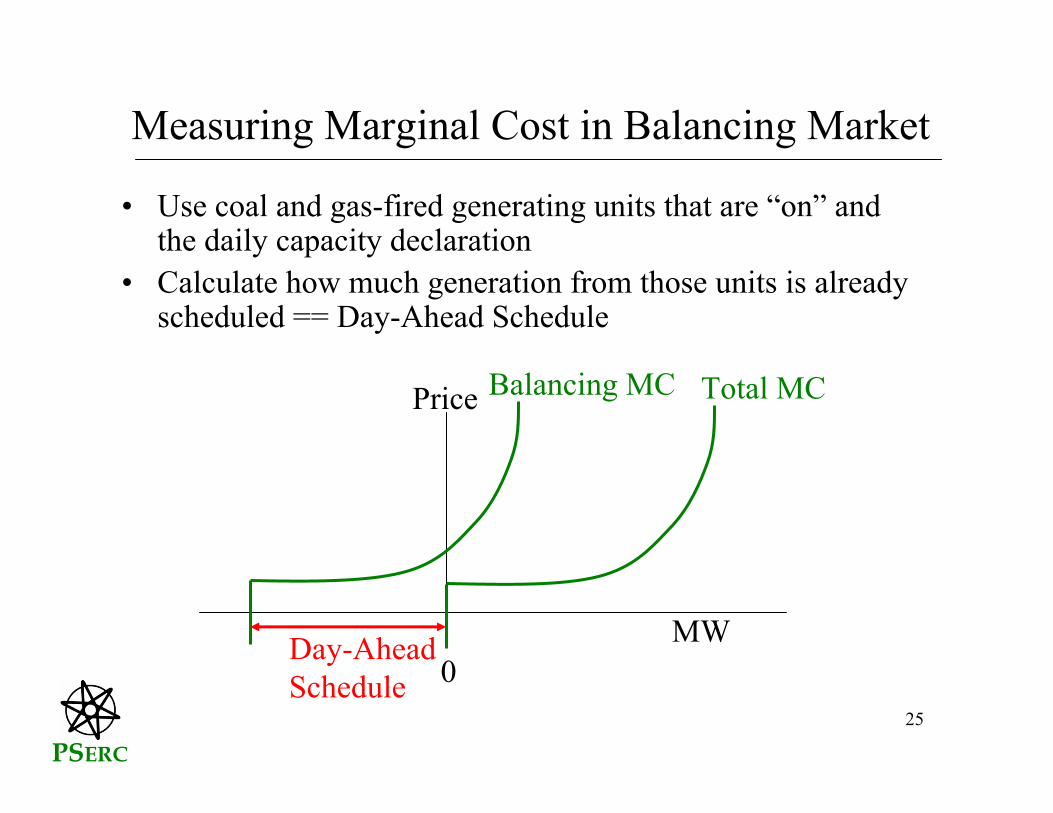
Measuring Marginal Cost in Balancing Market
• Use coal and gas-fired generating units that are “on” and the daily capacity declaration
• Calculate how much generation from those units is already scheduled == Day-Ahead Schedule
Total MCBalancing MC
Day-AheadSchedule
Price
MW0

26
PSERC
Reliant (biggest seller) Example
-2000 -1500 -1000 -500 0 500 1000 1500 20000
5
10
15
20
25
30
35
40
45
50
Balancing Market Quantity (MW)
Pric
e ($
/MW
h)Reliant on February 26, 2002 6:00-6:15pm
Residual DemandEx-post optimal bidMC curveActual Bid curve

27
PSERC
TXU (2nd biggest seller) Example
-2000 -1500 -1000 -500 0 500 1000 1500 20000
5
10
15
20
25
30
35
40
45
50
Balancing Market Quantity (MW)
Pric
e ($
/MW
h)TXU on March 6, 2002 6:00-6:15pm
Residual DemandEx-post optimal bidMC curveActual Bid curve
28
PSERC
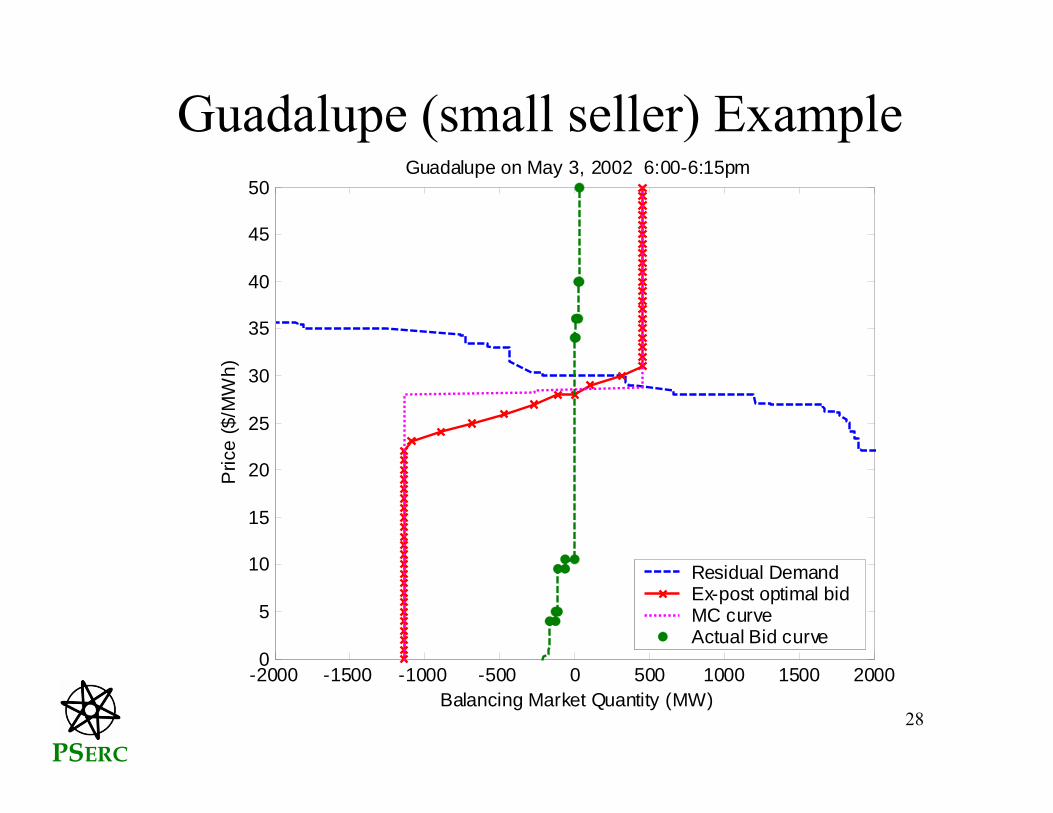
Guadalupe (small seller) Example
-2000 -1500 -1000 -500 0 500 1000 1500 20000
5
10
15
20
25
30
35
40
45
50
Balancing Market Quantity (MW)
Pric
e ($
/MW
h)
Guadalupe on May 3, 2002 6:00-6:15pm
Residual DemandEx-post optimal bidMC curveActual Bid curve

29
PSERC
30
PSERC
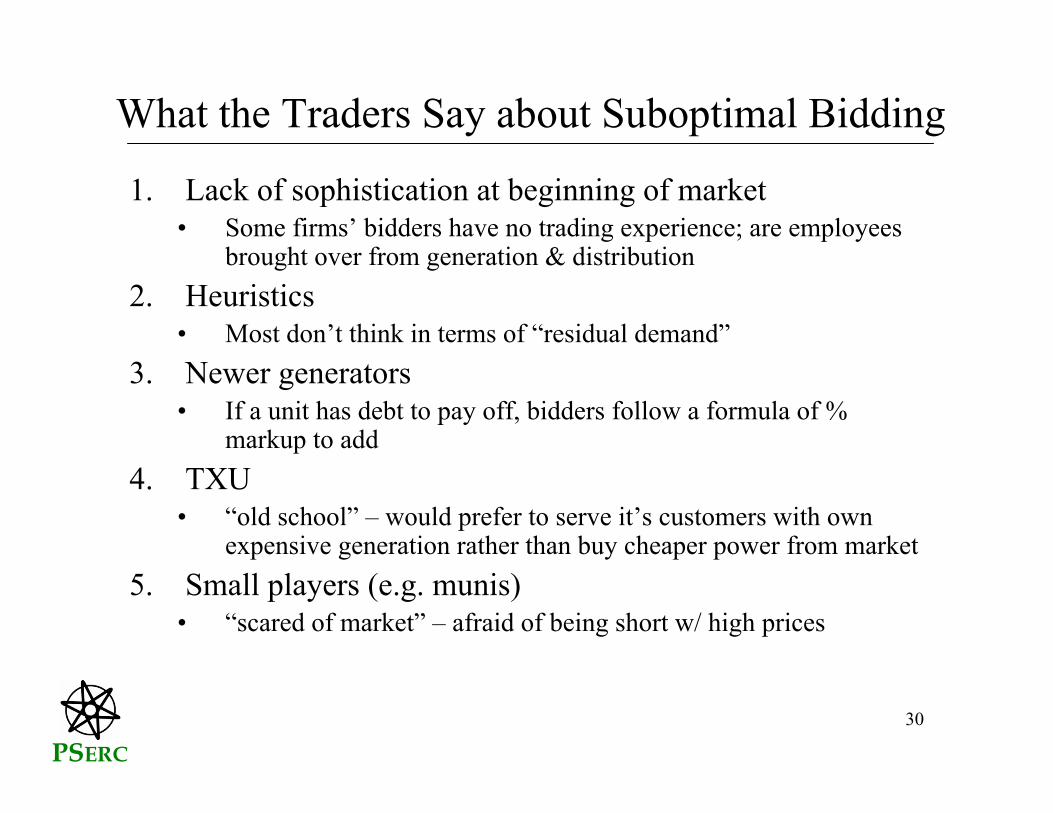
What the Traders Say about Suboptimal Bidding
1. Lack of sophistication at beginning of market• Some firms’ bidders have no trading experience; are employees
brought over from generation & distribution2. Heuristics
• Most don’t think in terms of “residual demand”3. Newer generators
• If a unit has debt to pay off, bidders follow a formula of % markup to add
4. TXU• “old school” – would prefer to serve it’s customers with own
expensive generation rather than buy cheaper power from market5. Small players (e.g. munis)
• “scared of market” – afraid of being short w/ high prices

31
PSERC
Possible Explanations for Deviations from Benchmarks
1. Unmeasured “adjustment costs”2. Transmission constraints3. Collusion / dynamic pricing4. Type of firm5. Stakes matter

32
PSERC
Adjustment Costs?1. Flexible gas-fired units often are marginal
• 70-90% of time for firms serving as own bidders
2. “Bid-ask” spread smaller for firms closer to benchmark• Decreases over time for higher-performing firms
33
PSERC
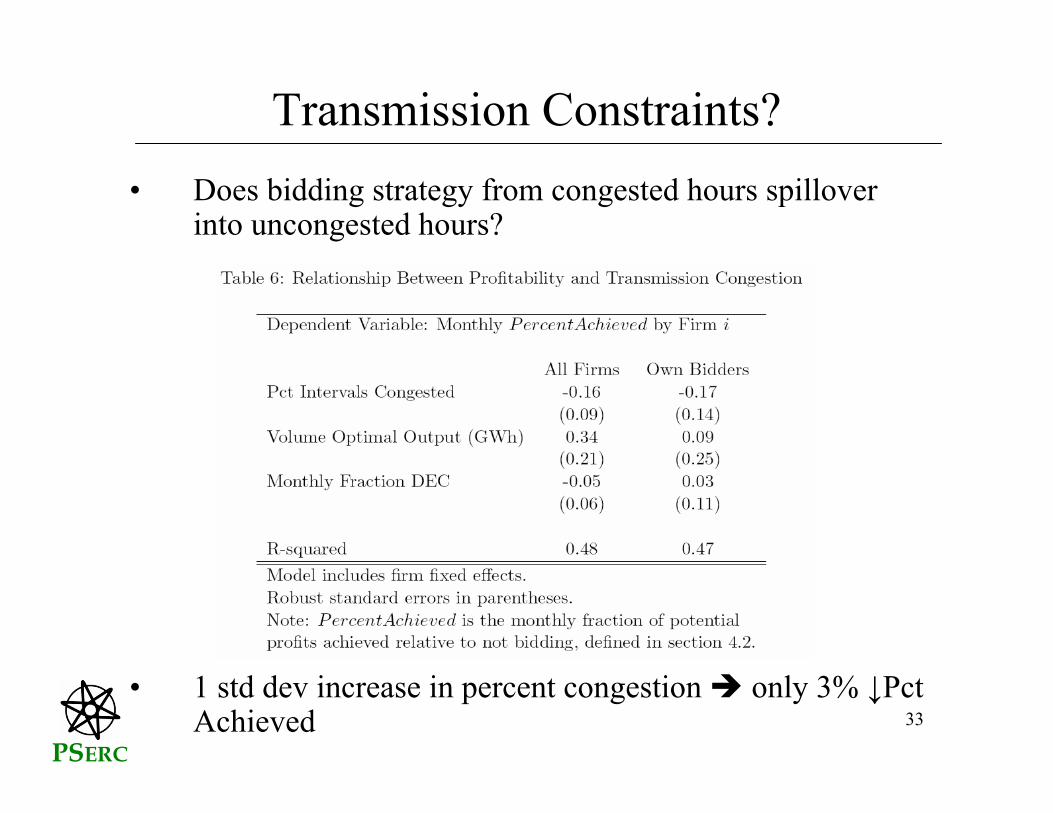
Transmission Constraints?• Does bidding strategy from congested hours spillover
into uncongested hours?
• 1 std dev increase in percent congestion only 3% ↓Pct Achieved
34
PSERC
Collusion?
• Collusion not consistent with large bid-ask spreads
– Collusion smaller sales than ex-post optimal– Bid-ask spread no sales
• Would be small(!) players - unlikely

35
PSERC
Do Stakes Matter?
Bryan**
CalpineCity of Austin**
City of Garland**
LCRA**
Reliant *
South TX Elec Coop**
TXU*
0.1
.2.3
.4.5
.6.7
.8.9
1Fr
actio
n fro
m N
o B
iddi
ng to
Opt
imal
0 100 200 300 400 500Volume of Optimal Output
* = Investor Owned Utility ** = Municipal Utility/Cooperative

36
PSERC
Efficiency Losses from Observed Bidding Behavior
• Which source of inefficiency is larger?– Exercise of market power by large firms?– Bidding “to avoid the market” by “unsophisticated” firms?
– Total efficiency loss = 27%– Fraction “strategic” = 19% Fraction “unsophisticated”=81%!!

37
PSERC
Implications for Market Design
• Production inefficiencies arise from both:– Sophistication (“market power”)– and lack of sophistication (“avoid the market”)
• More participation by small players less market power for large players
• Market monitor should concern itself with:– Bidding by smaller players– Market power on DEC side
• Market design– If strategic complexity imposes large participation
costs, may wish to choose mechanisms with dominant strategy equilibrium (e.g. Vickrey auction)

38
PSERC
For more details, see:http://econweb.tamu.edu/puller/AcadDocs/Hortacsu_Puller.pdf
Thank You!