The Efficacy of Using Synthetic Vision Terrain-Textured ...
12
2002-01-2970 The Efficacy of Using Synthetic Vision Terrain-Textured Images to Improve Pilot Situation Awareness Michael D. Uenking & Monica F. Hughes NASA Langley Research Center ABSTRACT The General Aviation Element of the Aviation Safety Program's Synthetic Vision Systems (SVS) Project is developing technology to eliminate low visibility induced General Aviation (GA) accidents. SVS displays present computer generated 3-dimensional imagery of the surrounding terrain on the Primary Flight Display (PFD) to greatly enhance pilot's situation awareness (SA), reducing or eliminating Controlled Flight into Terrain, as well as Low-Visibility Loss of Control accidents. SVS- conducted research is facilitating development of display concepts that provide the pilot with an unobstructed view of the outside terrain, regardless of weather conditions and time of day. A critical component of SVS displays is the appropriate presentation of terrain to the pilot. An experimental study is being conducted at NASA Langley Research Center (LaRC) to explore and quantify the relationship between the realism of the terrain presentation and resulting enhancements of pilot SA and performance. Composed of complementary simulation and flight test efforts, Terrain Portrayal for Head-Down Displays (TP-HDD) experiments will help researchers evaluate critical terrain portrayal concepts. The experimental effort is to provide data to enable design trades that optimize SVS applications, as well as develop requirements and recommendations to facilitate the certification process. In this part of the experiment a fixed based flight simulator was equipped with various types of Head Down flight displays, ranging from conventional round dials (typical of most GA aircraft) to glass cockpit style PFD's. The variations of the PFD included an assortment of texturing and Digital Elevation Model (DEM) resolution combinations. A test matrix of 10 terrain display configurations (in addition to the baseline displays) were evaluated by 27 pilots of various backgrounds and experience levels. Qualitative (questionnaires) and quantitative (pilot performance and physiological) data were collected during the experimental runs. This paper focuses on the experimental set-up and final physiological results of the TP-HDD simulation experiment. The physiological measures of skin temperature, heart rate, and muscle response, show a decreased engagement (while using the synthetic vision displays as compared to the baseline conventional display) of the sympathetic and somatic nervous system responses which, in turn, indicates a reduced level of mental workload. This decreased level of workload is expected to enable improvement in the pilot's situation and terrain awareness. INTRODUCTION Synthetic Vision Systems (SVS) displays for General Aviation (GA) applications are designed to enhance pilot's situation awareness (SA), radically reducing the occurrence of Controlled Flight into Terrain (CFIT) accidents in addition to reducing or eliminating pilots' spatial disorientation (SD), thus preventing low-visibility induced Aircraft Upset (LVAU) events. LVAU events without recovery can lead to Low Visibility Loss of Control (LVLOC) accidents. Using imagery derived from terrain, obstacle, and airport databases, SVS displays provide the pilot with an unobstructed view of the outside terrain, regardless of weather conditions and time of day. In addition, through the integration of advanced symbology (i.e. highway in the sky, velocity vectors, etc.), navigation performance is drastically improved, with no effective increase in pilot workload. The genesis of the Terrain Portrayal for Head Down Displays (TP-HDD) simulation experiment can be attributed to several factors. Actual requirements for terrain resolutions and texturing methods used to generate imagery on a PFD were previously undefined. In an attempt to utilize current technology avionics platforms with limited computational power, industry SVS displays have evolved with relatively low terrain portrayal fidelity that appear to be achieving substantial improvements in pilot performance over conventional displays (at the time this paper was written, references were not available to document GA industry SVS
Transcript of The Efficacy of Using Synthetic Vision Terrain-Textured ...
2002-01-2970
The Efficacy of Using Synthetic Vision Terrain-Textured Imagesto Improve Pilot Situation Awareness
Michael D. Uenking & Monica F. HughesNASA Langley Research Center
ABSTRACT
The General Aviation Element of the Aviation SafetyProgram's Synthetic Vision Systems (SVS) Project isdeveloping technology to eliminate low visibility inducedGeneral Aviation (GA) accidents. SVS displays presentcomputer generated 3-dimensional imagery of thesurrounding terrain on the Primary Flight Display (PFD)to greatly enhance pilot's situation awareness (SA),
reducing or eliminating Controlled Flight into Terrain, aswell as Low-Visibility Loss of Control accidents. SVS-conducted research is facilitating development of displayconcepts that provide the pilot with an unobstructed viewof the outside terrain, regardless of weather conditionsand time of day. A critical component of SVS displays isthe appropriate presentation of terrain to the pilot. Anexperimental study is being conducted at NASA LangleyResearch Center (LaRC) to explore and quantify therelationship between the realism of the terrainpresentation and resulting enhancements of pilot SA andperformance. Composed of complementary simulationand flight test efforts, Terrain Portrayal for Head-DownDisplays (TP-HDD) experiments will help researchersevaluate critical terrain portrayal concepts. Theexperimental effort is to provide data to enable designtrades that optimize SVS applications, as well asdevelop requirements and recommendations to facilitatethe certification process.
In this part of the experiment a fixed based flightsimulator was equipped with various types of HeadDown flight displays, ranging from conventional rounddials (typical of most GA aircraft) to glass cockpit stylePFD's. The variations of the PFD included an
assortment of texturing and Digital Elevation Model(DEM) resolution combinations. A test matrix of 10terrain display configurations (in addition to the baselinedisplays) were evaluated by 27 pilots of variousbackgrounds and experience levels. Qualitative(questionnaires) and quantitative (pilot performance andphysiological) data were collected during theexperimental runs.
This paper focuses on the experimental set-up and final
physiological results of the TP-HDD simulationexperiment. The physiological measures of skintemperature, heart rate, and muscle response, show adecreased engagement (while using the synthetic visiondisplays as compared to the baseline conventionaldisplay) of the sympathetic and somatic nervous systemresponses which, in turn, indicates a reduced level ofmental workload. This decreased level of workload is
expected to enable improvement in the pilot's situationand terrain awareness.
INTRODUCTION
Synthetic Vision Systems (SVS) displays for GeneralAviation (GA) applications are designed to enhancepilot's situation awareness (SA), radically reducing theoccurrence of Controlled Flight into Terrain (CFIT)accidents in addition to reducing or eliminating pilots'spatial disorientation (SD), thus preventing low-visibilityinduced Aircraft Upset (LVAU) events. LVAU eventswithout recovery can lead to Low Visibility Loss of
Control (LVLOC) accidents. Using imagery derived fromterrain, obstacle, and airport databases, SVS displaysprovide the pilot with an unobstructed view of the outsideterrain, regardless of weather conditions and time ofday. In addition, through the integration of advancedsymbology (i.e. highway in the sky, velocity vectors,etc.), navigation performance is drastically improved,with no effective increase in pilot workload.
The genesis of the Terrain Portrayal for Head DownDisplays (TP-HDD) simulation experiment can beattributed to several factors. Actual requirements forterrain resolutions and texturing methods used to
generate imagery on a PFD were previously undefined.In an attempt to utilize current technology avionicsplatforms with limited computational power, industrySVS displays have evolved with relatively low terrainportrayal fidelity that appear to be achieving substantialimprovements in pilot performance over conventionaldisplays (at the time this paper was written, referenceswere not available to document GA industry SVS

performanceimprovements).ThesenewindustrySVSdisplaysutilizelowto mediumDigitalElevationModel(DEM)resolutiondatabases(in the 30arc-secrange)andsimpleterraintexturingconcepts.In contrast,theRTCA (Special Committee193 (SC-193) andEUROCAEWorking Group 44 (WG-44)) haveprescribeddatabaseresolutionrequirementsintendedtomeetforeseeableaviationapplicationsthat are muchhigherthan currentindustrySVS applications.TheRTCAcommitteerecommends3 arc-secDEMfor enrouteoperations,1arc-secDEMforterminaloperations,and.3 arc-secDEMfor surfaceoperations[1]. As aresult,aninconsistencyexistsbetweenGAindustrySVSDEMdatausageandtheRTCArecommendations.Inaddition,there is a pervasivebeliefamongvariouselementswithin the aviationcommunitythat high-resolutionDEM data alwaysprovidessignificantlysuperiorpilot SA and betterpilot performancethanlower-resolutionDEMdata.Thisbeliefis fueled,inpart,by elaboratepicturesof high-fidelityterrainportrayalSVSconcepts.Whilehigherfidelityterrainportrayalscanbe appliedto SVSterraindisplays,there is aninherentincreasein SVSsystemcomplexityandcost.PreviousSVSresearchhasdemonstratedthatvariousconceptscanwork;however,proportionalbenefitsofhigh-fidelitySVSimagerywereunknownpriorto thiseffort. In-depthresearchto help definethe terrainportrayalrequirementsforSVSdisplaysisneeded.ThecombinedTP-HDDsimulationandflighteffortsexplorestheseissuesinorderto attemptto generatecriticaldatathat will provide a basis for recommendationsappropriateforallSVSapplications,withafocusonGA.
WhilepreviousstudieshavebeenconductedregardingtheunderstandingofSAandSD,leadingtosomenovelconcepts,onlyrelativelyminorprogresshasbeenmadetowardsmeasuringtheeffectivenessoftheseadvancedflightdisplayconcepts[2-8].As aninitialinvestigation,the SVS-GAteamconducteda studythatfocusedondeterminingthe associatedbenefitsof SVSdisplaystowardsreducingLVLOCandCFITaccidentsfor GApilots[2]. Resultsof thatfixed-basedsimulatorstudydemonstratedtheeffectivenessofgenericSVSdisplaysascomparedtoconventionalGAflightdecksinreducingpiloterrorsandthusimprovingpilotabilityto controltheaircraftduringIMC. Thecurrentstudybuildsuponresultsfrom reference2 and in additionprovidesevaluationofmultipleSVSdisplayconcepts.
OBJECTIVESOFTHETP-HDDEXPERIMENT
Oneoftheprimarychallengesof SVSasa PFDisthepresentationof appropriateinformationin a costeffectiveandcomputationallyviablemanner.TheTP-HDDexperimentsfocusspecificallyon the aspectofportrayingterraineffectivelyona PFD. As previouslymentioned,theTP-HDDstudyconsistedof twodistinctefforts. The first (currentstudy)focusedon flightsimulationwhilethesubsequentphaseofthestudywasaflightexperiment,employingtheNASALaRCCessna206researchaircraft.
Theobjectivesof the TP-HDDsimulationexperimentwere to establishthe relationshipbetweenterraindepictionfidelity and pilots' terrain SA, pilots'performance(controlandnavigation),andpreventionofLVLOC/LVAUincidents.Anotherobjectiveofthisstudywas to demonstratethat non-instrumentratedpilotswereableto fly approachesto an acceptablelevelofprecision,withminimaltraining,usinganSVSPFDwithtunnelsymbology. Flight-testingwas employedtoconfirmandextendsimulationresults.Thefinaloverallgoalof TP-HDDtestingwas to furtherestablishtheoverallbenefitofSVSforGApilots.
Severalmeasureswererecordedinorderto determinelevelsof workloadandsituationawarenessduringtheTP-HDDexperiment.In additionto performancedata,NASATaskLoadIndex(TLX)ratingswerecollected,aswellas SituationAwarenessRatingTechnique(SART)measuresand Cooper-Harperratings. Physiologicaldatawererecordedandanalyzedas a supplementtotheseothertypesof measures,providinga meansforinterpretingthedatainorderto drawviableconclusions.
Inaddition,thisexperimentdirectlyprovidedsupportforthe FederalAviationAdministration(FAA)Capstone-2certificationissues. The Capstone-2programisendeavoringto developandsupplynewandemergingavionicstechnologiesto thecommercialaircraftfleetinJuneau,Alaska,to reducethe extremelyhigh-rateofaircraftaccidentsin thatarea. OnetechnologybeingemployedforCapstone-2isSVSdisplays.
METHOD
The experiment was conducted using a fixed-basedsimulator equipped with a strategic (navigation) and atactical (primary) flight display. Various terrain portrayalconcepts were developed from combinations of DEMresolutions and texturing concepts for the PFD. Thesedisplays were evaluated in the General AviationWorkStation (GAWS) facility at NASA Langley ResearchCenter. Twenty-seven subject pilots participated in theTP-HDD simulation experiment.
DISPLAY CONCEPTS
The display concepts evaluated can be grouped intothree types. One type of display replicated conventional
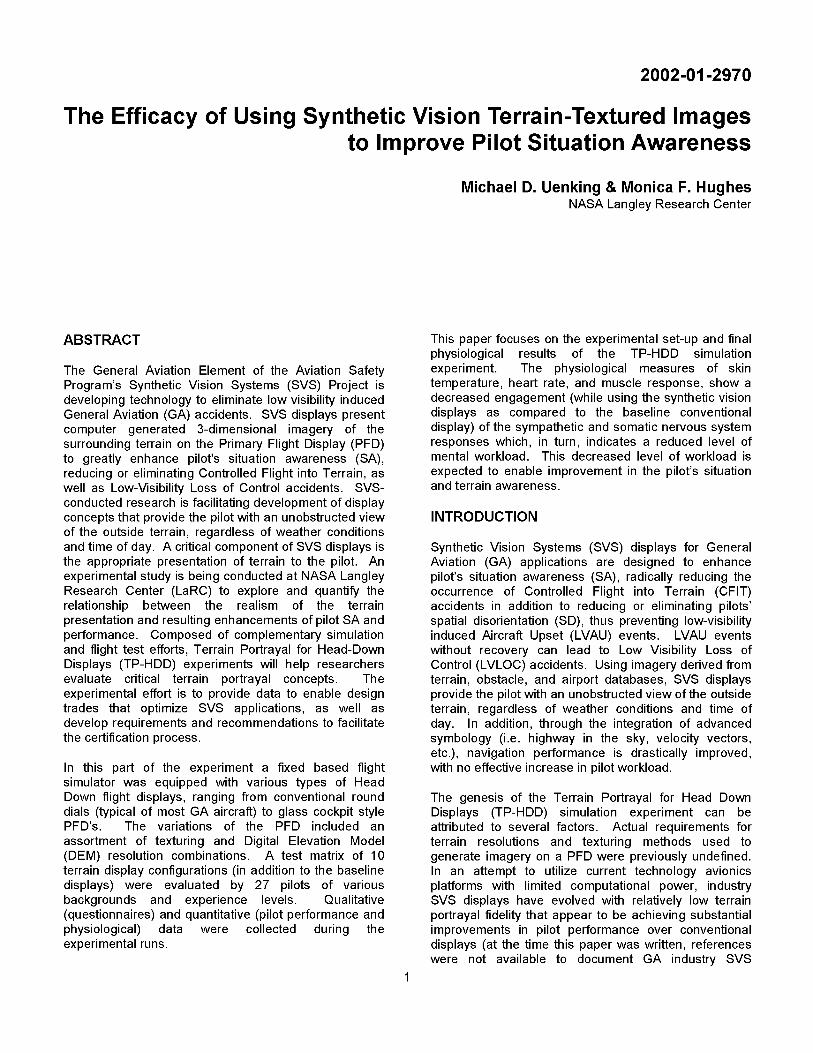
PFD's and was referred to as the blue-sky/brown ground(BSBG) concept. PFD's feature integrated information(i.e. airspeed, altitude, attitude) into one display (seeFigure 1).
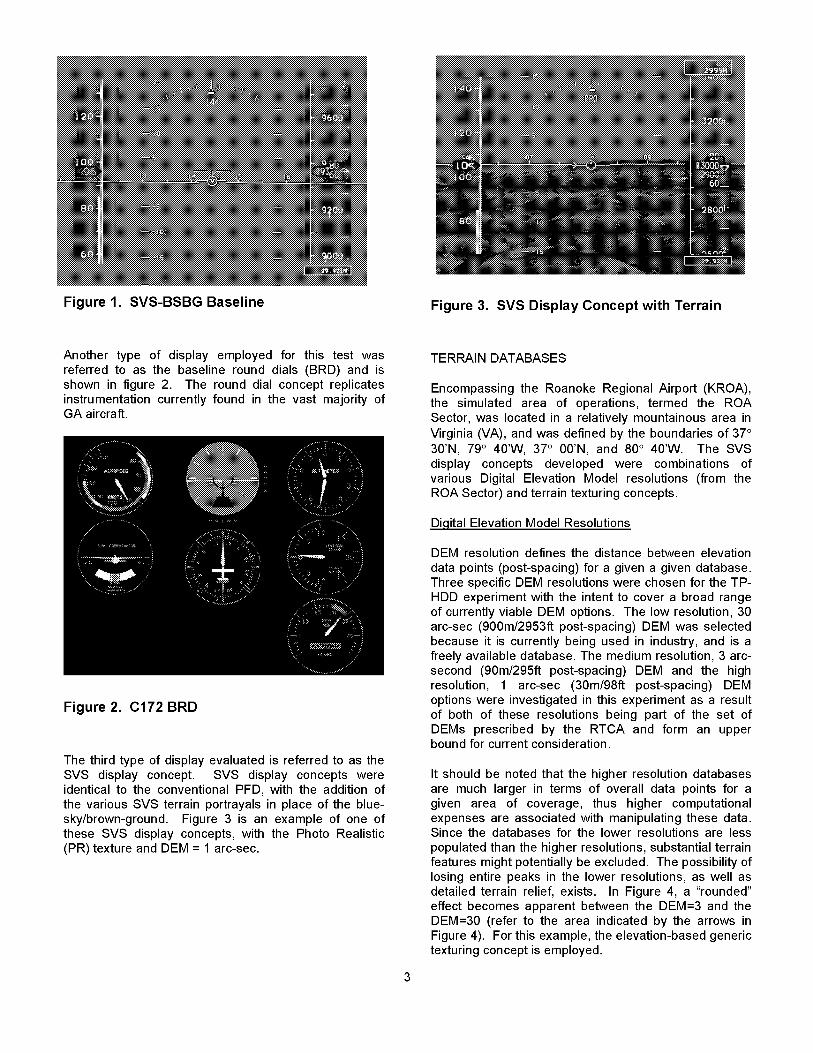
Figure 1. SVS-BSBG Baseline Figure 3. SVS Display Concept with Terrain
Another type of display employed for this test wasreferred to as the baseline round dials (BRD) and isshown in figure 2. The round dial concept replicatesinstrumentation currently found in the vast majority ofGA aircraft.
Figure 2. C172 BRD
The third type of display evaluated is referred to as theSVS display concept. SVS display concepts wereidentical to the conventional PFD, with the addition ofthe various SVS terrain portrayals in place of the blue-sky/brown-ground. Figure 3 is an example of one ofthese SVS display concepts, with the Photo Realistic
(PR) texture and DEM = 1 arc-sec.
TERRAIN DATABASES
Encompassing the Roanoke Regional Airport (KROA),the simulated area of operations, termed the ROASector, was located in a relatively mountainous area in
Virginia (VA), and was defined by the boundaries of 37 °30'N, 79 ° 40'W, 37 ° 00'N, and 80° 40'W. The SVSdisplay concepts developed were combinations ofvarious Digital Elevation Model resolutions (from theROA Sector) and terrain texturing concepts.
Di.qital Elevation Model Resolutions
DEM resolution defines the distance between elevation
data points (post-spacing) for a given a given database.Three specific DEM resolutions were chosen for the TP-HDD experiment with the intent to cover a broad rangeof currently viable DEM options. The low resolution, 30arc-sec (900m/2953ft post-spacing) DEM was selectedbecause it is currently being used in industry, and is afreely available database. The medium resolution, 3 arc-second (90m/295ft post-spacing) DEM and the highresolution, 1 arc-sec (30m/98ft post-spacing) DEMoptions were investigated in this experiment as a resultof both of these resolutions being part of the set ofDEMs prescribed by the RTCA and form an upperbound for current consideration.
It should be noted that the higher resolution databasesare much larger in terms of overall data points for agiven area of coverage, thus higher computationalexpenses are associated with manipulating these data.Since the databases for the lower resolutions are less
populated than the higher resolutions, substantial terrainfeatures might potentially be excluded. The possibility oflosing entire peaks in the lower resolutions, as well asdetailed terrain relief, exists. In Figure 4, a "rounded"effect becomes apparent between the DEM=3 and theDEM=30 (refer to the area indicated by the arrows inFigure 4). For this example, the elevation-based generictexturing concept is employed.

The Roundinf_1 Effect
with darker colors, and higher terrain levels are assignedlighter colors. A certain shade of green was set to thefield elevation, and the highest point was set to thehighest terrain within 50nm of ROA, approximately 4,000ft MSL. The photo-realistic texturing was derived from 4meter satellite imagery data that was draped over thevarious DEM databases. For the CC and EBG terrain
texturing display concepts, cultural features, such asroads, towers, and rivers, were presented on the display.Cultural and feature data were supplied directly throughthe photo-texture images on the PR displace concept.
Fishnet (FN) Overlay Concept
In addition to primary terrain texturing concepts, afishnet grid overlay was employed. The theory of thefishnet grid involves placing grids of known sizes withinthe synthetic scene to facilitate pilot's depth perception.The potential benefits of the fishnet grid used in thisstudy are cues for depth perception, distance, andangular rates. In addition, this fishnet grid provided aconstant geometric shape in the synthetic terrain scene.However, the fishnet grid may introduce elements ofconfusion in terms of adding to display clutter, distractingthe subject pilot, and being mistaken for the roads andrivers. These types of issues were investigated in this
experiment. The spacing of the fishnet overlay was500ft by 500ft, regardless of the DEM resolution. Thegrid was dual-color (gray/white), to compensate fordifferent coloring of features within the terrain databases(i.e., lighter colors of populated areas for the PR texture)and was constant for all texturing concepts.
SYMBOLOGY
Primary Fli.qht Display
Figure 4. Difference between DEM = 3 (top) and
DEM = 30 (bottom)
Terrain-Texturin.q Concepts
Terrain-texturing refers to the method used to enhanceelevation cues and position estimates of the DEMdatabase. The three primary texturing concepts testedwere Constant-Color (CC), Elevation-Based Generic(EBG), and Photo Realistic (PR). The constant-colortexturing concept was developed to replicate a currentindustry concept that is in the process of FederalAviation Administration (FAA) certification for theCapstone-2 program. This texturing concept representsa minimal SVS display concept requiring a nominalamount of computational resources for renderingavailable from current certified avionics platforms. Theelevation-based texturing concept consists of differentcoloring bands that correspond to different absoluteterrain elevation levels. Lower terrain levels are colored
The SVS PFD featured several advanced symbologyelements, including air-data, orientation, and guidanceinformation. Air-data information was presented by use
of integrated airspeed and altitude tapes withinstantaneous digital values. An analog vertical speedindicator was integrated into the altitude tape. A rollpointer with a sideslip wedge and magnetic headingdigital read-out portrayed heading, while a pitch ladderportrayed attitude orientation information. Additionalsymbology components displayed on the PFD wereelements that characterized the velocity vector cluster.This cluster depicted current aircraft flight path angleand track angle, incorporating a non-quickened velocityvector with an acceleration-along-flight-path indicator (offthe left finlet of the velocity vector marker) and sideslipflag (off the top finlet of the velocity vector marker).Guidance symbology was presented in the form ofcourse deviation indicators showing glide slope andIocalizer deviation dots and a tunnel in the sky type ofsymbology (see Figure 5). The tunnel in the sky conceptfeatured 400 feet wide by 320 feet tall, uniform greenboxes depicting the current flight path for the approachscenario, providing lateral and vertical path guidance.Vertical and lateral path deviation indicators provided the

pilotwithadditionalinformationregardingproximityoftheaircrafttothecenterofthetunnel.
Figure 5. Example of the Constant Color with
Fish Net, DEM =30 arc-sec, with Tunnel
Strateqic Display
SVS perspective displays are designed to provide pilotswith terrain SA similar to and beyond the informationprovided by strategic terrain display concepts, such asthe United Parcel Service Aviation Technologies(UPSAT) MX-20 multifunction display (MFD) (UPSATMX-20). The presence of the MX-20 in this experimentprovided the capability to evaluate the integratedinformation supplied by both the PFD and the MFD, as
well as estimate the relative value of each type ofdisplay. The MX-20 was used in the Terrain AwarenessMode only (see Figure 6), and was located in the radiostack. On the MX-20 MFD, terrain awareness, route
information, waypoints, and towers were portrayed. Alldisplay concepts, including both baselines, wereevaluated in the presence of the MX-20 MFD.
Figure 6. MX-20 MFD in Terrain Awareness
Mode (image courtesy of UPSAT)
TEST MATRIX
Combinations of DEM and texturing concepts (includingthe FN option) produced 18 different potential terrainportrayal concepts to evaluate. A preliminary look atthese 18 display concepts revealed that the CC texturewithout a FN provided little evident information on terraincontouring. As a result, the CC texture without the FNwas eliminated as a feasible concept for terrainportrayal. For the remaining 15 concepts, a usabilitystudy was then conducted in order to down-select asmaller and more manageable set of candidate displaycombinations for more thorough investigation. While theformation of this set of candidate display concepts wasbased on subject pilot evaluations, the suggested
collection of display concepts was broad enough to meetthe objectives of the experiment. Subsequently, anadequate number of display-concepts (10) were retainedfor the core experiment (see Table 1).
Texturing Concepts
_ EBG PR CCFN EBGFN PRFN
30 _/ _/ _/
tu_3 _/ _/
Table 1. TP-HDD Experiment Matrix (Legend:
EBG=Elevation-Based Generic, PR=Photo
Realistic, CC=Constant Color, FN=Fish Net)
These 10 SVS concepts were evaluated in addition tothe specific baseline concept flight displays mentionedearlier. These two baseline flight displays, BSBG andBRD were split evenly between subject pilots with

specificqualifications. All displayconceptswererandomizedamongthepilotsforeachmaneuver.
Oneadditionalrunwasaddedto theabovematrixforonespecifictexturingconcept(ConstantColorwithFishNet)andparticularDEM(30 arc-sec),but withoutatunnelduringthe approachmaneuver.Thistrialwasincludedin orderto establishpilotperformanceandworkloadrelationshipsregardinguseofthetunnelintheskyguidanceconcept.
EVALUATIONPILOTS
Twenty-sevenevaluationpilotsofvariousbackgroundsandqualificationsparticipatedintheTP-HDDsimulationandweregroupedbycertaincharacteristics.Thefirstgroupof subjectsconsistedof fourteenlow-timepilotswith lessthan400 hoursand no instrumenttrainingbeyondthatrequiredfortheprivatepilot'slicenserating.Six instrument-ratedpilots with various levels ofexperience,but less than1000hours,madeup thesecondset of subjects.Thelastgroupof evaluationpilotsconsistedof four professionaltest pilotsfromNASAandthe FAAandthreeJuneau(Alaska)areacommercialoperators.TheJuneaupilotsarepotentialfutureCapstoneII users. Inthephysiologicalanalysis,thelasttwopilotgroupingswerecombined.
SIMULATIONEQUIPMENT
TheGAWSfacilityplatformis basedon a modifiedPrecisionFlightControlPC-basedAviationTrainingDevice(PCATD)ModelP1-142instrumentproceduretrainer(see Figure7). The modelP1-142useshardwaretypicalof a generalaviationaircraftwithleft-and right-pilotseats. Modificationsto the hardwareincludedtheadditionof a 6" SVS-PFDanda UPSATMX-20MFD.
Additionally,threedifferentcomputerswereemployedtodrivethesysteminGAWS.Onecomputer,a Pentium-3classPC, hostedthe InitiativeComputing(IC) EliteElectronicIFR TrainingEnvironmentVersion 6.2software. This Elite softwareprovidedthe aircraftdynamicresponsestopilotcontrolinputs,andcontroloftheout-the-windowweather,aswellasdatarequiredtogeneratetheresearchdisplayimagery.Elitesoftwarecansimulatevarioustypesof GAaircraftincludingagenericCessna-172model,whichwas usedin thisexperiment.A SiliconGraphicsZxl0 PCwitha 3DlabWildCat4210graphicscardhousedtheSVSsoftwareemployedto renderthedisplaypresentedontheSVS-PFD.ThisSVSdisplaysoftwareincludedtheunderlyingdatabaseswith the variousDEM resolutionsandtexturingconcepts,combinedwiththeSVSsymbology.Thethirdcomputer,anotherSiliconGraphicsZxl0 PCwitha 3DlabWildCat4210graphicscard,hostedthesoftwarethatproducedthe outthewindowvisualthatwasprojectedontheforwardscreenthatprovidedthesimulatedout-the-windowview.
Figure 7. The General Aviation Workstation
(GAWS) Facility Configured for TP-HDD
A pilot-selectable Display Field of View (FOV) controlwas developed for the experiment. Field of View isdefined as the horizontal FOV of the image presented onthe display. The four FOV choices for this experiment
were 22 °, 30 °, 60 °, and 90 °. A minification factor (MF),which is the amount of angular compression to force animage to "fit" onto the display, is associated with eachFOV. As the horizontal FOV increases, so does the MF.Higher MFs make terrain features appear further awaythan they are in reality. Two control options wereavailable to the subject pilots, one located on the left-hand side of the instrument panel and one positioned onthe right horn of the yoke. Previous research dataindicate that a single fixed FOV would significantly limitSVS effectiveness. While flying each of the evaluationtasks, the subject pilots were encouraged to scrollthrough the FOV options during each phase of flight,evaluate the options, and provide comments during thisexperiment, as well as supply a resulting FOV strategyat the completion of the experiment.
EVALUATION TASKS
The evaluation tasks were developed to cover criticalphases of flight. En route and approach phases of aflight were ranked as high priority for SVS applicationsby an earlier in-house study describing the SVSConcepts of Operation for GA [9]. To add someadditional sensation of realism and more representativelevels of workload, a low/moderate level of turbulence
was simulated throughout the experiment. Due toanticipated higher levels of workload during theapproach maneuver, physiological data was collectedduring this maneuver, only, and not during the en routescenarios. The complete test is described in reference10.

Instrument Approach
The approach task consisted of a 6.5-minute flightsimulation starting with a straight and level flight in VMCon a 30-degree Iocalizer intercept course for the ILS(Instrument Landing System) 33 approach into ROA.The task started 12 nm south of ROA at 2,600 ft MSL,with a speed of 90 KIAS. The subject pilots were tasked
to fly a heading of 300 ° to join the Iocalizer(approximately 10 nm from the threshold) and maintain2,600ft until intercepting the glide slope at approximately4.5 nm, then continue flying the approach to 200 ft AGL.In this case, out-the-window visibility was reduced fromVMC to one statue mile within the first minute of the
flight. In addition to moderate turbulence that decreased
throughout the run, wind was simulated to be from 030 °at 15 knots, decreasing to 5 knots on final.
Rare Event
The Rare Event task simulated a flight scenario with anincorrect altimeter setting. Effectively, the altitude tapeindicated the incorrect (higher) altitude, which wasdifferent from the actual altitude portrayed by the terrainon the PFD. In addition, the altitude provided by the MX-20 also included the 1,500 ft error. This task wasadministered at the very end of the data collection foreach evaluation pilot and was designed to look like thelow altitude en route task. The starting point was at thesame position as the low altitude en route task, butactual altitude was 1500 ft lower. Consequently, thetarget level-off altitude for this maneuver was 500 ftbelow ground level. Display concepts, excludingbaseline concepts, were randomized among pilots,repeating one of the display concepts the evaluationpilot had already flown. The purpose of the rare eventwas to provide an experimental evaluation to establishwhether or not the different SVS terrain concepts on thePFD provided terrain situation awareness to avoid CFITaccidents in a rare event.
one block of 11 runs; all low altitude En Route trials were
completed during the next block of 11 runs; and allapproaches were completed in the third block of 12 runs.As previously stated, the rare event was typically the lastrun of the experiment for each subject pilot.Physiological data were collected only during theapproach maneuver.
PHYSIOLOGICAL DATA
Physiological data is used as an added measure toprovide a direct means of gauging a pilot's mental statewhile avoiding subjectivity inherent in questionnaires. Itis also used due to the possibility that contamination ofthe other measured variables can occur [11].
Physiological state data such as heart rate (HRT), skintemperature (SKT), and muscle response(Electromyogram, EMG) were recorded to determinestress and workload during the instrument approachmaneuvers. In addition to the collection during theapproach maneuver, physiological data weredocumented for a limited number of subjects during therare event as well, but only for evaluation (not statistical)purposes. The physiological data collection apparatusemployed for this experiment was the MP100 TM system
developed by BIOPAC Systems Inc. (See Figure 8).Data were transmitted from the BIOPAC system to aPentium-2 class PC for analysis.
Operations
The experiment was conducted within a 2.5 month-duration with no schedule interruptions. Each pilotparticipated in a day and a half of testing, consisting ofapproximately 35 trial runs, and 945 total trial runs for allpilots. Before the start of the experiment, each pilotreceived an extensive pilot briefing, as well asapproximately one-hour of training time in the GAWS bya FAA certified flight instructor for instruments (CFII).The goal of these briefings and training was tofamiliarize each subject with the objectives of theexperiment and educate the subjects on the salientfeatures of the current SVS symbology set and thesimulator functionality. The symbology set remainedconsistent across terrain databases for the approachmaneuver, except for the tunnel-on and -off concepts.All high altitude En Route trials were completed during
Figure 8. BIOPAC MP100 TM Data Acquisition
System
Physiological Measures
The first measure, HRT, was closely monitored todetermine if the test subject's peak-to-peak heart ratechanged due to the activities involved in the experiment.This heart rate change is the difference in time betweeneach corresponding R-wave peak. The R-wave is thepoint at which the ventricles contract to force blood to
the body's extremities from the heart muscle. Thisventricular contraction produces the highest peak in theelectrical signal that is shown in the data. Increases in

HRTgenerallyindicateincreasesin the levelof stressandworkload.
Thesecondmeasure,SKT,wascloselymonitoredtodetermineif the test subject's peripheralskintemperaturechangedrelativeto the experimentalactivities.In general,the peripheralskintemperaturedecreasesinthesituationoffightorflighttotrytoprotectthemajororgansof thebody.So,in theexperimentalsetup,whenevera stressfulsituationoccurs,a decreaseinskintemperaturewillensue.
The last measure,EMG,was closelymonitoredtodetermineif suddenmuscleelectricalactivityoccursduringthe experiment.Whenevera particularmusclebundleis utilized,anelectricalresponseoccursthatisseenin the dataas an electricalspike. For thisexperiment,increasesinthetime-integratedEMGsignalcanindicateincreasedlevelsofstressandworkload.
Electrode Placement
Two sensors were used to measure HRT. The
electrodes for heart rate were placed on each testsubject as shown in Figure 9. The ground electrode waslocated behind the right anklebone on the instep side ofthe foot and is shown in Figure 10.
iR
iE _' i
:!
\
\
\\
Figure 9. Heart Rate Electrode Placement
(Gnd)
Figure 10. Ground Electrode Placement
The EMG procedures and sensors were the same as theones used in the heart rate application. The two EMGsensors were placed on the left forearm as shown inFigure 11 below. The ground electrode was coupledwith the same electrode used for the HRT.
WhiteLead
(3
Figure 11. EMG Sensors Placement
For the skin temperature measurements, one smallbanjo-shaped temperature transducer was placed on theleft ring finger and lightly attached via white surgicaltape.

Allsensorswereconnectedviatheelectrodecablesintothe BIOPACamplifiersthat wereallocatedfor eachindividualphysiologicalmeasure.
RESULTS
The physiological data were analyzed as part of thisexperiment to determine if the various display conceptsproduced measurable physiological differences thatwould indicate a change in their mental workload.Analyses were performed across all experience levels ofsubject pilots. However, only the skin temperature datafrom the low-time GA (VFR-rated) pilots showedsignificant results. These results are presented below.
SKIN TEMPERATURE ANALYSES FOR THEAPPROACH MANEUVER
As seen in Figure 12, the mean delta skin temperature(DSKT) is lower for the synthetic vision displays vs. theBRD display. The delta values were calculated bymeasuring the difference between the resting
physiological condition values vs. the IMC physiologicalcondition values. The independent samples T-Test wasemployed to analyze the data using the SPSS © software.
The analysis was first employed to determine thesignificance of the largest difference in delta values asshown in Figure 12 (the comparison between the BRDvs. the Elevation-Based Generic, DEM = 1-arc-second(EBG1)). One can infer that, due to the statisticalsignificance in the deltas between EBG1 and the BRD,workload using the SVS EBG1 display was decreased incomparison to the workload that these subjectsexperienced while using the BRD that they are morefamiliar with (F(1,19)=-2.831, p=.011). Evaluating thenext largest difference involved the comparison betweenthe BRD vs. the Elevation-Based Generic with Fishnet,DEM = 1-arc-second (EBGFN1). The difference inthese delta values was shown to be near significance(F(1,19)=-1.919, p=.070). Further analyses of thecomparisons between the remaining synthetic visiondisplays and the BRD showed no significance.
One thing to also note from Figure 12 is that there is atrend towards a decrease in DSKT from the BRD to the
BSBG and then subsequently to the EBGI. This wouldindicate that possibly not only did the terrain have aneffect on the physiological state of the test subject, butalso that the symbology that is included in the EBG1 andnot in the BSBG could also be a factor as well.
l-
id)D
t-
(13
CON
Figure 12. Graph of Mean Delta Skin
Temperatures
Another skin temperature analysis was performed todetermine the significance between the Constant Colorwith Fishnet, DEM = 30 arc-second (CCFN30), with atunnel concept, and the Constant Color with Fishnet,DEM = 30 arc-seconds, with No Tunnel (CCFN30NT).The tunnel versus no tunnel analysis for this particularSVS display (CCFN30) revealed no significance.However, if the CCFN30NT display concept wascompared with the EBG1 display concept, significancewas found (F(1, 26)=3.130, p=.004). This significancecan be described as the combination of symbology andterrain effects. Likewise, comparing the CCFN30NTwith the EBGFN1, it was very nearly significant(F(1,26)=1.986, p=.058). These trends would indicatethat the evaluation pilots experienced less stress and
workload while flying using the EBG configurationswhich do utilize a tunnel vs. the CCFN30NT which doesnot.
HEART RATE ANALYSES FOR THE APPROACHMANEUVER
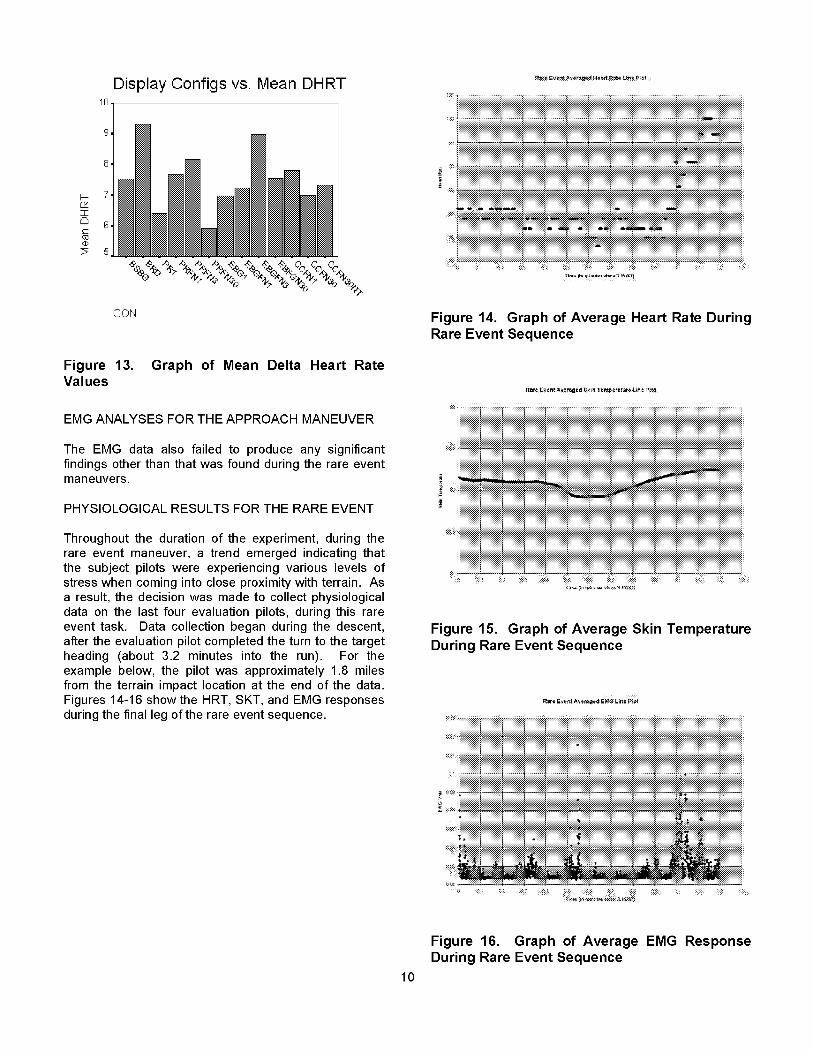
As illustrated in Figure 13, there was a decreased meandelta heart rate (DHRT) trend in the comparisonbetween the BRD and the synthetic vision. However, theindependent samples T-Test for significance failed toshow any statistically significant findings.
n_
i
DC-63
z
Display Configs vs. Mean DHRT
lo]
CON
Figure 13. Graph of Mean Delta Heart RateValues
EMG ANALYSES FOR THE APPROACH MANEUVER
The EMG data also failed to produce any significantfindings other than that was found during the rare eventmaneuvers.
PHYSIOLOGICAL RESULTS FOR THE RARE EVENT
Throughout the duration of the experiment, during the
rare event maneuver, a trend emerged indicating thatthe subject pilots were experiencing various levels ofstress when coming into close proximity with terrain. Asa result, the decision was made to collect physiologicaldata on the last four evaluation pilots, during this rareevent task. Data collection began during the descent,after the evaluation pilot completed the turn to the targetheading (about 3.2 minutes into the run). For theexample below, the pilot was approximately 1.8 milesfrom the terrain impact location at the end of the data.Figures 14-16 show the HRT, SKT, and EMG responsesduring the final leg of the rare event sequence.
...........:..................iiiiiiiiiii.....................................iiiiiiiiiiii_+>>>>>>>>:,.......... ::::::::::::::::::::::::::::::::::::::::::::::::::::::::::::::::::::::::::::::::::
iiiii'iiiiiiiii "i iiiiiiiiiiiiiiiiiiiiiiiiiiiiiiiii i; i;i;i iiiiiiiiiiiiiiiiiiiiiii>:+:+:+:+:.,................................................... .....................,
Figure 14. Graph of Average Heart Rate DuringRare Event Sequence
Figure 15. Graph of Average Skin TemperatureDuring Rare Event Sequence
10
Figure 16. Graph of Average EMG ResponseDuring Rare Event Sequence

During the rare event, the majority of the test subjectswere highly engaged in utilizing the yoke to pull theaircraft up to avoid the terrain, and consequently, usedmore muscle response than during the more standardmaneuvers. As the evaluation pilots flew closer to theterrain, each subject experienced an increase in heartrate, a decrease in skin temperature, and a more intenseEMG response. The combination of these variablessuggests that even though this was a simulation,conditions were realistic enough to induce some level ofstress during this maneuver.
CONCLUSION
As seen in the physiological analyses for the VFR pilots,there was a measured decrease in mean Delta Skin
Temperature (DSKT) and mean Delta Heart Rate(DHRT), indicating that the test subjects felt morecomfortable with the synthetic vision displays vs. thestandard gauges. As a result of the increased comfortlevel of the evaluation pilots, one can deduce that thisindicates less workload. This decrease in workload
would allow for an increase in cognitive resources thatcould be dedicated to study surroundings, therebyenabling the pilot to enhance situation awareness of theflying environment. With this enhanced SituationAwareness (SA), the pilot gains the important potentialto avoid controlled flight into terrain or loss of control.
One other result that was noticed was that the test
subjects preferred to have the displays in which thetunnel symbology was active. The CCFN30NT displaywas shown to be the third highest value in regards toDSKT only. The DSKT value comparison of the
CCFN30NT with the EBG1 was shown to be verysignificant as well which helps to corroborate this finding.
The overall physiological responses of the evaluationpilots indicate that the subjects favored Synthetic VisionSystems (SVS) displays over Baseline Round Dials(BRD), in terms of terrain awareness, SA, and perceivedpilot performance. Ongoing analyses of the pilotperformance and the subjective questionnaires arecurrently being performed, with an expected result ofcorroborating these findings.
One of the thrusts of the experiment was to determinewhich display configurations would be more useful inenhancing situation awareness. Although significantresults from one particular configuration (EBG1) vs. theBRD were apparent, comparing the individual SVSdisplays did not produce any statistical significantresults. One possible reason for this was because allevaluation pilots were trained to fly the approach usingthe tunnel symbology, which leaves very littleopportunity for the terrain to actually influence thesubject's situation awareness.
Further examination of these types of displayconfigurations with and without utilizing the tunnelsymbology is recommended to provide an assessment
of the effects each of these has on the pilot's workloadand stress levels. This will isolate effects on the
physiological data and provide a more realisticphysiological response to the terrain depictions.
ACKNOWLEDGMENTS
The authors would like to thank Mr. Mark Rawls (NASASHARP student, Crew Systems Branch) for hiscontribution in compiling the physiological data and thecreation of the rare event graphs.
11
REFERENCES
1. Special Committee 193 (SC-193) and EUROCAEWorking Group 44 (WG-44), 2002, User
Requirements for Terrain and Obstacle Data,RTCA/DO-276, Washington, DC, pp. 1-94.
2. Glaab, L.J and M.A. Takallu, 2002, "PreliminaryEffect of Synthetic Vision Systems Displays to
Reduce Low-Visibility Loss of Control and ControlledFlight Into Terrain Accidents," SAE 2002-01-1550.
3. Abbott, T., M. Nataupsky, and G. Steinmetz, 1987,"Subjective, Physiological and Performance
Measures of Eight Primary Flight Displays,"Proceedings of OSU APS, 721-727.
4. Sachs, G., K. Dobler, and P. Hermle, 1998, "Synthetic Vision Flight Tests for Curved Approach
and Landing," TU Muenchen, IEEE 0-7803-5086-3.5. Snow, M.P. and J.M. Reising, 1999, "Effect of
Pathway-in-the-Sky and Synthetic Terrain Imageryon Situation Awareness in a Simulated Low-Level
Ingress Scenario," Wright-Patterson AFB, ASC-99-1229.
6. Van Houten, Y.A., 1999, "Attentional Effects ofSuperimposing Flight Instrument and Tunnel-in-the-
Sky Symbology on the World," National Lucht-enRuimtevaartlaboratorium, NLR-TP-99141.
7. Williams, K.W., 2000, "Impact of Aviation Highway-In-The-Sky Displays on Pilot Situation Awareness,"FAA CAMI, DOT/FAA/AM-00/31.
8. Vidulich, M.A. and E.R. Hughes, 1991, "Testing a
subjective metric of situation awareness,"Proceedings of the Human Factors & Ergonomics
Society 35th Annual Meeting, Human Factors &Ergonomics Society, Santa Monica, CA.
9. Takallu, M. A., T.M. Doyle, F.G. McGee, M.F.Hughes, J.H. Koelling, and L.J. Glaab, 2001,
"Concept of Operations for General AviationSynthetic Vision Systems," NASA LaRC, Version2.5.
10. Hughes, M. F. and M. A. Takallu, 2002, "Terrain
Portrayal for Head-Down Displays Experiment,"IAATC, Anchorage, Alaska.
11. Wickens, C., S.E. Gordon, and Y. Liu, 1998, AnIntroduction to Human Factors Enqineerin.q, Addison
Wesley Longman, Inc.: New York.

CONTACTS
Michael D. Uenking, Human Factors Researcher, NASALangley Research Center, MS 156A, Hampton, VA23681-2199
(757) 864-6954
email: rn.d.uenkin_larc.nasa._
Monica F. Hughes, Deputy SVS-GA Lead, NASALangley Research Center, MS 156A, Hampton, VA23681-2199
(757) 864-3942
email: m_es d.larc,nasa, ov
12