The effects of various pretreatment methods on the ...studentsrepo.um.edu.my/8834/2/Content.pdf ·...
16
i ABSTRACT The effects of various pretreatment methods on the enrichment of H 2 evolving bacterial population and their hydrogen production efficiency using palm oil mill effluent (POME) as substrate were studied. Heat shock pretreatment was shown to be the most effective in enhancing the biological H 2 production. Up-flow anaerobic sludge blanket fixed film (UASB-FF) bioreactor is a modern bioreactor and was used to generate of biological hydrogen with the help of granulated microbial aggregates. A lab scale UASB-FF bioreactor (2.55 lit) with an external settling tank was successfully designed and operated for biohydrogen production from POME. The use of packing media in the middle portion reduced loss of biomass due to flotation associated with poorly performing UASB reactors. The bioreactor was developed in order to shorten the start-up period at low hydraulic retention time (HRT). The organic loading was gradually increased from 4.68 to 51.8 g COD/l.d during this period. Granular sludge was found to develop rapidly within 22 days with an increase in size of granules from an initial pinpoint size to about 1 mm. A marked improvement in shortening reactor start-up period (22 days) was achieved with 42.5 % COD removal at an OLR of 51.8 g COD/l.d. Experiments of fermentation hydrogen production of POME were conducted based on a central composite face-centered design (CCFD) and modeled and analyzed with two variables i.e. feed flow rate (Q F ) and up-flow velocity (V up ) using response surface methodology (RSM). The optimum conditions for the fermentation hydrogen production of the pre-settled POME were between Q F of 3.71 l/d, V up of 1.48 m/h and Q F of 2.03 l/d, V up of 2.31m/h, respectively. The experimental findings were in close agreement with the model prediction. The proposed kinetic equations and a simplified Monod’s model were successfully employed to describe the kinetics of fermentation hydrogen production from POME in the UASB-FF bioreactor. The maximum hydrogen
Transcript of The effects of various pretreatment methods on the ...studentsrepo.um.edu.my/8834/2/Content.pdf ·...
i
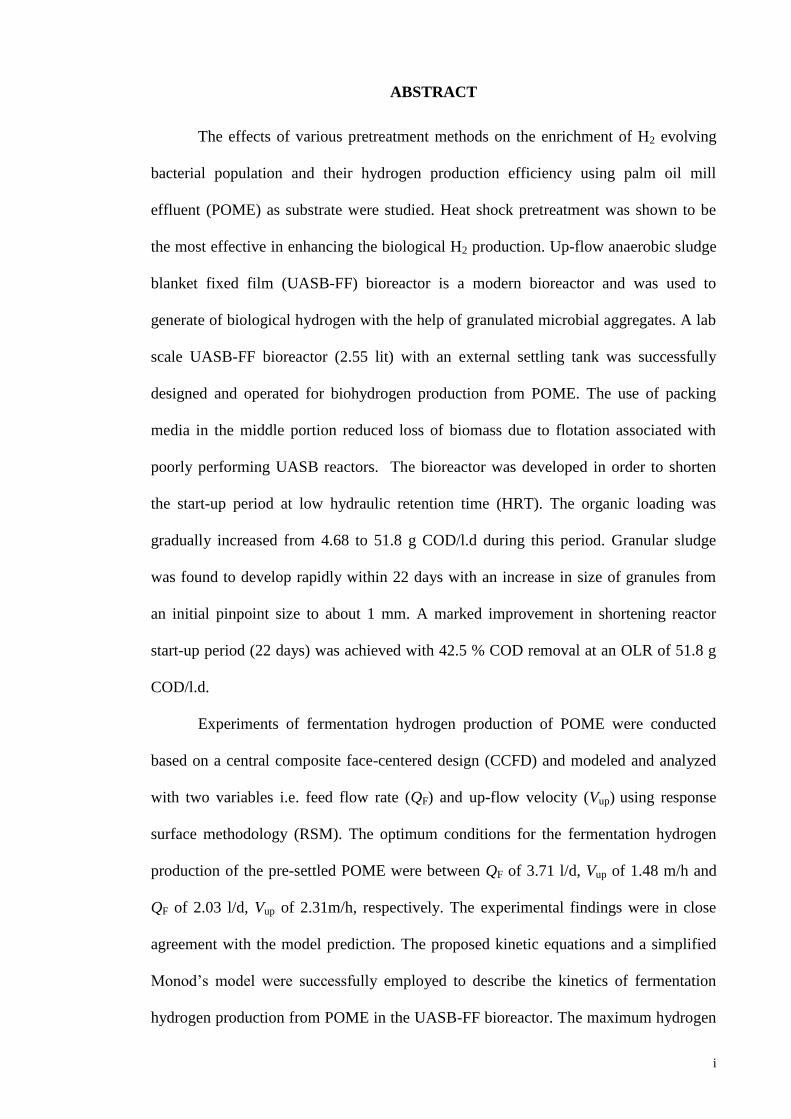
ABSTRACT
The effects of various pretreatment methods on the enrichment of H2 evolving
bacterial population and their hydrogen production efficiency using palm oil mill
effluent (POME) as substrate were studied. Heat shock pretreatment was shown to be
the most effective in enhancing the biological H2 production. Up-flow anaerobic sludge
blanket fixed film (UASB-FF) bioreactor is a modern bioreactor and was used to
generate of biological hydrogen with the help of granulated microbial aggregates. A lab
scale UASB-FF bioreactor (2.55 lit) with an external settling tank was successfully
designed and operated for biohydrogen production from POME. The use of packing
media in the middle portion reduced loss of biomass due to flotation associated with
poorly performing UASB reactors. The bioreactor was developed in order to shorten
the start-up period at low hydraulic retention time (HRT). The organic loading was
gradually increased from 4.68 to 51.8 g COD/l.d during this period. Granular sludge
was found to develop rapidly within 22 days with an increase in size of granules from
an initial pinpoint size to about 1 mm. A marked improvement in shortening reactor
start-up period (22 days) was achieved with 42.5 % COD removal at an OLR of 51.8 g
COD/l.d.
Experiments of fermentation hydrogen production of POME were conducted
based on a central composite face-centered design (CCFD) and modeled and analyzed
with two variables i.e. feed flow rate (QF) and up-flow velocity (Vup) using response
surface methodology (RSM). The optimum conditions for the fermentation hydrogen
production of the pre-settled POME were between QF of 3.71 l/d, Vup of 1.48 m/h and
QF of 2.03 l/d, Vup of 2.31m/h, respectively. The experimental findings were in close
agreement with the model prediction. The proposed kinetic equations and a simplified
Monod’s model were successfully employed to describe the kinetics of fermentation
hydrogen production from POME in the UASB-FF bioreactor. The maximum hydrogen

ii
production rate and hydrogen yield were 0.306 l H2/g CODremoved.d and 0.310 l H2/g
COD, respectively. The maximum specific growth rate (µmax) of hydrogenesis bacteria
grown on POME as substrate, the half-velocity constant (Ks), were calculated at 0.371
d-1
(38 °C) and 10.9 g/L, respectively, when POME concentration was 15.0 g/L. In this
study, the kinetic parameters Y, Kd, and k were obtained 0.093 g/g, 0.0046 d-1
, and 3.99
g COD/g VSS.d, respectively.
In a batch experiment, Effects of three important variables viz. initial COD
concentration (CODin), biomass concentration and initial bicarbonate alkalinity (BA) on
biological hydrogen production from POME using the granulated sludge were also
investigated. The maximum specific hydrogen production rate (55.42 mmol H2/g
VSS.d) was at the CODin, MLVSS and initial BA of 6500 mg/l, 2000 mg/l and 1100 mg
CaCO3/L, respectively. The maximum hydrogen yield (124.5 mmol H2/g CODremoved)
was also occurred at the CODin, MLVSS and initial BA of 3000 mg/l, 4000 mg/l and
1100 mg CaCO3/L, respectively. The minimum initial bicarbonate alkalinity required
was determined to be 0.17 g CaCO3 per gram initial COD. The results of mass transfer
study demonstrated that substrate mass transfer into granules was not a limiting factor in
POME anaerobic fermentation by the microbial granules.
All cumulative hydrogen production was well correlated to the modified
Gompertz equation with R2 more than 0.99. The kinetic parameters for total
accumulated hydrogen production (ml) were P: 329.8 ml, Rmax: 83.5 ml H2/h and λ: 5.45
h.
iii
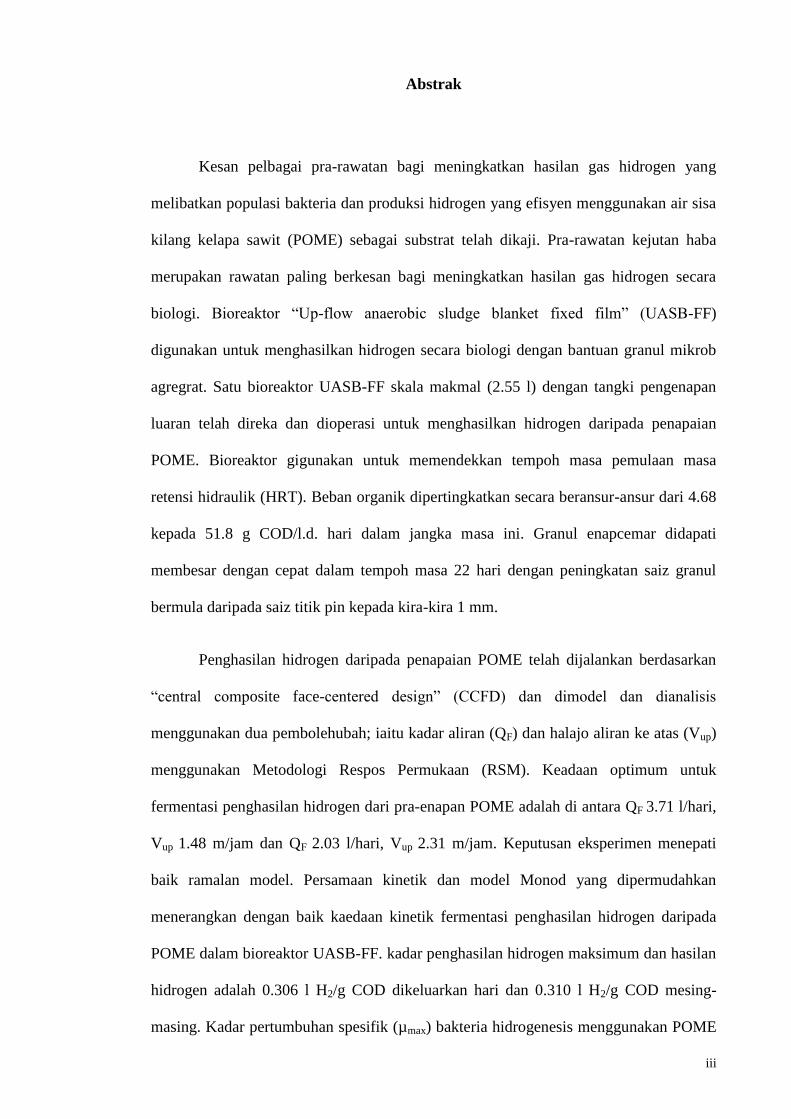
Abstrak
Kesan pelbagai pra-rawatan bagi meningkatkan hasilan gas hidrogen yang
melibatkan populasi bakteria dan produksi hidrogen yang efisyen menggunakan air sisa
kilang kelapa sawit (POME) sebagai substrat telah dikaji. Pra-rawatan kejutan haba
merupakan rawatan paling berkesan bagi meningkatkan hasilan gas hidrogen secara
biologi. Bioreaktor “Up-flow anaerobic sludge blanket fixed film” (UASB-FF)
digunakan untuk menghasilkan hidrogen secara biologi dengan bantuan granul mikrob
agregrat. Satu bioreaktor UASB-FF skala makmal (2.55 l) dengan tangki pengenapan
luaran telah direka dan dioperasi untuk menghasilkan hidrogen daripada penapaian
POME. Bioreaktor gigunakan untuk memendekkan tempoh masa pemulaan masa
retensi hidraulik (HRT). Beban organik dipertingkatkan secara beransur-ansur dari 4.68
kepada 51.8 g COD/l.d. hari dalam jangka masa ini. Granul enapcemar didapati
membesar dengan cepat dalam tempoh masa 22 hari dengan peningkatan saiz granul
bermula daripada saiz titik pin kepada kira-kira 1 mm.
Penghasilan hidrogen daripada penapaian POME telah dijalankan berdasarkan
“central composite face-centered design” (CCFD) dan dimodel dan dianalisis
menggunakan dua pembolehubah; iaitu kadar aliran (QF) dan halajo aliran ke atas (Vup)
menggunakan Metodologi Respos Permukaan (RSM). Keadaan optimum untuk
fermentasi penghasilan hidrogen dari pra-enapan POME adalah di antara QF 3.71 l/hari,
Vup 1.48 m/jam dan QF 2.03 l/hari, Vup 2.31 m/jam. Keputusan eksperimen menepati
baik ramalan model. Persamaan kinetik dan model Monod yang dipermudahkan
menerangkan dengan baik kaedaan kinetik fermentasi penghasilan hidrogen daripada
POME dalam bioreaktor UASB-FF. kadar penghasilan hidrogen maksimum dan hasilan
hidrogen adalah 0.306 l H2/g COD dikeluarkan hari dan 0.310 l H2/g COD mesing-
masing. Kadar pertumbuhan spesifik (µmax) bakteria hidrogenesis menggunakan POME

iv
sebstrat, pemalar halaju separa (Ks), bernilai 0.371 hari-1
(38˚C) dan 10.9 g/l masing-
masing, apabila kepekatan POME adalah 15.0 g/l. Dalam kajian ini, parameter kinetik
Y, Kd, dan k didapati bernilai 0.093 g/g, 0.0046 d-1
, dan 3.99 g COD/g VSS.hari,
masing-masing.
Dalam eksperimen kelompok, kesan tiga pembolehubah yang penting, iaitu
kepekatan masuk COD (CODmasuk), kepekatan biojisim dan alkalinity awal bikarbonat
(BA) ke atas penghasilan hidrogen spesifik yang maksimum (55.42 mmol H2/g
VSS.hari) kerlaku apabila CODmasuk, MLVSS, dan BA awal bernilai 6500 mg/l, 2000
mg/l, dan 1100 mg CaCO3/ l masing-masing. Penghasilan hidrogen maksimum (124.5
mmol H2/g CODdikeluarkan) iuga berlaku apabila CODmasuk, MLVSS, dan BA awal
bernilai 3000 mg/l, 4000 mg/l, dan 1100 mg CaCO3/ l masing-masing. Semua produksi
hidrogen kumulatif dapat dikaitkan dengan baik oleh persamaam Gompertz yang telah
dimodifikasikan dengan nilai R2 melbili 0.99. Parameter-parameter kinetik untuk
jumlam penghasilan hidrogen terkupul (ml) adalah P: 329.8 ml, Rmax: 83.5 ml H2/ jam
dan λ: 5.45 jam.

v
ACKNOWLEDGEMENT
Alhamdulillah, a great thank to The Great Almighty ALLAH s.w.t who grants
me the knowledge, strength and determination to accomplish my PhD research work.
My deepest gratitude to my wife Mrs. Nahid Ghanbari for her love, understanding,
encouragement, prayers and patience that supported me through the whole course of this
study.
Professor Shaliza binti Ibrahim, my main supervisor, provided a motivating,
enthusiastic, and critical atmosphere during the many discussions we had. It was a great
pleasure to me to conduct this thesis under her supervision. I also acknowledge Dr.
Mohamad Suffian Mohamad Annuar who as my co-supervisor provided constructive
comments and time in correcting my papers during my study.
My appreciation also goes to Mrs. Kalaiselvi Palani for her kind support to
provide laboratory equipments.
I would like to thank the Dean and Deputy Dean of Faculty of Engineering and
Head of Department of Civil for their continuous support and help rendered throughout
my studies. The financial support provided by University Malaya as a student grant
(Project No. PS122-2010A) is gratefully acknowledged. Not forgetting, all friends in
UM who have always provided an enjoyable and friendly working environment.
Last but definitely not least, my deepest and most heart-felt gratitude to my
parents for their endless love and support. They instilled in me a love for knowledge and
a strong work ethic that has enabled me to accomplish anything I set my mind to.
Finally, they are my lovely sweet children, Negin and Arian, who have been giving me
so much happiness and joy that gave me a duplex spirit to work.
Parviz Mohammadi
December 2012
vi
TABLE OF CONTENTS
Page
ABSTRACT i
ABESTRAKT iii
AKNOWLEGEMENTS v
TABLE OF CONTENTS vi
LIST OF TABLES ix
LIST OF FIGURES x
LIST OF PLATES xii
LIST OF ABBREVIATIONS xiii
LIST OF SYMBOLS xV
CHAPTER 1 – INTRODUCTION 1
1.1. General 1
1.2. Objectives of study 5
1.3. Propose and scope of study 6
CHAPTER 2 - LITERATURE REVIEW 7
2.1. Introduction 7
2.2. Effect of environmental and operational factors on fermentative
hydrogen production 11
2.2.1. Organic loading rate (OLR) 11
2.2.2. Hydraulic retention time (HRT) 15
2.2.3. Temperature 19
2.2.4. pH 23
2.3. Reactor type 26
2.3.1. Complete-mix process 26
2.3.2. Anaerobic sequencing batch reactor 26
2.3.3. Up-flow anaerobic sludge blanket (UASB) reactor 27
2.3.4. Up-flow fixed film reactor 29
2.3.5. Fluidized bed reactor 30
2.4. Pretreatment processes 30
2.5. Process modeling and optimization by design of experiments (DoE) 32
2.6. Kinetic modeling 35

vii
CHAPTER 3 - MATERIALS AND METHODS 38
3.1. Chemical substances 38
3.2. Overall experimental flowchart 39
3.3. Definitions of process parameters studied 39
3.4. UASB-FF bioreactor set-up 40
3.5. Pretreatment on anaerobic mixed microflora 44
3.5.1. Experimental 44
3.5.2. Experimental set-up 44
3.6. Studies of UASB-FF bioreactor performance 45
3.6.1. Bioreactor start-up 45
3.6.1(a) Wastewater preparation 45
3.6.1(b) Seed sludge preparation 45
3.6.1(c) Bioreactor operation 46
3.6.2. Optimization, modeling and process analysis of dark
fermentative hydrogen production from pre-settled POME
47
3.6.2(a) Experimental design and mathematical model 47
3.6.2(b) Bioreactor operation 50
3.7. Biological hydrogen production using granulated sludge in batch
experiments
50
3.7.1. Influence of process variables on biological hydrogen
production of the granulated sludge
50
3.7.2. Mass transfer evaluation on POME grown microbial granules 52
3.8. Analytical techniques 53
3.8.1. Basic water quality parameters measurement 53
3.8.2. Biogas analysis 53
3.8.3. Volatile fatty acids measurement 54
3.9. Hydrodynamic studies of UASB-FF bioreactor 54
3.10. Scanning Electron Microscopy (SEM) 55
CHAPTER 4- RESULTS AND DISCUSSION
56
4.1. Palm Oil Mill Effluent Characterization 56
4.2. Effects of different pretreatment methods on anaerobic mixed
microflora
57
4.2.1. Effect of different pretreatments on H2 production 57
4.2.2. Effect of different pretreatments on COD removal efficiency 60
viii
4.3. The start-up of an up-flow anaerobic sludge blanket fixed film
(UASB-FF) reactor
61
4.3.1. Hydrogen production 61
4.3.2. COD removal 62
4.3.3. Sludge bed growth 63
4.4. Optimization, modeling and process analysis 66
4.4.1. Statistical analysis 67
4.4.2. Effects of QF and Vup on biogas composition, hydrogen yield,
HPR, and SHPR
70
4.4.3. Effects of QF and Vup on COD removal 72
4.4.4. Effects of QF and Vup on pH, bicarbonate alkalinity and total
volatile fatty acids
73
4.4.5. Effects of QF and Vup on the operating parameters 76
4.4.6. Effects of QF and Vup on food to microorganism ratio 78
4.4.7. Process Optimization 78
4.4.8. Kinetic evaluation of biohydrogen production from POME in
the UASB-FF bioreactor
81
4.5. Effects of process variables on biological hydrogen production of the
granulated sludge
84
4.5.1. Hydrogen yield 85
4.5.2. Specific hydrogen production rate (SHPR) 87
4.5.3. COD removal efficiency 89
4.5.4. Kinetic analysis of hydrogen production 91
4.6. Mass-transfer evaluation on POME-grown microbial granules 92
4.7. Experimentation and determination of hydraulic regime 94
4.7.1. Hydraulic performance analysis 95
4.7.2. Statistical analysis 97
4.7.2 (a) Deviation from ideal retention time (Δτ) 97
4.7.2 (b) Morrill dispersion index (MDI) 98
4.8. The effect of the fixed film part on UASB-FF bioreactor performance 100
CHAPTER 5- CONCLUSIONS 103
CHAPTER 6- RECOMMENDATIONS 105
REFERENCES 106
APPENDICES 126
LIST OF PUBLICATIONS 130

ix
LIST OF TABLES
Page
1.1. Typical characteristics of POME 3
2.1. The effect of OLR and substrate on fermentation hydrogen
production
13
2.2. The effect of HRT and substrate on fermentative hydrogen
production
18
2.3. The effect of temperature and substrate on fermentative hydrogen
production
21
2.4. The effect of pH and substrate on fermentation hydrogen production 24
3.1. List of chemical substances 38
3.2. Experimental range of the independent variables 48
3.3. Experimental conditions for fermentative hydrogen production
from POME based on CCD design
49
3.4. Experimental range of the independent variables 51
3.5. Experimental conditions applying CCD in this study 51
4.1. Characteristics of raw POME 56
4.2. Characteristics of pre-settled POME 66
4.3. Experimental results of central composite design 68
4.4. ANOVA results for the equations of the Design Expert 6.0.8 for
with the studied responses as predictor variables
69
4.5. The amounts of the effluent VFAs at various trials
75
4.6. Verification experiments at optimum conditions 80
4.7. Kinetic parameters for biohydrogen production from POME in
different reactors and operating conditions
83
4.8. Experimental results of central composite design 84
4.9. ANOVA for response surface models applied 85

x
LIST OF FIGURES
Page
1.1. typical palm oil extraction process and sources of wastewater
production
2
1.2. Characteristics fruit and generation composition chart of a palm
oil
2
2.1. Anaerobic digestion and fermentative hydrogen production
pathway
10
2.2. Effect of organic loading rate on biohydrogen production 15
2.3. Effect of hydraulic retention time (HRT) on biohydrogen
production in continuous reactors
17
2.4. Effect of temperature on biohydrogen production in batch reactors 22
2.5. Effect of pH on biohydrogen production in batch reactor 25
2.6. Design of a UASB reactor 28
2.7. The main types of central composite designs for two variables; (a)
Rotatable, (b) Face-centered, (c) Inscribed
33
2.8. Central composite faced-centered design with three variables 34
3.1. Flowchart of overall experimental activities involved in this study 39
3.2. Schematic diagram of the experimental set-up 41
3.3 The Pall rings applied into the middle part of the UASB-FF
bioreactor
42
4.1. Hydrogen yield as a function of pretreatment methods and time 58
4.2. Cumulative H2 production as a function of pretreatment methods
and time
59
4.3. COD removal efficiency as a function of pretreatment methods
and time
60
4.4. Hydrogen fraction in biogas during start-up period 61
4.5. COD removal efficiency during start-up period 62
4.6. Growth of sludge blanket height in UASB-FF bioreactor during
the start-up period
64
4.7. Three-dimensional contour plots for (a) hydrogen percentage, (b)
hydrogen yield, (c) HPR, and (d) SHPR
71
xi
4.8. Three-dimensional contour plot of the model for COD removal 73
4.9. Three-dimensional contour plots of the two-factor interaction
models for (a) TVFA, (b) bicarbonate alkalinity, (c) pH in the
effluent
76
4.10. Three-dimensional contour plots of the two-factor interaction
model for (a) sludge height and (b) effluent TSS
77
4.11. Response surface plot for F/M ratio 78
4.12. Overlay plot for optimal region 79
4.13. Line weaver-Burk plot for reciprocals of specific growth rate
versus COD concentration
82
4.14. The reciprocal of SRT versus specific substrate utilization rate 83
4.15. Three-dimensional contour plots of the model for hydrogen yield
(mmol H2/g CODremoved) as a function of variables of initial BA
and MLVSS at COD concentration of 3000 mg/l (a), 6500 mg/l (b)
and 10000 mg/l (c)
86
4.16. Three-dimensional contour plots of the model for SHPR (mmol H2
/g VSS.d ) as a function of initial BA and MLVSS at COD
concentration of 3000 mg/l (a), 6500 mg/l (b) and 10000 mg/l (c)
88
4.17. Three-dimensional contour plots of the model for COD removal as
a function of CODin and MLVSS at initial BA of 200 mg CaCO3/l
(a), 1100 mg CaCO3/l (b), 2000 mg CaCO3/l (c)
90
4.18. Cumulative hydrogen production from POME at the CODin,
MLVSS and initial BA of 6500 mg/l, 4000 mg/l and 1100 mg
CaCO3/L, respectively (Run #14) in a batch experiment; (a)
Profile of hydrogen production (ml), (b) Profile of COD
concentration
92
4.19. Cumulative H2 production versus time 93
4.20. Absorption spectra of 2 10-4
M Rhodamine B 94
4.21. Calibration graph for determination of Rhodamine B 95
4.22. Mathematical and empirical curves of tracer concentration time
distribution for (a) Vup=0.5 m/h and Qg=14.87l/d, (b) Vup=3.0 m/h
and Qg=7.96 l/d
96
4.23. E(t) and F(t) plots with respect to (a) Vup 0.5 m/h and Qg 14.87l/d,
(b) Vup 3.0 m/h and Qg 7.96 l/d
100
4.24. Effluent COD concentration at S4 and S5 101
4.25. Effluent TSS concentration at S4 and S5 102
xii
LIST OF PLATES
Page
3.1. Laboratory-scale experimental set-up used in this study 43
3.2. Serum bottles used for batch experiments 52
4.1. Sequence of bio-granule formation in the UASB-FF reactor (a)
after 10 days, (b) after 20 days, (c) after 30 days
65
4.2. SEM images of (a, b) the fine structure of the hydrogen-producing
mesophilic granules and (c, d) a full-grown compact granule
65

xiii
LIST OF ABBREVIATION
2FI Two factor interaction
AF Anaerobic filter
Alk Alkalinity
AnFBR Anaerobic fluidized-bed reactor
ANOVA Analysis of variance
ASBR Anaerobic sequencing batch reactor
BA Bicarbonate alkalinity
BOD Biochemical oxygen demand
CCD Central composite design
CCFD Central composite face-centered design
COD Chemical oxygen demand
CODeff Effluent chemical oxygen demand
CODin Influent chemical oxygen demand
CPO Crude palm oil
CV Coefficient of variance
DoE Design of experiment
E(t) Distribution of the exit times
F(t) Cumulative residence time distribution function
FFB Fresh fruit bunch
F/M Food to microorganism
GSS Gas solids separator
HRT Hydraulic retention time
HPR Hydrogen production rate
MDI Morrill Dispersion Index
MLVSS Mixed liquor volatile suspended solids

xiv
OLR Organic loading rate
P Probability of error
POME Palm oil mill effluent
R2 Coefficient of determination
RSM Response surface methodology
SCOD Soluble chemical oxygen demand
SD Standard deviation
SEM Scanning electron microscopy
SHPR Specific hydrogen production rate
SRT Solid retention time
SVI Sludge volume index
TA Total alkalinity
TCOD Total chemical oxygen demand
TKN Total Kjeldahl nitrogen
TSS Total suspended solids
TVFA Total volatile fatty acids
UASB Up-flow anaerobic sludge blanket
UASB-FF Up-flow anaerobic sludge blanket fixed film
UFF Up-flow fixed film
VFA Volatile fatty acids
VSS Volatile suspended solids
xv
LIST OF SYMBOLS
Unit
C Ideal flow concentration (mM)
C0 Initial flow concentration of the tracer (mM)
Ci Concentration at ith measurement (mmol/l)
H(t) Cumulative hydrogen production (ml)
k Transportation rate constant into the granule (d-1
)
Ks Half-velocity constant (g COD/l)
P Hydrogen production potential (ml)
Qe Effluent flow rate (l/d)
QF Feed flow rate (l/d)
Qg Biogas production rate (l/d)
QH Volume of gas produced per day (l H2/d)
R Maximum hydrogen production rate (ml/h)
S0 Influent substrate concentration (g COD/l)
S Effluent substrate concentration (g COD/l)
t Hydraulic retention time (d)
ti Time at ith measurement (min)
V Volume of the reactor (lit)
Vup Up-flow velocity m/h
X Biomass concentration (mg/l)
Xe Effluent VSS concentration (mg/l)
Xi Independent variables / factors (-)
Yi Response (-)
YH Hydrogen yield constant
(l H2/g
CODremoved.d)
Yx Growth yield constant (g VSS/g
CODremoved.d)

xvi
Greek symbols
α Distance from the centre of the design space to axial point (-)
β0 Constant coefficient (-)
βi Coefficients for the linear effect (-)
βii Coefficients for the quadratic effect (-)
βij Coefficients for the cross-product effect (-)
η Effectiveness factor (-)
μ Specific microbial growth rate (d-1
)
μm Maximum specific microbial growth rate (d-1
)
λ Lag phase time (h)
λmax Maximum absorption (nm)
τ Theoretical retention time (min)
Mean detention time (min)
∆ti time increment about Ci (min)
Δτ Deviations from the ideal retention time (min)