THE EFFECTS OF TRUSTWORTHINESS ON THE IMPACT OF ...
410
THE EFFECTS OF TRUSTWORTHINESS ON THE IMPACT OF ORGANISATIONAL CULTURE ON EMPLOYEE CREATIVITY: THE NIGERIAN MANUFACTURING INDUSTRY By OGBEIBU SAMUEL A DISSERTATION SUBMITTED TO THE FACULTY OF BUSINESS AND FINANCE, UNIVERSITI TUNKU ABDUL RAHMAN, IN FULFILMENT OF THE REQUIREMENTS FOR THE DEGREE OF DOCTOR OF PHILOSOPHY (PHD). (HUMAN RESOURCE MANAGEMENT). September, 2018.
Transcript of THE EFFECTS OF TRUSTWORTHINESS ON THE IMPACT OF ...

THE EFFECTS OF TRUSTWORTHINESS ON THE IMPACT OF
ORGANISATIONAL CULTURE ON EMPLOYEE CREATIVITY:
THE NIGERIAN MANUFACTURING INDUSTRY
By
OGBEIBU SAMUEL
A DISSERTATION SUBMITTED TO THE FACULTY OF BUSINESS AND
FINANCE, UNIVERSITI TUNKU ABDUL RAHMAN, IN FULFILMENT OF
THE REQUIREMENTS FOR THE DEGREE OF DOCTOR OF
PHILOSOPHY (PHD).
(HUMAN RESOURCE MANAGEMENT).
September, 2018.

ii
ABSTRACT
THE EFFECTS OF TRUSTWORTHINESS ON THE IMPACT OF
ORGANISATIONAL CULTURE ON EMPLOYEE CREATIVITY:
THE NIGERIAN MANUFACTURING INDUSTRY
Ogbeibu Samuel
Nigeria has fallen behind other countries in terms of her creativity and innovative
capabilities. Equally, the Nigerian manufacturing industry that is supposed to aid
in catapulting Nigeria into an innovation centric entity has in recent years, grossly
underperformed. Extant research thus, accentuate that a major cause of this is the
application of non-supportive organisational cultures. This has consequently
impaired the growth of employees’ creativity in manufacturing organisations, and
further hampered perceptions of leader trustworthiness to foster organisational
exchange of creative ideas. This study, thus, investigates the effects of
trustworthiness on the impact of organisational culture on employee creativity in
the Nigerian manufacturing industry. A stratified proportionate sampling
technique was employed to obtain 439 valid responses from employees within
the Research and development (R/D) and Information Technology (I/T)
departments of 21 manufacturing organisations. Results indicated that top
management leaders’ trustworthiness and adhocracy organisational culture have
positive effects on employee creativity. Clan and market organisational cultures
have negative effects on employee creativity, while hierarchy organisational

iii
culture does not influence employee creativity. This study demonstrated that
ability and integrity does not moderate the impact of clan organisational culture
on employee creativity. However, integrity positively moderates this relationship.
Additionally, ability, benevolence and integrity negatively moderates the impact
of adhocracy organisational culture on employee creativity. Ability, benevolence
and integrity also positively moderates the impact of market organisational
cultures on employee creativity. Nevertheless, ability does not moderate the
impact of hierarchy organisational culture on employee creativity, whereas,
benevolence and integrity negatively moderates the impact of hierarchy
organisational culture on employee creativity. Furthermore, as a significance of
the findings, this study proffers novel insights to policymakers via a Multi-Level
Organisational Culture and Trustworthiness Structural Template (MOCTST),
developed for engendering employee creativity. Through the MOCTST, this
study substantially advance prior insights surrounding employee creativity,
trustworthiness and organisational culture.

iv
ACKNOWLEDGEMENT
I would like to express my deepest gratitude to God for his most excellent
help and grace towards me before, during, and after the completion of this
dissertation and overall doctor of philosophy program.
I also want to express my sincere appreciation to my main and co-
supervisors, Dr Abdelhak Senadjki, and Dr Tan Luen Peng, without whom I
would not have being able to proceed, nor complete the writing of this
dissertation. Their intense efforts in guiding, tutoring, and mentoring me all
through the stages of my PhD program has also helped to mould me into the
person I am today, and for this I am truly grateful.
I do want to use this medium to heartily thank Rev. Cannon. Engr. A. A.
Ogbeibu (my father), Mrs. Ann Ogbeibu (my mother), Mrs. Nneka Obianuju
Ogbeibu (my wife), and my siblings, for their amazing efforts in helping me
conquer the several milestones I have encountered throughout my PhD program.
I would not have started nor finished this scholarly pursuit without their enormous
support. I also thank my wife’s parents, Engr. and Mrs. Onubogu for their
immense psychological and spiritual help towards me.
Lastly, I acknowledge the vital efforts of Dr Chen, I-Chi, Dr Ramesh
Kumar Moona Haji Mohamed, and Dr Gengeswari a/p Krishnapillai, Engr.
Antony Beecham, Mrs. Caroline Beecham, and other colleagues, and friends of
mine. Their contributions are deeply appreciated.

v
APPROVAL SHEET
This dissertation entitled “THE EFFECTS OF TRUSTWORTHINESS
ON THE IMPACT OF ORGANISATIONAL CULTURE ON EMPLOYEE
CREATIVITY: THE NIGERIAN MANUFACTURING INDUSTRY” was
prepared by Ogbeibu Samuel and submitted as fulfilment of the requirements for
the degree of Doctor of Philosophy in Human Resource Management at
Universiti Tunku Abdul Rahman.
Approved by:
___________________________
(Assist. Prof. Dr. Abdelhak Senadjki) Date: ………………….
Supervisor
Department of Economics
Faculty of Business and Finance
Universiti Tunku Abdul Rahman
___________________________
(Assist. Prof. Dr. Tan Luen Peng) Date: ………………….
Co-supervisor
Department of Entrepreneurship
Faculty of Business and Finance
Universiti Tunku Abdul Rahman

vi
FACULTY OF BUSINESS AND FINANCE
UNIVERSITI TUNKU ABDUL RAHMAN
Date: __________________
SUBMISSION OF DISSERTATION
It is hereby certified that Ogbeibu Samuel (ID No: 15ABD07116) has completed
this dissertation entitled “THE EFFECTS OF TRUSTWORTHINESS ON THE
IMPACT OF ORGANISATIONAL CULTURE ON EMPLOYEE
CREATIVITY: THE NIGERIAN MANUFACTURING INDUSTRY” under the
supervision of Dr. Abdelhak Senadjki from the Department of Economics,
Faculty of Business and Finance, and Dr. Tan Luen Peng from the Department of
Entrepreneurship, Faculty of Business and Finance.
I understand that the University will upload softcopy of my thesis/dissertation in
pdf format into UTAR Institutional Repository, which may be made accessible to
UTAR community and public.
Yours truly,
____________________
OGBEIBU SAMUEL

vii
DECLARATION
I OGBEIBU SAMUEL hereby declare that the dissertation is based on my
original work except for quotations and citations which have been duly
acknowledged. I also declare that it has not been previously or concurrently
submitted for any other degree at UTAR or other institutions.
Name: OGBEIBU SAMUEL
Date: __________________

viii
TABLE OF CONTENTS
ABSTRACT ........................................................................................................ ii
ACKNOWLEDGEMENT ................................................................................ iv
APPROVAL SHEET ......................................................................................... v
SUBMISSION OF DISSERTATION .............................................................. vi
DECLARATION.............................................................................................. vii
LIST OF TABLES .......................................................................................... xiii
LIST OF FIGURES ......................................................................................... xv
ABBREVIATIONS ........................................................................................ xvii
PUBLICATIONS .......................................................................................... xviii
CHAPTER ONE ................................................................................................ 1
INTRODUCTION.............................................................................................. 1
1.0 Overview ................................................................................................................ 1
1.1 Background of the Study ....................................................................................... 1
1.1.2 The Nigerian Manufacturing Industry ....................................................... 9
1.1.3 Employee Creativity in the Manufacturing Industry ............................... 17
1.2 Problem Statement ............................................................................................... 21
1.3 Research Questions .............................................................................................. 27
1.4 Research Objectives ............................................................................................. 27
1.5 Significance of the Study ..................................................................................... 28
1.6 Scope of the Study ............................................................................................... 29
1.7 Definitions of Key Concepts ................................................................................ 30
1.8 Organisation of Research Structure ..................................................................... 34
CHAPTER TWO ............................................................................................. 36
LITERATURE REVIEW ............................................................................... 36
2.1 Introduction .......................................................................................................... 36
2.2 Employee Creativity Theories ............................................................................. 37

ix
2.2.1 The Componential Theory of Individual creativity ................................. 38
2.2.2 The Interactionist Theory of Creativity ................................................... 43
2.2.3 The Investment Theory of Creativity ....................................................... 45
2.2.4 The Multiple Social Domains Theory of Creativity ................................ 48
2.3 Theories of Organizational Culture .................................................................. 51
2.3.1 Cameron and Quinn (2006) Competing Values Frameworks (CVF) ...... 51
2.3.2 Grid-group Cultural Theory ..................................................................... 57
2.4 Trustworthiness Theoretical Concept .................................................................. 60
2.4.1 An Integrative Model of Organisational Trust ......................................... 61
2.4.2 Affect-Based and Cognition-Based Trust Theory ................................... 66
2.5 Justification of Theoretical and Conceptual Underpinnings ................................ 68
2.6 Analysis of the Organisational Culture, Trustworthiness and Employee Creativity
Concepts..................................................................................................................... 75
2.6.1 Organisational Culture ............................................................................. 75
2.6.2 Employee Creativity ................................................................................ 77
2.6.3 The Relationship between Organisational Culture and Employee
Creativity .......................................................................................................... 79
2.6.4 Trustworthiness and Employee Creativity ............................................... 85
2.6.5 The Moderating Effect of Trustworthiness .............................................. 88
2.7 Overview of Relevant Past Studies ...................................................................... 91
2.7.1 Past Studies Relating the Impact of Organisational Culture on Employee
Creativity .......................................................................................................... 91
2.7.2 Relevant Past Studies Reflecting the Trustworthiness, Organisational
Culture and Employee Creativity Concepts .................................................... 103
2.8 Theoretical Framework ...................................................................................... 114
2.9 Development of Hypothesis ............................................................................... 117
2.9.1 Organisational culture relationship to employee creativity ................... 118
2.9.2 Effect of Trustworthiness on Employee Creativity................................ 120
2.9.3 The moderating effect of ability on the relationship between
organisational culture and employee creativity .............................................. 122
2.9.4 The moderating effect of benevolence on the relationship between
organisational culture and employee creativity .............................................. 124
2.9.5 The moderating effect of integrity on the relationship between
organisational culture and employee creativity .............................................. 125
2.10 Summary .......................................................................................................... 126
CHAPTER 3 ................................................................................................... 128
RESEARCH METHODOLOGY ................................................................. 128

x
3.1 Introduction ........................................................................................................ 128
3.2 Research Paradigm ............................................................................................ 128
3.3 Research Design ................................................................................................ 130
3.4 Population of Study ........................................................................................... 131
3.5 Field Work and Data Collection ........................................................................ 133
3.6 Sample Size ........................................................................................................ 140
3.7 Sample Design ................................................................................................... 142
3.8 Questionnaire Design and Structure .................................................................. 143
3.8.1 Operationalised Definition and Construct Measurement ....................... 145
3.9 Reliability of Questionnaire ............................................................................... 150
3.10 Pre-test and Pilot Study .................................................................................... 151
3.11 Data Analysis ................................................................................................... 154
3.11.1 Preliminary Analysis and the Use of Partial Least Square (PLS) ........ 154
3.11.2 Data Processing and Outliers Detection .............................................. 155
3.11.3 Normality Analysis .............................................................................. 157
3.11.4 Common Method Bias ......................................................................... 157
3.12 Summary of Research Methodology ............................................................... 158
CHAPTER FOUR .......................................................................................... 160
DATA ANALYSIS AND PRESENTATION OF FINDINGS .................... 160
4.0 Overview ............................................................................................................ 160
4.1 Background of Respondents .............................................................................. 160
4.2 Analysis of descriptive statistics of study variables ........................................... 163
4.3 Measurement and Structural Models Employed in This study .......................... 166
4.3.1. Testing the Inner Measurement Model ................................................. 168
4.3.2. Testing the Outer Measurement Model ................................................ 170
4.4. Structural Model ............................................................................................... 183
4.5. Guidelines for Hypothesis Analysis .................................................................. 186
4.5.1. Acceptable Criteria for This Study’s Statistical Analysis ..................... 186
4.5.2. Model Fit Assessment ........................................................................... 189
4.5.3. Hypotheses Testing. .............................................................................. 191
4.6. Chapter Summary ............................................................................................. 235
CHAPTER FIVE ........................................................................................... 238

xi
DISCUSSION OF FINDINGS ...................................................................... 238
5.1. Introduction ....................................................................................................... 238
5.2. The effects of all organisational culture dimensions on employee creativity ... 240
5.3. Effect of trustworthiness dimensions on employee creativity .......................... 247
5.4. The moderating effect of ability, integrity and benevolence on the impact of
adhocracy organisational culture on employee creativity ........................................ 253
5.5. The moderating effect of ability, integrity and benevolence on the impact of
hierarchy organisational culture on employee creativity. ........................................ 259
5.7. The moderating effect of ability, benevolence and integrity on the impact of
market organisational culture on employee creativity. ............................................ 274
CHAPTER SIX .............................................................................................. 282
CONCLUSION AND RECOMMENDATIONS ......................................... 282
6.1. Introduction ....................................................................................................... 282
6.2 Summary of thesis ............................................................................................. 282
6.3. Study Implications ............................................................................................ 290
6.3.1 Theoretical Contributions and Implications ........................................... 291
6.3.2 Policy Implications ................................................................................ 296
6.4 Limitations of Research ..................................................................................... 300
6.5 Recommendations for Future Research ............................................................. 303
6.7 Conclusion ......................................................................................................... 305

xii
REFERENCES ............................................................................................... 307
APPENDIX A ................................................................................................. 356
APPENDIX B ................................................................................................. 369
APPENDIX C ................................................................................................. 370
APPENDIX D ................................................................................................. 373
APPENDIX E ................................................................................................. 374
APPENDIX F ................................................................................................. 375
APPENDIX G ................................................................................................. 376
APPENDIX H ................................................................................................. 377
APPENDIX I .................................................................................................. 381
APPENDIX J .................................................................................................. 384
APPENDIX K ................................................................................................. 387
APPENDIX L ................................................................................................. 389

xiii
LIST OF TABLES
Table Page
2. 1 Research Methodologies of Relevant Past Studies Related to
Organisational Culture and Employee Creativity
384384
2. 2 Research Methodologies of Relevant Past Studies Related to
Organisational Culture, Trustworthiness and Employee Creativity 387
3. 1 Number of Companies and Their Respective Locations
1322
3. 2 Stratified Proportionate Sampling Design
1433
3. 3 Questionnaire Design and Scale Items for Constructs Measurement 149
3. 4 Deleted Items During Pilot Study Analysis 154
4. 1 Demographic Profile of the Respondents 161
4. 2 Summary of Descriptive Statistics 165
4. 3 Inner Measurement Model and Assessment of Measurement
Model Fit 169
4.4 Reliability and Validity of Measurement Model 174
4.5 Fornell-Larcker (1981) Criterion for examining Discriminant
Validity (Diagonal elements are square roots of the AVE) 179
4.6 The Heterotrait-Monotrait Ratio (HTMT) Criterion
for examining Discriminant Validity 180
4.7 Cross-loadings 181

xiv
4.8 Model Fit Index and Structural Model Path Coefficients 188
4.9 Moderating Path Coefficients and Effects sizes of Ability,
Benevolence and Integrity 198
4.10 Results of the hypothesis testing 236

xv
LIST OF FIGURES
Figure Page
2. 1 The Componential Theory of Individual Creativity 41
2. 2 The Competing Values Framework 53
2. 3 Integrative Model of Organisational Trust 62
2. 4 Proposed Theoretical Framework 115
4. 1 Initial Measurement Model Showing the Factor
Loading/weights and Respective Path Coefficients 177
4. 2 Final Measurement Model 178
4. 3a The Structural Model and Respective Path Coefficients 185
4.3b Moderating Effect of Ability 390
4.3c Moderating Effect of benevolence 391
4.3d Moderating Effect of Integrity 392
4.4 Moderating effect of ability on the impact of adhocracy
organisational culture on employee creativity 204
4.5 Moderating effect of ability on the impact of clan
organisational culture on employee creativity 205
4.6 Moderating effect of ability on the impact of market
organisational culture on employee creativity 207
4.7 Moderating effect of ability on the impact of hierarchy
organisational culture on employee creativity 209
4.8 Moderating effect of benevolence on the impact of clan
organisational culture on employee creativity 212
4.9 Moderating effect of benevolence on the impact of
adhocracy organisational culture on employee creativity 215
4.10 Moderating effect of benevolence on the impact of market
organisational culture on employee creativity 218
4. 11 Moderating effect of benevolence on the impact of hierarchy
organisational culture on employee creativity 221

xvi
4.12 Moderating effect of integrity on the impact of clan
organisational culture on employee creativity 225
4.13 Moderating Effect of Integrity on the impact of Adhocracy
organisational culture on employee creativity. 228
4.14 Moderating effect of integrity on the impact of market
organisational culture on employee creativity 231
4.15 Moderating effect of integrity on the impact of hierarchy
organisational culture on employee creativity 234
6. 1 A multi-level organisational culture and trustworthiness
structural template (MOCTST), for engendering employee
creativity. 285

xvii
ABBREVIATIONS
AVE - Average Variance Extracted
CMB - Common Method Bias
dG - Geodesic discrepancy
f 2 - Effect Size
HTMT - Heterotrait-Monotrait Ratio
HR - Human Resources.
IT - Information Technology.
OCAI - Organisational Culture Assessment Instrument.
PLS - Partial Least Square.
R&D - Research and Development.
SEM - Structural Equation Modelling.
SRMR - Standardized Root Mean Square Residual
VIF - Variance Inflation Factor
dULS - Unweighted least squares discrepancy

xviii
PUBLICATIONS
International Conference
1. The Diffusion of Creative Ideas: A Dark Side Perspective of
Trustworthiness Perception (Published in The 19th Malaysian Finance
Association Annual Conference (MFAC), 2017).
Journal Articles
2. The moderating effect of benevolence on the impact of organisational
culture on employee creativity. Journal of Business Research. Vol 90.
pp. 334-346 (2018). Https://doi.org/10.1016/j.jbusres.2018.05.032 (Q1-
Web of Science - ISI JOURNAL). {Reflects the findings obtained from
research questions 1 and 4 of this study}
3. The Dark Side of Trustworthiness Perception and its Effects on the
Diffusion of Creative Ideas within Organisations. Journal of Business
Creativity and the Creative Economy. Vol 4. Pp. 40-52. ICSC Press. Doi:
10.18536/bcce.2018.10.8.1.05. {Highlights concepts reflecting how to
engender effective exchange of creative ideas between managers and
employees. Mirrors further insights into the background and literature
review of the study}
(Please see Appendix I for proof of manuscript publication acceptance)

1
CHAPTER ONE
INTRODUCTION
1.0 Overview
The main focus of this study is to investigate the effects of trustworthiness
on the impact of organisational culture on employee creativity, in the Nigerian
manufacturing industry. This chapter provides a detailed overview of the subject
matter and guidelines of this study. This is important so as to comprehend the
study background, aims, problem statement, objectives and questions, scope of
study, as well as the various relationships, and definitions of key contextual terms,
respectively.
1.1 Background of the Study
The concept of employee creativity is on a growing phase and it is
becoming a very widespread research phenomenon (Ghosh, 2015). This is in view
of its imperativeness and organisational significance which have been
experienced by corporations across the globe. Global corporations such as the
Hewlett-Packard software company, Procter and Gamble and the Wal-Mart, have
grown to realize, and also appreciate the importance of their employee creativity
within their respective workforce (Dong, 2002; Huston & Sakkab, 2006;

2
Peterson, 2005). Employee creativity in different organisations is usually
impacted differently and this is often due to the distinct operating organisational
cultures of each organisation. Cameron and Quinn (2006) highlighted that an
organisational culture may mainly reflect either values of adhocracy, clan, market
and or hierarchy organisational culture dimensions. Based on this, managers
seeking to engender employee creativity ought to employ the organisational
culture dimension which best suits their overall objectives. A major reason for
the relevance of an organizational culture which engenders employee creativity
is for the organisation to remain competitive, maintain sustainability as well as
increase profitability (Andreeva & Kianto, 2011; Ajay & Ana, 2015; Anastasia,
2015; Brown & Anthony, 2011).
Over the years, increasing changes in innovation have appeared to
instigate managers in striving to initiate and maintain a creative workforce driven
by a strong organisational culture (Amabile & Pillemer, 2012). The impacts of
organisational culture on employee creativity relates a necessity for managers to
re-evaluate their processes of managing the creativity of employees (Afsar, 2016;
Chang & Nadine, 2014; Ghosh, 2015; Hoskins, 2014; Raduan, Naresh, Haslinda,
& Goh, 2008). This, consequently cause managers to continuously review their
organisational cultures in order to identify factors which might have strong
impacts on employee creativity. A major factor known as trustworthiness has thus
been advocated to either inhibit or foster the degree of employee creativity
engenderment (Bradley, Yongjian, & Satyanarayana, 2014; Braun, Peus,
Weisweiler, & Frey, 2013; Rebecca & David, 2015). Trustworthiness could

3
influence the level of employee creativity by impacting the degree of diffusion of
creative ideas (Upasna, 2014).
The importance of employees with a very high capacity to commit
towards the diffusion of creative ideas should not be overlooked by organisational
managers. This is because employees are the most valuable assets to any
organisation (Aguirre, Post, & Hewlett, 2009; Biswas & Varma, 2012; Björkman,
et al., 2013; Olalere & Adesoji, 2013; Oscar, Tone, Leif, & Hansen, 2014).
Employees could manifest high levels of creativity should their expertise,
creativity skills and task motivations be given the considerable support and
attention they require (Amabile, 1997). Employee creativity usually involves a
cognitive process which may lead towards the creation of new products, services,
processes and or paradigm shifts (Afsar, 2016; Graen, 2009; Martha, Carolina,
Joseph, Niels, & Pei-Chuan, 2002). Therefore, organisational managers may have
to operate a flexible organisational culture that helps to reach into and exploit the
depths of respective employee creativity.
Sharifirad (2016) also argue that the organisational culture can impact the
creativity levels of organisational employees. Hence organisations might have to
re-evaluate their cultures with respect to their artefacts, basic values, beliefs and
even their underlying assumptions (Schein, 2010). Managers may also need to
inculcate flexibility within the workforce, regarding how things are done, to what
things ought to be done and in what ways. These steps are also vital for a learning
organisational workforce that seeks to continuously support and engender

4
employee creativity (Liu et al., 2016). Nevertheless, Afsar (2016) claim that an
organisational workforce is influenced by different cultural factors and that the
degree at which they operate, varies differently. Despite the importance and
relationships between the diverse conceptual understandings of organisational
culture and creativity, studies (Amabile & Pillemer, 2012; Biswas & Varma,
2012; Ghosh, 2015; Pay, Balaji, & Kok, 2015; Sharifirad, 2016) have yet to agree
on the complexities surrounding the definitions, conceptual and theoretical
undergirding of organisational culture, trustworthiness and employee creativity.
Despite the positions, capabilities and job roles of employees, creativity
ought to be welcomed and given adequate feedbacks even though not all creative
ideas may be implemented by managers (Muenjohn & McMurray, 2017). Also
employees ought to have some degree of freedom to make choices, and take
creative risks without the fear of adverse job related consequences from their
superiors (Ajay & Ana, 2015; Beausaert, Segers, & Gijselaers, 2011). This
reflects an adhocracy organisational culture type (Cameron & Quinn, 2006). A
type of organisational culture which engenders employees to engage in creative
risk initiatives within the work environment. Opportunities for high levels of
employee creativity development could further become plausible when
employees’ freedom and choices to commit towards creativity are supported by
a strong and appropriate organisational culture.
Similarly, Aguirre et al. (2009) opined that when employee creativity is
effectively supported, there is an increase in the sense of self belonging for

5
employees. Also Liu, Zhang, Liao, Hao, and Mao (2016) further point out that
employee creativity facilitates an effective learning organisational culture, as
employees tend to develop a mental awareness of flexibility and effective
communication processes among each other. Therefore, an organisational culture
which facilitates the development and effective engenderment of employee
creativity is bound to increase the diffusion of creative ideas that are relevant for
fostering innovation centred objectives (Yetunde & Aluko, 2012; Sharifirad,
2016). The implications of engendering employee creativity have been
considered in manufacturing organisations across several countries like South
Africa (Ellen & Nico, 2002), and Egypt (Mostafa, 2005), and Iran (Mobarakeh,
2011), and India (Gupta, 2011). However, the phenomenon of employee
creativity has yet to receive considerable attention in the Nigerian manufacturing
industry (Dimnwobi, Ekesiobi, & Mgbemena, 2016).
Dimnwobi et al. (2016) stress that Nigerian manufacturing organisations
struggle in terms of engendering an adequate level of employee creativity
required to foster national level innovation and promote the Nigerian economy.
This is due to the on-going organisational culture type in operation within the
manufacturing industry (Uwalomwa & Jafaru, 2012). According to Hofstede and
McCrae (2004), Nigerian organisations operate a high power distance culture.
Characteristics of this kind of organisational culture is very similar to the
Cameron and Quinn (2006) hierarchical organisational culture type. The power
distance and hierarchical organisational culture types rather inhibits employee
creativity due to high bureaucratic processes (Naranjo-Valencia, Jiménez-
Jiménez, & Sanz-Valle, 2016; Sridharan & Simatupang, 2013).

6
The hierarchical organisational culture type presents very little or no
flexibility between employees and top management to commit elaborately
towards employee creativity initiatives. According to Cameron and Quinn (1999)
competing values framework, the hierarchical organisational culture favours
structure and high control, efficiency and stability. The prevalence of this
organisational culture type does not favour risk taking and entrepreneurship
(Hofstede & Michael, 2010). It does not promote employee freedom within the
workplace and most of all inhibits trust among employees and top management
leaders (Carlos & Maria, 2014; Sridharan & Simatupang, 2013). Similarly,
Owolabi and Abdul-Hameed (2011) opine that this form of culture relates a
management covered with a mask of participation. Top management’s pretence
to be participative may therefore, not earn the trusts of employees (Dagmara &
Katarzyna, 2015). This could subsequently become an issue, as employees tend
to have a poor perception of top management.
Employee’s perceptions about top management may subsequently
become realigned with the motivation to express dissatisfactory attitudes of
distrust within the workforce (Agnieszka & Dariusz, 2016; Braun et al., 2013).
According to Joe (2014), employees’ perception of top management as
trustworthy is vital for facilitating the development and diffusion of creative ideas
within the workforce. Pay et al. (2015) postulate that a major factor that also
influences employees’ willingness to share their creative ideas is their
trustworthiness perception of their top management leaders. In this case, the
diffusion of creative ideas may very well depend on top managements’ ability,

7
benevolence and integrity to engage in interpersonal relationships that can help
to engender employee creativity (Rebecca & David, 2015).
Such relationships are often built on trustworthiness perceptions that then
determine the emergence or continuity of trust relationships. Trustworthiness is
an important factor that facilitates an employee’s decision-making process to
become vulnerable to organisational top management leaders (Vathsala &
Ruvini, 2012). It further promotes employee’s commitment and engagement
towards employee creativity initiatives (Jan & Hazel, 2013). According to
Upasna (2014), it is thus, important for top management and employees to
develop, and maintain a strong trust relationship in order to sustain positive
organisational culture impact on employee creativity.
Employee creativity is viewed as a critical resource point that needs to be
strategically managed by organisational management in a most effective and
efficient way (Graen, 2009). Sternberg (2006) emphasised that employee
creativity relates the significant evidence of a single or more creative ideas
committed towards remarkable innovations. In the course of employees’ daily job
routines, there is often the occurrence of a flash or flashes of creative ideas in
their minds (Sharifirad, 2016). Managers ought to find a way to capture and
nurture these creative ideas to further ensure organisational long-term survival
(Kembaren, Simatupang, Larso, & Wiyancoko, 2014). However, James (2008)
maintained that regardless of employees’ job positions, they might not be able or

8
willing to share their creative ideas in an organisation operating a rigid
organisational culture.
Yetunde and Aluko (2012) strongly acknowledge that in order to
encourage the diffusion of creative ideas, what really matters is top management’s
empowerment of employees to identify their own priorities and also implement
initiatives of direct benefit to them. Although, top management in this case could
be faced with the challenge of comprehensively capturing, representing and
developing these creative ideas which independently are not easily capturable
from an unresponsive employee. Moreover, Barry and Meisiek (2010) postulate
that creative ideas that are not thoroughly capturable cannot be adequately
utilized towards realizing the complete innovative potentials of an organisation.
Likewise, Ajay and Ana (2015) highlight that the significances of
creativity are still been realised by organisational top management leaders as they
continue to engage in more creativity related initiatives. Nevertheless, not all of
these initiatives may generate increased creativity and effective diffusion of
employee creative ideas. In retrospect, this study’s discourse on organisational
culture, trustworthiness, and employee creativity seeks to investigate the distinct
impacts of several organisational culture dimensions on employee creativity. In
order to further engender employee creativity, via an effective diffusion of
creative ideas, this study, also attempts to examine the effects of top management
leaders’ trustworthiness on the impact of organisational culture on employee
creativity. This is to further guide organisational top management leaders in their

9
efforts to operate a flexible organisational culture which inspires strong
trustworthiness perceptions, and that can provoke employee creativity
engenderment in Nigerian manufacturing industry (Birkinshaw, Crainer, & Mol,
2007; Raduan, Naresh, Haslinda, & Goh, 2008; Sharifirad, 2016).
1.1.2 The Nigerian Manufacturing Industry
African employees are usually creative, as established by a long history
of exclusive cultural goods which are accepted all over the world (Mike,
Jonathan, Kingsley, & Oladukun, 2009; Kpakol, Obiora, & Jaja, 2016). African
history relates creative employees who in various areas of their creative
industries, have demonstrated skills and entrepreneurship over the years
(Bounfour, 2018; Egbochuku, 2001). Although, compared to the rest of Africa,
there are claims to the potentials of employee creativity in Nigeria, as employee
creativity exhibited within Nigeria is also further rooted in the Nigerian
manufacturing industry experience (Ndaliman, Kamariah, Chikaji, & Mohd,
2015). The Nigerian manufacturing industry can contribute innovatively to the
nations’ increasing interdependent civilization. This notion could basically be
sustained by dealing with the challenge of engendering employee creativity to
ensure long term organisational survival (Carlos & Maria, 2014; Mike et al.,
2009).

10
Egbochukwu (2001) also stressed that Nigeria was at the same level of
development like other countries such as Indonesia, Brazil, Pakistan and
Malaysia in the 1950’s to 1960’s. However, today it ranks below them all in terms
of its overall level of employee creativity development. Nigeria has fallen behind
other countries in terms of high commitment of organisations towards employee
creativity development (Mike et al., 2009). Reflecting on employee creativity
development system in Nigeria, Ndaliman et al. (2015) concluded that it is yet
unsatisfactory for the average organisational employee. Nigeria yet struggles to
revive its weak manufacturing sector as its manufacturing organisations have
failed to achieve expected employee creativity growth (Adejumo, 2013;
Ndaliman et al., 2015; Nwibere, 2013; Onyeagu & Okeiyika, 2013). This is also
because manufacturing organisations have become unsuccessful in managing and
husbanding the concept of employee creativity (Ndaliman et al., 2015). Olusanya
(2000) pointed out that since the time of Nigeria’s independence, successive
organisational cultures have battled against inherent management militating
against employee creativity development. However, only little success has been
established.
Nigeria is part of a number of international and regional initiatives which
seeks to encourage employee creativity. Being part of the initiative, Nigeria is yet
to take the necessary actions required to put the employee creativity concept at
the forefront of organisational growth and development (Mike et al., 2009;
Ndaliman et al., 2015). Mike et al. (2009) emphasized that it is important for
Nigerian manufacturing industry initiatives to focus on the creativity of
organisational employees respectively. Employee creativity ought to be driven

11
from a broad platform as creative assets are fully embraced and adequately
articulated by each organisation. Similarly, Sangosanya (2011) argued that
organisations could have a high development rate if it operates a healthy
employee creativity system. The concept of employee creativity is thus, a broad
based trait which has to be nurtured and cultivated (Amabile & Pillemer, 2012;
Beth & Amabile, 2010; Mike et al., 2009).
Owolabi and Abdul-Hameed (2011) claimed that manufacturing
organisations all over the world perform an important role of contributing
positively towards economic improvement. Similarly, the Nigerian economy has
experienced great change since her independence in 1960 (Oluba, 2008;
Olorunfemi, Tomola, Felix, & Ogunleye, 2013). The manufacturing industry is
one of the focal industries in Nigeria (Federal Ministry of Industry, Trade and
Investment, 2011). A major attention in the manufacturing industry is that it
serves as a high potential system for jobs creation and a development platform of
employees’ creativity and innovative ideas (Owolabi & Abdul-Hameed, 2011).
However, studies reflect that there is an alarming lack of adequate commitment
by organisational top management leaders towards employee creativity within the
Nigerian manufacturing sector (Adeel, Francis, & Simon, 2006; John, 2011; Ku,
Mustapha, & Goh, 2010; Nigeria Industrial Revolution Plan, 2014; Olorunfemi
et al., 2013; Sangosanya, 2011).
Umoh, Amah, and Wokocha (2014) also relate an issue of less
consideration and under-utilisation of employees who otherwise contribute

12
effectively towards high employee creativity within the Nigerian manufacturing
industry. This is often due to a negative impact from the operated organisational
culture type (Skerlavaj, Su, & Huang, 2013). An organisational culture which
expresses less consideration for employee creativity development may end up
arousing a climate of interpersonal distrust among organisational members.
Where there is a climate of distrust, it is more difficult for employees to recognise
and value top management leaders’ trustworthiness (Ezirim, Nwibere, &
Emecheta, 2010; Mehlika, Ismai, & Mehmet, 2014; Seok & Chiew, 2013;
Sternberg, 2012).
Similarly, what might be prototypical behaviour for one employee may
reflect a counter-normative perspective for the other. Gabriel and Kpakol (2014)
further maintain that this is yet a growing issue which tends to result in conflicting
values (Dollinger, Burke, & Gump, 2007) between organisational members. In
an empirical evidence from Nigeria, Ojo (2012) highlighted that although
organisational culture is intangible, it is however manifested in the workplace
through its impacts on workplace relationships, conditions and work processes.
It is also reflected in the results of its impact on employees. As observed by Ojo
(2012), organizational culture incorporates values that mirror all life experiences,
creative capabilities and innovative skills each employee brings to the
organization.
Gabriel and Kpakol (2014) thus, reiterated that managers ought to ensure
a congruence of employee values, and that of their organisational culture, in order

13
to avoid issues of conflicting values, that could breed rigidity and distrust among
organisational members. Otherwise, this could lead to loss of creative ideas as
employees consistently leave their organisations for another (Chukwuma &
Obiefuna, 2014). Conversely, some employees may not want to quit their
organisations due to obvious benefits like salaries, wages, bonus, and other
incentives. However, they could consciously or subconsciously build up wrong
perceptions of job or workplace dissatisfaction. Employees within the
manufacturing industry may subsequently end up suppressing their creative ideas
by avoiding extra responsibilities in order to keep their jobs (Chukwuma &
Obiefuna, 2014).
Conversely, when employees’ trustworthiness perceptions of top
management appear to be discouraging, the rate of transfer of creative ideas and
innovative skills tends to decline (Pay, Balaji & Kok, 2015). Based on an analysis
of panel data from 23 developing countries, Hsiao (2003) affirms that
trustworthiness is also one major factor and prerequisite necessary for attracting
commitment towards employee creativity initiatives via the diffusion of creative
ideas (Vathsala & Ruvini, 2012; Liu et al., 2016). Hence, in Nigeria, the
manufacturing industry would continue to experience a grave struggle in its drive
to engender employee creativity, if employee trustworthiness perception towards
creativity initiatives are poorly considered. Likewise, the Nigerian economy
would undoubtedly continue to struggle if organisational employees are
incessantly impacted by a culture of distrust; as well as a climate of poor
trustworthiness perception of organisational members (Mosavi, Abedi, & Ghaedi,
2013; Rebecca & David, 2015).

14
Liu et al. (2016) also stress that in cases where top management leaders
do not adequately commit towards employee creativity, employees tend to
inculcate an altered trustworthiness perception of their managers. Therefore,
employees may perceive them as not been trustworthy in terms of their ability,
integrity or benevolence towards employee creativity initiatives (Bradley,
Yongjian, & Satyanarayana, 2014). When the trustworthiness of top management
leaders, and employees become convincingly questionable, it could deter
organisational members from, and dampen their collective commitments towards
creativity initiatives (Carvell & Paula, 2015; Liu et al., 2016; Rebecca & David,
2015). Additionally, such climate of trustworthiness conflict is also a reflection
of an on-going trend experienced within the Nigerian manufacturing industry
(Adeel, Francis, & Simon, 2006; Nzewi & Nwaduhu, 2015; Uwalomwa & Jafaru,
2012). However, employees are also often very conscious of the difference
between the official democracy and actual dictatorship of top management
leaders (Bradley et al., 2014; Won-Moo, Taewon, & Seung-Yoon, 2016).
In view of this, Gabriel and Kpakol (2014) opine that it goes beyond just
fancy assurances, employee support systems and monetary encouragements, to
achieve and sustain employee interpersonal trust relationships within the Nigerian
manufacturing industry. Top management behaviours are perceived as
unreceptive towards the development of employee creativity initiatives. As a
result, top management leaders are perceived to have questionable ability,
benevolence, and integrity, which is often typically followed by a decline in

15
employee work attitudes and sometimes intense organisation conflict if left
uncontrolled (Savolainen & López-Fresno, 2012). This also promotes unhealthy
work environments that inhibits effective and efficient diffusion of creative ideas,
as well as a poor level of commitment towards employee creativity initiatives
within manufacturing organisations (Ndaliman et al., 2015).
Kpakol et al. (2016) further stress that although the employee creativity
concept may exist in some Nigerian manufacturing companies, it however needs
to be stimulated and improved upon. Likewise, the Nigeria Industrial Revolution
Plan (2014) accentuated that employees lack the required competence and
capacity to demonstrate creative skills in course of implementing their jobs. A
major reason of this is due to poor diffusion of employee creative ideas within
manufacturing organisations (Adeel et al., 2006). Studies such as Gabriel and
Kpakol (2014), Ndaliman et al. (2015) and Kpakol et al. (2016) argue that
employees could withdraw from participating in or committing towards the
diffusion of creative ideas in cases where the organisational culture inhibits
creativity.
Manufacturing organisations need employee creative ideas to support its
continuous growth and survival. According to Owolabi and Abdul-Hameed
(2011), the lack of adequate commitment and support of employee creativity in
the Nigerian manufacturing sectors results in employees’ poor development of
their creative skills. This further impacts the level of their respective creativity
skills, and the use of creative ideas within the Nigerian manufacturing sector

16
(Adeel et al., 2006). Adeel et al. (2006) and Hope and Godwin (2015) further
opined that the manufacturing sector is not even open to the extensive use or
adoption of the concept of employee creativity. This is therefore causing
stagnation and also negatively impacting the efficiency of employee creativity
engenderment within Nigerian manufacturing industry (Nzewi & Nwaduhu,
2015).
With respect to the Nigeria Industrial Revolution Plan (2014), the
Nigerian manufacturing industry has failed to undergo the creative and innovative
transformation necessary for it to play a leading part in both employee creative
and innovative excellence. Employee creativity requires effective interaction
between employees and managers to build on existing, or make new creative
ideas (Fabian, Ike, & Alma, 2014). Limited financial resources also hinder the
rapid growth of employee creativity within the workplace (Olalere & Adesoji,
2013). The required creative capabilities of employees necessary to guarantee
effective and efficient employee creativity engenderment is still insufficient
(Uwalomwa & Jafaru, 2012). Poor communication systems and processes makes
it very challenging to share and exploit creative ideas that gravitate towards
innovations (Nigeria Industrial Revolution Plan, 2014).
While the Nigerian manufacturing industry needs innovation to succeed,
it requires employee creativity as a catalyst for achieving her innovation related
goals (Amabile & Pillemer, 2012; Chang & Nadine, 2014). A strong employee
creativity system is what underpins sustainable improvements in industrial

17
activities even from an individual level perspective (Amabile, 1997). Low
employee creativity within an organisational workforce is one of the greatest
challenges hindering the Nigeria manufacturing industry (Nigeria Industrial
Revolution Plan, 2014).
1.1.3 Employee Creativity in the Manufacturing Industry
Employee creativity is an individual level phenomenon which could be
identified as an observable trait reflected in the creative behaviours of employees.
Employee creativity is related to originality, novelty and appropriateness of ideas
concerning services, products or processes exhibited by employees (Amabile &
Pillemer, 2012). Studies relating to employee creativity within manufacturing
organisations highlight a strong significance for assessing creativity, based on
core research and technological innovations perspectives (Adejumo, 2013;
Amabile, 1997; Akume & Abdullahi, 2013; Brown & Anthony, 2011; Chukwuma
& Obiefuna, 2014; Gabora & Leijnen, 2013; Ghosh, 2015; Hope & Godwin,
2015; Ndaliman et al., 2015; Vishal & Shailendra, 2012). This is in view that
manufacturing organisations tend to have already structured procedures for
specific tasks, routines and processes, tailored towards high efficiency and
productivity (Hope & Godwin, 2015; Ndaliman et al., 2015).
Likewise, job routines and tasks within departments like operations,
procurement and logistics or even the security department within the
manufacturing organisations, may give little or no flexibility for implementing

18
strong employee creativity initiatives. However, employees working within the
Research and Development (R&D) and or Information Technology (IT) related
departments tend to have wider avenues to suggest, initiate, engage in and or
execute employee creativity initiatives, even upon aligned task routines, policies
and processes (Gupta & Singh, 2012; Gabora & Leijnen, 2013). Congruently, this
seems plausible due to the nature of their jobs and responsibilities.
Equally, employee creativity in IT departments is also vital, as it
engenders in-depth analysis and experimentations relevant to foster innovative
and technological processes of the organisation. Employees could be opportune
to write new programs, suggest and or initiate new software, relevant to foster
production efficiency even across other departments (Zoogah & Zoogah, 2014).
Mittal and Dhar (2015) also stress the significance of creativity in IT. The authors
further advocate that for employee creativity to achieve creative and innovative
outcomes within the IT paradigms, there is need to realise the importance of
employees who are research oriented, and willing to accept and adopt new
technology prowess (White, McMurray, & Rudito, 2012).
On the other hand, most research oriented employees are often found in
R&D departments. The R&D departments also reflect a pool of creativity and
innovation oriented employees (Burbiel, 2009). R&D departments normally
consists of employees who engage strongly in scientific processes that are centred
on creativity and innovation development initiatives (Gupta & Singh, 2012).
Thus, Amabile and Pillemer (2012) stressed on a distinction in employee
creativity. The authors argued that the psychometric characteristics of employee
creativity and the requirements for creativity initiatives differs between

19
employees as well as across various departments. Likewise, R&D and IT
departments may often encompass in-depth research and experimentations,
spanning across the creativity paradigms of other departments (marketing,
production, human resources) within the manufacturing organisation (Burbiel,
2009; Gupta & Singh, 2012; Mittal & Dhar, 2015; Tung & Yu, 2016; Zoogah &
Zoogah, 2014). Employee creativity within manufacturing organisations is thus,
a major prerequisite for short and long term survival (Liu et al., 2016).
It is important for managers to engender and support employee creativity
for every employee within the organisation, regardless of the employee’s
department. Amabile et al. (2008) reported that creativity exists in every domain.
Its existence may be observed through employee traits and in two distinct forms.
They may be observed via high (genius) creativity levels or a low (everyday)
creativity levels. These levels are identified as the Big C creativity and the Little
C creativity respectively (Stein, 1987; Merrotsy, 2013). Kaufman and Beghetto
(2009) highlighted that employees within the Big C construct are typical creators
or inventors. They are known as researchers and experts whose contributions are
eminent or novel. Merrotsy (2013) pointed out that Little C creativity consists of
employees who are non-experts and non-professionals; yet they participate in
everyday creative actions. Kaufman and Beghetto (2009) also argued that
employees in the Little C category usually engage in less remarkable and far more
ambiguous employee creativity initiatives. The is the kind of everyday or
common creativity initiatives observed in most employees, usually in course of
effecting their jobs.

20
However, due to growing discrepancies in studies regarding employee
creativity levels and creativity within various domains, it is important to also note
that strong employee creativity initiatives seems to be relatively higher in the
R&D and IT departments as compared to other departments (Burbiel, 2009;
Kaufman & Baer, 2004; Kaufman, Baer, Agars, & Loomis, 2010; Kaufman &
Beghetto, 2009; Kaufman, 2012; Merrotsy, 2013; Runco, Plucker, & Lim, 2001;
Tung & Yu, 2016; Vishal & Shailendra, 2012; Zoogah & Zoogah, 2014).
Consequently, it could be accentuated that employees within the R&D and IT
departments exhibit the Big C creativity rather than the Little C creativity, as
employees within both levels exhibit different psychological characteristics
(Amabile & Pillemer, 2012; Merrotsy, 2013; Stein, 1987). Burbiel (2009)
highlighted that most scientific and technological innovations usually originate
from R&D departments. According to Vishal and Shailendra (2012), R&D
departments also reflect the main innovation source from a scientific perspective.
The authors opine that R&D provides competitive advantage for the organisation,
through adequate knowledge generation, experimentation, diffusion and
integration.
R&D and IT departments may often consist of employees from various
departments who are homogenously classified and identified by their relative job
routine requirements. Employees within these departments might appear to be
homogenously grouped based on departmental creativity initiatives and
requirements. They are thus, relevant to further facilitate innovativeness within
distinct facets of the organisational structure respectively (Gupta & Singh, 2012;
Tung & Yu, 2016; Zoogah & Zoogah, 2014).

21
1.2 Problem Statement
A major aspiration for Nigeria is to break into the group of the top 20
economies across the world by the year 2020 (Dimnwobi et al., 2016). Thus,
diversification initiatives of the Nigerian manufacturing industry have been a top
priority of the nation’s administration. This is on the precipice of engendering
employee creativity, as a cornerstone for innovation, and economic progress for
the Nigerian economy (Dimnwobi et al., 2016; Florida, Mellander, & King,
2015). Regrettably, in the 2015 Global Creativity Index (GCI), that reflects long
run economic prosperity, Nigeria is not ranked as one of the 139 countries.
Nations like Australia, United States, Canada and even New Zealand, head the
spotlight on the GCI. Nigeria is also not part of the several African countries such
as South Africa, Kenya, Ethiopia, Botswana that have been highly ranked in the
GCI. Similarly, even the Global Innovation Index (GII) 2015, that encompasses
over 141 countries across the globe ranks Nigeria as the 128th in the world
(Cornell University, INSEAD, WIPO, 2015; Florida et al., 2015).
Emeka, Ifeoma, and Emmanuel (2015) and Dimnwobi et al. (2016)
accentuate that Nigeria is thus lagging behind with respect to worldwide
competitiveness on creativity and innovation. This is further evidenced in the
Global Competitiveness Index and scorecard which reflects Nigeria as 106 out of
140 countries competing for technological readinness. Nigeria is also ranked 117
out of 140 countries, in the growth rankings of innovation (World Economic
Forum, 2015). Ikemefuna and Abe (2015) further supports that this reflects a slow

22
growth impact on creative and innovative capabilities of the Nigerian economy.
Likewise, Dimnwobi et al. (2016) espouse that Nigeria’s suboptimal creativity
level is responsible for several socio-economic issues that has plauged the
nation’s innovative prowess.
Moreover, a major industry that is directly capable of reviving the nation’s
economy, by transforming it into an innovation centred entity, is known to be the
manufacturing industry (Ikemefuna & Abe, 2015; Popoola & Fagbola, 2014).
Emeka et al. (2015) opined that the Nigerian manufacturing industry is known to
be an engine for innovation growth which subsequently increases employment
and wealth for Nigeria’s economy. The authors stressed that it is the country’s
platform for creativity and innovations development. However, in recent years, it
has grossly underperformed in terms of its highlighted strenghts. As far back as
1977, creativity and innovative capability of the manufacturing sector was ranked
at 78.8% by the country’s central bank. But, over the years, it has faced a growing
decline which is down to about 29.3% (Central Bank of Nigeria, 2004; Emeka et
al., 2015).
The results suggest an inability of the manufacturing industry to cope with
increasing changes in technological innovations, which has also led to a closure
of a high number of manufacturing organisations (Emeka et al., 2015; Ogbo,
Okechukw, & Ukpere, 2012). Although, Nigeria revealed a rebased gross
domestic product figures for the year 2013, that showed an 89% increase in the
projected size of its economy; the manufacturing sector that ought to reflect the
innovative strenght of the economy only contributed 6.81% to the new gross

23
domestic product data. This is a very low rate, compared to the high rate of
conrtibutions of other sectors of the nation (Dimnwobi et al., 2016; Emeka et al.,
2015).
Dimnwobi et al. (2016) therefore argued that for the high expectations of
the Nigerian manufacturing industry to be achieved, a lot of creativity centred
initiatives are needed to drive the innovation standards of the country. However,
the Nigerian manufacturing industry may not thrive for long as it faces several
challenges that inhibits it from being able to drive the innovativeness of the
Nigerian economy (Emeka et al., 2015). A severe challenge the Nigerian
manufacturing organisations continue to encounter is the application of
organisational cultures which do not strongly support employee creativity
(Gabriel & Kpakol, 2014; Hofstede & Michael, 2010; Hoskins, 2014).
Gabriel and Kpakol (2014) opine that Nigerian manufacturing
organisations ought to strive to operate clearly defined, flexible and generally
acceptable organisational cultures which strongly supports and commits towards
engendering employee creativity. Similarly, by not employing an organisational
culture which fosters employee’s workplace freedom, top management leaders
yet struggle to embrace employee creativity initiatives (Ndaliman et al., 2015).
This workplace freedom is vital for the exploitation and diffusion of creative ideas
as it also promotes employee’s engagement in creativity initiatives without the
fear of punishment (Afsar, 2016).

24
Application of less supportive organisational cultures towards employee
creativity does constrain employees from contributing distinct creative ideas
which might facilitate organisation’s innovativeness. Likewise, in cases when
employee creative ideas reflect strong sense of novelty, managers tend to perceive
them as threats to their respective job positions (Ezirim et al., 2010; Ndaliman et
al., 2015; Nwibere, 2013). Hence, Umoh et al. (2014) highlighted that creative
ideas are often lost or inhibited in Nigerian manufacturing organisations, as they
are sometimes unwelcomed by top management leaders, managers or fellow
employees. A similar case is when line managers become unreceptive to creative
ideas due to fear of losing their jobs in the long run, to the employee with the
creative idea. This is also in view that some creative ideas also require or lead to
major changes in the organisation. As such, top management leaders could
perceive such changes as unfavourable to already familiar organisational culture
routines and practices. Creative ideas which are capable of causing major changes
in organisations could also be perceived as a source of inconvenience to
respective top management leaders (Ezirim et al., 2010; Ndaliman et al., 2015;
Nwibere, 2013).
An effective exchange of creative ideas could therefore, be contingent
upon employee’s strong trustworthiness perceptions of top management leaders’
ability, benevolence and integrity to commit towards creativity initiatives.
Trustworthiness plays a great role in determining the degree at which values of
organisational members are integrated to foster exchange of creative ideas
(Bradley et al., 2014). Studies that have espoused on the Nigerian manufacturing
industry further reflect that organisational members still struggle to express

25
effective and efficient perceived trustworthiness (Akume & Abdullahi, 2013;
Chukwuma & Obiefuna, 2014; Gabriel & Kpakol, 2014; Ndaliman et al., 2015;
Umoh et al., 2014; Uwuigbe & Jimoh, 2012).
However, in several Nigerian manufacturing organisations, employees
tend to avoid exchanging their creative ideas due to low trustworthiness
perception of organisational members that continues to inhibit interpersonal trust
relationships. The rate of diffusion of creative ideas within Nigerian
manufacturing organisations is thus inhibited by low trustworthiness perceptions
among organisational members (Mosavi, Abedi, & Ghaedi, 2013; Peter, Brian, &
Rob, 2015; Seok & Chiew, 2013). This could subsequently cause employees to
become unresponsive towards creativity initiatives. This further poorly impacts
the level of employee creativity growth and organisational innovativeness (Jan &
Hazel, 2013). This, therefore, presents another major reason why top
management leaders struggle to engender employee creativity (Gabriel &
Kpakol, 2014).
Nigerian manufacturing organisations have applied several initiatives to
combat the growing challenges posed by the distinct organisational cultures and
their impacts on employee creativity. Nevertheless, Ndaliman et al. (2015)
postulate that much is yet to be done to build and transform Nigeria into an
innovation centric entity. Mike et al. (2009) further relate that without an adequate
solution, the creativity initiatives endemic within Nigerian manufacturing
industry would yet fail in the attempts to improve upon employee creativity. This
is also in congruence to the negligence of employees’ perceived trustworthiness

26
which is otherwise relevant to foster the exchange and diffusion of creative ideas.
Trustworthiness perception is a behavioural trait which is observed among
organisational members, and its impact can also be further experienced in the
organisational culture processes (Amabile & Pillemer, 2012; Jan & Hazel, 2013;
Raduan et al., 2008; Savolainen & López-Fresno, 2012).
The organisational culture reflects a complex web of integrated values. It
consists of a multiplicity of complex ideals inherently structured as values
(Cameron & Quinn, 1999; Dollinger, Burke, & Gump, 2007; Martins &
Terblanche, 2003). Studies elucidate that such integration tends to stir up issues
of conflicting values from various organisational members (Kpakol et al., 2016;
Lipponen et al., 2008; Ojo, 2012). An empirical analysis carried out in Nigeria
reflects issues of ineffective integration of organisational culture values with the
set values of organisational members (Ojo, 2012). Employees strongly uphold
their respective values and thus avoid sharing or integrating individual values
with various organisational cultural values. Within Nigerian manufacturing
organisations, this is also becoming a common factor that is negatively impacting
employees’ creative capabilities and behaviours to engage in employee creativity
initiatives (Fabian et al., 2014; Olorunfemi et al., 2013).
Furthermore, employing an unsupportive organisational culture presents
top management leaders with the difficulty of tapping into the creative ideas of
their employees (Andreeva & Kianto, 2011). Likewise, tapped and cultivated

27
creative ideas mirror a major source of organisational innovativeness, and long-
term survival (Anastasia, 2015; Sharifirad, 2016).
The research questions and objectives for this study are therefore
highlighted, in lieu of the problem statement.
1.3 Research Questions
1. What relationships exist between organisational culture dimensions and
employee creativity?
2. What are the relationships between trustworthiness dimensions and
employee creativity?
3. How does ability moderate the impact of organisational culture
dimensions on employee creativity?
4. How does benevolence moderate the impact of organisational culture
dimensions on employee creativity?
5. How does integrity moderate the impact of organisational culture
dimensions on employee creativity?
1.4 Research Objectives
1. To investigate the impact of organisational culture dimensions on
employee creativity.

28
2. To examine the effect of trustworthiness dimensions on employee
creativity.
3. To investigate the moderating effect of trustworthiness dimensions on
the impact of organisational culture dimensions on employee creativity
1.5 Significance of the Study
This research is useful to facilitate the diffusion of employee creative
ideas within an organisational workforce. It would assist in bringing about
improvement of employee creative skills and innovative capabilities. It would
also serve as a resourceful guide for identifying and critically analysing how
trustworthiness impacts the culture of an organisation towards the engendering of
employee creativity. This research would also be significant to academicians for
the purpose of further identifying and managing organisational culture
dimensions which tend to inhibit or engender employee creativity within the
workforce. Similarly, it would aid in creating a platform for further conceptual
research development towards increased organisational creativity. This is in view
that this study is based on an employee creativity level.
Moreover, the results of this study would also act as a research guide for
policy makers to further investigate possible organisational culture impacts on the
development, exploitation and implementation of employee creativity. It would
aid employee creativity consultants and human resource professionals to relay
organisational culture strategies by which trustworthiness effects within the

29
workforce, would improve academic and organisational related employee
creativity within and across Nigeria.
1.6 Scope of the Study
This study focus on core organisational cultures which affects employee
creativity within the Nigerian manufacturing industry. It seeks to examine the
effects of top management leaders’ trustworthiness on employee creativity, and
the moderating effects of top management leaders’ trustworthiness on the impact
of organisational culture on employee creativity. Likewise, it tries to find out what
trustworthiness dimensions could be employed to engender employee creativity
within distinct organisational cultures in Nigerian manufacturing industry. This
is due to its significance and potential to Nigeria’s economic development. Also,
due to the distinctions and discrepancies surrounding the creative employee
underpinnings, respondents in this study would be from the R&D, and IT
departments, respectively. Respondents from the R&D and IT departments are
regarded as employees exhibiting high level creativity.
Moreover, in order to have a clearer understanding of major arguments
employed within this study, it is therefore necessary to consider briefly the
various meanings of key reoccurring terms employed.
30
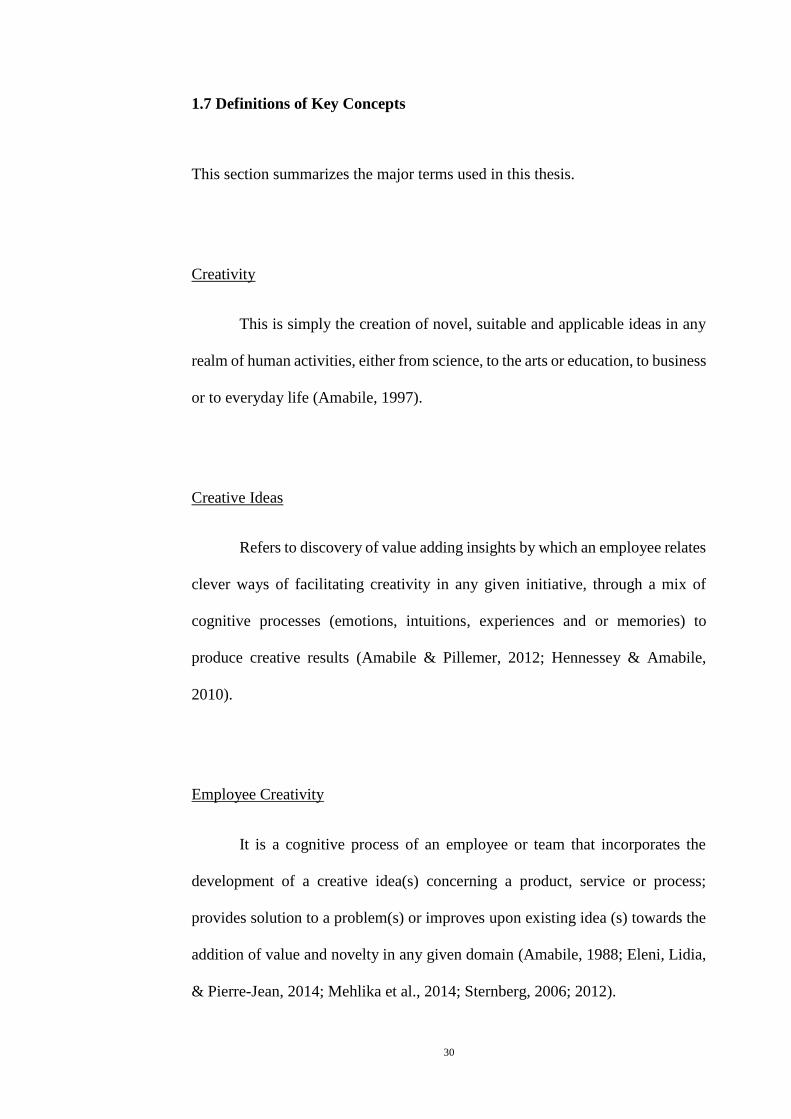
1.7 Definitions of Key Concepts
This section summarizes the major terms used in this thesis.
Creativity
This is simply the creation of novel, suitable and applicable ideas in any
realm of human activities, either from science, to the arts or education, to business
or to everyday life (Amabile, 1997).
Creative Ideas
Refers to discovery of value adding insights by which an employee relates
clever ways of facilitating creativity in any given initiative, through a mix of
cognitive processes (emotions, intuitions, experiences and or memories) to
produce creative results (Amabile & Pillemer, 2012; Hennessey & Amabile,
2010).
Employee Creativity
It is a cognitive process of an employee or team that incorporates the
development of a creative idea(s) concerning a product, service or process;
provides solution to a problem(s) or improves upon existing idea (s) towards the
addition of value and novelty in any given domain (Amabile, 1988; Eleni, Lidia,
& Pierre-Jean, 2014; Mehlika et al., 2014; Sternberg, 2006; 2012).

31
Expertise
Expertise is an underpinning factor for all creative labour. It is a required
quality for doing a specific task or solving a particular problem (Amabile, 1997).
Creativity Skills
Creativity skills relate to an extra effort of creative performance and may
include but not limited to a cognitive style which favours taking new viewpoints
on problems (Amabile, 1997).
Task Motivation
The intrinsic task motivation is the kind that is normally driven by deep
involvement and interest in work. Conversely, the extrinsic task motivation
relates to the desire to accomplish some goals which stands aloof from the defined
work in question (Amabile, 1997).
Organisational Culture
Refers to a pattern of shared plain assumptions learned by a group of
employees as they solve the issues of external adaptation as well as internal
integration, that has functioned sufficiently to be considered valid and, therefore
to be imparted to new employees as the accurate way to think, perceive and feel
in relation to those issues (Schein, 2010).

32
Adhocracy dimension
Adhocracy oriented culture dimension relates a dynamic, creative and
entrepreneurial place to work. It consists of employees who are basically risk
takers and are willing to commit towards creative risk initiatives (Cameron &
Quinn, 2006).
Clan dimension
The mirrors a responsive place where employees share a lot of values with
each other. They operate a family system and a relationship of best of friends
within the workplace.to implement employee creative initiatives (Cameron &
Quinn, 2006).
Market dimension
This dimension is known for its productive, competitive and directive
capabilities and focus. It consists of top management leaders that are usually
demanding and tough (Cameron & Quinn, 1999).
Hierarchy
The hierarchy culture dimension mirrors a formalized and structured work
system. In this dimension, there are already prescribed procedures and processes
governing the employee behaviour (Cameron & Quinn, 2006).

33
Trust
The willingness of an employee to be vulnerable to the activities or actions
of another employee, contingent upon the hope that the other will perform a
particular action significant to the trustor in such relationship and regardless of
the ability to monitor or control the other employee (Colquitt, Jeffery, Cindy, &
Eric, 2011; Mayer, Davis, & Schoorman, 1995).
Trustworthiness
This is an antecedent of trust which relates the employee’s ability,
benevolence and integrity upon which trust relationship can be built (Colquitt,
Brent, & Jeffery, 2007; Colquitt & Rodell, 2011; Mayer & Davis, 1999).
Ability
Ability is a dimension of trustworthiness which deals with a set of
competencies an organisational member may have within a certain domain. It
comprises of the group of skills, characteristics and competencies necessary for
top management to possess influence within certain domains (Mayer et al., 1995).
Benevolence
The degree at which a creative employee is believed to have and exhibit
good intentions is referred to as the benevolence (Mayer et al., 1995).

34
Integrity
This refers to the trustor’s awareness that a set of principles and values
which the same trustor finds acceptable is highly adhered to by the trustee (Mayer
et al., 1995).
1.8 Organisation of Research Structure
This study is divided into five chapters. This chapter identifies the
research problem by explaining the gap found in the current literature on
employee creativity, organisational culture and trustworthiness. It also provides
an overview of the basic research questions. The underpinning conceptual
foundations and theories such as the componential theory of individual creativity,
the competing values framework model, the model of organisational trust are thus
presented in Chapter 2.
In addition, Chapter 2 would also present a critical review of the various
literatures significantly related to this research work. This chapter would
therefore present an in-depth analysis and assessment of relevant past studies and
theoretical frameworks. Likewise, a justification of chosen theory and models
employed in this research would also be examined. Similarly, an overview of past
studies measurements of constructs, past studies research methodologies and data
analysis would also be evaluated. This is in order to subsequently obtain a critical
assessment of major organisational cultures, perceived trustworthiness concepts
and their relationships with employee creativity.

35
Chapter 3 would unveil an insight into the proposed conceptual
framework and the development of current research’s hypothesis. It would also
show the operation framework of current research, definition of current study’s
target population, current study’s research design, data elicitation of current study
and data analysis. This is to further reiterate the significance and uniqueness of
this research study with respect to the empirical methodologies and
measurements, for the purpose of effective and efficient data collection processes.
Chapter 4 would present the results of findings and discussions for this
research work. Also it would relate an empirical relationship, comparisons and
confirmation between the findings and the results of past studies accordingly.
Chapter 5 will relate a discussion the various findings of this study with
respect to their respective hypothesis.
Chapter 6 would relate a summary of this study, results, theoretical and
policy implications respectively. It would furthermore highlight certain
managerial implications, limitations and recommendations for future research.

36
CHAPTER TWO
LITERATURE REVIEW
2.1 Introduction
This chapter reviews the theories, models and basic concepts which are
tailored towards employee creativity as the focal foundation for this study. An
explanatory analysis on the impact of organisational culture on employee
creativity is also examined. This study also evaluates the direct effect of
trustworthiness on employee creativity and the moderating effect of
trustworthiness on the impact of organisational culture on employee creativity.
Likewise, relevant theories and conceptual underpinnings of organisational
culture, employee creativity, and trustworthiness have been evaluated in this
present study. The componential theory of individual creativity (Amabile, 1997)
has been employed to examine employee creativity. The organisational culture is
also analysed by evaluating the competing values framework of Cameron and
Quinn (2006). To examine top management leader’s trustworthiness, the
trustworthiness concept of Mayer et al. (1995) has also been employed. In this
study, several viewpoints regarding employee creativity concept are identified
(Rhodes, 1961; Mooney, 1963; Ryhammar & Brolin, 1999).
Employee creativity is evaluated from the lens of top management
leaders’ trustworthiness and organisational culture. There is already a wealth of

37
information from past studies on organisational culture (Cameron, 2008;
Hofstede, 2015). Likewise, there is a growing increase of the number of
trustworthiness related studies (Bing & Chenyan, 2015; Dagmara & Katarzyna,
2015). Studies have also focused on organisational creativity and innovation
(Birkinshaw & Mol, 2006; Ellen & Nico, 2002; Ghosh, 2015). However,
investigations reflecting employee creativity, from the lens of trustworthiness and
organisational culture has so far been understudied (Beth & Amabile, 2010;
Dollinger, Burke, & Gump, 2007; Gilson, 2008). In view of this study’s
objectives, organisational culture, trustworthiness and employee creativity would
be further examined from their respective theoretical and conceptual
undergirding.
2.2 Employee Creativity Theories
Employee creativity has been given considerable degree of attention over
the years (Eleni, Lidia, & Pierre-Jean, 2014; Gong, Huang, & Farh, 2009; Hope
& Godwin, 2015; Shalley & Gilson, 2004; Shalley, Zhou, & Oldham, 2004; Won-
Moo et al., 2016). With diverse discourse on employee creativity, several theories
have been propounded with each taking one or more of this present study’s
viewpoints. Theories such as Adaptation-Innovation theory or those of successful
intelligence which relate to mostly creative individuals tend to emphasize on
individual differences (Kirton, 1976; Sternberg, 1997; Sternberg, 2006).
Likewise, theories which focus on creative production tend to relate to creative
outputs. Moreover, theories such as the Geneplore model and creative cognition

38
which also study creative processes, centre more on internal variables (Ward,
Smith, & Finke, 1999). However, one of the major theories which consider
employee creativity from an employee level is the componential theory of
individual creativity (Amabile, 1997).
Other theories that highlight creativity from an employee level are
subsequently discussed. These theories are, the Investment Theory of creativity
by Sternberg and Lubart (1991; 1992), the Interactionist Theory of Creativity
(Woodman, Sawyer, & Griffin, 1993), and the Multiple Social Domains Theory
(Ford, 1996). These theories relate that while employees may have a
predisposition towards high creativity, factors within the organisation, such as
organisational culture could determine the impact at which employee creativity
may be engendered (Amabile, 1988; 1997; Ford, 1996; Sternberg & Lubart, 1991;
1992; Woodman et al., 1993).
2.2.1 The Componential Theory of Individual creativity
For several decades, early creativity researchers have focused on
the perception that creativity is initiated by mainly creative employees
(Hennessey & Amabile, 2010). This notion of a person centred approach seems
to have yielded some important findings. These are findings regarding individual
personality traits, backgrounds and even work styles of uniquely creative
employees (Amabile & Pillemer, 2012; Björkman, et al., 2013; Eleni et al., 2014;

39
Hennessey & Amabile, 2010). However, to further examine the attributes by
which one may truly qualify an employee to be creative, Amabile (1997)
propounded the componential theory of individual creativity. This theory
provides a thorough view into the employee creativity concept. Amabile (1997)
defined the concept of employee creativity as “…simply the production of novel,
appropriate ideas in any realm of human activity, from science, to the arts, to
education, to business, to everyday life” (p. 40).
This theory assumes that all employees from diverse domain, possess
normal capacities and are able to produce at least moderately creative work. Also
it stresses that the workforce environment can influence both the level and
frequency of employee creative behaviours disparately. This theory opines that
when employee’s skills overlap with their most potent intrinsic interests such as
their deepest passions; their respective creativity potential tends to be higher. The
higher the degree of the creativity commitments, the higher the level of employee
creativity as well. This theory consists of three core dimensions of employee
creativity. They are expertise, creativity skills and task motivation (Figure 2.1).
Each dimension is convenient for creativity in any particular domain (Amabile,
1988; 1997).
2.2.1.1 Expertise Dimension
According to Amabile (1997) expertise is an underpinning factor for all
creative labour. For doing a specific task or solving a particular problem. It is also

40
perceived as a set of cognitive pathways. This dimension is made up of three
different scopes of understandings. They are the memory for factual knowledge,
exceptional talents in the target work domain and the technical proficiency. These
scopes of understandings may range across various fields of knowledge such as
expertise in strategic management, computer simulation and even gene slicing
(Amabile & Pillemer, 2012).
2.2.1.2 Creativity Skills Dimension
On the other hand, Amabile (1997) posit that creativity skills which is also
identified as creative thinking skills, deals with an extra effort of creative
performance. Skills in this dimension may include but are not limited to a
cognitive style which favours taking new viewpoints on problems. Amabile
(1997) also stress that it involves the application of techniques for exploring new
cognitive pathways.

41
Source: Adapted from Amabile (1997) Componential Theory of
Individual Creativity
FIGURE 2. 1: The Componential Theory of Individual Creativity
Also it serves as a system of working which is favourable towards
persistence and the energetic hunt of ones’ work. Moreover, the degree at which
creativity skills may be improved is also contingent on a number of personal
factors (Amabile & Pillemer, 2012; Jan & Hazel, 2013; Jennifer & Donna, 2013).
Factors such as employee’s personal characteristics that relates to self-discipline,
freedom, mental and technical coordination towards risk taking. Likewise,
perseverance when faced with intense frustration, ambiguity tolerance as well as
a comparative absence of concern for social approval (Amabile & Pillemer, 2012;
Jan & Hazel, 2013; Jennifer & Donna, 2013; Sharifirad, 2016). Through learning
and practical initiatives, employee creativity skills could be increased to improve
intellectual flexibility and mental liberation.
CREATIVITY SKILLS
TASK MOTIVATION
EXPERTISE
CREATIVITY

42
2.2.1.3 Task Motivation Dimension
Similarly, the task motivation could be observed as either intrinsic or
extrinsic (Amabile, 1997; Sternberg & Lubart, 1992). Amabile (1997) opine that
the intrinsic task motivation is normally driven by deep involvement and interest
in work. The author argues that this is either by one or some factors such as
curiosity, a personal nous of challenge or even enjoyment. Conversely, the
extrinsic task motivation relates to the desire to accomplish some goals which
stands aloof from the defined work in question. These goals could be already
promised rewards, publicity or fame, wining a competition or maybe meeting a
deadline (Amabile, 1997; Amabile & Pillemer, 2012).
Although expertise and creativity skills determine an employee’s
capability in a given domain, task motivation however, relates what the employee
will actually do. This theory recount that within the first two dimensions, an
employee may rely on just expertise and creative thinking skills. Ndaliman et al.
(2015) relate that the task motivated employee engages in the service of a creative
process; the motivation for the immediate task determines the extent to which he
will effusively engage his expertise and also his creative thinking skills. The
componential theory of individual creativity also supports that a high level of
intrinsic motivation can in a way make up for a deficiency of both or either the
expertise or creative thinking skills (Amabile, 1988; Amabile, Hill, Hennessey,
& Tighe, 1994).

43
Similarly, “intrinsic motivation is conducive to creativity. Controlling
extrinsic motivation is detrimental to creativity, but informational or enabling
extrinsic motivation can be conducive, particularly if initial levels of intrinsic
motivation are high” (Amabile, 1997, p. 46). An employee who is highly
intrinsically motivated is likely to draw creative skills from other domains. Such
employee may also apply excessive efforts towards the acquisition of necessary
creative skills in the respective domain in order to engender creativity in a given
task (Amabile & Pillemer, 2012). This is with respect to the fact that despite the
domain; conceptual underpinnings of creativity “…involves the development of
a novel product, idea, or problem solution that is of value to the individual and/or
the larger social group” (Hennessey & Amabile, 2010, p. 572).
In view of further examination of employee creativity concept, other
creativity theories related to the contextual aims and objectives of this study are
subsequently highlighted.
2.2.2 The Interactionist Theory of Creativity
This theory is similar to the componential theory of individual creativity
(Amabile, 1997). Woodman et al. (1993) proposed an interactionist theoretical
approach, premised on the knowledge that employee creativity is an employee
level phenomenon. The authors accentuated that employee creativity can be
affected by both situational (contextual) and dispositional variables. The authors
defined the concept of creativity as “production of novel and useful outcomes by
44
people working together in complex organizational context” (Woodman et al.,
1993, p. 294). This theory is geared towards an outcome oriented view of
employee creativity. In this theoretical approach, employee creativity is also
predicted by the interaction of employees’ disposition and contextual factors as
well. It also clearly stressed the importance of the interface between the employee
and the situation. This is due to its theoretical roots of interactional psychology.
Sequel to this theoretical approach, the antecedent’s situation which this
theory acknowledges relate past reinforcement history and demographic variables
(Woodman et al., 1993). Creativity is a function of the individual, group and also
the organisational features which intermingle to facilitate or inhibit employee
creativity. Likewise, this theory suggests that creative employees, groups and
organisations are but contributors which transforms in some way by creative
processes and creative circumstances. These creative processes and creative
circumstances often consist of facilitators and inhibitors for creative initiatives.
However, the plausible outcome for the creative processes is a creative product
(Woodman et al., 1993).
Similar to the componential theory of individual creativity, this
interactionist approach does consider employee cognitive abilities as factor which
affects employee creativity. This resultant effect also influences the
organisational creativity through the group creativity level components. The
highlight of cognitive abilities in the individual level further supports Amabile’s
(1988) argument regarding employee creativity relevant skills and its importance

45
to the creativity concept. Woodman et al. (1993) also recognise that knowledge,
experience and learning have positive impact on creative outcome. Congruently,
in some circumstances previous experience or even knowledge may lead towards
a functional fixedness (Sharifirad, 2016). This however, inhibits employees from
producing creative results (Woodman et al., 1993).
Furthermore, unlike the componential theory of individual creativity this
theoretical approach does not consider specific impacts which the types of
organisational cultures (Cameron & Quinn, 1999) may have on employee
creativity. Likewise, even though it identifies the creativity of social systems, it
however does not describe employee creativity as an organisational (collective)
level undertaking. Moreover, Woodman et al. (1993) further point out that aspects
of the work environment such as the organisational culture also support or inhibit
employee creativity.
2.2.3 The Investment Theory of Creativity
The Investment theory is also related as an individual level phenomenon
which is proposed and collaborated by Sternberg and Lubart (1991). It stands out
as a confluence theory and opines that employee creativity is largely a decision
which employees have to make (Sternberg & Lubart, 1991; Sternberg, 2006). In
this Investment theory, the authors Sternberg and Lubart (1991) emphasize that
creativity is not secluded to a gifted few. Rather it is a choice any employee can
make if they are eager to invest the required effort and time into the creative

46
process. Moreover, choice in this regard is yet a large factor that occurs on
multiple strata. Therefore, not only must the employee invest in the creative
processes, but must also decide to employ these investments toward a creative
endeavour. It also considers creativity as a habit (Sternberg, 2012). Likewise, the
theory argues that behind all innovations there is always creativity. Thus even
creativity emerges from choice to perform a habit(s). As a confluence theory, it
stresses that employee creativity consists of creative employees “…who are
willing and able to buy low and sell high in the realm of ideas” (Sternberg, 2006,
p. 87).
Creative employees are like good investors who generate ideas which at
a certain time may be acknowledged as somewhat ridiculous or actually novel.
The Investment theory further points out that at the development stage of the
creative idea, the creative employee is metaphorically assumed to be “buying
low”. However, when the creative idea has gained some degree of acceptance the
creative employees “sell high” (Sternberg, 2006). The authors of this theory
posits that employees are not born creative or uncreative. Instead, the greatest
difficulty employee creativity continues to face are the restrictions employees
place on their own thinking. Consequently, the investment theory highlight that
employee creativity comprises of six aspects. They include intellectual skills,
knowledge, thinking styles, personality attributes, motivation, and environment.
They all reflect a system of creativity by choice (Sternberg & Lubart, 1991).

47
Sternberg’s (2006) investment theory of creativity, have certain similar
components which are also in Amabile (1997) componential theory of individual
creativity and Woodman et al. (1993) interactionist theory of creativity. These
components are centred on the intrinsic motivation, knowledge, cognitive
abilities and personality attributes. Although these components are sources of
employee differences, yet the decision to employ either of these components is a
more important source of individual differences. The theory relate that an
intellectual skill deals with new ways of problem identification. Consequently,
supporting employee creativity towards differentiating between bad and good
ideas. Thereby equipping employees with the skills to persuade others to follow
and value the creative ideas. Moreover, the employee would also require
investing enough research in a respective field of study in order to have a
thorough understanding of the necessary information. However, this theory does
not stress on the measurement and control of knowledge necessary for
engendering employee creativity under dissimilar organisational cultures (Gian,
Lee, & Mark, 2012; Sharifirad, 2016).
Conversely, too much knowledge may hinder the employee’s ability to
think in novel ways about an old subject matter (Afsar, 2016). Likewise, the
employee personality attributes are regularly influenced by different value
systems (Cameron & Quinn, 1999; Hofstede & McCrae, 2004; Schein, 2010)
which are not considered by this theory. These values may impact employees’
attitudes to exhibit certain trustworthiness traits which may either lead towards a
creative behaviour or not. Similarly, in the personality component, employee
creativity related traits may be the willingness to take sensible risks, overcome

48
obstacles, self-efficacy issues, defying the crowd, and a tolerance toward
ambiguity (Bradley et al., 2014; Dollinger et al., 2007; Mehlika et al., 2014; Pay
et al., 2015).
On the other hand, the investment theory is supportive of both the
componential theory of individual creativity (Amabile, 1997) and the
interactionist theory in the aspect of motivation (Woodman et al., 1993). This is
with respect to the author’s view that the employee must have to have a high level
of interest in a particular task at hand in order to express creativity and experience
intrinsic motivation (Sternberg, 2006; Amabile & Pillemer, 2012). Furthermore,
an organisational culture which is supportive and rewarding of creative ideas
seems to be very vital for the facilitation of employee creativity. Without a
supportive organisational culture which is one of the most important factors
impacting employee creativity, employees may never be encouraged to express
creativity (Meyer, 2014).
2.2.4 The Multiple Social Domains Theory of Creativity
Ford (1996) multiple social domains theory of employee creativity
stretches both the interactionist and the componential theories of creativity. This
theory posit that creative and habitual activities are in rivalry. Congruently,
individuals are more likely to abandon creative activities despite circumstances
favourable for employee creativity and as long as habitual activities are more

49
attractive. Within a behavioural context, employee creativity (whether creative or
habitual) results from joint influences of employee’s sense making capabilities,
motivation, knowledge and ability as well. These theoretical components such as
the sense making processes, stimulates intentions and anticipations concerning
the suitability and probable effectiveness of future activities. Similarly, the
motivation component is a function of goals, self-efficacy beliefs, emotions,
receptivity beliefs. However, knowledge and ability appears to be closely related
to the theoretical viewpoints of both the componential theory of individual
creativity, interactionist theory as well as the investment theory (Amabile, 1997;
Sternberg, 2006; Woodman et al., 1993).
Although creativity and habitual activities seem to be in rivalry, factors
which constrain one kind of creative activity do not essentially facilitate the other.
The theory proposes that in addition to describing the intentional individual
processes which most impact employee creativity; this theory of multiple social
domains also stipulates key levels of domains which influence employee
creativity within organisations. Therefore, the four domains which are considered
within this theory are the groups or subunits, organisations, institutional
environments and the markets. Each domain consists of a related field such as
work unit members, socialized organisational actors, the functional or
professional specialists as well as the consumers. This theory puts forward that
interested stakeholders’ interactions (i.e., fields), creative actors, accepted
wisdom (i.e., domains) and interactions within and among multiple levels of
fields and domains determine the viability of a creative act (Ford, 1996).

50
Likewise, the various fields and domains represent the context within
which the employee chooses to participate in habitual versus creative activities.
Moreover, facilitating or inhibiting factors may be found in each of these
domains. This theory however, does not emphasis on the component of
personality, to a similar degree as the interactionist and componential theory of
individual creativity. However, similar to the investment, interactionist and
componential theories of employee creativity, the multiple social domain theory
also stress the role of the employees’ motivation, knowledge and also ability.
Conversely, this theory reveals that one aspect which has not been acknowledged
by the interactionist and componential theories is the employees emotional state.
In disparity to the componential and interactionist theories, this theory posits that
motivation consists of a number of factors which are; the believe that an employee
is able to be creative, the set goals, the believe that employee creative behaviour
will be well received as compared to how habitual activities would be received.
In addition, another factor which is also considered is that of employees’
emotional state. Emotional state may be anxiety, anger, pleasure, boredom or
even interest (Ford, 1996). Furthermore, this theory postulates that an impact by
the manager on employee’s motivation is due to the influence of managers on
employee creativity. Although a major similarity between the investment,
interactionist, multiple social domains and even the componential theories of
individual creativity is their central highlight on intrinsic motivation (Amabile,
1997; Ford, 1996; Woodman et al., 1993).

51
On the other hand, theories reflecting the phenomenon of organisational
culture are subsequently considered.
2.3 Theories of Organizational Culture
This section centres on examining the various related theoretical
underpinnings by which the organisational culture construct may be critically
examined.
2.3.1 Cameron and Quinn (2006) Competing Values Frameworks (CVF)
The competing values framework (CVF) is established to be a supportive
framework for the assessment and profiling of dominant organisational cultures
(Cameron & Quinn, 2006). This is due to its usefulness in helping individuals
identify the underlying organisational culture dynamics existing within each
organisation. Cameron and Quinn (2006) relate that the CVF has been developed
since the early 1980’s in view of organisational effectiveness studies. Over the
years, it has been established to reflect leadership, information processing and
even structure (Cameron & Quinn, 2011). The CVF is made up of four
dimensions as illustrated in Figure 2.2. These are clan, adhocracy, market and
hierarchy organisational culture dimensions. Each of these dimensions mirror two
different scopes and pathways. The clan and hierarchy dimensions are structured
on internal focus and integration. Clan and adhocracy dimensions are also centred
on flexibility and discretion. The adhocracy and market dimensions mirror a

52
scope of external focus and differentiation. Likewise, the market and hierarchy
dimensions are rooted on stability and control (Figure 2.2).
Similarly, an organisation is effective if they have harmonious internal
features (Hamza et al., 2011). An organisation may also be effective should it
focus on an interrelating or conflicting perspective with other organisations
outside its boundaries (Aguirre, Post, & Hewlett, 2009). Organisational culture is
perceived as supportive towards employee creativity should they have a high
degree of flexibility, and trust. Likewise, organisations may grow to become very
effective on account of adaptation and flexibility towards employee creativity
(Barbara & Valerie, 2007; Carlos & Maria, 2014; Martins & Terblanche, 2003).
Cameron and Quinn (2006) also stressed that these dimensions further reflect the
values organisational members exhibit within them, respectively. This is in terms
of what they define as right, good and appropriate. Also the values relate how
creative ideas are generated, shared and implemented, or what existing human
needs may be fundamental. It also reflects what core values are employed for
establishing judgements and implementing creative performance related actions
(Adeel et al., 2006; Braun et al., 2013).

53
Flexibility and Discretion
Stability and Control
Source: Adapted from Cameron and Quinn (2006) Organizational
Culture Framework.
FIGURE 2. 2: The Competing Values Framework
Basically Cameron and Quinn (2011) argue that the CVF highlights
whether an organization has a predominant internal or external focus and whether
it fights for flexibility and individuality or stability and control as the case may
be. Cameron and Quinn (2006) have also engendered an "Organizational Culture
Assessment Instrument (OCAI)" which is employed to measure and ascertain the
organizational culture profile centred on the core values, and assumptions that
characterize organizations. Moreover, the four major dimensions that make up
the four quadrants will be subsequently highlighted.
Clan Oriented
A very personal place; like an extended family; Also
Mentoring; Nurturing and participation.
Adhocracy Oriented
Dynamic and entrepreneurial; Risk taking, Creativity and
innovation; Values and Entrepreneurship.
Hierarchically Oriented
Favours structure and control; Coordination and
efficiency; Stability is vital.
Market Oriented
Results oriented; getting the job done; Values
competion and achievement.
External
Focus and
Differentiation
Internal
Focus and
Integration

54
2.3.1.1 Adhocracy Organisational Culture Dimension
The Cameron and Quinn (2006) adhocracy oriented culture dimension
relates a dynamic, creative and entrepreneurial place to work. It consists of
employees who are basically risk takers and are willing to commit towards
creative risk initiatives. In this culture type, the drive to commit towards
experimentation and innovation is a major uniting force for the employees. This
is in view of an organization building a strong competitive edge (Heritage,
Pollock, & Roberts, 2014). Although the long term focus in this kind of culture
is also geared towards rapid growth and new resources acquisition (Cameron &
Quinn, 1999). Moreover, success for the adhocracy culture means employing the
concepts of employee creativity towards achieving unique and novel services or
products (Jan & Hazel, 2013; Jeevan & Sumeet, 2015). Thus this organizational
culture type strongly encourages freedom and employee creativity. It is
characterized by leaders who are innovators, visionaries and even entrepreneurs
(Cameron & Quinn, 2011). Its workforce consists of value drivers such as agility,
innovative outputs and transformation. Its rationale relates that innovativeness,
new resources, vision and creativity produces effectiveness (Jan & Hazel, 2013;
Jeevan & Sumeet, 2015). According to Cameron and Quinn (2006), this culture
type is further geared towards anticipating need, continuous improvement,
creation of new standards and finding creative solutions to problems.

55
2.3.1.2 Clan Organisational Culture Dimension
The clan culture which is in the upper left quadrant is characterized as a
responsive place to implement employee creative initiatives. Cameron and Quinn
(2006) posit that within this quadrant, employees share a lot of values with each
other. They operate a family system and a relationship of best of friends within
the workplace. Cameron (2008) argue that leaders are thought of as coaches,
mentors, and maybe even as parent figures respectively. Likewise, the art of
collaboration, tradition and loyalty seems to be a bonding force for organizations
in this quadrant. This may consequently foster employee commitment towards
high employee creativity. Moreover, emphases are subsequently laid on the long
term benefits of internal climate and for employees concern. Furthermore, the
organization might often place a premium on participation, teamwork and also
agreement. This quadrant is similar to the collectivism cultural dimensions
(Hofstede, 1980) and the individualistic quadrant of the grid-group cultural theory
(Douglas, 1970). This is in view of employee’s motivation to commit and
contribute towards the diffusion of creative ideas (Afsar, 2016; Amabile, 1997;
Mehlika et al., 2014).
2.3.1.3 Market Organisational Culture Dimension
The market oriented culture located in the lower right quadrant is a result
oriented place of work. Top management leaders in this quadrant are known for
their productive, competitive and directive capabilities and focus. Such top
management leaders are usually demanding and tough (Cameron & Quinn, 1999).

56
The organizational bond in this regard is based on an emphasis on winning. Also,
long term anxieties are characterized by competitive actions, targets and stretch
goals achievements. Likewise, success in this quadrant is defined in terms of
penetration and market share (Cameron & Quinn, 2011). Therefore, dominance
of success criteria for employee creativity initiatives are by this quadrant
contingent upon escalating share price, market leadership and Outpacing the
competition (Cameron, 2008; Beausaert, Segers, & Gijselaers, 2011).
2.3.1.4 Hierarchy Organisational Culture Dimension
The hierarchy culture dimension by Cameron and Quinn (2006) mirrors a
formalized and structured work system. In this dimension, there are already
prescribed procedures and processes governing the employee behaviour.
Cameron and Quinn (2011) espouse that this culture type is characterized
however by leaders as well who are coordinated, organized and efficient. Focus
within this quadrant is to maintain smooth running organizational processes.
Cameron (2008) further opine that the long term concerns in this culture type are
efficiency, stability and predictability. Also what binds the organization together
are its strict rules and policies (Hofstede & Michael, 2010). It may however, pose
as rigid rather than flexible culture dimension and further impede the processes
of employee creativity. Consequently, employee creativity tends to be adversely
inhibited due to a poor employee workplace freedom and the diffusion of creative
ideas becomes seemingly constrained (Afsar, 2016; Sharifirad, 2016)

57
In view of further examination of the organisational culture concept,
another organisational culture theory that is related to the contextual aims and
objectives of this study have been subsequently discussed.
2.3.2 Grid-group Cultural Theory
According to Douglas (1970), the Grid-group cultural theory is a four-
fold typology with causal claims. This typology is centred on two different
dimensions which are the group and the grid. It also forms the basis for the four
cultural types. Group which is the first dimension of the typology is generally
understood as the degree to which an employee is incorporated into confined
components. This theory relates that the choice for employee creativity becomes
highly subjected to group determination when the group dimension is higher. The
second dimension which is Grid is the extent to which the employee’s life is
bounded by prescriptions imposed by external factors. Similarly, life tends to
become less open to employee’s negotiation, the higher the grid dimension
(Kristel & Jeroen, 2014). Consequently, the grid-group typology offers a
classification of four cultural types. These are the hierarchy, egalitarianism,
individualism as well as fatalism (Douglas, 1970).
Kristel and Jeroen (2014) relate that the four types of grid-group
organisational cultures are generic in nature. This is in regards towards their
applicability to all cultural forms such as societies, clubs, churches, teams and
also organisations. Although this theory presents four types of organisational

58
cultures, these cultural types are extreme cases which are basically differentiated
on a theoretical level (Douglas, 1970). However, they are never present in the
empirical reality (Kristel & Jeroen, 2014). Therefore, a brief analysis of the
cultural types would be further addressed.
At the upper right quadrant of this cultural typology, the high group and
the high grid are represented as Hierarchy. Rules and prescriptions are prevalent
in this cultural type. They are therefore justified by the relevance of the whole,
over the parts, and the collective over the individuals. Likewise, for this culture
type, hierarchical authority is very crucial (Hofstede, 2015). This may either be
in the form of positions and roles. Similarly, they are centred on procedures and
rules (Cameron & Quinn, 2011). Douglas (1970) also support that status within
this quadrant is based on employees’ position in a defined group. This is in view
that in hierarchical organisations, the world is reflected as controllable. This thus
presents hierarchical cultures as vulnerable to misplaced trust within their rules,
expertise and authority (Barbara & Valerie, 2007; Ann-Marie et al., 2015).
Congruently the concept of employee creativity and diffusion of creative ideas
might be relatively constrained.
According to Douglas (1970), the egalitarian culture type is branded by a
mix of strong group boundaries, procedures and rules. There is usually an
intensive relationship between group members which helps to continually
preserve the group. The egalitarian culture is basically preserved through a strong
maintenance of barrier between non-members and members respectively. This

59
may lead to a system of distrust between members and non-members of a group
(Bing & Chenyan, 2015; Liu et al., 2016; Sharifirad, 2016). Although, the central
idea in this quadrant is that all employees are equal and operate a system of
collective decision making. This tends to promote employee creativity as it relates
to creative behaviours in which employees have freedom of choice regarding
what to do or what to be (Eleni et al., 2014). However, it may be further exposed
to impasses (Won-Moo et al., 2016).
The third cultural type is referred to individualism. Douglas (1970)
highlight that this cultural typology is branded by weak role prescriptions, group
incorporation as well as weak regulation. This cultural type relates a competitive
environment in which employees are after personal rewards. A basic trend which
could be found is that everything is up to negotiation as employee’s interactions
are based on exchange strategies. However, this cultural type is vulnerable for
lack of cooperation and egoism (Mary, 1970; Hofstede & Michael, 2010;
Hoskins, 2014; Hofstede, 2015). This is often due to employees acting on their
own benefit. Consequently, employees may rather follow profits in this cultural
type regardless of personal integrity or respect for law. This cultural type is
contrary to intrinsic task motivation (Amabile & Pillemer, 2012) as employees
become basically motivated extrinsically to commit towards employee creativity.
The fatalistic culture in the higher left quadrant is categorized by
compulsory instructions which are integrated with weak group incorporation
(Douglas, 1970). In contrast with the other three active cultural typologies, the

60
fatalistic culture is regarded as passive. This is in view that it consists of
employees who feel they are extremely bound by a system of rules (high grid).
These employees yet feel no connection to other employees in the organisation
(low group). Employees within this cultural typology may tend to feel very
suspicious towards each other due to future uncertainty (Kristel & Jeroen, 2014).
This theory relates a culture which lacks cooperation, promotes apathy and
widespread distrust (Bing & Chenyan, 2015; Sharifirad, 2016; Wenxing et al.,
2016). Thus employees might basically struggle to endure within this cultural
typology which is vulnerable to lethargy and unwillingness to plan ahead.
Consequently, the diffusion of creative ideas within this quadrant may be very
much prone to inhibition as a result of the organisational culture type (Shalley &
Gilson, 2004).
Accordingly, the conceptual underpinnings that reflects the phenomenon
of trustworthiness are subsequently considered.
2.4 Trustworthiness Theoretical Concept
This section also highlights major underpinnings of the trustworthiness
concept. It espouses the rational for utilising the concept of perceived
trustworthiness and further examines other theoretical undergirding that may be
employed to investigate the overall trustworthiness phenomenon.

61
2.4.1 An Integrative Model of Organisational Trust
Mayer et al. (1995) developed the integrative model of organisational
trust. This model has a broad application. It could be employed on an individual
or group level of the organisation. It could also be utilised across multiple
disciplines. Since its development in 1995, it has been applied in several
organisations centred research (Bradley et al., 2014; Colquitt, Brent, & Jeffery,
2007; Colquitt & Rodell, 2011; Mayer et al., 1995; Pay et al., 2015; Rebecca &
David, 2015). Thus, it has received various empirical supports. Mayer et al.
(1995) define trust as:
The willingness of a party to be vulnerable to the actions of
another party based on the expectation that the other will perform
a particular action important to the trustor, irrespective of the
ability to monitor or control that other party (p. 712).
Following from the definition, this model is made up of the characteristics
of the trustor. The characteristics of the trustee as well as the relationship between
trust and risk are also included in the model (McAllister, 1995). A trait of the
trustor that relates a propensity to trust is described as the expectation of an
individual as it relates to the trustworthiness of others (Pay et al., 2015). In this
case, employee’s propensity to trust may differ due to their diverse types of
nature, development experiences and even cultural upbringing. Consequently, the
degree to which a party would trust is often contingent on the influences of the
perceived trustworthiness of the other party (Colquitt et al., 2007). A stable factor
across various situations is the propensity to trust and it might assist in explaining
the variance in trust among organisational members. Figure 2.3, therefore relates

62
an integrative model of organisational trust. The degree of trust the manager or
employee can generate in order to foster employee creativity initiatives are
contingent on certain dimensions. Mayer et al. (1995) argued that part of the
model in Fig. 2.3 relate established dimensions of trustworthiness or trustee’s
features which are ability, benevolence and also integrity. These factors are the
perceptions concerning an employee or manager’s ability, benevolence and
integrity (Schoorman et al., 2007).
Source: Adapted from Mayer et al., (1995).
FIGURE 2. 3: Integrative Model of Organisational Trust
Trustworthiness
Ability
Benevolence
Integrity
Perceived Risk
Trust Risk taking in
Relationship Outcomes
Trustor’s
Propensity

63
2.4.1.1 Ability Dimension
Ability is a dimension of trustworthiness that deals with a set of
competencies an organisational member may have within a certain domain. In
this case top management leaders are thus, trusted to implement specific tasks in
an area that is best fitting to the abilities they may possess for that task (Pay et al.,
2015). Mayer et al. (1995) argued that ability comprises of the group of skills,
characteristics and competencies necessary for top management to possess
influence within certain domains. Ability relates to intellectual skills which deals
with new ways of problem identification (Sternberg, 2006). Ability is an extra
effort of creative behaviour (Amabile, 1997). Therefore, in the employee
creativity context, ability may include but is not limited to a cognitive style which
favours taking new viewpoints on problems (Amabile & Pillemer, 2012).
Moreover, Ann-Marie et al. (2015) further emphasize that it involves the
application of competencies and techniques for the purpose of exploring new
cognitive pathways.
2.4.1.2 Benevolence Dimension
The degree at which a creative employee is believed to have and exhibit
good intentions is referred to as the benevolence (Mayer et al., 1995). This is with
the view that the employee’s creative ideas are based on good ethics and noble
intentions (Braun et al., 2013). Jovana et al. (2014) opine that benevolence may
be defined as the trustee’s optimistic and positive orientation towards the trustor.
Also Mayer et al. (1995) assert that benevolence is the degree to which a trustee

64
is perceived to express goodness towards the trustor. The authors highlighted that
this is also exacted aside from any form of egocentric profit motive. Basically in
this dimension, it is understood that there is a specific attachment between the
trustee and the trustor. It tends to relate a high level of trust relationship. The kind
of relationship which exists between the mentor (trustee) and the protégé (trustor)
(Mayer et al., 1995; Schoorman et al., 2007).
2.4.1.3 Integrity Dimension
The third dimension is known as integrity. A major relationship between
trust and integrity is that it comprises of the trustor’s awareness that a set of
principles and values which the same trustor finds acceptable is highly adhered
to by the trustee (Mayer et al., 1995). Jovana et al. (2014) emphasized that the
trustee abides by a set of values for which the same trustee is accountable for
following through. In this dimension, perceptions regarding integrity is often
contingent upon an individual’s past actions and or credible reports. It is also
dependent on the perception that a creative employee has some sense of justice
and the degree to which the employee’s creative actions are congruent with his or
her words (Jovana et al., 2014; Mayer et al., 1995; Schoorman et al., 2007).
Furthermore, Mayer et al. (1995) opined that the judgement of the trustor
on the integrity and ability of the trustee tends to form rapidly. Nevertheless,
benevolence usually takes time to grow. It is thus important to note that all three
dimensions are theoretically distinct (Jovana et al., 2014). These three dimensions

65
of trustworthiness play important roles in determining the degree of trust
(Schoorman et al., 2007). This is in view that each respective trustworthiness
dimension is rather insufficient to cause trust except all three dimensions are
highly integrated (Pay et al., 2015). Therefore, all three dimensions must have to
be considered if and when making choices about trust (Jovana et al., 2014; Mayer
et al., 1995; Schoorman et al., 2007).
Mayer et al. (1995) espoused that the trustworthiness, moderated by the
trustor’s propensity to trust relates a willingness to trust. However, when trust is
established, the trustor and trustee are bound by a system of shared values
(Lipponen, Bardi, & Haapamaki, 2008) to initiate the risk of achieving a desired
outcome (Ann-Marie et al., 2015). These shared values are thus integrated values
expressed through the interpersonal trust relationship that exists and are reflected
in defined organisational cultures (Cameron, 2008; Carlos & Maria, 2014). Thus,
trustworthiness is that vital part of organisational members’ lives which
influences the relationship between the organisational culture and employee
creativity (Colquitt & Rodell, 2011; Rawlins, 2008; Shalley & Gilson, 2004).
Nevertheless, other concepts have been considered to reflect more
understanding of the trustworthiness phenomenon.

66
2.4.2 Affect-Based and Cognition-Based Trust Theory
McAllister (1995) who stressed that trust is a pervasive phenomenon that
drives the life and culture of an organisation has developed this theory. It enables
managers and their employees to commit and take risks towards employee
creativity (Philip et al., 2013). The affect-based and cognitive based trusts are
forms of trust as well as components of interpersonal trust. The cognitive-based
trust is that which relates a process whereby employees choose whom they will
trust, in which respects and under what conditions (McAllister, 1995). Such trust
is based on what is perceived by the employees as good reasons that constitutes
evidence of trustworthiness.
The degree of knowledge necessary for trust is just at a point between total
knowledge and total ignorance (Andreeva & Kianto, 2011; Gian, Lee, & Mark,
2012). Moreover, with total knowledge given then there may be no need to trust.
Although with total ignorance given as well, there would be no foundation to trust
rationally. However, the availability of good reasons and knowledge does serve
as grounds for trust decisions to be initiated because of acceptable degree of
trustworthiness (Jovana et al., 2015; McAllister, 1995). Several measures of trust
within the organisational settings propose that responsibility and competence,
dependability and reliability are central elements that reflect trustworthiness
(Jovana et al., 2014). These expectations must be met for trust to exist and grow
(Carvell & Paula, 2015). Conversely, evidence that stays contrary to this would
provide a rational basis for withholding trust.

67
On the other hand, the affect-based trust deals with the emotions of
employees. It is another foundation for trust, which consists of the emotional bond
between organisational members (McAllister, 1995). In this case, organisational
members make trust relationships relate to emotional investments. They express
sincere attention and concern for the welfare of their organisational colleagues.
Similarly, there is believe in the intrinsic features of such relationships and
believe that these feelings are shared. Eventually, the emotional ties binding the
employees could also provide the foundation for perceived trustworthiness of one
another. Consequently, Bing and Chenyan (2015) further point out that
organisation would grow with relationships that are built upon faith, reliability
and dependability, as they could be perceived to reflect consequences of
trustworthiness.
Research on affect-based and cognition-based trust in close interactions
highlights the development of interpersonal affect upon a cognitive base trust
(Jovana et al., 2014; McAllister, 1995). Similarly, cognitive-based trust or
reliableness may be viewed as a more superficial and less special form of trust
than that of emotional worthiness. Although, regarding top management working
relationships, some level of the cognition-based trust could also be vital for the
affect-based form of trust to develop. In this respect, top management leaders
ought to be perceived by employees as trustworthy before additional investments
in relationships can be initiated (McAllister, 1995). Confident attributions
however, may follow if there are some levels of cognition-based trust. This may

68
also be contingent upon an established track record of trustworthiness of top
management leaders.
Moreover, the affect-based trust is not perceived as a higher level of trust
since it ought to be viewed as a form of interpersonal trust (Tsung-Hsien, 2013).
It is clear that the decoupling of trust forms and reverse causation potentials may
increase as the affect-based trust develops. Although after a period of time,
attributed intentions are taken as stable and left undisputed, even though there is
a proof of disconfirming evidence (Tschannen-Moran & Hoy, 2000).
Consequently, offenses are often explained away or discounted. Consequently,
the development of a high level of trustworthiness engendered through affect-
based trust might lead to the disregarding of a foundation of cognition-based trust.
This is because at such point the cognition-based trust might no longer be
necessary (Rawlins, 2008).
2.5 Justification of Theoretical and Conceptual Underpinnings
A major focus and scope of this present study, is on an employee creativity
level rather than the organisational creativity level. This study seeks to examine
the impact of organisational culture on employee creativity in the Nigerian
manufacturing industry. This is in view of investigating the organisational culture
dimensions prevalent within the Nigerian manufacturing industry. Likewise, to
investigate what dimensions of organisational culture might be more supportive

69
to engender employee creativity. This study further investigates the moderating
effects of trustworthiness on the impact of organisational culture on employee
creativity.
To guide this study’s analysis, the researcher therefore draws on the
Componential Theory of Individual Creativity (an individual level phenomenon)
by Amabile (1997). This theory highlights that irrespective of employee domain
and time, employees possess natural capacity and are capable of producing at
least moderately creative efforts. It also stresses that the culture of an organisation
can influence both the levels and occurrences of employee creative behaviours
incongruently (Amabile et al., 1996). This theory asserts that when competencies
of employees overlap with their highest intrinsic interests, passions and
aspirations, their distinct potentials for creativity tends to increase.
Likewise, the higher the level of commitment towards creativity, the
higher the probability that employee creativity would increase. The componential
theory of individual creativity thus highlights a robust view through which
employee creativity may be examined and further engendered. It gives insight
into engendering effective generation of creative ideas that could consequently
foster employee creativity (Amabile & Mueller, 2008). In over a twelve-year
period and with over 12,000 distinct employees from 26 different companies;
Amabile (1997) proved the reliability and validity of the componential theory of
individual creativity dimensions. Although this was later initiated at an
organisational creativity level. The research instrument employed to examine
creativity at an organisational level is called KEYS. Nevertheless, in this study,

70
several measurement instruments would be employed to examine the construct of
employee creativity. This is because KEYS is utilised for assessing the climate
for creativity, different work environments, work outcomes of creativity and
productivity as well. Its application is beyond the scope of this study which
mainly espouses the nature of individual level creativity. It also does not examine
via empirical and statistical techniques, the creativity of respective employees.
Hence, it cannot be employed in this study to investigate the three dimensions of
employee creativity.
Still, the componential theory of individual creativity reflects much
insight into the concept of employee creativity. Therefore, examining this theory
in this study would aid in the assessment and identification of the nature of
employee creativity within the Nigerian manufacturing industry. It will aid to
examine how top management leaders may engender their employee creativity.
This is with respect to the application of the appropriate organisational culture
type that strongly supports employee creativity (Amabile & Pillemer, 2012;
Cameron & Quinn, 2011; Dollinger, Burke, & Gump, 2007).
Despite the increase of discourse on this theory and its highlight of the
creativity concept, very less consideration has been given towards the role
trustworthiness plays to engender employee creativity (Amabile & Mueller,
2008; Zhou & George, 2003). The role of trustworthiness in engendering
employee creativity has been very much overlooked in the employee creativity
paradigm (Bing & Chenyan, 2015; Heyns & Rothmann, 2015). It takes a certain

71
degree of managers’ trustworthiness perceptions of an employee, to get a manager
to commit sufficient resources (Amabile, 1997) towards an employees’ creative
ideas and creativity initiatives (Batovrina, 2016). A certain degree of
trustworthiness could also be needed to cause employees to decide on being
willing to share their creative ideas. As one of the implications for management,
Amabile (1997) strongly posit on the orientation of managers towards the
generation, communication, development and exchange of creative ideas. It is
therefore logical to highlight that the exchange of creative ideas may require an
already existing interpersonal relationship that is built upon high trustworthiness
perceptions (Gardner, Avolio, Luthans, May, & Walumbwa, 2005).
Pay, Balaji, and Kok (2015) espouse that trustworthiness is a major
bedrock on which interpersonal relationships involving trust can be built.
Trustworthiness is thus expedient to foster the fruition and diffusion of creative
ideas among employees (Ghosh, 2015; Liu et al., 2016). Employees that perceive
managers as not trustworthy enough or even untrustworthy, may not be willing
to exhibit certain creative behaviours. This may consequently limit the extent at
which employee creativity may be engendered within an organisation.
Nevertheless, Amabile et al. (1996) and Amabile and Mueller (2008) further
opine that employee creativity should reflect its highest degree when an
intrinsically motivated employee with high expertise and high creativity skills
exhibit creative behaviours within a highly supportive organisational culture.

72
Although, in the Componential Theory of Individual Creativity, Amabile
(1997) further identified the organisational culture as a major factor that could
either be a facilitator or an obstacle to employee creativity. The author further
opined that organisational culture has the capacity to influence employee’s
creative behaviours within the organisation. Similarly, this present study aims to
examine the organisational culture as a facilitator that may engender employee
creativity, rather than an impediment. Studies for example Ghahreman et al.
(2006), Karamipour et al. (2015) and Mobarakeh (2011) that have examined the
relationship between organisational culture and employee creativity have
highlighted that organisational culture is a rather strong facilitator of employee
creativity. Extant research such as Naranjo-Valencia, Sanz-Valle, and Jimenez-
Jimenez (2010) have also not given rigorous consideration towards examining all
the dimensions of organisational culture, and this limits probable in-depth
knowledge of what dimensions could really be supportive to engender employee
creativity.
To employ the right dimension of organisational culture is a critical
requirement for ensuring an effectively engendered employee creativity.
Cameron and Ettington (1988) opine that “the effectiveness of organizations is
more closely associated with the type of culture present than with the congruence
or the strength of that culture” (p. 385). Several manufacturing organisations
relate poor interpersonal relationships between top management leaders and
organisational members due to seemingly dominant and hierarchy organisational
culture dimensions (Cameron, 2008; Hofstede, 2015; Uwuigbe & Jimoh, 2012).

73
In Cameron and Quinn (2006) competing values framework model, the hierarchy
dimension favours structure and high control, efficiency and stability.
According to Hofstede and McCrae (2004) a dominant organisational
culture operated mostly across several Nigerian organisations is a high power
distance culture, and this culture type shares similar features with the hierarchy
dimension of the competing values framework. Thus it is difficult to engender
employee creativity as there is very little or no flexibility between employees and
top management leaders to commit elaborately towards employee creativity. The
prevalence of this cultural dimension does not favour risk taking and
entrepreneurship, creativity and innovation (Hofstede & Michael, 2010). It does
not promote employee freedom within the workplace and most of all inhibits trust
among employees and managers (Carlos & Maria, 2014).
Agnieszka and Dariusz (2016) opine that the organisational culture to a
large extent influences both the degree and occurrence of employee creative
behaviour. Hofstede and McCrae (2004) argued that the organisational culture is
the collective programming or instrument of the mind which distinguishes or
separates one individual or group of individuals from another. This central
differentiating factor is found in the multiplicity of diverse values shared between
top management leaders and their respective employees (Dollinger et al., 2007;
Lipponen et al., 2008). Hence, Martha et al. (2002) supported that organisational
culture is “the pattern of variations within a society, or, more specifically, as the
pattern of deep-level values and assumptions associated with societal
effectiveness, shared by an interacting group of people” (p. 276).

74
Therefore, the Cameron and Quinn (2006) competing values frameworks
would be employed in this study to analyse the organisational culture dimensions
that may be more supportive to engender employee creativity within the Nigerian
manufacturing industry. Additionally, this present study further stretches this
scope of mainly examining the various impacts of organisational culture
dimensions on employee creativity. It also examines the trustworthiness
moderating effect on the impacts of the organisational culture dimensions on
employee creativity. This is also because, a good number of studies have also
failed to consider the relationship between organisational culture and employee
creativity, from a trustworthiness perspective (Einsteine & Hwang, 2007; Gupta,
2011; Karamipour et al., 2015; Mobarakeh, 2011).
Therefore, the trustworthiness construct of Mayer et al. (1995), shall be
employed in this study. This is in view of accessing the integrity, ability, and
benevolence of top management leaders towards their employees and the manner
in which their trustworthiness is employed to engender employee creativity.
Organisational members with diverse developmental experiences, cultural
backgrounds and even personality types vary, regarding their propensity or
willingness to perceive another as trustworthy (Meyer et al., 1995). Employees
may be observed to repeatedly perceive top management leaders as trustworthy,
even in conditions that most employees, would approve do not warrant it (Bing
& Chenyan, 2015). Employees may also be unwilling to trust in most conditions
despite the circumstance that might support the propensity to perceive their top

75
management leaders as trustworthy. This may often leave employees in a
dilemma of not been able to really know whether to have a strong or weak
perception of top management leader’s trustworthiness. This is because, despite
the importance of trustworthiness and its role in aiding to engender employee
creativity; too high or too low trustworthiness might actually have a negative
effect on employee creativity (Carlos & Maria, 2014; Ogbeibu, Senadjki, & Luen
Peng, 2017).
2.6 Analysis of the Organisational Culture, Trustworthiness and Employee
Creativity Concepts
This section relates an analytic review of the relationship between
organisational culture and employee creativity. It also examines the concepts of
organisational culture and trustworthiness, as major factors that impact employee
creativity. It presents trustworthiness as a factor that could moderate the
relationship between organisational culture and employee creativity.
2.6.1 Organisational Culture
Schein (2010) advocated that the culture of an organisation mirrors:
A pattern of shared basic assumptions learned by a group as it
solved its problems of external adaptation and internal integration,
which has worked well enough to be considered valid and,
therefore, to be taught to new members as the correct way to
perceive, think, and feel in relation to those problems (p. 18).

76
Organisational culture is a group level phenomenon that seems to be
perceived in diverse ways based on its distinct definitions (Hofstede & McCrae,
2004; Nightingale, 2018). Thus, there is a growing debate surrounding the
phenomenon of organisational culture (Barbara & Valerie, 2007; Cameron, 2008;
Cameron & Quinn, 2011; Hamza et al., 2011; Hoskins, 2014; Hofstede, 2015).
This is often due to different levels or dimensions at which it manifests (Erthal &
Marques, 2018; Chang & Nadine, 2014). Schein (2010) stress that the formation
of organisation culture usually reflects its definition. Hence, in an organisational
culture, there may be a struggling towards integration and patterning, even though
in many groups, their exact history of experiences inhibits them from ever
realizing an explicit paradigm. The organisational culture consists of a defined
group of employees working in coherence towards a common purpose (Barbara
& Valerie, 2007).
Likewise, not much has been done regarding going beyond the descriptive
level of organisational culture, to recognize and analyse the processes involved
in organisational culture formation (Hofstede, 2015; Weerts, Vermeulen, &
Witjes, 2018). Moreover, the presence of diverse classifications makes it
challenging for the study to indicate the type of classificatory scheme which is
more appropriate to employ in an investigation (Schein, 2010). Studies relate a
lack of coherent views regarding the phenomenon of organisational culture
(Cameron & Quinn, 2011; Hoskins, 2014; Hofstede, 2015). Considerations given
towards organisational culture, mirror underlying principles which might explain

77
intersecting patterns of employee creative behaviours (Dollinger et al., 2007;
Wiener, Gattringer, & Strehl, 2017). Employee creative behaviours may often
highlight a specific dimension that subsequently describes the culture of an
organisation (Hamza et al., 2011; Kumar & Sharma, 2018).
However, despite an absence of confluence of several discourse of the
organisational culture concept, studies yet agree on the significant and pervasive
role of organisational culture on employee creativity (Amabile & Pillemer, 2012;
Amiri, Qayoumi, & soltani, 2014; Einsteine & Hwang, 2007; Karamipour et al.,
2015; Mobarakeh, 2011). Organisational culture ought to comprise of values and
features which are receptive to new ideas (Chang & Nadine, 2014; Rich, Rich, &
Hair, 2018). Also Oscar et al. (2014) opined that the organisational culture is one
in which clearly defined internal assumptions, values as well as management
initiatives foster the development of new ideas into products, processes, objects
and or services. Therefore, an effective integration of top management values and
employee values may subsequently help to engender employee creativity
(Wipulanusat, Panuwatwanich, & Stewart, 2018).
2.6.2 Employee Creativity
It is a cognitive process of an employee or team that incorporates the
development of a creative idea(s) concerning a product, service or process;
provides solution to a problem(s) or improves upon existing idea (s) towards the
addition of value and novelty in any given domain (Amabile, 1988; 2012; Eleni
et al., 2014; Mehlika et al., 2014; Sternberg, 2006). Employee creativity is a

78
cognitive process that is needed to expedite the effective and efficient
implementation of creative ideas (Alfred, Dean, & Chunhong, 2009). The concept
of creative ideas on the other hand, is argued to be a catalyst of employee
creativity (McIntyre, Hite, & Rickard, 2003; Mostafa, 2005).
Amabile and Pillemer (2012) opined that creative ideas and employee
creativity within organizations equates the permutation of commitment and
competence. Ruppe (2006) emphasise that the concept of employee creativity is
the sum of an individual’s innovative and cognitive capabilities. Moreover,
studies point out that employee creativity incorporates the development of a novel
product, solution to problem or creative idea which is unique and is of value to
respective individuals or group of individuals (Amabile & Pillemer, 2012;
Hennessey & Amabile, 2010; Sok, Sok, Danaher, & Danaher, 2018).
According to Vagn, Clausen, and Gish (2013) and Ogbeibu, Senadjki, and
Gaskin (2018), employee creativity relates a collection of creative ideas which
when effectively exploited, may lead towards innovation. Although Hennessey
and Amabile (2010) further stress that, the outcome of the creativity phenomenon
revolves between novelty and addition of value. However, the investment theory
of creativity posits that employee creativity could be related to creative
individuals who are willing to “buy low and sell high” in a world of ideas
(Sternberg, 2006, p. 87). Similarly, Parjanen (2012) further opine that “it is the
component that enhances the organizations’ ability to retain their competitive
advantage as well as to stay ahead of their competitors” (p. 109). Employee

79
creativity is primarily concerned with the generation of new or fresh ideas by
organisational employees (Nisula & Kianto, 2018). Ghosh (2015) also assert that
it is the process of applying these new ideas to produce something useful,
innovative and new. Nevertheless, the strength of the diffusion of creative ideas
might often be contingent upon the degree of integrated values of organisational
members and thus, the defined organisational culture (Mehlika et al., 2014).
2.6.3 The Relationship between Organisational Culture and Employee
Creativity
The organisational culture has been known to influence the perceptions,
values and behaviours of employees (Jan & Hazel, 2013). Hofstede and McCrae
(2004) reported in their definition of organisational culture that it consists of
collective attributes. It is not directly discernible except it is revealed through
various value systems in employee creative behaviours and attitudes (Dollinger
et al., 2007; Lipponen et al., 2008). An effective and efficient integration of
employee’s values with that of the organisational culture may thus, help to
facilitate the diffusion of creative ideas (Jackson, Morgan, & Laws, 2018;
Mehlika et al., 2014). According to Christina and Lucy (2004), strong
organisational cultures can act as drivers by which creative ideas of employees
are employed towards organisation’s survival and creative excellence.
Hofstede (2015) assert that the organisational culture deals with
transferable and shared perceptions, practices and notions. These may be
expressed and perceived from the integration of top management leader’s values

80
and those of employees (Jan & Hazel, 2013). In addition, Anugamini and Rajib
(2016) support the necessity of shared values for the sustenance of employee
creativity. Values in this context may be regarded as ideas and objects which have
a special implication on an employee level as well as organizational level (Lotars
& Barbars, 2010). Likewise, Dollinger et al. (2007) point out that organizational
culture values refer to the ideologies which underlie forms of norms and
behaviours. Recall that, Martins and Terblanche (2003) further defined
organisational culture as “the deeply seated (often subconscious) values and
beliefs shared by personnel in an organisation” (p. 65). These values relate certain
beliefs which are perceived as assumptions over time and consequently expressed
in the attitudes and behaviours of employees (Schein, 2010). Martins and
Terblanche (2003) further emphasized that the constituents of routine norms,
philosophies, behaviours and values all form part of organisational culture.
Therefore, an effective integration of values often leads to a strong union
between the organisational culture and the employee creativity (Dollinger et al.,
2007). This is in view that values which facilitate employee creativity usually
manifest themselves in particular behavioural forms. These behavioural forms
may either promote or inhibit employee creativity (Martins & Terblanche, 2003).
Values may prove as fundamental and enduring characteristics which relate
individual preferences and the work environment characteristics (Ellen & Nico,
2002). Employees who possess similar values to those of the organisational
culture tend to interrelate more efficiently towards creativity related initiatives. A
successful integration of employee value systems with that of the organisational
culture tends to highly facilitate employee creativity (Mehlika et al., 2014).

81
Likewise, value systems vary with regards to various creative employees
(Amabile & Pillemer, 2012; Dollinger et al., 2007). Highly creative employees
may hold different value systems compared to their less creative colleagues. It is
therefore, debated that a strong sense of novelty may be a function of the
integrated values held by highly creative employees (Dollinger et al., 2007). This
might be in view of what they desire or prefer. Nevertheless, the relationship
between organisational culture and employee creativity still remains a
controversial issue.
Kaufman and Baer (2004) have espoused a negative relationship between
organisational culture and employee creativity. Findings from another study of
Karamipour, Mehraban, and Jahani (2015) yet highlight a positive impact of
organisational culture on employee creativity. In an empirical study of a total of
175 respondents, including managers and experts of the Khuzestan Physical
Education Organization; Mobarakeh (2011) reported that there is significant
relation between organisational culture and employee creativity. Likewise,
Ghahreman, Tondnevis, Amirtash and Kadivar (2006) also argued that the power
component of the organisational culture, change adaptability and goal
achievement reflect a linear relationship with the criterion variable. The authors
also report that they are eligible for projecting creativity. The power
organisational culture is relatively similar to the heirarchy oriented organisational
culture as they share similar charateristics (Cameron & Quinn, 2006).

82
Also Mobarakeh (2011) posited that power (heirarchy) oriented
organisational culture relate a positive linear relationship with creativity.
However, no significant relationship has been highlighted between organisational
culture components with creativity. Likewise, Yazdi (2007) reported no
significant relationship between the organisational culture indicators and
creativity. In an empirical study of 40 experts in education administrations located
in the Guilan provincial cities of Iran, Hemmatinezhad et al. (2012) found that
there is no significant relationship between organisational culture and creativity.
Contrary to these findings, Einsteine and Hwang (2007) advocate a
significant positive relationship existing between the organisational culture
dimensions and creativity. In their study, it has been highlighted that open
communications factor also exerts more effect on creativity. Likewise, in another
empirical study of 234 employees of the Ministry of Culture and Islamic
Guidance: Amiri, Qayoumi, and Soltani (2014) highlight that there is a positive
and significant relationship between the organisational culture and creativity.
Equally, in a questionnaire survey of a total of 128 lower and middle level
executives from various departments of 6 organisations in India, Gupta (2011)
further pointed out that the future oriented and innovation organisational culture
does have a positive impact on creativity. Results of Karamipour et al. (2015)
shows that in their study of 355 employees from 12 companies in Iran, there is a
significant impact of organisational culture on employee creativity.

83
The discourse of organisational culture and employee creativity
relationship is yet a growing paradox and this is becoming a cross national issue
(Mobarakeh, 2011). The growing controversies endemic within the paradigms of
the organisational culture and employee creativity, suggests the controversies are
yet systematically unanswered. A reason for this dissension could be due to
results obtained from the investigations of diverse organisational culture impacts
on employee creativity across distinct contexts. The diverse impacts could also
be the result of homogeneous and heterogeneous clusters within defined
organisational cultures. In organisational cultures, employees whose values are
fully integrated with the culture of the organisation tend to form homogeneous
groups and cultures. The Attraction-selection-attrition theory by Schneider
(1987) proposed that often values and personality represent homogeneity in
personal characteristics. Such homogeneity occurs over time in an organisation.
Subsequently employees may become attracted to and selected by organisations
affiliated to them. On the other hand, creative employees whose values are not
aligned with that of the organisational culture may tend to leave.
Nevertheless, employees become more familiar with each other as their
values get more similar (Agnieszka & Dariusz, 2016). Over time a homogeneous
organisational culture could be created. Homogeneous employee groups are
usually socially integrated and tend to have fewer communication issues, lower
turn-over rates and even less conflict (Schneider, 1987). Although in this case,
employees may very well be inhibited from thinking divergently and exhibiting
strong creative behaviours (Hennessey & Amabile, 2010). On the other hand,
studies maintain that heterogeneous groups outperform homogeneous groups in

84
creativity related initiatives as a greater variety of creative ideas, perspectives and
methods towards employee creativity are made available (Afsar, 2016; Aguirre
et al., 2009; Gilson, 2008; Ghosh, 2015; Hope & Godwin, 2015). Although,
creative ideas are only easily accessible when respective values are effectively
integrated (Liu et al., 2016). Hence, the more effective the integrated values of
top management leaders and their employees become; the higher the chances of
commitment towards employee creativity (Mehlika et al., 2014; Meyer, 2014;
Owoyemi & Ekwoaba, 2014).
The degree of effectiveness of integrated values relates the extent to which
respective values are accepted and internalized by organisational members within
a defined organisational culture (Lotars & Barbars, 2010). Over time, values tend
to get more effective and subsequently become entrenched into the core basic
underlying assumptions of the employees. This causes the fusion of a binding
impact between the organisational culture and organisational members (Lipponen
et al., 2008; Schein, 2010). This could further engender effective commitment of
organisational members towards the engendering of employee creativity (Jan &
Hazel, 2013; Liu et al., 2016; Mehlika et al., 2014; Won-Moo et al., 2016).
An effectively integrated value system may also facilitate the taking of
risks related to creativity initiatives under a supportive organisational culture.
This is due to the fact that values are beliefs (Martins & Terblanche, 2003) which
might be engendered towards desirable outcomes or creative behaviours (Jan &
Hazel, 2013). Subsequently, they tend to transcend specific conditions, guide

85
selections and evaluations of creative actions (Dollinger et al., 2007; Lipponen et
al., 2008). According to Hofstede (1991), values are viewed as often unconscious
broad feelings which are not easily discussable. They reflect that which is good
and evil, dirty and clean, normal or abnormal, ugly or even beautiful, logical or
paradoxical and natural or unnatural. Moreover, Dollinger et al. (2007) stressed
that even though studies have addressed the relationship between the
organisational culture and employee creativity, its link remains unclear due to
mixing results of empirical studies. Another major part of this issue is as a result
of lack of a commonly agreed definition and model of organisational culture and
its relationship towards employee creativity (Amabile & Pillemer, 2012;
Cameron & Quinn, 1999, 2011; Hennessey & Amabile, 2010; Hofstede &
McCrae, 2004; Hofstede & Michael, 2010; Hofstede, 2015). Therefore, stern
doubts yet exists regarding the relationship between organisational cultures and
employee creativity (Kaufman & Baer, 2004).
2.6.4 Trustworthiness and Employee Creativity
According to Pay et al. (2015), literature on trust recognizes the concept
of trustworthiness as a critical component of social and interpersonal interaction,
although, its definition and measurement are yet to be consistent. This is because
the concept of trustworthiness is complex in that it is clustered with issues
surrounding its definition and measurement (Carlos & Maria, 2014). Likewise,
studies conducted over 50 years ago relate several trustworthiness dimensions
which creates a pattern in regards to trustworthiness definitions and
measurements (Rawlins, 2008). Nevertheless, the concept of trustworthiness yet

86
proves to be imperative for the effective diffusion of creative ideas (Carlos &
Maria, 2014). Trustworthiness is necessary for the continuous development and
maintenance of interpersonal relationships between the manager and the
employee (Tsung-Hsien, 2013). It is an indispensable element of satisfactory
relationship which reassures the manager about increasing commitment towards
employee creativity (Philip, James, Anthony, Ceasar, & Gerald, 2013).
Trustworthiness plays several roles. Even in positively impacting the
organisational culture by facilitating transparency and openness in
communication between organisational members (Martins & Terblanche, 2003).
Studies argue that trustworthiness could be characterized by integrity, just
personality and fairness, dependability, reliability, and competence (Colquitt &
Rodell, 2011; Liu et al., 2016). Similarly, trustworthiness makes it less difficult
for an employee to commit willingly and sincerely towards self-openness. For
this to occur in most cases, the employee must have been able to prove an
acceptable degree of integrity, dependability, reliability, honesty, commitment
and acts of goodwill (Morrow et al., 2004). Although, through cognitive
submission processes the employee may become vulnerable and dependent on the
choices of another employee (Bing & Chenyan, 2015).
Correspondingly, the effect of trustworthiness in interpersonal trust
relationships is a key instrument of organizational co-ordination and control
(Anastasia, 2015). This is in view that it facilitates employee commitment to
engage in employee creativity initiatives. Employee creativity initiatives in this
regard could be a program tailored towards the effective and efficient diffusion

87
of creative ideas within the organisation (Bing & Chenyan, 2015; Parjanen,
2012). Upasna (2014) also support that employee creativity involves the risk of
employee participation in decision making processes, thus mistakes are
inevitable. In this context, managers express a great degree of trust on their
employees, when they perceive their employees are trustworthy to make effective
decisions. This could often be the outcome when perceived trustworthiness levels
of organisational members are high. Another probable outcome could be an
experience of employees’ freedom of action as well as employees trusting their
managers towards engagement and support in employee creativity initiatives
(Fabian et al., 2014).
Likewise, for managers to delegate employee creativity tasks, employees
could be required to possess and exhibit adequate level of integrity, benevolence
and ability since the same delegation often involves risk for employees (Braun et
al., 2013). Studies report that better performing organisations with high employee
creativity usually have effective cultures of strong trustworthiness perceptions of
its respective organisational members (Biswas & Varma, 2012; Chang & Nadine,
2014; Hoskins, 2014; Peter, Brian, & Rob, 2015; Upasna, 2014). However, this
is on the rationale that the operating organisational culture fits thoroughly and
flexibly into the workforce environment (Hu & Cui, 2012).
Congruently, in light of engendering employee creativity; employees may
often experience anxiety as much as they put themselves in vulnerable positions
which involves the diffusion of their creative ideas. It is reasonable therefore, to

88
thoroughly evaluate the trustee on possessing certain qualities of trustworthiness
(Jovana, Jean, & Priva, 2014). Trustworthiness is perceived as an antecedent of
trust outcome which describes the features of a trustworthy employee or manager.
Likewise, trustworthiness reflects a perception of one employee or manager,
relating that another employee or manager would meet commitments, be honest,
open and take no advantage of others (Ann-Marie et al., 2015).
2.6.5 The Moderating Effect of Trustworthiness
Engendering employee creativity may be contingent upon a number of
factors (Afsar, 2016; Agnieszka & Dariusz, 2016; Bing & Chenyan, 2015). Two
of these factors are the organisational culture and employee perceived
trustworthiness (Carlos & Maria, 2014; Chang & Nadine, 2014; Rebecca &
David, 2015). The organisational culture consists of a web of integrated values
(Kyvik, Zhang, & Romero-Martinez, 2012; Lotars & Barbars, 2010). These
values could be expressed and observed in a system of interpersonal trust
relationships between organisational members. Conversely, the strength or
weakness of integrated values is also contingent upon the degree of employee
perceived trustworthiness of respective organisational members (Bradely et al.,
2014; Cameron & Quinn, 2011; Dollinger et al., 2007; Lipponen et a., 2008;
Ronald, Kaspar, & Michele, 2016). Therefore, perceived trustworthiness in this
study relate the degree at which an employee is willing to become vulnerable to
another based on an evaluated and acceptable degree of trustworthiness
dimensions (Colquitt & Rodell, 2011; Pay et al., 2015). Likewise, being
vulnerable in this regard could relate to an employee being willing to align set

89
values with that of another, under the impact of a defined organisational culture
(Fabian et al., 2014; Rebecca & David, 2015).
Schoorman et al. (2007) stressed that employee trustworthiness is
characterised by the employee’s ability, benevolence and integrity in a defined
domain. These trustworthiness dimensions influence the employee’s capability to
be considered trustworthy (Mayer et al., 1995). Managers may not commit
towards the exchange or allow the alignment and integration of set values if
employee’s trustworthiness is in question (Fabian et al., 2014). In this case,
employee creativity might experience a gross decline in growth. It could be worse
in organisations where employee creativity is not adequately supported by a
culture that promotes strong trustworthiness perceptions of one another.
Organisational culture may be as vital to employee creativity as employee
creativity might be as well to the organisational culture (James, 2008; Jan &
Hazel, 2013). The organisational culture and employee creativity are both
separate constructs connected by distinct value systems (Dollinger et al., 2007;
Ronald et al., 2016).
A process which engenders effectiveness of integrated values between
these two constructs is the exchange of creative ideas and trust expectations
(Mehlika et al., 2014). Colquitt and Rodell (2011) opined that trust reflects an
exchange of values between the trustor and the trustee. This mirrors a process that
consists of an employee being willing to exchange his or her creative ideas based
on an accepted degree of trustworthiness the other employee exhibits (Tsung-
Hsien, 2013). In this case, effective interpersonal relationship may be created

90
when the trustworthy employee receives an initial anticipated offer (Carlos &
Maria, 2014). Over time, values become effectively aligned. Trustworthiness
perceptions of the trustor and the trustee becomes confirmed as exchange
relationships are established (Lipponen, Bardi, & Haapamaki, 2008). Exchange
in this context, is observed in the relationship between the manager and the
employee or among overall organisational members (Hakan & Jamel, 2013). In
this regard, it is important to note that values shared over time can also be
sustained by a strong and supportive organisational culture. Hence, there is a
chance that creative ideas exchanged could aid to engender employee creativity
(Sawyer, 2006).
However, the relationship between the organisational culture and
employee creativity may lose its strength when there is an absence of strong
trustworthiness perception among organisational members. A strong
trustworthiness perception could help to foster efficient communication processes
between the managers and employees. It facilitates an effective and efficient
diffusion of creative ideas among organisational members (Vagn et al., 2013).
This is in view that employees engage in creative ideas exchange towards a
collective or respective expected outcome. Creative ideas are also often generated
when existing knowledge infused from organisational culture impact, are shared
through interpersonal trust relationships (Shuchih, Anne, & Sungmin, 2015). In
this regard, employees are willing to take the risk of becoming vulnerable due to
strong perceived trustworthiness of each other. Over time, employees willingly
commit towards creativity as their values become more aligned and integrated
(Dollinger et al., 2007; Ronald et al., 2016).

91
Conversely, an organisational culture influenced by a system of distrust
tends to adversely inhibit the diffusion of creative ideas necessary to engender
employee creativity (Po-Ling & Cheng-Yuan, 2014). This may consequently lead
to poor employee creativity within the organisation. Employing an unsupportive
organisational culture towards employee creativity may very well increase the
levels of distrust (Liu et al., 2016). This further makes it more difficult for the
exchange of creative ideas, alignment and integration of set values (Bing &
Chenyan, 2015; Christina & Lucy, 2004; Dollinger et al., 2007; Ronald et al.,
2016).
2.7 Overview of Relevant Past Studies
This section reviews the relevant past studies, their research
methodologies and conceptual underpinnings related to organisational culture
and employee creativity relationships. It also recounts the concept of
trustworthiness effect on organisational culture and employee creativity.
2.7.1 Past Studies Relating the Impact of Organisational Culture on
Employee Creativity
Ellen and Nico (2002) points out that trust relationships play a role in
influencing employee support towards change and the probability of effective
employee creativity. In a questionnaire survey of 188 employees from a service-

92
orientated organisation, Ellen and Nico (2002) opine that trust impacts the level
to which creativity and innovation are encouraged and upheld. Liu et al., (2016)
argued that trust relationships subsequently determines the strength of creative
initiatives to facilitate the diffusion of creative ideas. Similarly, McLean (2005)
espouse in a qualitative research finding of organisational culture’s influence on
creativity and innovation, that regular generating of creative ideas and using its
innovative process to realize potential value of those ideas are vital for
organisations survival. Creative ideas are also important for the organisation to
sustain the strength of the type of operationalized organisational culture as well
(Afsar, 2016).
Regarding stimulants and obstacles of employee creativity, Martins and
Terblanche (2003) presented a descriptive study of managerial sciences literature
used to describe the organisational culture influence on creativity. In their
findings, values, norms and beliefs play a role in employee creativity. They can
either support or inhibit employee creativity based on their influence on
respective employee behaviour. The study also identifies a relationship between
the organisational culture and creativity. The study further emphasized on the
impact of organisational culture on employee creativity. This impact may be
contingent on the relationships observable in the behavioural routines of
employees. These behaviours seem to be engendered by the attitudes and belief
systems of organisational members which enables the creation of assumptions
(Schein 2010). Likewise, these assumptions are further expressed in the
respective or collective values exhibited by organisational members towards
employee creativity (Martins & Terblanche, 2003).

93
However, the study of Martins and Terblanche (2003) centred on
creativity from an organisational level context and not on an employee level
context. The study lacks a deductive investigation which may otherwise have
been used to further ascertain and examine its validity and reliability (Burns &
Bush, 2010). This is in view that Martins and Terblanche’s (2003) qualitative
study may have been biased in that it employs a subjective description (Trochim,
2006) and study of managerial sciences literature used to describe the impacts
and relationships between organisational culture and creativity phenomena
(Martins & Terblanche, 2003). Consequently, there is therefore the need for an
objective study approach which relate to a deductive methodology. This is in view
to further provide results which are based on statistical techniques and empirical
evidences (Pathirage, Amaratunga, & Haigh, 2008). Nevertheless, this study also
agrees with Martins and Terblanche (2003) that creativity has a vital role to play
in the process of organisational survival. Martins and Terblanche (2003) also
point out that very few empirical studies and especially quantitative studies have
been carried out to support the results of researchers within this study’s
framework.
Mostafa (2005) carried out a study on 170 managers from different banks,
major hospitality firms and industrial companies. The author found that risk
aversion is one of the major creativity barriers. Likewise, rigid rules are found to
be inversely related to creativity and innovation. A major finding of this study is
that, risk aversion is a primary creativity barrier in the Egyptian business
organizations (Mostafa, 2005). This is in view that managers appear to be
generally averse in their attitudes towards engaging in risk related initiatives.

94
Colquitt and Rodell (2011) argue that an optimum level of trustworthiness is often
required for an employee or manager to risk partaking in any creative behaviour.
The study of Mostafa (2005) focus on managers’ perceptions and attitudes
towards creativity. Although less consideration is given as to whether managers
express negative attitudes or have the wrong perceptions towards engaging in
creativity related risks initiatives due to poor trust relationships (Upasna, 2014).
The manager’s propensity to trust and the employees’ trustworthiness are parts of
the underpinning determinants of occurrence of the employee creativity concept
(Colquitt et al., 2011; Dagmara & Katarzyna, 2015; Liu et al., 2016). Similarly,
an effective and appropriate organisational culture is the type which actively
encourages the wide-view and employee risk taking is also necessary. According
to Sharifirad (2016) the way mistakes are addressed within the workforce is a
strong determinant as to whether employees would exhibit creative behaviours or
not. Mostafa (2005) further argue that an efficient tolerance of mistakes is a vital
element which promotes creativity. Also an effective organisational culture
would be required to promote positive values which relate that mistakes made
during creativity initiatives are learning processes that can result in novel ideas
(Lipponen et al., 2008; Meyer, 2014; Mehlika et al., 2014). An effective and
appropriate organisational culture could be necessary to facilitate the
achievement of high employee creativity.
Moreover, an organisational culture which operates a system of rigid rules
is perceived as a coercive organisational culture (Mostafa, 2005; Wallach, 1983).

95
Mostafa (2005) stressed that the prevalence of the coercive style of` management
is endemic as a common phenomenon in Egypt. Accordingly, a coercive
organisational culture inhibits employee creativity through its system of tight
control and frequent expectations of immediate compliance and obedience from
employees. Employees in this regard, may be forced to use their creativity to work
against autocratic managers (Mostafa, 2005; Liu et al., 2016). Moreover,
Naranjo-Valencia et al. (2010) further claim that there is often a high degree of
negative energy growing within the work climate of a coercive or hierarchical
organisational culture.
Cameron and Quinn (1999), Hofstede and McCrae (2004), Hofstede and
Michael (2010) and Wallach (1983) share similar views as to the concept of
hierarchical organisational culture dimension. According to Hofstede and
McCrae (2004), the predominant culture type of organisations in Nigeria is that
of the power distance which is quite similar to Cameron and Quinn’s (1999)
hierarchy organisational culture. Although in Nigeria, this notion cannot be
completely generalizable across other organisations as only one major
organisation was examined by Hofstede and McCrae (2004).
It also important to note that the investigation of Hofstede and McCrae
(2004) was basically initiated across national culture types. Conversely, Mostafa
(2005) examined a more narrowed path which relate the managers-employees’
perceptions and attitudes towards creativity. Although, Mostafa (2005)
highlighted the importance of the manager employing a strong organisational
culture which supports and commits towards employee creativity, the study was

96
conducted in Egypt. This may also be a limiting factor of the study's
generalizability as organizational cultures may differ from one firm to the other
and across national boundaries as well (Hoskins, 2014).
Another study that stressed on stimulants of employee creativity is that of
Yuri (2011). The main finding of this study was that the workplace does stimulate
creativity but in an indirect way. Employee creativity may be stimulated through
the experience of freedom, control of one’s work and job security. Similarly,
employee creativity could also be inhibited by the workplace through certain
factors such as noise, lack of space and maybe high temperatures. Yuri (2011)
went on to argue that relationships observed between the workplace and
employee creativity are not limited to freedom, security and control over one's
creative behaviour. These relationships are also perceived as values which
actively support employee creativity (Martins & Terblanche, 2003).
Subsequently, these values become similar to the kind which is experienced in an
adhocracy organizational culture dimension (Cameron & Quinn, 2011). The
competing values framework relate similar values through parts of its culture
dimensions which actively supports employee creativity (Cameron & Quinn,
1999). The Yuri (2011) study focus mainly on the employee physical workplace
as a stimulant of creativity. Hence, the workplace relates a much less robust scope
of the employee creativity stimulants (Amabile & Pillemer, 2012).
According to Yuri (2011) the physical workplace does not directly impact
employee creativity. It rather seems to be mediated by certain values such as
employee freedom, control, security, flexibility, and cooperative teamwork

97
(Martins & Terblanche, 2003; Yuri, 2011). Therefore, these values relate an
adhocracy oriented organisational culture dimension which was not considered
in the study of Yuri (2011). The author’s findings may be much robust if the
employee's physical workplace was considered as a subset of the much broader
adhocracy culture dimension (Cameron & Quinn, 2011). Conversely, Yuri (2011)
opine that pleasant environment can engender a creative culture that is informal
yet collaborative. This emphasis may depict a culture type that expresses values
similar to values shared in a family. Thus, this also highlights the clan oriented
culture type as stressed by Cameron and Quinn (1999). This is also in view of the
relationships experienced as values, through which the workplace stimulates
employee creativity (Dollinger et al., 2007; Martins & Terblanche, 2003).
An in-depth study into the organisational culture types might aid to further
identify across just the workplace construct, diverse operationalized
organisational culture types which stimulates or inhibits employee creativity
(Barbara & Valerie, 2007; Beth & Amabile, 2010). This is in view that the
physical workplace relates core values which are similar to values that may be
observed in the adhocracy and or clan organisational culture dimensions
(Cameron & Quinn, 2011; Martins & Terblanche, 2003; Won-Moo et al., 2016;
Yuri, 2011). Consequently, Cameron and Quinn’s (1999) CVF is employed in
this study to further understand and examine the organisational culture
dimensions which may not only support but also facilitate high employee
creativity in an organisation.
By employing the resource-based view theoretical approach, Eleni et al.
(2014) conducted a study involving an analysis of three case studies, secondary

98
sources and 24 interviews in highly service-innovative European research and
technology organisations. The study of Eleni et al. (2014) report seven different
capabilities propositions for reinforcing creativity in service innovation. These
seven capabilities are the abilities to attract employees who are creative by nature,
a stimulating creative environment, combination of diverse inputs, provision of
relevant resources, breeding of creative ideas, opening up to external influences
and the acceptance of risk, criticism and failure. In the ability to attract employees
who are creative by nature, the phrase creative by nature, seems to lack a broader
consideration in terms of empirical qualification and measurement (Amabile &
Pillemer, 2012). As a finding of the study, it gives no consideration to such
understanding of qualifying employees who are creative by nature. This raises the
challenge of qualifying and measuring the nature of creativity of employees
(Amabile, 1988). Moreover, Amabile’s (1997) componential theory of individual
creativity highlight three major components of the creative employee. These
components relate the employee’s intrinsic task motivation, creative thinking
styles and expertise. These three components aid to further qualify the nature of
employee creativity (Amabile & Pillemer, 2012; Hennessey & Amabile, 2010;
Mostafa, 2005).
The study of Eleni et al. (2014) has an inherent flaw which could
potentially narrow its applicability. This is in view of its qualitative findings for
reinforcing creativity in service innovation. Eleni et al. (2014) also further
acknowledge the fact that the first step to any innovation requires creativity as all
innovations originates from creative ideas. Evan et al. (2015) argue that there may
be no potential for innovation without creativity. However, Ghosh (2015) stress

99
that achieving high employee creativity is often contingent on an effective
organisational culture. This is in view that the organisational culture has an
impact on employee creativity (Amabile & Pillemer, 2012; Chang & Nadine,
2014; Eleni et al., 2014). Consequently, by integrating the perspectives of
organisational culture impact, this study is focused on further examining the
strategies for achieving high employee creativity in the organisation.
Moreover, James (2008) argue that another factor which fosters employee
creativity is intrinsic motivation. It is the key driver of employee creativity which
also drives organizational learning and transformation. Also organisational
management may play a vital role in facilitating employee intrinsic motivation
towards high employee creativity. Although it is vital to note that coercive
management actions tend to negatively influence employee creativity (James,
2008). In an interview of 52 scientists, Vishal and Shailendra (2012) espouse that
management behaviours significantly impact employee creativity. Consequently,
the concept of employee creativity should never be overlooked by managers but
rather given adequate creative support. In an emphasis of the vital roles of
managers Jennifer and Donna (2013) highlight that creative managers help to
influence employee creativity in situations where employee’s creativity-relevant
skills are minimal. Moreover, in a mixed method study consisting a survey of 201
employees, 2 focus groups of 18 development department staff, and interviews
with 46 employees working in innovation management roles, Jan and Hazel
(2013) further argue that a number of factors influences employee creativity.
These factors are organisational culture, leadership and work environment

100
conditions. This is also in terms of refining knowledge creation processes related
to creativity and nurturing innovation accordingly.
Employing the appropriate organisational culture type could also be
expedient for the effective diffusion of creative ideas. The diffusion of creative
ideas involves a number of factors such as teamwork, participation and consensus
(Hennessey & Amabile, 2010). Likewise, in a survey of 50 students, Barbara and
Valerie (2007) reveal that the clan organisational culture type is both current and
preferred in terms of creative activities involving teamwork, participation and
consensus. Moreover, Owoyemi and Ekwoaba (2014) also opine that the
organisational culture can influence both management and employees. Barbara
and Valerie (2007) further highlight that organisational culture can staff
relationships in terms of closure of mind, restriction, reduction of autonomy or
provision of direction. In view of management and employees’ relationships,
Mehlika et al. (2014) relate an exchange of values systems between employees
and the organisational culture.
A survey of 96 employees from 13 different industries, relate that
congruence between employee values and organisational culture values in
conformity, positively affect employee creativity. Also according to Ghosh
(2015) there are significant relationships existing between employee creativity,
creativity climate and workplace innovation orientation respectively. Afsar
(2016) claim that positive link exists between person-organisation-fit and
innovative work-behaviour. These connections further relate how an

101
organisation’s culture reveals a significant relationship with employee creativity.
Moreover, Chang and Nadine (2014) further argue that the type of organisational
culture also influences the perceived need for creativity and innovation.
Naqshbandi and Kamel (2017) investigated organisational culture and
open innovation relationship, utilizing 270 obtained questionnaires from middle
and top level managers from banking, public services, telecommunication and the
airline industries in the United Arab Emirates. The authors found that highly
integrative organisational cultures relate positively to open innovation, as
opposed to the negative relationship of hierarchy organisational cultures to open
innovation. However, their approach of analysis of organisational culture raises
some issues of endogeneity (Antonakis, 2017). Only two dimensions of
organisational culture were espoused in the development of the hypothesis as
compared to the assessment of five distinct dimensions of organisational culture
employed in the measures of the study. This could also lead the reader to belief
organisational cultures are mainly limited to just integrative and hierarchy
dimensions. Likewise, it raises the question of how one can actually classify what
organisational cultures are integrative and those that are not.
Similarly, Al-Tit (2017) espoused on the effects of organisational culture
on organisational performance. Data was obtained from employees and managers
in 93 manufacturing firms in Jordan. The author found that organisational culture
was a significant predictor of organisationa performance. Despite the author’s
impressive effort in highlighting several organisational culture dimensions in the

102
review of the literature, only two dimensions were employed to examine the
complex phenomenon of organisational culture (Naranjo-Valencia et al., 2016).
This, again raises the same endoginiety issues.
Studies by Barbara and Valerie (2007), Lotars and Barbars (2010) and
Naranjo-Valencia et al. (2010) have considered employing the organisational
culture assessment instrument (OCAI) (Cameron & Quinn, 1999); in order to
efficiently measure the appropriate organisational culture type which may
effectively support employee creativity. Barbara and Valerie (2007) identify the
clan oriented culture as current and preferred organisational culture type in terms
of creative activities involving teamwork, participation and consensus. Moreover,
Naranjo-Valencia et al. (2010) argued that the adhocracy oriented culture type
can enhance creativity towards new products and or services development. In
their findings, the hierarchical oriented cultures inhibit creativity and innovation.
Conversely, Lotars and Barbars (2010) highlight that hierarchical and market
(Cameron & Quinn, 2011), or bureaucratic organizational culture dimension
(Wallach, 1983) are dominant organisational culture types which are considered
effective to promote competitiveness. However, Naranjo-Valencia et al. (2010)
supported that the organizational culture is a key element that enhances or inhibits
creativity and innovation. Employing the appropriate culture type is vital. In this
context, the use of OCAI would aid this study to critically assess and identify the
appropriate organisational culture types relevant for engendering employee
creativity. Therefore, this study aims to further investigate the impact of
organisational culture dimensions on employee creativity. It is also focused on

103
examining the ways organisational culture impacts employee creativity from the
perspective of the Nigerian manufacturing industry.
2.7.2 Relevant Past Studies Reflecting the Trustworthiness, Organisational
Culture and Employee Creativity Concepts
The trustworthiness phenomenon is a complex concept that is clustered
with issues surrounding its definition, measurement and conceptualization
(Carlos & Maria, 2014; Rebecca & David, 2015). According to Mayer et al.
(1995), trustworthiness concept is also a major determinant of employee
interpersonal relationship. Moreover, for an interpersonal relationship to occur or
grow, the trustee may have to exhibit an acceptable measure of perceived
trustworthiness towards the trustor. Consequently, the perceived trustworthiness
relates a bedrock on which interpersonal trust relationships may be built. Another
scope of trustworthiness that seems to have raised several arguments is in its
relationship to the concepts of organisational culture and or employee creativity
(Bradley et al., 2014; Jan & Hazel, 2013).
Ann-Marie et al. (2015) argue that a relationship between the
organisational culture and employee creativity is contingent upon the
organisational culture typology influenced by interpersonal trust relationships.
Similarly, the trustworthiness concept is a vital factor that plays a major role in
impacting the degree at which an organisation may achieve high employee
creativity (Bing & Chenyan, 2015; Rebecca & David, 2015). In this regard,

104
Carvell and Paula (2015) claim that trust is a vital variable that should be
considered to further improve and exploit the process and significance of the
organisational impact on employee creativity. In a survey of 370 employees in
organisations from services and industry economic sectors, Dagmara and
Katarzyna (2015) support that organisational trust acts as an intermediary factor
between organisational culture and employee creativity concept. Although
discrepancies in their underpinning relationships continue to grow, Asfar (2016)
maintain that future studies can improve the conceptual foundations of
interpersonal trust relationships experienced between organisational members.
This is also includes the concepts of organisational culture and of employee
creativity.
Equally, a survey of 496 employees from 10 different organisations by
Gian et al. (2012) relate that the role of organisational culture in developing the
trust concepts between employees requires further investigations. Such
investigation may be engendered towards a positive impact of trustworthiness on
the diffusion of creative ideas. The authors also argue that the organisational
culture is a vital and sensitive part of the organisations life. It may either facilitate
or inhibit both interpersonal trust among employees and therefore have a negative
impact on the diffusion of creative ideas. Similarly, Vathsala and Ruvini, (2012)
espouse on the importance of interpersonal trust. The authors also argue that a
high interpersonal trust relationship between organisational members may
certainly foster the diffusion of creative ideas.

105
An effective diffusion of creative ideas among organisational members
could certainly lead towards a high employee creativity (Javed, Rawwas,
Khandal, Shahid, & Tayyeb, 2018; Ogbeibu, Senadjki, & Tan, 2018). A major
result from a survey of 150 software developers reveal that the diffusion of
creative ideas is significantly and positively influenced by interpersonal trust and
rewards (Vathsala & Ruvini, 2012). Therefore, the trust concept could appear to
be a key factor that strengthens the bond between organisational members within
a strong and adequate organisational culture. Congruently, the trustee’s ability to
create a trusting relationship impacts the degree at which the trustor will express
willingness to trust and exhibit trust behaviours.
According to Dagmara and Katarzyna (2015), to improve trust at both the
individual and organisational levels, an organisation would have to consider
building employee trust features. A major feature to consider while building trust
is the trustworthiness of organisational members (Colquitt et al., 2011; Meriggi
& Bulte, 2018). Employees’ trustworthiness perceptions are a vital determinant
of trust behaviours. In order to establish interpersonal trust relationships between
the trustee and trustor, the trustee’s trustworthiness has to also be put into
consideration (Ho, Kaarst-Brown, & Benbasat, 2018; Shuchih et al., 2015).
Colquitt et al. (2007) also espouse the vitality of employee trustworthiness. This
is in view that trustworthiness components predict affective commitment which
has distinctive relationships with the results of trust influence. In Mayer and
James (1999), the trustworthiness components influence the relationship between
perceptions of employees’ appraisal systems of trust. This process could foster

106
commitment towards employee creativity effectiveness in both teams and groups
(Holmes & Parker, 2018).
The study of Rebecca and David (2015) is another study which highlight
the core effects of trustworthiness. The study relates a survey of 86 mergers and
acquisitions implementation processes. The study had been carried out in the
United States of America, between 1995 and 2002. The study examines how tacit
knowledge impacts implementation success in mergers and acquisitions. It also
contrasts this with explicit knowledge. A major finding of this study is that tacit
routine compatibility further supports the differential moderating roles of
trustworthiness (Rebecca & David, 2015). Similarly, the study emphasize that
trustworthiness facilitates successful knowledge transfer in mergers and
acquisitions. In this study, the moderating effect of trustworthiness on the
relationship between organisational culture and employee creativity is examined.
Moreover, Rebecca & David (2015) espouse that tacit knowledge presents a
greater value to organisations. Nevertheless, it is more difficult to transfer
internally since it is not exactly easily codified. Similarly, when knowledge
transfer is impeded, it becomes increasingly challenging for the diffusion of
creative ideas within the organisation (Ajay & Ana, 2015; Carlos & Maria, 2014).
Afsar (2016) emphasize that ineffective trustworthiness level between
organisational members relate a major challenge of transferring and diffusing
creative ideas. The study of Rebecca and David (2015) support this current
research framework. This is in view that the substance of a creative idea may be
perceived as the function of knowledge gained (Afsar, 2016; Ajay & Ana, 2015;

107
Carlos & Maria, 2014). Christina and Lucy (2004) stress on the art of acquiring
knowledge as a cognitive process that might involve the exploitation of creative
ideas. Yuri (2011) also argue that creative ideas are prerequisites for creativity.
Contrary to this, knowledge and creative ideas may be perceived as functions of
elements which impacts the cognitive processes that results in creativity (Afsar,
2016; Ajay & Ana, 2015; Carlos & Maria, 2014; Hope & Godwin, 2015; James,
2008; Kaufman et al., 2010; Magadley & Birdi, 2006; Vagn et al., 2013).
A creative idea in its original form of conception may be viewed from the
lens of tacit knowledge (Mehlika et al., 2014; Rebecca & David, 2015). Basically,
creative ideas refer to discovery of value adding insights by which an employee
relates clever ways of facilitating creativity in any given initiative; usually
through a mix of cognitive processes (emotions, intuitions, experiences and
memories) to produce creative results (Afsar, 2016; Ajay & Ana, 2015; Carlos &
Maria, 2014; Hope & Godwin, 2015; James, 2008; Kaufman et al., 2010;
Magadley & Birdi, 2006; Vagn et al., 2013). Consequently, creative ideas that
tend to engender employee creativity are often rather challenging to codify and
diffuse among organizational employees (Liu et al., 2016; Sharifirad, 2016).
Moreover, trustworthiness is one major factor which facilitates the
diffusion of creative ideas among organizational members (Bradley, Yongjian, &
Satyanarayana, 2014; Rebecca & David, 2015; Sharifirad, 2016). Adequate
trustworthiness levels can positively influence employee’s decisions and
commitments towards relating creative ideas to another employee or the manager

108
(Li, Laurence, & Blume, 2018). This is in view that trustworthiness breaches the
walls impeding an employee’s capabilities of perceiving the manager as
trustworthy to actively impact upon employee creativity (Liu et al., 2016;
Rebecca & David, 2015; Sharifirad, 2016).
In view of the moderating impact of trustworthiness, Ronald et al. (2016)
argue that trustworthiness plays a vital role in facilitating effective interpersonal
communication. This relates a process that involves the exchange of creative
ideas as well as promoting transparency of employee-shared values. Ghosh
(2015) support by arguing that the conception of creative ideas is often because
of knowledge gained. In this case, employees can be confident that creative ideas
would not be misused and motives for creative ideas diffusion would include the
best interest of organisational members (Rebecca & David, 2015).
Over time these shared values which relate employee commitment
towards the diffusion of creative ideas may gravitate towards becoming
behavioural norms; subsequently promoting employee creativity (Millar, Peters,
& Millar, 2018; Ronald et al., 2016). However, Jan and Hazel (2013) postulate
that the strength of behavioural norms also greatly depends on the operationalised
organisational culture. Although, due to the complexity of the creativity concept
(Parjanen, 2012; Sternberg, 2012), in that it is subtle, more nuanced and often less
articulable, it may be therefore vital to operate an organisational culture which
actively supports the freedom of information sharing. Evan et al. (2015) further
highlight that the employee creativity initiatives may often require frequent

109
interactions and face-to-face contacts between organisational members. This
might help to build employee shared assumptions, which could frequently
promote the diffusion of creative ideas. Therefore, a supposition in this regard
may be that the higher the level of trustworthiness among organisational
members, the higher the diffusion of creative ideas (Afsar, 2016; Ajay & Ana,
2015; Carlos & Maria, 2014; Hope & Godwin, 2015; James, 2008; Kaufman et
al., 2010; Magadley & Birdi, 2006; Vagn et al., 2013).
The Bradley et al. (2014) study of 249 employees of 11 Mainland Chinese
organisations within China, also highlight the positive role of trustworthiness in
organisations within the Chinese culture. The study examines the effects which
trustworthiness can have on the perception of organizational politics as well as
organizational outcomes. It also focuses on trustworthiness components as a
moderator that could decrease the negative effects of organisational politics on
organisational outcomes. Findings of the study relate trustworthiness as a factor
that moderates the negative effect of organisational politics on job satisfaction,
normative and affective commitment. This study can be related to the moderating
effect of trustworthiness on the relationship between various organisational
culture dimensions and employee creativity that this study seeks to examine.
However, Bradley et al. (2014) have only examined the collectivist or clan
(Cameron & Quinn, 1999; Hofstede & Michael, 2010) culture dimension. This
may have narrowly highlighted and presented a less holistic analysis of the
positive role of trustworthiness in organisations within the Chinese culture. This

110
is also in view that no consideration is given towards other forms of Chinese
cultures through which contribution of knowledge may be added to the
organisational culture literatures. In Bradley et al. (2014) study, the
trustworthiness components of (Meyer et al., 1995) are employed as moderators
of the negative effect of organisational politics on job satisfaction, normative and
affective commitment. The job satisfaction, normative and affective commitment
are related as organisational outcomes accordingly. In this current study, the
Meyer et al. (1995) perceived trustworthiness factor is also employed as a
moderating variable. This is in view of examining the trustworthiness effect on
the relationship between organisational culture and employee creativity.
Trustworthiness helps to foster a positive interpersonal relationship
between the manager and the employee (Bradley et al., 2014; Rebecca & David,
2015). Bradley et al. (2014) argue that despite the anticipated organisational or
employee outcome, trustworthiness seems to be a fundamental prerequisite for
trust to occur. Trustworthiness is necessary for determining and influencing
employee creative behaviours (Bing & Chenyan, 2015; Rebecca & David, 2015).
Consequently, Bradley et al. (2014) study is therefore also in congruence with
this current research study. This is in view that it employs the perceived
trustworthiness factor to determine how each trustworthiness component can
impact the relationship between the dependent and the independent variables.
Sequel to this, Mayer and James (1999) stressed that the employee perception of
the manager as having competent ability, relates to some degree of assurance to
the employee that the manager is able to assist efficiently towards achieving high
employee creativity.

111
Pay et al. (2015) highlight that care and concerns can positively influence
employees’ perception of the managers’ benevolent personality. This usually
have a positive effect on employee intrinsic motivation towards high employee
creativity (Amabile, 1997). Conversely, managers who exhibit high integrity
levels often help to increase employee confidence in them (Joe, 2014). This is
also in view that shared values would continue to be maintained between the
employer and the manager (Lipponen et al., 2008). Employees tend to commit
more towards creative behaviours when they are assured of the managers’
reliability in upholding shared values (Dollinger et al., 2007; Hennessey &
Amabile, 2010). Consequently, trustworthiness seems to play a vital role in
interpreting the manager-employee interpersonal relationships.
The study of Ronald et al. (2016) recount the role of trustworthiness in
interpersonal relationships. The authors present a view of trustworthiness in
cooperative relationships. Through questionnaires distribution and structured
interviews with entrepreneurs and lead-investors, Ronald et al. (2016) did
conduct a study of 79 emerging biotechnology firms. The biotech companies had
been drawn from biopharmaceutical or “red” biotech clusters which are in
Germany, France and Canada. Overall aim of the study had been to evaluate value
co-creations in an entrepreneurial network of developing biotechnology
companies. Likewise, to further evaluate the relative impacts of the level of
interpersonal attraction, strength of the relational norms as well as the degree of
partner trustworthiness. Findings of the study tend to state that partner
trustworthiness is critical for the co-creation of value in both the financial and
scientific partnerships. It has been further noted that trustworthiness mediates the

112
association between interpersonal attraction and co-created value (Ronald et al.,
2016). Also in scientific partnerships, the strength of relational norms contributes
to partner trustworthiness which subsequently affects value co-creation (Ronald
et al., 2016).
Interestingly, much of trust related literature tend not to systematically
differentiate between trust and trustworthiness concepts (Bradley et al., 2014; Joe,
2014; Pay et al., 2015; Ronald et al., 2016). According to Ronald et al. (2016), a
socially embedded, strong tie, cooperative relationships and trust among
organisational members based on relational norms which have been mutually
accepted also leads to increased performance. The authors emphasize that
cooperative relationships build trust and commitments. However, contrary to this
perception; cooperative relationships require trust for even commitments to be
expressed towards engagements in cooperative relationships (Bradley et al.,
2014; Joe, 2014; Pay et al., 2015; Ronald et al., 2016). Moreover, trust as a major
influencing factor is further impacted by trustworthiness perceptions (Rebecca &
David, 2015). Trustworthiness is that precursor variable which determines the
possible occurrence of potential trust outcomes or commitments towards
interpersonal or cooperative relationships (Barend & Victor, 2015; Joe, 2014).
Although, the concept of trust has been treated as a moderator, independent and
dependent variable, its complexity necessitates theory and methodology to
explore its many levels and facets. Conversely, in this study trustworthiness is
therefore employed as a moderating variable that influences the relationship
between organisational culture and employee creativity.

113
Philip et al. (2013) argue that to achieve employee creativity
effectiveness, cohesion and satisfaction might have to be considered. Hossein and
Amir (2014) opined that trust relationship levels increases when the
organisational culture supports employee interpersonal relationships. Similarly,
the authors argue that an effective interpersonal trust system relates the obtaining
of necessary information which is relevant to make more informed creativity
centred decisions. Mayer and James (1999) also supported that the concept of
trust is basically influenced by its antecedents which are trustworthiness and trust
propensity. Similarly, Carlos and Maria (2014) further highlighted trust
propensity as a moderating factor influencing the relationship between a
knowledge centred organisational culture and knowledge sharing. Conversely,
Jovana et al. (2014) argue that trustworthiness is a bedrock upon which trust is
built. It precedes the propensity to trust as it relates to employee interpersonal
trust behaviours (Colquitt et al., 2007; Colquitt et al., 2011; Mayer and James,
1999; Mayer et al., 1995). This study therefore focuses on the employees’
perceived trustworthiness as an antecedent upon which trust relationship may be
established between organisational members. Its emphases are also on examining
the trustees’ capabilities to be trusted by the trustor. The Mayer et al. (1995)
integrated organisational trust model would be employed in this study to further
comprehend the effect of trustworthiness on the relationship between
organisational culture and employee creativity.

114
2.8 Theoretical Framework
The section presents the proposed theoretical framework for this study.
Knowledge of this theoretical framework has been derived from the literature
review which describes the theoretical and conceptual underpinnings relating to
the effects of trustworthiness and organisational culture on employee creativity.
Basically this study addresses five research questions in the Nigerian
manufacturing industry context.
The study employs a newly considered approach of examining and
integrating the theoretical and conceptual underpinnings of organisational culture
(the competing values framework), trustworthiness (the integrated model of
organisational trust) and employee creativity (the componential theory of
individual creativity). It seeks to examine the impact of trustworthiness as a
moderating variable on the impact of organisational culture on employee
creativity. The proposed theoretical framework of this study therefore highlights
a multidimensional model for engendering employee creativity.
Previous studies that have examined the effects of organisational culture
on employee creativity have often considered it from a descriptive level of
analysis (Chang & Nadine, 2014; Jan & Hazel, 2013). Several proxies of the
constructs found in this study’s theoretical framework, that have been employed
in extant literature reflect issues of endogeneity (Hogan & Coote, 2014; Naranjo-
Valencia et al., 2010, 2011). This is due to incomplete assessment of all related

115
dimensions of the organisational culture constructs under study (Antonakis,
Bendahan, Jacquart, & Lalive, 2010). Similarly, past related studies have tried to
also address parts of the theoretical underpinnings of this study by examining
their general relationships with proxies such as culture, knowledge, trust
propensity or just creativity respectively (Afsar, 2016; Ann-Marie et al., 2015;
Carlos & Maria, 2014; Hennessey & Amabile, 2010). In view of the increasing
number of related literature, this study attempts to simultaneously examine the
direct, and moderating effects of trustworthiness on the impact of organisational
culture on employee creativity. Therefore, the proposed theoretical framework
for this study is highlighted in Figure 2.4.
FIGURE 2. 4: Proposed Theoretical Framework

116
Apart from the employee creativity construct, the distinct latent constructs
(organisational culture, trustworthiness) are conceptualised as multidimensional
constructs. Constructs are regularly conceptualized and then operationalized as
multidimensional phenomena (Diamantopoulos et al., 2008). Law, Wong, and
Mobley (1998) advocated that a construct is thus espoused;
When it consists of a number of interrelated attributes or
dimensions and exists in multidimensional domains. In contrast to
a set of interrelated unidimensional constructs, the dimensions of
a multidimensional construct can be conceptualized under an
overall abstraction, and it is theoretically meaningful and
parsimonious to use this overall abstraction as a representation of
the dimensions (p. 741).
As a prime drive of this study, the four dimensions of organisational
culture are examined distinctively to assess their direct effects on employee
creativity. In order to further investigate beyond the scope of related studies, the
three dimensions of trustworthiness are thus examined to analyse their distinctive
moderating effects on the impact of organisational culture on employee creativity.
Studies have examined the impact of organisational culture on employee
creativity (Amiri et al., 2014; Einsteine & Hwang, 2007; Ghahreman, Tondnevis,
Amirtash, & Kadivar, 2006; Gupta, 2011; Karamipour et al., 2015). However,
with regards to the present study’s aims, it is to the best of the researcher’s
knowledge that the methodological undergirding of trustworthiness has so far
been given less emphasis. Therefore, empirically examining the dimensions of
trustworthiness as moderating factors mirrors a major part of this study’s
originality. Lowry and Gaskin (2014) opine that moderator relationships are
examined statistically by checking for interaction effects among independent

117
variables. Consequently, an assessment of the distinct moderating effects of
ability, benevolence and integrity on the impact of organisational culture on
employee creativity, would also aid to engender further theoretical support for
improving employee creativity within the Nigerian manufacturing industry.
The structure of the hypotheses examined in this study (Figure 2.4)
mirrors both direct effects of trustworthiness on employee creativity and
moderating effects of trustworthiness on the impact of organisational culture on
employee creativity. This approach has been drawn from Fassott et al.’s (2016)
study that exemplify a basic model with moderating and direct effects. Their
model demonstrated a moderating variable that reflects both moderating and
direct effects. Hence, in this study, trustworthiness is examined as both a
moderator and a predictor.
2.9 Development of Hypothesis
The concept of employee creativity has been examined by extant research
as either a multidimensional or unidimensional construct (Birdi et al., 2016; Liu
et al., 2016). This might often be an integration and analysis of all the dimensions
of employee creativity (expertise, creative skills and task motivation), to reflect a
creative employee. However, there is also an increase in the number of studies
that have examined employee creativity as a unidimensional construct (Martins
& Terblanche, 2003; Liu et al., 2016; Mehlika et al., 2014; Shalley et al., 2004).
This might also mean that all distinct dimensions within the employee creativity

118
construct are analysed, subsequently scored and further integrated to reflect just
one variable; in this case, employee creativity. The rational here is due to a high
lack of homogeneity of perceptions regarding the phenomenon of employee
creativity (Amabile & Pillemer, 2012; Kaufman & Baer, 2004; Kaufman &
Beghetto, 2009; Kaufman et al., 2010; Kaufman, 2012; Merrotsy, 2013; Shalley
et al., 2004). This is also due to the diverse perceptions of the attributes which
defines a creative employee or due to differences observed in the empirical
examination of the employee creativity concept (Mehlika er al., 2014; Merrotsy,
2013). With respect to the growing controversies rising within the primal concept
of creativity and for the sake of this study’s overall aims and objectives, this
study, will thus, examine the employee creativity concept as a unidimensional
construct. This is also to minimize the confusion of what kind or level of
creativity is required to be measured within different creativity domains. A total
of 19 hypotheses (H) are thus, developed in order to investigate the moderating
effect of trustworthiness on the relationship between organisational culture and
employee creativity. The hypotheses have been grouped into five categories.
2.9.1 Organisational culture relationship to employee creativity
Hofstede (2015) assert that the organisational culture deals with
transferable and shared perceptions, practices and values. These shared notions
are expressed and perceived from the integration of organisational culture values
and that of employees (Jan & Hazel, 2013). Kyvik et al. (2012) also support the

119
necessity of shared values for the sustenance of employee creativity. Values in
this context may be regarded as ideas and objects which have a special
implication on an employee level as well as organizational level (Anugamini and
Rajib, 2016; Lotars & Barbars, 2010). The effective integration of values often
leads to a strong union between the organisational culture and the employee
creativity. In view of this, Gupta (2011) report a significant positive impact on
creativity by the future and innovation oriented culture dimensions. These culture
dimensions are further congruent to the clan and adhocracy oriented culture
dimensions (Cameron & Quinn, 2011).
Although the findings of Hemmatinezhad, Shafiee, Sharari, &
Hemmatinezhad (2012) suggest that there is no significant relationship between
all the subsets of the organisational culture with the creativity of experts of
physical education. Likewise, Gupta (2011) conclude that there is no significant
impact of organisational culture dimensions on employee creativity. However,
studies convincingly report a significant positive relationship that is endemic
between organisational culture and creativity (Einsteine & Hwang, 2007;
Goncalo & Staw, 2006; Martins & Terblanche, 2003; Mobarakeh, 2011; Pandey
& Sharma, 2009). Therefore, this study postulates that the clan and adhocracy
organisational culture dimensions are positively related to employee creativity.
In addition, this study, proposes that the market and hierarchy oriented
organisational culture dimensions are negatively related to employee creativity.

120
H1: There is a relationship between organisational culture dimensions and
employee creativity.
H1a: Clan oriented culture is positively related to employee creativity
H1b: Adhocracy oriented culture is positively related to employee
creativity
H1c: Market oriented culture is negatively related to employee creativity
H1d: Hierarchy oriented culture is negatively related to employee
creativity.
2.9.2 Effect of Trustworthiness on Employee Creativity
The present study strives to investigate the effects of the several
dimensions of trustworthiness on employee creativity. A considerable amount of
research has been initiated over the years to examine on the effects of ability,
benevolence and integrity on employee creativity (Baer, 2012; Bauman, 2013;
Yang & Hung, 2015). These trustworthiness dimensions have also been
exemplified to reflect significant and positive associations to employee creativity.
The ability dimension is known to be a necessary requirement that top
management leaders may need to drive creative efforts towards engendering
employee creativity. The features of ability also mirror certain unique skills sets
and capabilities exhibited through creative behaviours to engender employee
creativity (Guo & Li, 2006). Studies that have espoused on the concept of ability

121
stress the need for managers to ensure continuous development of their abilities
in order to engender employee creativity (Hsu, 2016).
Similarly, this study also accentuates the need for top management leaders
to not overlook the role benevolence plays in engendering employee creativity.
This is such that, a show of top management’s kindness and goodwill towards
employees may have a positive effect on employee creativity (Yang & Hung,
2015). Employees who perceive their top management leaders have good
intentions towards them may rarely get scared or worried about sharing their
creative ideas. It could be unlikely for employees to feel threatened when they
perceive top management leaders as being benevolent towards them. Hence,
employee creativity could be consequently engendered as a result of expressions
of kind emotions exhibited by top management to their employees.
The third dimension of trustworthiness also plays an important role in
engendering employee creativity. This is such that it reflects honesty, a certain
bond of commitment and reliability to promises or principles that are evidenced
in actions or words (Hoch, 2013). Top management leader’s integrity ought to be
characterised by values such as accountability and openness (Palanski &
Vogelgesang, 2011). This is also necessary, as integrity takes time to build, given
that it may often require constant application and reflection. Top management
leaders ought to be capable of demonstrating high integrity even during day to
day interactions with employees (Peng & Wei, 2016). Given a strong employee
perception that their top management leader’s integrity is very high, it may be

122
very unlikely that their willingness to commit towards engendering employee
creativity would be repressed by them. Employees could feel more relaxed and
persuaded to exchange creative ideas that could be expedient for engendering
employee creativity. The following postulations are thus highlighted in this study.
H2: There is a relationship between trustworthiness dimensions and
employee creativity
H2a. Ability has a positive effect on employee creativity
H2b. Benevolence has a positive effect on employee creativity
H2c. Integrity has a positive effect on employee creativity
2.9.3 The moderating effect of ability on the relationship between
organisational culture and employee creativity
The organisational members’ perceived ability is also a major factor
within the perceived trustworthiness construct, relevant for promoting effective
interpersonal trust relationship. An adequate trustworthiness perception of
organisational members is subsequently vital for achieving high employee
creativity (Afsar, 2016; Barend & Victor, 2015). This is due to its command of
employee commitment towards a collective integration of values and further
exchange of creative ideas. For an employee to be engaged in employee creativity
initiatives, it may be required of the manager to examine the employee’s
perceived ability to effectively and efficiently engage in employee creativity

123
initiatives. Thus employee creativity initiatives may be contingent on an
organisational members’ ability to adequately exhibit a high degree of expertise,
creative thinking styles and task motivation (Anugamini & Rajib, 2016; Liu et
al., 2016). However, the extent at which organisational members are able to fully
employ their ability towards high employee creativity could also be dependent on
the operationalised organisational culture type. Gupta (2011) argue convincingly
that the organisational culture enforces a high degree of influence on the
processes and outcomes of employee creativity. This further present a question
of the effect of employee ability on the relationship between the organisational
culture and employee creativity. Consequently, this study proposes that the
employee’s ability moderates the relationship between the organisational culture
and employee creativity.
H3: Ability moderates the impact of organisational culture dimensions on
employee creativity.
H3a: Ability moderates the impact of adhocracy organisational culture on
employee creativity.
H3b: Ability moderates the impact of clan organisational culture on
employee creativity.
H3c: Ability moderates the impact of market organisational culture on
employee creativity.
H3d: Ability moderates the impact of hierarchy organisational culture on
employee creativity.

124
2.9.4 The moderating effect of benevolence on the relationship between
organisational culture and employee creativity
Benevolence refers to the degree to which the manager or organisational
members are believed to want to exhibit goodness to an employee or other
organisational members. This is apparently exclusive of an egocentric profit
motive (Colquitt & Rodell, 2011). Signs of benevolence may be easily observed
in the highlighted values of managers towards organisational members. Thus, this
promotes a platform which further encourages the integration of values and
exchange of creative ideas among organisational members. The integration of
values and exchange of creative ideas is also on the perception that organisational
members relate an acceptable degree of goodwill towards each other (Mehlika et
al., 2014). The perception of organisational members which constitutes the
creation of an appropriate organisational culture that adequately commits towards
high employee creativity is likely welcomed as a sign of manager’s care about
organisational member’s interests. Consequently, managers’ actions which are
tailored towards enhancing or promoting respective employee creativity is
subsequently perceived as demonstration of benevolence (Agnieszka & Dariusz,
2016). Therefore, this study proposes that benevolence moderates the relationship
between the organisational culture and employee creativity.
H4: Benevolence moderates the impact of organisational culture
dimensions on employee creativity.

125
H4a: Benevolence moderates the impact of clan organisational culture on
employee creativity.
H4b. Benevolence moderates the impact of adhocracy organisational
culture on employee creativity.
H4c. Benevolence moderates the impact of Market organisational culture
on employee creativity.
H4d. Benevolence moderates the impact of hierarchy organisational
culture on employee creativity.
2.9.5 The moderating effect of integrity on the relationship between
organisational culture and employee creativity
Integrity relate the perception that organisational managers adhere strictly
to certain laid down principles and policies which organisational members find
acceptable. This also entail the belief that value standards embedded within the
organisational culture and are relevant for promoting employee creativity remain
unaffected. Similarly, employing the wrong sets of values within the
organisational workforce may give rise to organisational members questioning
the integrity of managers (Meyer, 2014). Conversely, for an employee to become
tasked with the responsibility to exhibit respective expertise, creative thinking
styles and even motivation towards a given creativity initiative; the same
employee must have displayed an acceptable degree of integrity which is
congruent with already organisational culture set values (Po-Ling & Cheng-
Yuan, 2014). Consequently, it is imperative to propose that integrity moderates

126
the relationship between organisational culture and employee creativity. Mehlika
et al. (2014) further stress on the importance of recognising the effective and
efficient integration of employee creativity values of overall organisational
members with that of the organisational culture.
H5: Integrity moderates the impact of organisational culture dimensions
on employee creativity.
H5a. Integrity moderates the impact of clan organisational culture on
employee creativity.
H5b. Integrity moderates the impact of adhocracy organisational culture
on employee creativity.
H5c. Integrity moderates the impact of market organisational culture on
employee creativity.
H5d. Integrity moderates the impact of hierarchy organisational culture
on employee creativity.
2.10 Summary
This chapter reviews and analyses the theoretical foundation and
framework underpinning this study. This is in relation to the problem statement
and research questions of this study. This study’s central focus is basically on two
major perspectives. One of which is on the impact of organisational culture on

127
employee creativity. Likewise, the second is on the moderating effect of
trustworthiness on the relationship between organisational culture and employee
creativity. Similarities and differences between concepts, weaknesses and gaps of
the research are identified. Past studies related to organisational culture,
trustworthiness and employee creativity from both the oriental and western
countries are also considered (See Appendix J and K for an overview). Therefore,
the subsequent chapter presents the research methodology of this study.

128
CHAPTER 3
RESEARCH METHODOLOGY
3.1 Introduction
This is a quantitative research which seeks to investigate the impact of
organisational culture on employee creativity. It also seeks to examine the
moderating effect of trustworthiness on the relationship between the
organisational culture and employee creativity. This chapter outlines the research
methodology for this study. It includes the design of the study, sample population
and sampling techniques, method of data collection, the questionnaire design,
reliability and validity of the instrument, the data analysis methods as well as the
operationalization of measurement.
3.2 Research Paradigm
This study adopted a positivist research paradigm. This is because, this study
reflects a scientific research that is concerned with obtaining objective insights through
the use of scientific methods of enquiry. Methods of enquiry in this regard are associated
with surveys and experiments and the norm of quantitative data application (Chen, Shek,
& Bu, 2011). The believe surrounding positivist research is a view that the world is
external and that despite the researcher’s perceptions of a given research phenomenon,
there is mainly a single objective reality (Schmierback, 2005). Therefore, the positivist

129
research paradigm involves a structural and controlled approach that requires the
development of relevant hypotheses and adoption of a suitable research methodology
(Johnson, 1999). Congruent to the discourse of extant literature (Gray, 2014; Mack,
2010), this study strives to maintain a distinction between facts, value judgements,
personal experience and science. Hence, a quantitative approach of investigation is used
in this study, as it employs statistical techniques that are central to a positivist research
in order to uncover single and objective knowledge (Chen, Shek, & Bu, 2011).
This study has not employed the qualitative research method to investigate its
highlighted constructs. The phenomenon of organisational culture, trustworthiness, and
employee creativity have received a great deal of attention over the years. Their
respective concepts have been previously investigated via a qualitative and quantitative
approach by extant research, and are thus, not new or underdeveloped (Birdi et al., 2016;
Eleni et al., 2014; Jan & Hazel, 2013; Karamipour et al., 2015; Ogbeibu et al., 2018).
Employing the qualitative research approach in this study would inhibit richer
investigations into the perceptions of a broad spectrum of employees and would have
limited the sample representativeness and results generalizability to the wider population
of study (Morgan, 2016). Hence, Hammarberg, Kirkman, and de Lacey (2016) posit that
qualitative, rather than quantitative approach should be used when investigating new,
underdeveloped, unclear and ambiguous phenomenon, or when a target population
cannot be identified (Hammarberg, Johnson, Bourne, Fisher, & Kirkman, 2014). Further,
since this study’s constructs can be isolated, defined and linked to generate hypothesis,
a quantitative approach is thus, relevant to generate findings that can be applied to a
wider population and context (Hammarberg et al., 2016; Morgan, 2016).

130
3.3 Research Design
This study employed a cross sectional research design. The cross-
sectional research design could be defined as a data collection research technique
which is employed to determine prevalence (Pathirage, Amaratunga, & Haigh,
2008). It is a kind of study which reflect the number of people in a population at
a specific point in time. The cross sectional research technique prevalence is vital
for this study. This is due to its considerable influence on the likelihood of any
specific diagnosis. Likewise, it would aid the predictive value of this study’s
investigation (Mann, 2003). Sneve and Jorde (2008) argued that cross sectional
studies are usually employed to determine the probability of subjects’ exposure
to the respective agent and the probability of the interest outcome.
The cross sectional research design is well suited for the statistical and
empirical examination of the organisational culture impact on employee
creativity. It is also suitable for investigating the moderating effect of
trustworthiness on the relationship between organisational culture and employee
creativity. Employing this research design would aid to examine and identify
major relationships between variables of this study’s theoretical framework. This
would also allow for the quantifying of study constructs as they relate to the
descriptive population characteristics. Thereby, facilitating the examination of
prevalence of employee creative behaviour in course of engendering employee
creativity (Knox, 2004). Likewise, Schmidt and Kohlmann (2008) support that
employing a cross-sectional research technique would aid in sorting out the
existence and degree of causal effects of one or even more independent variables

131
upon a dependent variable of interest. Mann (2003) further espouse that the cross-
sectional empirical process involves the analysis of data obtained from a defined
population, or a representative subset. This usually occurs at a specific point in
time.
3.4 Population of Study
The population of this study centres on organisational members such as
employees. The objective is to collect comparable and non-biased data from
employees. Data would reflect employee perceptions of their organisational
culture, creativity and top management leader’s trustworthiness. The target
population are located in and represented by the headquarters of a total of 21
manufacturing companies. The headquarters of these manufacturing companies
are also situated in 7 different states of Nigeria. Similarly, these 7 states represent
a network of concentration hubs of manufacturing companies in Nigeria (EMIS,
2016; Nzewi & Nwaduhu, 2015; Usman & Amran, 2015; Uwalomwa & Jafaru,
2012). Choosing these manufacturing companies is also because they are the
listed, indexed and have also been recognised by the Nigerian Stock Exchange
Commission as major operating manufacturing companies in Nigeria (The
Nigerian Stock Exchange, 2016). This approach of choosing these manufacturing
companies from the Nigerian Stock Exchange Commission, is similar to, and
considered appropriate by extant literature (Ademola, 2014; Nzewi & Nwaduhu,
2015; Usman & Amran, 2015; Uwalomwa & Jafaru, 2012). Figure 3.1 relate an
overview of the number of companies and their locations respectively.

132
TABLE 3. 1: Number of Companies and Their Respective Locations
COMPANY LOCATIONS
(STATES)
NUMBER OF
MANUFACTURING COMPANIES
Lagos 15
Rivers 1
Anambra 1
Gombe 1
Edo 1
Ogun 1
Sokoto 1
Source: Self devised based on (EMIS, 2016; The Nigerian Stock Exchange, 2016)
In Table 3.1, Lagos state has the highest total of the headquarters of
manufacturing companies examined in this study. This is because Lagos state has
the highest concentration of manufacturing companies in Nigeria (Ademola,
2014; Nzewi & Nwaduhu, 2015; Usman & Amran, 2015; Uwalomwa & Jafaru,
2012). Table 3.1 also indicates that the headquarters of the other manufacturing
companies resides respectively in each of the 6 remaining states examined. This
is with respect to the respective locations of the headquarters of the distinct
manufacturing industries (EMIS, 2016; The Nigerian Stock Exchange, 2016).
These manufacturing companies are characterised by the production of
goods such as building materials, electrical and electronic products,
packaging/containers, tools and machinery. These manufacturing companies also

133
comprise of the manufacture and distribution of capital goods, defence and
aerospace, engineering and industrial products, packaging and electrical
equipment for both industrial and consumer products. Basically they are centred
on producing goods for commercial usage (The Nigerian Stock Exchange, 2016).
Carrying out this study in these 7 different states would aid in reaching into a
broader perspective and network of employees working in several locations
within the 21 manufacturing companies (The Nigerian Stock Exchange, 2016).
3.5 Field Work and Data Collection
Data were collected from respondents who were solely from the R&D and
IT departments. This is because respondents from the R&D and IT departments
are regarded as employees exhibiting high creativity and able to significantly
contribute to the manufacturing organisation (Gabora & Leijnen, 2013; Gupta &
Singh, 2012; Tung & Yu, 2016). It is argued that employees in R&D and IT
departments tend to exhibit high levels of creative behaviours that engenders
remarkable and long lasting creative accomplishments (Gupta & Singh, 2015;
Kozbelt, Beghetto, & Runco, 2010; Tung & Yu, 2016). Kaufman and Beghetto
(2009) convincingly opine that creative accomplishments of employees consists
of clear-cut, renowned creative contributions. The authors highlight such
employees as creators. It is also noted that R&D and IT employees are capable of
producing novelty that reflects eminent and highly substantial contributions
towards an organization. They often possess the R&D and IT domain relevant
skill-sets which includes high levels of technical skills, knowledge and
specialized talents (Gupta & Singh, 2015; Mittal & Dhar, 2015; Yuri, 2011).

134
However, this does not necessarily mean that R&D and IT employees are
the only creative geniuses in manufacturing organisations. In retrospect of
Plucker, Beghetto, and Dow (2004) creativity definition, “Creativity is the
interaction among aptitude, process, and environment by which an individual or
group produces a perceptible product that is both novel and useful as defined
within a social context” (p. 90). So as long as the creative outcome is both novel
and useful, it is considered a creative product, service or process. Similarly,
considering Amabile (1997) definition of what the nature of creativity really is,
the creative employee is one whose creative ideas and behaviours lead to creative
outcomes which appear as novel, suitable and applicable ideas in any realm of
human activities, either from science, to the arts or education, to business or to
everyday life. Nevertheless, do recall that one major aim of this study is to
engender employee creativity. So to produce long lasting novelty which
culminates from the manufacturing industry perspective, employee creativity
needs to be engendered (Burbiel, 2009; Ghosh, 2015).
Employee creativity is also required to foster an employee's expertise to
exhibit creative behaviours which produces and engenders novel outcomes. A
kind of novel outcome which lasts longer and has the ability to leap through many
years (Kaufman & Beghetto, 2009; Rogers, 2003). This often originates from
creative ideas which transcends beyond the very less eminent or common creative
output that may be produced daily by other departmental employees, yet with less
significant contributions to the organization (Amabile & Pillemer, 2012;
Kaufman, 2012; Rodney & Alan, 2005). This could conversely mean that creative
behaviours of eminent employees who are experts or professionals in the fields

135
of R&D and IT would necessitate high and far more significant contributions to
the organization, as compared to supposedly everyday creative actions of non-
experts who may also be creative (Kaufman & Beghetto, 2009; Mittal & Dhar,
2015).
Moreover, engendering employee creativity often involves high levels of
creative outputs and this usually requires a certain degree of time (Kaufman &
Beghetto, 2009). Employee creativity could also be associated with employees
whose creative contributions could be related as novelty. Likewise, as novelty,
such creative contributions could also be observed by the degree of impact a
creative idea has or would have and how much the longevity of the creative output
has or how much it can significantly influence and revolutionize the organization
(Eleni et al., 2014; Evan et al., 2015; Kaufman & Beghetto, 2009). Congruently,
this study builds towards examining such relative experience from the
perspectives of R&D and IT employees in Nigerian manufacturing industry, since
these two departments tend to mostly generate creative ideas that reflect novelty.
Apart from R&D and IT, other departments would not be included in the
data collection process. This is also because in view of the scope and aims of this
study, other departments reflect employees characterised by low or everyday
creativity initiatives (Adeel et al., 2006; Gordon & Tarafdar, 2007; Merrotsy,
2013; Oke, 2013; Yamashina, 2001). Due to the nature of their jobs which often
includes strict adherence to instituted organisational policies and guidelines,
employees in other departments are thus constrained to exhibit significant
creative behaviours. They tend to mostly produce creative ideas which adds very
minimal or far less significant contribution to the organisation (Kaufman &

136
Beghetto, 2009; Nzewi & Nwaduhu, 2015; Oke, 2013). Although they may
exhibit certain forms of creative behaviours but their creative outcomes and
establishments are often common and far more ambiguous (Merrotsy, 2013).
Merrotsy (2013) also accentuated that the degree of creativity exhibited in this
regard usually reflect the everyday and far less remarkable kind. Creative ideas
that come from employees outside the R&D and IT departments are also useful
for addressing common misconceptions in the organisation. However, they often
only give very less significant contributions to the organisation (Akume &
Abdullahi, 2013; Kaufman & Beghetto, 2009).
Unlike the R&D and IT departments, tolerance for ambiguity, self-
discipline, capability and willingness to engage in risks are often not highly
common in other departments. It could also be that based on the daily repeated
processes, already structured procedures and routines of their jobs, they may often
constitute non-experts exhibiting less creative behaviours and contributing far
less significantly towards organisational innovation (Gupta & Singh, 2015; Mittal
& Dhar, 2015). To further grasp the nature of employee creativity, one could end
up with a question of how the creative employees have impacted the organisation
at large and how much have their creative ideas influenced and revolutionized the
organisation’s innovativeness (Kaufman & Beghetto, 2009).
Regardless of the domain and department, studies stress that a very
prevalent occurrence of significant creative behaviours is often from the R&D
and IT departments (Adeel et al., 2006; Gordon & Tarafdar, 2007; Gupta &
Singh, 2015; Mittal & Dhar, 2015; Oke, 2013; Yamashina, 2001). So in order to

137
further examine the nature of employee creativity with a view of engendering it;
questionnaires for data collection were randomly distributed by hand to
organisational employees from the R&D and IT departments, accordingly.
Similarly, collection of data from respondents within the R&D and IT
departments helped to facilitate a thorough assessment of the employee creativity
concept.
To aid the data collection of this study, three research assistants were
recruited, and paid to collect the data for this study. Recruitment of research
assistants for data collection purposes is congruent with studies that have
espoused on its importance and applied similar approach in conducting empirical
research (Chiware & Dick, 2008; Deane & Stevano, 2015). The research
assistants were members of the Nigerian Institute of Social and Economic
Research (NISER, 2017). This institution which is a Federal government
parastatal has a team of research experts who are also adept in conducting
investigations on areas that even spans across the manufacturing and innovations
research scopes (NISER, 2017). The research assistants recruited were known to
be reliable and credible to execute the data collection processes efficiently,
considering their institution’s research capabilities. The research assistants were
educated via the skype internet application, about this study’s aims, objectives,
scope and significance. Details regarding the aims and objectives of the
questionnaire were discussed with them accordingly, to ensure smooth and
effective data collection processes. Hence, questionnaires were distributed to both
middle/line management level, and non-management level employees in each
R&D and I/T department of each manufacturing organisation. Questionnaires

138
were structured to investigate the effects of trustworthiness on the impact of
organisational culture on employee creativity. Duration of data collection lasted
for about 9 months (3rd October, 2016 – 25th June, 2017).
Human resources (HR) managers of each organisation were consulted.
Names of employees were requested for and randomly selected from appropriate
generated lists. The research assistants made official requests through the HR
managers, to meet with employees for a quick 5 minutes briefing about the
questionnaire and distribution, during employee’s breaks. Employees were each
given envelopes containing a questionnaire and were advised to attempt and
complete the questionnaires. After which the questionnaires were returned in
sealed envelopes back to the HR managers within a three days’ period. The time
for the completion of questionnaires was between 30 to 45 minutes, respectively.
This information was highlighted on some of the sealed envelopes, by employees
who also submitted the sealed envelopes to their respective HR managers. The
sealed envelopes were subsequently collected from the HR managers by the
research assistants for further collation processes.
With the additional support of a court affidavit from the High Court of
Law, Nigeria; it was less challenging for HR managers to work with the research
assistants and release employee details. The court affidavit reflected that the study
is valid, the source upon which the study is built is reliable and that the study’s
data collection processes are suitable. This is to ensure that data collection
processes were within the appropriate research ethics governing the strict
confidentiality of respective employee’s personal data, and purpose of this study.

139
Likewise, organisational members with less than 3 years’ organisational
tenure1 within each company were exempted from the data collection processes.
This is in view of insufficient insight and experience of such employees regarding
a strong perception of top management’s trustworthiness. Employees’
trustworthiness perception of top management is based on the organisations’ top
leadership reputation and not just on information acquired through direct
interpersonal relationships (Costigan, Insinga, Berman, Kranas, & Kureshov,
2011). This is often similar to the case of employees with less organisational
tenure. Moreover, in large organisations, there is often very limited direct
relationships between top management leaders and employees. Congruently, it
requires a longer organisational tenure for the employee to build strong
trustworthiness perceptions of their top management leaders (Chen & Indartono,
2008; Jiang, Hu, Liu, & Lepark, 2015; Steffens, Shemla, Wegge, & Diestel,
2014).
Costigan et al. (2011) further stressed that employees’ perceptions of top
management could also be determined by having practical perspectives of the
justice and efficiency of organisation-wide practices and systems; rather than just
top management’s personal characteristics. Moreover, studies (Chen &
Indartono, 2008; Costigan et al., 2011; Jiang et al., 2015) further reflect an
appropriateness of 3 years’ organisational tenure and above, for employees to
have been able to obtain sufficient insights and experiences regarding
1 Organisational tenure relates the length of time an employee has spent in an
organisation. It reflects the personal and professional experiences an employee might be
able to obtain within the length of time spent in an organisation (Steffens et al., 2014).

140
trustworthiness perceptions of top management. Similarly, Chen and Indartono
(2008) report that employees with longer organisational tenures have wider views
of several aspects relating to their perceptions of top management leaders than
employees with less organisational tenures. Therefore, employees with longer
tenures would help facilitate a non-biased and in-depth quality of data for this
study.
3.6 Sample Size
In calculating an appropriate sample size, a number of factors have to be
considered in relation to each survey’s uniqueness. These factors considered may
be the level of confidence, precision as well as the level of variability within the
attributes considered for measurement (Babbie, 2010; Miaoulis & Michener,
1976). On this note, it is often left to the researcher to determine a judgment
concerning the elements. In this study, the formulae employed for the calculation
of the sample size is based on the work of Krejcie and Morgan (1970).
S = X 2NP (1− P) ÷ d 2 (N −1) + X 2P (1− P);
Where S = required sample size,
N = the population size,
d = the degree of accuracy or the level of accuracy conveyed as a
proportion (0.05),

141
X 2 = this represents the table value/worth of chi-square for 1 degree of
freedom at a 95% confidence level which is X 2 = 1.962 = 3.841; and P =
the overall population proportion or the degree of variability (generally
assumed to be .50 since this would deliver the maximum sample size).
First of all, the total number of employed workers within the Nigerian
manufacturing industry is 2,368,514. However, this population size is yet to be
updated even as at the year 2017 (National Bureau Of Statistics, 2012). In 2007,
The World Bank (2007), highlighted that Nigeria had a total of 38,576 R&D
employees. Over the years, Nigeria has experienced an increase in the number of
people who are employees from R&D and IT departments. Consequently, as at
2015/2016, there have been a total of 152,528 employees in the R&D and IT
departments of Nigerian manufacturing organisations (Manufacturers
Association of Nigeria, 2017). This thus reflects the population sample for this
study. The use of Krejcie and Morgan (1970) determinant of sample size has been
employed in this study. This is because it helps to facilitate the prevalence of
detecting significant differences, interactions and relationships for this study’s
sample size (Bartlett, Kotrlik, & Higgins, 2001). Applying the statistical
recommendations would help to minimize alpha errors by addressing differences
which are non-existent within the population. This is in order to obtain an
appropriate representative of the overall sample size.
Given the above formula, the estimated population is 400. This reflects
the minimum sample size required for this study. This is due to the total
142
population data required for this study as the total population sample of this study
reflect a finite sample size. Therefore, applying the Krejcie and Morgan (1970)
determinant of sample size in this study would also facilitate the applicability of
simplified measurements of the finite population. Krejcie and Morgan (1970)
related that a sample size of 384 could be appropriate for a given population
sample, equal to or greater than 1,000,000; on an acceptable sampling error of
5%. However, studies (Bartlett et al., 2001; Weisberg & Bowen, 1977) further
insinuate that at an acceptable error of 5%, the sample size of 400 is also
appropriate.
3.7 Sample Design
It is impracticable for a survey to be employed concerning all the
employees working within the manufacturing industry. Therefore, the stratified
proportionate sampling technique has been employed in this study in order to
efficiently partition the population sample size into groups based on the overall
representative of the sample size (Teddlie & Yu, 2007). 21 different
manufacturing companies were engaged in course of this study. This is in view
of obtaining a stratified proportionate sampling of employees in each company.
Thus, 510 copies of questionnaires were distributed to employees. 439 copies of
the questionnaires were completed, returned and found suitable for analysis. This
reflects an 86% response rate. This response rate is congruent with and considered
appropriate by extant literature which highlight a response rate of 85% and above
(Jubril, Raji, Banjo, & Olayinka, 2014; Maduka & Okafor, 2014). Table 3.2

143
highlights the number of questionnaires distributed per company, questionnaires
returned and percentage rate of responses from each manufacturing company.
TABLE 3. 2: Stratified Proportionate Sampling Design
States Questionnaires
distributed
Questionnaires
returned
Response rate
86%
% of population
Lagos 390/390 336 86 77
Rivers 26/26 22 84 5
Anambra 23/23 20 87 5
Gombe 19/19 16 84 4
Edo 20/20 18 90 4
Ogun 17/17 14 82 3
Sokoto 15/15 13 86 3
Total 510 439 439 100
3.8 Questionnaire Design and Structure
This research study employs the use of questionnaire for the collection of
data. The questionnaire is prepared in English, which is Nigerian’s official
language. Moreover, in order to avoid the issue of limited choices and the
constraints of inadequately capturing respondents’ opinions; the 7-point Likert
scale option is employed in this study (Jones & Loe, 2013; Rickards, Magee, &
Artino, 2012). This is to allow for flexibility in relating and capturing distinct
perspectives in the increased number of response options. In a review of literature,
Jones and Loe (2013) argue that expected values of validity coefficients tends to
increase, should the number of response options increase as well. Similarly,
studies by Lietz (2010), and Leung (2011) also reported that the use of a 7-point

144
Likert scale tends to increase sensitivity and does not affect reliability. It
otherwise stretches on towards the reliability upper limits, psychometric qualities
and validity enhancements (Allen & Seaman, 2007; Lietz, 2010). This would help
to simplify the selection and rating of respective items in the questionnaire. It
would help to further maintain a sense of clarity required to explore deep choice
of insights from distinct perspectives (Jones & Loe, 2013). In this study, it would
further aid in increasing the response rate categories in Likert items by facilitating
the scales psychometric properties and increased validity coefficients
respectively. Therefore, this study employed a 7-point Likert scale so as to aid in
the process of examining the validity and reliability of the respective constructs
of study, within the scope of the Nigerian manufacturing industry.
The questionnaire items do not exceed a maximum of 10 for each
measurement scale. Artino, La Rochelle, Dezee, and Gehlbach (2014) advocated
convincingly that scales ranging from six to ten items would usually suffice in
reliably capturing the essence of the research phenomenon examined. Similarly,
to further examine the validity of the questionnaire items to measure the
constructs, experts in this study’s related field have been consulted. Each survey
items have been analysed and systematically reviewed by the experts to ensure
their relevance to the examined constructs and that major items have not been
omitted as well. Polit and Beck (2006) highlight that the use of experts in this
regard could substantially enhance the general quality and characteristics of the
scale items. Likewise, various instruments of measurements items are used in
order to decrease biasness, which may arise due to use of a single source of
measurement instrument for all the items (McCoach, Gable, & Madura, 2013).

145
3.8.1 Operationalised Definition and Construct Measurement
The prime focus of this study is centred on an employee level analysis.
The various constructs of this study are examined by their respective
measurement items. Several validated items are employed to examine the
constructs of this study. Nunally (1978) advocated that coefficient alpha value of
0.7 for deductive studies conducted is sufficient and acceptable. Therefore, the
alpha value found for each highlighted construct and their components as
presented from an analysis of their related literatures, indicate that their
measurements are sufficiently reliable (Green, Salkind, & Akey, 2000; Mostafa,
2005). Table 3.2 reflects the total number of items used to measure each construct
in this study.
3.8.1.1 Organisational Culture
Similarly, Table 3.2, highlights the four respective dimensions of the
Cameron and Quinn (2006) competing values framework and the measurement
items relate a Cronbach’s alpha ranging from .71 to .80, in a recent study by
Heritage, Pollock, and Roberts (2014). In Table 3.2, the OCAI is employed to
examine and profile the organisational culture type operationalised within the
Nigerian manufacturing industries. One of the measurement items within this
quadrant is “My company is a special place where individuals seem to share a lot

146
of care for each other and live like a family”. A total of 24 questions are adapted
from the OCAI (Cameron & Quinn, 2006).
3.8.1.2 Trustworthiness
The trustworthiness variable has three dimensions which are ability,
benevolence and integrity (Bradley et al., 2014). According to Mayer and Davis
(1999), these dimensions relate a reliability Cronbach alpha scale ranging from
.88 to .89. In a previous research by Heyns and Rothmann (2015), the
trustworthiness components (Mayer & Davis, 1999) reflect a reliability
coefficient range of 0.93 to 0.96. Likewise, in another study conducted by Bradley
et al. (2014) the reliability scale relate a 0.85 to 0.94 reliability coefficient alpha
range. Moreover, the trustworthiness construct is measured by adapting a total
of 17 items from the perceived trustworthiness measurement scale of Mayer and
Davis (1999). A measurement item here is “Top management of my company has
specialized capabilities that can increase my creativity”.
3.8.1.3 Employee creativity
In view of the componential theory of individual creativity (Amabile,
1997), measure of employee creativity by Liu et al. (2016) relate a Cronbach
alpha reliability scale of .90. Also another study by Birdi et al. (2016) reflect a
Cronbach alpha of 0.76 for the expertise component, while intrinsic motivation is

147
a 0.79 and creative thinking is 0.90 alpha range. In this study, a total of 30
questions are thus adapted to measure employee creativity. Likewise, one of the
items measuring this construct is “I often think about ideas than most employees
in my company”. Thus, expertise is measured by adapting 10 items from the
Kaufman et al.’s (2012) Domains of Creativity Scales (K-DOCS); 10 items are
also adapted to measure creative thinking, from Runco, Plucker and Lim’s (2001)
Runco Ideational Behaviour Scale (RIBS). Likewise, 10 items are also employed
to measure task motivation (Robinson et al., 2014). The employee creativity
measurement scales are necessary for the critical assessments of various
employee expertise, creative thinking and task motivation. In regards to this
study, all the measurement scales are adapted. Adaptation of these measurements
are also in order to further ensure clarity and comprehension in the responses of
questionnaire items during data collection processes (Gehlbach & Brinkworth,
2011). It is also due to the choice of target respondents of this study.
They would aid in investigating the employee creativity phenomenon
from an employee level perspective. In a comprehensive review of the methods
for studying creativity, Amabile and Mueller (2008) also stressed that there are
several approaches for examining exactly how employee creativity dimensions
(expertise, creative thinking and task motivation) result in a creative outcome.
The authors posit that creativity measurement scales can be combined in a variety
of ways to investigate the employee creativity phenomena. Therefore, the
employee creativity measurement scales used in this study are relevant for
examining individual employee creativity level within the Nigerian
manufacturing organisations.

148
Moreover, Table 3.3 present the summary of the total respective items for
each variable as well as the source from which the distinct items were adapted.
The questionnaires consist of four sections. Section one consists of six questions
regarding the demographic background of the respondents. Section two is
highlighted in four parts and relates the organisational culture dimensions.
Likewise, section three addresses employees’ perceived trustworthiness of
organisational top management. Moreover, this section consists of three parts.
Section four deals with respective employee creativity assessment within the
R&D and IT departments, and it consists of three parts as well.

149
TABLE 3.3: Questionnaire Design and Constructs’ Scale Items
Section Variables No of Items Items Sources
One Socio-demographic variables
Age 1
Gender 1
Highest Academic Qualification (Education)
1
Duration of time in Current Company
(Organisational Tenure)
1
Level of Job Position 1
Department Attached to Within the
Company
1
Two Organisational culture
Clan Oriented Culture 6 Adapted from Cameron and
Quinn (2006)
Adhocracy Oriented Culture 6 Adapted from
Cameron and Quinn (2006)
Market Oriented Culture 6 Adapted from
Cameron and
Quinn (2006)
Hierarchy Oriented Culture 6 Adapted from
Cameron and
Quinn (2006)
Three Trustworthiness
Ability 6 Adapted from Mayer and Davis (1999)
Benevolence 5 Adapted from Mayer
and Davis (1999)
Integrity 6 Adapted from Mayer
and Davis (1999)
Four Employee Creativity
Expertise 10 Adapted from Kaufman, (2012)
Creative Thinking 10 Adapted from
Runco, Plucker and
Lim (2001)
Task Motivation 10 Adapted from Robinson, et al.
(2014)

150
3.9 Reliability of Questionnaire
Questionnaire used in this study reflects that it detects some real ability,
prevailing situation and or attitude which the researcher can illustrate and
ascertain. Thus, if an attitude or ability relates self-stability and if a respondent’s
reply to the various items are not in any way affected by other irregular factors,
then each item of the instrument ought to yield basically the same results
(Sarantakos, 2000). Ekinci and Riley (2000) opine that questionnaires indicates
how valuable a measure is likely to be in a defined situation. Thus questionnaires
reveal whether the instrument reflects the accurate outcome or at least something
clearly similar to the fact it seeks. Basically, this research questionnaire would
aim at asking the right questions which would be phrased in the least ambiguous
manner.
Although the overall questionnaire measurement items relate self-rating
report techniques and may thus, seem to reflect some sense of bias regarding an
employee reporting dishonest evaluations. However, this study’s scope is
primarily tailored towards the employees and questions have been structured
systematically to obtain honest respondents’ evaluations. The use of top
management leader’s evaluations of employees would not be appropriate for this
study, as it is not within this study’s scope. Thus, results of a top management
leader’s ratings of their employee’s creativity would be rather questionable as
only each employee would be able to accurately relate their own self-perceptions
(Mehlika et al., 2014). This is in view of the overall assessment of the employees’
perceptions of self-creativeness, perceptions of top management’s

151
trustworthiness and organisational culture. Similarly, self-rating evaluations are
also commonly employed in field research and several studies have used self-
rating report techniques, even as evaluations for employee creativity,
organisational culture and trustworthiness respectively (Heritage et al., 2014;
Kaufman, 2012; Kaufman & Baer, 2004; Mayer & Davis, 1999; Mehlika et al.,
2014; Robinson et al., 2014; Runco et al., 2001; Silvia, Wigert, Reiter-Palmon,
& Kaufman, 2012).
Furthermore, the items have been tailored towards measuring significant
aspects of the concepts of this research. Hence, the terms maintain a clearly
defined construct that assumes similar and very clear meanings to all the
respondents (Cohen & Marion, 2003). In view of this study, the reliability of
measuring instrument addresses the question of whether the outcomes of the
measuring practices are stable on situations where they should be stable
(Trochim, 2006). Burns and Bush (2010) further improved on the concept of
questionnaire reliability by emphasizing that reliability is a statistical conception
which is associated with dependability and consistency, in that there is
consistency in obtaining the same relative answer when measuring phenomena
that is yet constant. (Please see Appendix B, for reliability statistics)
3.10 Pre-test and Pilot Study
To avoid issues of vagueness of words and their meanings, a pre-test was
conducted to validate the instrument used in this study (Hair, William, Barry, &

152
Rolph, 2010). The pre-test involved 6 experts. These experts consisted of 1-line
manager from a manufacturing organisation, 2 senior level employees from R&D
and IT departments respectively. The remaining 3 experts consisted of a professor
of strategic human resource management discipline and 2 other assistant
professors from within Business and Finance faculty. These experts reviewed the
contents of this study’s questionnaire items. Feedbacks and corrections, based on
the instructions from the experts resulted in a final confirmation of the content
validity of this study’s questionnaire items.
To further verify the consistency between this study’s constructs and scale
items, the researcher conducted a pilot study. According to Saunders, Lewis and
Thornhill (2009) the purpose of pilot test is usually to refine the questions on the
questionnaire in order to make certain that there is no vagueness or partiality, thus
making for an adequate instrument of measurement which is fine tuned for quality
data collection. Despite the appropriate measures and steps to be undertaken in
order to adequately initiate a reliable research process as well as obtain valid
responses; some survey items may yet prove problematic. A pilot test phase has
therefore been initiated in this study to ascertain the range and variance of items,
composite score correlations, whole scale score reliability and review items
(Artino et al., 2014). Moreover, this has helped to identify items below the factor
loading value and threshold of 0.7 (Nunally, 1978).
Moreover, data for pilot study was obtained from 3 branches of 3 different
manufacturing organisations. Their branches were used for the pilot study

153
because they are a reflection of their respective headquarters where the main
study was conducted. Additionally, they were not included in the main study.
These 3 manufacturing organisations are also part of the 21 listed manufacturing
organisations, examined in this study. Hence, the pilot study was conducted using
a total of 50 questionnaires. A total of 50 respondents from R&D and IT
departments was preferred in order to initiate the pilot test phase for this study
(Siniscalco & Auriat, 2005). This is consistent with the arguments of studies by
Siniscalco and Auriat (2005), Gjersing, Caplehorn, and Clausen (2010), Gehlbach
and Brinkworth (2011), McCoach et al. (2013), and Artino et al. (2014) which
advised that, at least a total number of 50 respondents would be appropriate to
initiate a pilot test phase.
By initiating the pre-test and pilot test in this study, the researcher
attempted to refine the questionnaire items and helped ensure clarity and
simplicity of words used. This helped the respondents to better understand and
accurately attempt each question contained in the distributed questionnaire.
Equally, the questionnaire was structured chronologically in sections to mitigate
against confusion that could have otherwise risen due to disarrangement of
measured constructs. Likewise, the RA’s were trained researchers who deployed
their expertise in efficiently communicating the aims/objectives and approaches
of responding to all the questionnaire items. Further, the respondents were well-
educated individuals who were quite familiar with the questionnaire intents and
contents. These steps further reinforced the level of data integrity of this study,
and subsequently aided to yield significant findings.

154
The researcher employed the SPSS statistical tool to test the internal
consistency of the constructs and scale items. SPSS was also used to calculate the
Cronbach alpha index; Cronbach alpha results confirmed the internal consistency
for the pilot study tests (See Appendix B). This is due to the range of .768 to .954,
which is above the minimum threshold of .70 (Nunally, 1978). Likewise, only a
total of 5 items were dropped during the pilot study results analysis (Table 3.4).
This was due to low loading below .70. Additionally, all the other items loaded
above .70.
TABLE 3. 4: Deleted Items During Pilot Study Analysis
CONSTRUCTS CREATIVE
THINKING
EXPERTISE HIERARCHY MARKET TASK
MOTIVATION
ITEMS CT10 EXP10 HRY6 MKT5 TMOT10
LOADINGS .652 .554 .342 .490 .372
3.11 Data Analysis
3.11.1 Preliminary Analysis and the Use of Partial Least Square (PLS)
Partial Least Square (PLS) is a variant-based statistical technique used in
structural equation modelling (SEM) (Lowry & Gaskin, 2014). PLS incorporates
several techniques that are relevant for estimating formative and reflective models
without inflating the t-statistics. The PLS algorithm also permits each indicator
to vary in the extent at which it contributes to the construct’s composite score.
This is important to prevent the issues of fixed scale construction (Sarstedt, Hair,

155
Ringle, Thiele, & Gudergan, 2016). PLS is also especially relevant for models
that mirror higher or latent order constructs. PLS aims to demonstrate that an
alternative hypothesis is significant and by showing significant t-values and high
R2, it thus permits the researcher to reject a null hypothesis (Lowry & Gaskin,
2014). Hence, Gefen, Straub, and Boudreau (2000), Lowry and Gaskin (2014),
and Afthanorhan (2013) advocated that it can be employed for both confirmatory
and exploratory studies.
This study’s analysis has therefore been conducted via the use of PLS
Structural Equation Modelling (SEM) and the Smart PLS software version 3. A
major reason for this is because this study estimates both a reflective and
formative model. This is in view that employee creativity examined in this study
mirrors a formative latent construct. Likewise, this study employs 3 distinct
moderators, and the Smart PLS software has been known to be designed to
facilitate easy interactions based on its product indicator approach (Fassot et al.,
2016). It is thus far more sensitive to moderator effects as it is basically better at
dealing with measurement errors (Fassot et al., 2016; Sarstedt et al., 2016).
3.11.2 Data Processing and Outliers Detection
Processing the data for this study refers to a process of data description.
This includes an evaluation of the data to ascertain if there is any issue of missing
data, scanning and editing information obtained from the questionnaire to ensure

156
information is consistent and legible (Zikmund, Babin, Carr, & Griffin, 2013).
Field (2005) espoused that a dataset may have missing values for several reasons
such as too lengthy questionnaire or deliberate act of ignoring some questions by
respondents. Nevertheless, after careful scrutiny of the dataset of this study, no
missing value was found. Hence the original sample of the dataset remained a
total of 439. Subsequently, the dataset was examined for the presence of outliers.
Outliers represent observations of extreme values that are substantially
different from the other observations Despite the level of data cleaning attention
given to the dataset, the researcher has to ensure the results are not unduly
affected by small or single set of observations. In other words, ill-fitting
observations such as outliers (Hair et al, 2010). Hair et al. (2016) highlight that
outliers can be very problematic as they can lead to model biasness. Hence they
should be recoded or removed via SEM analysis. Outliers in this study were
identified using univariate (z-scores) and multivariate detections (Mahanalobis
distance - D2). Thus respective variables were examined for standardised z score
results and z score results > 4 were deleted, since they reflected extreme
observation (Hair, Anderson, Tatham, & Black, 1998).
The dataset was further analysed by applying a multivariate detection test.
Mahanalobis distance could be generated for respective cases using SPSS
Regression analysis, including a case number that represents the dependent
variable as well as employing all non- demographic measures as independent
variables. Mahanalobis values > 3.5 signify possible multivariate outliers (Hair

157
et al., 1998). Hence, this study also shows that the dataset had no major issues of
outliers (See Appendix D).
3.11.3 Normality Analysis
To test the data for normality of distribution, the skewness and kurtosis
test was initiated. Appendix E reflects the statistical results of this data skewness
and kurtosis. In the assessment of skewness and kurtosis, values above or below
zero may indicate departures from normality. Since the range of skewness is “+/-
2” and kurtosis is “+/-3”, the skewness statistics in the data therefore represents
a low skewness. Moreover, the absolute values of skew produced is below the
required threshold which is “+-2”. Similarly, the kurtosis absolute is below the
required threshold which is “+-3” (Hair et al., 2010). Therefore, it is concluded
that there is no non-normality item in this study (See Appendix E).
3.11.4 Common Method Bias
This is also known to reflect the variance that could be attributable to the
method of measurement instead of the constructs assumed to be represented by
the measures (Podsakoff, MacKenzie, Lee, & Podsakoff, 2003). In other words,
it reflects the emergence of a single factor from the analysis of other several
factors which explains the data. However, such cases may indicate a strong
evidence that common method bias exists. Consequently, all the variables
examined in this model have been estimated in an exploratory factor analysis.

158
Thus, unrotated factor analysis has also been examined in order to determine the
total number of factors that may highlight the differences in the variables. The
results in Appendix C indicates that unrotated factor analysis accounted for an
approximated total of 67% of the total variance. Podsakoff et al. (2003) also
espoused that by assuring participants that their identities would remain
anonymous, often helps to prevent high evalution apprehension, and editing of
responses by respondents. Equally, kock (2015) advocated that when
investigating for common method bias in PLS-SEM, it is important to consider
the Variance Inflation Factor (VIF) values. The author espoused that a VIF value
greater than 3.3 is an indication of pathological collinearity, which suggests
model contamination by common method bias. Consequently, all VIF values
must be lower, or equal to 3.3, before a resolve can be made that a model is not
influenced by common method bias. VIF values of all the constructs in this study
range from 1.034 to 1.558, and this shows that all the VIF values fall much lower
than 3.3. Therefore, one can infer that the typical method of bias did not impact
participant’s responses.
3.12 Summary of Research Methodology
This research study is conducted in Nigeria. It is thus carried out to
examine the various impacts of organisational culture on employee creativity. It
also seeks to investigate the moderating effect of trustworthiness on the
relationship between the organisational culture and employee creativity. Due to
the procedure which satisfies the need to generalise the results of this study, a
quantitative research approach is utilised. Likewise, the use of stratified sampling

159
technique in this study is necessary as it would aid to efficiently partition the
population sample size into groups based on the overall representative of the
sample size.

160
CHAPTER FOUR
DATA ANALYSIS AND PRESENTATION OF FINDINGS
4.0 Overview
This section is made up of the study’s descriptive statistics and
demographic analysis respectively. It also consists of a report of findings. The
sampled respondents profile provides information on employees’ age, job
position, highest qualification, department, gender, and organisational tenure
(Table 4.1).
4.1 Background of Respondents
Table 4.1 highlight that a total of 45.8% of respondents hold management
level positions and 54.2% hold non-management level positions. Given the
difference between the holders of management and non-management positions,
it shows that holders of non-management positions have not been over
represented. A total of 31.7% of respondents are between the ages of 20 to 40
years. Respondents between the ages of 41 to 50 years reflect the highest
frequency count of 34.6%. Only 2.1% of the respondents fall between the ages of
51 to 60 years old. All the respondents consist of 52.2% of males and only 47.8%
females. This could mirror a rational that more males are employed as compared

161
to females within the Nigerian manufacturing industry. It also indicates that males
have not been overrepresented in this study, given the very little difference
between their results. It may also be because of the nature of the manufacturing
jobs.
Also, a total of 52.6% of the respondents possess a bachelor’s degree or
equivalent. This represents the highest number of respondents and their highest
qualification. For several reasons such as finances, level of brilliance, peer group
influences and so on; most employees may be more comfortable with just a
bachelor’s degree or equivalent, rather than a master’s degree. Respondents with
a master’s degree or equivalent sum up to a total of 39.4%, while respondents
with a PhD degree are a total of 4.1%. Only a total of 3.9% have a diploma or
equivalent.
Table 4. 1: Demographic Profile of the Respondents
Frequency Percent
Job
Position
Management Level
Position
201 45.8
Non-Management Level
Position
238 54.2
Total 439 100.0
Highest
Qualification
Diploma or equivalent 17 3.9
Bachelor’s degree or
equivalent 231 52.6

162
Table 4. 1: Demographic Profile of the Respondents Continued
Frequency Percent
Master’s Degree or
equivalent 173 39.4
Doctor of Philosophy
(PhD/DBA) 18 4.1
Total 439 100.0
Department Research and Development 213 48.5
Information Technology 226 51.5
Total 439 100.0
Gender Male 229 52.2.
Female 210 47.8
Total 439 100.0
Age 20-30 years’ old 139 31.7
31-40 years’ old 139 31.7
41-50 years’ old 152 34.6
51-60 years’ old 9 2.1
Total 439 100.0
Organizational
Tenure
1-10 years 254 57.9
11-20 years 141 32.1
21-30 years 44 10.0
Total 439 100.0

163
In Table 4.1, 30.1% of respondents within the manufacturing
organisations occupy management level positions, followed by a total of almost
70% of non-management level respondents. As for the percentages of
respondents working in the R&D and IT departments, 51.5% are in IT
departments and 48.5% are employees who work in R&D.
Table 4.1 further indicates that 57.9% of the respondents have worked in
in their respective manufacturing organisations for a total of 1 to 10 years. This
means a majority of employees within the manufacturing industry have at least a
total of 1 to 10 years of working experience (organisational tenure). A total of
32.1% had between 11 to 20 years’ of working in their respective manufacturing
organisations. Nevertheless, only a total of 10% of respondents have worked over
20 to 30 years with their respective manufacturing organisations. This reflects
that a minimum of respondents have at most 30 years of working for their
respective manufacturing organisations. Therefore, the degree of the quality of
results may be a reflection of level of their individual experiences, from the
duration of time spent working with their respective manufacturing companies.
4.2 Analysis of descriptive statistics of study variables
Table 4.2 suggests that at minimum, all the variables apart from
Benevolence, Clan, Expertise, and Hierarchy, have been rated as 5.00
respectively. Other variables employed for this study have been rated as 1.00.

164
Hence, at a minimum level, respondents strongly disagree to the statements
identified within all the other variables except for Benevolence, Clan, Expertise,
and Hierarchy. The mean on the other hand, shows a relatively close rate for all
the variables. All the variables range from 5.1944 to 5.9194, respectively. This
thus reflect that all the questionnaire statements that examined the variables have
been slightly agreed to. However, at a maximum level, ratings of a 7.00 indicates
that a majority of the respondents strongly agree to the statements employed to
examine all the variables of this study. With respect to the dispersion or how
spread out the variables of this study are from each other, the standard deviation
is thus considered.

165
TABLE 4. 2: Summary of Descriptive Statistics
N Minimum Maximum Mean Std. Deviation
ABILITY 439 1.00 7.00 5.6405 1.43893
ADHOCRACY 439 1.00 7.00 5.6317 1.42500
BENEVOLENCE 439 5.00 7.00 5.9071 1.57839
CLAN 439 5.00 7.00 5.9176 1.58128
CREATIVE_THINKING 439 1.00 7.00 5.2179 1.63729
EXPERTISE 439 5.00 7.00 5.8960 1.57486
HIERARCHY 439 5.00 7.00 5.9194 1.55818
INTEGRITY 439 1.00 7.00 5.6390 1.31583
MARKET 439 1.00 7.00 5.2916 1.76172
TASK_MOTIVATION 439 1.00 7.00 5.1944 1.65302
Valid N (listwise) 439
In the standard deviation column, the scores of all the variables range from
1.31583 to 1.76172. This means that these variables are dispersed evenly rather
than unevenly distributed or being so far from each other. It also suggests
normality of data dispersion as the above values are relatively close to each other.
Moreover, comparing the differences in the standard deviation with that of the
mean, the study finds that the degree of differences in both the scores of standard
deviation and the mean is very similar. Hence, there isn’t a notable difference in
the distribution of the above variables of this study.

166
4.3 Measurement and Structural Models Employed in This study
The measurement model (Outer model in PLS) describes the relationships
between a construct and its distinct measures or indicator items. This is different
from the structural model (Inner model) which specifies relationships between
constructs (Diamantopoulos et al., 2008). This study’s overall measurement and
structural models mirror the two kinds of measurement scale in structural
equation modelling (SEM). These are the formative and reflective measurement
scales (Wong, 2013). The formative measurement scale relates to a formative
sub-construct (indicator or variable) measuring an assumed cause of a latent
construct. In this regard, a latent construct is often assumed to be defined by or is
a function of its sub-constructs (Lowry & Gaskin, 2014).
Lowry and Gaskin (2014) and Wong (2013) espouse that in cases where
sub-constructs cause latent constructs or act as contributing factors for the
existence of a latent construct; such sub-constructs are considered formative
(Hence the unidimensional approach of examining the creativity of employees,
via the three distinct dimensions that predict the latent construct, employee
creativity). This is also with respect to the fact that they are not interchangeable
among themselves. In other words, the distinct sub-constructs (dimensions) of
employee creativity are causes of the latent construct employee creativity. Recall
that latent constructs or variables are phenomena of theoretical attention which
are not directly observable, but have to be assessed by other observable manifest
measures such as indicators or items (Diamantopoulos et al., 2008). Hence, it is
possible that they may have negative, positive or no correlations among each

167
other (Coltman, Devinney, Midgley, & Venaik, 2008). Wong (2013) therefore
argue that there is no need to report indicator reliability, discriminant validity and
internal consistency reliability for formative measurement scales. This is also
because latent constructs are usually made up of uncorrelated measures, thus
outer loadings, square root of Average Variance Extracted (AVE) and even
composite reliabilities are in this case meaningless (MacKenzie, Podsakoff, &
Podsakoff, 2011; Wong, 2013).
Whilst the measurement model of this study mirrors an assessment of only
reflective measurement scales (outer model), examination of the formative
measurement scales is highlighted in the structural model (inner model). In the
structural model, employee creativity is examined as a unidimensional construct.
As a formative latent construct, this would allow for predictability by all the
constructs represented in the measurement model (Hair, Ringle, & Sarstedt,
2013). Therefore, as recommended by Hair et al. (2013), this study, thus employs
the two-stage approach advocated by Ringle, Sarstedt, and Straub (2012). Ringle
et al. (2012) introduced an approach by which latent formative constructs may be
examined. The first stage involves obtaining latent variable scores for all sub-
constructs, but excluding the latent construct. The latent construct is only
estimated in the second stage which contains the structural model. In the second
stage, all sub-constructs are represented by their respective latent variable scores.
Thus, the scores of the sub-constructs (in this case, employee creativity
dimensions) then distinctively serve as manifest variables of the latent construct,
employee creativity. In this case they are fully represented and mirrored to predict
and also allow for the prediction of employee creativity, by other constructs of

168
organisational culture and trustworthiness respectively. Although another
approach known as the “repeated indicator” approach presents a plausible method
for addressing and modelling latent constructs in Smart PLS SEM (Lowry &
Gaskin, 2014; Wold, 1982).
However, the repeated indicator approach as espoused by Lowry and
Gaskin (2014) have not been used in this study. This is due to the major issue of
other constructs not been able to predict the latent formative constructs
accordingly in the measurement models, and thus creates inconsistent estimates
(Van Riel, Henseler, Kemény, & Sasovova, 2017). So in congruence to the two-
stage approach advocated by Ringle et al. (2012), the structural model has
subsequently been developed and employee creativity further examined as a
unidimensional construct. Hence, the 3 distinct employee creativity dimensions
are formative measurement indicators which predict the latent construct
employee creativity.
4.3.1. Testing the Inner Measurement Model
In assessing the measurement model fitness, the Geodesic discrepancy
(dG) and the Unweighted least squares discrepancy (dULS) are distance measures
that relate more than one way to quantify the discrepancy between two matrices
(Henseler et al., 2016). As fitting functions; when normalized, they reflect
asymptotical equivalents to ratio statistic likelihood. The dG and dULS values are
7.964 and 4.67 respectively. This supports the indication of a well-fitting

169
measurement model (Dijkstra & Henseler, 2015). According to the
recommendations of Henseler et al. (2016), the R2 values would be subsequently
estimated and analysed in the structural model. Although, the R2 values
highlighted in Figure 4.2 and Table 4.3 are have significant P-values, they are not
considered yet, since employee creativity dimensions are yet to be scored and
integrated to obtain the actual R2 value for this study.
Table 4.3: Inner Measurement Model and Assessment of Measurement Model Fit
Items Saturated Model T Statistics P-Values @ < 0.05
SRMR 0.057 32.538 0.000
R2 of CT 0.117 4.586 0.000
R2 of EX 0.117 3.343 0.001
R2 of TMOT 0.064 3.008 0.003
Note: Creative thinking (CT); Expertise (EX); Task Motivation (TMOT); Standardized root mean
square residual (SRMR)
Furthermore, as recommended by Henseler et al. (2016), to check for
overall and approximate model fit, researchers ought to consider evaluating the
estimated model of the Standardized Root Mean Square Residual (SRMR).
Considerations should be given towards an SRMR < 95% bootstrap quantile
(HI95 of SRMR). The authors also advocate that the only approximate model fit
criterion applied for PLS path modelling is known as the SRMR. Henseler (2017)
supports that it is yet the dominant approximate model fit criterion. On this note,

170
Hu and Bentler (1999) also further opined that a threshold of < 0.08 for the
SRMR, does reflect to be more tolerable for PLS path models. The SRMR results
in Table 4.3 shows that the SRMR has a value of 0.057, which falls below the
recommended threshold of < 0.08. In view of this study’s measurement model fit,
a strong support of the SRMR value which is the t-statistics value is thus
highlighted. Table 4.3 indicates an absolute size of t-statistics value of 32.538,
and it is by far beyond the minimum threshold of 1.645 (Hair, Ringle, & Sarstedt,
2011). This indicates a highly significant p-value of 0.000 at a confidence interval
of < 0.01 (even < 0.05) significance level requirement (Gelman, 2013; Henseler
et al., 2016). These results thus validate the overall measurement model of this
study and therefore indicates that the overall measurement model of this study is
highly significant and with a good fit (Henseler et al., 2016).
4.3.2. Testing the Outer Measurement Model
In this section, the measurement model would be examined to describe
the relationships between constructs and their measures respectively
(Diamantopoulos et al., 2008; Zainudin, 2012). The indicators that measure the
distinct sub-constructs mirror reflective measurement scales. This is because,
latent constructs in the reflective measurement scale exists independent of the
measures employed. Also, in reflective measurement scales, items are manifested
by the constructs; thus they share a common theme and are interchangeable
(Lorenzo, Romo, & Ruiz, 2006). Consequently, to examine this study’s outer
measurement model; Convergent Validity, Discriminant Validity and Composite
Reliability have been taken into consideration (Hair, Hult, Ringle, & Sarstedt,

171
2016). Relevant empirical tests of internal consistency, validity, reliability, factor
loadings and AVE’s are considered in Table 4.4.
This study utilised a total of 66 indicator items out of which 13 indicator
items were dropped from the measurement model. This was to further engender
model fitness and it is congruent to the rule of thumb of 20% of total number of
deleted items allowed for model specification (Hair et al., 2010; Hair et al., 2016).
These indicator items are ABI1, ABI3, ABI4, BEN2, CLAN2, CT1, CT3, EXP2,
HRY1, HRY5, ADH1, TMOT1, and TMOT3. Despite their high loadings (Figure
4.1), they yet had to be dropped. A major reason is that these items had strong
issues of standardized residuals loading less than 0.7, and multicollinearity that
thus threatened the measurement model integrity, fitness, and construct validity
(Hair et al., 2010). As supported by Hair et al. (2010, p. 682), “…the most
common change would be the deletion of an item that does not perform well with
respect to model integrity, model fit, or construct validity.” In Table 4.4, 3
indicator items have been employed to measure ABILITY and HIERARCHY
constructs respectively. The use of 3 indicators per construct is also congruent to
the recommendation of Hair et al. (2010). The authors stressed that “having three
indicators per construct is acceptable, particularly when other constructs have
more than three” (Hair et al., 2010, p. 670). This thus reflects the case of the
loadings in Table 4.4.
A total of 60 out of 300 iterations was initiated to produce the results of
factor analysis of the outer/reflective measurement model. This indicates a

172
normal data as the data obtained stable estimation. It thus relates a good
estimation since it is far below the reach of the maximum number of 300 iterations
(Wong, 2013). In Table 4.4, all indicator items reflect high and strong loadings,
reflecting their convergent validity. Indicator items range from 0.76 to 0.97; thus
exceeding the minimum preferred level of 0.7 (Sarstedt, Ringle, Smith, Reams,
& Hair, 2014; Yong & Pearce, 2013). This means that all indicative items have
significant contributions to their respective constructs. With regards to internal
consistency reliability, all the constructs employed within this study mirror high
reliability with respect to a Cronbach alpha range of > 0.914 to 0.967.
Nevertheless, extant literature suggests the use of “composite reliability” as a
measure (Hair, Sarstedt, Ringle, & Mena, 2012; Wong, 2013). Table 4.4 suggests
that the composite reliability values all reflect very high results ranging from >
0.93 to 0.97. This demonstrates very high levels of internal consistency and
reliability of the distinct sub-constructs employed in this study.
To also check for convergent validity, the Average Variance Extracted
(AVE) is examined. Table 4.4 relates that all AVE values are greater than the
minimum acceptable threshold of 0.5 (Hair et al., 2012). In this case, the study
concludes that convergent validity has been confirmed for all the sub-constructs.
In addition to this, the Fornell and Larcker (1981) criterion for assessing the
discriminant validity is represented in Table 4.5. All the AVEs in Table 4.5
reflects very high and distinct values, ranging from 0.85 to 0.94. All the AVE’s
are larger than the correlation values below them in their respective measured
sub-construct. In order words, all the loadings of each distinct measurement item
and on their respective sub-constructs, are in chronological order and larger than

173
any other loading. This study can hereby conclude that discriminant validity is
well established considering that the required guidelines have been met.
Additionally, the Heterotrait-Monotrait Ratio (HTMT) developed by Henseler,
Ringle, and Sarstedt (2015) is espoused to be a higher boundary criterion for
examining discriminant validity. As an estimate for factor correlation, the HTMT
should be significantly smaller than one; in order to evidently distinguish between
two factors (Henseler, Hubona, & Ray, 2016). Table 4.6 shows a range of 0.053
to 0.629. These figures fall significantly below the threshold of 1.0. Hence
indicating all constructs are explicitly independent of each other and that
discriminant validity is thus achieved. To further ensure that no indicator is
incorrectly assigned to the wrong construct, the cross-loadings assessment is thus
highlighted in Table 4.7. The results therefore reflect no issues of cross-loadings
as all the indicators appear to have loaded into their predicting sub-construct
respectively.
In order to also test for possible issues of multicollinearity, the VIF has
been examined. Table 4.4 shows that the constructs: expertise, creative thinking,
and task motivation, have no VIF results. This is because, the VIF addresses
issues of multicollinearity that reflects linear associations between 2 or more
explanatory (predictors) constructs in a multiple regression model (Akinwande,
Dikko, & Samson, 2015). Hair et al. (2010) stress that multicollinearity tends to
occur when there is an estimated direct relationship among 2 or more independent
variables. Results of the model VIF are thus represented in Table 4.4. A thorough
examination of all the VIF values indicates sufficient construct validity. With a
range of 1.034 to 1.558, the figures fall significantly below the maximum
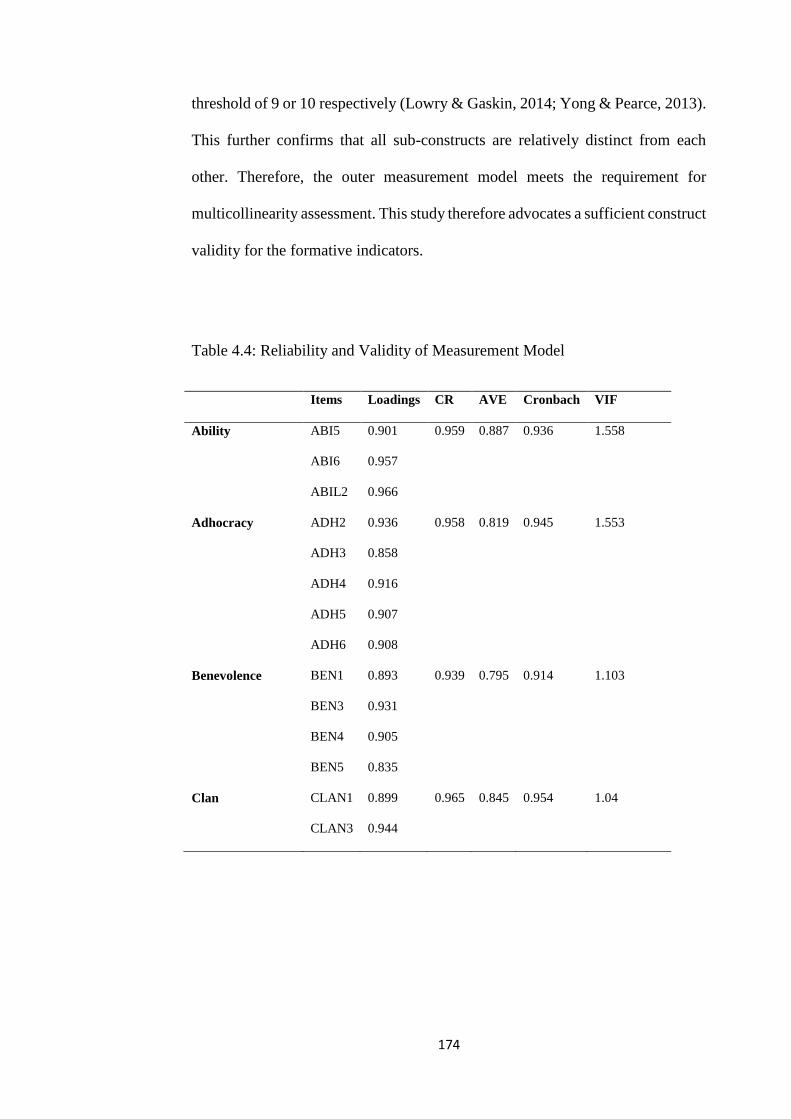
174
threshold of 9 or 10 respectively (Lowry & Gaskin, 2014; Yong & Pearce, 2013).
This further confirms that all sub-constructs are relatively distinct from each
other. Therefore, the outer measurement model meets the requirement for
multicollinearity assessment. This study therefore advocates a sufficient construct
validity for the formative indicators.
Table 4.4: Reliability and Validity of Measurement Model
Items Loadings CR AVE Cronbach VIF
Ability ABI5 0.901 0.959 0.887 0.936 1.558
ABI6 0.957
ABIL2 0.966
Adhocracy ADH2 0.936 0.958 0.819 0.945 1.553
ADH3 0.858
ADH4 0.916
ADH5 0.907
ADH6 0.908
Benevolence BEN1 0.893 0.939 0.795 0.914 1.103
BEN3 0.931
BEN4 0.905
BEN5 0.835
Clan CLAN1 0.899 0.965 0.845 0.954 1.04
CLAN3 0.944

175
Table 4.10: Reliability and Validity of Measurement Model Continued
Items Loadings CR AVE Cronbach VIF
CLAN4 0.956
CLAN5 0.852
CLAN6 0.941
Creative Thinking CT2 0.845 0.95 0.731 0.939 Endogenous
CT4 0.914
CT5 0.877
CT6 0.852
CT7 0.791
CT8 0.76
CT9 0.933
Expertise EX1 0.93 0.96 0.751 0.952 Endogenous
EX3 0.881
EX4 0.938
EX5 0.919
EX6 0.875
EX7 0.78
EX8 0.803
EX9 0.79
Hierarchy HY2 0.978 0.956 0.878 0.935 1.034
HY3 0.858
HY4 0.97

176
Table 4.10: Reliability and Validity of Measurement Model Continued
Items Loadings CR AVE Cronbach VIF
INTEGRITY INT1 0.946 0.962 0.808 0.952 1.114
INT2 0.849
INT3 0.936
INT4 0.906
INT5 0.823
INT6 0.927
MARKET MKT1 0.911 0.975 0.885 0.967 1.056
MKT2 0.944
MKT3 0.907
MKT4 0.972
MKT6 0.966
TASK MOTIVATION TMOT2 0.914 0.951 0.734 0.942 Endogenous
TMOT4 0.856
TMOT5 0.834
TMOT6 0.83
TMOT7 0.875
TMOT8 0.859
TMOT9 0.824
Source: Data Processing SmartPLS 3 (2017)

177
FIGURE 4. 1: Initial Measurement Model Showing the Factor Loadings

178
FIGURE 4. 2: Final Measurement Model

179
Table 4.5: Fornell-Larcker (1981) Criterion for examining Discriminant Validity (Diagonal elements are square roots of the AVE)
ABI ADH BEN CLAN CT EX HY INT MKT TMOT
ABI 0.942
ADH 0.589 0.905
BEN 0.158 0.123 0.892
CLAN -0.024 -0.003 -0.017 0.919
CT 0.09 0.13 0.226 -0.166 0.855
EX 0.139 0.103 -0.019 -0.18 0.023 0.867
HY 0.06 0.013 -0.069 0.048 -0.045 0.201 0.937
INT 0.079 0.083 0.239 -0.141 0.131 0.167 0.106 0.899
MKT -0.083 -0.135 -0.115 0.131 -0.219 -0.124 0.049 -0.128 0.941
TMOT -0.057 0.004 0.012 -0.2 0.219 0.149 0.01 0.139 0.025 0.857
Note: ABI (Ability); ADH (Adhocracy); BEN (Benevolence); CT (Creative thinking); EX (Expertise); INT (Integrity); MKT (Market); TMOT (Task
motivation).
Source: Data Processing SmartPLS 3 (2017)

180
Table 4.6: The Heterotrait-Monotrait Ratio (HTMT) Criterion for examining Discriminant Validity
ABI ADH BEN CLAN CT EX HY INT MKT TMOT
ABI
ADH 0.629
BEN 0.17 0.134
CLAN 0.033 0.037 0.044
CT 0.094 0.139 0.225 0.181
EX 0.147 0.109 0.108 0.191 0.063
HY 0.067 0.022 0.074 0.059 0.055 0.183
INT 0.083 0.086 0.256 0.147 0.144 0.179 0.105
MKT 0.086 0.141 0.12 0.136 0.222 0.132 0.053 0.133
TMOT 0.071 0.04 0.068 0.19 0.253 0.192 0.077 0.138 0.053
Note: Ability (ABI); Adhocracy (ADH); Benevolence (BEN); Clan (CLAN); Creative Thinking Styles (CT); Expertise (EX); Hierarchy (HY); Integrity (INT);
Market (MKT), and Task Motivation (TMOT)
Source: Data Processing SmartPLS 3 (2017)

181
Table 4.7: Cross-loadings
ABI ADH BEN CLAN CT EX HY INT MKT TMOT
ABI5 0.901 0.532 0.132 0.005 0.037 0.124 0.083 0.072 -0.056 -0.067
ABI6 0.957 0.548 0.15 -0.037 0.123 0.129 0.041 0.074 -0.085 -0.031
ABIL2 0.966 0.582 0.163 -0.031 0.085 0.139 0.052 0.077 -0.09 -0.066
ADH2 0.592 0.936 0.118 -0.019 0.095 0.131 0.041 0.071 -0.131 0.003
ADH3 0.579 0.858 0.152 0.008 0.072 0.107 0.015 0.068 -0.116 -0.057
ADH4 0.505 0.916 0.115 -0.032 0.13 0.117 0.018 0.088 -0.123 0.035
ADH5 0.45 0.907 0.078 0.008 0.137 0.059 -0.006 0.076 -0.125 0.039
ADH6 0.554 0.908 0.099 0.033 0.147 0.048 -0.013 0.069 -0.117 -0.018
BEN1 0.137 0.098 0.893 -0.04 0.23 0.081 -0.082 0.241 -0.119 0.057
BEN3 0.162 0.115 0.931 0.002 0.198 -0.068 -0.049 0.187 -0.106 -0.01
BEN4 0.107 0.098 0.905 -0.002 0.187 0.006 -0.075 0.234 -0.103 0.017
BEN5 0.157 0.129 0.835 -0.014 0.186 -0.102 -0.036 0.188 -0.081 -0.029
CLAN1 -0.014 -0.042 -0.057 0.899 -0.163 -0.167 0.066 -0.17 0.123 -0.188
CLAN3 -0.022 -0.016 -0.029 0.944 -0.152 -0.16 0.044 -0.133 0.118 -0.183
CLAN4 -0.01 0.001 -0.011 0.956 -0.16 -0.17 0.038 -0.135 0.133 -0.196
CLAN5 -0.021 0.046 0.046 0.852 -0.152 -0.177 0.021 -0.065 0.106 -0.191
CLAN6 -0.049 -0.002 -0.028 0.941 -0.13 -0.149 0.051 -0.144 0.12 -0.155
CT2 0.029 0.069 0.252 -0.128 0.845 0.071 -0.012 0.122 -0.189 0.156
CT4 0.049 0.112 0.216 -0.145 0.914 0.084 -0.024 0.119 -0.19 0.267
Note: Ability (ABI, ABIL); Adhocracy (ADH); Benevolence (BEN); Creative Thinking Styles
(CT); Expertise (EX)

182
Table 4.13: Cross-loadings Continued
ABI ADH BEN CLAN CT EX HY INT MKT TMOT
CT5 0.116 0.118 0.259 -0.128 0.877 0.001 -0.066 0.089 -0.226 0.087
CT6 0.075 0.124 0.217 -0.118 0.852 -0.024 -0.052 0.061 -0.235 0.049
CT7 0.112 0.134 0.046 -0.186 0.791 -0.049 -0.034 0.152 -0.117 0.288
CT8 0.07 0.132 0.036 -0.197 0.76 -0.035 -0.028 0.142 -0.117 0.315
CT9 0.096 0.107 0.226 -0.131 0.933 0.054 -0.049 0.133 -0.194 0.246
EX1 0.127 0.113 -0.035 -0.172 0.038 0.93 0.173 0.167 -0.119 0.149
EX3 0.111 0.096 0.052 -0.173 0.041 0.881 0.086 0.173 -0.138 0.127
EX4 0.124 0.098 -0.065 -0.14 0.016 0.938 0.307 0.152 -0.098 0.145
EX5 0.107 0.109 -0.052 -0.156 0.03 0.919 0.19 0.149 -0.119 0.153
EX6 0.137 0.111 -0.039 -0.16 -0.01 0.875 0.199 0.152 -0.09 0.123
EX7 0.109 0.089 0.178 -0.166 0.075 0.78 -0.027 0.181 -0.129 0.126
EX8 0.127 0.035 -0.032 -0.161 0.004 0.803 0.174 0.104 -0.095 0.104
EX9 0.125 0.057 -0.032 -0.138 -0.009 0.79 0.167 0.1 -0.094 0.101
HY2 0.062 0.022 -0.059 0.05 -0.031 0.24 0.978 0.123 0.048 0.03
HY3 0.06 0.003 -0.057 0.081 -0.067 0.087 0.858 0.066 0.047 -0.034
HY4 0.049 0.004 -0.078 0.022 -0.047 0.185 0.97 0.092 0.045 0.007
INT1 0.083 0.079 0.224 -0.139 0.115 0.161 0.109 0.946 -0.144 0.116
INT2 0.058 0.053 0.205 -0.075 0.112 0.122 0.063 0.849 -0.072 0.157
INT3 0.068 0.084 0.222 -0.153 0.119 0.16 0.104 0.936 -0.135 0.103
INT4 0.074 0.095 0.211 -0.176 0.14 0.149 0.103 0.906 -0.125 0.145
INT5 0.067 0.055 0.187 -0.057 0.103 0.135 0.074 0.823 -0.067 0.142
Note: Ability (ABI, ABIL); Adhocracy (ADH); Benevolence (BEN); Creative Thinking Styles
(CT); Expertise (EX)

183
Table 4.13: Cross-loadings Continued
ABI ADH BEN CLAN CT EX HY INT MKT TMOT
INT6 0.074 0.078 0.239 -0.15 0.116 0.175 0.119 0.927 -0.143 0.082
MKT1 -0.085 -0.154 -0.133 0.12 -0.208 -0.101 0.034 -0.109 0.911 0.096
MKT2 -0.073 -0.15 -0.113 0.124 -0.215 -0.146 0.033 -0.126 0.944 0.013
MKT3 -0.079 -0.124 -0.043 0.127 -0.194 -0.103 0.041 -0.11 0.907 -0.012
MKT4 -0.072 -0.104 -0.121 0.125 -0.211 -0.104 0.068 -0.127 0.972 0.001
MKT6 -0.083 -0.102 -0.126 0.119 -0.201 -0.126 0.057 -0.128 0.966 0.017
TMOT2 -0.067 0.002 0.044 -0.227 0.153 0.042 -0.039 0.133 -0.001 0.914
TMOT4 -0.021 0.029 -0.026 -0.099 0.242 0.263 0.072 0.102 0.045 0.856
TMOT5 -0.05 0.015 -0.049 -0.108 0.137 0.229 0.088 0.082 0.057 0.834
TMOT6 -0.051 -0.007 -0.076 -0.084 0.133 0.249 0.088 0.078 0.092 0.83
TMOT7 -0.11 -0.022 0.024 -0.212 0.128 0.037 -0.037 0.124 0.007 0.875
TMOT8 -0.019 0.007 0.072 -0.243 0.264 0.023 -0.057 0.164 -0.017 0.859
TMOT9 0.006 0.013 0.006 -0.119 0.279 0.256 0.057 0.108 0.025 0.824
Note: Expertise (EX); Hierarchy (HY); Integrity (INT); Market (MKT) and Task Motivation
(TMOT).
4.4. Structural Model
The structural model consists of and highlights the relationship between
endogenous and exogenous constructs. It examines the relationships between
the latent construct and other sub-constructs. Although, it is usually assumed
that the relationships that may exist between constructs are linear (Henseler et

184
al., 2016). In view of this study’s hypotheses, the path model is highlighted in
Figure 4.3a. Following from the measurement model highlighted in Figure 4.2,
all the sub-constructs examined in this section are made up of their respective
Latent Variable Scores (LVS). Employee creativity is made up of results of the
computed latent variable scores of all its 3 formative sub-constructs. As earlier
opined, and in congruence to the recommendations of Ringle et al. (2012), and
Hair et al. (2013), employee creativity is only introduced in the structural
model. Employee creativity is distinctively made up of an integration of all its
formative sub-constructs’ LVS measurement items. In view of the “two-stage
approach” and recommendations of Ringle et al. (2012) and Ringle et al.
(2015); the development and t-values assessments of all path analysis for this
study is thus engineered (Figure 4.3a, Table 4.8).

185
FIGURE 4. 3a: The Structural Model and Respective Path Coefficients

186
4.5. Guidelines for Hypothesis Analysis
4.5.1. Acceptable Criteria for This Study’s Statistical Analysis
The test results of all the hypotheses of this study in this section have
been obtained by testing all the hypotheses with the recommended
bootstrapping technique, accessible in Ringle, Wende, and Becker (2015)
SmartPLS 3 software. Note that PLS path modelling tests of model fit does
rely on the bootstrapping option in order to determine the likelihood of gaining
a divergence between the model-implied and empirical correlation matrix
(Henseler et al., 2016). To test for all moderation effects, direct effects and
effect sizes, the SMARTPLS 3 bootstrapping have been employed at a 5000
bootstrap subsamples. This is because of its high degree of accuracy in the
testing of significance of path coefficients, by estimating standard errors for
the estimates. It is also because it is tractable with respect to computation time
as it allows for a common resolve of empirical bootstrap confidence intervals
(Fassott et al., 2016; Henseler et al., 2016).
As recommended by Hair et al. (2013), the moderators examined in this
study has been estimated distinctively. The authors stress on first, the
estimation of the main effects in the PLS structural model; followed by a
subsequent moderation analysis which includes the product term(s) and its
interaction effect(s). The authors further emphasize that this is expedient for
avoiding common mistakes of confounding both main and the simple effects.
Similarly, in the case of multiple moderators, the authors accentuate the
analysis of one moderator at a time, to maintain results consistency and

187
interpretability. Therefore, estimation of each moderating effects of Ability,
Benevolence and Integrity on the impact of each organisational culture
dimensions on employee creativity, is initiated separately.
In examining the total of 19 hypotheses investigated in this study, 5
different categories consisting of several hypotheses relative to their distinct
assessments have been highlighted. Group one relates the different effects of
organisational culture dimensions on employee creativity; thus providing
valuable information to the research question (Are there any relationships
between organisational culture dimensions and employee creativity?) of this
study. The second group of hypotheses investigates the effect of
trustworthiness on employee creativity. This is also to provide useful findings
to the 2nd research question (Are there any relationships between
trustworthiness dimensions and employee creativity?) of this study. The third,
fourth and fifth groups examines the moderating effects of Ability,
Benevolence, and Integrity on the impact of all 4 organisational culture
dimensions on employee creativity, respectively. This is to provide valid
insights to the 3rd, 4th, and 5th research questions (How does ability moderate
the impact of organisational culture dimensions on employee creativity? How
does benevolence moderate the impact of organisational culture dimensions on
employee creativity and how does integrity moderate the impact of
organisational culture dimensions on employee creativity?) of this study.
Therefore, as contained in Table 4.8, results of the 1st group are highlighted

188
along with the overall and approximate model fit index and path coefficients
of this study.
Table 4.8: Model Fit Index and Structural Model Path Coefficients
MODEL FIT INDEX Original
Sample (O)
T Statistics P-Values
@ < 0.05
Decision
SRMR 0.061 10.316 0.000 Significant
R2 0.255 3.267 0.001 Significant
Adjusted R2 0.242 3.062 0.002 Significant
CONSTRUCTS IN
STRUCTURAL MODEL
Path
Coefficient
Effect Size
(f2)
T Statistics P-Values
@ < 0.1
Decision
ABILITY -> EMPLOYEE
CREATIVITY
0.120 0.019 1.831 0.067 Supported
ADHOCRACY ->
EMPLOYEE CREATIVITY
0.372 0.084 1.891 0.059 Supported
BENEVOLENCE ->
EMPLOYEE CREATIVITY
0.148 0.026 2.542 0.011 Supported
CLAN -> EMPLOYEE
CREATIVITY
-0.166 0.035 2.652 0.008 Not Supported
(Significant / -)

189
Table 4.8: Model Fit Index and Structural Model Path Coefficients Continued
CONSTRUCTS IN
STRUCTURAL MODEL
Path
Coefficient
Effect Size
(f2)
T Statistics P-Values
@ < 0.1
Decision
HIERARCHY ->
EMPLOYEE CREATIVITY
0.048 0.003 0.748 0.454 Not supported
(Not
Significant)
INTEGRITY -> EMPLOYEE
CREATIVITY
0.145 0.025 3.537 0.000 Supported
MARKET -> EMPLOYEE
CREATIVITY
-0.424 0.107 3.105 0.002 Supported
4.5.2. Model Fit Assessment
In assessing for estimated model fit of this study, Henseler et al. (2016)
advocates an overall guide for reporting model fit in PLS. The authors stress
that researchers should endeavour to highlight the results of the dG, dULS, R2,
and SRMR. The values for both the dG and the dULS are 9.678 and 12.116
respectively. These values reflects an indication of a well-fitting structural
model for this study (Dijkstra & Henseler, 2015). The R2 and adjusted R2
highlighted in Table 4.8 suggests a value of 0.255 and 0.242 respectively. This
relates a 25% and 24% adjusted level of variance of EC that could be explained
by all the other sub-constructs examined in this study. The adjusted R2 takes
into consideration, sample size and the complexity of a model. It therefore, aids
the explanatory power of a model identified across several data sets (Fassot et
al., 20116). Although, Hair, William, Barry, and Rolph (2010) espouse that as

190
a coefficient of determination, a 0.75, 0.5, and a 0.25 R2 reflects a very strong,
strong and weak R2 respectively. Chin (1998) also suggested that R2 of 0.67,
0.33, and 0.19 indicates a strong, moderate and weak R2 respectively.
Despite the several R2 fit assessments advocated by studies, Recall that
Hair et al. (2013) opine that an acceptable R2 level is contingent upon the kind
of research context in question. Fassot et al. (2016) argue that more concern
for statistical significance ought to be given utmost consideration when
investigating scientific inquiries. Hence, the t-statistical value of the final
overall model of this study’s R2 and adjusted R2 are 3.267 and 3.062
respectively. These values do exceed by a far margin, the t-statistics value cut
off of > 1.96 (Fassott et al., 2016; Lowry & Gaskin, 2014). Additionally, this
indicates a highly significant p-value of 0.001 and 0.002 at a < 0.05 confidence
interval (Gelman, 2013). Hence, regardless of the levels of both R squares
represented in Table 4.8, they yet reflect very strong statistical significance.
This therefore mirrors the degree of significance of the variance that could be
explained by the distinct sub-constructs.
Furthermore, as recommended by Henseler et al. (2016), to check for
overall, and approximate model fit, researchers ought to consider evaluating
the SRMR. Considerations should be given towards an SRMR < 95% bootstrap
quantile (HI95 of SRMR). The SRMR results in Table 4.8 shows that the
SRMR has a value of 0.061, which falls below the recommended threshold of
< 0.08 (Hu & Bentler, 1999). In view of this study’s model fit, a strong support

191
of the SRMR value that is the t-statistics value of the SRMR, is thus
highlighted. Table 4.8 indicates an absolute size of t-statistics value of 10.316,
and it is by far beyond the minimum threshold of 1.645. This indicates a highly
significant p-value of 0.000 at a confidence interval of < 0.01 significance level
requirement (Gelman, 2013; Henseler et al., 2016). These results thus validate
the overall model fit of this study and therefore indicates that the overall model
fit of this study has a highly significant and adequate fit (Henseler et al., 2016).
4.5.3. Hypotheses Testing.
4.5.3.1. Effect of organisational culture dimensions on employee
creativity
H1: Clan organisational culture has a positive impact on employee
creativity.
The t-statistics results of path coefficient in Table 4.8 suggests that clan
organisational culture has a significant negative (rather than the initial
hypothesised positive) impact on employee creativity. This is with regards to
the negative path coefficient of -0.166. Also, to know to what extent at which
organisational culture negatively impacts employee creativity, the effect size
(f2) is considered (Table 4.8). Recall that Wong (2013), opined that the effect
size of 0.02, 0.15, and 0.35 respectively suggests a small, medium and large
effect. The effect size result therefore indicates that clan organisational culture
has a small negative effect of 0.035 on employee creativity. The effect size is

192
thus significantly negative with respect to its highlighted t-statistics and p-
values of 2.652 and 0.008 (significant at a < 0.5 confidence interval)
respectively. This study therefore concludes that clan organisational culture
has a small and significantly negative effect on employee creativity within the
Nigerian manufacturing industry.
H2: Adhocracy organisational culture has a positive impact on
employee creativity.
The t-statistics result of path coefficient in Table 4.8 suggests that
adhocracy organisational culture has a significant positive impact on employee
creativity. This supports and confirms the already hypothesised relationship of
adhocracy organisational culture impact on employee creativity. This is also
with regards to the positive path coefficient of 0.372. The effect size that
reflects the extent at which adhocracy organisational culture impacts employee
creativity is 0.084. This suggests a small effect as well (Wong, 2013) and
further indicates that adhocracy organisational culture has a small and
significantly positive effect on employee creativity. It is thus significantly
negative with respect to its highlighted t-statistics and p-values of 1.891 and
0.059 (significant at < 0.1 confidence interval) respectively. Studies also
recommend the confidence interval level of < 0.1 for scientific research as it
explains 90% variance of the examined phenomenon (Carlo, Gaskin, Lyytinen,
& Rose, 2014; Filho et al., 2013; Gelman, 2013). This therefore confirms the
H2 of this study as it can now be concluded that adhocracy organisational

193
culture has a significant positive impact on employee creativity within the
Nigerian manufacturing industry. It also supports the findings of extant
literature that have suggested that organisational culture has a positive impact
on employee creativity (Amiri et al., 2014; Karamipour et al., 2015)
H3: Market organisational culture has a negative impact on employee
creativity.
The t-statistics result of path coefficient in Table 4.8 suggests that
market organisational culture has a significant negative impact on employee
creativity. This supports and confirms the already hypothesised relationship of
market organisational culture impact on employee creativity. This is also with
regards to the negative path coefficient of -0.424. The effect size that reflects
the extent at which market organisational culture impacts employee creativity
is 0.107. This suggests a moderate or medium effect (Lowry & Gaskin, 2014;
Wong, 2013) and further indicates that market organisational culture has a
medium and significantly negative effect on employee creativity. It is thus
significantly negative with respect to its highlighted t-statistics and p-values of
3.105 and 0.002 (significant at < 0.05 confidence interval) respectively. It
could therefore be concluded that market organisational culture has a medium
and significantly negative effect on employee creativity within the Nigerian
manufacturing industry.

194
H4: Hierarchy organisational culture has a negative impact on
employee creativity.
The t-statistics results of path coefficient in Table 4.8 suggests that
hierarchy organisational culture has a positive but not significant
(disconfirming the initial hypothesised relationship) impact on employee
creativity. This is with regards to the positive path coefficient of 0.048. Also,
to know to what extent at which hierarchy organisational culture positively
impacts employee creativity, the effect size (f2) is considered (Table 4.8). The
effect size result of 0.003, therefore indicates hierarchy organisational culture
has no effect on employee creativity. The effect size is thus not significant with
respect to its highlighted t-statistics and p-values of 0.748 and 0.454 (higher
than the threshold of a < 0.1 confidence interval) respectively. This study
therefore concludes that hierarchy organisational culture has a no effect and no
statistical significance. Therefore, it neither contributes to, nor negatively
impact the improvement of employee creativity within the Nigerian
manufacturing industry.
4.5.3.2. Effect of trustworthiness dimensions on employee creativity
H5: Ability has a positive impact on employee creativity.

195
The t-statistics result of path coefficient in Table 4.8 suggests that
ability has a significant positive impact on employee creativity. This supports
and confirms the already hypothesised relationship of the impact of ability on
employee creativity. This is also with regards to the positive path coefficient
of 0.120. The effect size that reflects the extent at which ability impacts
employee creativity is 0.019; approximately 0.02. This suggests a small effect
as well (Wong, 2013) and further indicates that ability has a small and
significantly positive effect on employee creativity. It is thus significantly
positive with respect to its highlighted t-statistics and p-values of 1.831 and
0.067. This reflects a significance of < 0.1 confidence interval respectively
(Carlo et al., 2014; Filho et al., 2013; Gelman, 2013). This therefore confirms
the H5 of this study as it can now be concluded that ability has a significant
positive impact on employee creativity within the Nigerian manufacturing
industry.
H6: Benevolence has a positive impact on employee creativity.
The t-statistics result of path coefficient in Table 4.8 suggests that
Benevolence also has a significant positive impact on employee creativity. This
supports and confirms the already hypothesised relationship of the impact of
benevolence on employee creativity. This is also with regards to the positive
path coefficient of 0.148. The effect size that reflects the extent at which
benevolence impacts EC is 0.026. This implies a small effect as well (Wong,
2013) and further indicates that benevolence has a small and significant

196
positive effect on EC. It is thus significantly positive with respect to its
highlighted t-statistics and p-values of 2.542 and 0.011. This reflects a
significance of < 0.05 confidence interval respectively (Carlo et al., 2014; Filho
et al., 2013; Gelman, 2013). This therefore confirms the H6 of this study and
can now be concluded that benevolence has a significant positive impact on
employee creativity within the Nigerian manufacturing industry.
H7: Integrity has a positive impact on employee creativity.
The t-statistics result of path coefficient in Table 4.8 also points out that
integrity has a significant positive impact on employee creativity. This supports
and confirms the already hypothesised relationship of the impact of integrity
on employee creativity. This is also with regards to the positive path coefficient
of 0.145. The effect size that reflects the extent at which integrity impacts EC
is 0.025. This implies a small effect (Wong, 2013) and also further shows that
integrity has a small and significant positive effect on employee creativity. It
is thus significantly positive with respect to its highlighted t-statistics and p-
values of 3.537 and 0.000 respectively. This thus reflects a significance level
of < 0.001 confidence interval (Carlo et al., 2014; Filho et al., 2013; Gelman,
2013). This therefore confirms the H7 of this study and can now be concluded
that integrity has a significant positive impact on employee creativity within
the Nigerian manufacturing industry.

197
Table 4.9 also shows the moderating path coefficients and effects sizes
of ability, benevolence and integrity in this study (Please see Appendix L for
their respective moderating models).

198
Table 4.9: Moderating Path Coefficients and Effects sizes of Ability,
Benevolence and Integrity.
VARIABLES PE T-Statistics
(|O/STDEV|)
P-Values
@ < 0.05
Effect
Size
(f2)
SRMR Decision
MODERATING EFFECT OF
ABILITY
0.000
ADHOCRACY -> EMPLOYEE
CREATIVITY
-0.331 3.276 0.001 0.180 Supported
CLAN -> EMPLOYEE
CREATIVITY
0.033 0.470 0.639 0.001 Not
Supported
HIERARCHY -> EMPLOYEE
CREATIVITY
-0.063 0.770 0.441 0.005 Not
Supported
MARKET -> EMPLOYEE
CREATIVITY
0.428 3.836 0.000 0.173 Supported
MODERATING EFFECT OF
BENEVOLENCE
0.000
ADHOCRACY -> EMPLOYEE
CREATIVITY
-0.488 5.117 0.000 0.307 Supported
CLAN -> EMPLOYEE
CREATIVITY
0.078 0.997 0.319 0.011 Not
Supported
HIERARCHY -> EMPLOYEE
CREATIVITY
-0.216 3.815 0.000 0.079 Supported
MARKET-> EMPLOYEE
CREATIVITY
0.369 5.136 0.000 0.181 Supported
Note: PE (Point estimates)

199
Table 4.9: Moderating Path Coefficients and Effects sizes of Ability,
Benevolence and Integrity Continued.
VARIABLES PE T-Statistics
(|O/STDEV|)
P-Values
@ < 0.05
Effect
Size
(f2)
SRMR Decision
MODERATING EFFECT OF
INTEGRITY.
0.000
ADHOCRACY -> EMPLOYEE
CREATIVITY
-0.475 3.235 0.001 0.191 Supported
CLAN -> EMPLOYEE
CREATIVITY
0.152 2.361 0.018 0.034 Supported
HIERARCHY -> EMPLOYEE
CREATIVITY
-0.122 2.640 0.008 0.020 Supported
MARKET-> EMPLOYEE
CREATIVITY
0.537 4.295 0.000 0.162 Supported
Note: PE (Point estimates)
4.5.3.3. Moderating effect of Ability
H8: Ability moderates the impact of adhocracy organisational culture
on employee creativity.
To explore the nature of the moderation, an interaction graph is shown
in Figure 4.4. Figure 4.4. mirrors a disordinal interaction. This is because
disordinal interactions indicates that a factor has a particular kind of an effect

200
in a defined condition, and a different kind of effect in another condition
(Widaman, et al., 2012). Given a -0.331 point estimate (Table 4.15), Figure
4.4. suggests that ability inverts the positive relationship between adhocracy
organisational culture and employee creativity. It also highlights that
adhocracy organisational culture has a weak simple effect on employee
creativity and ability has a pronounced moderating effect on this relationship.
Consequently, this means that in a condition where ability is low, an increase
by 1 standard deviation (SD) in ability, would lead to an increase in employee
creativity, and vice versa. Contrary to conventional expectations, one may
think the higher the ability employed; the higher the chances of increase in
creativity.
The reverse of such notion is the case in Figure 4.4 and plausible
reasons have been subsequently discussed. However, in Table 4.9, the t-
statistics value 3.276, relating the moderating effect of ability suggests a
significant moderating effect on the impact of adhocracy organisational culture
on employee creativity. As reported in Table 4.9, the moderating effect size of
ability on this relationship is 0.180. This value reflects the amount of change
in employee creativity if ability is increased by 1 and adhocracy organisational
culture remains constant. Although the effect size mirrors a medium
moderating effect of ability on the impact of adhocracy organisational culture
on employee creativity, it still does have very important value and relay vital
contribution to this study’s model (Fassott et al., 2016).

201
The results as highlighted in Table 4.9, relates a highly significant p-
value of 0.001 at a confidence interval of < 0.01 significance level (Gelman,
2013). This also confirms the H9 of this study; as it can now be concluded that
ability moderates the impact of adhocracy organisational culture on employee
creativity. Moreover, a negative moderating effect could therefore imply that
in Nigerian manufacturing industries, the higher the ability of top management
leaders operating under adhocracy organisational culture, the less improved
their employee creativity could become and vice versa. In other words, while
adhocracy organisational culture remains constant; an increase in top
management’s ability, could mean a slight decrease in employee creativity.
Therefore, to engender employee creativity, top management leaders of
manufacturing organisations operating an adhocracy organisational culture,
would have to consider maintaining their current state of ability. It could be
advised that more resources be committed towards regulating and ensuring that
the present condition of top management’s abilities are otherwise relatively
constant.

202
Note: Green line (High Ability); Blue line (Ability at Mean); Red line (Low Ability)
Figure 4.4: Moderating effect of ability on the impact of adhocracy organisational culture on employee creativity

203
H9: Ability moderates the impact of clan organisational culture on
employee creativity.
Figure 4.5 shows a disordinal interaction which reflects that ability
nullifies the negative effect of clan organisational culture on employee
creativity. It also indicates a less pronounced moderating effect on this
relationship. In Table 4.9, the t-statistics value relating the moderating effect
of ability suggests that it has no statistically significant effect on the impact of
clan organisational culture on employee creativity. This is with respect to the
t-statistics value of 0.470, which falls way below the recommended > 1.96
threshold (Lowry & Gaskin, 2014). At a p-value of 0.639, it is higher than the
minimum threshold of < 0.1 confidence interval. Therefore, the moderating
effect of ability in this case is thus not significant. As reported in Table 4.9, the
moderating effect size of ability on this relationship is 0.001. This signifies that
ability also has no effect in this relationship as it falls below the minimum
threshold of > 0.02 (Wong, 2013). This value also reflects only a 0.001 amount
of change in employee creativity if ability is increased by 1 and clan
organisational culture remains constant. Therefore, this study can conclude that
ability does not moderate the impact of the clan organisational culture on
employee creativity within the Nigerian manufacturing industry. With no
statistical significance, ability thus, plays no moderating role in this
relationship.

204
Note: Green line (High Ability); Blue line (Ability at Mean); Red line (Low Ability)
Figure 4.5: Moderating effect of ability on the impact of clan organisational culture on employee creativity

205
H10: Ability moderates the impact of market organisational culture on
employee creativity.
Figure 4.6, shows the nature of the moderation for H10. It relates a
disordinal interaction as well. With a point estimate 0.428 (Table 4.9), Figure
4.6 suggests that ability inverts or dampens the negative effect of market
organisational culture on employee creativity. It also highlights that market
organisational culture has a weak simple effect on employee creativity and
ability has a pronounced moderating effect on this relationship. This also
signifies that in a condition where ability is low, an increase by 1 standard
deviation (SD) unit in ability, would lead to a positive improvement in
employee creativity. Similarly, a decrease by 1 SD unit in ability would cause
a decline in the level of employee creativity in another condition. In Table 4.9,
the t-statistics value 3.836, relating the moderating effect of market
organisational culture also suggests a strong and positive moderating effect on
the impact of market organisational culture on employee creativity.
As reported in Table 4.9, the moderating effect size of ability on this
relationship is 0.173. This value reflects the amount of change in employee
creativity if ability is increased by 1 SD and market organisational culture
remains constant. Although the effect size mirrors a medium moderating effect
of ability on the impact of market organisational culture on employee
creativity, it still does have very important value and relay vital contribution to
this study’s model (Fassott et al., 2016). On this note, Lowry and Gaskin (2014)

206
accentuate that even small interaction terms which appear significant are vital
and they contribute a certain degree of relevance to a model. The results as
highlighted in Table 4.9, relates a highly significant p-value of 0.000 at a
confidence interval of < 0.001 significance level (Gelman, 2013). This also
confirms the H10 of this study, as it can now be concluded that ability has a
positive and highly significant moderating effect on the impact of market
organisational culture on employee creativity.
It therefore infers that in Nigerian manufacturing industries, the higher
the ability of top management leaders operating under market organisational
culture, the more engendered their employee creativity could become and vice
versa. In other words, while market organisational culture remains constant; an
increase in top management’s ability, would mean an increase in employee
creativity. Therefore, to engender employee creativity, top management
leaders of manufacturing organisations operating a market organisational
culture, would have to consider increasing their current state of ability. It could
be advised that more resources be committed towards increasing top
management’s ability and to also ensure it is facilitated by a market
organisational culture. Consideration regarding the extent of increase in ability,
should likewise be inferred based on the effect size of ability’s moderating
effect on the impact of market organisational culture on employee creativity.

207
Note: Green line (High Ability); Blue line (Ability at Mean); Red line (Low Ability)
Figure 4.6: Moderating effect of ability on the impact of market organisational culture on employee creativity

208
H11: Ability moderates the impact of hierarchy organisational culture
on employee creativity.
Figure 4.7 indicates that ability nullifies the positive relationship
between hierarchy organisational culture and employee creativity. In view of
the disordinal interaction, Figure 4.7 also suggests that ability has a less
pronounced moderating effect on this relationship. However, in Table 4.9, the
t-statistics value relating the moderating effect of ability suggests that this
moderating effect on the impact of hierarchy organisational culture on
employee creativity is statistically insignificant. This is with respect to the t-
statistics value of 0.770, which falls way below the recommended < 1.96
threshold (Lowry & Gaskin, 2014). At a p-value of 0.441 with a > 0.1
confidence interval, ability in this case is therefore not significant. As reported
in Table 4.8, the moderating effect size of ability on this relationship is 0.005.
This signifies that ability also has no effect in this relationship as it falls below
the minimum threshold of > 0.02 (Wong, 2013). This value also reflects only
a 0.001 amount of change in employee creativity if ability is increased by 1
and hierarchy organisational culture remains constant. Therefore, this study
can conclude that ability has no statistically significant effect on the impact of
hierarchy organisational culture on employee creativity within the Nigerian
manufacturing industry. With no statistical significance, ability thus plays no
moderating role in this relationship.

209
Note: Green line (High Ability); Blue line (Ability at Mean); Red line (Low Ability)
Figure 4.7: Moderating effect of ability on the impact of hierarchy organisational culture on employee creativity

210
4.5.3.4. Moderating effect of benevolence
H12: Benevolence moderates the impact of clan organisational culture
on employee creativity.
Figure 4.8 shows an ordinal interaction which indicates that
benevolence inverts the negative effect of clan organisational culture on
employee creativity. Interactions are regarded as ordinal when an independent
variable appears to have more of an effect in a particular condition of an
additional independent variable, under another condition (Widaman, et al.,
2012). However, in Table 4.9, the t-statistics value relating the moderating
effect of benevolence, suggests that this moderating effect on the impact of
clan organisational culture on employee creativity is statistically insignificant.
This is with respect to the t-statistics value of 0.997, which falls way below the
recommended < 1.96 threshold (Lowry & Gaskin, 2014).
At a p-value of 0.319 with a > 0.1 confidence interval, benevolence in
this case is also not significant. As reported in Table 4.9, the moderating effect
size of benevolence on this relationship is 0.011. This signifies that
Benevolence also has no effect in this relationship as it falls below the
minimum threshold of > 0.02 (Wong, 2013). This value also reflects only a
0.011 amount of change in employee creativity if ability is increased by 1 and
clan organisational culture remains constant. Although an interaction seems to

211
have occurred in Figure 4.9; it is yet statistically insignificant. Therefore, with
no statistical significance, benevolence thus plays no moderating role in this
relationship. This study, can thus, conclude that benevolence does not
moderate the impact of clan organisational culture on employee creativity
within the Nigerian manufacturing industry.

212
Note: Green line (High Ability); Blue line (Ability at Mean); Red line (Low Ability)
Figure 4.8: Moderating effect of benevolence on the impact of clan organisational culture on employee creativity

213
H13: Benevolence moderates the impact of adhocracy organisational
culture on employee creativity.
Figure 4.9 indicates a disordinal interaction which shows that
benevolence inverts the positive relationship between adhocracy organisational
culture and employee creativity. The nature of interaction indicates that at one
condition, a reduction by 1 SD unit of benevolence causes an increase in
employee creativity. In another condition, an increase by 1 SD unit of
benevolence would lead to a decrease in employee creativity. This also
signifies that when benevolence is low, under an adhocracy organisational
culture, there tends to be an increase in the level of employee creativity as
compared to a decrease in employee creativity when benevolence is high. Also,
contrary to a conventional expectation, one may think the more benevolence
exhibited, the more creativity may tend to increase. The reverse of such notion
is the case in Figure 4.9, and plausible reasons would be subsequently
discussed. Table 4.15 indicates a 5.117 t-statistics moderating value of
benevolence on the impact of adhocracy OC on EC. This suggests a positive
interaction effect.
As highlighted in Table 4.8, the moderating effect size of benevolence
on this impact is 0.307; thus relating a strong or large effect size (Lowry &
Gaskin, 2014). This also indicates the amount of change that would occur in
employee creativity if benevolence is increased by 1 and adhocracy
organisational culture remains constant. Table 4.8 also suggests a very

214
significant p-value of 0.000 at a confidence interval of < 0.001 significance
level. This thus confirms the H13 of this study; as it can now be also concluded
that benevolence has a significant moderating effect on the impact of
adhocracy organisational culture on employee creativity. Moreover, a negative
moderating effect could therefore imply that in Nigerian manufacturing
industries, the higher the benevolence of top management leaders operating
under adhocracy organisational culture, the less improved their employee
creativity could become. In other words, while adhocracy organisational
culture remains constant, an increase in top management’s benevolence, could
mean a slight decrease in employee creativity. Therefore, to engender
employee creativity, top management leaders of manufacturing organisations
operating an adhocracy organisational culture, would have to consider
maintaining their current state of benevolence towards their employees. It
could be advised that more resources be committed towards regulating and
ensuring that the present condition of top management’s benevolence are
otherwise relatively constant.

215
Note: Green line (High Ability); Blue line (Ability at Mean); Red line (Low Ability)
Figure 4.9: Moderating effect of benevolence on the impact of adhocracy organisational culture on employee creativity

216
H14: Benevolence moderates the impact of market organisational
culture on employee creativity.
The interaction graph in Figure 4.10, suggests that benevolence
weakens the negative effect of market organisational culture on employee
creativity. Consequently, this also implies that when benevolence is at its mean,
an increase by 1 SD unit of benevolence would cause an increase in the level
of employee creativity. Likewise, a decrease by 1 SD of benevolence would
lead to a strong decline in the level of employee creativity. Table 4.9 indicates
a 5.136 t-statistics moderating value of benevolence on the impact of market
organisational culture on employee creativity. This suggests a positive
interaction effect. As highlighted in Table 4.9, the moderating effect size of
benevolence on this impact is 0.181; thus relating a moderate or medium effect
size (Lowry & Gaskin, 2014; Wong, 2013). This also indicates the amount of
change that would occur in employee creativity if benevolence is increased by
1 and market organisational culture remains constant. Table 4.9 also shows a
very significant p-value of 0.000 at a confidence interval of < 0.001
significance level. This thus confirms the H14 of this study, as it can now be
also concluded that benevolence has a positive and significant moderating
effect on the impact of market organisational culture on employee creativity.
Moreover, it therefore infers that in Nigerian manufacturing industries,
the higher the benevolence exhibited by top management leaders operating
under Market organisational culture; the more engendered their employee

217
creativity could become and vice versa. In other words, while market
organisational culture remains constant; an increase in top management’s
benevolence, would mean an increase in employee creativity. Therefore, to
engender employee creativity, top management leaders of manufacturing
organisations operating a market organisational culture, would have to
consider exhibiting more benevolence towards their employees.
It could be advised that more resources be committed towards
facilitating the degree of benevolence exhibited by top management’s leaders
and also to ensure it is facilitated by a market organisational culture.
Considerations regarding the extent of increase in benevolence, should
likewise be inferred based on the effect size of benevolence’s moderating effect
on the impact of market organisational culture on employee creativity.
Consequently, an increase in benevolence would cause a strong significant but
moderate improvement on employee creativity. Therefore, to engender
employee creativity, market organisational culture oriented manufacturing
organizations may want to consider committing a moderate degree of increase
of benevolence, as it does contribute only a moderate, positive and yet
statistically significant increase in employee creativity.

218
Note: Green line (High Ability); Blue line (Ability at Mean); Red line (Low Ability)
Figure 4.10: Moderating effect of benevolence on the impact of market organisational culture on employee creativity

219
H15: Benevolence moderates the impact of Hierarchy OC on EC.
Figure 4.11, shows the nature of interaction of the benevolence on the
impact of hierarchy organisational culture on employee creativity. Given a
point estimate of -0.216, the interaction graph suggests that benevolence
inverts the positive relationship between hierarchy and employee creativity. It
further signifies that when benevolence is at its mean; an increase by 1 SD unit
of benevolence would lead to a decline in employee creativity. In another
condition, a decrease by 1 SD unit of benevolence would otherwise cause an
increase in employee creativity. On the other hand, when benevolence is high,
it would lead to a decline in employee creativity as compared to an increase in
employee creativity when benevolence is low. Likewise, it may be logical to
expect that the more benevolence is exhibited, the more engendered employee
creativity might become.
Table 4.9 also indicates a 3.815 t-statistics moderating value of
benevolence on the impact of hierarchy organisational culture on employee
creativity. This also suggests a positive interaction effect. As highlighted in
Table 4.9, the moderating effect size of benevolence on this impact is 0.079;
thus relating a small effect size (Lowry & Gaskin, 2014; Wong, 2013). This
also indicates the amount of change that would occur in employee creativity if
benevolence is increased by 1 and hierarchy organisational culture remains
constant. Table 4.9 also shows a very significant p-value of 0.000 at a
confidence interval of < 0.001 significance level. This thus confirms the H15

220
of this study, as it can now be also concluded that benevolence significantly
moderates the impact of hierarchy organisational culture on employee
creativity.
Moreover, a negative moderating effect could therefore imply that in
Nigerian manufacturing industries, the higher the benevolence exhibited by top
management leaders operating under hierarchy organisational culture; the less
improved their employee creativity could become and vice versa. In other
words, while hierarchy organisational culture remains constant; an increase in
top management’s benevolence, could mean a decline in employee creativity.
Therefore, to engender employee creativity, top management leaders of
manufacturing organisations operating a hierarchy organisational culture,
would have to consider maintaining their current state of benevolence. It could
also be advised that more resources be committed towards regulating and
ensuring that the present condition of top management’s benevolence is
otherwise relatively constant.

221
Note: Green line (High Ability); Blue line (Ability at Mean); Red line (Low Ability)
Figure 4. 11: Moderating effect of benevolence on the impact of hierarchy organisational culture on employee creativity

222
4.5.3.5. Moderating effect of integrity
H16: Integrity moderates the impact of clan organisational culture on
employee creativity.
To explore the nature of moderation, an interaction graph is shown in
Figure 4.12. Given a point estimate of 0.152 (Table 4.9), Figure 4.12 indicates
that integrity inverts the negative effect of clan organisational culture on
employee creativity. It highlights a pronounced moderating effect of integrity
on this relationship. It also suggests that when integrity is at its mean, an
increase of integrity by 1 SD unit will cause an increase in the level of
employee creativity and vice versa. Consequently, a high integrity results in an
increase in the level of employee creativity. However, employee creativity
faces a substantial decline when integrity is low. In Table 4.15, the t-statistics
value 2.361, signifying the moderating value of clan organisational culture
suggests a moderate and positive interaction effect on the impact of clan
organisational culture on employee creativity.
As reported in Table 4.9, the moderating effect size of integrity on this
impact is 0.034. This value reflects the amount of change in employee
creativity if integrity is increased by 1 and clan organisational culture remains
constant. Although the effect size mirrors a rather small size of moderating
effect, it still does have a very important value and relay vital contribution to

223
this study’s model (Fassott et al., 2016). Lowry and Gaskin (2014) stress that
even small interaction terms which appear significant are vital and they also
contribute a certain degree of relevance to a model. The results as highlighted
in Table 4.9, represent a significant p-value of 0.018 at a confidence interval
of < 0.05 significance level (Gelman, 2013). This also confirms the H16 of this
study, as it can now be concluded that integrity has a positive and significant
moderating effect on the impact of clan organisational culture on employee
creativity.
It therefore infers that in Nigerian manufacturing industries, the higher
the integrity of top management leaders operating under clan organisational
culture; the more engendered their employee creativity could become and vice
versa. In other words, while clan organisational culture remains constant, an
increase in top management’s integrity would mean an increase in employee
creativity. Therefore, to engender employee creativity, top management
leaders of manufacturing organisations operating a clan organisational culture,
would have to consider exhibiting more integrity towards their employees. It
could be advised that more resources be committed towards fostering the
degree of integrity exhibited by top management’s leaders and to ensure it is
facilitated by a clan organisational culture. Considerations regarding the extent
of increase in integrity should be deduced from the calculated effect size of
integrity’s moderating effect on the impact of clan organisational culture on
employee creativity. Consequently, an increase in integrity would cause a
small but statistically significant improvement on employee creativity.

224
Therefore, to engender employee creativity, clan organisational culture
oriented manufacturing organizations may want to consider committing a small
degree of increase of their top management’s integrity.

225
Note: Green line (High Ability); Blue line (Ability at Mean); Red line (Low Ability)
Figure 4.12: Moderating effect of integrity on the impact of clan organisational culture on employee creativity

226
H17: Integrity moderates the impact of Adhocracy OC on EC.
To explore the nature of moderation, an interaction graph is shown in
Figure 4.12. Given a point estimate of -0.475 (Table 4.9), Figure 4.12 indicates
that integrity inverts the positive relationship between adhocracy
organisational culture and employee creativity. This interaction suggests that
when integrity is at its mean, an increase by 1 SD unit of integrity would lead
to a decrease in the level of employee creativity. On the other hand, a decrease
by 1 SD unit of integrity would mean an increase in the level of employee
creativity. This also means that, when integrity is low, employee creativity
tends to increase as compared to a decrease in the level of employee creativity
when integrity is high. Plausible reasons for this would be subsequently
discussed in the next chapter. Nevertheless, the t-statistics moderating value
(3.235) of integrity on the impact of adhocracy organisational culture on
employee creativity suggests a significant interaction effect. As highlighted in
Table 4.9, the effect size of integrity on this impact is 0.191; thus relating a
medium or moderate effect size (Lowry & Gaskin, 2014; Wong, 2013). This
also indicates the amount of change that would occur in employee creativity if
integrity is increased by 1 and adhocracy organisational culture remains
constant. Table 4.9 also shows a very significant p-value of 0.001 at a
confidence interval of < 0.05 significance level. This thus confirms the H17 of
this study. It can also be concluded that integrity has a positive and significant
moderating effect on the impact of adhocracy organisational culture on
employee creativity.

227
Moreover, a negative moderating effect could therefore imply that in
Nigerian manufacturing industries, the higher the integrity of top management
leaders operating under adhocracy organisational culture; the less improved
their employee creativity could become and vice versa. In other words, while
adhocracy organisational culture remains constant; an increase in top
management’s integrity, could mean a slight decrease in employee creativity.
Conversely, a decrease in integrity would also mean an increase in employee
creativity. Therefore, to engender employee creativity, top management
leaders of manufacturing organisations operating an adhocracy organisational
culture, would have to consider maintaining their current state of integrity. It
could be advised that more resources be allocated towards regulating and
ensuring that the present condition of top management’s integrity are otherwise
relatively constant.

228
Note: Green line (High Ability); Blue line (Ability at Mean); Red line (Low Ability)
Figure 4.13: Moderating Effect of Integrity on the impact of Adhocracy organisational culture on employee creativity.

229
H18: Integrity moderates the impact of market organisational culture
on employee creativity.
Figure 4.14 indicates the nature of interaction for the moderating effect
of integrity on the impact of market organisational culture on employee
creativity. The results show that integrity inverts the negative relationship
between market organisational culture and employee creativity. It also
highlights a pronounced moderating effect on this relationship. The nature of
interaction also signifies that when integrity is at its mean, an increase by 1 SD
unit of integrity would lead to an increase in employee creativity. On the other
hand, a decrease by 1 SD of integrity would also cause a pronounced decline
in EC. It is also observed in Table 4.9, that integrity has a positive interaction
effect of 4.295 t-statistics value. As reported in Table 4.9, the moderating effect
size of integrity on this impact of market organisational culture on employee
creativity is 0.162. This also implies a moderate or medium amount of effect
(Wong, 2013). This effect size value reflects the amount of change in employee
creativity if integrity is increased by 1 and market organisational culture
remains constant. Despite the degree of effect, it is also imperative to note that
a major consideration is hinged on whether the phenomenon under
investigation is significant or not (Fassott et al., 2016). On this note, Lowry
and Gaskin (2014) accentuate that even small interaction terms which appear
significant are vital and they contribute a certain degree of relevance to a
model. Table 4.9 thus highlights a very significant p-value of 0.000 at a
confidence interval of < 0.01 significance level. This explains a strong level of
significance and therefore confirms the H18 of this study. It is therefore

230
concluded that integrity has a positive and highly significant moderating effect
on the impact of market organisational culture on employee creativity.
Consequently, it could be inferred that in Nigerian manufacturing
industries, the higher the integrity of top management leaders operating under
market organisational culture; the more engendered their employee creativity
could become and vice versa. In other words, while market organisational
culture remains constant, an increase in top management’s integrity, would
lead to an increase in employee creativity. Therefore, to engender employee
creativity, top management leaders of manufacturing organisations operating a
market organisational culture, would have to consider increasing the current
state of their integrity. It could be further advised that more resources be
committed towards increasing top management’s integrity and to ensure it is
facilitated by a market organisational culture. Considerations regarding the
extent of increase in integrity should be inferred based on the effect size of
integrity’s moderating effect on the impact of market organisational culture on
employee creativity.

231
Note: Green line (High Ability); Blue line (Ability at Mean); Red line (Low Ability)
Figure 4.14: Moderating effect of integrity on the impact of market organisational culture on employee creativity

232
H19: Integrity moderates the impact of hierarchy organisational culture
on employee creativity.
The nature of interaction in Figure 4.9 indicates that integrity inverts
the positive relationship between hierarchy organisational culture and
employee creativity. This also means that when integrity is at its mean, an
increase by 1 SD unit of integrity would cause a decline in the level of
employee creativity. Conversely, a decrease by 1 SD of integrity would lead to
an increase in employee creativity. Probable reasons for this nature of result
have been subsequently discussed. Table 4.9 indicates a 2.640 t-statistics
moderating value of integrity on the impact of hierarchy organisational culture
on employee creativity. This also suggests a positive interaction effect. As
highlighted in Table 4.9, the moderating effect size of integrity on this impact
is 0.020; thus implying a small effect size (Lowry & Gaskin, 2014; Wong,
2013). This also indicates the amount of change that would occur in employee
creativity if integrity is increased by 1 and hierarchy organisational culture
remains constant. Table 4.9 also shows a very significant p-value of 0.008 at a
confidence interval of < 0.05 significance level. This thus confirms the H19 of
this study. Hence, it can be concluded that integrity has a positive and
significant moderating effect on the impact of hierarchy organisational culture
on employee creativity.
Moreover, a negative moderating point estimate of -0.122, could
therefore imply that in Nigerian manufacturing industries, the higher the

233
integrity of top management leaders operating under hierarchy organisational
culture; the less improved their employee creativity could become and vice
versa. In other words, while hierarchy organisational culture remains constant;
an increase in top management’s integrity, could mean a slight decrease in
employee creativity. Therefore, to engender employee creativity, top
management leaders of manufacturing organisations operating a hierarchy
organisational culture, may have to consider maintaining their current state of
integrity. This is also because Figure 4.9 indicates that when integrity is at its
mean, there is a positive but slight increase in employee creativity. It could
further be advised that more resources be assigned towards regulating and
ensuring that the present condition of top management’s integrity is otherwise
relatively constant.

234
Note: Green line (High Ability); Blue line (Ability at Mean); Red line (Low Ability)
Figure 4.15: Moderating effect of integrity on the impact of hierarchy organisational culture on employee creativity

235
4.6. Chapter Summary
This chapter highlighted the examination of the study’s descriptive
statistics and relayed a brief discussion of the role of respondents’
demographics. It has also investigated several direct and moderating effects of
the variables examined in this study. Among a total of 19 tested hypotheses, 14
different hypotheses have been confirmed and supported. However, a total of
5 different hypotheses were not supported. Results of all tested hypothesis have
been highlighted in Table 4.16. Hence, further discussions of the findings of
this study would be considered in the subsequent chapter. This is also going to
be with respect to the respondent’s demographics, critical discussion on the
supported and not supported hypothesis and their relativity to extant literature
findings.

236
Table 4.10: Results of the hypothesis testing
Hypothesis Decisions
H1 Relationship between organisational culture dimensions
and employee creativity.
H1a Clan organisational culture is positively related to employee
creativity
Not supported
(Significant / -)
H1b Adhocracy organisational culture is positively related to
employee creativity
Supported
H1c Market organisational culture is negatively related to
employee creativity
Supported
H1d Hierarchy organisational culture is negatively related to
employee creativity.
Not supported (Not
Significant)
H2 Relationship between trustworthiness dimensions and
employee creativity
H2a Ability has a positive effect on employee creativity. Supported
H2b Benevolence has a positive effect on employee creativity Supported
H2c Integrity has a positive effect on employee creativity Supported
H3 Ability moderates the impact of organisational culture
dimensions on employee creativity
H3a Ability moderates the impact of adhocracy organisational
culture on employee creativity.
Supported
H3b Ability moderates the impact of clan organisational culture on
employee creativity.
Not supported (Not
Significant)

237
Table 4.10: Results of the Hypothesis Testing Continued
Hypothesis Decisions
H3c Ability moderates the impact of market organisational culture
on employee creativity.
Supported
H3d Ability moderates the impact of Hierarchy OC on EC Not supported (Not
Significant)
H4 Benevolence moderates the impact of organisational
culture dimensions on employee creativity
H4a Benevolence moderates the impact of clan organisational
culture on employee creativity
Not supported (Not
Significant)
H4b Benevolence moderates the impact of adhocracy
organisational culture on employee creativity
Supported
H4c Benevolence moderates the impact of market organisational
culture on employee creativity
Supported
H4d Benevolence moderates the impact of hierarchy organisational
culture on employee creativity.
Supported
H5 Integrity moderates the impact of organisational culture
dimensions on employee creativity
H5a Integrity moderates the impact of clan organisational culture
on employee creativity
Supported
H5b Integrity moderates the impact of adhocracy organisational
culture on employee creativity
Supported
H5c Integrity moderates the impact of market organisational
culture on employee creativity.
Supported
H5d Integrity moderates the impact of hierarchy organisational
culture on employee creativity.
Supported

238
CHAPTER FIVE
DISCUSSION OF FINDINGS
5.1. Introduction
This chapter discusses the research findings and examined hypothesis
that has been highlighted in the previous chapter. It deliberates on the impacts
of organisational culture on employee creativity, impacts of trustworthiness on
employee creativity; and moderating effects of ability, benevolence and
integrity on the impact of the dimensions of organisational culture on employee
creativity. A critical evaluation of the results shown in Table 4.15, indicates
that ability, benevolence and integrity have positive moderating effects on the
impact of both clan organisational culture and market organisational culture on
employee creativity. Similarly, ability, benevolence and integrity reflect
negative moderating effects on the impact of both adhocracy organisational
culture and hierarchy organisational culture on employee creativity. Notably,
these negative moderating effects appear to be consistent mainly when
adhocracy and hierarchy organisational culture dimensions are constant or
when examined. It could then be logical to surmise that the negative
moderating effects might be due to the nature of relationships between top
management and organisational members within the adhocracy and hierarchy
organisational culture dimensions.

239
It thus relates that a plausible cause of this might be arising from value
systems (Kpakol et al., 2016) endemic within the adhocracy and hierarchy
organisational culture dimensions. This has also been given subsequent
considerations. Additionally, plausible justifications of both supported and
unsupported hypothesis has subsequently been considered. Congruent with the
findings and tested hypotheses of this study, the nature of discussions would
therefore reflect;
a) The effects of all organisational culture dimensions on employee
creativity.
b) The effects of all trustworthiness dimensions on employee creativity.
c) The moderating effect of ability, integrity and benevolence on the
impact of adhocracy organisational culture on employee creativity.
d) The moderating effect of ability, integrity and benevolence on the
impact of hierarchy organisational culture on employee creativity.
e) The moderating effect of ability, integrity and benevolence on the
impact of clan organisational culture on employee creativity.
f) The moderating effect of ability, integrity and benevolence on the
impact of market organisational culture on employee creativity.

240
5.2. The effects of all organisational culture dimensions on employee
creativity
5.2.1. Clan organisational culture impact on employee creativity.
Results of this study indicates that clan organisational culture has a
small negative impact on employee creativity, thus disconfirming the initial
postulation (Table 4.8). Recall that Schein (2010) has earlier opined that
organisational culture mirrors a pattern of shared primary assumptions that are
learnt by a group of employees, as it solves its issues of internal integration and
external adaptation. In the clan organisational culture, Cameron and Quinn
(2006) argue that it projects a responsive environment in which employees
share many values with each other. This is also because of an organisation
operating as a set of best friends or a family (Cameron & Quinn, 2011).
Although, this might be very helpful in engendering employee
creativity through the generation, sharing and implementation of creative
ideas; it may however, relate negative consequences that could actually impede
employee creativity in the long run. Over time, a homogeneous cluster could
be formed and this could limit the degree at which organisational members
perceive, critic and implement novelty from very diverse perspectives. This
could subsequently have a negative effect on employee creativity (Tang &
Byrge, 2016). This could also be because of less assessment rates of, and less
access to new and divergent values that could otherwise provoke new thinking
processes that engenders employee creativity. This is also in view that, in most

241
cases, mostly known and already familiar values are accessible to employees
in homogeneous clusters, as compared to employees in heterogeneous clusters
(Fernandes & Polzer, 2015). Studies found that employees with different value
systems (heterogeneous clusters) would stimulate team members’ cognition
and thereby engender employee creativity (Fernandes & Polzer, 2015; West,
2002). Contrary to conventional anticipations that the features of clan
organisational culture ought to be positively associated with employee
creativity (Barbara & Valerie, 2007); the result of this present study is therefore
congruent with studies that have espoused that clan organisational culture have
a negative effect on employee creativity (Stahl, Maznevski, Voigt, & Jonsen,
2010; Tang & Byrge, 2016).
5.2.2. Adhocracy organisational culture impact on employee creativity
Table 4.8, shows that adhocracy organisational culture has a significant
positive impact on employee creativity. This indicates that the adhocracy
organisational culture is one of the organisational culture dimensions that is
positively associated with employee creativity within the Nigerian
manufacturing industry. Cameron and Quinn (2006) argue that the adhocracy
organisational culture ought to mirror an entrepreneurial and creative platform.
It embodies a certain degree of task flexibility that allows for the anticipation
of needs, creation of new standards, constantly transforming creative ideas into
problem solving solutions. McLean (2005) found out that frequent generating

242
of creative ideas and using its innovative process to realize potential value of
those ideas, are vital for firm’s survival.
To engender the ideation and fruition of employee creative ideas, a
strong support of an adhocracy oriented organisational culture is also required;
if the goal is to engender employee creativity (Gupta, 2011). The adhocracy
organisational culture is usually tailored towards innovativeness and
production of cutting edge novelties (Heritage, Pollock, & Roberts, 2014). By
profiling and highlighting the presence and influence of adhocracy
organisational culture on employee creativity, it may be required of top
management to be self-motivating in building more of an entrepreneurial spirit
that encourages engagement in risk taking activities. This is with respect of its
positive and statistically significant impact on employee creativity. Top
management ought to recognise the significance of operating an adhocracy
organisational culture. Naranjo-Valencia et al. (2010) found that adhocracy
organisational culture can enhance new products/services development.
Additionally, Gupta (2011) further found that adhocracy oriented
organisational culture has a positive impact on employee creativity. Even the
findings of Mobarakeh (2011) indicate a positive impact on employee
creativity. Naranjo-Valencia et al. (2016) also found that adhocracy culture has
a positive impact on innovation, which is a consequence of employee
creativity. In adhocracy organisational culture, employee creativity could be
further engendered in a way that inspires new focus on obtaining new

243
resources, new challenges, risk taking and exploration of relevant opportunities
(Martins & Terblanche, 2003). This, however, requires a certain degree of
flexibility and optimum control for employee creativity to be further
engendered by a supportive adhocracy organisational culture (Einsteine &
Hwang, 2007). Findings of this present study is therefore consistent with extant
literature that has espoused on the significance of operating a strong adhocracy
organisational culture, and have stressed on its positive association with
employee creativity (Gupta, 2011; Mobarakeh, 2011; Naranjo-Valencia et al.,
2010, 2011; Naranjo-Valencia et al., 2016).
5.2.3. Market organisational culture impact on employee creativity
Figure 4.14 shows that the market organisational culture has a
significant negative effect on employee creativity. This negative effect could
be associated with the values exhibited in the market organisational culture.
Top management leaders in this quadrant are known for their focus on
productive, competitive and directive capabilities. They are usually demanding
and tough as a major focus is to improve upon market shares and penetration.
In view of this, employees are more task oriented and preoccupied with
achieving set goals and meeting strict deadlines (Cameron & Quinn, 1999).
Employee creativity may not be succinctly engendered since focus is tailored

244
towards productivity rather than development or fostering of cutting edge
innovations.
At the early stages of engendering employee creativity in terms of the
diffusion of creative ideas, the market organisational culture might not actually
play a substantial role. It may however, play a significant role when employee
creativity becomes engendered towards innovation diffusion, and when
awareness and productivity of innovations becomes a prime focus (Jain, Jain,
& Jain, 2013; Wang & Wang, 2012). Cameron and Quinn (2011) and Lisboa,
Skarmeas, and Lages (2011) posited that market organisational culture ought
to guarantee success of new innovativeness built upon employee creativity, in
terms of market share, investment returns, sales and profitability. Engendering
employee creativity for example in the IT products’ manufacturing companies
may very well lead to increase in changes of technological advancements.
Thus, constant changes in technological advancements might require regular
diffusion of creative ideas to foster and manage novelties. This is logically in
contrast to a focus on improving market shares and penetration which are
probable consequences rather than antecedents of employee creativity
(Amabile & Mueller, 2008; Amiri et al., 2014). Consequently, Jain et al. (2013)
stressed that market organisational culture is said to have a weaker or negative
effect on employee creativity antecedents.
In addition, it is practically unrealistic to espouse on and engage in
employee creativity initiatives without eliciting and taking on certain degree of

245
risks (Wang & Wang, 2012). However, in view of the features of market
organisational culture, it may be rational to infer that the market organisational
culture might actually require less risk associated with employee creativity, as
compared to maybe the adhocracy organisational culture (Cameron & Quinn,
2011). Top management within this dimension of organisational culture may
either be found to tolerate very less risks or averse risks regarding employee
creativity initiatives. In light of this, Mostafa (2005) also found risk aversion
to be one of the barriers to employee creativity. Extant research further
espoused that the more market oriented the organisational culture becomes, the
more averse to risk it will be (Balas, Colakoglu, & Gokus, 2012; Jain et al.,
2013). The postulation of this present study thus demonstrates that market
organisational culture is negatively associated with employee creativity, and
this is likewise congruent to studies that have advocated a similar notion
(Kaufman & Baer, 2004; Yazdi, 2007).
5.2.4. Hierarchy organisational culture impact on EC
Findings of this study indicates that hierarchy organisational culture has
no significant impact on employee creativity. Recall that the hierarchy
organisational culture dimension is characterised by very formalized and
structured patterns. It could be perceived as a web of already prearranged and
established procedures and typically known for its strict rules and strong
control over task routines and employee actions (Cameron, 2008). It is
common-sense to understand that manufacturing organisations ought to be

246
guided by sets of rules. However, extant literature concludes that top
management might want to consider limiting such rules to the lowest
acceptable minimum (Mittal & Dhar, 2015; Liu et al., 2016). This is to foster
a flexible system of control within the established sets of norms and
procedures. Studies have espoused that excessive implementation of strict rules
and regulation of processes might play a role of suffocating employee
creativity (Gupta & Singh, 2012).
In terms of engendering employee creativity, a consequence of this
might compel employees to strictly implement routines in line with already
prescribed procedures and strict rules. For fear of encountering unpleasant
consequences from top management, employees may endeavour to avoid
mistakes or contribute their own creative ideas to further engender
innovativeness. Subsequently, this could result in low morale of employees to
effusively contribute or commit towards creativity initiatives. Liu, Lin, and Shu
(2017) and Venkatraman and Huettel (2012) advocate that this could lead to
decline in production quality, employee motivation, and overall innovativeness
of employee creative capabilities. However, to mitigate this, the findings of
James (2008) indicate that instead of excessive control and strict rules, top
management may endeavour to explore intrinsic motivation. The author
emphasised that it is a key driver of employee creativity and that it drives
organizational learning and transformation. The author further stressed that
coercive top management actions otherwise tend to reduce employee
creativity.

247
Andron (2013) found that a very strictly and regulated hierarchy
organisational culture is mostly never creative and innovative as they may not
successfully adapt to the constant change influencing the business world. On
this note, Naranjo-Valencia et al. (2010) found that hierarchical organisational
culture inhibits product innovation. Likewise, Hemmatinezhad et al. (2012)
show that there is no significant relationship between hierarchy organisational
culture with employee creativity. Liu et al. (2016) found a negative effect of
the consequences of hierarchy organisational culture on employee creativity.
Similarly, Kaufman and Baer (2004) found no relationship between hierarchy
organisational culture and employee creativity. Yazdi (2007) found no
significant relationship either. This is therefore consistent with the findings of
this study which mirror no significant relationship between hierarchy
organisational culture and employee creativity.
5.3. Effect of trustworthiness dimensions on employee creativity
5.3.1. Impact of ability on employee creativity
In this study, ability has been demonstrated to have a significant
positive impact on employee creativity (Table 4.8). Mayer et al. (1995) and
Amabile and Mueller (2008) support that ability ought to reflect proficiencies,
intellectual skill sets, creative thinking capabilities and creative behaviours that
addresses new paths of identifying problems and providing solutions
accordingly. Ability is surprisingly required in virtually all phases of
engendering employee creativity. A major driver of employee creativity could

248
thus be the ability of top management leaders to engender the diffusion of
creative ideas. This may be from the production of creative ideas to
implementation of creative ideas.
Studies (Axtell, Holman, & Wall, 2006; Clegg, Unsworth, Epitropaki,
& Parker, 2002) highlight a positive link between the production and
implementation of creative ideas. The authors opine that production of creative
ideas is a positive predictor of its implementation. However, Baer (2012)
stressed that the ability to produce creative ideas is far more predominant than
creative ideas implementation. Ogbeibu, Senadjki, and Tan (2017) also posit
that the ability to apply creative efforts relevant for the diffusion of creative
ideas is positively associated with employee creativity. Moreover, despite the
novelty or usefulness of a creative idea, the resistance and scepticism it might
face could be as a result of not perceiving the source, as trustworthy enough to
exercise its required ability. Hence, as long as ability can be trusted or
perceived to be highly trustworthy, there could also be a high chance that the
diffusion of creative ideas may aid to engender employee creativity.
Extant research has found a positive link between ability and employee
creativity, in that ability is relevant for the improvement of employee
knowledge that subsequently leads to advancement in employee creativity
(Hsu, 2016). It thus mirrors a positive link that espouses the boundaries of
creative ideas generation to creative ideas implementation. In view of
engendering employee creativity, the ability to identify problems and propose

249
novel solutions is usually an initial step in the creative process (Amabile &
Mueller, 2008). Guo and Li (2006) argued that if top management leaders
could fully exploit their innate and extrinsic abilities, support for employee
creativity would very well increase. In their study of socialization and
innovations, Dingler and Enkel (2016) found that ability is positively
associated with employee creativity. Likewise, Jiao, Yang, Gao, Xie, and Wu
(2016) also found that ability have significant positive effects on employee
creativity. The findings of a positive, strong and statistically significant
association between ability and employee creativity is therefore consistent with
the findings of extant literature (Dingler & Enkel, 2016; Hsu, 2016; Jiao et al.,
2016).
5.3.2. Impact of benevolence on EC
In this study, Table 4.8 shows that benevolence has a significant
positive impact on employee creativity. Mayer et al. (1995) highlight that
benevolence is the exhibition of good intentions, goodwill, kindness or
altruism by top management and towards other employees. Notably, an
interesting detail is that a certain degree of emotions might be exhibited during
the process of benevolent actions and interactions. As an art, benevolence
could be perceived as an aptitude by which top management may perceive and
express emotions, understand and manage them as well (Castro et al., 2012).
These emotions (whether positive or negative) is said to have an effect on
employee creativity (Yang & Hung, 2015). Employees may be thus compelled

250
to act or react based on the emotions perceived via several benevolent
interactions they may experience from top management.
Manufacturing organisations that are innovation oriented for example,
may also rely on the benevolent top management leaders to drive employee
creativity in within a working climate that reflects positive emotions. This also
enhances employee commitment to engage in creativity initiatives that may
subsequently engender employee creativity. Studies have also emphasized on
the importance of top management’s benevolence as a vital driver that
influences employee creativity (Zhou & George, 2003). For example, being
benevolent instils in employees, an appreciation of the significance of task
activities. It may also contribute towards producing and maintaining
enthusiasm, optimism, confidence, encourages flexibility in decision making
and trust. These are vital processes by which benevolence may engender
employee creativity. Hence, in this present study, benevolence has been
demonstrated to be positively associated with employee creativity.
Contrary to this view, Yang and Hung (2015) and Vosburg (1998)
found a negative link or association between benevolence and employee
creativity. The authors demonstrate that benevolence constrains rather than
engender employee creativity. However, Hirt, Levine, McDonald, Melton, and
Martin (1997) and Murray, Sujan, Hirt, and Sujan (1990) concluded on a
similar notion that benevolence when exhibited via positive emotions have
positive effects on employee creativity and subsequently engenders it. Castro

251
et al. (2012) also confirmed a positive relationship between top management
leader’s benevolence and employee creativity. The extent at which a top
management leader is benevolent and relay good intentions towards
employees, might result in either a positive or negative burst of emotions. This
may further mirror a positive or negative employee orientation or perception
of trustworthiness for the top management leader. A consequence of this might
either reflect a positive or negative effect on employee creativity. The literature
on top management’s benevolence that engenders or inhibits employee
creativity has thus been powered by several developments in recent years
(Yang & Hung, 2015). The findings of the already highlighted extant literature
is thus congruent with that of this study, which emphasises a positive
association between benevolence and employee creativity.
5.3.3. Impact of integrity on employee creativity
According to the results of Table 4.14, integrity is shown to have a
positive and significant impact on employee creativity. This could be because
top management leaders may have been exhibiting very high levels of integrity,
considering the positive impact their integrity has on employee creativity. This
highlights a strong degree of trustworthy, open, just and empathetic nature of
top management leaders. Integrity is also regarded as a crucial component of
the characteristics of top management, in matters pertaining to creativity and

252
innovations. Integrity has been examined to reflect different interpretations by
several researchers (Peng & Wei, 2016). On one hand, integrity is considered
as a particular perception of reliability between top management’s words and
actions (Palanski & Vogelgesang, 2011). Simons (2002) identifies this as
behavioural integrity.
Conversely, Peng and Wei (2016) stress that top management’s
integrity could be considered as a general description of ethical and honest
behaviour. It is also perceived as a morally justifiable commitment in action,
regarding a set of values and principles (Bauman, 2013). It is becoming a
growing conventional believe that top management leaders ought to by default
possess and actually exhibit high levels of integrity, whether during adversity
or for initiatives concerning creativity (Moorman, Darnold, & Priesemuth,
2013). The significance of integrity on employee creativity mostly in the
manufacturing industry cannot be overemphasised (Hoch, 2013). This is
because creativity which involves the generation and diffusion of creative
ideas, might be a risky endeavour for several employees. Hence, the need for
top management leaders with high integrity. In their study of perceived leader
integrity effect on employee creativity, Pang and Wei (2016) argue
convincingly that top management leaders that possess high integrity are
actually creators of very supportive working climate and organisational culture
which engenders employee creativity. The authors also support that integrity is
synonymous with honesty and trustworthiness.

253
Mayer et al. (1995) and Bauman (2013) argue that top management’s
integrity could also reflect the extent at which employees perceive them to be
reliable. In this case, extant research accentuate that integrity is positively
associated with employee creativity when top management leaders mirror an
acceptable degree of reliability between their actions and words (Hoch, 2013).
It has also been empirically proven that employees whose top management
leaders exhibit high behavioural integrity are often found to be very likely to
trust, share their creative ideas and also commit towards employee creativity
initiatives (Simons, Leroy, Collewaert, & Masschelein, 2015). Extant literature
has found that such top management attributes that mirror integrity, is
positively related to employee creativity (Ma, Cheng, Ribbens, & Zhou, 2013;
Valentine, Godkin, Fleischman, & Kidwell, 2011). In a study of 716 employees
and their supervisors, Pang and Wei (2016) also found that managers and
supervisor’s integrity are positively associated with employee creativity. This
therefore confirms the postulation of this study, that integrity has a positive
impact on employee creativity.
5.4. The moderating effect of ability, integrity and benevolence on the
impact of adhocracy organisational culture on employee creativity
Ability, benevolence and integrity are all dimensions and therefore
predictors of trustworthiness (Mayer et al., 1995). In this study, all three
dimensions have been predicted to moderate the impact of adhocracy
organisational culture on employee creativity. However, the findings indicate

254
that not only are they moderators; they all negatively moderate the impact of
adhocracy organisational culture on employee creativity. This certainly
counters conventional expectations. A probable cause for the negative
moderating effects could be because of top management’s high expectations
from employees based on their high standards. Notably, their negative effects
revolve within for example, the processes of observable traits, values and
beliefs that could be demonstrated within an adhocracy organisational culture.
These examples reflect the relationships hidden within employee’s perceptions
of their top management.
To further buttress this notion, Figure 4.4, Figure 4.9 and Figure 4.13
shows that at the mean of their respective interactions and under an adhocracy
organisational culture, top management’s ability, benevolence and integrity are
already high and on a positive increase. However, when each distinct
moderator increases by 1 SD, employee creativity faces a decline and when
they reduce by 1 SD, employee creativity is increased. This consequently
demonstrates that just at the mean, top management leaders are already
exhibiting high levels of ability, benevolence and integrity. Congruently,
extant literature espouses the possibility that top management leaders under an
adhocracy oriented organisational culture, tend to reflect very high standards
of ability, benevolence and integrity. In this case, top management leaders
would prefer to be perceived as having such high standards in order to
continuously drive employee beliefs of their leadership competencies. Top
management leaders also tend to drive employees to uphold such high

255
standards in themselves and consequently achieve high creative results. This
may be logically appropriate, except, based on their high standards, top
management leaders tend to place high expectations on employees (Liu et al.,
2016).
This might usually be to either foster employee personal development
and or achieve corporate innovative prowess and stronger competitive edge.
Their high expectations of creative results from their employees might be due
to their own personal development factors, for example; exposure, academic
qualifications, experience, high self-efficacy, profit maximization or pride. It
could also be from external factors such as economic, social or technological
changes influencing the innovative and competitive edge of the manufacturing
organisation. In light of such changes, some employees might have the ability,
benevolence and integrity to advance their skills or respond efficiently, while
others may not (Thomas & Eileen, 2006). Due to top management’s high
expectations and culminated push on their employees, studies argue that
employee creativity may tend to suffer certain consequences (Baer, 2012; Zhou
& George, 2003). A very conventional yet prevalent case could be a steady
decline in the degree of employee creativity due to increased workplace stress
levels of employees.
Similarly, the increase in workplace stress could hinder and have an
adverse negative effect on employee creativity (Thomas & Eileen, 2006).
Workplace stress is referred to as a physiological and behavioural response of

256
an employee, when the same employee experiences a demand which exceeds
his/her actual or perceived abilities (Ren & Zhang, 2015). It might be a kind of
demand that may not only exceed employee abilities, but may be perceived by
the employees to be detrimental to their perceived benevolence and integrity,
during and or after the demand is fulfilled. The demands could be related to
time urgency, nature of job responsibility and high workload, organisational
politics, role ambiguity and even concerns of job insecurity (Ren & Zhang,
2015). These demands could reflect forms of strain; for example, tension,
exhaustion, anxiety, anger, confusion, pressure and lack of focus. It is likely
that this is often common in manufacturing organisations that are adhocracy
oriented and innovation centred (Axtell, Holman, & Wall, 2006).
Employee workplace stress might cause employees to leave the
manufacturing organisation in response to the work stress. Thus, employee
creativity is not engendered but may be lost. Employees may remain in the
manufacturing organisation but only passively in acceptance to the status quo,
yet without contributing towards improvement of employee creativity. Thus,
employee creativity might face a sudden stop in growth rate. It may also happen
that employees might not only remain passive but also further minimize their
efforts by exhibiting withdrawal behaviours from employee creativity
initiatives (Hon, Chan, & Lu, 2013). This could lead to a subsequent decline in
employee creativity for a manufacturing organisation. These arguments have
been supported by Thomas and Eileen (2006), in their study of workplace
stress: etiology and consequences. The authors opined that employees

257
experiencing workplace stress are in significant danger of psychological and
physiological disorder, as this can lead to unproductiveness.
Employees who are mentally unproductive cannot think creatively nor
contribute towards employee creativity initiatives (Castro, Gomes, & de Sousa,
2012). Ren and Zhang (2015) also found that work stress perceived as a
hindrance is negatively associated to even idea generation. In their study of
overcoming stress and promoting employee creativity, Hon et al. (2013)
advocate that work stress is negatively associated to employee creativity.
Extant literature that have espoused the negative association of work stress
with employee creativity also further confirms the findings of this present study
(LePine, Podsakoff, & LePine, 2005; Podsakoff, LePine, & LePine, 2007).
With respect to part of the findings of this study, the negative
moderating effects of all trustworthiness dimensions helps to further stretch the
scope of the undergirding supporting the employee creativity phenomenon. It
brings to light, how ability, benevolence and integrity actually negatively
moderates the positive relationship between adhocracy organisational culture
and employee creativity. This is with regards to how the high standards of top
management leader’s trustworthiness may inspire them to strongly expect
employees to exhibit the same. Several studies have examined the direct links
between trustworthiness dimensions and employee creativity (Castro et al.,
2012; Dingler & Enkel, 2016; Ma et al., 2013). However, a descriptive analysis
of the nature of the relationship, when trustworthiness is examined as a

258
moderator, has yet been given considerable attention. To shed light on the
nature of this moderating relationship, this study also recaps on how top
management leader’s high trustworthiness expectations in their employees
might cause a major consequence of employee work stress, and subsequently,
negatively impact employee creativity.
Moreover, it might seem as though not much has been done by extant
literature to accentuate and demonstrate the negative moderating effects of
trustworthiness on the impact of adhocracy organisational culture on employee
creativity. This could be mainly because, to the best of the researcher’s
knowledge, trustworthiness as a moderator within this study’s context, has
been previously very much overlooked. This might also be due to the
increasing wealth of literature that has focused on trustworthiness paradigm,
yet leaving its association with employee creativity almost underdeveloped
(Shainesh, 2012; Singh & Sidhu, 2017). Hence, this study’s originality and
another unique contribution to the wealth of creativity, organisational culture
and trustworthiness research. This study’s results, has thus, demonstrated that
top management’s ability, benevolence and integrity are actually strong
moderators but with statistically significant negative effects.

259
5.5. The moderating effect of ability, integrity and benevolence on the
impact of hierarchy organisational culture on employee creativity.
5.5.1 Moderating effect of ability on the impact of hierarchy
organisational culture on employee creativity.
Part of the findings of this study is thus consistent with the findings of
extant literature that conclude that there is no significant link between
hierarchy organisational culture and employee creativity. This study also
stretches this finding a little further by examining the moderating effect of top
management’s ability, benevolence and integrity on this relationship. The
present study finds that only benevolence and integrity are actually moderators
of the relationship between hierarchy organisational culture and employee
creativity. In addition, it was found that top management’s ability has no
significant moderating effect on the impact of hierarchy organisational culture
on employee creativity. This counters the anticipated postulation for the H3d
of this present study. Figure 4.7 shows that at the slope of the mean, top
management’s ability is already positive and reflects an increasing and high
slope. This means that under a hierarchy organisational culture, top
management leaders are perceived to exhibit high levels of ability within their
respective manufacturing organisations.
With an internal focus on integration, stability and control under the
hierarchy organisational culture, coupled with an exertion of high ability by
top management leaders, it is not a surprise that employee creativity may be
otherwise suppressed or inhibited (Andron, 2013; Cameron & Quinn, 2011).

260
The hierarchy organisational culture mirrors an organisation whose top
management leaders are highly focused on stability, control and order
(Cameron & Quinn, 2011). Not only is the focus on control still a hot debate
in creativity literature, studies advocate that excessive control of top
management has a negative effect or is negatively associated with employee
creativity (Gupta, 2011; Gupta & Singh, 2012; Rinne, Steel, & Fairweather,
2013). Other researchers espouse that there is no significant relationship
between ability, the features of hierarchy organisational culture (for example,
control) and EC (Hemmatinezhad et al., 2012; Naranjo-Valencia et al., 2010).
Andron (2013) stress that a stringent form of control is negatively
associated to employee creativity. As earlier highlighted, when top
management leaders are perceived to exhibit very high standards of ability, it
might be rational for them to expect the same from their employees. This study
has earlier deliberated on the ‘how’ and the probable consequences of
expecting employees to exhibit high abilities, benevolence and integrity. Under
the hierarchy organisational culture, employees are often compelled to respond
to top management leaders as a result of lack of choice and sometimes, fear
(Busco, Frigo, Giovannoni, & Maraghini, 2012). Under a system of excessive
control and rigid rules, not much choice is given to creative employees who
could otherwise engender employee creativity via task autonomy.
Employee creativity may often be faced with frequent monitoring and
supervision. In cases like this, employees are basically compelled to obey and

261
adhere to strict task routines and practices so as to avoid unpleasant
consequences from top management leaders (Hoskins, 2014; Weibel, 2007).
Hence, the workforce may subsequently become influenced negatively by a
climate of fear. A prominent down turn of this is argued to result in low
employee motivation such that employees may become passively rather than
actively engaged in creative processes. This could also lead to gross
unproductiveness in the degree at which creative ideas are generated or
diffused (Liu et al., 2017; Owoyemi & Ekwoaba, 2014).
Extant literature tend to imply that employee creativity may hardly
survive under a very strong hierarchy organisational culture, where the nature
of employee’s jobs is centred on R&D and or IT (Gupta & Singh, 2012).
Moreover, the hierarchy organisational culture does play a vital role to either
facilitate or inhibit employee creativity. Studies argue that the growth of
employee creativity in this situation may be contingent on top management
leadership style or on the time of implementation of the hierarchy
organisational culture features (Jeffrey & Samuel, 2013). Top management’s
ability to drive the features of hierarchy organisational culture in creativity
initiatives could be mostly vital for the implementation phase of creative ideas
rather than the idea generation phase. The generation phase reflects the actual
birth of creativity, while the implementation phase mirrors the production of
innovations (products or services) (Baer, 2012).
Moreover, top management’s ability is a necessary dimension of
trustworthiness that is imperative for engendering employee creativity. It is

262
also a vital necessity for driving the entire creativity processes (Guo & Li,
2006). Dingler and Enkel (2016), Hsu (2016) and Jiao et al. (2016) have
deliberated on the effect and significance of top management’s ability, and
reflect that it’s an on-going discourse which mirrors a propensity for more
controversial debate. Although, a degree of influence of top management’s
ability and control might be required for engendering employee creativity, it is
often advised that a moderate or acceptable minimum be exerted. This is also
because extant research has espoused that excessive control and high ability
expectations have a tendency to suffocate and subsequently kill employee
creativity (Dingler & Enkel, 2016; Hsu, 2016; Jiao et al., 2016). The findings
of this study is thus consistent with the above mentioned arguments; such that
high ability is found to actually nullify the positive association between
hierarchy organisational culture and employee creativity (refer to Figure 4.7).
Likewise, it is congruent with studies that have found that there is no significant
relationship between ability, the features of hierarchy organisational culture
(for example, control) and employee creativity (Hemmatinezhad et al., 2012;
Naranjo-Valencia et al., 2010).
5.5.2 Moderating effect of benevolence on the impact of hierarchy
organisational culture on employee creativity.
On the other hand, findings of this study has also demonstrated the need
for managers to recognize the moderating significance of benevolence. It is
vital to fathom the role benevolence plays in moderating the impact of

263
hierarchy organisational culture on employee creativity. Figure 4.11 suggests
a positive increase of the slope of the mean of benevolence. It further suggests
that, under the influence of a hierarchy OC, top management leaders of
manufacturing organisations, were already exhibiting a positive and increasing
benevolence towards employees. However, results of this study also shows that
benevolence has a significant negative moderating effect on the impact of
hierarchy organisational culture and employee creativity.
Under a strong hierarchy organisational culture, employees might feel
compelled rather than motivated to support employee creativity initiatives.
Some authors found that an unmotivated workforce might experience dire
struggle while trying to engender employee creativity (Chukwuma &
Obiefuna, 2014; Ndaliman et al., 2015). Conversely, top management’s
expression of increased benevolence towards employees might be quite
confusing to employees when they perceive and experience benevolence as a
medium of enforced control and push by top management. Employees may
tend to further believe they are being manipulated and therefore perceive top
management leaders as being untrustworthy. Employees may mainly be
passively engaged in creativity initiatives and thereby commit less creative
efforts toward employee creativity. Similarly, when stringent controls and rules
are enforced, it often produces fear and less autonomy that might have
otherwise engendered employee creativity (Liu et al., 2017). Consequently,
employees may find it difficult to share their creative ideas within the
workforce. They may feel that although top management expresses

264
benevolence towards them, it is yet pointless to engender employee creativity
when creative efforts are basically inhibited by strict rules, monitoring and
control processes.
Studies accentuate that this often leads to employee low job satisfaction
and motivation, as employees experience a lack of choice to exploit creativity
initiatives (Weibel, 2007). In this regard, it could be rather challenging for
employees to trust in top management’s benevolence. Studies that have
examined the concept of top management’s benevolence espouse that
benevolence mirrors an act of kindness or goodwill, which is often exhibited
via transfer of emotions (Castro et al., 2012; Mayer et al., 1995). In a study of
emotions as constraining and facilitating factors for creativity, Yang and Hung
(2015) found that positive emotions can constrain employee creativity and
negative emotions can foster employee creativity. This might often be the case
when top management’s system of enforcing stringent control and rules is
masqueraded as benevolence. The findings of a negative moderating effect of
benevolence are thus congruent with the results and debates of extant literature
that have examined and found that through expressed emotions, benevolence
has a negative effect on employee creativity (Castro et al., 2012; Jafri, Dem, &
Choden, 2016).
This therefore meets the proposition of H4d of this present study.
Benevolence might have had a supposedly positive effect if it was not exhibited
under a hierarchy oriented OC. This supposition is based on the negative

265
association or insignificant relationship found between hierarchy
organisational culture on employee creativity (Andron, 2013; Hemmatinezhad
et al., 2012; Liu et al., 2016; Yazdi, 2007). In a hierarchy organisational culture,
top management’s benevolence may be vital to foster employee loyalty or
mitigate high labour turnover rather than engender employee creativity
(Podsakoff et al., 2007; Valentine et al., 2011).
5.5.3 Moderating effect of integrity on the impact of hierarchy
organisational culture on employee creativity.
In this study, top management’s leader’s integrity had a negative
moderating effect on the impact of hierarchy organisational culture on
employee creativity. This is with respect to a high level of top management’s
integrity perceived by employees under a hierarchy oriented organisational
culture. Figure 4.15 suggests a positive increase of the slope of the mean of top
management leader’s integrity. This might have been expressed via top
management leader’s honesty, fairness and openness towards matters related
to employee creativity. These results further indicated that, under the influence
of a strong hierarchy organisational culture, top management leaders of
manufacturing organisations, were already exhibiting a high integrity towards
employees. Additionally, top management’s integrity is commonly associated
with a reputation for, and personal commitment to honesty or sincerity,
openness and fairness (Chun, 2006).

266
Exhibiting a high integrity towards employees ought to aid in
engendering employee creativity through an effective diffusion of creative
ideas; however, the features of integrity, such as honesty, fairness and openness
may be grossly inhibited by the influence of a strong hierarchy organisational
culture. Employees who happen to be recipients of benefits gotten from top
management’s integrity, may end up perceiving top management as
untrustworthy when the workforce lacks the openness it requires to engender
employee creativity. An example of this might be cases where lack of openness
breeds fear, and employees withhold creative ideas due to fear of betrayal
among employees. Implications of top management’s integrity and that of the
hierarchy organisational culture may produce very conflicting perceptions in
the minds of employees (Palanski & Vogelgesang, 2011). Hence top
management’s reputation for high integrity could become very questionable,
when employees still feel their creative ideas are suppressed by strong
bureaucracy and rigid procedures. Jassawalla and Sashittal (2002) stressed on
the need for top management leaders to foster an environment of integrity and
trust, that encourages employees to propose and test creative ideas. Despite the
high top management’s perceived integrity, not much creative ideas can be
shared in an environment where the features of high integrity are impeded by
the prevalence of strict control, tightness of structure and already established
guidelines employees need to follow (Weibel, 2007).

267
Employees may often strictly adhere to the dictates of company policies
and prescribed routine practices required of them rather than commit towards
engendering employee creativity. It could also be a difficult challenge for top
management leaders to try promoting a climate of openness and fairness when
their flair for strict control is still been perceived as a strong impediment to
employee creativity. Hence, creative employees who obtain job satisfaction
from being able to fully utilise, exploit, share and implement their creative
ideas may perceive top management as being too head strong, bullies and
untrustworthy. This could subsequently instil a decline in the growth rate of
employee creativity as most employees may become passively involved rather
than actively involved in employee creativity initiatives. In further support of
this notion, Chun (2006) found that integrity was actually negatively correlated
with innovation which is also a consequence of employee creativity. Findings
of this present study is thus congruent with the suggestions and findings of
prior extant research that has examined the concept of integrity and its
association with employee creativity (Chun, 2006; Peng & Wei, 2016). It can
therefore be concluded that the H5d hypothesis of this study is supported.

268
5.6. The moderating effect of ability, benevolence and integrity on the
impact of clan organisational culture on employee creativity.
5.6.1 Moderating effect of ability on the impact of clan organisational
culture on employee creativity.
In this study, Table 4.9 shows that top management leader’s ability has
no significant moderating effect on the impact of organisational culture on
employee creativity. In Figure 4.5, the slope of the mean suggests a decline of
top management leader’s ability when it is introduced under a clan
organisational culture. This might mean that under a clan organisational
culture, top management’s ability has no statistical moderating significance.
Thus, employee creativity may not be effectively engendered under the strong
influence of this organisational culture dimension.
Dollinger et al. (2007) and Mehlika et al. (2014) have suggested that
employee creativity is grounded in desires and values instead of just top
management’s abilities and skills. The clan organisational culture mirrors a
workforce of homogeneous clusters of employees who share many values
among each other. Tang and Byrge (2016) opined that, employees within the
same homogeneous clusters spend a lot of time together. Fernandes and Polzer
(2015) also supported that employees within the same clusters often tend to
develop intense emotional contact with their colleagues or sometimes, their
superiors. As a result of frequently shared creative ideas and consistent debate

269
about mostly the same topics, circulated information may often end up being
redundant. Studies espouse that this dampens the likelihood that employee
creativity would be engendered (Dingler & Enkel, 2016; Hsu, 2016; Jiao et al.,
2016). Moreover, introducing high ability of top management leaders, in order
to engender employee creativity, ought to aid in nullifying the negative effect
that clan organisational culture might have on employee creativity (Figure 4.5).
However, when top management leaders’ high ability traits are exhibited
within the workforce, employees might tend to experience a sudden push that
could be perceived in the negative sense (Tastan & Davoudi, 2015).
Although this push may have been intended to cause a positive change,
but because it is initiated under the influence of a strong clan organisational
culture, it could be perceived as a change that is steered by an unfamiliar sets
of values. Employees in homogeneous clusters have been known to have
resisted changes introduced through unfamiliar sets of values (Anderson &
Ackerman, 2010; Axtell, Holman, & Wall, 2006). These values may be
exhibited consciously or subconsciously, while top management leader’s high
ability reflect behaviours that are strange and may be difficult to become fused
with already established employee values. Studies accentuate that employee
creativity is bound to be strongly inhibited when the change associated with it
is strongly resisted (Axtell et al., 2006). Therefore, employee creativity in this
situation could be strongly inhibited by employees when top management
leaders try to employ high ability that are strange to employees and even expect
employees to exhibit the same, as a strategy to drive employee creativity

270
initiatives under a clan oriented organisational culture. As such, findings of this
study, is therefore consistent with the discourse of extant literature that have
examined the association and effect of the clan organisational culture, and
ability on employee creativity (Dingler & Enkel, 2016; Hsu, 2016; Jiao et al.,
2016). This, thus, support the postulation of H3b.
5.6.2 Moderating effect of benevolence on the impact of clan
organisational culture on employee creativity.
On the other hand, the H4a of this present study postulated that
benevolence is a moderator of the impact of clan organisational culture on
employee creativity. This however, has been refuted, as findings of this study
indicated otherwise. Contrary to the initial prediction, this study found out that
benevolence is not a moderator as it has not been proven to be statistically
significant. A probable cause of this might be inferred via the results of Figure
4.8. At the slope of the mean, Figure 4.8 suggests that top management
benevolence is almost neither positive nor negative. Hence, a maintained slope
of 0.0 SD. This might further indicate that top management leaders were
exhibiting neither an increased or a decreased level of benevolence.
Benevolence under the clan organisational culture as highlighted in Figure 4.8
has been mostly maintained at a neutral level.

271
Furthermore, Figure 4.8 of this study, indicates that employee creativity
increases when benevolence is high and positive. Employee creativity,
otherwise decreases when it is low and negative. Nevertheless, what really
happens when benevolence is neither high (positive) or low (negative) is yet to
be fathomed. Hence, findings of this present study, therefore, stretches this
discourse a little further by accentuating the state of benevolence when it is
neither positive nor negative. This is such that based on the results of Figure
4.8; Table 4.9 further indicates that benevolence therefore maintains a non-
statistically significant state. Hence, this therefore suggests that at the slope of
the mean, top management leader’s benevolence has no significant effect on
the relationship between clan organisational culture and employee creativity.
Consequently, benevolence does not play the role of a moderator. Recall that
benevolence in the first place reflects acts of goodwill and kindness that are
often expressed through transfer of emotions (Castro et al., 2012; Mayer et al.,
1995). When top management leader’s benevolence is expressed via emotions,
they are known to have the propensity of inhibiting employee creativity when
they are positive and facilitating employee creativity when they are negative
(Yang & Hung, 2015). The finding of benevolence as espoused in Table 4.9 is
thus congruent with the discourse of studies that have espoused on the effect
of benevolence (Castro et al., 2012; Yang & Hung, 2015).

272
5.6.3 Moderating effect of integrity on the impact of clan organisational
culture on employee creativity.
Interestingly, the arguments surrounding the relationship between clan
organisational culture and employee creativity is yet a growing debate. To
extend the scope of discourse in this relationship, this present study further
investigated the moderating role of integrity. This present study found that
integrity is a significant and positive moderator of the impact of clan
organisational culture on employee creativity. It thus highlights that integrity
inverses the negative effect of clan organisational culture on employee
creativity (Figure 4.12). Figure 4.12 suggests that at the slope of the mean, top
management’s integrity faced a decline. However, when top management
leader’s integrity increased, employee creativity also increased and vice versa.
This could be because of a climate of openness, fairness, empathetic and just
nature of top management leaders under a clan oriented organisational culture.
By exhibiting some of these characteristics of integrity, studies accentuate that
it could engender employee creativity, as the diffusion of creative ideas are
rarely inhibited. This discourse is consistent with the findings of Pang and Wei
(2016). The authors found a positive association between manager’s integrity
and employee creativity.
A major reason for the importance of integrity is that it reflects top
management leader’s justifiable commitment to, and reputation for honesty,
sincerity, and reliability between the sets of values expressed through their

273
words and actions (Bauman, 2013; Peng & Wei, 2016). Despite a strong
influence of a clan oriented organisational culture and the probable
consequences of homogeneous clusters, studies thus advocate that clan
organisational culture is negatively associated to employee creativity (Tang &
Byrge, 2016; Stahl et al., 2010). Although, this is consistent with the findings
of this present study, a further step has also been taken to remedy the negative
association. Hence, by examining the moderating effect of top management
leader’s integrity on this relationship, the initial negative effect is consequently
inverted. Such that, despite the issues of having non-redundant creative ideas
and a probably undiversified cluster of employees; employee’s strong
trustworthiness perception that top management leaders are known for their
integrity could subsequently result in a positive effect on employee creativity
(Simons et al., 2015; Pang & Wei, 2016). The findings of Pang and Wei (2016)
is thus consistent with the findings of this present study, such that, integrity
plays a positive and very significant moderating role in engendering employee
creativity. This role has been thus demonstrated via its moderating effect on
the relationship between clan organisational culture and employee creativity
(Figure 4.12). Therefore, this confirms the H5a postulation of this study.

274
5.7. The moderating effect of ability, benevolence and integrity on the
impact of market organisational culture on employee creativity.
5.7.1 Moderating effect of ability on the impact of market organisational
culture on employee creativity.
Despite the features of the market oriented organisational culture, Table
4.9 highlights a significant moderating effect of top management leader’s
ability on the impact of market organisational culture on employee creativity.
Figure 4.5 suggests that at the slope of the mean, employee creativity faced a
decline when top management leader’s ability was low. Given that the
interaction indicates that an increase in top management leader’s ability would
mean an increase in employee creativity and vice versa, it does further infer
that under a market organisational culture, there is a need for top management
leaders to apply increased ability in their application of creative efforts.
The market oriented organisational culture reflects a workforce that has
a strong focus on productivity, competitiveness and directive capabilities. It
consists of top management leaders who are more fixated on improvement of
market penetration and shares (Cameron & Quinn, 1999). Hence, initiatives
may be tailored towards tasks and goals accomplishments. However, in the
wake of an intense era of technological advancement, global competitive
measures have fostered the demand for even organisations influenced by a
market oriented organisational culture to employ creative efforts in order to
engender employee creativity (Titus, 2007). This is also on the knowledge that
a consequence of this could foster increased competitive advantage. In order to

275
efficiently employ creative efforts under a market organisational culture, top
management may require a certain degree of ability to drive creativity
initiatives. Studies have stressed that managers ought to recognise the role of
ability in significantly improving creative efforts, as this could aid in
engendering employee creativity (Guo & Li, 2006; Jiao et al., 2016). Findings
of this present study, is thus, consistent with this notion, as it also found that
an increase in 1 SD unit of ability would cause an increase in employee
creativity (Figure 4.5). This present study, has therefore, demonstrated the
moderating role of ability on the impact of market organisational culture on
employee creativity.
Regardless of, the contradictory notions of studies (Jain et al., 2013;
Kaufman & Baer, 2004; Yazdi, 2007) that have found a negative association
between market organisational culture to creativity, findings of this present
study stretches this notion a little further as it demonstrates that ability actually
nullifies the negative impact of market organisational culture on employee
creativity. This positive and significant role of ability shows that it is a vital
dimension of trustworthiness that contributes positively towards engendering
employee creativity. This notion is also congruent with the debates of studies
that have advocated the positive role of ability in fostering employee creativity
(Dingler & Enkel, 2016; Hsu, 2016; Jiao et al., 2016). It can also therefore be
concluded that the H3c postulation of this study has been met.

276
5.7.2 Moderating effect of benevolence on the impact of market
organisational culture on employee creativity.
Likewise, another vital dimension of trustworthiness that plays a
positive and significant role is benevolence. This is such that, benevolence
positively and significantly moderates the relationship between market
organisational culture and employee creativity. This actually meets this study’s
H4c hypothesized anticipation. Hence, Figure 4.10 supports that top
management leader’s benevolence is capable of increasing the level of
employee creativity if it increases by 1 SD unit and vice versa. Through the
significance of the interaction effect in Figure 4.10, this study demonstrates a
remedy for the espoused negative association between market organisational
culture and employee creativity. This present study, therefore, sheds more light
to the literature. This is such that top management leader’s benevolence further
nullifies the espoused negative effect of market organisational culture on
employee creativity (refer to Figure 4.10).
In line with extant literature (Castro et al., 2012), benevolence may be
identified via several characteristics such as goodwill, altruism, good intentions
or even kindness. These characteristics are expedient factors that top
management might have to consider in order to foster anticipated creative
efforts from employees. Employees may become more open minded, willing
and committed to share creative ideas within a market organisational culture
influenced workforce, when a high level of benevolence is perceived. Focus,

277
on a market oriented organisational culture, may suggest a short and long run
requirement of a high level of creativity. This is due to an increasing demand
to meet up with the constant change in technological advancements (Ghosh,
2015). Knowing that this might lead towards increased innovativeness and
subsequent increase of competitive edge, there is therefore need for market
organisational culture to also consider a market orientation that encourages
generation of creative ideas. Jain et al. (2013) found out that the orientation of
market organisational culture concept, has positive association with
organisational innovativeness; this is also another consequence of engendered
employee creativity.
Since, market organisational culture is also task oriented in nature,
employees may further require a certain degree of benevolence that could
trigger the motivation to stimulate creativity. As one of the predictors of a
creative employee, Amabile (1997) advocated that task motivation is a vital
determinant of the extent an employee is willing to commit creative efforts
towards creativity initiatives. It could be logical to infer that employees may
fail to produce creative results because they are not sufficiently motivated in
that regard. This might also be that it could take a lot of time and effort, to
produce truly creative results even within a market oriented organisational
culture. Employees simply might not possess the required motivation and
values to address relative creative tasks. Considering the sets of values
exhibited within the market oriented organisational culture, employees might
prefer to focus on productiveness and market share penetration. Involvement

278
in further creative tasks could be abandoned half way through, if employees do
not feel motivated to commit creative efforts towards engendering employee
creativity. Titus (2007) argued that the absence of sufficient task motivation
for employees could otherwise foster early abandonment of creative efforts.
This insight is found consistent with the findings of an investigation initiated
by Institute of Personality Assessment (Rowe, 2004). The findings highlighted
that motivation is a major driver that determines creative failure or success.
Motivated employees, therefore, tend to collectively embrace creative
tasks and contribute their resources such as creative ideas, in order to engender
employee creativity (Ndaliman at al., 2015). In light of this, values expressed
require a certain degree of benevolence to further guarantee sustainable
commitments towards creativity initiatives (Dingler & Enkel, 2016; Dollinger
et al., 2007). A sense of kindness, a show of love or even the knowledge that
top management has good intentions towards employees who strive to
engender EC, could go a long way to inspire motivation in employees. It is thus
argued that the features of benevolence have a way of stimulating motivation
in employees to exhibit creative efforts in defined creative tasks (Yang &
Hung, 2015). Managers ought to therefore recognise the positive and
significant moderating role of benevolence. Finding of this present study, is
thus consistent with that of extant literature that has accentuated on the positive
role or association of benevolence (its features and proxies) to employee
creativity (Castro et al., 2012; Yang & Hung, 2015).

279
5.7.3 Moderating effect of integrity on the impact of market OC on EC.
Figure 4.14 suggests that the market organisational culture has a
negative effect on employee creativity. This supports the argument of the
negative association of the features of strong market organisational culture to
employee creativity. Additionally, Table 4.9 also illustrates that top
management leader’s integrity has a positive and significant moderating effect
on the impact of organisational culture on employee creativity. It further relates
that integrity is another vital trustworthiness dimension that top management
leaders ought to take into consideration. In order to engender employee
creativity, the top management leaders ought to ensure that their standards of
integrity remain unquestionable, even over time. Employees would be more
interested in sharing their creative ideas with a top management leader that is
committed to, and has a reputation for high integrity (Hoch, 2013).
In a market oriented organisational culture, there is often a thriving
drive to push employees towards becoming more productive, targets achieving,
and to meet set deadlines (Cameron, 2008). This may however, offset the
cognitive flexibility of an employee with strong creative potentials to engender
employee creativity. According to Titus (2007), Hargrove (2012), Kauppila
and Tempelaar (2016), and Murray et al. (1990), cognitive flexibility has long
been perceived as a favourite trait for employees desiring to develop their
creative output. The authors argue that cognitive flexibility is a way of thinking
which involves consistent use of alternative methods to provide solutions to
challenging tasks. Under the strong influence of a market oriented

280
organisational culture, employees may find it difficult to consistently employ
alternative pathways to provide solutions to challenging task related problems.
This is in view that employees who also thrive by applying creative efforts to
foster tasks accomplishment, might feel constrained to exploit their potentials.
Creative employees may feel their creative capabilities are suppressed by the
features of the strong influence of a market oriented organisational culture.
However, with strong employee perceptions of their top management
leader’s high standard of integrity, the chances of sharing and acting upon
creative ideas are quite likely. This is in view that they may become confident
that their top management leaders would embrace their creative efforts.
Moreover, it might be logical to accentuate that as long as employee creative
efforts positively contributes towards the goals and objectives enshrined within
the market organisational culture; it might be very likely that top management
leaders would relay more support towards engendering employee creativity.
Employees, on the other hand may be more willing to further commit towards
creativity initiatives, since they have more autonomy to exercise their cognitive
flexibility and subsequently engender employee creativity.
Studies have demonstrated that to a high extent, integrity has a
significant and or plays a positive role in encouraging and stimulating
employee creativity (Hoch, 2013; Peng & Wei, 2016). By further investigating
the nature of interaction of integrity in Figure 4.14, this study finds that
integrity thus has a positive and significant moderating effect on the negative

281
association of market organisational culture to employee creativity. This
therefore point out that, the application of increased top management leader’s
integrity is a strong recommendation for engendering employee creativity,
even in a market oriented organisational culture. This is such that integrity, in
this present study, inverts the negative effect of market organisational culture
on employee creativity. The findings of this study is therefore consistent with
findings and supporting arguments of extant research (Bauman, 2013; Hoch,
2013; Peng & Wei, 2016; Simons et al., 2015) that have espoused on the
positive role of integrity. It further confirms the H5c of this study.

282
CHAPTER SIX
CONCLUSION AND RECOMMENDATIONS
6.1. Introduction
This chapter presents an overall summary of the key findings. It
highlights a Multi-Level Organisational Culture and Trustworthiness
Structural Template (MOCTST), for manufacturing organisations and decision
makers to consider when engendering employee creativity. It highlights
theoretical contributions and implications that reflect on this study’s
multidimensional model for engendering employee creativity. This section also
provides some policy implications for policy makers. The limitations of this
present study and recommendations for future research is subsequently
discussed. Additionally, a concise conclusion is highlighted at the end of this
final chapter.
6.2 Summary of thesis
One of the major goals of a research grounded in employee creativity
is to foster innovative benefits that are born out of the stem of effective
diffusion of creative ideas. Creative ideas are important for short and long term
survival of a manufacturing organisation. They are also important for
engendering employee creativity, for manufacturing organisations that seek to

283
thrive even in this era of constant change and uncertainty. Although, it is one
thing to have a spark of a creative idea, it is also another thing to ensure its
diffusion, hence its subsequent implementation. A common challenge for
employees within the workforce, may not often be the inability to generate
creative ideas. It might be that of trusting that the top management leaders
vetting their creative ideas would embrace and support their creative ideas to
achieve their innovative results. However, potential innovative results could be
perceived as instigators for acceptance, rejection or suppression of creative
ideas that could be vital for engendering employee creativity. Likewise, to
engender employee creativity within manufacturing organisations, it does
require the strong support of a flexible type of organisational culture. The
degree at which employee creativity manifest, is subsequently determined by
the magnitude of trustworthiness exhibited by several top management leaders,
respectively. It is therefore pertinent to note that the various dimensions of
organisational culture and top management’s trustworthiness are being
exhibited consistently and respectively, in manufacturing organisations across
the globe. Nevertheless, with respect to the scope of this study, an in-depth
examination of the case of the Nigerian manufacturing industry has aided to
shed more light on this study’s aims and objectives.
The Nigerian manufacturing industry, is an important organ of
Nigeria’s economic and innovation development. Deep within the core of its
innovations culture, Nigerian manufacturing industry ought to recognise the
grave importance of engendering employee creativity. With a view to engender

284
employee creativity, it is also important to consider the roles of a supportive
organisational culture and the significant moderating effects of top
management leader’s trustworthiness. The country often highlights the need to
be more innovation centric, but has rarely shifted its focus from the innovation
surface to a rooted perspective, where employee creativity, ought to first thrive
through the effective diffusion of creative ideas. Therefore, based on the
findings of this study, the MOCTST was developed for manufacturing
organisations to consider, when engendering employee creativity (Figure 6.1).
The MOCTST suggests several noteworthy considerations that may help to
foster positive and significant benefits to the Nigerian manufacturing industry.

285
FIGURE 6. 1: A Multi-Level Organisational Culture and Trustworthiness Structural Template (MOCTST), for engendering employee creativity.2
2 Note: OC (Organisational culture); EC (Employee creativity); The signs (-/+) and significant and not significant arrows directions indicate the nature/positions of the
respective moderators (Ability, benevolence and integrity).

286
The MOCTST relates four different levels of the organisational culture
dimensions. Each organisational culture level reflects their respective findings
based on this present study. Each of the organisational culture levels are made
up of their respective quadrants. Each quadrant consists of information
suggesting the effect of that dimension of organisational culture on employee
creativity. It also highlights the nature of each moderator’s effect in that
quadrant; indicating whether they have positive or negative, significant or not
significant effects on the impact of the organisational culture dimension on
employee creativity.
The MOCTST reflects a guide or roadmap for Nigeria manufacturing
organisations to consider and employ in order to engender employee creativity.
It profiles the several impacts of organisational cultures that are prevalent
within the Nigerian manufacturing industry. It also offers a guide to aid
organisational top management leaders in making decisions regarding their
organisational culture. Such decisions that might be more appropriate for them
to effectively engender employee creativity. It also highlights what
organisational culture to avoid or should be adopted to engender employee
creativity. The MOCTST, also points out possible moderators that can be
applied or should not be applied under specific organisational cultures. By
highlighting the nature/positions of respective moderators in each quadrant, top
management leaders can be able to know the relative moderator(s) to improve
upon. Furthermore, for manufacturing organisations who are already being
strongly influenced by a specific dimension of organisational culture, the

287
MOCTST provides an immediate and simplistic advice to top management
leaders on what trustworthiness dimension to either foster or mitigate for in
order to yet engender employee creativity. The MOCTST mirrors a rather
simplistic overview of the complex results of this study.
As an aid to further comprehend the summary of findings of this study,
the MOCTST relate that the clan organisational culture has a significant and
negative direct effect on employee creativity. Although, employee creativity
might be engendered, it may however, be engendered to a certain extent where
it would either cease to be engendered or become engendered rather slowly.
This infers that organisations under a strong influence of the clan
organisational culture may struggle to excel innovatively in the long run. This
could be due to over familiarity of exchanged values and absence of no new
information or values that challenges the current status quo of doing things.
Engendering of employee creativity may require constant diffusion of creative
ideas to ensure it is being constantly engendered. Top management leaders
ought to endeavour to not overlook the consequences the negative effects clan
organisational culture might have on employee creativity. The MOCTST also
indicates that top management leader’s integrity has a positive and significant
moderating effect on the negative impact of clan organisational culture on
employee creativity. As a plausible remedy to the negative effect of clan
organisational culture on employee creativity, top management leaders ought
to strive to ensure their integrity remains unquestionable. It has the propensity
to subsequently engender employee creativity. This is also because their

288
integrity can inverse the negative effects of clan organisational culture on
employee creativity. The MOCTST also shows that, although top management
leader’s ability and benevolence appear to be positive moderators, they are
statistically not significant.
The second quadrant of the MOCTST shows the impact of adhocracy
organisational culture on employee creativity. It indicates that the adhocracy
oriented organisational culture have significant and positive direct effect on
employee creativity. In order to engender employee creativity, top
management leader’s might also want to consider adopting an adhocracy
oriented organisational culture. This is due to its prevalent focus on
innovativeness, entrepreneurial spirit and creativity centred objectives. It could
thus be inferred that the collective features of adhocracy organisational culture
relate a structure that allows for employee creativity to be consistently
engendered. However, in this quadrant, the results show that top management
leader’s ability, benevolence, and integrity have significant negative
moderating effects on the impact of adhocracy organisational culture on
employee creativity. This study demonstrates that within the adhocracy
organisational culture, ability, benevolence and integrity are seemingly high.
This seems to be consistent with a logical assumption that, top management
leaders might be required to exhibit high standards of ability, benevolence and
integrity, in order to efficiently engender employee creativity. Nevertheless,
this study further highlights that when these trustworthiness dimensions

289
become too high, they reflect negative effects on the positive impact of
adhocracy organisational culture on employee creativity.
In the third quadrant, the MOCTST highlights that there is no
significant direct relationship between hierarchy organisational culture and
employee creativity. Top management leaders ought to acknowledge that,
while the hierarchy organisational culture might not be a recommended type of
culture for engendering employee creativity, it may however, be important
during the implementation of creative ideas. This is due to the need for control
and direction regarding the fruition of creative ideas. During the
implementation (innovations) of creative ideas, top management ought to
exhibit an acceptable degree of control rather than an enforced kind of control.
Moreover, the MOCTST illustrates that top management leader’s benevolence
and integrity have negative moderating effects on the impact of hierarchy on
employee creativity. It also demonstrates that top management leader’s ability
does not moderate the relationship between hierarchy organisational culture
and employee creativity. This is because ability in this quadrant, is not
statistically significant.
The fourth and final quadrant of the MOCTST indicates that the market
organisational culture have a significant and negative direct effect on employee
creativity. It shows that top management leader’s ability, benevolence, and
integrity are positive and significant moderators of the negative effect of
market organisational culture on employee creativity. Additionally, findings of

290
this study also suggest that it is vital for top management leaders to exhibit an
acceptable degree of ability, benevolence and integrity. This is because when
they are not being influenced, or neither acting as moderators, they all have
positive and significant direct effects on employee creativity. Hence they play
very important roles in engendering employee creativity.
Based on the MOCTST, this study also indicates that in order to
engender employee creativity, both existing and new manufacturing
organisations may want to consider adopting and employing the adhocracy or
market organisational cultures. This is due to the significant and positive direct
effect adhocracy organisational culture have on employee creativity. This is
also because the adhocracy organisational culture is structured to engender
employee creativity via its features of innovativeness, flexibility, risk taking,
external focus and differentiation. Likewise, the market organisational culture
is another option for engendering employee creativity. This is because it is
positively and significantly moderated by top management leader’s ability,
benevolence and integrity. Hence, top management leaders do have important
roles to play in ensuring that they exhibit acceptable levels of ability,
benevolence and integrity in order to engender employee creativity.
6.3. Study Implications
This section relating to the discourse of study implications is divided
into two parts, such as the theoretical contributions and implications, and the

291
policy implications for the study. They are structured to relay invaluable
insights to practitioners and policy makers.
6.3.1 Theoretical Contributions and Implications
To the best of the researcher’s knowledge, this study is among the first
to integrate and empirically examine specific theoretical and conceptual
underpinnings to engender employee creativity in Nigerian manufacturing
industry. To aid this analysis, this study thus employed the conceptual insights
of Cameron and Quinn (2006) competing values framework (CVF) for
profiling and examining organisational cultures, and the concept of
trustworthiness from Mayer et al. (1995). These have been employed to support
the undergirding of Amabile (1997) componential theory of individual
creativity (Refer to Figure 2.4). To reflect their contributions to the theory, this
study has therefore demonstrated that organisational culture mirrors positive
and negative, significant and insignificant effects on employee creativity
(Figure 6.1). This has been evidenced via an examination of the impacts of
organisational culture dimensions on employee creativity. Likewise, this study
has also demonstrated that ability, benevolence and integrity are moderators of
the relationship between organisational culture and employee creativity.
Although the nature in which they manifest differs based on the organisational
culture type under scrutiny (Figure 6.1). This study has also shown at what
conditions these moderators are either positive or negative and significant or
insignificant.

292
Several extant literature has examined the organisational culture
concept from a unidimensional perspective (Jan & Hazel, 2013) or in terms of
mainly its descriptive characteristics (Hogan & Coote, 2014). Investigations of
a growing body of literature (for example, Deshpande, Farley, & Webster,
1993; Lau & Ngo, 2004; Naranjo-Valencia et al., 2010, 2011; Obenchain &
Johnson, 2004) that has employed the CVF in order to examine its effects on
employee creativity, have notably resulted in question of endogeneity issues.
This is due to lack of not examining and or not measuring the complete
proposed dimensions of the CVF. This has led to a subjective centred approach
to thorough scrutiny of organisational culture. Although, these approaches may
have produced relevant findings, they are often limited to mainly a narrow view
of the depth of what organisational culture really is. Hence, its several
conflicting definitions. Therefore, it could thus, be inferred that results
obtained from these studies that have investigated organisational culture effects
on employee creativity are both limiting and or misleading (Deshpande et al.,
1993; Lau & Ngo, 2004; Naranjo-Valencia et al., 2010, 2011; Obenchain &
Johnson, 2004). This is because they failed to enhance the theoretical insights
of all organisational culture dimensions, and how these various dimensions,
impact employee creativity. It is deemed misleading as it may guide readers to
develop a perception that organisational culture mainly demonstrates a
particular kind of impact on employee creativity.

293
Equally, in the discourse of the Amabile (1996, 1997) Componential
Theory of Individual Creativity, organisational culture was highlighted as a
factor that could be an obstacle and or facilitator of employee creativity.
However, Amabile (1996, 1997) did not highlight what kind of organisational
culture is or could actually be a facilitator or an obstacle to employee creativity.
Without an in-depth analysis of what exact organisational culture might
actually be an obstacle or facilitator; organisations may be guided by the
perceptions that organisational culture as a whole, is mainly a facilitator or an
obstacle to employee creativity. This further limits the degree of insights
relevant to understand how organisational culture actually impacts employee
creativity.
Therefore, this study has attempted to bridge these gaps and contribute
to the theory, by highlighting and profiling the organisational culture via its
four distinct dimensions (based on the CVF). To shed more light on this, this
study has also examined their various impacts on employee creativity, and this
has led to its rather significant findings. This study also contributed to the
Componential Theory of Individual Creativity by further confirming that the
hierarchy organisational culture dimension is an obstacle, as it has no
significant relationship to employee creativity. Conversely, this study
confirmed that the adhocracy organisational culture is also a facilitator and can
actually engender employee creativity. This is due to its significant direct effect
on employee creativity.

294
This study enhanced the insights of the Componential Theory of
Individual Creativity by further extending the scope of establishing causal
effects between organisational culture and employee creativity. Given that not
all dimensions of the organisational culture have significant effects on
employee creativity. It thus, examined what trustworthiness traits top
management leaders ought to exemplify, in order to subsequently engender
employee creativity. This study provided additional clarity to already existing
literature by further demonstrating that top management leader’s
trustworthiness could function as both moderator and predictor. This is with
respect to the significant moderating and direct effects highlighted in this study.
This has consequently been investigated by demonstrating the significant roles
of top management leader’s ability, benevolence and integrity on the impact of
organisational culture on employee creativity. Hence another major
uniqueness of this study.
Additionally, the proposed multidimensional model (Figure 2.4) sheds
more light that enhances the perceptions surrounding the association between
organisational culture dimensions and employee creativity. It highlights that
contrary to conventional assumptions, the clan organisational culture is
actually significantly and negatively associated with employee creativity. It
also confirms the widespread conviction that the adhocracy organisational
culture could be a most appropriate fit for an organisational culture seeking to
engender their employee creativity. It even further confirms that the market
organisational culture demonstrates a direct negative effect on employee

295
creativity. Notably, this study further reiterates that the hierarchy
organisational culture has no significant effect on employee creativity.
As a consequence of Figure 2.4, the MOCTST illustrates that under an
adhocracy organisational culture, top management leaders ought to be cautious
of not exerting too high ability, benevolence and integrity. This is because they
tend to have significant negative effects on employee creativity. The negative
effects may appear in form of work stress, due to pressure employees may
experience from top management’s expectations of them. Likewise, top
management leaders should also try to avoid employing a hierarchy
organisational culture to engender employee creativity. This study confirmed
the findings of extant literature that espoused that it does not have any
significant effect on employee creativity. For manufacturing organisations who
are already strongly influenced by a hierarchy organisational culture, and may
yet want to engender employee creativity; such organisations might have to
consider finding an acceptable balance of top management leader’s
benevolence or integrity or executing an adhocracy organisational culture
change entirely.
As a plausible solution to the significant negative effect of the clan
organisation culture on employee creativity, the MOCTST highlights that top
management leaders should endeavour to improve upon their integrity. This is
because it actually nullifies the negative effect clan organisational culture has
on employee creativity. Similarly, for organisations where the market

296
organisational culture is prevalent, and they yet seek to engender employee
creativity, considerations could be tailored towards applying an acceptable
degree of top management leader’s ability, benevolence and integrity. This is
also because ability, benevolence and integrity reflect positive and significant
effects that nullifies the significant negative impact of market organisational
culture on employee creativity. Hence, the MOCTST provides the
manufacturing organisations under the strong influence of market
organisational culture, a way to yet engender employee creativity. This study
therefore demonstrates strong and insightful theoretical implications and
contributions to the rising wealth of creativity, trustworthiness and
organisational culture literature.
6.3.2 Policy Implications
By adopting the MOCTST in Nigerian manufacturing organisations,
this study therefore advocate that policy makers and practitioners should be
able to profile prevalent and supportive organisational cultures, expedient for
engendering employee creativity. They should be able to examine the
conditions at which, and how ability, benevolence and integrity moderates the
impact of organisational culture on employee creativity. Likewise, policy
makers and practitioners ought to take into consideration the following
suggestions:

297
1) There is a need for the development and adoption of policies
that support and foster the formation of heterogeneous clusters of employees
within Nigerian manufacturing industry. This would be important for a
workforce that is strongly influenced by the clan organisational culture.
Considering the dominant attributes of cohesiveness, teamwork, sense of
family and participation in typical clan organisational cultures; policies and
programs should be tailored towards evaluating and developing the human
resources of manufacturing organisations. This should be with the aim of
recruiting for diversified talents within the workforce. Given that top
management leadership style within clan organisational culture reflects that of
facilitators, mentors and parent-figure; it could be important for processes to
be put in place to further ensure that top management leaders integrity remain
upheld and unquestionable. This is also with respect to the bond of values such
as loyalty and interpersonal cohesion, that are prevalent within the clan
organisational culture.
2) Thorough attention should be given towards development of
models and strategies that would continue to foster and encourage the spirit of
creativity, adaptability and even entrepreneurship. This would be very relevant
for employees within the workforce that is strongly influenced by adhocracy
organisational culture. Considering the dominant attributes of innovativeness,
it would be imperative that more resources be allocated to foster growth and
consequently engender employee creativity. A more engendered employee
creativity could mean more innovations for manufacturing organisations. More

298
innovations could mean organisational expansion and further creation of job
opportunities. More innovations could also aid to improve the Nigerian’s
economy by a far margin. Moreover, achieving all these may require top
management to employ high ability, benevolence and integrity to drive
creativity initiatives under the adhocracy organisational culture. This is also
because top management leadership styles often reflect that of an innovator and
a risk taker. However, top management behavioural control measures and
employee feedback systems should be developed and encouraged to mitigate
against possible negative effects of too high ability, benevolence and integrity.
3) To engender employee creativity, strong government
collaborations with the institutions and agencies responsible for the
manufacturing industry’s overall management should be inspired to strongly
uphold and recommend against the adoption or continued application of
hierarchy organisational cultures. Several related institutions like for example:
The Nigerian Association of Chambers of Commerce, Industry, Mines, and
Agriculture (NACCIMA) and the Manufacturers Association of Nigeria
(MAN), could aid to ensure control policies regarding such recommendation
remains binding. Nevertheless, an inspired form of flexible control, rooted in
intrinsic task motivation might be very effective in this regard. This is to enable
already established and new manufacturing organisations implement or further
adopt an organisational culture change that engenders employee creativity.
Copies of the MOCTST could be further circulated through these institutions

299
to help reiterate the significance of applying an appropriate organisational
culture.
4) Manufacturing organisations would certainly need to promote
their innovations after the early stages of the diffusion of creative ideas are
over. Policies could be developed to support a probable balance of both
adhocracy and market organisational cultures. Adhocracy organisational
culture would be very vital for fostering the diffusion of creative ideas and
foster innovativeness. On the other hand, market organisational culture should
be employed to promote competitive advantage and also market superiority of
the results of creative ideas. Since the leadership style in the market
organisational culture is centred on goal achievement orientations and
decisiveness, trustworthiness standards should be set up to ensure that top
management leaders exhibit an acceptable degree of ability, benevolence and
integrity. This is with respect to the trustworthiness’ positive and significant
nullifying effects of the negative impact of market organisational culture on
employee creativity.
5) In order to ensure a strong diffusion of creative ideas, programs
and initiatives should be put in place to support and consistently ensure that
top management leaders continue to exhibit a suitable and acceptable degree
of ability, benevolence, and integrity. This is also because all trustworthiness
dimensions have positive and significant direct effects on employee creativity.
To further engender employee creativity, the diffusion of creative ideas within

300
the workforce should be strongly supported by an integration of the leadership
styles endemic within the market and adhocracy organisational cultures. These
leadership styles of decisiveness, goal achievement-orientations,
innovativeness and risk taking should be exemplified on a satisfactory but not
too high levels of ability, benevolence and integrity. Based on the results of
this study, this approach is advocated to subsequently aid in engendering
employee creativity in Nigerian manufacturing organisations.
6.4 Limitations of Research
Despite the contributions of this study to the relative body of literature,
it is yet not without its limitations. Hence, this study suggests that due to the
limitations, strong considerations should be given towards the findings and
interpretations.
The prime focus of this study is based on an individual level analysis.
This does not relay sufficient information of value compared to examining this
study from the scope of an organisational level. A much broader insight into
engendering employee creativity could have been achieved since a view into
an organisational level would mean introducing new variables into the study.
The features of the organisational culture which mirrors flexibility and
discretion, stability and control, internal and external focus and integration
have not been extensively considered in this study. They have not been thus

301
considered because they are actually descriptive features that reflect the
directions or paths of the organisational culture dimensions. They are not
particularly parts of the dimensions of the organisational culture, and the
direction of this study is tailored towards engendering employee creativity, not
otherwise.
The study acknowledges its use of a cross-sectional research design to
obtain its data. Hence, this might have limited the understanding of the
relationship between organisational culture and employee creativity.
Employing a longitudinal study might have aided to collect more data and
engender comparability of results across periodic investigations. A one-time
data collection certainly limited this study from achieving more significant
results that may have fostered stronger policy implications. Generalizability of
this study’s results should therefore be addressed with caution. This is also
because, information obtained during data collection processes did not
originate from a specific manufacturing company across all 7 states of Nigeria.
However, it is yet reliable as investigations were initiated in the headquarters
of all 21 manufacturing organisations. Each headquarter wholly represented
and reflected the overall aims and objectives of this study.
Nevertheless, the results of this study could be replicated across the
boundaries of Nigeria, in manufacturing industries or other sectors, seeking to
engender employee creativity. This is also plausible as the generalizability and
replicability of organisational culture, trustworthiness and employee creativity

302
examined in this study, have been distinctively evidenced in diverse contexts
of extant research (Barbara & Valerie, 2007; Bradley et al., 2014; Naranjo-
Valencia et al., 2016; Ogbeibu et al., 2017). Dimensions of the employee
creativity construct (expertise, creativity skills, task motivation) have been
measured as a unidimensional construct. However, the employee creativity
construct has been analysed based on the total score of the three unidimensional
constructs (expertise, creativity skills, task motivation). Examining the impacts
of organisation culture’s several dimensions on each of the employee creativity
dimensions might have also helped to contribute significantly to the
investigations and results of this study.
The investigations carried out in this study has been centred mainly on
employee’s perceptions of their creativity, their organisational culture and their
top management leader’s trustworthiness. This study did not include the top
management leader’s perception of their own creativity, organisational culture
and their perceptions of their employees’ trustworthiness. This might have
otherwise produced valuable information that sheds more light on top
management leader’s involvement and what their trustworthiness perceptions
of their employees might actually be. Likewise, organisational members with
less than 3 year’s organisational tenure were exempted from the data collection
processes. It might be possible that employees within this category may have
had or gained knowledge that might have contributed substantially to this
study’s findings.

303
6.5 Recommendations for Future Research
The focus of this study was on Nigerian manufacturing industry.
Studies may consider examining other industry sectors, for example: mining,
oil or services industry sectors within Nigeria. These sectors also have a
potential of making positive significant contributions that stems from their
plausible association to employee creativity. The scope of this study mainly
reflected results obtained from the headquarters of 21 manufacturing
organisations. Future studies may focus on foreign multinational companies in
Nigeria, in order to obtain richer insights and comparable results of their
organisational cultures, trustworthiness and employee creativity systems.
These results could help improve the current findings of this study by
provoking new research prospects and expounding on prominent gaps that are
related to the aims and objectives of this present study. Moreover, studies could
be initiated over a cross national context to further confirm the generalizability,
replicability and applicability of findings of this present study.
Further investigations involving a cross-examination of both the
organisational and individual level could be initiated to foster a multilevel
analysis. This could facilitate a broader scope and provide wider insights that
covers aspects of the organisational level (for example: resources, corporate
structure and leadership, even work environmental influences). Future studies
could also consider examining the four dimensions of organisational culture
with respect to flexibility and discretion, stability and control, internal and

304
external focus and integration. Future studies should endeavour to employ a
longitudinal study analysis, to measure the degree of change encountered from
causal and moderating effects of trustworthiness. It could be that the nature of
top management leader’s trustworthiness may be affected positively or
negatively at certain periods of time and by certain factors. This could be more
substantial when examined from a multilevel perspective. Considerations may
be extended towards employees; despite their duration of organisational tenure.
This is in a bid to derive findings that might close the increasing fractured
debate that has plagued the measurement of creativity. Potential results could
thus highlight what exactly defines a creative employee and how much
creativity could actually be termed as novelty or ordinary.
Moreover, future studies should also investigate the plausible effects of
organisational culture dimensions on all three dimensions of Amabile (1997)
componential theory of individual creativity. This would aid to shed more
theoretical and methodological insights into how expertise, creative skills and
task motivation are impacted by the dimensions of organisational culture.
Results of the moderating effect of trustworthiness in this relationship could
also prove very substantial in provoking further significant theoretical and
methodological implications. Additionally, future studies may consider
investigating top management leader’s perception of their own creativity,
organisational culture and also their perceptions of their employees’
trustworthiness. Broader insights into what roles employee’s trustworthiness
play and at what conditions could employee trustworthiness be either

305
encouraged, controlled or mitigated; could be obtained. Another consideration
for further research should be an examination of the influence of organisational
control. This is necessary to further comprehend and gauge the degree at which
either top management leaders or employees need to, or not exhibit, or exhibit
less of their ability, benevolence and integrity. Organisational control could
even be thus employed to moderate the moderating effects of trustworthiness
on the relationship between organisational culture and employee creativity.
Future studies may also consider exploring and investigating what kind of
processes could be put in place to ensure top management leader's integrity,
ability and benevolence remain upheld and unquestionable. It could also
analyse how the identified processes could be executed to ensure their effective
and efficient implementation. Therefore, future studies may try to probe what
these processes could be and how they could be implemented. Additionally,
one area this study might have overlooked, and that could be considered for
further investigations is that of how national culture could influence the
organizational culture. This could help to deepen the insights into major
differences that might abound in diverse values, beliefs systems and underlying
assumptions of distinct employees in a specific country and what impacts they
may have on employee creativity.
6.7 Conclusion
The main aim and objective of this present study is to investigate and
espouse the moderating effects of top management leader’s trustworthiness on

306
the impact of organisational culture on employee creativity. This study
examined the several impacts of four distinct dimensions of the organisational
culture on employee creativity. It further highlighted the moderating and direct
significant effects of ability, benevolence and integrity on the impact of
organisational culture on employee creativity. By developing a
multidimensional model, it has demonstrated that organisational culture
(through its dimensions) has both positive and negative, significant and
insignificant effects on employee creativity. Based on the results gotten from
an examination of the multidimensional model, this study has also developed
and highlighted the MOCTST for manufacturing organisations in Nigeria, to
help engender their employee creativity. The MOCTST has been exemplified
as a useful tool and resource that provides valuable guide to both policy makers
and practitioners. It highlights relevant pathways by which manufacturing
organisations may address concerns relating to their organisational culture
effect on employee creativity. It also espouses the nature of and conditions in
which top management leaders’ trustworthiness reflect positive or negative,
and significant or insignificant effects on the impact of diverse organisational
cultures on employee creativity.
Overall, this study further emphasised on the need for policy makers
and practitioners to substantially consider adopting and fostering the features
of adhocracy and or market organisational cultures in order to efficiently and
effectively engender employee creativity. Furthermore, it advocated that strong
considerations should also be given to the positive and significant moderating
effects of top management trustworthiness when employing the features of the
market organisational culture to engender employee creativity.

307
REFERENCES
Adeel, M., Francis, T., & Simon, B. (2006). The performance of Nigerian
manufacturing firms: report on the Nigerian manufacturing enterprise survey.
Oxford: Centre for the study of African economies, University of Oxford.
Adejumo, A. V. (2013, July). Foreign Direct Investments and Manufacturing
Sector Performance in Nigeria. Australian Journal of Business and
Management Research, 3(4), 39-56.
Ademola, O. J. (2014). Working Capital Management and Profitability of
Selected Quoted Food and Beverages Manufacturing Firms in Nigeria.
European Journal of Accounting Auditing and Finance Research, 2(3), 10-21.
Afsar, B. (2016). The impact of person-organization fit on innovative work
behavior: the mediating effect of knowledge. International Journal of Health
Care Quality Assurance, 29(2), 1-32.
Afthanorhan, W. M. (2013). A Comparison Of Partial Least Square Structural
Equation Modeling (PLS-SEM) and Covariance Based Structural Equation
Modeling (CB-SEM) for Confirmatory Factor Analysis. International Journal
of Engineering Science and Innovative Technology, 2(5), 198-205.
Agnieszka, W.-T., & Dariusz, T. (2016). The significance of perceived social-
organization climate for creating employees’ innovativeness. Management
Research Review, 39(2), 167 - 195.
Aguirre, D., Post, L., & Hewlett, S. A. (2009). Global Talent Innovation
Strategies for Breakthrough Performance. Booz & Company Inc., (pp. 1-28).
San Francisco.

308
Ajay, K. J., & Ana, M. (2015). Organizational learning, knowledge
management practices and firm’s performance. The Learning Organization,
22(1), 14-39.
Akgunduz, Y. (2015). The influence of self-esteem and role stress on job
performance in hotel businesses. International Journal of Contemporary
Hospitality Management, 27(6), 1082-1099.
Akinwande, M., Dikko, H. G., & Samson, A. (2015). Variance Inflation Factor:
As a Condition for the Inclusion of Suppressor Variable(s) in Regression
Analysis. Open Journal of Statistics, 5, 754-767. doi:10.4236/ojs.2015.57075
Akume, A. T., & Abdullahi, Y. T. (2013). Challenges and prospects of
effective industrial conflict resolution in Nigeria. Journal of Social Science,
36(2), 199-208.
Alfred, W., Dean, T., & Chunhong, L. (2009). “Innovation by teams in
Shanghai, China: cooperative goals for group confidence and persistence.
British Journal of Management, 20(2), 238-251.
Allen, E., & Seaman, C. (2007). Likert scales and data analyses. Quality
Progress, 40(7), 64-65.
Amabile, M. T. (1997). Motivating Creativity in Organisations: On doing what
you love and loving what you do. CALIFORNIA MANAGEMENT REVIEW,
40(1), 39-58.
Amabile, T. M. (1988). A model of creativity and innovation in organizations.
In B. M. Staw, & L. L. Cummings, Research in Organizational Behavior (pp.
123-167). Greenwich, CT: JAI Press.
Amabile, T. M., & Mueller, J. S. (2008). Studying Creativity, Its Processes,
and Its Antecedents: An exploration of the componential theory of creativity.

309
In J. Zhou, & C. E. Shalley, Handbook of Organizational Creativity (pp. 33-
64). New York: Lawrence Erlbaum Associates.
Amabile, T. M., & Pillemer, J. (2012). Perspectives on the social psychology
of creativity. The Journal of Creative Behavior, 46(1), 3-15.
Amabile, T. M., Hill, K. G., Hennessey, B. A., & Tighe, E. M. (1994). The
Work Preference Inventory: Assessing Intrinsic and Extrinsic Motivational
Orientations. Journal of Personality and Social Psychology, 66(5), 950-967.
Amiri, S. R., Qayoumi, A., & soltani, M. (2014). Study the relationship
between organization culture and employee’s creativity in cultural
organizations (a case study). Kuwait Chapter of Arabian Journal of Business
and Management Review, 3(10(a)), 332-341.
Anastasia, A. K. (2015). Transformational leadership and organisational
performance: Three serially mediating mechanisms. Employee Relations,
37(3), 329 - 353.
Anderson, D., & Ackerman, L. A. (2010). Beyond Change Management: How
to Achieve Breakthrough Results Through Conscious Change Leadership (2nd
ed.). California: Pfeiffer(John Wiley and Sons).
Andreeva, T., & Kianto, A. (2011). Does knowledge management really
matter? Linking knowledge management practices, competitiveness and
economic performance. Journal of Knowledge Management, 16(4), 617-636.
Ann-Marie, N., Philipp, D. R., Rosalind, S., & Gerhard, S. (2015). A
qualitative meta-analysis of trust in supervisor-subordinate relationships.
Journal of Managerial Psychology, 30(5), 507 - 534.

310
Antonakis, J. (2017, February 4). On doing better science: From thrill of
discovery to policy implications. The Leadership Quarterly, 28, 5-21.
doi:10.1016/j.leaqua.2017.01.006
Antonakis, J., Bendahan, S., Jacquart, P., & Lalive, R. (2010). On making
causal claims: A review and recommendations. The Leadership Quarterly, 21,
1086–1120. doi:10.1016/j.leaqua.2010.10.010
Anugamini, P. S., & Rajib, L. D. (2016). "Impact of leader member exchange,
human resource management practices and psychological empowerment on
extra role performances. International Journal of Productivity and
Performance Management, 65(3), 351 - 377.
Artino, A. R., La Rochelle, J. S., Dezee, K. J., & Gehlbach, H. (2014).
Developing questionnaires for educational research: AMEE Guide No. 87.
Medical Teacher, 36, 463–474.
Astrachan, C. B., Patel, V. K., & Wanzenried, G. (2014). A comparative study
of CB-SEM and PLS-SEM for theory development in family firm research.
Journal of Family Business Strategy, 5, 116–128.
Axtell, C., Holman, D., & Wall, T. (2006). Promoting innovation: A change
study. Journal of Occupational and Organizational Psychology, 79, 509-516.
Babbie, E. R. (2010). The Practice of Social Research. Belmont CA:
Wadsworth Cengage.
Baer, M. (2012). Putting creativity to work: The implementation of creative
ideas in organizations. Academy of Management Journal, 55(5), 1102–1119.
doi:10.5465/amj.2009.0470
Bandura, A. (1986). Social Foundations of Thought and Action: A Social
Cognitive Theory. Englewood Cliffs: Prentice Hall.

311
Bandura, A. (1995). Exercise of personal and collective efficacy in changing
societies. In A. Bandura, Self-efficacy in changing societies (pp. 1-45). New
York: Cambridge University Press.
Barbara, F., & Valerie, O. (2007). Organizational Culture At The University
Level: A Study Using The OCAI Instrument. Journal of College Teaching &
Learning, 4(11), 85-98.
Barend, V. D., & Victor, D. (2015). Doctors’ trustworthiness, practice
orientation, performance and patient satisfaction. International Journal of
Health Care Quality Assurance, 28(1), 82 - 95.
Barnouw, V. (1963). Culture and Personality. Homewood, 111: Dorsey Press.
Barry, D., & Meisiek, S. (2010). Seeing more and seeing differently: sense
making, mindfulness and the workarts. Journal of Organization Studies, 3(11),
1505-1530.
Bartlett, J. E., Kotrlik, J. W., & Higgins, C. C. (2001). Organizational
Research: Determining Appropriate Sample Size in Survey Research.
Information Technology, Learning, and Performance Journal, 19(1), 43-50.
Batovrina, E. (2016). Searching and Retaining Innovative Staff: Assessment of
the Factors Promoting Employee Innovative Thinking within an
Organisational Development Context. Journal of Creativity and Business
Innovation, 2, 144-159.
Bauman, D. C. (2013). Leadership and the three faces of integrity. The
Leadership Quarterly, 24, 414–426. doi:10.1016/j.leaqua.2013.01.005
Beausaert, S., Segers, M., & Gijselaers, W. (2011). The use of a personal
development plan and the undertaking of learning activities, expertise-growth,

312
flexibility and performance: the role of supporting assessment conditions.
Human Resource Development International, 14(5), 527-543.
Beiske, B. (2007). Research Methods. Uses and Limitations of Questionnaires,
Interviews, and Case Studies. GRIN Verlag GmbH.
Beth, A. H., & Amabile, T. M. (2010). Creativity. The Annual Review of
Psychology, 61, 569-598.
Bing, W., & Chenyan, Z. (2015). Trust evaluation for inter-organization
knowledge sharing via the e-learning community. The Electronic Library,
33(3), 400 - 416.
Birdi, K., Leach, D., & Magadley, W. (2016). The Relationship of Individual
Capabilities and Environmental Support with Different Facets of Designers’
Innovative Behavior. Journal of Product Innovation Management, 33(1), 19-
35.
Birkinshaw, J., & Mol, M. (2006). How management innovation happens.
Sloan Management Review, 47(4), 81-88.
Birkinshaw, J., Crainer, S., & Mol, M. (2007). Special report on management
innovation. Business Strategy Review, 18(1), 45-73.
Biswas, S., & Varma, A. (2012). Antecedents of employee performance: an
empirical investigation in India. Employee Relations, 34(2), 177-192.
Björkman, I., Ehrnrooth, M., Höglund, M., Mäkelä, K., Smale, A., & Sumelius,
J. (2013). Talent or not? Employee reactions to talent identification. Human
Resource Management, 52(2), 195-214.

313
Blumberg, M., & Pringle, C. (1982). The missing opportunity in organizational
research: Some implications for a theory of work performance. Academy of
Management Review, 7, 560-569.
Borman, W., & Motowidlo, S. (1993). Expanding the criterion domain to
include elements of contextual performance. In N. Schmitt, & W. Borman,
Personnel selection in organizations (pp. 71-98). San Fransisco, CA: Jossey-
Bass.
Bounfour, A. (2018). Africa: The next frontier for intellectual capital. Journal
of Intellectual Capital, 19(3), 474-479. doi:10.1108/JIC-12-2017-0167
Bradley, O., Yongjian, B., & Satyanarayana, P. (2014). Political behavior,
trustworthiness, job satisfaction, and commitment. Chinese Management
Studies, 8(3), 354 - 374.
Braun, S., Peus, C., Weisweiler, S., & Frey, D. (2013). “Transformational
leadership, job satisfaction, and team performance: a multilevel mediation
model of trust. The Leadership Quarterly, 24(1), 270-283.
Brown, B., & Anthony, S. (2011, June). How P&G tripled its innovation
success rate. Harvard Business Review, 89(6), 64-72.
Burbiel, J. (2009). Creativity in research and development environments: A
practical review. Int. Journal of Business Science and Applied Management,
4(2), 35-51.
Burns, A., & Bush, R. (2010). Marketing research (6th ed.). New York:
Pearson education, Inc.
Busco, C., Frigo, M. L., Giovannoni, E., & Maraghini, M. P. (2012). When
Creativity Meets Control: A Fashion Industry Case Study. The Journal of
Corporate Accounting & Finance, 61-71. doi:10.1002/jcaf.21799

314
Cameron, K. (2008). A process for changing organizational culture. In C. G.
Thomas, Handbook of Organizational Development (pp. 429-445). Thousand
Oaks, CA: Sage Publishing.
Cameron, K. S., & Ettington, D. R. (1988). The conceptual foundations of
organizational culture. In J. Smart, Higher Education: Handbook of Theory
and Research (pp. 356-396). New York: Agathon.
Cameron, K. S., & Quinn, R. E. (2006). Diagnosing and Changing
Organizational Culture: Based on the Competing Values Framework. San
Francisco: Jossey-Bass.
Cameron, K., & Quinn, R. E. (2011). Diagnosing and Changing
Organizational Culture: Based on the Competing Values Framework (3rd ed.).
CA: John Wiley & Sons.
Cameron, S. K., & Quinn, R. E. (1999). Diagnosing and Changing
Organizational Culture Based on Values Framework. Addison: Wesley
Publishing Company. Inc.
Campbell, J. (1990). Modeling the performance prediction problem in
industrial and organizational psychology. In M. Dunnette, & L. Hough,
Handbook of industrial and organizational psychology (pp. 686-707). Palo
Alto, CA: Consulting Psychologists Press.
Carlo, J. L., Gaskin, J., Lyytinen, K., & Rose, G. M. (2014). Early vs. late
adoption of radical information technology innovations across software
development organizations: an extension of the disruptive information
technology innovation model. Information Systems Journal.
doi:10.1111/isj.12039
Carlos, F. P., & Maria, F. S. (2014). Knowledge-centered culture and
knowledge sharing: the moderator role of trust propensity. Journal of
Knowledge Management, 18(3), 538 - 550.

315
Caroline, S. L., & Kosmas, X. S. (2014). What drives learning orientation in
fast growth SMEs. International Journal of Entrepreneurial Behavior &
Research, 20(4), 324 - 350.
Carvell, N. M., & Paula, A. C. (2015). A context-specific model of
organizational trust. Cross Cultural Management, 22(2), 297-320.
Castro, F., Gomes, J., & de Sousa, F. C. (2012). Do Intelligent Leaders Make
a Difference? The Effect of a Leader’s Emotional Intelligence on Followers’
Creativity. Creativity and Innovation Management, 21(2), 171-182.
doi:10.1111/j.1467-8691.2012.00636.x
Central Bank of Nigeria. (2004). Statistical Bulletin. 15.
Chang, Z., & Nadine, E. (2014). Organizational culture and instructional
innovations in higher education: Perceptions and reactions of teachers and
students. Educational Management Administration & Leadership, 42(1), 136-
158.
Chen, C.-H. V., & Indartono, S. (2008). Perception Of Direct And Indirect
Compensations Fulfillment On Hazardous Work Environment: The
Relationship with Age, Tenure, Employee’S Rank and Work Status. Journal
of Economics & Education, 5(1), 37-56.
Chen, Y. Y., Shek, D. T., & Bu, F. F. (2011). Applications of interpretive and
constructionist research methods in adolescent research: Philosophy, principles
and examples. International Journal of Adolescent Medicine and Health,
23(2), 129–139.
Chiware, E. R., & Dick, A. L. (2008). Information Needs and Information
Seeking Patterns of Small, Medium and Micro Enterprises in Namibia.
Information Development, 24(1), 24-36. doi:10.1177/0266666907087694

316
Chukwuma, E. M., & Obiefuna, O. (2014). Effect of Motivation on Employee
Productivity: A Study of Manufacturing Companies in Nnewi. International
Journal of Managerial Studies and Research, 2(7), 137-147.
Chun, R. (2006). Innovation and Reputation: An Ethical Character Perspective.
Creativity and Innovation Management, 15(1), 63-73. doi:10.1111/j.1467-
8691.2006.00369.x
Clegg, C., Unsworth, K., Epitropaki, O., & Parker, G. (2002). Implicating trust
in the innovative process. Journal of Occupational and Organizational
Psychology, 409-422.
Cohen, L., & Marion, L. (2003). Research Method in Education. London:
Routledge.
Colquitt, J. A., & Rodell, B. J. (2011). Justice, Trust, and Trustworthiness: A
Longitudinal Analysis Integrating Three Theoretical Perspectives. Academy of
Management Journal, 54(6), 1183–1206.
Colquitt, J. A., Brent, S. A., & Jeffery, L. A. (2007). Trust, Trustworthiness,
and Trust Propensity: A Meta-Analytic Test of Their Unique Relationships
With Risk Taking and Job Performance. Journal of Applied Psychology, 92(4),
909–927.
Colquitt, J. A., Jeffery, L. A., Cindy, Z. P., & Eric, W. R. (2011). Trust In
Typical And High-Reliability Contexts: Building And Reacting To Trust
Among Firefighters. Academy of Management Journal, 54(5), 999–1015.
Coltman, T., Devinney, T. M., Midgley, D. F., & Venaik, S. (2008). Formative
versus reflective measurement models: Two applications of formative
measurement. Journal of Business Research, 61, 1250–1262.
doi:doi:10.1016/j.jbusres.2008.01.013

317
Cornell University, INSEAD, WIPO. (2015). The Global innovation index
2015: Effective innovation policies for development. Geneva: World
Intellectual Property Organisation.
Costigan, R. D., Insinga, R. C., Berman, J. J., Kranas, G., & Kureshov, V. A.
(2011). Revisiting the relationship of supervisor trust and CEO trust to turnover
intentions: A three-country comparative study. Journal of World Business, 46,
74-83.
Crossan, M. M., & Apaydin, M. (2010). A multi-dimensional framework of
organizational innovation: a systematic review of the literature. Journal of
Management Studies, 47(6), 1154-1191.
Dagmara, L., & Katarzyna, K. (2015). The model of HRM-trust-commitment
relationships. Industrial Management & Data Systems, 115(8), 1457-1480.
David, L. J., & Andrew, J. W. (2012, September). The Social Dynamics of
Trust: Theoretical and Empirical Research. Oxford University Press, 91(1),
Oxford University Press.
Deane, K., & Stevano, S. (2015). Towards a political economy of the use of
research assistants: reflections from fieldwork in Tanzania and Mozambique.
Qualitative Research, 16(2), 213 - 228. doi:10.1177/1468794115578776
Dijkstra, T. K., & Henseler, J. (2015). Consistent and asymptotically normal
PLS estimators for linear structural equations. Computational Statistics & Data
Analysis, 81(1), 10-23. doi:10.1016/j.csda.2014.07.008
Dimnwobi, S. K., Ekesiobi, C. S., & Mgbemena, E. M. (2016). Creativity,
Innovation and Competitiveness in Nigeria: An Economic Exploration.
International Journal of Academic Research in Economics and Management
Sciences, 5(3), 29-52. doi:10.6007/IJAREMS/v5-i3/2242

318
Dingler, A., & Enkel, E. (2016). Socialization and innovation: insights from
collaboration across industry boundaries. Technol. Forecast. Soc. Change,
109, 50-60.
Dollinger, S., Burke, P., & Gump, N. (2007). Creativity and Values. Creativity
Research Journal, 19(2/3), 91-103.
Dong, J. (2002, April 10). Palo Alto Weekly Online Edition. Retrieved Febuary
10, 2016, from
http://www.paloaltoonline.com/weekly/morgue/2002/2002_04_10.hpway10.h
tml
Egbochuku, S. (2001). Nigeria, Unlocking the future. Business Confidential.
Nigeria’s Business Newsletter, 27(35), 8.
Einsteine, P., & Hwang, K. P. (2007). An Appraisal for Determinants of
Organizational Creativity and Impacts on Innovative Behavior. Proceedings of
the 13th Asia Pacific Management Conference , (pp. 1041-1055). Melbourne,
Australia.
Ekinci, A., & Riley, F. (2000). Fundamental of management: Essentials
concepts and applications. New Jersey: Pearson Prentice Hall.
Elaine, F., Avinash, P., Paul, S., & Scullion., H. (2014). Balancing individual
and organizational goals in global talent management: A mutual-benefits
perspective. Journal of World Business, 49, 204-214.
Eleni, G., Lidia, G., & Pierre-Jean, B. (2014). Creativity for service innovation:
A practice-based perspective", Managing Service Quality. An International
Journal, 24(1), 23-44.
Ellen, M., & Nico, M. (2002). An Organisational Culture Model to Promote
Creativity and Innovation. SA Journal of Industrial Psychology, 28(4), 58-65.

319
Emeka, N. H., Ifeoma, A. J., & Emmanuel, O. I. (2015). An Evaluation of the
Effect of Technological Innovations on Corporate Performance: A Study of
Selected Manufacturing Firms in Nigeria. The International Journal Of
Business & Management, 3(1), 248-262.
EMIS. (2016). A Euromoney Institutional Investor Comany. Retrieved April
14, 2016, from www.emis.com: https://www.emis.com/
Erthal, A., & Marques, L. (2018). National culture and organisational culture
in lean organisations: A systemic review. Production Planning and Control, 1-
20. doi:10.1080/09537287.2018.1455233
Evan, F. S., Richard, S. W., & Chris, P. (2015, Novermber 23). Creating the
Conditions for Sustainable Innovation. Retrieved from www.ddiworld.com:
http://www.ddiworld.com/ddi/media/trend-
research/creatingtheconditionsforsustainableinnovation_tr_ddi.pdf?ext=.pdf
Ezirim, C. B., Nwibere, B. M., & Emecheta, B. C. (2010). Organisational
culture and performance: The Nigerian experience. International Journal of
Business and Public Administration, 7(1), 40-57.
Fabian, O. U., Ike, E. O., & Alma, M. R.-S. (2014). Linking organizational
trust with employee engagement: the role of psychological empowerment.
Personnel Review, 43(3), 377 - 400. doi:http://dx.doi.org/10.1108/PR-11-
2012-0198
Fassott, G., Henseler, J., & Coelho, P. S. (2016). Testing moderating effects in
PLS path models with composite variables. Industrial Management & Data
Systems, 116(9), 1887-1900. doi:10.1108/IMDS-06-2016-0248
Federal Ministry of Industry, Trade and Investment. (2011). Retrieved March
16, 2016, from www.fmti.gov.ng:
http://www.fmti.gov.ng/component/content/article/39-small-business/100-
manufacturing.html

320
Fernandes, C. R., & Polzer, J. T. (2015). Diversity in Groups. Harvard
Business Review, 1-13. Retrieved from
http://www.hbs.edu/faculty/Publication%20Files/Diversity_in_Groups_Emer
gingTrends_57796940-b049-43dc-b58b-832eccbcaa80.pdf
Field. (2005). Discovering Statistics Using SPSS. London: Sage Publications.
Filho, D. B., Paranhos, R., Rocha, E. C., Batista, M., Silva, J. A., Santos, M.
W., & Marino, J. G. (2013). When is statistical significance not significant?
Brazilian Political Science Review, 7(1), 31 - 55.
Florida, R., Mellander, C., & King, K. (2015). The global creativity index 2015.
Martin Prosperity Institute.
Florida, R., Mellander, C., & King, K. (2015). The global creativity index 2015.
Martin Prosperity Institute.
Ford, C. M. (1996). A theory of individual creative action in multiple social
domains. Academy of Management Review, 21, 1112-1142.
Gabora, L., & Leijnen, S. (2013). Relationship between creativity, imitation,
and cultural diversity. International Journal of Software and Informatics, 7(4),
615-627.
Gabriel, J. M., & Kpakol, A. G. (2014). Mediating Role of Power Distance on
the Association of Perceived Managerial Competency and Employee Trust in
the Nigerian Manufacturing Industry. International Journal of Managerial
Studies and Research, 2(10), 1-12.
Gardner, W. L., Avolio, B. J., Luthans, F., May, D. R., & Walumbwa, F.
(2005). "Can you see the real me?" A self-based model of authentic leader and
follower development. The Leadership Quaterly, 343-372.
doi:10.1016/j.leaqua.2005.03.003

321
Gefen, D., Straub, D. W., & Boudreau, M. (2000). Structural equation
modeling and regression: Guidelines for research practice. Commun. AIS, 4, 1-
78.
Gehlbach, H., & Brinkworth, M. E. (2011). Measure twice, cut down error: A
process for enhancing the validity of survey scales. Review of General
Psychology, 15, 380–387.
Gelman, A. (2013, January). P Values and Statistical Practice. Epidemiology,
24(1), 69-72. Retrieved from www.epidem.com
Ghahreman, T. K., Tondnevis, F., Amirtash, A., & Kadivar, P. (2006).
Relationship between organisational culture and creativity of faculty members
in physical education departments in Iranian universty. Journal of Movement
Science and Sports, 3(6), 139-150.
Ghosh, K. (2015). Developing organizational creativity and innovation.
Management Research Review, 38(11), 1126 - 1148.
Gian, C., Lee, K., & Mark, L. (2012). Knowledge sharing: influences of trust,
commitment and cost. Journal of Knowledge Management, 16(5), 740 - 753.
Gilson, L. L. (2008). Why Be Creative? A Review of the Practical Outcomes
Associated with Creativity at the Individual, Group, and Organizational
Levels. In J. Zhou, & C. E. Shalley, Handbook of Organizational Creativity
(pp. 303-322). New York: Lawrence Erlbaum Associates.
Gjersing, L., Caplehorn, J. R., & Clausen, T. (2010). Cross-cultural adaptation
of research instruments: language, setting, time and statistical Considerations.
BMC Medical Research Methodology, 10(13), 1-10.

322
Goncalo, J., & Staw, B. (2006). Individualism- Collectivism and group
creativity. Organizational Behavior and Human Decision Processes, 100(1),
96–109.
Gong, Y., Huang, J. C., & Farh, J. L. (2009). Employee learning orientation,
transformational leadership, and employee creativity: The mediating role of
employee creative selfefficacy. Academy of Management Journal, 52, 765-
778.
Gordon, S. R., & Tarafdar, M. (2007). How do a company’s information
technology competences influence its ability to innovate? Journal of
Enterprise Information Management, 20(3), 271-290.
Gotz, O., Liehr-Gobbers, K., & Kraft, M. (2010). Chapter 29: Evaluation of
Structural equation Models Using the Partial Least Squares (PLS) Approach.
In V. E. Vinzi, Handbook of Partial Least Squares. Heidelberg, Germany:
Springer-Verlag.
Graen, G. (2009). Early identification of future executives: A functional
approach. Industrial and Organizational Psychology, 2, 437–441.
Gray, D. E. (2014). Doing Research in the Real World (3rd ed.). London: Sage.
Green, S., Salkind, N., & Akey, T. (2000). Using SPSS for Windows: Analyzing
and Understanding Data (2nd ed.). Upper Saddle River, NJ.: Prentice-Hall.
Gulati, P. M. (2009). Research Management: Fundamental and Applied
Research. New Delhi: Global India Publications.
Guo, H., & Li, Y. (2006). Research on relationship between governance
mechanism and managerial innovation ability, independent innovation. Stud.
Sci. Sci., 6, 27-34.
323
Gupta, B. (2011). Organisational culture and creative behaviour: moderating
role of creative style preference. Int. J. Innovation and Learning, 10(4), 429-
441.
Gupta, V., & Singh, S. (2012). How leaders impact employee creativity: A
study of Indian R&D laboratories. Management Research Review, 36(1), 66 -
88.
Gupta, V., & Singh, S. (2015). Leadership and creative performance behaviors
in R&D laboratories: examining the mediating role of justice perceptions.
Journal of Leadership & Organizational Studies, 22(1), 21-36.
Hair, J. F., Anderson, R. E., Tatham, R. L., & Black, W. C. (1998). Multivariate
data analysis (5th ed.). New York: Prentice Hall International.
Hair, J. F., Gabriel, M. L., & Patel, V. K. (2014). Amos Covariance-Based
Structural Equation Modeling (Cb-Sem): Guidelines on its Application as a
Marketing Research Tool. Brazilian Journal of Marketing, 13(2), 44-55.
Hair, J. F., Hult, G. T., Ringle, C. M., & Sarstedt, M. (2013). A Primer on
Partial Least Squares Structural Equation Modeling (PLS-SEM). Thousand
Oaks: Sage.
Hair, J. F., Hult, G. T., Ringle, C., & Sarstedt, M. (2016). A primer on partial
least squares structural equation modeling (PLS-SEM). Sage Publications.
Thousand Oaks.
Hair, J. F., Ringle, C. M., & Sarstedt, M. (2011). PLS-SEM: Indeed a Silver
Bullet. Journal of Marketing Theory and Practice, 19(2), 139–151.
doi:10.2753/MTP1069-6679190202
Hair, J. F., Ringle, C. M., & Sarstedt, M. (2013). Partial Least Squares
Structural Equation Modeling: Rigorous Applications, Better Results and

324
Higher Acceptance. Long Range Planning, 46, 1-12.
doi:10.1016/j.lrp.2013.01.001
Hair, J. F., Sarstedt, M., Ringle, C., & Mena, J. A. (2012). An assessment of
the use of partial least squares structural equation modeling in marketing
research. Journal of the Academy of Marketing Science, 40(3), 414-433.
Hair, J. F., William, B. C., Barry, B. J., & Rolph, A. E. (2010). Multivariate
Data Analysis, 7th Edition (7th ed.). Pearson Prentice Hall.
Hakan, E., & Jamel, C. (2013). Effects of trust and psychological contract
violation on authentic leadership and organizational deviance. Management
Research Review, 36(9), 828 - 848.
Hammarberg, K., Johnson, L., Bourne, K., Fisher, J., & Kirkman, M. (2014).
Proposed legislative change mandating retrospective release of identifying
information: consultation with donors and Government response. Human
Reproduction, 29, 286–292.
Hammarberg, K., Kirkman, M., & de Lacey, S. (2016). Qualitative research
methods: when to use them and how to judge them. Human Reproduction,
31(3), 498–501. doi:10.1093/humrep/dev334
Hamza, K., Reza, K., Gholam, A. K., & Meghdad, M. (2011). Levels of
Analysis and Hofstede's Theory of Cultural Differences: The Place of Ethnic
Culture in Organizations. International Conference on Financial Management
and Economics (pp. 320-323). Singapore: IACSIT Press.
Hargrave, T., & Van de Ven, A. (2006). A collective action model of
institutional innovation. Academy of Management Review, 31, 864-888.
Hemmatinezhad, M., Shafiee, S., Sharari, M., & Hemmatinezhad, M. (2012).
The relation between organizational culture and creativity: A case study on

325
physical education experts in Education Administrations. International
Journal of Sport Studies, 2(1), 69-78.
Hennessey, B., & Amabile, T. (2010). Creativity. Annual Review of
Psychology, 61, 569-598.
Henseler, J. (2017). Partial Least Squares Path Modeling. In L. e. H, Advanced
Methods for Modeling Markets, International Series in Quantitative Marketing
(pp. 361-381). Springer International Publishing AG. doi:10.1007/978-3-319-
53469-5_12
Henseler, J., Hubona, G., & Ray, P. A. (2016). Using PLS path modeling in
new technology research: updated guidelines. Industrial Management & Data
Systems, 116(1), 2-20. doi:10.1108/IMDS-09-2015-0382
Henseler, J., Ringle, C. M., & Sinkovics, R. R. (2009). The use of Partial Least
Squares Path Modeling in International Marketing. Advances in International
Marketing, 20, 227-319.
Heritage, B., Pollock, C., & Roberts, L. (2014). Validation of the
Organizational Culture Assessment Instrument. PLoS ONE, 9(3), 1-10.
Heyns, M., & Rothmann, S. (2015). Dimensionality of trust: An analysis of the
relations between propensity, trustworthiness and trust. SA Journal of
Industrial Psychology, 41(1), 1-12.
Ho, S. M., Kaarst-Brown, M., & Benbasat, I. (2018). Trustworthiness
attribution: Inquiry into insider threat detection. Journal of the Association for
Information Science and Technology, 69(2), 271-280.
Hoch, J. E. (2013). Shared leadership and innovation: The role of vertical
leadership and employee integrity. Journal of Business Psychology, 28, 159–
174.

326
Hofstede, G. (1980). Culture's Consequences: International Differences in
Work-Related Values. Beverly Hills: CA: SAGE.
Hofstede, G. (1991). Managing in a Multicultural Society. Malaysian
Management Review, 26(1), 3-12.
Hofstede, G. J. (2015). Culture’s causes: the next challenge. Cross Cultural
Management, 22(4), 545-569.
Hofstede, G., & McCrae, R. R. (2004, February). Personality and Culture
Revisited: Linking Traits and Dimensions of Culture. Cross-Cultural
Research, 38(1), 52-88. doi:doi: 10.1177/1069397103259443
Hofstede, G., & Michael, M. (2010). Cultures and Organizations: Software of
the Mind. (3rd Edition ed.). New York, USA: McGraw-Hill Professional.
Hofstede, G., & Michael, M. (2010). Cultures and Organizations: Software of
the Mind. (3rd Edition ed.). New York, USA: McGraw-Hill Professional.
Hogan, S. J., & Coote, L. C. (2014). Organizational culture, innovation, and
performance: A test of Schein's model. Journal of Business Research, 67(8),
1609-1621. doi:10.1016/j.jbusres.2013.09.007
Holmes, W. T., & Parker, M. (2018). The relationship between behavioral
integrity, competence, goodwill, trustworthiness, and motivating language of a
principal. School Leadership & Management, 1-22.
doi:10.1080/13632432434.2018.1430687
Hon, A. H., Chan, W. W., & Lu, L. (2013). Overcoming work-related stress
and promoting employee creativity in hotel industry: The role of task feedback
from supervisor. International Journal of Hospitality Management, 33, 416–
424. doi:10.1016/j.ijhm.2012.11.001

327
Hoskins, D. (2014, January 16). Organisational Culture. Retrieved from
Harvard Business Review: https://hbr.org/2014/01/employees-perform-better-
when-they-can-control-their-space/%20Organizational%20culture
Hossein, J., & Amir, H. M. (2014). The study of Organizational Trust Effect
on Organizational Transparency and Loyalty of Primary School Teachers in
Zahedan City, Iran. World Applied Programming, 4(6), 156-160.
Hsiao, C. (2003, July). Foreign Direct Investment and Economic Growth: The
Importance of Institution and Urbanisation. Economic Development &
Cultural Change, 51(4), 883-896.
Hsu, Y.-T. (2016, June). The Relationships among Transformational
Leadership, Employees’ Learning Abilities, Creativity, and Job Performance.
The Journal of Human Resource and Adult Learning, 12(1), 107-115.
Hu, J., & Cui, X. (2012, March 15). A Literature Review on Organization
Culture and Corporate Performance. International Journal of Business
Administration, 3(2), 28-37.
Hu, L. T., & Bentler, P. M. (1999). Cutoff criteria for fit indexes in covariance
structure analysis: conventional criteria versus new alternatives. Structural
Equation Modeling, 6(1), 1-55.
Huston, L., & Sakkab, N. (2006). Connect and Develop: Inside Procter &
Gamble’s new model for innovation. Harvard Business Review, 84(3), 58-66.
Ikemefuna, & Abe, A. (2015). Technological Environment and Some Selected
Manufacturing Industry in Enugu State, Nigeria. J Glob Econ, 3(149), 2-5.
doi:10.4172/2375-4389.1000149

328
Jackson, C., Morgan, J., & Laws, C. (2018). Creativity in events: The untold
story. International Journal of Event and Festival Management, 9(1), 2-19.
doi:10.1108/IJEFM-10-2017-0062
Jain, R., Jain, c., & Jain, P. (2013). Integrated Framework of Antecedents and
Effects of Market Orientation: A Qualitative Review. Management and Labour
Studies, 38(4), 425–445. doi:10.1177/0258042X13516595
James, C. (2008). Facilitating employee creativity in the library environment.
Library Management, 29(3), 159 - 172.
Jan, A., & Hazel, H. (2013). Organisational culture in knowledge creation,
creativity and innovation: towards the Freiraum model. Journal of Information
Science, 1–14.
Javed, B., Rawwas, M. Y., Khandal, S., Shahid, K., & Tayyeb, H. H. (2018).
Ethical leadership, trust in leader and creativity: The mediated mechanism and
an interacting effect. Journal of Management and Organization, 24(3), 388-
405. doi:10.1017/jmo.2017.56
Jeevan, J., & Sumeet, K. (2015). Assessing the cultural intelligence and task
performance equation: Mediating role of cultural adjustment. Cross Cultural
Management: An International Journal, 22(2), 236-258.
Jeffrey, L. B., & Samuel, H. T. (2013). Charismatic, Ideological, and Pragmatic
Leaders' Influence on Subordinate Creative Performance Across the Creative
Process. Creativity Research Journal, 25(1), 59-74.
doi:10.1080/10400419.2013.752228
Jennifer, C., & Donna, C. K. (2013). Creative role models, personality and
performance. Journal of Management Development, 32(4), 336 - 350.

329
Jiang, K., Hu, J., Liu, S., & Lepark, D. P. (2015). Understanding Employees’
Perceptions of Human Resource Practices: Effects of Demographic
Dissimilarity to Managers and Coworkers. Human Resource Management, 1-
23.
Joe, K. (2014). Do my staff trust me? Leadership & Organization Development
Journal, 35(5), 470 - 488.
John, O. O. (2011). Factors constraining the growth and survival of SMEs in
Nigeria. Management Research Review, 32(2), 156-171.
Johnson, M. (1999). Observations on positivism and pseudoscience in
qualitative nursing research. Journal of Advanced Nursing, 30(1), 67–73.
Jones, P. W., & Loe, S. A. (2013). Optimal Number of Questionnaire Response
Categories: More May Not Be Better. SAGE Open, 1-10.
Jovana, M., Jean, M. M., & Priva, F. (2014). An Integrative Trust Model in the
Coaching Context. American Journal of Management, 14(1-2), 102-110.
Jubril, L. O., Raji, O. A., Banjo, H., & Olayinka, S. A. (2014). An Exploratory
Study of Relational Capabilities and Balanced Scorecard in the Nigeria
Manufacturing Firms. Review of Public Administration and Management, 5(3),
215-226. Retrieved from www.arabianjbmr.com/RPAM_index.php
Judge, T., Jackson, C., Shaw, J., Scott, B., & Rich, B. (2007). Self-Efficacy
and Work-Related Performance: The Integral Role of Individual Differences.
Journal of Applied Psychology, 92(1), 107-127.
Karamipour, M. R., Mehraban, M., & Jahani, S. (2015). The effect of
organizational culture on the employee’s creativity. SAUSSUREA
Multidisciplinary International Peer Reviewed Journal, 3(2), 40-53.

330
Kaufman, J. C. (2012). Counting the Muses: Development of the Kaufman
Domains of Creativity Scale (K-DOCS). Psychology of Aesthetics, Creativity,
and the Arts, 6(4), 298-308.
Kaufman, J. C., & Baer, J. (2004). Sure, I’m creative – but not in math! Self-
reported creativity in diverse domains. Empirical Studies of the Arts, 22, 143-
155.
Kaufman, J. C., & Beghetto, R. A. (2009). Beyond big and little: The Four C
Model of Creativity. Review of General Psychology, 13(1), 1-12.
Kaufman, J. C., Baer, J., Agars, M. D., & Loomis, D. (2010). Creativity
stereotypes and the consensual assessment technique. Creativity Research
Journal, 22(2), 200-205.
Kembaren, P., Simatupang, T. M., Larso, D., & Wiyancoko, D. (2014). Design
Driven Innovation Practices in Design-preneur led Creative Industry. J.
Technol. Manag. Innov, 9(3), 91-105.
Kirton, M. (1976). Adaptors and innovators: A description and measure.
Journal of Applied Psychology, 61, 622-629.
Knox, K. (2004). A researchers’ dilemma: Philosophical and methodological
pluralism. Electronic journal of business research methods, 2(2), 119- 128.
Kock, N. (2015). Common method bias in PLS-SEM: A full collinearity
assessment approach. International Journal of e-Collaboration, 11(4), 1-10.
doi:10.4018/ijec.2015100101
Korkaew, J., & Suthinee, R. (2012). Factors Affecting Job Performance: A
Review of Literature. Silpakorn University Journal of Social Sciences,
Humanities, and Arts, 12(2), 115-127.

331
Kozbelt, A., Beghetto, R. A., & Runco, M. A. (2010). Theories of creativity.
In J. C. Kaufman, & R. J. Sternberg, The Cambridge handbook of creativity
(pp. 20-47). New York: Cambrdge University Press.
Kpakol, A. G., Obiora, N. J., & Jaja, S. A. (2016). Employee Participation and
Organizational Identification: Implications of the Mediating Effect of
Organizational Culture. European Journal of Business and Management,
8(11), 32-44.
Krejcie, R. V., & Morgan, D. W. (1970). Determining Sample Size For
Research Activities. Educational And Psychological Measurement, 1-4.
Kristel, W., & Jeroen, M. (2014). Surveying organizational culture to explore
grid-group cultural theory. International Journal of Organizational Analysis,
22(2), 224-246.
Kristina, S., & Thomas, S. J. (2014). Multiple affective commitments: quitting
intentions and job performance. Employee Relations, 36(5), 516-534.
Ku, H., Mustapha, U. M., & Goh, S. (2010). A Literature Review of Past and
Present Performance of Nigerian Manufacturing Sector. Proceedings of
IMechE, Part B: Journal of Engineering Manufacture, 224(12), 1894-1904.
doi:10.1243/09544054JEM1818
Kumar, N., & Sharma, D. D. (2018). The role of organisational culture in the
internationalisation of new ventures. International Marketing Review.
doi:10.1108/IMR-09-2014-0299
Kyvik, O., Zhang, Y., & Romero-Martinez, A. M. (2012). Value dimensions
and creativity: an international comparative study. International Journal of
Manpower, 33(4), 349 - 366.

332
LePine, J. A., Podsakoff, N. P., & LePine, M. A. (2005). A metaanalytic test
of the challenge stressor–hindrance stressor framework: An explanation for
inconsistent relationships among stressors and performance. Academy of
Management Journal, 48, 764–775.
Leung, S.-O. (2011). A Comparison of Psychometric Properties and Normality
in 4-, 5-, 6-, and 11-Point Likert Scales. Journal of Social Service Research,
37, 412-421.
Li, J., Laurence, G. A., & Blume, B. D. (2018). How does supervisor-focused
procedural justice explain the effects of person-focused leadership? The
moderating role of leader-referenced rational-self. European Journal of Work
and Organisational Psychology, 1-13. doi:10.1080/1359432x.2018.1458713
Lietz, P. (2010). Research into questionnaire design: A summary of the
literature. International Journal of Market Research, 52, 249-272.
Lipponen, J., Bardi, A., & Haapamaki, J. (2008). The interaction between
values and organizational identification in predicting suggestion-making at
work. Journal of Occupational and Organizational Psychology, 81, 241-248.
Liu, W., Zhang, P., Liao, J., Hao, P., & Mao, J. (2016). Abusive supervision
and employee creativity: The mediating role of psychological safety and
organizational identification. Management Decision, 54(1), 130 - 147.
doi:10.1108/MD-09-2013-0443
Lorenzo, P., Romo, J., & Ruiz, E. (2006). Bootstrap prediction for returns and
volatilities in GARCH models. Computational Statistics & Data Analysis,
50(9), 2293-2312. Retrieved from http://hdl.handle.net/10016/4739
Lotars, D., & Barbars, A. (2010). The Role of Organizational Culture in Human
Resource Management. Human Resources Management & Ergonomics, 4(1),
1-10.

333
Lowry, P. B., & Gaskin, J. (2014). Partial Least Squares (PLS) Structural
Equation Modeling (SEM) for Building and Testing Behavioral Causal
Theory: When to Choose It and How to Use It. IEEE Transactions on
Professional Communication, 57(2), 123-146.
Lunenburg, F. (2011). Self-efficacy in the workplace: implications for
motivation and performance. International Journal of Management, Business,
And Administration, 14(1), 1-6.
Ma, Y., Cheng, W., Ribbens, B., & Zhou, J. (2013). Linking ethical leadership
to employee creativity: Knowledge sharing and self-efficacy as mediators.
Social Behavior and Personality: An International Journal, 41(9), 1409–1419.
Mack, L. (2010). The Philosophical Underpinnings of Educational Research.
Polyglossia, 19, 5-11.
MacKenzie, S. B., Podsakoff, P. M., & Podsakoff, N. P. (2011). Construct
Measurement and Validation Procedures in MIS and Behavioral Research:
Integrating New and Existing Techniques. MIS Quaterly, 35(2), 2-5.
Maduka, E. C., & Okafor, O. (2014). Effect of Motivation on Employee
Productivity: A Study of Manufacturing Companies in Nnewi. International
Journal of Managerial Studies and Research (IJMSR), 2(7), 137-147.
Magadley, W., & Birdi, K. (2006). What is a Creativity Retreat Centre?
Competency and Emotional Intelligence, 13, 43-45.
Mann, C. J. (2003). Observational research methods. Research design II:
cohort, cross sectional, and case-control studies. Emergency Medicine Journal,
20, 54–60.

334
Manufacturers Association of Nigeria. (2017). Retrieved 2016, from
www.manufacturersnigeria.org:
http://www.manufacturersnigeria.org/membership/login.php
Maria, A. L.-L., William, W. S., Eunsuh, L., & Claire, A. S. (2015).
Relationship of budget participation conflict and job performance of South
Korean managers. Cross Cultural Management, 22(4), 608-629.
Marina, d. P. (2007). The role of knowledge management in innovation.
Journal of Knowledge Management, 11(4), 20 - 29.
doi:http://dx.doi.org/10.1108/13673270710762684
Martha, L. M., Carolina, B. G., Joseph, J. D., Niels, G. N., & Pei-Chuan, W.
(2002). Cultural Dimensions at the Individual Level of Analysis: The Cultural
Orientations Framework. International Journal of Cross Cultural
Management, 2(3), 275-295.
Martins, E. C., & Terblanche, F. (2003). Building Organisational Culture That
Stimulates Creativity and Innovation. European Journal of Innovation
Management, 6(1), 64-74.
Mary, D. (1970). Natural Symbols: Explorations in Cosmology. New York,
NY: Random House.
Mayer, C. R., Davis, H. J., & Schoorman, D. F. (1995). An Integrative Model
of Organisational Trust. Academy of Management Review, 20(3), 709-734.
Mayer, R. C., & Davis, J. H. (1999). The Effect of the Performance Appraisal
System on Trust for Management: A Field Quasi-Experiment. Jornal of
Applied Psychology, 84(1), 123-136.

335
McAllister, J. D. (1995). Affect- and Cognition-Based Trust as Foundations
for Interpersonal Cooperation in Organizations. Academy of Management
Journal, 38(1), 24-59.
McCoach, D. B., Gable, R. K., & Madura, J. P. (2013). Instrument development
in the affective domain: School and corporate applications (3rd ed.). New
York: Springer.
McIntyre, F. S., Hite, R. E., & Rickard, M. K. (2003). Individual characteristics
and creativity in the marketing classroom: Exploratory insights. Journal of
Marketing Education., 25(2), 143-149.
McLean, L. D. (2005, May). Organizational Culture’s Influence on Creativity
and Innovation: A Review of the Literature and Implications for Human
Resource Development. Advances in Developing Human Resources, 7(2), 226-
246.
Mehlika, S., Ismai, l. E., & Mehmet, E. (2014). A study of the relationship
between person-organization fit and employee creativity. Management
Research Review, 37(5), 479 - 501.
Meriggi, N. F., & Bulte, E. (2018). Leader and villager behavior: Experimental
evidence from Cameroon. World Development, 110, 324-332.
doi:10.1016/j.worlddev.2018.06.004
Merrotsy, P. (2013). A Note on Big-C Creativity and Little-c Creativity.
Creativity Research Journal, 25(4), 474–476.
Meyer, J.-U. (2014). Strengthening Innovation Capacity through Different
Types of Innovation Cultures. Technology Innovation Management Review,
4(12), 6-16.

336
Miaoulis, G., & Michener, R. D. (1976). An introduction to sampling.
Dubuque, Iowa: Kendall/Hunt Publishing Company.
Mike, K., Jonathan, A. A., Kingsley, O., & Oladukun, K. (2009). The Impact
of the Arts, Culture and Creative Industries on Nigeria’s Economy. Retrieved
March 23, 2016, from www.uis.unesco.org:
http://www.uis.unesco.org/culture/Documents/nigeria-pilot-research-impact-
study-culture-industries-2009.pdf
Millar, C., Peters, K., & Millar, P. H. (2018). Culture, the missing link in value
creation and governance in knowledge-intensive institutions? Journal of
Public Affairs, 18, 1-8. doi:10.1002/pa.1702
Mittal, S., & Dhar, R. L. (2015). Transformational leadership and employee
creativity. Management Decision, 53(5), 894 - 910.
Mobarakeh, S. N. (2011). The relation between the organizational culture and
creativity of managers and experts of Khuzestan physical education
organization. Procedia- Social and Behavioral Sciences, 15, 3648-–3650.
Mooney, R. (1963). A conceptual model for integrating four approaches to the
identification of creative talent. In C. W. Taylor, & F. Barron, Scientific
creativity: Its recognition and development (pp. 331-340). New York: Wiley.
Moorman, R. H., Darnold, T. C., & Priesemuth, M. (2013). Perceived leader
integrity: Supporting the construct validity and utility of a multi-dimensional
measure in two samples. The Leadership Quarterly, 24, 427–444.
Morgan, D. L. (2016). Living within blurry boundaries: The value of
distinguishing between qualitative and quantitative research. Journal of Mixed
Methods Research, 1-12. doi:10.1177/1558689816686433

337
Morrow, J. L., Hansen, M. H., & Pearson, A. W. (2004). The cognitive and
affective antecedents of general trust within cooperative organizations. Journal
of Management Issues, 16, 48-64.
Mosavi, S. A., Abedi, M., & Ghaedi, M. (2013). Reviewing the relationship
between perception of trust in organization with employee extra-role
behaviour. African Journal of Business Management, 7(35), 3620-3629.
Mostafa, M. (2005). Factors affecting organisational creativity and
innovativeness in Egyptian business organisations: An empirical investigation.
The Journal of Management Development, 24(1/2), 7-33.
Motowidlo, S., Borman, W., & Schmidt, N. (1997). A theory of individual
differences in task and contextual performance. Human Performance, 10, 71-
83.
Muenjohn, N., & McMurray, A. (2017). Design leadership, work values ethic
and workplace innovation: an investigation of SMEs in Thailand and Vietnam.
Asia Pacific Business Review, 1-12. doi:10.1080/13602381.2017.1281642
Muhammad, A. B., Mohamed, M. B., Ahmed, R. I., & Veera, P. S. (2014).
Effects of personality traits (big five) on expatriates adjustment and job
performance. Equality, Diversity and Inclusion: An International Journal,
33(1), 73-96.
Naqshbandi, M. M., & Kamel, Y. (2017). Intervening role of realized
absorptive capacity in organizational culture–open innovation relationship:
Evidence from an emerging market. Journal of General Management, 42(3),
5-20. doi:10.1177/0306307016687984
Naranjo-Valencia, J. C., Jiménez-Jiménez, D., & Sanz-Valle, R. (2016).
Studying the links between organizational culture, innovation, and
performance in Spanish companies. Revista Latinoamericana de Psicología,
48(1), 30-41. doi:10.1016/j.rlp.2015.09.009

338
Naranjo-Valencia, J. C., Sanz-Valle, R., & Jimenez-Jimenez, D. (2010).
Organizational culture as determinant of product innovation. European
Journal of Innovation Management, 13(4), 466 -480.
National Bureau Of Statistics. (2012). Nigerian Manufacturing Sector.
Retrieved April 15, 2016, from www.nigerianstat.gov.ng:
http://www.nigerianstat.gov.ng/report/260
Ndaliman, M. A., Kamariah, I., Chikaji, A. I., & Mohd, K. R. (2015). Exploring
Employee Motivation and Creativity on SMEs Innovation Implementation
Activities in Nigeria. Global Journal of Business and Social Science Review,
1(1), 156-162.
Nigeria Industrial Revolution Plan. (2014, January). Nigeria Industrial
Revolution Plan. Retrieved March 16, 2016, from www.nac.org.ng:
http://www.nac.org.ng/NIRP.pdf
Nightingale, A. (2018). Developing the organisational culture in a healthcare
setting. Nursing Standard, 32(21), 53-62. doi:10.7748/ns.2018.ell021
NISER. (2017, January). Nigerian Institute of Social and Economic Research.
Retrieved from www.niser.gov.ng: https://www.niser.gov.ng/
NISER. (2017). Nigerian Institute of Social and Economic Research (NISER).
Retrieved from www.niser.gov.ng:
https://www.niser.gov.ng/about/departments
Nisula, A., & Kianto, A. (2018). Stimulating organisational creativity with
theatrical improvisation. Journal of Business Research, 85, 484-493.
doi:10.1016/j.jbusres.2017.10.027
Nunally, J. (1978). Psychometric Theory (2nd ed.). New York, NY.: McGraw-
Hill.

339
Nwibere, B. M. (2013). The influence of corporate culture on managerial
leadership style: The Nigerian experience. International Journal of Business
and Public Administration, 10(2), 166-187.
Nzewi, H. N., & Nwaduhu, G. O. (2015, May). Creativity and Entrepreneurial
Development in Selected Manufacturing Firms in Anambra State. Journal of
Business Management and Economics, 3(5), 1-8.
Ogbeibu, S., Senadjki, A., & Gaskin, J. (2018). The moderating effect of
benevolence on the impact of organisational culture on employee creativity.
Journal of Business Research, 90C, 334-346.
Ogbeibu, S., Senadjki, A., & Luen Peng, T. (2017). The diffusion of creative
ideas: A dark side perspective of trustworthiness perception. The 19th
Malaysian Finance Association Annual Conference (MFAC) (pp. 70-88).
Perak: Universiti Tunku Abdul Rahman (UTAR).
Ogbeibu, S., Senadjki, A., & Tan, L. P. (2018). The dark side of trustworthiness
perception and its effect on the diffusion of creative ideas within organisations.
Business Creativity and the Creative Economy, 4, 40-52.
doi:10.18536/bcce.2018.10.8.1.05
Ogbo, A. I., Okechukw, I., & Ukpere, W. I. (2012). Managing innovations in
telecommunications industry in Nigeria. African Journal of Business
Management, 6(25), 7469-7477. doi:10.5897/AJBM12.921
Ojo, O. (2012). Organizational Culture and Corporate Performance: Empirical
Evidence from Nigeria. Journal of Business Systems, Governance and Ethics,
5(2), 1-12.
Oke, A. (2013). Linking manufacturing flexibility to innovation performance
in manufacturing plants. International Journal of Production Economics, 143,
242–247.

340
Olalere, T. O., & Adesoji, A. A. (2013, May). Human capital development in
First bank of Nigeria Plc. Mediterranean Journal of Social Sciences, 4(2), 783-
801.
Olorunfemi, S., Tomola, M. O., Felix, A. O., & Ogunleye, E. O. (2013).
Manufacturing Performance in Nigeria: Implication for Sustainable
Development. Asian Economic and Financial Review, 3(9), 1195-1213.
Oluba, M. (2008). Rethinking the Nigerian banking system: a prologue.
Economic Reflections, B(3), 1-7.
Olufemi, A. J. (2009). Human capital development practices and
organizational effectiveness: A focus on the contemporary Nigerian Banking
Industry. Pakistan Journal of Social Science, 6(4), 194-199.
Olusanya, G. D. (2000). Management of Government and Nigerian Economy:
Challenges and Prospects. Management in Nigeria. Nigerian Institute of
Management Journal, 36(4), 3-4.
Onyeagu, A. N., & Okeiyika, K. O. (2013). Investigating the interaction
between foreign direct investment and human capital on growth: evidence from
Nigeria. Asian Economic and Financial Review, 3(9), 1134-1151.
Oscar, A., Tone, M. A., Leif, J. G., & Hansen, K. (2014). Preparing
organisations for employee-driven open innovation. Int. Journal of Business
Science and Applied Management, 9(1), 24-35.
Owolabi, L. K., & Abdul-Hameed, A. S. (2011). Employee Involvement in
Decision Making and Firms Performance in the Manufacturing Sector in
Nigeria. Serbian Journal of Management, 6(1), 1-15.

341
Owoyemi, O. O., & Ekwoaba, J. O. (2014). Organisational Culture: A Tool for
Management to Control, Motivate and Enhance Employees’ Performance.
American Journal of Business and Management, 3(3), 168-177.
Palanski, M. E., & Vogelgesang, G. R. (2011). Virtuous creativity: The effects
of leader behavioural integrity on follower creative thinking and risk taking.
Canadian Journal of Administrative Sciences, 259–269.
Pandey, S., & Sharma, R. (2009). Organizaitional Factors for Exploratory and
Exploitative. Journal of Technology Management and Innovation, 4(1), 48-58.
Parjanen, S. (2012). Experiencing Creativity in the Organization: From
Individual Creativity to Collective Creativity. Interdisciplinary Journal of
Information, Knowledge, and Management, 7, 109-128.
Pathirage, C. P., Amaratunga, R. D., & Haigh, R. P. (2008). The Role of
Philosophical Context in the Development of Theory: Towards
Methodological Pluralism. The Built & Human Environment Review, 1, 1-10.
Pay, L. Y., Balaji, M. S., & Kok, W. K. (2015). Building trust in internet
banking: A trustworthiness Perspective. Industrial Management & Data
Systems, 115(2), 235 - 252.
Peng, H., & Wei, F. (2016, May 30). Trickle-Down Effects of Perceived
Leader Integrity on Employee Creativity: A Moderated Mediation Model.
Journal of Business ethics. doi:10.1007/s10551-016-3226-3
Peter, J. H., Brian, C., & Rob, H. (2015). Electronic monitoring and
surveillance in the workplace. Personnel Review, 44(1), 161-175.
Peterson, C. H. (2005). Employee retention: The secrets behind Wal-Mart’s
successful hiring policies. Human Resource Management, 44(1), 85-88.

342
Philip, S. D., James, K. S., Anthony, P. A., Ceasar, D., & Gerald, R. F. (2013).
Cohesion and satisfaction as mediators of the team trust – team effectiveness
relationship. Career Development International, 18(5), 521 - 543.
Plucker, J. A., & Beghetto, R. A. (2003). Why not be creative when we enhance
creativity? In J. H. Borland, Rethinking gifted education (pp. 215-226). New
York: Teachers College Press.
Plucker, J., Beghetto, R. A., & Dow, G. (2004). Why isn’t creativity more
important to educational psychologists? Potential, pitfalls, and future
directions in creativity research. Educational Psychologist, 39, 83-96.
Podsakoff, N. P., LePine, J. A., & LePine, M. A. (2007). Differential challenge
stressor–hindrance stress relationships with job attitudes turn-over intentions,
turnover, and withdrawal behavior: A meta-analysis. Journal of Applied
Psychology, 92, 438–454.
Podsakoff, P. M., MacKenzie, S. B., Lee, J. Y., & Podsakoff, N. P. (2003).
Common method biases in behavioral research: A critical review of the
literature and recommended remedies. Journal of Applied Psychology, 88(5),
879–903. doi:10.1037/0021-9010.88.5.879
Po-Ling, S., & Cheng-Yuan, K. (2014). Review of threats on trust and
reputation models. Industrial Management & Data Systems, 114(3), 472 - 483.
Polit, D. F., & Beck, C. T. (2006). The content validity index: Are you sure
you know what’s being reported? Critique and recommendations. Research in
Nursing & Health, 29, 489–497.
Popoola, S., & Fagbola, O. (2014). Innovation capability of managers in
Nigerian large-scale manufacturing companies. SA Journal Of Information
Management, 16(1), 1-10. doi:10.4102/sajim.v16i1.593

343
Raduan, C. R., Naresh, K., Haslinda, A., & Goh, Y. L. (2008, March).
Organizational Culture as a Root of Performance Improvement: Research and
Recommendations. Contemporary Management Research, 4(1), 43-56.
Rawlins, B. R. (2008). Measuring the relationship between organizational
transparency and employee trust. Public Relations Journal, 2(2), 1-21.
Rebecca, A. R., & David, S. (2015). Facilitating tacit knowledge transfer:
routine compatibility, trustworthiness, and integration in M & As. Journal of
Knowledge Management, 19(2), 257 - 276.
Ren, F., & Zhang, J. (2015). Job Stressors, Organizational Innovation Climate,
and Employees’ Innovative Behavior. Creativity Research Journal, 27(1), 16-
23. doi:10.1080/10400419.2015.992659
Rhodes, M. (1961). An analysis of creativity. Phi Delta Kappan, 42, 305-310.
Rich, L. L., Rich, J., & Hair, J. (2018). The influence of organizational culture
on how we define and pursue goals: The value of regulatory focus. Journal of
organizational effectiveness: People and Performance. doi:10.1108/joepp-03-
2018-0017
Richard, I. L., & Leonard, D. G. (2016). Pre-employment good impression and
subsequent job performance. Journal of Managerial Psychology, 31(2), 346-
358.
Rickards, G., Magee, C., & Artino, A. R. (2012). You can’t fix by analysis
what you’ve spoiled by design: developing survey instruments and collecting
validity evidence. The Journal of Graduate Medical Education, 4(4), 407–410.
Rinne, T., Steel, G. D., & Fairweather, J. (2013). The role of Hofstede’s
individualism in national-level creativity. Creativity Research Journal, 25(1),
129-136.

344
Robinson, G. F., Galen E. Switzer, G. E., Cohen, E. D., Primack, B. A.,
Wishwa, K. N., Seltzer, D. L., & Rubio, D. M. (2014). Shortening the Work
Preference Inventory for use with Physician Scientists: WPI-10. Clinical and
Translational Science, 7(4), 324-328.
Rodney, M., & Alan, G. (2005). Enterprise Resource Planning And
Organisational Innovation: A Management Perspective. Industrial
Management & Data Systems, 105(3), 280-290.
Rogers, E. M. (2003). Diffusion of Innovations (5th ed.). Free Press.
Ronald, F., Kaspar, S., & Michele, P. (2016). The social context for value co-
creations in an entrepreneurial network. International Journal of
Entrepreneurial Behavior & Research, 22(2), 199 - 214.
Runco, M. A., Plucker, J. A., & Lim, W. (2001). Development and
Psychometric Integrity of a Measure of Ideational Behavior. Creativity
Research Journal, 13(3-4), 393-400.
Ruppe, L. (2006). Tools and dialogue set the stage for talent management at
Johns Manville. Journal of Organisational Excellence, 25(3), 37-48.
Ryhammar, L., & Brolin, C. (1999). Creativity research: Historical
considerations and main lines of development. Scandinavian Journal of
Educational Research, 43, 259-273.
Sangosanya, A. O. (2011). Firms Growth Dynamics in Nigeria’s
Manufacturing Industry: A Panel Analysis. Journal of Applied Econometric
Review, 1(1), 1-18.
Sanjit, K. R., & Vaibhav, S. (2010). Dimensional hierarchy of trustworthiness
of financial service providers. International Journal of Bank Marketing, 28(1),
47-64.

345
Sarantakos, S. (2000). Social Research. Sydney: MacMillian.
Sarstedt, M., Hair, J. F., Ringle, C. M., Thiele, K. O., & Gudergan, S. P. (2016).
Estimation issues with PLS and CBSEM:Where the bias lies. Journal of
Business Research, 69, 3998–4010. doi:10.1016/j.jbusres.2016.06.007
Sarstedt, M., Ringle, C. M., Smith, D., Reams, R., & Hair, J. F. (2014). Partial
least squares structural equation modeling (PLS-SEM): A useful tool for
family business researchers. Journal of Family Business Strategy, 5, 105–115.
doi:10.1016/j.jfbs.2014.01.002
Saunders, M., Lewis, P., & Thornhill, A. (2009). Research Methods for
Business Students (5th ed.). Essex: Pearson Education Limited.
Savolainen, T., & López-Fresno, P. (2012). Trust in leadership for sustaining
innovations: How leaders enact on showing trustworthiness. Nang Yan
Business Journal, 1(4), 129-138.
Sawyer, R. K. (2006). Explaining Creativity: The Science of Human
Innovation. New York: Oxford University Press.
Schein, E. H. (2010). Organizational Culture and Leadership (4th ed.). San
Francisco: Jossey-Bass.
Schmidt, C. O., & Kohlmann, T. (2008). When to use the odds ratio or the
relative risk? International journal of public health, 53(3), 165–167.
Schmierback, M. (2005). Method matters: The influence of methodology on
journalists’ assessments of social science research’, Science Communication.
Science Communication, 26(3), 269–287.

346
Schneider, B. (1987). People make the place. Personnel Psychology, 40, 437-
453.
Schoorman, D. F., Mayer, C. R., & Davis, H. J. (2007). An Integrative Model
of Organizational Trust: Past, Present and Future. Academy of Management
Review, 32(2), 344–354.
Seok, C. B., & Chiew, T. C. (2013). Trust, trustworthiness and justice
perception toward the head of department. Global Journal of Arts Humanities
and Social Sciences, 1(1), 20-29.
Shainesh, G. (2012). Effects of trustworthiness and trust on loyalty intentions.
International Journal of Bank Marketing, 30(4), 267-279.
Shalley, C. E., & Gilson, L. L. (2004). What leaders need to know: A review
of social and contextual factors that can foster or hinder creativity. The
Leadership Quarterly, 15, 33-53.
Shalley, C. E., Zhou, J., & Oldham, G. R. (2004). The Effects of Personal and
Contextual Characteristics on Creativity: Where Should We Go from Here?
Journal of Management, 30(6), 933–958.
Sharifirad, M. S. (2016). Can incivility impair team’s creative performance
through paralyzing employee’s knowledge sharing? A multi-level approach.
Leadership & Organization Development Journal, 37(2), 1-34.
Shuchih, E. C., Anne, Y. L., & Sungmin, L. (2015). Exploring privacy and trust
for employee monitoring. Industrial Management & Data Systems, 115(1), 88-
106.
Silvia, P. J., Wigert, B., Reiter-Palmon, R., & Kaufman, J. C. (2012). Assessing
Creativity With Self-Report Scales : A Review and Empirical Evaluation.

347
Psychology Faculty Publications, 54. Retrieved from
http://digitalcommons.unomaha.edu/psychfacpub/54
Simons, T., Leroy, H., Collewaert, V., & Masschelein, S. (2015). How leader
alignment of words and deeds affects followers: A meta-analysis of behavioral
integrity research. Journal of Business Ethics, 132, 831–844.
doi:10.1007/s10551-014-2332-3
Singh, S., & Sidhu, J. (2017). Compliance-based Multi-dimensional Trust
Evaluation System for determining trustworthiness of Cloud Service Providers.
Future Generation Computer Systems, 67, 109-132.
Siniscalco, M. T., & Auriat, N. (2005). Quantitative research methods in
educational planning (8th ed.). (K. N. Ross, Ed.) Paris, France: International
Institute for Educational Planning/UNESCO.
Skerlavaj, M., Su, C., & Huang, M. (2013). The moderating effects of national
culture on the development of organisational learning culture: A multilevel
study across seven countries. Journal for East European Management Studies,
18(1), 97-134.
Sneve, M., & Jorde, R. (2008). Cross-sectional study on the relationship
between body mass index and smoking, and longitudinal changes in body mass
index in relation to change in smoking status: The Tromsø Study. Scandinavian
Journal of Public Health, 36, 397–407.
Sok, P., Sok, K. M., Danaher, T. S., & Danaher, P. J. (2018). The
complementarity of frontline service employee creativity and attention to detail
in service delivery. Journal of Service Research, 1-14.
doi:10.1177/1094670517746778
Sridharan, R., & Simatupang, T. M. (2013). Power and trust in supply chain
collaboration. Int. J. Value Chain Management, 7(1), 76-96.

348
Srinivasa, R. A., & Waheed, K. A. (2015). Impact of transformational
leadership on team performance: an empirical study in UAE. Measuring
Business Excellence, 19(4), 30 - 56.
Stahl, G. K., Maznevski, M. L., Voigt, A., & Jonsen, K. (2010). Unraveling the
effects of cultural diversity in teams: A meta-analysis of research on
multicultural work groups. Journal of International Business Studies(41), 690-
709.
Steffens, N. K., Shemla, M., Wegge, J., & Diestel, S. (2014). Organizational
Tenure and Employee Performance: A Multilevel Analysis. Group &
Organization Management, 39(6), 664-690.
Stein, M. I. (1987). Creativity research at the crossroads: A 1985 perspective.
In S. G. Isaksen, Frontiers of creativity research: Beyond the basics (pp. 417-
427). Buffalo, New York: Bearly.
Sternberg, R. (1997). Successful intelligence. New York: Plume.
Sternberg, R. J. (2006). The Nature of Creativity. Creativity Research Journal,
18(1), 87-98.
Sternberg, R. J. (2012). The Assessment of Creativity: An Investment-Based
Approach. Creativity Research Journal, 24(1), 3-12.
Sternberg, R. J., & Lubart, T. I. (1991). An investment theory of creativity and
its development. Human Development, 34, 1-32.
Sternberg, R. J., & Lubart, T. I. (1992). Buy low and sell high: An investment
approach to creativity. Current Directions in Psychological Science, 1, 1-5.

349
Tang, C., & Byrge, C. (2016). Ethnic Heterogeneous Teams Outperform
Homogeneous Teams on Well-defined but not Ill-defined Creative Task.
Journal of Creativity and Business Innovation, 2, 20-30.
Tastan, S. B., & Davoudi, S. M. (2015). An examination of the relationship
between leader-member exchange and innovative work behavior with the
moderating role of trust in leader: A study in the Turkish context. Procedia-
Social and Behavioral Sciences, 181, 23-32.
Teddlie, C., & Yu, F. (2007). Mixed Methods Sampling A Typology With
Examples. Journal of Mixed Methods Research, 1(1), 77-100.
Teece, D. J. (2009). Dynamic Capabilities and Strategic Management:
Organizing for Innovation and Growth. New York: Oxford University Press
Inc.
The Nigerian Stock Exchange. (2016). Retrieved April 14, 2016, from
www.nse.com.ng: http://www.nse.com.ng/Issuers-section/listed-securities
The University of Western Ontario. (2015, December 17). Publish Web Server.
Retrieved from http://publish.uwo.ca/:
http://publish.uwo.ca/~rmoir2/docs/CriticalThinking%20Tutorial%202.pdf
The World Bank. (2007). http://www.worldbank.org/. Retrieved September
2016, from Researchers in R&D (per million people):
https://data.worldbank.org/indicator/SP.POP.SCIE.RD.P6?end=2007&locatio
ns=NG&start=2007&view=chart
Thomas, C. M., & Eileen, H. M. (2006). Workplace Stress. Journal of
Workplace Behavioral Health, 21(2), 89-97. doi:10.1300/J490v21n02_07
Thompson, V. A. (1965). Bureaucracy and innovation. Administrative Science
Quarterly, 10, 1-20.

350
Tidd, J., & Bessant, J. (2009). Managing innovation. Integrating technological,
market, and organizational change (4th ed.). Chichester: Wiley.
Titus, P. A. (2007). Applied Creativity: The Creative Marketing Breakthrough
Model. Journal of Marketing Education, 29(3), 262-272.
doi:10.1177/0273475307307600
Trochim, W. (2006). Research Methods (2nd Edition ed.). New Delhi: Himal
Impressions.
Tschannen-Moran, M., & Hoy, W. K. (2000). A multidisciplinary analysis of
the nature, meaning, and measurement of trust. Review of Educational
Research, 70(4), 547-593.
Tsung-Hsien, K. (2013). How expected benefit and trust influence knowledge
sharing. Industrial Management & Data Systems, 113(4), 506 - 522.
Tung, F.-C., & Yu, T.-W. (2016). Does innovation leadership enhance
creativity in high-tech industries? Leadership & Organization Development
Journal, 37(5), 579 - 592.
Umoh, G. I., Amah, E., & Wokocha, I. H. (2014). Employee Benefits and
Continuance Commitment in the Nigerian Manufacturing Industry. Journal of
Business and Management, 16(2), 69-74.
Upasna, A. A. (2014). Linking justice, trust and innovative work behaviour to
work engagement. Personnel Review, 43(1), 41 - 73.
Usman, A. B., & Amran, N. A. (2015). Corporate social responsibility practice
and corporate financial performance: evidence from Nigeria companies. Social
Responsibility Journal, 11(4), 749-763. doi:10.1108/SRJ-04-2014-0050

351
Uwalomwa, U., & Jafaru, J. (2012, July). Corporate Environmental
Disclosures in the Nigerian Manufacturing Industry: A Study of Selected
Firms. African Research Review: An International Multidisciplinary Journal,
6(3), 71-83.
Vagn, A. R., Clausen, C., & Gish, L. (2013). Towards a new perspective of
managing ideas in front-end innovation as actor networks. In Proceedings of
the 19th International Conference on Engineering Design (ICED13) : Design
For Harmonies. (pp. 181-190). SEOUL: International Conference On
Engineering Design, ICED13. Retrieved December 17, 2015
Valentine, S., Godkin, L., Fleischman, G. M., & Kidwell, D. (2011). Corporate
ethical values, group creativity, job satisfaction and turnover intention: The
impact of work context on work response. Journal of Business Ethics, 98, 353–
372.
Van Riel, A. C., Henseler, J., Kemény, I., & Sasovova, Z. (2017). Estimating
hierarchical constructs using consistent partial least squares: The case of
second-order composites of common factors. Industrial Management & Data
Systems, 117(3), 459-477. doi:10.1108/IMDS-07-2016-0286
Vathsala, W., & Ruvini, W. (2012). Effects of interpersonal trust, team leader
support, rewards, and knowledge sharing mechanisms on knowledge sharing
in project teams. VINE, 42(2), 214 - 236.
Vathsala, W., & Wickramasinghe, G. (2016). Variable pay and job
performance of shop-floor workers in lean production. Journal of
Manufacturing Technology Management, 27(2), 287-311.
Viswesvaran, C., & Ones, D. S. (2000). Perspectives on models of job
performance. International Journal of Selection and Assessment, 8, 216-226.
Vroom, V. H. (1964). Work and Motivation. New York: Wiley.

352
Wallach, E. (1983). Individuals and organization: The cultural match. Training
and Development Journal, 12, 28-36.
Wang, Z., & Wang, N. (2012). Knowledge sharing, innovation and firm
performance. Expert Systems with Applications, 8899–8908.
doi:10.1016/j.eswa.2012.02.017
Ward, T. .., Smith, S. M., & Finke, R. A. (1999). Creative cognition. In R. J.
Sternberg, Handbook of Creativity (pp. 189-212). New York: Cambridge
University Press.
Weerts, K., Vermeulen, W., & Witjes, S. (2018). On corporate sustainability
integration: Analysing corporate leaders' experiences and academic learnings
from an organisational culture perspective. Journal of Cleaner Production.
doi:10.1016/j.jclepro.2018.07.173
Weibel, A. (2007). Formal Control and Trustworthiness: Shall the Twain
Never Meet? Group & Organization Management, 32(4), 500-517.
Weisberg, H. F., & Bowen, B. D. (1977). An Introduction to Survey Research
and Data Analysis. San Francisco: W. H. Freeman.
West, M. A. (2002). Sparkling Fountains or Stagnant Ponds: An Integrative
Model of Creativity and Innovation Implementation in Work Groups. Applied
Psychology: An International Review, 51(3), 355–424.
White, C., McMurray, A. J., & Rudito, P. (2012). Using mature concepts to
generate new ideas: technology acceptance revisited. Int. J. Technology
Marketing, 7(4), 361-378.
Widaman, K. F., Helm, J. L., Castro-Schilo, L., Pluess, M., Stallings, M. C., &
Belsky, J. (2012). Distinguishing Ordinal and Disordinal Interactions. Psychol
Methods, 17(4), 615-662. doi:10.1037/a0030003

353
Wiener, M., Gattringer, R., & Strehl, F. (2017). Participation in inter-
organisational collaborative open foresight: A matter of culture. Technology
Analysis and Strategic Management, 1-17.
doi:10.1080/09537325.2017.1376045
Wipulanusat, W., Panuwatwanich, K., & Stewart, R. A. (2018). Pathways to
workplace innovation and career satisfaction in the public service: The role of
leadership and culture. International Journal of Organizational Analysis.
doi:10.1108/IJOA-03-2018-1376
Wold, H. (1982). Soft modeling: the basic design and some extensions. In K.
G. Joreskog, & H. Wold, Systems Under Indirect Observations: Part II (pp. 1-
54). Amsterdam: North-Holland.
Wong, K. K.-K. (2013). Partial Least Squares Structural Equation Modeling
(PLS-SEM) Techniques Using SmartPLS. Marketing Bulletin, 24(1), 1-32.
Retrieved from http://marketing-bulletin.massey.ac.nz
Won-Moo, H., Taewon, M., & Seung-Yoon, R. (2016). Exploring the
relationships between compassion at work, the evaluative perspective of
positive work-related identity, service employee creativity, and job
performance. Journal of Services Marketing, 30(1), 103-114.
Woodman, R., Sawyer, J. E., & Griffin, R. W. (1993). Toward a theory of
organizational creativity. Academy of Management Review, 18, 293-321.
World Economic Forum. (2015). Global Competiveness Report 2015-2016.
Geneva: World Economic Forum.
Yamashina, H. (2001). Challenge to world-class manufacturing. International
Journal of Quality & Reliability Management, 17(2), 132-143.

354
Yang, J.-S., & Hung, H. V. (2015). Emotions as Constraining and Facilitating
Factors for Creativity: Companionate Love and Anger. Creativity and
Innovation Management, 24(2), 217-230. doi:10.1111/caim.12089
Yazdi, m. H. (2007). The relationshipbetween organizational culture and
creativity of employees in the branches of National Bank of North Khorasan.
Quarterly of Scientific- research, Educational research letter of Islamic Azad
University Branch Bojnourd, 189-209.
Yetunde, A. A., & Aluko, O. (2012). Human capital development: Nigeria’s
greatest challenge. Journal of Management Policy and Practice, 13(1), 162-
177.
Yong, G. A., & Pearce, S. (2013). A Beginner’s Guide to Factor Analysis:
Focusing on Exploratory Factor Analysis. Tutorials in Quantitative Methods
for Psychology, 9(2), 79-94.
Yuri, M. (2011). Creative workplace: Instrumental and symbolic support for
creativity. Facilities, 29(1/2), 63 - 79.
Yusuf, S., & Akram, A. A. (2014). Institutional and corporate drivers of global
talent management: Evidence from the Arab Gulf region. Journal of World
Business, 49, 215-224.
Zhao, H. (2015). Leader-member exchange differentiation and team creativity.
Leadership & Organization Development Journal, 36(7), 798-815.
Zhou, J., & George, J. M. (2003). Awakening Employee Creativity: The Role
of Leader Emotional Intelligence. The Leadership Quarterly, 14, 545-568.
Zikmund, W. G., Babin, B. J., Carr, J. C., & Griffin, M. (2013). Business
research methods. Cengage Learning.

355
Zoogah, D. B., & Zoogah, R. B. (2014, November 28). Experimenting with
Resource Strategy: Experimental Analysis and Strategic Human Resources. In
Advancing Research Methodology in the African Context: Techniques,
Methods, and Designs, 21-53.

356
APPENDIX A
STUDY’S QUESTIONNAIRE
Section A: Questionnaire
UNIVERSITI TUNKU ABDUL RAHMAN
Dear Sir/Madam
I am currently studying for a PhD degree at the Universiti Tunku Abdul
Rahman (UTAR) in Malaysia, with the tittle; The Effect of Trustworthiness
on The Impact of Organisational Culture on Employee Creativity: The
Nigerian Manufacturing Industry.
The study is vital for the achievement of high employee creativity within the
organisation. It would aid in assessing and profiling an appropriate
organisational culture, which adequately supports employee creativity. It
would also serve as a resourceful benchmark and guide for analysing
trustworthiness effects on the relationship between the current company culture
and its employee creativity. This questionnaire is divided into four sections;
sections A, B, C and D.
Section A relates to the demographics of the respondents. Section B highlights
the participant’s opinions about the company’s culture profile. Section C is
about employee’s perceived trustworthiness of company’s top management.
The section D is also about the overall assessment of employee creativity in
the organisation.

357
Your participation is valuable to this study. The value of your time and effort
employed in completing the attached questionnaire is highly appreciated. The
information provided herein will be treated as strictly confidential and for the
purpose of the current study only.
Yours sincerely,
Ogbeibu Samuel
Please should you have any further enquiries, do contact me through any of the
email addresses below; [email protected] or [email protected].
Section A: Demographic
Instructions: Please tick [√] the appropriate box or fill in the blanks (….) with
an appropriate answer.
1. Age: ………… years.
2. Gender: Female Male
3. Highest Academic Qualification
Diploma or equivalent Master’s Degree or equivalent
Bachelor’s degree or equivalent Doctor of Philosophy
(Phd/DBA)
4. How long have you been attached to the current company?
Year(s): ...……...

358
5. Level of job position in the company
Management Level Position Non-Management Level
Position
6. Which department are you currently attached with?
Research and Development Information Technology
Other Departments
Section B: Current Organisational Culture Profile
Instructions: Please indicate the extent to which you agree or disagree with
each of the statements below. Tick [√] the appropriate box that best represents
your level of agreement with the statement, by using the scale provided.

359

360

361

362
Section C: Employees’ Perceived Trustworthiness of Organisation’s Top
Management.
Instructions: Please indicate the extent to which you agree or disagree with
each of the statements below. Tick [√] the appropriate box that best represents
your level of agreement with the statement, by using the scale provided.

363

364

365
Section D: Overall Level of Employee Creativity in the Organisation.
Instructions: Please indicate the extent to which you agree or disagree with
each of the statements below. Compared to employees of almost your age and
or life experience, just how creative would you rate yourself for each of the
subsequent acts? For acts which you have not precisely done, do estimate your
creative potential based on your results or performance on similar tasks.
Therefore, tick [√] the appropriate box that best represents your level of
agreement with the statement, by using the scale provided.

366

367

368
THANK YOU FOR YOUR KIND CO-OPERATION AND TIME

369
APPENDIX B
RELIABILITY OF THE QUESTIONNAIRE
Overall Reliability Statistics
Cronbach's Alpha N of Items
.876 66
Pilot Study Reliability Statistics
Items Cronbach's Alpha N of Items
ABILITY .936 6
ADHOCRACY .768 5
BENEVOLENCE .854 5
CLAN .866 6
CREATIVE THINKING .856 9
EXPERTISE .904 9
HIERARCHY .945 6
INTEGRITY .934 6
MARKET .888 5
TASK MOTIVATION .888 9

370
APPENDIX C
TOTAL VARIANCE EXPLAINED

371
Total Variance Explained (Continued)

372
Total Variance Explained (Continued)

373
APPENDIX D
NORMALITY OF DATA BASED ON MAHANALOBIS DISTANCE AND OUTLIERS
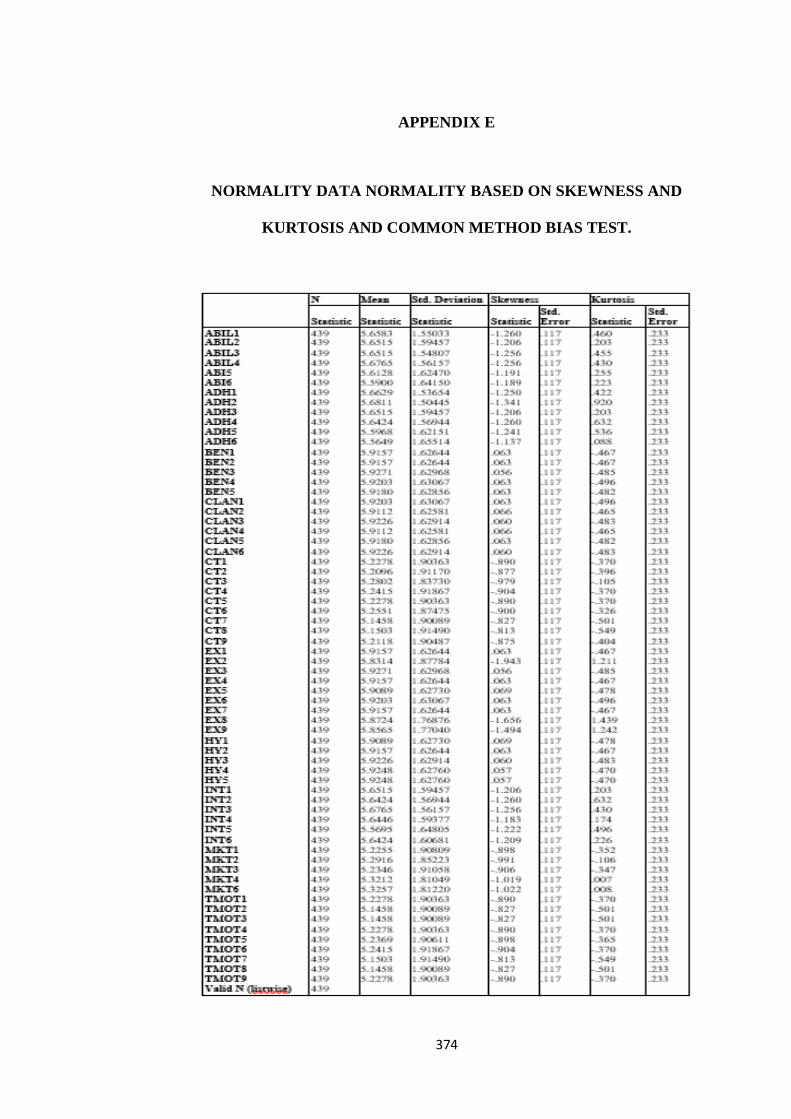
374
APPENDIX E
NORMALITY DATA NORMALITY BASED ON SKEWNESS AND
KURTOSIS AND COMMON METHOD BIAS TEST.

375
APPENDIX F
EMAIL RESPONSE FROM PROF. JOSEPH HAIR ON MULTIPLE MODERATION ANALYSIS

376
APPENDIX G
EMAIL RESPONSE FROM PROF. MARKO SARSTEDT ON MODERATION INTERACTION ANALYSIS

377
APPENDIX H
EMAIL RESPONSE FROM PROF. JAMES GASKIN ON
MODERATION INTERACTION OF THIS STUDY’S ANALYSIS

378
APPENDIX H (Continued)

379
APPENDIX H (Continued)

380
APPENDIX H (Continued)

381
APPENDIX I

382
EMAIL PROOF OF MANUSCRIPT ACCEPTANCE FOR PUBLICATION IN THE JOURNAL OF BUSINESS RESEARCH

383
EMAIL PROOF OF MANUSCRIPT ACCEPTANCE FOR PUBLICATION IN BUSINESS CREATIVITY AND THE CREATIVE
ECONOMY JOURNAL

384
APPENDIX J
REVIEW OF RELEVANT PAST STUDIES 1
Table 2. 1: Research Methodologies of Relevant Past Studies Related to
Organisational Culture and Employee Creativity

385

386

387
APPENDIX K
REVIEW OF RELEVANT PAST STUDIES 2
Table 2. 2: Research Methodologies of Relevant Past Studies Related to
Organisational Culture, Trustworthiness and Employee Creativity

388

389
APPENDIX L
MODERATION MODELS

390
Figure 4.3b: Moderating Effect of Ability

391
Figure 4.3c: Moderating Effect of Benevolence

392
Figure 4.3d: Moderating Effect of Integrity