THE EFFECTS OF TRAFFIC CALMING MEASURES ON PEDESTRIAN AND MOTORIST ... · The Effects of Traffic...
31
PDHonline Course C269 (2 PDH) The Effect of Traffic Calming Measures on Pedestrian and Motorist Behavior 2012 Instructor: Vincent D. Reynolds, MBA, PE PDH Online | PDH Center 5272 Meadow Estates Drive Fairfax, VA 22030-6658 Phone & Fax: 703-988-0088 www.PDHonline.org www.PDHcenter.com An Approved Continuing Education Provider
Transcript of THE EFFECTS OF TRAFFIC CALMING MEASURES ON PEDESTRIAN AND MOTORIST ... · The Effects of Traffic...

PDHonline Course C269 (2 PDH)
The Effect of Traffic Calming Measureson Pedestrian and Motorist Behavior
2012
Instructor: Vincent D. Reynolds, MBA, PE
PDH Online | PDH Center5272 Meadow Estates Drive
Fairfax, VA 22030-6658Phone & Fax: 703-988-0088
www.PDHonline.orgwww.PDHcenter.com
An Approved Continuing Education Provider

The Effects of Traffic CalmingMeasures on Pedestrian andMotorist Behavior
REPORT NO. FHWA-RD-00-104 August 2001
U.S. Department of TransportationFederal Highway AdministrationResearch, Development, and TechnologyTurner-Fairbank Highway Research Center6300 Georgetown PikeMcLean, VA 22101-2296
FOREWORD The FHWA’s Pedestrian and Bicycle Safety Research Program’s overall goal is to increase pedestrian and bicycle safety and mobility. Traffic calming has been used on residential streets to help reduce vehicle speeds. In addition to reducing vehicle speeds, traffic calming treatments may also benefit pedestrians by shortening crossing distances and enhancing motorist and pedestrian visibility. This reports documents an evaluation of the effects of selected traffic calming treatments on both pedestrian and motorist behavior. This study was part of a larger Federal Highway Administration research study investigating the effectiveness of engineering treatments on pedestrian and bicycle safety. It is hoped that readers also will review the reports documenting the results of the other pedestrian and bicycle safety studies. The results of this research will be useful to transportation engineers, planners, and safety professionals who are involved in improving pedestrian safety and mobility.
Michael F. Trentacoste
Director, Office of Safety Research and Development
NOTICE This document is disseminated under the sponsorship of the Department of Transportation in the interest of information exchange. The United States Government assumes no liability for its content of use thereof. This report does not constitute a standard, specification or regulation. The United States Government does not endorse products or manufactures. Trade and manufactures’ names appear in this report only because they are considered essential to the object of the document.
Technical Report Documentation Page 1. Report No.
FHWA-RD-00-104
2. Government Accession No. 3. Recipient's Catalog No.
4. Title and Subtitle
THE EFFECTS OF TRAFFIC CALMING MEASURES ON PEDESTRIAN AND MOTORIST BEHAVIOR
5. Report Date
August 20016. Performing Organization Code
7. Author(s)
Herman F. Huang and Michael J. Cynecki
8. Performing Organization Report No.
9. Performing Organization Name and Address
Highway Safety Research Center City of Phoenix University of North Carolina Street Transportation Dept. 730 Airport Rd., Bolin Creek Ctr. 200 West Washington Chapel Hill, NC 27599-3430 Phoenix, AZ 85003-1611
10. Work Unit No. (TRAIS)
11. Contract or Grant No.
DTFH61-92-C-00138
12. Sponsoring Agency Name and Address
Federal Highway Administration Turner-Fairbank Highway Research Center 6300 Georgetown Pike McLean, VA 22101-2296
13. Type of Report and Period Covered
Research ReportJuly 1, 1996 - October 31, 199914. Sponsoring Agency Code
15. Supplementary Notes
Contracting Officer’s Technical Representative (COTR): Carol Tan Esse, HRDS-05 16. Abstract
Traffic calming treatments may benefit pedestrians who are crossing the street by slowing down vehicletraffic, shortening crossing distances, and enhancing motorist and pedestrian visibility. The objective of this studyis to evaluate the effects of selected traffic calming treatments, at both intersection and mid-block locations, onpedestrian and motorist behavior.
“Before” and “after” data were collected in Cambridge, MA (bulbouts and raised intersection), Corvallis, OR(pedestrian refuge island), and Seattle, WA (bulbouts). Data were also collected at “treatment” and “control”sites in Durham, NC (raised crosswalks), Greensboro, NC (bulbouts), Montgomery County, MD (raisedcrosswalks), Richmond, VA (bulbouts), and Sacramento, CA (bulbouts). The key findings include:
(1) Overall vehicle speeds were often lower at treatment sites than at control sites.(2) The combination of a raised crosswalk with an overhead flasher increased the percentage of pedestrians
for whom motorists yielded. It is not known what part of the improvement was attributable to the raisedcrosswalk and what part was attributable to the flasher. None of the other treatments had a significanteffect on the percentage of pedestrians for whom motorists yielded.
(3) The treatments usually did not have a significant effect on average pedestrian waiting time.(4) Refuge islands often served to channelize pedestrians into marked crosswalks. The raised inter- section
in Cambridge also increased the percentage of pedestrians who crossed in the crosswalk.In conclusion, these devices have the potential for improving the pedestrian environment. However, these
devices by themselves do not guarantee that motorists will slow down or yield to pedestrians.17. Key Words
traffic calming, pedestrians, motorists, yielding, crossing
18. Distribution Statement
No restrictions. This document is available to thepublic through the National Technical InformationService, Springfield, VA 22161.
19. Security Classif. (of this report)
Unclassified
20. Security Classif. (of this page)
Unclassified
21. No. of Pages
27
22. Price
Form DOT F 1700.7 (8-72) Reproduction of form and completed page is authorize

ii
TABLE OF CONTENTS Page
INTRODUCTION . . . . . . . . . . . . . . . . . . . . . . . . . . . . . . . . . . . . . . . . . . . . . . . . . . . . . . . . . . . . 1Past Research on the Effects of Speed Humps . . . . . . . . . . . . . . . . . . . . . . . . . . . . . . . . . . . . . 1Previous Studies on the Effects of Bulbouts and Street Narrowing . . . . . . . . . . . . . . . . . . . . . . . 3
DATA COLLECTION . . . . . . . . . . . . . . . . . . . . . . . . . . . . . . . . . . . . . . . . . . . . . . . . . . . . . . . . . 5
BULBOUTS — CAMBRIDGE AND SEATTLE . . . . . . . . . . . . . . . . . . . . . . . . . . . . . . . . . . . . . 6Site Descriptions . . . . . . . . . . . . . . . . . . . . . . . . . . . . . . . . . . . . . . . . . . . . . . . . . . . . . . . . . . . 6Pedestrians for Whom Motorists Yielded . . . . . . . . . . . . . . . . . . . . . . . . . . . . . . . . . . . . . . . . . 6Where Do Pedestrians Cross? . . . . . . . . . . . . . . . . . . . . . . . . . . . . . . . . . . . . . . . . . . . . . . . . . 7Average Pedestrian Wait Time . . . . . . . . . . . . . . . . . . . . . . . . . . . . . . . . . . . . . . . . . . . . . . . . . 8
BULBOUTS — GREENSBORO AND RICHMOND . . . . . . . . . . . . . . . . . . . . . . . . . . . . . . . . . 9Site Descriptions . . . . . . . . . . . . . . . . . . . . . . . . . . . . . . . . . . . . . . . . . . . . . . . . . . . . . . . . . . . 9Vehicle Speeds . . . . . . . . . . . . . . . . . . . . . . . . . . . . . . . . . . . . . . . . . . . . . . . . . . . . . . . . . . . . 9Pedestrians for Whom Motorists Stopped . . . . . . . . . . . . . . . . . . . . . . . . . . . . . . . . . . . . . . . 11
RAISED CROSSWALKS . . . . . . . . . . . . . . . . . . . . . . . . . . . . . . . . . . . . . . . . . . . . . . . . . . . . . 11Vehicle Speeds . . . . . . . . . . . . . . . . . . . . . . . . . . . . . . . . . . . . . . . . . . . . . . . . . . . . . . . . . . . 13Pedestrians for Whom Motorists Stopped . . . . . . . . . . . . . . . . . . . . . . . . . . . . . . . . . . . . . . . 14
RAISED INTERSECTIONS . . . . . . . . . . . . . . . . . . . . . . . . . . . . . . . . . . . . . . . . . . . . . . . . . . . . 15Pedestrians for Whom Motorists Yielded . . . . . . . . . . . . . . . . . . . . . . . . . . . . . . . . . . . . . . . . 16Pedestrians Who Crossed in the Crosswalk . . . . . . . . . . . . . . . . . . . . . . . . . . . . . . . . . . . . . . 16Average Pedestrian Wait Time . . . . . . . . . . . . . . . . . . . . . . . . . . . . . . . . . . . . . . . . . . . . . . . . 16
REFUGE ISLANDS . . . . . . . . . . . . . . . . . . . . . . . . . . . . . . . . . . . . . . . . . . . . . . . . . . . . . . . . . . 16Pedestrians for Whom Motorists Yielded . . . . . . . . . . . . . . . . . . . . . . . . . . . . . . . . . . . . . . . . 17Where Do Pedestrians Cross? . . . . . . . . . . . . . . . . . . . . . . . . . . . . . . . . . . . . . . . . . . . . . . . . 18Average Pedestrian Wait Time . . . . . . . . . . . . . . . . . . . . . . . . . . . . . . . . . . . . . . . . . . . . . . . . 19
DISCUSSION . . . . . . . . . . . . . . . . . . . . . . . . . . . . . . . . . . . . . . . . . . . . . . . . . . . . . . . . . . . . . . 20
CONCLUSIONS . . . . . . . . . . . . . . . . . . . . . . . . . . . . . . . . . . . . . . . . . . . . . . . . . . . . . . . . . . . . 22
ACKNOWLEDGMENTS . . . . . . . . . . . . . . . . . . . . . . . . . . . . . . . . . . . . . . . . . . . . . . . . . . . . . 22
REFERENCES . . . . . . . . . . . . . . . . . . . . . . . . . . . . . . . . . . . . . . . . . . . . . . . . . . . . . . . . . . . . . . 23
iii
LIST OF FIGURES Page
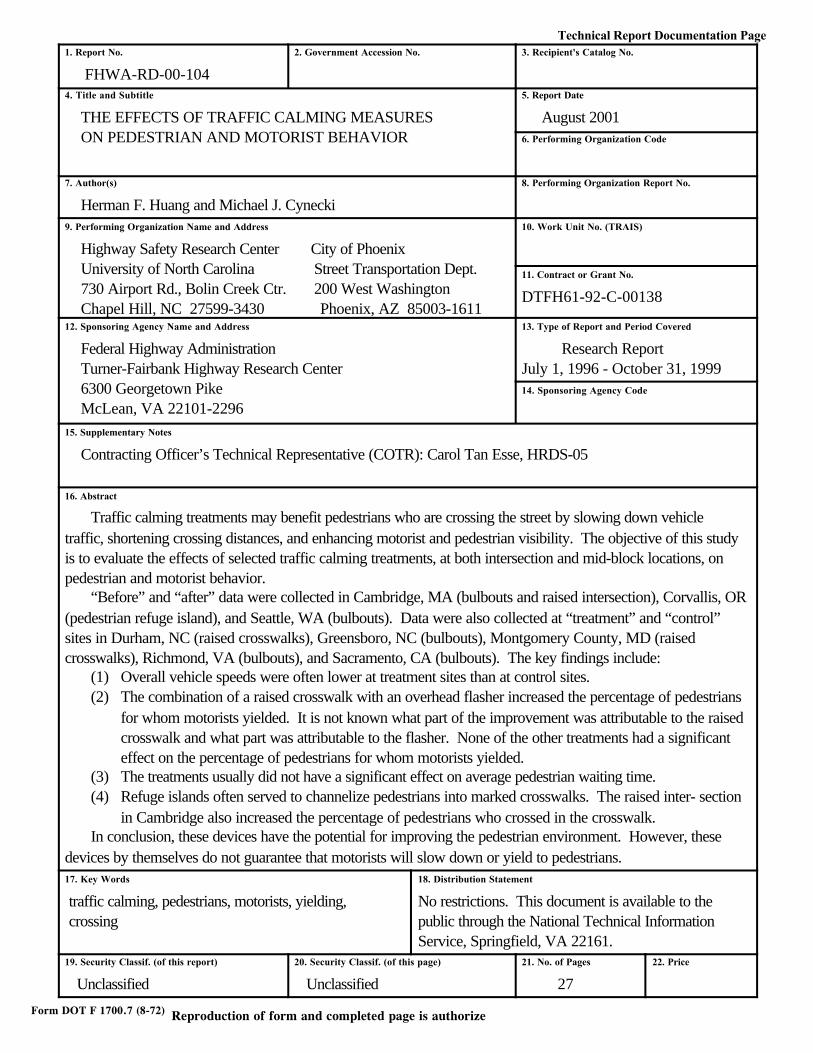
Figure 1. Two vehicles slow down as they pass over a speed hump . . . . . . . . . . . . . . . . . . . . . . . . 2
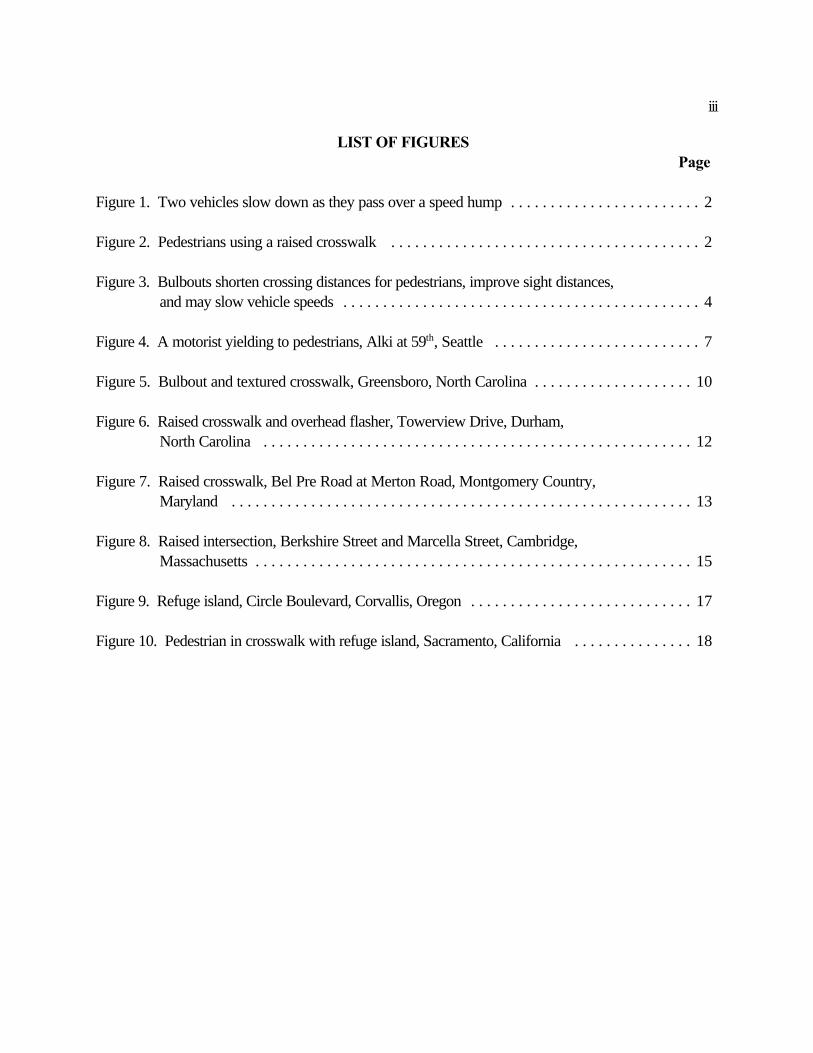
Figure 2. Pedestrians using a raised crosswalk . . . . . . . . . . . . . . . . . . . . . . . . . . . . . . . . . . . . . . . 2
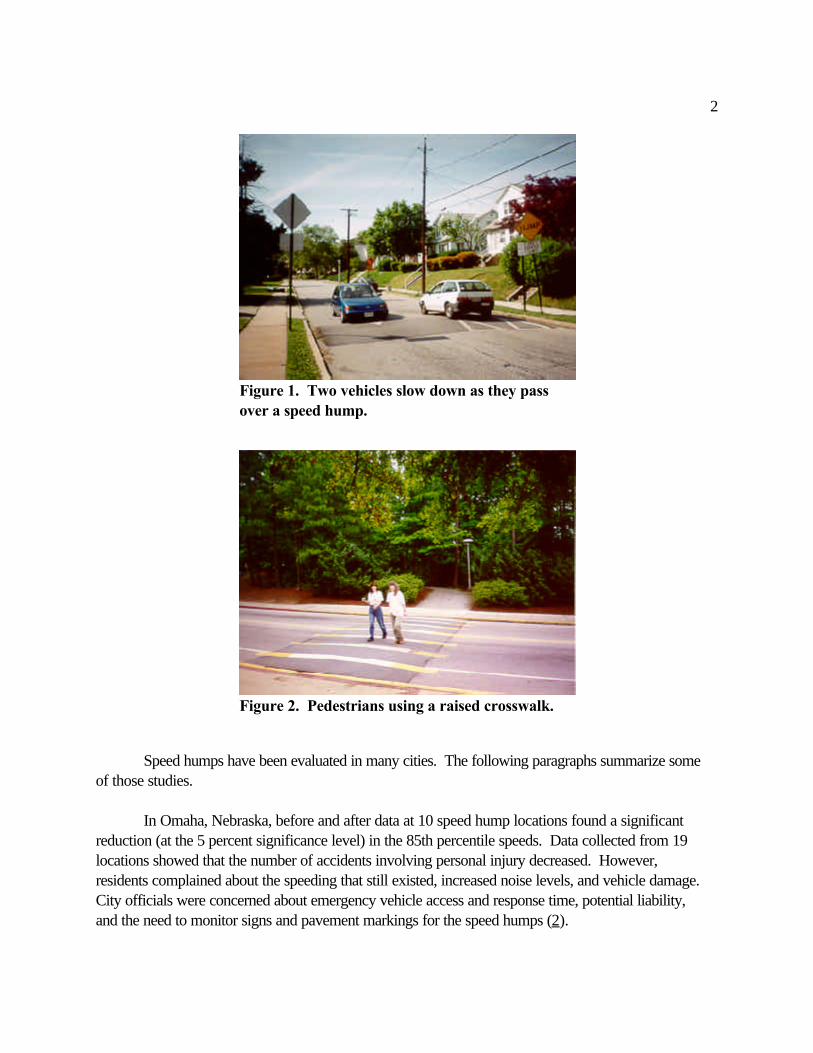
Figure 3. Bulbouts shorten crossing distances for pedestrians, improve sight distances, and may slow vehicle speeds . . . . . . . . . . . . . . . . . . . . . . . . . . . . . . . . . . . . . . . . . . . . . 4
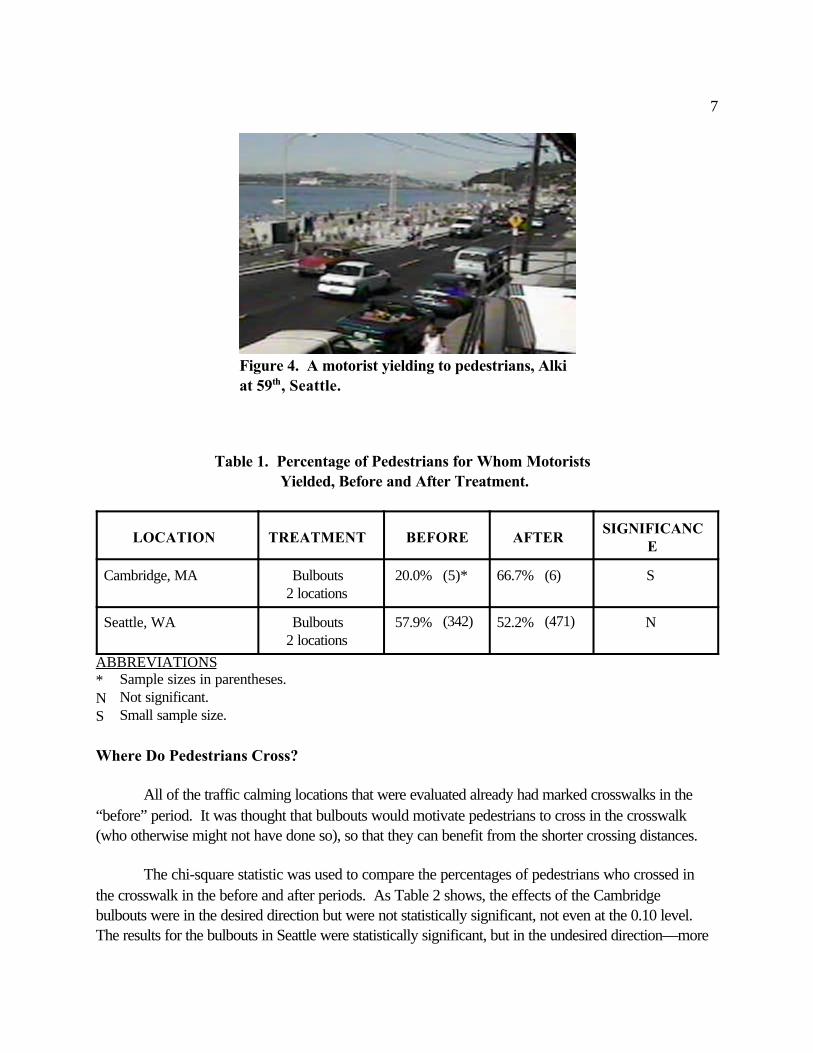
Figure 4. A motorist yielding to pedestrians, Alki at 59th, Seattle . . . . . . . . . . . . . . . . . . . . . . . . . . 7
Figure 5. Bulbout and textured crosswalk, Greensboro, North Carolina . . . . . . . . . . . . . . . . . . . . 10
Figure 6. Raised crosswalk and overhead flasher, Towerview Drive, Durham, North Carolina . . . . . . . . . . . . . . . . . . . . . . . . . . . . . . . . . . . . . . . . . . . . . . . . . . . . . . 12
Figure 7. Raised crosswalk, Bel Pre Road at Merton Road, Montgomery Country, Maryland . . . . . . . . . . . . . . . . . . . . . . . . . . . . . . . . . . . . . . . . . . . . . . . . . . . . . . . . . . 13
Figure 8. Raised intersection, Berkshire Street and Marcella Street, Cambridge, Massachusetts . . . . . . . . . . . . . . . . . . . . . . . . . . . . . . . . . . . . . . . . . . . . . . . . . . . . . . . 15
Figure 9. Refuge island, Circle Boulevard, Corvallis, Oregon . . . . . . . . . . . . . . . . . . . . . . . . . . . . 17
Figure 10. Pedestrian in crosswalk with refuge island, Sacramento, California . . . . . . . . . . . . . . . 18

iv
LIST OF TABLES
Page
Table 1. Percentage of Pedestrians for Whom Motorists Yielded, Before and After Treatment . . . . . . . . . . . . . . . . . . . . . . . . . . . . . . . . . . . . . . . . . . . . . . . . . . . . . . . . . . . 7
Table 2. Percentage of Pedestrians Who Crossed in the Crosswalk, Before and After Treatment . . . . . . . . . . . . . . . . . . . . . . . . . . . . . . . . . . . . . . . . . . . . . . . . . . . . . . . . . . . . 8
Table 3. Average Pedestrian Wait Time, Before and After Treatment . . . . . . . . . . . . . . . . . . . . . . 8
Table 4. Bulbouts and Control Sites . . . . . . . . . . . . . . . . . . . . . . . . . . . . . . . . . . . . . . . . . . . . . . . 9
Table 5. Comparison of Vehicle Speeds at the Treatment and Control Sites . . . . . . . . . . . . . . . . 10
Table 6. Pedestrians for Whom Motorists Stopped to Let Them Cross . . . . . . . . . . . . . . . . . . . . 11
Table 7. Raised Crosswalks and Control Sites . . . . . . . . . . . . . . . . . . . . . . . . . . . . . . . . . . . . . . 12
Table 8. Comparison of Vehicle Speeds at the Treatment and Control Sites . . . . . . . . . . . . . . . . 14
Table 9. Pedestrians for Whom Motorists Stopped to Let Them Cross . . . . . . . . . . . . . . . . . . . . 15
Table 10. Percentage of Pedestrians for Whom Motorists Yielded, Before and After Treatment . . . . . . . . . . . . . . . . . . . . . . . . . . . . . . . . . . . . . . . . . . . . . . . . . . . . . 18
Table 11. Percentage of Pedestrians Who Crossed in the Crosswalk, Before and After Treatment . . . . . . . . . . . . . . . . . . . . . . . . . . . . . . . . . . . . . . . . . . . . . . . . . . . . . 19
Table 12. Average Pedestrian Wait Time, Before and After Treatments . . . . . . . . . . . . . . . . . . . . 20
Table 13. Summary of Traffic Calming Devices by Site and MOE . . . . . . . . . . . . . . . . . . . . . . . . 21

INTRODUCTION
Continued growth and decentralization throughout the United States have increased thenumber of cars on streets and highways. High traffic volumes and speeds, especially on residentialstreets, reduce the quality of life for residents because of concerns about safety, noise, and pollution. As a result, many neighborhood residents and local officials have expressed interest in undertakingtraffic calming as a means of decreasing the cars’ dominance.
Traffic calming encompasses a series of physical treatments that are meant to lower vehiclespeeds and volumes by creating the visual impression that certain streets are not intended for high-speed or cut-through traffic. Thus, traffic calming can improve safety for pedestrians and reduce noiseand pollution levels. Examples of these measures include bulbouts, speed humps, chicanes, and trafficcircles.
This paper summarizes past research on speed humps, bulbouts, and roadway narrowing. Findings from a new evaluation of bulbouts, raised crosswalks and intersections, refuge islands, andspeed humps in eight communities are also reported. Whereas earlier studies usually focused onvehicle speeds and volumes, this study looked at motorist yielding and pedestrian crossing behavior, inaddition to vehicle speeds. The research reported in this paper is part of a national-level researcheffort to evaluate the operational and safety effects of pedestrian treatments, such as traffic calming,crosswalks, sidewalks, automated pedestrian detection, and illuminated push buttons.
Past Research on the Effects of Speed Humps
Also known as road humps, undulations, or “sleeping policemen,” the purpose of speed humpsis to promote the smooth flow of traffic at slow speeds of about 32 to 40 km/h(20 to 25 mi/h). The speed hump is an elongated hump with a circular-arc cross-section (round-top)or flat-top, rising to a height of 76 mm (3 in) above the normal pavement surface and having a length of3.7 m to 6.7 m (12 ft to 22 ft) in the direction of vehicular travel (Figure 1). Speed humps usuallyextend the full width of the road, excluding the gutter to allow for drainage (1).
Raised crosswalks are flat-top speed humps with crosswalk markings painted on the top(Figure 2). Raised crosswalks elevate pedestrians above the surface of the roadway and can makethem more visible to motorists. Raised crosswalks cause motorists to slow at the most criticallocation, where pedestrians cross. They are generally designed to keep pedestrians at one level sothat there is no need for curb ramps. Drainage is accommodated by pipes along the gutter or otherdesign features.
2
Figure 1. Two vehicles slow down as they passover a speed hump.
Figure 2. Pedestrians using a raised crosswalk.
Speed humps have been evaluated in many cities. The following paragraphs summarize someof those studies.
In Omaha, Nebraska, before and after data at 10 speed hump locations found a significantreduction (at the 5 percent significance level) in the 85th percentile speeds. Data collected from 19locations showed that the number of accidents involving personal injury decreased. However,residents complained about the speeding that still existed, increased noise levels, and vehicle damage. City officials were concerned about emergency vehicle access and response time, potential liability,and the need to monitor signs and pavement markings for the speed humps (2).

3
In Bellevue, Washington, 16 speed humps were installed in 5 residential neighborhoods. The85th percentile speeds declined from 58 to 63 km/h (36 to 39 mi/h) prior to installation to 39 to 43km/h (24 to 27 mi/h) after installation. Traffic volumes fell when alternate routes existed. Mostresidents felt that the humps were effective and favored their continued use (3).
Speed humps in Montgomery County, Maryland, typically reduced 85th percentile speeds by6 to 11 km/h (4 to 7 mi/h). The installation of the humps reduced accident frequency. The humps didnot have a consistent effect on traffic volumes, though (4). The speed-reducing effect was stronger inadjacent Howard County, Maryland. There, the use of speed humps on a number of streets loweredthe 85th percentile speeds by 14 km/h to 37 km/h (9 mi/h to 23 mi/h) (5).
Five speed humps were built along a 0.8-km (0.5-mi) stretch of Grey Rock Road in AgouraHills, California. Instead of the customary 76-mm (3-in) height, these humps were70 mm (2.75 in) high. The 85th percentile traffic speeds fell by 10 to 15 km/h (6 to 9 mi/h) after thehumps were installed. Traffic volumes remained constant and motorists did not divert to otherresidential streets (6).
The speed humps placed in Westlake Village, California, were 67 mm (2.625 in) high. Thehumps reduced the 85th percentile speeds by 15 to 23 km/h (9 to 14 mi/h) to 39 to 47 km/h (24 to 29mi/h). Several demonstration projects in Los Angeles used the 67-mm (2.625-in ) high speed humps,with results similar to those in Agoura Hills and Westlake Village (6).
In three Australian cities, Corio and Croydon in Victoria and Stirling in Western Australia, the85th percentile speeds at speed humps dropped by half or more after installation. Mid-hump speedsfell by about one-fourth to one-third. Daily traffic volumes fell by one-fourth to roughly one-half (7; 8;9).
Previous Studies on the Effects of Bulbouts and Street Narrowing
The purpose of a bulbout (also known as a choker, curb bulb, neckdown, nub, or gateway) isto reduce the width of vehicle travel way at an intersection or a mid-block pedestrian crossing. Bulbouts shorten the street crossing distance for pedestrians, may slow vehicle speeds, and providepedestrians and motorists with an improved view of one another, thereby reducing the risk of a motorvehicle-pedestrian collision (Figure 3).
Anne Arundel County, Maryland, has used a combination of medians and bulbouts nearintersections. The medians narrow the traveled way and provide a sheltered storage area, while thebulbouts force drivers to make a lateral deflection as they enter the narrowed area. Medians withlateral deflection reduced the 85th percentile speeds by 3 km/h to 8 km/h (2 to 5 mi/h) (5).
4
Figure 3. Bulbouts shorten crossing distances forpedestrians, improve sight distances, and mayslow vehicle speeds.
In Ontario, Canada, Macbeth (10) reported speed reductions on five raised and narrowedintersections and seven mid-block bulbouts, in conjunction with lowering the speed limit to30 km/h. The proportion of motorists who exceeded 30 km/h was 86 percent before the deviceswere built, but only 20 percent afterwards.
The Dutch towns of Oosterhout and De Meern have both installed street narrowing variations. The Oosterhout project consisted of installing two bulbouts so as to require motorists to deviate from astraight path. Both the 85th percentile vehicle speed and the degree of pedestrian-motor vehicleconflict fell after the bulbouts were installed. In De Meern, two bulbouts were placed opposite oneanother to narrow the width of the traveled way. A significant reduction in the 85th percentile vehiclespeed was observed (11).
In two Australian cities, Keilor (Queensland) and Eltham (Victoria), bulbouts had little effect onreducing vehicle speeds. However, in Concord, New South Wales, a comparison of a street with bothbulbouts and marked parking lanes versus an untreated street showed that the crash rate on the treatedstreet was only one-third that of the untreated street. It was not stated how many of these crashesinvolved pedestrians, nor how the streets compared prior to treatment (9).
The Australian “wombat” crossing usually consists of a raised crosswalk and bulbouts. It isdesigned to slow motorists, shorten pedestrian exposure to motor vehicles, and increase pedestrianvisibility to motorists. Wombat crossings have generally reduced 85th percentile vehicle speeds byabout 40 percent (9).

5
DATA COLLECTION
Four types of traffic calming devices were evaluated in this study: (1) bulbouts, (2) raisedcrosswalks, (3) raised intersections, and (4) refuge islands. Both before-and-after and treatment-and-control study designs were used. The findings are presented in the following sections, along withinformation about the study locations and study designs.
Before and after data were collected using a video camera, prior to and following theinstallation of each treatment. The video camera was set up on the sidewalk, approximately 61 m(200 ft) upstream from the crossing location. The camera faced in the same direction as traffic on thathalf of the roadway. This position allowed the camera to record, on videotape, pedestrians in thecrosswalk and in the queuing areas on either side of the roadway. The camera also recorded whetherapproaching motorists stopped or slowed down for pedestrians. Videotaping was done mostly onweekdays, during daylight hours, and under dry conditions (when it was neither raining nor snowing). The length of videotaping at each location ranged from 2 to 8 h.
For the treatment-and-control design, each treatment site was matched with a control site thatdid not have a traffic calming device in place but was otherwise similar. Data were collected throughreal-time observations and the use of speed-measuring devices (more details in the following sections). Data were collected on weekdays, during daylight hours, and under dry conditions. The datacollection periods ranged from about 40 min to 4 h.
Each traffic calming device was evaluated according to two or three measures of effectiveness(MOEs):
1. Vehicle speeds2. Pedestrians for whom motorists stopped or yielded3. Crossing in the crosswalk4. Average wait time
With regard to pedestrians for whom motorists stopped or yielded, the pedestrian was theunit of analysis. Only pedestrians who crossed when motorists were approaching are included in theanalysis. For example, if a total of 100 pedestrians crossed when vehicles were approaching, andmotorists yielded to 50 pedestrians, then the percentage of pedestrians for whom motorists yielded isequal to 50 percent. It does not matter whether the 50 pedestrians crossed as one large group (withone motorist yielding), several smaller groups (with several motorists yielding), or one by one (with 50motorists yielding).
Wait time refers to the time that a pedestrian waits, after arriving at the curb, before he or shestarts to cross the roadway. When no vehicles are present, pedestrians can cross immediately afterthey arrive at the curb. When vehicles are present, pedestrians typically either wait for a gap that they

6
perceive to be adequate, or until an approaching motorist stops or slows down, before they startcrossing.
The results for the MOEs are described in more detail below. The reader is advised thatsample sizes vary even at the same location, because of the way that the MOEs were defined. Forsome observations, individual data items were not recorded, and these observations were not includedin the analysis.
BULBOUTS — CAMBRIDGE AND SEATTLE
A before-and-after study approach was used to evaluate four bulbouts in two cities.
1. Berkshire Street at Marney Street, Cambridge, MA2. Berkshire Street at York Street, Cambridge, MA3. Alki Avenue SW at 59th Avenue SW, Seattle, WA4. East Pike Street at 11th Avenue, Seattle, WA
Site Descriptions
Both bulbout locations in Cambridge are in residential neighborhoods. Berkshire Street isone-way northbound. Marney Street is one block north of York Street and meets Berkshire from theeast, at a T-intersection. There is a city park on the west side of Berkshire. Traffic and pedestrianvolumes were low during the times that data collection took place.
In Seattle, Alki Avenue SW is an arterial along the waterfront. There is considerablepedestrian activity on sunny days during the warmer months. The neighborhood is largely residential,with some shops and restaurants. The intersection of East Pike Street at 11th Avenue is just east ofdowntown Seattle and is predominantly retail.
Pedestrians for Whom Motorists Yielded
By constricting the roadway, bulbouts are intended to slow vehicles down and increase thelikelihood that motorists will see pedestrians sooner than they would otherwise. Therefore, it washypothesized that bulbouts would increase the number of pedestrians for whom motorists yielded. Inother words, more pedestrians would have the benefit of motorists yielding to them (Figure 4).
The chi-square statistic was used to compare the percentages of pedestrians for whommotorists yielded in the before and after periods (Table 1). The bulbouts in Seattle did not have astatistically significant effect on the percentage of pedestrians for whom motorists yielded, not even atthe 0.10 level. The bulbouts in Cambridge had small sample sizes.
7
Figure 4. A motorist yielding to pedestrians, Alkiat 59th, Seattle.
Table 1. Percentage of Pedestrians for Whom Motorists Yielded, Before and After Treatment.
LOCATION TREATMENT BEFORE AFTERSIGNIFICANC
E
Cambridge, MA Bulbouts2 locations
20.0% (5)* 66.7% (6) S
Seattle, WA Bulbouts2 locations
57.9% (342) 52.2% (471) N
ABBREVIATIONS* Sample sizes in parentheses.N Not significant.S Small sample size.
Where Do Pedestrians Cross?
All of the traffic calming locations that were evaluated already had marked crosswalks in the“before” period. It was thought that bulbouts would motivate pedestrians to cross in the crosswalk(who otherwise might not have done so), so that they can benefit from the shorter crossing distances.
The chi-square statistic was used to compare the percentages of pedestrians who crossed inthe crosswalk in the before and after periods. As Table 2 shows, the effects of the Cambridgebulbouts were in the desired direction but were not statistically significant, not even at the 0.10 level. The results for the bulbouts in Seattle were statistically significant, but in the undesired direction—more

8
pedestrians crossed in the crosswalk before the bulbouts were installed than after they were installed.Table 2. Percentage of Pedestrians Who Crossed in the Crosswalk,
Before and After Treatment.
LOCATION TREATMENT BEFORE AFTER SIGNIFICANCE
Cambridge, MA Bulbouts2 locations
66.7% (60)* 67.2% (64) N
Seattle, WA Bulbouts2 locations
93.7% (824) 74.1% (939) X
ABBREVIATIONS* Sample sizes in parentheses.X Significant, but in the wrong direction.N Not significant.
Average Pedestrian Wait Time
Bulbouts may slow vehicle speeds, thus increasing the number of adequate gaps and alsoincreasing the likelihood that an approaching motorist will yield to a pedestrian. Therefore, it wasexpected that bulbouts would shorten the time that pedestrians must wait to cross the street. In thisstudy, wait times were recorded for all pedestrians who crossed the street, regardless of whethermotor vehicles were approaching.
The t test for difference in means was used to compare average pedestrian wait times in thebefore and after periods (Table 3). The effect of the bulbouts in Seattle was statistically significant butin the undesired direction, i.e., the wait times at the bulbouts were longer in the after period than in thebefore period. The average wait time at the bulbouts in Cambridge was 0.16 s (N = 85) in the beforeperiod and 0.11 s (N = 99) in the after period. According to the t test for difference in means, thischange was not statistically significant. Because traffic volumes were very light, the majority ofpedestrians crossed without having to wait for a gap in traffic, so the average wait times were veryshort.
Table 3. Average Pedestrian Wait Time, Before and After Treatment.
LOCATION TREATMENT BEFORE AFTER SIGNIFICANCE
Cambridge, MA Bulbouts2 locations
0.16 sN = 85
0.11 sN = 99
N
Seattle, WA Bulbouts2 locations
1.19 sN = 1086
1.76 sN = 1233
X
ABBREVIATIONSX Significant, but in the undesired direction.N Not significant.

9
BULBOUTS — GREENSBORO AND RICHMOND
A treatment-and-control study approach was used to evaluate four additional bulbouts (Table4).
Table 4. Bulbouts and Control Sites.
TREATMENT SITE CONTROL SITE
Elm Street, between Friendly Avenue andSummit Avenue, Greensboro, NC
Elm Street, between Market Street andFriendly Avenue, Greensboro, NC
Elm Street, between Washington Street andFebruary One Place, Greensboro, NC
Elm Street at Martin Luther King Jr. Drive,south leg, Greensboro, NC
Ellwood Avenue at Auburn Avenue, Richmond,VA
West Main Street at Rowland Street,Richmond, VA
Ellwood Avenue at Dooley Avenue, Richmond,VA
Cary Street at Stafford Street, Richmond, VA
Site Descriptions
Elm Street in Greensboro is the main north-south downtown arterial. Both bulbouts and thecontrol site between Market Street and Friendly Avenue are downtown. The control site at MartinLuther King Jr. Drive is on the southern edge of downtown. Elm Street is generally two-way, withone lane in each direction. There is usually parking on both sides. The crosswalks are made oftextured pavement. Elm Street is lined with shops, offices, and several vacant buildings (Figure 5).
In Richmond, both bulbouts and their control sites were on two-lane, one-way streets inresidential neighborhoods.
Vehicle Speeds
It was hypothesized that bulbouts would reduce vehicle speeds.
In Greensboro, automated traffic counters were used to measure the speeds of all vehicles, inboth directions, at the crossing and about 30 m (100 ft) upstream from the crossing. Speeds weremeasured for about 8,900 vehicles at the bulbouts and 5,300 vehicles at the control sites.

10
Figure 5. Bulbout and textured crosswalk,Greensboro, North Carolina.
A laser speed measurement gun was used in Richmond to measure the speeds of vehicles, in onedirection, at the crossing and about 92 to 183 m (300 ft to 400 ft) upstream from the crossing, whenthe staged pedestrian was present at the crossing. Speeds were measured for a total of 132 vehiclesat the bulbouts and 132 vehicles at the control sites.
The 50th percentile speeds were calculated at all study sites (Table 5). The 50th percentilespeeds in Greensboro were 1.8 km/h (1.1 mi/h) lower than at their corresponding control sites. Thisis consistent with the hypothesis. However, the difference may or may not be of practicalsignificance.
Table 5. Comparison of Vehicle Speeds at the Treatment and Control Sites.
CITY ANDTREATMENT
50THPERCENTILE
SPEEDTREATMENT SITE
50TH PERCENTILESPEED
CONTROL SITE
DIFFERENCE INSPEEDS
Greensboro, NC2 Bulbouts
26.4 km/h(16.4 mi/h)
28.2 km/h(17.5 mi/h)
1.8 km/h (1.1 mi/h)lower at treatment siteSIGNIFICANT1
Richmond, VA 2
2 Bulbouts53.1 km/h(33.0 mi/h)
49.9 km/h(31.0 mi/h)
3.2 km/h (2.0 mi/h)higher at treatment siteSIGNIFICANT—Undesired direction
1 Significant at the 0.05 level or better, using a two-tailed test.2 Vehicle speeds in Montgomery County and Richmond were measured only when the staged
pedestrian was present.
11
In Richmond, the 50th percentile speeds were 3.2 km/h (2.0 mi/h) higher at the treatment site thanat the corresponding control site (Table 5). This is contrary to what was hypothesized. It is not clearwhy the bulbout sites had higher speeds than the control sites.
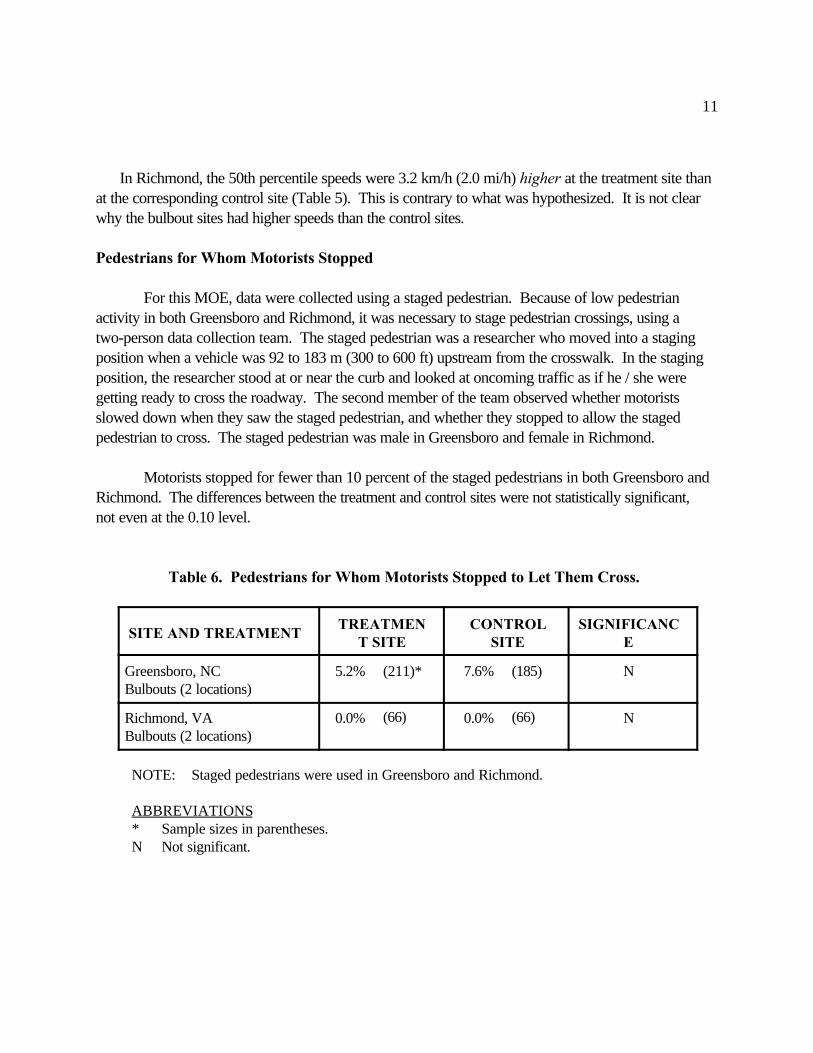
Pedestrians for Whom Motorists Stopped
For this MOE, data were collected using a staged pedestrian. Because of low pedestrianactivity in both Greensboro and Richmond, it was necessary to stage pedestrian crossings, using atwo-person data collection team. The staged pedestrian was a researcher who moved into a stagingposition when a vehicle was 92 to 183 m (300 to 600 ft) upstream from the crosswalk. In the stagingposition, the researcher stood at or near the curb and looked at oncoming traffic as if he / she weregetting ready to cross the roadway. The second member of the team observed whether motoristsslowed down when they saw the staged pedestrian, and whether they stopped to allow the stagedpedestrian to cross. The staged pedestrian was male in Greensboro and female in Richmond.
Motorists stopped for fewer than 10 percent of the staged pedestrians in both Greensboro andRichmond. The differences between the treatment and control sites were not statistically significant,not even at the 0.10 level.
Table 6. Pedestrians for Whom Motorists Stopped to Let Them Cross.
SITE AND TREATMENTTREATMEN
T SITECONTROL
SITESIGNIFICANC
E
Greensboro, NCBulbouts (2 locations)
5.2% (211)* 7.6% (185) N
Richmond, VABulbouts (2 locations)
0.0% (66) 0.0% (66) N
NOTE: Staged pedestrians were used in Greensboro and Richmond.
ABBREVIATIONS* Sample sizes in parentheses.N Not significant.

12
Overhead flasher
Figure 6. Raised crosswalk and overhead flasher,Towerview Drive, Durham, North Carolina.
RAISED CROSSWALKS
Three raised crosswalks, each matched with a control site, were evaluated.
Table 7. Raised Crosswalks and Control Sites.
TREATMENT SITE CONTROL SITE
Research Drive, Durham, NC Research Drive, Durham, NC
Towerview Drive, Durham, NC (This locationalso has a continuous overhead flasher.)
Towerview Drive, Durham, NC
Bel Pre Road at Merton Road, MontgomeryCounty, MD
Bel Pre Road at Merton Road, MontgomeryCounty, MD
Research Drive and Towerview Drive are both on the campus of Duke University in Durham,NC. Both are two-way streets, with one lane of traffic in each direction. Towerview has a parking
lane in the eastbound direction. Traffic speeds were higher on Research Drive than on Towerview. This may be partly attributable to straighter alignment and longer sight distance on Research Drive. The location on Towerview Drive has both a raised crosswalk and a continuously operating overheadflasher (Figure 6). The corresponding control site has neither a raised crosswalk nor an overheadflasher, but it has a painted ladder crosswalk.

13
Figure 7. Raised crosswalk, Bel Pre Road atMerton Road, Montgomery County,Maryland.
Bel Pre Road at Merton Road is in a residential area just outside of Rockville, MD. Bel Pre is anorthwest-southeast collector, with one lane of traffic in each direction and parking lanes on bothsides. Merton Road is a local street that approaches from the southwest and forms a T-intersectionwith Bel Pre Road. The raised crosswalk is on the northwest leg of the intersection, and the controlsite is on the southeast leg of the same intersection (Figure 7).
Vehicle Speeds
Raised crosswalks are intended to slow vehicles down by forcing drivers to go up, across thecrosswalk, and then back down again. The effect on vehicles is similar to that of a speed hump. Itwas hypothesized that raised crosswalks would lower vehicle speeds.
At the two raised crosswalks in Durham, automated traffic counters were used to measure thespeeds of all vehicles, in both directions, at the crossing and about 30 m (100 ft) upstream from thecrossing. The sample sizes at each site ranged from about 1,800 to 2,600.
A laser speed measurement gun was used in Montgomery County to measure the speeds ofvehicles, in one direction, at the crossing. The sample sizes were 42 vehicles at the raised crosswalkand 38 vehicles at the control site.
The 50th percentile speeds were calculated at all study sites. For both study sites in Durham,the 50th percentile speed was lower at the treatment site than at the control site, by 6.5 to 19.3 km/h(4.0 to 12.4 mi/h) as shown in Table 8. These results are consistent with the hypothesis. InMontgomery County, the 50th percentile speeds were 4.0 km/h (2.5 mi/h) lower at the treatment sitethan at the corresponding control site, but the increase was not statistically significant at the 0.10 level

14
(Table 8).
Table 8. Comparison of Vehicle Speeds at the Treatment and Control Sites.
CITY ANDTREATMENT
50THPERCENTILE
SPEEDTREATMENT
SITE
50THPERCENTILE
SPEEDCONTROL SITE
DIFFERENCE INSPEEDS
Durham, NC – ResearchDriveRaised crosswalk
33.3 km/h(20.7 mi/h)
39.8 km/h(24.7 mi/h)
6.5 km/h (4.0 mi/h)lower at treatment siteSIGNIFICANT1
Durham, NC – TowerviewDriveRaised crosswalk & overhead flasher
18.5 km/h(11.5 mi/h)
38.4 km/h(23.9 mi/h)
19.3 km/h (12.4 mi/h)lower at treatment siteSIGNIFICANT
Montgomery County, MD2
Raised Crosswalk34.6 km/h(21.5 mi/h)
38.6 km/h(24.0 mi/h)
4.0 km/h (2.5 mi/h)lower at treatment siteNOT SIGNIFICANT
1 Significant at the 0.05 level or better, using a two-tailed test.2 Vehicle speeds in Montgomery County were measured only when the staged pedestrian was present
Pedestrians for Whom Motorists Stopped
Raised crosswalks elevate pedestrians so that they are easier for motorists to see. Thus, it wasthought that motorists would stop for a higher percentage of pedestrians in raised crosswalks than instandard crosswalks.
In Durham, data were collected as pedestrians crossed in or within 9 m (30 ft) of the crosswalkwhile a motorist was approaching. The researcher observed pedestrians who crossed and recordedwhether motorists yielded.
Because of low pedestrian activity in Montgomery County, it was necessary to stage pedestriancrossings, using a two-person data collection team. A female researcher moved into a staging positionwhen a vehicle was 92 to 183 m (300 to 600 ft) upstream from the crosswalk. In the staging position,the researcher stood at or near the curb and looked at oncoming traffic as if she were getting ready tocross the roadway. The second member of the team observed whether motorists slowed down whenthey saw the staged pedestrian, and whether they stopped to allow the staged pedestrian to cross.
Motorists stopped for a much higher percentage of pedestrians at the raised crosswalk with an

15
overhead flasher in Durham than at the corresponding control site (Table 9). Results for the raisedcrosswalk on Research Drive in Durham are not listed in Table 9 because almost no pedestrians at thecorresponding control site crossed while vehicles were approaching. The difference between thetreatment and control sites in Montgomery County were not statistically significant, not even at the0.10 level.
Table 9. Pedestrians for Whom Motorists Stopped to Let Them Cross.
SITE AND TREATMENTTREATMENT
SITECONTROL
SITESIGNIFICANC
E
Durham, NC — TowerviewDrRaised crosswalk and overhead flasher
79.2% (159)* 31.4% (35) T (0.000)
Montgomery County, MDRaised crosswalk
1.2% (169) 1.0% (198) N
NOTE: Staged pedestrians were used in Montgomery County.
ABBREVIATIONS* Sample sizes in parentheses.T Significant at the 0.10 level or better (p-values in parentheses).N Not significant.
RAISED INTERSECTIONS
Before and after data were collected at one raised intersection in Cambridge, Massachusetts(Berkshire Street and Marcella Street) (Figure 8). This intersection is one block north of MarneyStreet, where a bulbout was installed (see above). It is in a residential area.

16
Figure 8. Raised intersection, Berkshire Streetand Marcella Street, Cambridge, Massachusetts.
Pedestrians for Whom Motorists Yielded
By constricting the roadway or creating vertical displacement, raised intersections are intendedto slow vehicles down and increase the likelihood that motorists will see pedestrians sooner than theywould otherwise. It was thought that raised intersections would increase the number of pedestrians forwhom motorists yielded. However, because both traffic and pedestrian volumes were low, it was notpossible to determine what effect, if any, the raised intersection had on this MOE.
Pedestrians Who Crossed in the Crosswalk
All of the traffic calming locations that were evaluated already had marked crosswalks in thebefore period. It was thought that the raised intersection would motivate pedestrians to cross in thecrosswalk (who otherwise might not have done so), so that they can benefit from having a delineatedcrossing zone.
The chi-square statistic was used to compare the percentages of pedestrians who crossed in thecrosswalk in the before and after periods. In the before period, 11.5 percent of pedestrians (N =104) crossed in the crosswalk. This percentage increased to 38.3 percent (N = 47) in the after
period. Thus, the raised intersection in Cambridge had statistically significant effects (p-value =0.001). In other words, more pedestrians crossed in the crosswalk in the after period than in thebefore period.

17
Figure 9. Refuge island, Circle Boulevard,Corvallis, Oregon.
Average Pedestrian Wait Time
The average wait time was 0.04 s (N = 104) in the before period and 0.00 s (N = 47) in theafter period. According to the t test for difference in means, this change was not statistically significant. Because traffic volumes were very light, the majority of pedestrians crossed without having to wait fora gap in traffic, so the average wait times were very short.
REFUGE ISLANDS
Five refuge islands in two cities were evaluated using a before and after study approach.
1. Circle Boulevard, Corvallis, OR2. E Street at 23rd Street, east leg, Sacramento, CA3. E Street at 23rd Street, west leg, Sacramento, CA4. F Street at 23rd Street, east leg, Sacramento, CA5. F Street at 23rd Street, west leg, Sacramento, CA
Circle Boulevard is an urban arterial in Corvallis, Oregon (Figure 9). It has two lanes in eachdirection and a center left-turn lane, for a total of five lanes. A mid-block marked cross- walk and arefuge island were installed. The refuge island has a cut-through for the crosswalk. The crosswalkconnects an apartment complex to the north with a shopping center to the south.
The refuge islands in Sacramento were installed along with zebra crosswalks. The twointersections are in the Midtown neighborhood, in a predominantly residential area. Both E and F

18
Streets run east-west, and are two-way, two-lane, with parking on both sides. Traffic and pedestrianactivity appeared to be higher on F Street, owing to the presence of a supermarket on the northwestcorner.
Pedestrians for Whom Motorists Yielded
By constricting the roadway, refuge islands are intended to slow vehicles down and increase thelikelihood that motorists will see pedestrians sooner than they would otherwise. Therefore, it washypothesized that refuge islands would increase the number of pedestrians for whom motorists yielded. In other words, more pedestrians would have the benefit of motorists yielding to them.
The chi-square statistic was used to compare the percentages of pedestrians for whom motoristsyielded in the before and after periods. None of the treatments had a statistically significant effect onthe percentage of pedestrians for whom motorists yielded, not even at the 0.10 level (Table 10). Inthe after period, motorists yielded to about two-thirds of the pedestrians in the best case, and to only 8percent in the worst case. The refuge island in Corvallis had small sample sizes.
Table 10. Percentage of Pedestrians for Whom Motorists Yielded, Before and After Treatment.
LOCATION TREATMENT BEFORE AFTERSIGNIFICANC
E
Corvallis, OR Refuge islandand pavement
markings
5.7% (35)* 7.5% (53) S
Sacramento, CA Refuge islandswith zebracrosswalks4 locations
32.6% (46) 42.1% (38) N
ABBREVIATIONS* Sample sizes in parentheses.N Not significant.S Small sample size.
Where Do Pedestrians Cross?
All of the traffic calming locations that were evaluated already had marked crosswalks in thebefore period. It was thought that refuge islands would motivate pedestrians to cross in the crosswalk,so that they can benefit from having a place of refuge in the middle of traffic (Figure 10).

19
Figure 10. Pedestrian in crosswalk with refugeisland, Sacramento, California.
The chi-square statistic was used to compare the percentages of pedestrians who crossed in thecrosswalk in the before and after periods. As Table 11 shows, the refuge islands in Sacramento hadstatistically significant effects, i.e., more pedestrians crossed in the crosswalk in the after period than inthe before period. The effects of the refuge island in Corvallis were in the desired direction but werenot statistically significant, not even at the 0.10 level.
Table 11. Percentage of Pedestrians Who Crossed in the Crosswalk, Before and After Treatment.
LOCATION TREATMENT BEFORE AFTERSIGNIFICANC
E
Corvallis, OR Refuge islandand pavement
markings
51.9% (79)* 78.0% (113) N
Sacramento, CA Refuge islandswith zebracrosswalks4 locations
61.5% (314) 71.9% (224) T (0.012)
ABBREVIATIONS* Sample sizes in parentheses.T Significant at the 0.10 level or better (p-values in parentheses).N Not significant.

20
Average Pedestrian Wait Time
Because refuge islands allow pedestrians to cross one direction of traffic at a time, pedestriansmay choose a shorter gap than if they had to cross both directions of traffic. Therefore, it wasexpected that refuge islands would shorten the time that pedestrians must wait to cross the street. Inthis study, wait times were recorded for all pedestrians who crossed the street, regardless of whethermotor vehicles were approaching.
The t test for difference in means was used to compare average pedestrian wait times in thebefore and after periods (Table 12). Neither the refuge islands in Corvallis nor those in Sacramentohad a significant effect on pedestrian wait time, not even at the 0.10 level.
Table 12. Average Pedestrian Wait Time, Before and After Treatment.
LOCATION TREATMENT BEFORE AFTER SIGNIFICANCE
Corvallis, OR Refuge island andpavementmarkings
8.59 s(75)*
6.68 s(110)
N
Sacramento, CA Refuge islands andzebra crosswalks
4 locations
1.59 s(289)
1.54 s(214)
N
ABBREVIATIONSN Not significant.* Sample sizes in parentheses.
DISCUSSION
Overall vehicle speeds for the raised crosswalks in Durham were lower compared with theirmatching control sites. This suggests that the raised crosswalks in Durham were effective in reducingvehicle speeds. Vehicle speeds in Montgomery County were measured only in the presence of stagedpedestrians. The speeds at the raised crosswalk and control sites in Montgomery County were aboutthe same, an indication that the raised crosswalk had no effect on vehicle speeds.
Evaluations were conducted to determine if motorists would be more likely to stop for unstagedpedestrian crossings than crossings staged from the data collection team. Table 3 suggests thatmotorists are more likely to yield to unstaged pedestrians than to staged pedestrians — as many as 70

21
percent of unstaged pedestrians but less than 5 percent of staged pedestrians. No observations ofboth unstaged pedestrians and staged pedestrians in the same city were made, because pedestriancrossings were staged only when pedestrian activity was low. As a result, the reason why motoristsyielded more often to unstaged pedestrians is possibly a result of city-by-city or site-by-sitedifferences. It may also be that, to some motorists, the staged pedestrian did not appear to want tocross the roadway.
Table 13 summarizes the effect of traffic calming devices by site and MOE. For example, thebulbouts in Seattle did not have an effect on wait times or whether pedestrians used the crosswalk. The effect on the number of pedestrians for whom motorists yielded was not determined because ofsmall sample sizes. Vehicle speeds were not measured at those bulbouts.
Average pedestrian wait times were usually under 2 s (Tables 3 and 12). The short wait timesindicate that most pedestrians started crossing as soon as they reached the curb, or within a fewseconds thereafter. Motor vehicle traffic volumes were usually not very high, so adequate gaps forpedestrians to cross the roadway came frequently, without a long wait. The
Table 13. Summary of Traffic Calming Devices by Site and MOE.
TREATMENTAND CITY
VEHICLESPEED
PEDESTRIANSFOR WHOMMOTORISTS
YIELDED
PEDESTRIANWAIT TIME
USINGCROSSWALK
BULBOUTS (2 locations)Cambridge, MA
N/A * No Change No Change
BULBOUTS (2 locations)Seattle, WA
N/A No Change Worse Worse
BULBOUTS (2 locations)Greensboro, NC
Improve No Change N/A N/A
BULBOUTS (2 locations)Richmond, VA
Worse No Change N/A N/A
RAISED CROSSWALKDurham, NC
Improve * N/A N/A
RAISED CROSSWALK &OVERHEAD FLASHERDurham, NC
Improve Improve N/A N/A
RAISED CROSSWALKMontgomery County, MD
No Change No Change N/A N/A

22
RAISED INTERSECTIONCambridge, MA
N/A N/A No Change Improve
REFUGE ISLANDS &ZEBRA CROSSWALKS (4 locations)Sacramento, CA
N/A No Change No Change Improve
REFUGE ISLAND &PAVEMENT MARKINGSCorvallis, OR
N/A * No Change No Change
ABBREVIATIONSN/A Data were not collected for this MOE. Improve Significant improvement at 0.10 level. Worse Conditions significantly worse at 0.10 level. * Small sample size.
wait times did not change much between the before and after periods. However, the wait times in thebefore period were close to zero and could not get much shorter, nor did they get much longer. Infact, the change in wait times at four of the sites turned out to be not statistically significant. It is likelythat wait times will fluctuate from one day to the next in response to vehicle and pedestrian volumes,and vehicle speeds. The significant effect in the wrong direction at the other two sites may be partlythe result of these fluctuations in pedestrian and motor vehicle volumes.
CONCLUSIONS
These findings suggest that bulbouts and raised crosswalks can reduce motor vehicle speeds. The combination of a raised crosswalk with an overhead flasher was most effective in encouragingmotorists to yield to pedestrians. It is not known what effect was from the flasher and what portioncan be attributed to the raised crosswalk. Raised intersections and refuge islands are likely to directmore pedestrians to cross within the crosswalk.
At most sites, however, these traffic calming devices did not have significant effects onpedestrians. In fact, the bulbouts in Seattle were associated with increased wait times and a lowerpercentage of those who crossed in the crosswalk, both undesirable effects from a pedestrianstandpoint. These results may be due to a fluctuation in traffic conditions at the site.
The reader is cautioned that traffic calming devices are not a panacea guaranteed to improveconditions for pedestrians. These devices by themselves cannot ensure that motorists will slow down
23
and yield to pedestrians, nor that pedestrians will cross in the crosswalk. Moreover, traffic calmingdevices have their disadvantages. For example, these treatments can hinder activities such as streetcleaning and snow plowing, may impede emergency vehicle access, and may affect drainage. Thenoise of vehicles going over speed humps, raised crosswalks, and raised intersections may disturbnearby residents.
The ultimate evaluation of traffic calming devices would consist of a safety-based analysis using 3or more years of collision records, adding more study sites, and including other devices (such as trafficcircles) that were not examined in this study. Such an evaluation was beyond the scope of this study,but should eventually be conducted.
ACKNOWLEDGMENTS
This study was conducted as part of a research project funded by the Federal HighwayAdministration, under contract number DTFH61-92-C-00138. Carol Tan Esse (Federal HighwayAdministration) served as the Contracting Officer’s Technical Representative and Charles Zegeer(University of North Carolina Highway Safety Research Center) was the Principal Investigator. Theauthors gratefully acknowledge the many individuals, too numerous to list here, who assisted with datacollection. Eric Rodgman and J. Richard Stewart (both from University of North Carolina HighwaySafety Research Center) provided computer and statistical expertise, respectively.
REFERENCES
1. ITE Technical Council Speed Humps Task Force. Guidelines for the Design and Applicationof Speed Humps, Institute of Transportation Engineers, Washington, DC, March 1993.
2. Marcel Klik and Ardeshir Faghri. “A Comparative Evaluation of Speed Humps andDeviations,” Transportation Quarterly, Vol. 47, No. 3, July 1993, pp. 457-469.
3. Andrew Clarke and M.J. Dornfeld. Traffic Calming, Auto-Restricted Zones and OtherTraffic Management Techniques - Their Effects on Bicycling and Pedestrians, Case StudyNo. 19, National Bicycling and Walking Study, Publication No. FHWA-PD-93-028, FederalHighway Administration, Washington, DC, January 1994.
4. David A. Loughery and Marcy Katzman. Montgomery County, Maryland Speed HumpProgram Evaluation Report. Prepared for presentation to the Montgomery County Council,January 1998.

24
5. C. Edward Walter. “Suburban Residential Traffic Calming, ITE Journal, Vol. 65, No. 9,September 1995, pp. 44-48.
6. Edward Cline. “Design of Speed Humps...Or ‘The Kinder, Gentler Speed Hump.’” Presentedat the 45th California Symposium on Transportation Issues, May 12-14, 1993.
7. P.E. McDonald and J.R. Jarvis. The Use of Road Humps on Residential Streets in the Shireof Corio, ARRB Internal Report, AIR 335-2, Australian Road Research Board, 1981.
8. E. Richardson and J.R. Jarvis. The Use of Road Humps on Residential Streets in the City ofStirling, Western Australia. ARRB Internal Report, AIR 335-3, Australian Road ResearchBoard, 1981.
9. Ludmilla Hawley, Colin Henson, Andrew Hulse, and Ray Brindle. Towards Traffic Calming: A Practitioners’ Manual of Implemented Local Area Traffic Management and BlackspotDevices, Publication No. CR 126, Federal Office of Road Safety, Canberra, Australian CapitalTerritory, Australia, August 1992.
10. A. Macbeth. “Balliol Street” Traffic Calming 1995, proceedings from 21 papers, OntarioTraffic Conference, November 1995.
11. Michael Replogle. Bicycle and Pedestrian Policies and Programs in Asia, Australia, andNew Zealand. Case Study 17, National Bicycling and Walking Study. Report No. FHWA-PD-93-016. Federal Highway Administration, Washington, DC, April 1992.