The Effects of Technology Integration Techniques in .../67531/metadc4307/m2/1/high... · project...
99
THE EFFECTS OF TECHNOLOGY INTEGRATION TECHNIQUES IN ELEMENTARY MATHEMATICS METHODS COURSES ON ELEMENTARY PRESERVICE TEACHERS’ COMPUTER SELF-EFFICACY, SOFTWARE INTEGRATION CONFIDENCE, AND LESSON PLANNING Robert M. Maninger, B.S.E., M.E. Dissertation Prepared for the Degree of DOCTOR OF EDUCATION UNIVERSITY OF NORTH TEXAS August 2003 APPROVED: James Laney, Major Professor and Chair James L. Poirot, Minor Professor Frances van Tassell, Committee Member John Stansell, Chair of the Department of Teacher Education and Administration M. Jean Keller, Dean of the College of Education C. Neal Tate, Dean of the Robert B. Toulouse School of Graduate Studies
Transcript of The Effects of Technology Integration Techniques in .../67531/metadc4307/m2/1/high... · project...

EL
S
THE EFFECTS OF TECHNOLOGY INTEGRATION TECHNIQUES IN
EMENTARY MATHEMATICS METHODS COURSES ON ELEMENTARY
PRESERVICE TEACHERS’ COMPUTER SELF-EFFICACY,
OFTWARE INTEGRATION CONFIDENCE, AND LESSON PLANNING
Robert M. Maninger, B.S.E., M.E.
Dissertation Prepared for the Degree of
DOCTOR OF EDUCATION
UNIVERSITY OF NORTH TEXAS
August 2003
APPROVED: James Laney, Major Professor and Chair James L. Poirot, Minor Professor Frances van Tassell, Committee Member John Stansell, Chair of the Department of
Teacher Education and Administration M. Jean Keller, Dean of the College of
Education C. Neal Tate, Dean of the Robert B. Toulouse
School of Graduate Studies

Maninger, Robert M., The Effects of Technology Integration Techniques in
Elementary Mathematics Methods Courses on Elementary Preservice Teachers’
Computer Self-Efficacy, Software Integration Confidence, and Lesson Planning. Doctor
of Education (Curriculum and Instruction), August 2003, 93 pp., 8 tables, references, 26
titles.
The purpose of this study was to demonstrate the effect of computer technology
integration techniques on preservice teachers’ feelings of computer self-efficacy and
feelings of confidence in software integration. It was also the purpose of this study to
interpret these preservice teachers’ confidence in using computer technology integration
techniques in their own planning and instruction during student teaching. The
participants in this study were from two intact, non-randomly-formed classrooms. They
were 27 preservice teachers enrolled in the College of Education at a university in north
central Texas in two sections of a course entitled EDEE 4350, Mathematics in the
Elementary School.
This study was quasi-experimental, with a nonequivalent pretest-posttest control
group design. The independent variable was the type of instruction experienced in an
elementary mathematics methods course: novel instruction with specialized computer
technology integration techniques versus traditional instruction with no specialized
technology integration techniques. The dependant variables were measured using the
following instruments: the Demographic Data and Previous Context Use of the
Computer Survey which described participants’ demographics and their previous usage
of the computer; the Self-Efficacy With Computer Technologies Scale; the Preservice

Teacher Software Integration Confidence Scale; and the Lesson Plan
Infusion/Integration Scale.
The results of the data analysis revealed, through the inferential statistics run on
the Self-Efficacy with Computer Technology Scale pretest and posttest, that there was
no statistically significant difference between treatment groups (p < .05). The posttest-
only Preservice Teachers Software Integration Confidence Scale revealed a statistically
significant difference between treatment groups (p < .05). The posttest-only Lesson
Plan Technology Infusion/Integration Scale revealed no statistical significance between
treatment groups (p < .05). The study provides insight into the benefits of instruction in
specific software integration techniques instruction. It suggests that when preservice
teachers are given instruction in specific computer software integration techniques, they
are more confident in the use of those techniques.

ii
Copyright 2003
by
Robert M. Maninger

iii
Acknowledgements
I would like to thank the members of my committee, Dr. James Laney, Dr.
Frances van Tassell, and Dr. Jim Poirot for their tireless effort in supporting my
dissertation process. I would also like to acknowledge Linda Hodges, Barbara
Ashmore, and Martha Peet of the Technology Leadership Institute for their participation
in the study involving the demonstration of computer integration techniques and the
preparation and review of the scales used in this study. The services of Dr. James
Morrow and Leslie Odom for their generosity of time and concern with the data for this
project were greatly appreciated. Last, but not least, the proofreading talents of my wife
Melinda, without which I would not have survived, are much appreciated.

iv
TABLE OF CONTENTS
Chapter 1
Introduction p. 1
Chapter 2
Related Literature p. 12
Chapter 3
Design of the Study p. 26
Chapter 4
Presentation of Data p. 42
Chapter 5
Conclusions p. 50
Appendices p. 62 References p. 90

1
CHAPTER 1
Introduction
Computers have been in place in the K-12 classroom for more than twenty years.
Unfortunately, placing computers in classrooms does not mean that graduates from our
school systems are equipped to use the computer as a tool. Morrison, Lowther, and
DeMuelle (1999) warned that computers were not being used in school classrooms as
they would be used in the workplace. In the early stages of computer placement in the
classroom, teachers used them primarily as tutorial machines for students. Self-
contained games, drill and practice software, word processing, and tutorial software
certainly have a place, but if this is the primary use for the computer, then much is being
missed in using it as a tool. Morrison et al. (1999) recommended teacher-designed
lessons that use spreadsheets and databases to analyze data and develop
relationships between concepts. These strategies are based on problem-based
learning and are more closely related to workplace application.
According to the National Council of Teachers of Mathematics, technology has
become an essential part of teaching, learning, and doing mathematics (Beaudrie,
2001). One study revealed that professors’ proficiency with technology was limited to
the use of the Internet, E-mail for communication, and word processing (Vannatta,
2000). This method of technology integration instruction leaves databases and
spreadsheets largely unused. Not using these applications limits the assignments that
would require problem-solving skills and higher order thinking skills.

2
Statement of the Problem
Colleges of Education must be very progressive in measuring themselves
against the National Council for Accreditation of Teacher Education (NCATE) standards
in order to maintain accreditation. The standards provide competency areas in
technology and endorsement for educational computing (Brown, 2001). It has been
asserted that teacher education institutions must close the teaching and learning gap
between where they are and where they need to be (Gunter, 2001). For accreditation
purposes, colleges of education must provide folios of evidence that coursework and
field experiences are preparing teachers to effectively use computers in their classroom
instruction (Lan, 1997). Unfortunately, faculty knowledge of the NCATE standards does
not translate into an equal knowledge of the International Society for Technology in
Education (ISTE) standards. Universities are doing a major disservice to their students
if they fail to provide appropriate opportunities to develop information technology skills
as part of their undergraduate program (Schrum and Dehoney, 1998).
The set of standards released by ISTE in 2000 specified technology standards
for preservice teachers. The fifteen competencies that follow not only serve as
guidelines for current preservice teachers but also as benchmarks for all teacher
education programs:
1. Troubleshoot a computer system in order to solve routine hardware and
software problems.
2. Evaluate and use computers and related technologies to support a
coherent lesson.

3
3. Facilitate learning experiences using technology that affirm diversity and
provide equity.
4. Implement a well-organized plan to manage available technology
resources.
5. Facilitate learning experiences that use assistive technologies to meet the
special needs of students.
6. Design and teach a coherent sequence of learning activities with
appropriate use of technology by connecting district, state, and national
standards.
7. Design, implement, and assess learner-centered lessons with technology
that engage, motivate, and encourage self-directed student learning.
8. Guide collaborative learning activities in which students use technology
resources to solve authentic problems in the subject area(s).
9. Develop and use criteria for ongoing assessment of technology-based
student products.
10. Design an evaluation plan that will determine students’ technology
proficiency.
11. Analyze instructional practices that employ technology to improve
planning, instruction, and management.
12. Apply technology productivity tools to collect, analyze, and interpret data
and to report to parents.
13. Select and apply suitable productivity tools to complete tasks.

4
14. Model safe and responsible uses of technology and develop classroom
procedures to implement school and district policy.
15. Participate in on-line professional collaboration with peers and experts as
part of a personally designed plan, based on self-assessment, for
professional growth in technology. (ISTE, 1991, p. 2)
Students in today’s world are faced with an ever-increasing demand for the use
of technology. Students need to develop a clear understanding of the role that
technology can play in mathematics and the role that the computer can play in problem-
solving (Cavey and Barnes, 2001). In order for this to become a reality, instructors in
colleges of education must prepare preservice teachers to integrate technology into
mathematics. Mathematics methods courses should prepare preservice teachers to
implement technology integration practices in their teaching strategies.
Purpose of the Study
The purpose of this study was to assess the effect of technology integration
techniques in an elementary mathematics methods course on preservice teachers’
computer self-efficacy, software integration confidence, and lesson planning. More
specifically, the purpose of this study was to demonstrate the effect of technology
integration (through direct intervention, required assignments, and instructor
demonstration) on preservice teachers’ feelings of computer self-efficacy and feeling of
confidence in software integration. It was also the purpose of this study to interpret
these preservice teachers’ confidence in using technology integration techniques in their
own planning and instruction during student teaching.

5
In 2001, as a teaching fellow for a prominent university in Texas, the author
became aware that the beginning structures for technology integration were in place in
the College of Education. Professors in the Computer Education and Cognitive
Systems Department of the College of Education instituted research and development
of technology integration coursework for preservice teachers. The course CECS 4100,
“Computers in the Classroom”, was a requirement of all elementary preservice teachers
in their degree plans. The course was designed to include motivational techniques and
objectives in computer education. It included some programming language and
instructional uses of the computer as well as topics of curriculum integration.
Prerequisites to the CECS 4100 course included software and hardware applications
courses. Equipment in each College of Education classroom had been upgraded and
included a projector, a cabinet with a computer, VCR, and a remote device. This
hardware allowed professors to utilize all the current software available to the university,
including Internet access. Therefore, preservice teachers came to their required
elementary methods courses with some background in the use of technology and some
introduction to the concepts of technology integration. The significance of this study
was to add to the research literature about computer integration requirements in an
elementary mathematics methods course, and to explore the implications that this
practice has in preservice teachers’ practice during their student teaching. The
important question was whether or not added instruction in computer integration
techniques results in preservice teachers’ attaining a high enough level of self-efficacy
that, in turn, leads them to feel confident in utilizing the strategies in their assigned
student teaching classroom.

6
Statement of the Hypotheses
It seems logical to assume that the addition of technology to instruction in a
mathematics methods course can improve preservice teachers’ abilities and attitudes
toward using technology in their mathematics methods course as well as infusing
technology in mathematics instruction during student teaching. Individuals weigh their
capabilities and vulnerabilities, and then they generate self-appraisals of capability.
Self-perception of efficacy is a driving force in, among other things, persistence and
choice of activities (Ropp, 1999). A preservice teacher’s performances based on
authentic experiences are the most important source of information on efficacy.
Authentic opportunities, such as hands-on computer experience, should be an important
component in effective instruction for preservice teachers (Ropp, 1999). Therefore, the
following directional research hypotheses were used for this study:
Hypothesis 1. Preservice elementary teachers who receive mathematics
methods instruction with computer integration techniques will have higher scores on a
Self-Efficacy with Computer Technologies Scale than preservice elementary teachers
who receive traditional mathematics methods instruction without computer integration
techniques.
Hypothesis 2. Preservice elementary teachers who receive mathematics
methods instruction with computer integration techniques will have higher scores on a
Preservice Teacher Software Integration Confidence Scale than preservice elementary
teachers who receive traditional mathematics methods instruction without computer
integration techniques.

7
Hypothesis 3. Preservice elementary teachers who receive mathematics
methods instruction with computer integration techniques will generate lesson plans in
their student teaching internship experience that score higher on a Lesson Plan
Technology Infusion/Integration Scale than preservice elementary teachers who receive
traditional mathematics methods instruction without computer integration techniques.
In calculating the inferential statistics in this study, null hypotheses were
assumed. The three null hypotheses for this study were as follows:
Null Hypothesis 1. There will be no statistically significant difference in scores on
a Self-Efficacy with Computer Technologies Scale between preservice elementary
teachers who receive mathematics methods instruction with computer integration
techniques versus preservice elementary teachers who receive traditional mathematics
methods instruction without computer integration techniques.
Null Hypothesis 2. There will be no statistically significant difference in scores on
a Preservice Teacher Software Integration Confidence Scale between preservice
elementary teachers who receive mathematics methods instruction with computer
integration techniques versus preservice elementary teachers who receive traditional
mathematics methods instruction without computer integration techniques.
Null Hypothesis 3. There will be no statistically significant difference in scores on
a Lesson Plan Technology Infusion/Integration Scale between preservice elementary
teachers who receive mathematics methods instruction with computer integration
techniques versus preservice elementary teachers who receive traditional mathematics
methods instruction without computer integration techniques.

8
Definition of Terms
The following definitions are provided, as these terms are pertinent to this study.
Computer self-efficacy. Computer self-efficacy was defined as not being
concerned with the skill one possesses using the computer, but with the self-judgments
of what one can do with these skills, especially as these skills are reflected in classroom
use of the computer.
Elementary mathematics methods course. The elementary mathematics
methods course was defined as a course in which instruction is given to preservice
teachers in specific techniques describing how to teach mathematics concepts and
skills to children in the elementary and middle school grades (EC-8).
Preservice teacher. Preservice teacher was defined as an intern and/or
candidate studying for a degree and/or certification in education. The term preservice
teacher, for the purposes of this study, refers to an individual who has completed the
requirements for and has been admitted to the College of Education’s teacher education
program. This individual has also completed coursework requirements for the College
of Education (i.e. field of study, academic major, technology, fine arts, and pedagogy
coursework) and has been admitted into the Professional Development School
program. The preservice teacher is in his/her year of internship (which includes
methods courses) and student teaching.
Professional Development School (PDS). The Professional Development School
was defined as a regular elementary or middle school that worked in affiliation with the
university to develop thought provoking preparation for teacher candidates. The
teacher candidates were placed in the schools by the school district sponsoring the

9
PDS and the university delivered methods coursework at a site in the school district.
The teacher candidates spent two semesters in their PDS placement. The first
semester included two days of classroom observation a week in the classrooms with
their mentor teachers as well as two days of university instruction in their methods
coursework. The second semester included their student teaching rotation as well as
one class conducted by the university.
Self-efficacy. Self-efficacy was defined as individuals’ judgments of their
capabilities to execute courses of action required to attain designated types of
performances. Self-efficacy is concerned not with the skills one has, but with the
judgments of what one can do with the skills one possesses. (Bandura, 1986)
Software integration confidence. For the purposes of this study, software
integration confidence was defined as one’s confidence in integrating specific software
applications, such as a spreadsheet or a database, into lessons taught in elementary
mathematics classes.
Technology integration. For the purposes of this study, technology integration
was limited to the application of computers and computer software. Technology
integration was the infusion of the computer and it’s software into the curriculum.
Assumptions
There were several underlying assumptions associated with this study. It was
assumed that the participants in this study understood the importance of their eventual
use of computer integration in their future elementary mathematics instruction. The
participants needed to make this connection in order for the study to have relevance in
their preparation for student teaching. It was assumed that the preservice teachers in

10
the experimental group made the connection with the instructor’s demonstration of
computer integration techniques as a model for their future use as student teachers.
There was also the assumption that a level of self-efficacy in computer technology and
a confidence in software integration would actualize itself in the use of the computer as
a tool in the planning and instruction of the preservice teacher in his/her mathematics
classes when they did their student teaching.
Limitations
Ideally, the participants in the experimental group should have experienced the
intervention by the Technology Leadership Institute in its entirety in a computer lab
classroom. The limitation in this instance was available time. The time spent in the
computer lab classroom was scheduled around other classes at the selected PDS
campus, thus limiting the time for this group. Another limitation in this study was the
length of time allowed for the preservice teacher to demonstrate computer integration
techniques in the student teaching experience. This study was limited to elementary
preservice teachers. It was also limited to preservice teachers at one university. Thus,
results may or may not generalize to other preservice teachers and/or institutions.
Description of Design
This study was quasi-experimental. The design for this study was a
nonequivalent pretest-posttest control group design. The experimental group and the
control group each received a pretest, the Self-Efficacy with Computer Technologies
Scale. The experimental group then received the novel treatment, and the control
group received the traditional instruction. Both groups were then posttested at the end
of the instructional treatment. This posttest included the original Self-Efficacy with

11
Computer Technologies Scale plus two other posttest-only instruments, which were the
Preservice Teacher Software Integration Confidence Scale and the Lesson Plan
Technology Infusion/Integration Scale.

12
CHAPTER 2
Related Literature
The review of literature found a large body of work dealing with technology
integration in colleges of education. The literature revealed plans by colleges to
improve technology integration in their coursework by including more specific courses
for technology integration and by improving faculty demonstration of technology
integration techniques. The following is a sample of the literature relevant to this study.
Technology Integration needs in Colleges of Education
Two examples of colleges of education that have examined themselves in
relation to their perceived need for more technology integration training for their
preservice teachers are the University of Georgia and the University of West Florida.
The College of Education at the University of Georgia developed initiatives to address
the lack of technology integration in their preservice teacher training (Hill and Somers,
1996). The outcome of this study was the recommendation to hire a technology
coordinator, organize events and presentations to improve technology use, and to
develop standards (Vannatta, 2000). The College of Education at the University of
West Florida also initiated a technology planning process (Northrup and Little, 1996).
They designed five benchmarks to facilitate a stronger program. These benchmarks
included areas of equipment, technology needs, preservice teacher education, in-
service, and outreach.
Technology Integration and Preservice Teachers
In a global study reflective of how teachers and preservice teachers develop their
computer skills, Janice Stuhlmann (1998) of Louisiana State University commented that
13
the estimated five to six years that teachers take to master the use of computers and
include them in their daily lessons could be reduced. This time frame could be less if
preservice teachers were well prepared in computer-assisted instruction.
One study looked at preservice teachers’ attitudes and emotions in conjunction
with computer use. Abbott and Farris (2000) reported that preservice teachers found
using computers enjoyable, experienced little frustration, and believed that computers
contributed to their learning as well as the production of products related to teaching.
For many preservice teachers, computing is stressful. Laffey and Musser (1998)
found that student attitudes about the use of computers in the classroom and computer
use in the real world were not the same. They report that students place a higher value
on the future use of technology in the workplace than on the future use of technology in
the schools. It comes as no surprise that they found preservice teachers to be anxious
about their own use of technology as well as the expectations for them to use the
computer as a tool in their future classrooms.
Technology Integration and College/University Professors
Deborah Eldridge (2001) of the City University of New York, Hunter College,
claimed that not only was there an advantage to technology integration for her students,
but there was also a side benefit of self-improvement for the professor. She found that
she was more responsive to her students and more reflective of her teaching practice.
Encouragement from her son gave Eldridge the courage to set up and maintain a
website for her students. She developed a website that included a syllabus, lecture
notes, grades and discussions, test materials, assignments, and Internet resources
(Eldridge, 2001). She then surveyed her classes each semester for three semesters

14
and made improvements to her website according to their comments and suggestions.
The first implementation came in the spring of 1999. This semester was one of
implementation and resulted in the highest degree of change and learning for both the
students and the instructor. The students reported accessing the website to help them
stay organized, keep up-to-date, and support their study. Each semester that Eldridge
surveyed her students, she felt they had been impacted by the integration of the
technology. She also reported a need to improve the site and her integration strategies.
Eldridge reported, in conclusion, that she felt she had a clear vision of what she wanted
to accomplish, but in her enthusiasm she may have underestimated the time and
energy required to accomplish her goals.
Technology Infusion/Integration in Education Methods Courses
According to Marianne Handler (1993) of National-Louis University, although
nearly 90% of all teacher education programs offer some opportunity for computer
training, only 29% of students see themselves as prepared to integrate technology.
Handler conducted her study by surveying one hundred and thirty three education
graduates to collect data on the respondents’ self-perceptions of their preparation to
integrate technology. She divided the respondents into two categories: (1) teachers
completing their first year in the classroom who felt their program prepared them to use
computers in the classroom, and (2) those who did not perceive themselves as being
prepared (Handler, 1993). The research that Handler conducted offered the following
two insights: (1) the most commonly stated use of the computer in the respondents’
methods courses was using the word processor for assignments, and (2) the most
common answer given by respondents was having had at least one experience in

15
software evaluation. Seeing technology used in methods classes is very important,
according to this study. Handler concluded that a single course introducing technology
in education is important, but that “hands-on” and “minds-on” opportunities in methods
courses and in student teaching should be given equal importance.
A study conducted, not in mathematics methods courses but instead in social
studies methods courses, provides some insight into the power of the instructor.
Elizabeth Willis (1997) of New Mexico State University conducted research on the
advent of technology integration in social studies methods coursework for preservice
teachers. Although this study is not directly related to mathematics, it does reflect
positively on technology integration. Willis provided background for her study by
providing a historical context covering the past twenty years. She emphasized the
debate between educators, parents, and the media on how to improve standardized test
scores. She noted the many calls for reform, which have resulted in very little change in
the low test scores. Willis emphasized the teacher as the agent of change and
narrowed the area of needed change to that of technology integration. She also
focused on the need for teacher education programs to provide more training for
preservice teachers in computer use and computer integration. Willis discussed the
modeling and instruction that she utilized in her classroom. She stated that changing
from a static form of learning to a dynamic form of learning cannot come from the
technology, but must come instead from the instructor. One of her basic assumptions
was the tie between colleges of education and the National Council for Accreditation of
Teacher Education (NCATE) standards and the International Society for Technology in
Education (ISTE) foundation competencies for technology integration.

16
Willis offered three models for incorporating technology into teacher education
programs illustrated in her review of related literature. One model for incorporating
technology into preservice teacher programs was integrating it into the college
curriculum. The second model was to require preservice teachers to take a computer
integration course that would include applications such as word processing, database,
and spreadsheet. The third model was to unite three program components to prepare
preservice teachers to integrate technology. These components would include (a) a
three-semester core course in computer applications, (b) professors who model
computer integration in all courses, and (c) field experiences with mentor teachers who
integrate technology into their lessons.
After this brief review of related literature, Willis introduced her alternative model
for integrating technology into a teacher education program. In this, she described her
experience as a teaching fellow and the computer course she taught to preservice
teachers. In this reflection, she offered insight into demonstrative techniques by the
instructor, expectations for student assignments, and the development of lesson plans
that include technology integration. All of the goals and objectives for this course were
carefully linked to NCATE and ISTE standards and competencies.
The next step in Willis’s model was provided when she taught a secondary and
elementary social studies methods course. She was then able to use computer
integration strategies in her methods course. The applications that were used by the
instructor for the social studies methods courses she taught were databases,
hypertext/hypermedia, and simulation. The attempt was made to present preservice
teachers with methods of use in these areas for their own classroom. Presentations

17
were made in a motivational, professional manner. Database techniques were based
on real-world usage, such as address books and phone books. Willis noted two specific
applications. In both applications, she had each student create his/her own database in
conjunction with any field that he/she desired. The preservice teachers then wrote a
letter to a university official in a word processing software-using data from the fields they
had created. A computer simulation was demonstrated by asking the preservice
teachers to participate in a selected simulation. The simulation and its goals for use
within a one-computer classroom were explained. The preservice teachers then formed
groups and participated in the simulation activity. The outcome was an understanding
that the dilemma presented by the simulation was the key to the activity and that the
computer was only a tool of delivery. Willis concluded that technology integration had
been successful in her social studies methods courses and would be beneficial not only
in social studies methods courses, but in all methods courses.
Positive student responses are a side benefit for some instructors who integrate
technology into their classes. Ken Jensen (2001) at the University of Nebraska stated
that technology is an integral part of his mathematics methods course instruction. He
also commented about the favor with which his students received this kind of
instruction.
The study Jensen reported on was a case-study design. It included classroom
observations, instructor interviews, and student-written feedback as sources of
information for analysis. This information was augmented by data accumulated from
student journals and observations augmented by other faculty members. Preservice
teachers in his course were able to use laptop computers (with Internet connectivity),
18
Mathematica®, Geometer’s Sketch Pad®, E-mail, advanced calculators, and other
technology devices.
Jensen reported that his findings were that the instructor had prepared the
coursework and incorporated the technology appropriately. The students responded
very favorably. He reported three specific responses from students in the class, all of
which were very favorable. A female student commented, “I enjoy a … teacher who is
trying innovative things in the classroom” (p. 66). A male student responded, “It is
amazing what technology will allow you to do in the classroom” (p. 66). Another male
student responded, “… I learned lots of neat features that would work beautifully in my
Calc reci as well as the prealgebra we will be teaching” (p. 66).
There were negative aspects of the study. Jensen reported missed class time
while checking out the laptops and the distraction of having a laptop in front of students
during times he lectured.
All things considered, there were more positive points than negative points in the
information related by Jensen (2001). The positive responses were coupled with his
own admission of learning as well. Faculties are often divided about “how and to what
extent” (p. 36) technology should be incorporated into coursework. Jensen reported
that his strategies were one answer to college faculty members asking the question of
how much technology should be used in a course of this nature.
Robert Quinn (1998), professor of mathematics education at the University of
Nevada-Reno, commented that mathematics methods courses can affect preservice
teacher’s attitudes, knowledge, and assumptions about the role of teachers and
technology in the classroom. One of the underlying assumptions of his study was that

19
teachers teach the way they were taught. Information was gathered from 28 preservice
elementary teachers and 19 preservice secondary math teachers. The median age of
the elementary group was 28, and the median age of the secondary group was 29.
Both the elementary and the secondary math methods courses provided numerous
opportunities for participants to use technology.
The study was begun at the start of the semester using an eight-minute response
to the question, “What are your beliefs concerning the use of technological aids in the
teaching of mathematics?” (p. 375). Most participants held favorable views regarding
technology at the beginning of the study. Quinn provided several specific responses
from respondents. He quoted three preservice teachers who felt that technology could
provide an important link to the mathematics curriculum. He offered thoughts from two
students who expressed that technology could be a strong motivator for children. He
then provided thoughts from three respondents who reacted negatively concerning the
use of technology in mathematics. These three participants expressed negative views
concerning the use of calculators in math and the need for basics to be delivered in a
more traditional method.
The follow-up in his study was near the end of the semester in which the
instructor asked each participant to answer four questions in a tape-recorded interview.
The interview data revealed that preservice teachers received little exposure to
technology in their elementary and secondary education. Three-fourths of the
respondents recorded no use of technology, while the remaining respondents admitted
sparing use during their formal education.
20
At the end of Quinn’s study, most respondents indicated that their beliefs
concerning the use of technology had remained unchanged. However, Quinn shared
the thoughts of three preservice teachers who expressed changes in their beliefs about
mathematics students using calculators. The three respondents originally felt that the
students would use calculators as a crutch, but they changed their thoughts to reflect
the positive use of calculators with basic mathematical principles. Four conclusions to
his study were that (1) mathematics methods courses can provide preservice teachers
with important knowledge and experience, (2) preservice teachers can learn
mathematical content through experience involving technology, (3) preservice teachers
are concerned about impending difficulties that might impede their ability to utilize
technology in their classroom, and (4) preservice teachers leave mathematics methods
courses feeling they need to know more about the use of technology.
Technology Integration and Preservice Teachers’ Self-Efficacy
Finally, the basis for understanding the potential impact of technology integration
on preservice teachers’ self-efficacy was investigated by Margaret Ropp (1999). Ropp
spent time in establishing the direction of her study by defining several key aspects of
the research. Attitude toward computers was a key component in her study. If
preservice teachers do not believe that technology has a use in the classroom, they will
not use it no matter the degree of proficiency they may possess. Computer anxiety was
another key element to Ropp’s study. Ropp defined computer anxiety as a mixture of
fear and apprehension felt by the user before interacting with the computer. She
reported on the research literature investigating whether instruction and experience can
reduce anxiety in students. Computer self-efficacy was the third important idea covered
21
by Ropp. She defined self-efficacy and then related that concept to computer
technology, stating that self-efficacy was concerned with the judgments of what one can
do with whatever skill one possesses. She reported that the literature indicates a high
correlation between self-efficacy and performance.
The technology proficiency portion of her study was directly linked to the
Michigan State University College of Education Technology Proficiency checklist. The
goal of this area of the study was to evaluate preservice teachers in four specific
domains of proficiency. Those domains were (1) E-mail, (2) World Wide Web, (3)
integrated applications, and (4) integrating technology into teaching. The items in the
self-assessment were both simple and adaptive pedagogical uses of technology.
The last area of concern for this study was computer coping strategies. Ropp
reported this as a less commonly researched area of technology study. She defined the
use of this concept as strategies that individuals might use when they encounter
difficulties getting the computer to do what they want.
The participants for this study included 53 preservice teachers from two sections
of a teacher preparation course offered in the spring semester. There were 22
elementary preservice teachers and 28 secondary preservice teachers. Three
preservice teachers declined to have their data used for research. The participants
ranged in age from 21 years to 40-plus years; 34% were males and 64% were females.
Ropp (1999) used six instruments in her study. The Attitudes Toward
Technology scale had 42 items that were constructed using positive and negative
sentences. The Computer Anxiety Scale consisted of 20 items in sentence stem
construction. The Computer Attitude Scale was a 23-item scale with positive and

22
negative statement construction. The Computer Self-Efficacy Scale was a scale
consisting of 29 statements that completed a sentence stem. This scale was used by
permission from Murphy, Coover, and Owen (1989). The study also included the
Computer Coping Strategies Scale. This scale was comprised of 17 strategies useful in
problematic situations. The Technology Proficiency Self-Assessment had 20 items that
asked participants to evaluate their pedagogical uses of technology.
Early in the semester, each participant was given a packet of surveys and
instruments to complete as a homework assignment over a weekend. Data from these
surveys were analyzed and the author reported the information gathered from the
preservice teachers. At approximately the mid-term of the course, the preservice
teachers in the study participated in two hands-on technology sessions. The two
sessions totaled three hours in length. The preservice teachers worked in pairs,
utilizing a web page designed specifically for the participants. This web page was
designed with hyperlinks to encourage the participants to explore the Internet and
discover teachers using the Internet in their classrooms to teach subject matter. At the
end of the first session, the participants wrote responses to three open-ended
statements on a fast-write instrument.
The surveys measuring the six sets of individual characteristics were
administered in a pretest-posttest design. These six scales were the (1) Attitudes
Toward Technology Scale, (2) Computer Anxiety Scale, (3) Computer Attitude Scale,
(4) Computer Self-Efficacy Scale, (5) Technology Proficiency Self-Assessment, and (6)
Computer Coping Strategies Scale. Pearson correlation coefficients were computed
between these instruments as well as demographic variables at the pretest stage. At

23
the posttest point of the study, Ropp did the correlational analysis again, and paired t-
tests to assess significance of changes between administrations. Relationships among
the background demographics and the six instruments given at the pretest were
reported using nine different variables. These nine variables were age, gender, ease of
computer access, computer ownership, weekly computer use, completed computer
courses, method of most computer learning, and the number of teachers who used
computers in the participants’ education. Most variables showed only weak correlation.
However, ease of computer access and hours of weekly computer use were
significantly correlated as reported above.
Relationships among the six scales at pretest found significant correlations.
Computer self-efficacy was positively correlated with the Computer Coping Strategies
scale, indicating that students who felt more comfortable with general computer tasks
tended to use more adaptive coping strategies. Computer Self-Efficacy was also highly
correlated with the Technology Proficiency Scale. Computer anxiety was negatively
correlated with the other four measures. These results provide some degree of support
for the construct validity of the scales used in Ropp’s study.
The comparison of scores from pretest to posttest indicates that the participants
had mostly positive attitudes toward computers, relatively low computer anxiety, and
fairly high computer self-efficacy. The results of the paired t-tests indicated significant
growth on three of the six instruments: (1) Technology Proficiency Scale, with t = 5.01, p
< .001, (2) Computer Self-Efficacy, with t = 2.02, p < .05, and (3) Computer Coping
Strategies, with t = 5.25, p < .001. A repeated measures analysis of variance was
conducted to investigate several differential gains from pretest to posttest. Significant

24
main effects were found for the between-subjects Proficiency factor, with F = 45.28, p <
.001 and for the two within-subjects factors of Time, with F = 52.68, p < .001, and Time,
Time 1 vs. Time 2; with F = 12.24, p < .001.
Results reported by Ropp included two main points. At posttest, preservice
teachers who were confident in their ability to perform computer tasks (computer self-
efficacy) were less anxious about computers, had more positive attitudes toward
computers, were more confident in their ability to teach using computers, and knew
more computer coping strategies. More notably, while several items of demographic
background information did not have any statistically significant relationship, the
measures of computer access and amount of time spent weekly on a computer were
statistically significantly correlated (p < .05) with almost all of the other measures used.
She also reported that the most significant gains noted by participants from pretest to
posttest were found for those preservice teachers who were least confident in their
abilities at the beginning of the semester.
This review of related literature leads us to the current study on the effects of
computer technology integration techniques in an elementary mathematics methods
course on preservice teachers’ computer self-efficacy, software integration confidence,
and lesson planning. This research contributes to the current base of literature by
focusing on mathematics methods course instruction. The intent of this study was to
determine whether the use of specific computer integration techniques with preservice
teachers in a mathematics methods course provides them with a level of self-efficacy or
confidence that translates into usage of these techniques in the field. The experimental
group participated in activities involving computer integration, experienced direct

25
instruction on integration techniques, and completed required assignments with
computer integration criteria. This study constituted a significant addition to the
research literature on the impact or effectiveness of computer integration strategies
used with preservice teachers. It has instructional implications for the design and
implementation of effective, technology-infused mathematics methods courses and
other methods courses.
26
CHAPTER 3
Design of the Study
Participants
The participants in this study were from two intact, non-randomly-formed
classrooms. They were 27 preservice teachers enrolled in the College of Education at a
university in north central Texas in two sections of a course entitled EDEE 4350,
Mathematics in the Elementary School. The experimental group consisted of 17 female
participants enrolled in EDEE 4350.002. The control group consisted of ten female
participants enrolled in EDEE 4350.080. There were no males enrolled in either class.
The ethnicity of the two groups was predominantly Caucasian. Each of the 27
participants was scheduled to student teach in the Spring 2003 semester.
Instruments
Four instruments were used to measure student characteristics and experiences.
A demographic survey was used to collect information from the preservice teachers
relating to personal information, experiences in their prior education relating to computer
use, and their current computer use. This survey had 16 items and was entitled,
“Demographic Data and Previous Context Use of the Computer Survey.” It was used as
a pretest instrument only. It described participants’ demographics and their previous
usage of the computer and was used to help establish the initial equivalence of groups.
Participants were asked what year they first worked with a computer, how many college
classes they had had in computer-related instruction, where their first experience with a
computer took place, how many different teachers they had had who used technology in
their instruction, and how they had learned the most about computers. The second

27
section of the survey concentrated on current use of the computer. This section asked
participants to indicate whether they owned a computer, how many hours a week they
spend on the computer, which applications they use most frequently, and their Internet
usage. This data is summarized later in this chapter and is detailed in table form. The
survey is located in appendix a.
The second instrument was the Self-Efficacy With Computer Technologies Scale,
consisting of 50 statements that complete a sentence stem asking for self-report of
computer confidence (Murphy et al., 1989). It was used as a pretest and a posttest
instrument. This scale was constructed using a five-point, Likert-type response scale,
with the options of (1) Strongly Disagree, (2) Disagree, (3) Uncertain, (4) Agree, and (5)
Strongly Agree. The first section was titled, “Computer Skills.” This section provided 24
statements to the sentence stem, “I feel confident…” Participants were asked to report
on their physical skills in manipulating the computer. For example, one item was “I feel
confident handling a floppy disk”. They were also asked to report on their skills working
with software and hardware. They were asked about their confidence in copying files,
explaining why a software program will/will not run on a computer, describing the
function of the computer hardware, and troubleshooting computer problems. The
second section was entitled, “Word Processing.” This section provided ten statements
to the sentence stem “I feel confident…” In this section, participants were asked to
report on their confidence in a word processing program with letter writing, accessing
files, formatting text, printing and saving files, renaming a file, and moving blocks of text.
The third section of the scale was entitled, “World Wide Web.” This section provided
nine statements to the sentence stem, “I feel confident…” Participants were asked to

28
report their abilities related to finding and using information, accessing information from
a website, searching for information, and getting to a specific site on the World Wide
Web. The fourth section of the scale was entitled, “Presentation Programs.” This
section provided seven statements to the sentence stem “I feel confident…” Participants
were asked to respond to creating a slide presentation, editing a slide presentation,
adding pictures and sounds, working with colors and backgrounds, and rearranging and
printing a presentation. This scale is located in appendix b.
The original 32-item Computer Self-Efficacy Scale was determined to be highly
reliable and valid as reported by Murphy et. al. (1989). “Principal factor analysis with
oblique (direct quartimin) rotation produced a three-factor solution that explained 92% of
the systematic covariance among the 32 CSE items… . The alpha reliabilities for the
three empirically derived factors were .97, .96, and .92, respectively” (p. 895). The alpha
reliability estimates for each factor were very high, “indicating that the current form is
suitable for research and evaluation purposes” (p. 898). The criticisms discussed in this
article involve statements used in the section that dealt with mainframe computers. This
concern, although refuted by Murphy et. al. (1989), was not a concern in this study
because the Self-Efficacy with Computer Technologies Scale used here was an
updated version that no longer addressed mainframe computer use. Dr. Steven V.
Owen provided this updated version to the researcher. Dr. Owen was one of the
original authors of the Computer Self-Efficacy Scale and has worked on many revisions
since its original publication.
The third instrument was the Preservice Teacher Software Integration
Confidence Scale. This instrument, designed by the researcher, consisted of ten

29
statements constructed with a five-point, Likert-type response scale with the options of
(1) Strongly Disagree, (2) Disagree, (3) Uncertain, (4) Agree, and (5) Strongly Agree.
Participants were asked to define their levels of confidence in the utilization of computer
integration techniques with students in a classroom. Specific items on the scale
addressed participants’ confidence with spreadsheet and database software as related
to teaching students with these tools. The Preservice Teacher Software Integration
Scale was designed to use as a posttest-only instrument. The Preservice Teacher
Software Integration Scale is located in appendix c. Internal reliability data were
collected on this instrument. The reliability analysis revealed an alpha of .9314 on
section one, an alpha of .9347 on section two, and an alpha of .9500 on the total
instrument. Content validity was established by having experts from the Technology
Leadership Institute (TLI) review the ten items. These experts determined the
instrument had content validity.
The fourth instrument, the Lesson Plan Infusion/Integration Scale, provided
qualitative and quantitative data. This instrument was utilized as a posttest-only
instrument. The author tracked a minimum of three preservice teachers from the
experimental group and three preservice teachers from the control group into their
student teaching experience. Grade level assignment and pretest scores matched
these students. Lesson plans from each of these preservice teachers were collected.
Attention was focused on lesson plans in the content area of mathematics.
Researchers from the Technology Leadership Institute (TLI), a division of the Texas
Center for Educational Technology, extrapolated and rated preservice teachers’ use of
computer integration strategies and shared this with the researcher. Analysis of this

30
data was conducted by (a) identifying categories within the lesson plans using constant
comparison methods as in Laney et al. (1996), and (b) scoring according to the rubric in
the Lesson Plan Infusion/Integration Scale in the categories. These categories were
developed post facto based on the actual wording in the participants’ lesson plans. Two
judges from TLI independently categorized and scored the participants lesson plans,
and any discrepancies were discussed until a consensus was reached. The Lesson
Plan Technology Infusion/Integration Scale is located in appendix d.
Design
This study was quasi-experimental. The design for this study was the
nonequivalent pretest-posttest control group design. This design involved the random
assignment of intact classes/groups to treatments (Gay and Airasian, 2000). The
author made every attempt to utilize groups that were equivalent to combat threats to
validity. The Demographic Data and Previous Use of the Computer Survey revealed
several similarities in the demographic information between groups. All participants
were in their senior year of school and all were female. The categories of age and
elementary major (either EC-4 or 4-8) were similar between groups. The self-reported
ethnicity across the two groups was 22 Caucasians (81.5%), three African-Americans
(11.1%), one Hispanic (3.7%), and one Asian (3.7%). All participants were classified as
seniors. Nineteen of the participants were early childhood through 4th grade certification
majors, which represented 70.4% of the sample. Eight of the participants were fourth
grade through eighth grade certification majors, which represented 29.6% of the
sample. Table 1 demonstrates a breakdown of the demographic data.

31
Table 1
Participant Demographics
Category Experimental Group Control Group Total Total %
Senior Classification 17 10 27 100
Female Gender 17 10 27 100
Caucasian 15 7 22 81.5
African-American 1 2 3 11.1%
Hispanic 0 1 1 3.7%
Asian 1 0 1 3.7%
There were no participants screened out of the data analysis process. There
were no participants who refused to participate in the study. Twenty-seven candidates
were enrolled in the two classes, and all 27 agreed to participate in the study. Grade
point averages were also similar between groups. The experimental group’s mean
grade point average was 3.306 and the control group’s mean grade point average was
3.248. The use of a pretest and the two-way ANOVA design also helped establish the
initial equivalence of groups.
Each group received a pretest. The experimental group got the novel treatment,
and the control group got the traditional treatment. Both groups were posttested at the
end of the instructional treatment.
The independent variable was the type of instruction experienced in an
elementary mathematics methods course: novel instruction with specialized computer
technology integration techniques versus traditional instruction with no specialized
technology integration techniques. The dependant variables included the self-efficacy

32
of preservice teachers with computer integration technologies as measured by the Self-
Efficacy with Computer Technologies Scale, the confidence of preservice teachers with
computer software integration as measured by the Preservice Teacher Software
Integration Confidence Scale, and the use of computer technology integration
techniques in their student teaching mathematics classes as measured by the Lesson
Plan Technology Infusion/Integration Scale.
Procedure
During an early class period in the semester, each preservice teacher in EDEE
4350.002 (i.e. the experimental group, taught in a Professional Development School
cadre located at an elementary school site), and EDEE 4350.080 (i.e. the control group,
taught at a Professional Development School cadre located at a separate elementary
school site), was given a packet of surveys. This packet included the Demographic
Data Instrument and the Self-Efficacy with Computer Technologies Scale instrument.
Students were asked to complete the instruments during class. The researcher’s
faculty sponsor proctored these instruments, and the results for individual participants
were made known to the instructor after grades had been posted. Both groups were
taught by the same instructor, the investigator of this study.
The instructor for the experimental technology integration group issued
assignments that included an Internet search for mathematics lesson plans that used
technology integration, the use of E-mail correspondence to turn in assignments to the
instructor, plus several student assignments that required the use of computer software
in the execution of the assignment and/or inclusion in the preservice teachers’ plans as
described below.

33
There were multiple opportunities for the instructor to demonstrate technology
integration techniques with the preservice teachers in the experimental group.
Techniques demonstrated by the instructor included the use of the World Wide Web
and PowerPoint presentation software. These techniques were demonstrated
throughout the course of study. The instructor demonstrated the use of the World Wide
Web through the use of search tools, investigating school district web pages, and E-
mail. The instructor utilized PowerPoint in weekly mini-lectures as coursework content
was covered.
The preservice teachers in the experimental group constructed a notebook with
ten prescribed sections. Each of these ten sections covered a mathematics instruction
concept, and each section contained a minimum of one lesson plan for that section’s
topic that included technology integration. The first five sections were completed by
mid-term and reviewed by the instructor. These five sections included: 1) Standards, 2)
Problem-Solving, 3) Numbers and Place Value, 4) Addition/Subtraction, and 5)
Multiplication/Division. The entire notebook (all ten sections) was completed by the end
of the course and reviewed by the instructor. In addition to the first five sections
described above, the completed notebook included the following sections: 6) Geometry,
7) Fractions, 8) Ration, Percentage, Proportion, 9) Measurement, and 10) Data
Collection. All course requirements are in the course syllabus located in appendix e.
The preservice teachers in the experimental group were required to present in
groups using PowerPoint and to demonstrate requiring their “class” to do the same.
The PowerPoint presentation required each preservice teacher to analyze and evaluate
a current mathematics textbook according to set criteria. These criteria included the

34
following components: 1) compliance with National Council for Teachers of Mathematics
principles and standards for mathematics, 2) identification of Texas Essential
Knowledge and Skills, 3) activities formatted with the Texas Assessment of Knowledge
and Skills, 4) use of problem-solving strategies, 5) non-dependence on rote learning
and worksheets, 6) use of varied assessment instruments, 7) presence of
interdisciplinary connections, 8) use of manipulatives, 9) employment of alternative
approaches to instruction, 10) provision for hands-on learning opportunities, 11)
presence of supplemental teaching materials, and 12) use of technology integration.
Findings were reported by each group at the end of the course. Each group had ten
minutes to present its findings and make recommendations for the chosen mathematics
textbook.
In the middle of the semester, guest instructors from the Technology Leadership
Institute (TLI), which demonstrates the integration of technology into the preservice
teachers’ future classrooms, made a presentation to the experimental group. This
presentation included spreadsheet and database usage in the everyday mathematics
classroom. Special emphasis was placed on the inclusion of technology TEKS. The
TLI presenters focused on problem-solving activities in the middle-elementary grades
(4th through 6th). Presentations were highly motivational, with humor, laughter, patience,
perseverance, and professionalism demonstrated and encouraged. Hands-on activities
were used to encourage preservice teachers to think and plan otherwise normal, routine
mathematical exercises that included the use of spreadsheet and database software
applications. Exciting presentations promoting knowledge of state expectations were

35
provided in order to impact the preservice teachers’ future experience with student
teaching.
TLI presenters provided step-by-step instruction in a “how-to” format for
transferring data in mathematical problem solving into a spreadsheet and working a
solution. They also provided instruction on the practical application of database usage
in a mathematical problem by demonstrating its ease of use in establishing a checkbook
and also establishing a simple data arrangement.
This activity was followed by the TLI presenters escorting the preservice teachers
to the computer lab located in the adjoining classroom and the preservice teachers
executing a hands-on activity in which they manipulated the software in accordance to
their previous training. Each activity included the construction of a spreadsheet utilizing
information from the preservice teachers. Each preservice teacher provided his or her
name, favorite color, favorite food, favorite number, and favorite holiday. They then
took turns providing that data for the entire class. The data were then grouped by rows
and columns to demonstrate the ease and functionality of this project and how it relates
to the preservice teachers’ classroom.
The TLI presenter then returned to the classroom with the cadre of preservice
teachers and demonstrated another activity for a one-computer classroom. Using a
spreadsheet on the only computer in the classroom, the preservice teachers were
asked to categorize data from chocolate chip cookies. Each preservice teacher was
given a cookie with four different kinds of chips baked in. They were then asked to
break apart the cookies and determine how many of each kind of chip were present.
The data were collected from the entire class and placed into the spreadsheet, and

36
questions were asked to stimulate extended thought. This activity demonstrated the
use of computer software as a tool and, more specifically, as a motivational and age-
appropriate tool for children.
The database presentation consisted of introducing the software on the
projection television in the classroom. Students were guided, step-by-step, through two
of the sample databases provided with the software. Students were then given non-
personal demographic information and told to assemble an address book for the class.
The duration of this presentation was no more than four hours (or two class periods).
The length was determined by the amount of time needed for the hands-on activity.
These activities and assignments addressed nearly half of the 15 standards for
the student teaching and internship performance profile instituted by the International
Society for Technology in Education. Included were; (1) apply troubleshooting
strategies for solving routine hardware and software problems that occur in the
classroom; (2) identify, evaluate, and select specific technology resources available at
the school site to support a coherent lesson sequence; (3) design, manage, and
facilitate learning experiences using technology that affirm diversity and provide
equitable access to resources; (4) create and implement a well-organized plan to
manage available technology resources, provide equitable access for all students, and
enhance learning outcomes; (5) design, implement, and assess learner-centered
lessons that are based on the current best practices on teaching and learning with
technology and that engage, motivate, and encourage self-directed student learning; (6)
guide collaborative learning activities in which students use technology resources to
solve authentic problems in the subject areas; and (7) apply technology productivity

37
tools and resources to collect, analyze and interpret data and to report results to
students and parents (ISTE, 1991).
The preservice teachers fulfilled most, if not all, of the National Council for
Accreditation of Teacher Education standards for preservice teachers in relation to
technology. Specifically, (1) for standard I.C.1, candidates completed a sequence of
courses and/or experiences to develop an understanding of the structure, skills, core
concepts, ideas, values, facts, methods of inquiry, and uses of technology for the
content they plan to teach and; (2) for standard I.D.2 candidates completed a well-
planned sequence of courses and/or experiences in pedagogical studies that helped
develop understanding and use of: educational technology, including the use of
computer and other technologies in instruction, assessment, and professional
productivity (NCATE, 1995).
The control group was a class taught by the same instructor in a more traditional
way, with no specialized technology integration strategies, experiences, or
requirements. The students had no computer technology integration requirements, and
they did not have the presentations or demonstrations of technology integration. The
preservice teachers in the control group received the same mathematics methods
content as the experimental group. The course syllabus is located in appendix f.
The experimental group and the control group had similar classroom experiences
in several regards. They were both lectured to with the same mathematics methods
content. They were both instructed in the use of mathematics manipulatives. They both
participated in hands-on, manipulative training activities to model appropriate
mathematics pedagogy for elementary and middle school classrooms. The main

38
assignment for the course was the mathematics notebook, and both the experimental
and control groups completed this assignment. The only difference in the two group’s
notebook assignment was that the experimental group was required to include
technology integration in their ten lesson plans. The control group did not have
technology included in their lesson plan requirement. The control group and the
experimental group both had textbook analysis assignments. Students in the
experimental group prepared their reports using a PowerPoint presentation. Each
member of the control group presented her textbook analysis in the more traditional
paper report format. To substitute for training in computer technology integration
techniques, the control group had a more traditional assignment that consisted of
tutoring sessions with students in the school to which they were assigned. This
assignment was reported in a traditional paper format as well. The syllabi for the
experimental and control groups may be found in the appendix.
The Self-Efficacy with Computer Technologies Scale and the Preservice Teacher
Software Integration Confidence Scale was administered during class near the end of
the semester. The author’s faculty sponsor proctored these instruments, and the results
for individual students were not made known to the instructor until after grades had
been posted. Analyses of data from these instruments at pretest and posttest were
shared with the class, in general terms, at the conclusion of the study.
The establishment of initial equivalence of the two groups was determined
through descriptive and statistical means using the two pretest instruments. The two
pretest instruments used were the Demographic Data and Previous Context Use of the
Computer Survey and the Self-Efficacy with Computer Technologies Scale. The pretest

39
results were very similar for the two groups. The pretest means were similar and the
standard deviations for the two groups were very similar. Descriptive demographic
information from the first pretest instrument demonstrated the comparability of the
groups. All participants were in their senior year of school and all were female. The
categories of age and elementary major (either EC-4 or 4-8) were similar between
groups. Grade point averages were also similar between groups. Statistical analysis
was done on the second instrument to determine reliability. Each of the four sections of
the instrument was analyzed as well as a total item analysis of the instrument. The first
section, “Computer Skills,” had an alpha reliability of .8907. The second section, “Word
Processing,” had an alpha reliability of .6293. The third section, “World Wide Web,” had
an alpha reliability of .8346. The fourth section, “Presentation Programs,” had an alpha
reliability of .8632. All 50 items in the total instrument had an alpha reliability of .9308.
These high alpha reliabilities allowed the analysis to be conducted using one variable;
thus, a two-way ANOVA (repeated measures) was conducted to analyze the data.
The reliability analysis provided a reliability coefficient for the Self-Efficacy with
Computer Technologies Scale pretest in each of its four categories and for the total
scale comparing all 50 items. The analysis provided a reliability coefficient for the Self-
Efficacy with Computer Technology Scale (SECTS) posttest in each of its four
categories and for the total scale. The analysis also provided a reliability coefficient for
the Preservice Teacher Software Integration Confidence Scale (PTSICS) posttest in
each of its two parts and for the total scale comparing all ten items. Table 2 reports the
alpha scale for the reliability analysis. The alpha coefficients were very high for all three
instruments, with one minor exception. The alpha reliability coefficient for the SECTS

40
pretest category “Word Processing” was only .6293, and the alpha reliability coefficient
for the SECTS posttest category “Word Processing” was only .4258. Examination of
these two categories revealed that the data from each participant were very similar, thus
accounting for a lower number on the alpha rating. The total scale alpha reliability
coefficients were extremely high for the SECTS pretest (.9308), the SECTS posttest
(.9506), and the PTSICS posttest (.9500).
Table 2
Category and Total Reliability Analysis
Category SECTS pretest SECTS posttest PTSICS posttest
Computer Skills .8907 .9309 -
Word Processing .6293 .4258 -
World Wide Web .8346 .8577 -
Presentation Programs .8632 .9115 -
Spreadsheet Integration - - .9314
Database Integration - - .9347
Total .9308 .9506 .9500
The reliability analysis revealed a high degree of correlation in the data. This led
to the decision to run a two-way ANOVA (repeated measures) on the SECTS pretest
and the SECTS posttest. ANOVA was used to explore posttest differences between the
two groups in terms of computer software integration confidence as measured by the
PTSICS. An alpha level of .05 was used throughout the data analysis.
The author then collected the math lesson plans of three preservice teachers
from the experimental group and three preservice teachers from the control group

41
during their student teaching experience, which they pursued in the semester
immediately following the study. The students were matched based on grade-level
assignment and pretest scores. Review of lesson plans by technology integration
experts from the Technology Leadership Institute ensured that researcher/teacher bias
and effects were tightly controlled and that the qualitative portion of this study was valid.
Researchers from the Technology Leadership Institute extrapolated preservice
teachers’ use of computer integration strategies and shared this with the author. The
form used to collect this data was comprised of a rubric style point scale to identify
integration strategies. A systematic method of categorizing and scoring was utilized to
describe preservice teacher usage of computer software integration practices.
Reliability was confirmed with researcher’s agreement in scoring that was well over 90%
of the scale judgments.

42
CHAPTER 4
Presentation of Data
The purpose of this chapter is to report the findings of the data based on the six
stated hypotheses. This study was conducted to assess the effect of technology
integration strategies in an elementary mathematics methods course on preservice
teachers’ computer self-efficacy, software integration confidence, and lesson planning in
their student teaching semester. Reliability analysis was run on the Self-Efficacy with
Computer Technologies Scale pretest and posttest. The same reliability analysis was
run on the posttest-only Preservice Teacher Software Integration Confidence Scale and
the Lesson Plan Technology Infusion/Integration Scale. The reliability analysis,
described previously in chapter 3, was used to determine the number of constructs
present in the data. The reliability scores were very high measuring one construct.
Descriptive statistical analysis was used for data analysis of Hypotheses 1, 2 and 3.
Null Hypotheses 1, 2, and 3 were then analyzed using inferential statistics.
The participants in the study were from two intact, non-randomly-formed
classrooms. They were 27 preservice teachers enrolled in an elementary mathematics
methods course in a college of education in a metropolitan state university. The two
classrooms received different instructional treatments. The experimental group
experienced novel instruction with specialized computer technology integration
techniques, experiences, and requirements provided them by the regular course
instructor and a guest instructor from the Technology Leadership Institute (TLI). The
control group experienced the same content delivered in a more traditional instructional
format without computer technology integration techniques, experiences, or
43
requirements. Thus, use or non-use of computer technology integration techniques in
an elementary mathematics methods course was the independent variable manipulated
in this study. The dependent variables included the self-efficacy of preservice teachers
with computer integration techniques as measured by the Self-Efficacy with Computer
Technologies Scale, the confidence of preservice teachers with computer software
integration as measured by the Preservice Teacher Software Integration Confidence
Scale, and the use of computer technology integration techniques by preservice
teachers during their student teaching experience in a mathematics class as measured
by the Lesson Plan Technology Infusion/Integration Scale. The Windows SPSS
10.07™ statistical program was used to run the data analysis.
Descriptive and Inferential Statistics
The six hypotheses restated below were tested at the .05 level of statistical
significance for all participants in the two groups. Hypothesis 1 stated that preservice
elementary teachers who received mathematics methods instruction with computer
integration techniques would have higher scores on a Self-Efficacy with Computer
Technologies Scale than preservice elementary teachers who received traditional
mathematics methods instruction without computer integration techniques. Null
Hypothesis 1 stated that there would be no statistically significant difference in scores
on a Self-Efficacy with Computer Technologies Scale between preservice elementary
teachers who received mathematics methods instruction with computer integration
techniques versus preservice elementary teachers who received traditional
mathematics methods instruction without computer integration techniques.
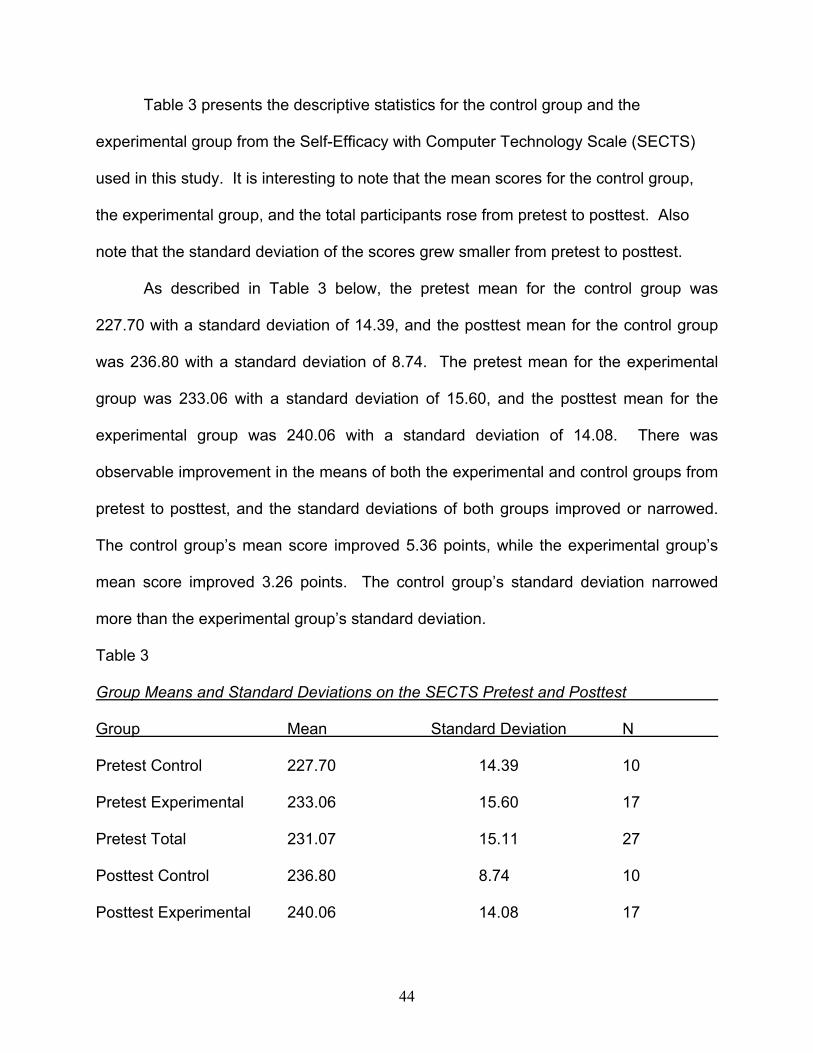
44
Table 3 presents the descriptive statistics for the control group and the
experimental group from the Self-Efficacy with Computer Technology Scale (SECTS)
used in this study. It is interesting to note that the mean scores for the control group,
the experimental group, and the total participants rose from pretest to posttest. Also
note that the standard deviation of the scores grew smaller from pretest to posttest.
As described in Table 3 below, the pretest mean for the control group was
227.70 with a standard deviation of 14.39, and the posttest mean for the control group
was 236.80 with a standard deviation of 8.74. The pretest mean for the experimental
group was 233.06 with a standard deviation of 15.60, and the posttest mean for the
experimental group was 240.06 with a standard deviation of 14.08. There was
observable improvement in the means of both the experimental and control groups from
pretest to posttest, and the standard deviations of both groups improved or narrowed.
The control group’s mean score improved 5.36 points, while the experimental group’s
mean score improved 3.26 points. The control group’s standard deviation narrowed
more than the experimental group’s standard deviation.
Table 3
Group Means and Standard Deviations on the SECTS Pretest and Posttest
Group Mean Standard Deviation N
Pretest Control 227.70 14.39 10
Pretest Experimental 233.06 15.60 17
Pretest Total 231.07 15.11 27
Posttest Control 236.80 8.74 10
Posttest Experimental 240.06 14.08 17
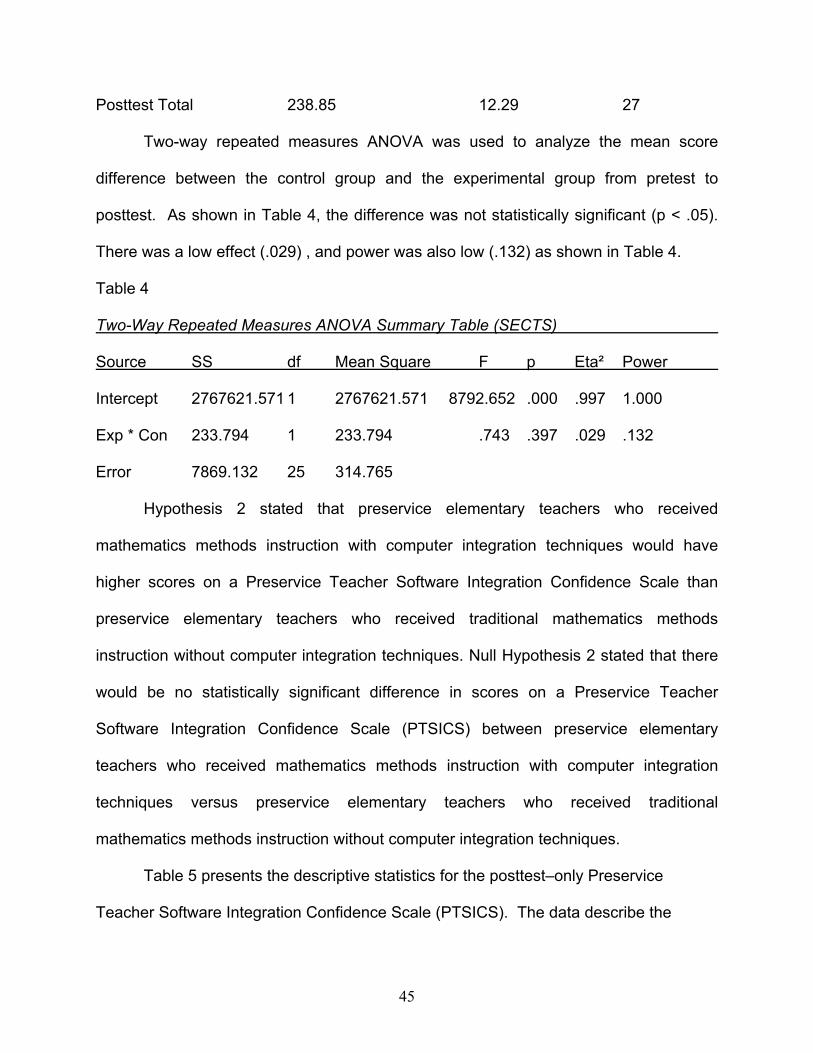
45
Posttest Total 238.85 12.29 27
Two-way repeated measures ANOVA was used to analyze the mean score
difference between the control group and the experimental group from pretest to
posttest. As shown in Table 4, the difference was not statistically significant (p < .05).
There was a low effect (.029) , and power was also low (.132) as shown in Table 4.
Table 4
Two-Way Repeated Measures ANOVA Summary Table (SECTS)
Source SS df Mean Square F p Eta² Power
Intercept 2767621.571 1 2767621.571 8792.652 .000 .997 1.000
Exp * Con 233.794 1 233.794 .743 .397 .029 .132
Error 7869.132 25 314.765
Hypothesis 2 stated that preservice elementary teachers who received
mathematics methods instruction with computer integration techniques would have
higher scores on a Preservice Teacher Software Integration Confidence Scale than
preservice elementary teachers who received traditional mathematics methods
instruction without computer integration techniques. Null Hypothesis 2 stated that there
would be no statistically significant difference in scores on a Preservice Teacher
Software Integration Confidence Scale (PTSICS) between preservice elementary
teachers who received mathematics methods instruction with computer integration
techniques versus preservice elementary teachers who received traditional
mathematics methods instruction without computer integration techniques.
Table 5 presents the descriptive statistics for the posttest–only Preservice
Teacher Software Integration Confidence Scale (PTSICS). The data describe the

46
performance of the control group, the experimental group, and the total population. As
described below in Table 5 experimental group mean on the PTSICS was 39.65, and
the control group mean on the PTSICS was 32.90. The standard deviation for the
experimental group was 7.42, and the standard deviation for the control group was 6.37.
The means were in the expected direction to support hypothesis 2 of this study, and the
standard deviations were low enough for drawing conclusions with some confidence.
Table 5
Group Means and Standard Deviations on the PTSICS Posttest
Group Mean Standard Deviation N
Control Group 32.90 6.37 10
Experimental Group 39.65 7.42 17
Total 37.15 7.68 27
One-way ANOVA for mean differences was used to analyze the difference in
PTSICS posttest means between the control group and the experimental group. Table
6 demonstrates the difference was statistically significant (p < .05). It is notable that R
squared was equal to .187, and the adjusted R squared was equal to .154. Thus, 15.4%
of the variance between groups is explainable by the independent variable (i.e. use/non-
use of computer technology integration techniques within an undergraduate elementary
mathematics methods course).
Table 6
One-Way ANOVA Summary Table (PTSICS)
Source SS df Mean Square F p Eta² Power
Intercept 33137.884 1 33137.884 664.468 .000 .964 1.000

47
Exp * Con 286.625 1 286.625 5.747 .024 .187 .635
Error 1246.782 25 49.871
Total 38793.000 27
Hypothesis 3 stated that preservice elementary teachers who received
mathematics methods instruction with computer integration techniques would generate
lesson plans in their student teaching internship experience that scored higher on a
Lesson Plan Technology Infusion/Integration Scale than preservice elementary teachers
who received traditional mathematics methods instruction without computer integration
techniques. Null Hypothesis 3 stated that there would be no statistically significant
difference in scores on a Lesson Plan Technology Infusion/Integration Scale between
preservice elementary teachers who received mathematics methods instruction with
computer integration techniques versus preservice elementary teachers who received
traditional mathematics methods instruction without computer integration techniques.
Table 7 presents the descriptive statistics for the posttest-only Lesson Plan
Technology Infusion/Integration Scale (LPTIS). The data represent the control group,
the experimental group, and the total population. As described below in Table 7 the
experimental group mean on the LPTIS was 13.33, and the control group mean on the
LPTIS was 1.67. The standard deviation for the experimental group was 10.41, and the
standard deviation for the control group was 2.89. The mean score difference between
the experimental group and the control group was certainly reflective of the direction
that was expected.

48
Table 7
Group Means and Standard Deviations on the LPTIS Posttest
Group Mean Standard Deviation N
Control Group 1.67 2.89 3
Experimental Group 13.33 10.41 3
Total 7.50 9.35 6
One-way ANOVA for mean differences was used to analyze the difference in
LPTIS posttest means between the control group and the experimental group. Table 8
demonstrates that the difference was not statistically significant (p. < 05).
Table 8
One-Way ANOVA Summary Table (LPTIS)
Source SS df Mean Square F p Eta² Power
Intercept 337.500 1 337.500 5.786 .074 .591 .450
Exp * Con 204.167 1 204.167 3.500 .135 .467 .302
Error 233.333 4 58.333
Total 775.000 6
Summary
There was no statistical significance (p < .05) between experimental and control
groups on the Self-Efficacy with Computer Technology Scale at pretest and posttest.
However, the results were in the expected direction that indicated growth by both
groups and a higher mean score by the experimental group. There was statistical
significance (p = .024) between groups on the posttest-only Preservice Teacher
Software Integration Confidence Scale. There was no statistical significance (p < .05)

49
between groups on the Lesson Plan Technology Infusion/Integration Scale. However,
the results were in the expected direction in that the mean score for the experimental
group was much higher than the control group.

50
CHAPTER 5
Conclusions
The purpose of this study was to demonstrate the effect of computer technology
integration (through direct intervention, required assignments, and instructor
demonstration) on preservice teachers’ feelings of computer self-efficacy and feelings of
confidence in software integration. It was also the purpose of this study to interpret
these preservice teachers’ actual use of these computer technology integration
techniques in their own planning and instruction during student teaching.
The participants in this study were from two intact, non-randomly-formed
classrooms. They were 27 preservice teachers enrolled in a college of education at a
university in north central Texas in two sections of a course entitled EDEE 4350,
Mathematics in the Elementary School. The experimental group consisted of 17 female
participants enrolled in EDEE 4350.002. The control group consisted of ten female
participants enrolled in EDEE 4350.080. The ethnicity of the two groups was
predominantly Caucasian. Each of the 27 participants was scheduled to student teach
in the Spring 2003 semester.
The reliability analysis provided a reliability coefficient for the Self-Efficacy with
Computer Technologies Scale (SECTS) pretest and posttest in each of its four
categories and the total scale comparing all 50 items. The analysis also provided a
reliability coefficient for the Preservice Teacher Software Integration Confidence Scale
(PTSICS) posttest in each of its two parts and the total scale comparing all ten items.
The reliability coefficients for the SECTS (pretest and posttest) and the PTSIC (posttest)
were very high. The SECTS pretest alpha was .9308, and the SECTS posttest alpha
51
was .9506. The PTSIC posttest alpha was .9500. These results provide a clear
indication that the scales were very reliable. Margaret Ropp (1999) reported computer
self-efficacy reliability coefficients of .96 in her study, which supports the findings of the
current study.
The hypotheses were tested at the .05 level of statistical significance. In this
study, the independent variable was the use or non-use of computer technology
integration techniques in an undergraduate elementary mathematics methods course.
Experimental group students experienced novel instruction with specialized technology
strategies, experiences, and requirements provided to the experimental group by the
regular course instructor and the guest instructor from the Technology Leadership
Institute (TLI), while control group students experienced traditional instruction without
computer technology integration techniques. The dependant variables included the
self-efficacy of preservice teachers with computer integration technologies as measured
by the Self-Efficacy with Computer Technologies Scale, the confidence of preservice
teachers with computer software integration as measured by the Preservice Teacher
Software Integration Confidence Scale, and the use of computer technology integration
techniques by preservice teachers during their student teaching in a mathematics class
as measured by the Lesson Plan Technology Infusion/Integration Scale.
The results of the data analysis revealed, through the inferential statistics run on
the Self-Efficacy with Computer Technology Scale pretest and posttest, that there was
no statistically significant difference between treatment groups (p = .397). Therefore,
Hypothesis 1 was rejected, and Null Hypothesis 1 was sustained. Preservice
elementary teachers who received mathematics methods instruction with computer

52
integration techniques did not have higher scores on a Self-Efficacy with Computer
Technologies Scale than preservice elementary teachers who received traditional
mathematics methods instruction without computer integration techniques. There was
no statistically significant difference in scores on a Self-Efficacy with Computer
Technologies Scale between preservice elementary teachers who received
mathematics methods instruction with computer integration techniques versus
preservice elementary teachers who received traditional mathematics methods
instruction without computer integration techniques.
The novel intervention had little measurable effect on the experimental
participants in the study as pertaining to computer self-efficacy. The participants in the
experimental group had higher mean scores at pretest and at the posttest as compared
to the control group. The experimental group’s pretest mean score was 5.36 more than
the control group, and their posttest mean score was 3.26 more than the control group.
There was also test wise occurrence improvement. However, this cannot be attributed
to the intervention. Participants’ mean scores, both pretest and posttest, were very
high. The participants in both the experimental group and the control group appear to
be very well prepared in the areas addressed by the SECTS instrument. These areas
included basic computer skills, appropriate use of word processing skills, use of the
World Wide Web, and presentation software skills.
The experimental group’s pretest-posttest means of 233.06 and 240.06 and the
control group’s pretest-posttest means of 227.70 and 236.80 are relatively high when
compared to the 250 total points attainable on the SECTS instrument. This reflects very
well on the prior knowledge and skills attained by these preservice teachers. It also
53
provides some basis to the thought that these participants are ready for more advanced,
sophisticated software applications. These participants advanced through their
secondary education with formal technology course requirements and completed
university coursework in technology. This background is evident in their high pretest
and posttest scores of self-efficacy.
Preservice teachers who are confident in their ability to perform computer tasks
(i.e. who have high computer self-efficacy) also have more positive attitudes toward
computers (Ropp, 1999). The preservice teachers in the present study had the
background in technology use to support further preparation in computer integration
strategies. Although students in her study only received three hours of hands-on
computer technology instruction, Margaret Ropp (1999) reported that her results were
statistically significant. In Ropp’s study, the statistical analysis of computer self-efficacy
yielded a t = 2.02, with p < .05. Although the current study did not match this statistical
significance, the results were in the same, expected direction.
The results of the data analysis revealed, through the inferential statistics run on
the posttest-only Preservice Teachers Software Integration Confidence Scale, that there
was a statistically significant difference between treatment groups (p = .024).
Therefore, Hypothesis 2 was sustained, and Null Hypothesis 2 was rejected.
Preservice elementary teachers who received mathematics methods instruction with
computer integration techniques had higher scores on a Preservice Teacher Software
Integration Confidence Scale than preservice elementary teachers who received
traditional mathematics methods instruction without computer integration techniques.
There was a statistically significant difference in scores on a Preservice Teacher

54
Software Integration Confidence Scale (PTSICS) between preservice elementary
teachers who received mathematics methods instruction with computer integration
techniques versus preservice elementary teachers who received traditional
mathematics methods instruction without computer integration techniques.
The statistical significance of the difference between treatment groups is
important to this study. It reflects well on this portion of the study that the adjusted R
squared value is equal to .154, permitting the inference that 15.4% of the observed
effect is explainable by the independent variable. Preservice teachers who are exposed
to computer technology integration techniques seem to be much more confident with
the concepts of integrating spreadsheet and database software into their future lesson
plans than preservice teachers who are not exposed to computer technology integration
techniques.
The findings of this study, although limited to the student sample at one
university, point to the possible benefits of introducing specific computer software
integration techniques into mathematics methods courses at other teacher education
institutions. In this study, demonstrating and utilizing specific computer integration
techniques strengthened the experimental group’s confidence in using computer
hardware and software in their future classrooms. Schrum and Dehoney (1998) built a
convincing argument for computer technology instruction in methods courses in their
survey study. Methods course instructors used a variety of techniques that were
applicable to their content area. The mathematics methods instructors used specific
techniques that included spreadsheet software. Their results demonstrated that 90% or

55
more of the survey respondents predicted that they would use spreadsheets and
databases in their future classrooms.
Colleges of education often require preservice teachers to complete coursework
in computer use and computer integration. The review of literature for this study
demonstrates that some university professors do an adequate job of modeling computer
integration in their classrooms. This study demonstrates the direct benefit of using
specific computer software integration techniques on students’ confidence in software
integration. The preservice teachers in the experimental group internalized the novel
treatment and thus felt prepared enough by that instruction to boost their confidence.
The results of the data analysis revealed, through the inferential statistics run on
the Lesson Plan Technology Infusion/Integration Scale posttest, that there was no
statistical significance between treatment groups (p = .135). Therefore, Hypothesis 3
was rejected, and Null Hypothesis 3 was sustained. Preservice elementary teachers
who received mathematics methods instruction with computer integration techniques did
not generate lesson plans in their student teaching internship experience that scored
higher on a Lesson Plan Technology Infusion/Integration Scale than preservice
elementary teachers who received traditional mathematics methods instruction without
computer integration techniques. There was no statistically significant difference in
scores on a Lesson Plan Technology Infusion/Integration Scale between preservice
elementary teachers who received mathematics methods instruction with computer
integration techniques versus preservice elementary teachers who received traditional
mathematics methods instruction without computer integration techniques.

56
There were several uncontrollable variables at work that may help to explain the
results on the Lesson Plan Technology Infusion/Integration Scale posttest. One factor
was the availability of a minimal number of computers (i.e. one) in half of the
classrooms in which the participants were teaching and the non-availability of
computers in the other half of the classrooms occupied by participants. This factor
certainly could have contributed to the student teachers’ reluctance to plan for computer
software integration. This reluctance was possibly enhanced further by their mentor
teacher’s inability to demonstrate computer integration techniques. This possibility
could have existed easily. Most preservice teachers do not use technology in their field
experience and do not work with teachers who can advise them on its use (Milken
Exchange, 1999). Also, the collection of lesson plans was at random. This leaves the
author with a question as to which lesson plans were sent (or not sent) that might (or
might not) have indicated some form of software integration.
At first glance, the difference in the control group mean (1.67) and the
experimental group mean (13.33) on the LPTIS posttest seemed to be a real difference,
but it was not statistically significant. Without statistical significance, these apparent
differences in group mean differences are impossible to interpret as a real difference.
They may have arisen by chance. These data likely reflected no statistical difference
because of the low number of participants. There were three participants from the
control group and three participants from the experimental group. There was one
remarkable statistic revealed in the analysis and that was Cohen’s d, which was 4.035.
This statistic records a greater than four standard deviation difference in the mean
scores between the two groups. This suggests that even though there was no

57
statistically significant difference between means, the mean score differences were very
different in terms of standard deviation. The reality of the specific data is much more
simplistic. The three students in the control group scored 0, 0, and 5 out of a possible
60 points on the LPTIS scale. The student teacher who scored 5 points recorded this in
the category indicating teacher directed integration techniques. This category could
record points for a wide variety of technology integration plans. The three students in
the experimental group scored 5, 10, and 25 out of a possible 60 points on the LPTIS
scale. These students scored all but 10 points in these three rubrics in the category
scoring student lead usage of software. Even though this may not have recorded use of
spreadsheet or database usage the student teachers were exhibiting some skill in
technology integration techniques by allowing the students to constructively direct their
own learning. Although the experimental group appears to have a much larger mean
score, they also have a much larger standard deviation (10.41). The reason for this is
that one experimental group student scored significantly higher than the other two
experimental group students on the LPTIS scale, thus impacting the standard deviation.
Whereas the control group students show virtually no evidence of lesson plan
technology infusion/integration, the experimental group students at least show some
evidence of lesson plan technology infusion/integration, with one experimental group
student performing well above all other students – experimental or control. Again, this
is an insufficient amount of data from which to draw a conclusion with any certainty.
The implications of these results may reach beyond the direct control of any
college of education. Perhaps schools used in the professional development of
preservice teachers should be supported in such a way as to provide the tools for

58
mentor teachers and preservice teachers to use technology in a way that will insure
success for students and teachers alike. But, is this level of support feasible? Let us
assume that it could be achieved. If preservice teachers have a high level of self-
efficacy, a high degree of confidence with the software, and a technology-rich
environment (such as laptop computers in the hands of all children) in which to student
teach, one wonders whether these preservice teachers would be more likely to plan and
use the software.
If this is not feasible, then colleges of education should pay more attention to
instructing preservice teachers on the use of computer integration techniques in a
classroom with limited numbers of computers (i.e. 1-3) and/or the use of computer
integration techniques in school computer labs. More time should be spent in methods
classes on preparing preservice teachers to use computer labs as a viable resource.
Typical computer lab time is spent with a computer lab instructor teaching a separate
(or, at least, parallel) curriculum from the classroom teacher. Preservice teachers
should be taught how to make better use of this time. They should be instructed in
collaborative planning techniques so that they can engage in team planning with
colleagues, including other teachers at their grade level and the school’s computer lab
instructor. If planned correctly, time in the computer lab could be utilized for hands-on
integration of software with the day-to-day content and skills taught by the regular
classroom teacher. In order to make this a reality, the preservice teacher must be
prepared to take the initiative. Using guided discussion and other appropriate
strategies, methods courses should instruct preservice teachers on how to

59
cooperatively schedule and plan lessons with the computer lab instructor that
successfully coordinate computer lab activities with classroom activities.
The preservice teachers in their semester of student teaching might also benefit
from being closely monitored for their computer technology integration techniques.
Intervention by a university supervisor that necessitated the use of the computer
integration techniques they had previously studied might better insure their usage in the
student teaching semester. The desired results may not happen automatically; there
may need to be monitoring by the university and by knowledgeable on-site mentors in
the classroom.
Conclusions
This study provides evidence that when preservice teachers are given instruction
in specific computer software integration techniques, they are more confident. In this
study, demonstrating and utilizing specific computer integration techniques
strengthened the experimental group’s confidence in using computer software in their
future classrooms. The novel treatment with the experimental group had the desired
effect, with significant results in terms of software integration confidence. The results of
the data analysis also revealed, through the inferential statistics run on the Lesson Plan
Technology Infusion/Integration Scale (LPTIS) posttest, that there was no statistical
significance between treatment groups on their actual use of technology integration
during student teaching. This lack of statistical significance may reflect the low number
of participants/subjects in this data subset. The results of the study imply that the level
to which software integration confidence is transformed into actual use may be variable
and dependent on many factors. These factors may include the integration confidence

60
level of the mentor teacher, the presence/absence of instruction on cooperative
planning (between computer lab instructors and regular classroom teachers), the
presence/absence of instruction on the efficient/integrative use of limited computer
resources (e.g. a low number of computers in the regular classroom and limited access
and/or time in a school computer lab), and other factors.
The intended purpose of this study was fulfilled. The study provides insight into
the benefits of specific software integration techniques instruction. If we want
preservice teachers to use computer integration strategies with their students, we must
provide them with adequate preparation. In this study, some of the steps were in place
to actualize this preparation, but more work is needed. Hopefully, the ultimate winners
in this process will be the children in these teachers’ classrooms. They will begin their
journey of preparation to enter a technological world. Preservice teachers cannot be
expected to have these abilities without the proper background and instruction in
integration strategies.
Recommendations for Further Research
The data analysis in this study suggests several items in need of additional
research, as follows:
1. Further research is recommended in computer integration techniques in
mathematics, social studies, science, and reading methods courses.
2. Further research should consider ways to enlarge the sample of study and look
at specific computer software integration strategies and confidence levels.
3. A meta-analysis of multiple studies related to the integration of software into
methods coursework should be considered.

61
4. Further research should be considered to track preservice teachers into their
career and assess the level of use that they demonstrate in their classrooms.
5. Research important to the global aspects of computer integration should also
include studies on novel treatments involving in-service teacher staff
development.
6. Future research should measure the willingness of preservice teachers to
transfer their technology integration confidence into classroom use in their
student teaching within field settings richly supported with computer technology

62
APPENDICES
63
APPENDIX A
Demographic Data and Previous Context Use of the Computer Survey

64
DEMOGRAPHIC DATA AND PREVIOUS CONTEXT USE OF THE COMPUTER
SURVEY
Please fill in the blank or circle the choice that best answers the following questions. 1. Year in school (i.e. 1 = freshman) 1 2 3 4 Grad 2. Female Male 3. Age: 4. Ethnic origin: Caucasian , African American , Hispanic
Native American , Asian . 5. What is your major? 6. How many college-level computer-related courses have you completed? 7. In what year did you first work with a computer? 8. Where did this first experience with a computer take place? (select only one) Elementary school Middle school High School College Your home Friends home Work Museum Library Other 9. How many different teachers have you had who used computer technology in their
teaching?
K-12 , College 10. How have you learned the most about computers? (select only one) K-12 schools Courses in college
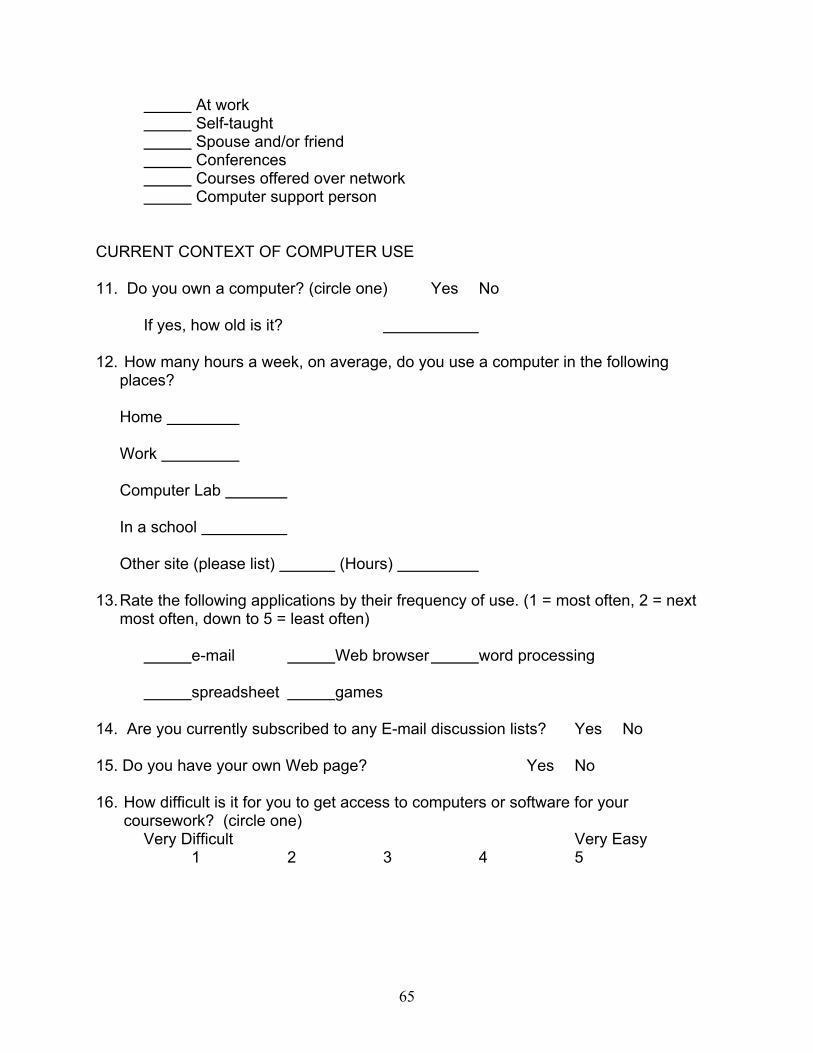
65
At work Self-taught Spouse and/or friend Conferences Courses offered over network Computer support person CURRENT CONTEXT OF COMPUTER USE 11. Do you own a computer? (circle one) Yes No
If yes, how old is it? 12. How many hours a week, on average, do you use a computer in the following
places?
Home Work Computer Lab In a school Other site (please list) (Hours)
13. Rate the following applications by their frequency of use. (1 = most often, 2 = next
most often, down to 5 = least often) e-mail Web browser word processing spreadsheet games 14. Are you currently subscribed to any E-mail discussion lists? Yes No 15. Do you have your own Web page? Yes No 16. How difficult is it for you to get access to computers or software for your
coursework? (circle one) Very Difficult Very Easy 1 2 3 4 5

66
APPENDIX B
SELF-EFFICACY WITH COMPUTER TECHNOLOGIES

67
SELF-EFFICACY WITH COMPUTER TECHNOLOGIES
After reading each statement, please indicate the extent to which you agree or disagree, by circling the number to the right of each sentence. Please respond to all statements, even if you have not had a great amount of experience with a particular type of instructional computer technology.
Your responses should reflect your current level of appraisal with the activity described in each statement. For example: Strongly Strongly I feel confident… Disagree Disagree Uncertain Agree Agree
Ex. Formatting a computer diskette 1 2 3 4 5 By circling number 4 you indicate that you have some confidence in your ability to format a computer disk. Computer skills I feel confident
Strongly Strongly
Disagree Disagree Uncertain Agree Agree
1. Working on a personal computer 1 2 3 4 5 2. Getting the software up and running 1 2 3 4 5 3. Using the user’s guide when help is
needed 1 2 3 4 5 4. Exiting a program 1 2 3 4 5 5. Understanding terms relating to the
computer hardware 1 2 3 4 5
6. Understanding terms relating to the computer software 1 2 3 4 5
7. Handling a floppy disk properly 1 2 3 4 5 8. Learning to use a variety of programs 1 2 3 4 5 9. Learning advanced skills with software 1 2 3 4 5 10. Making selections from a menu 1 2 3 4 5 11. Using the computer to analyze number
data 1 2 3 4 5 12. Using a printer to produce a hard copy 1 2 3 4 5 13. Copying a disk 1 2 3 4 5 14. Copying an individual file 1 2 3 4 5 15. Adding or deleting information from
a file 1 2 3 4 5
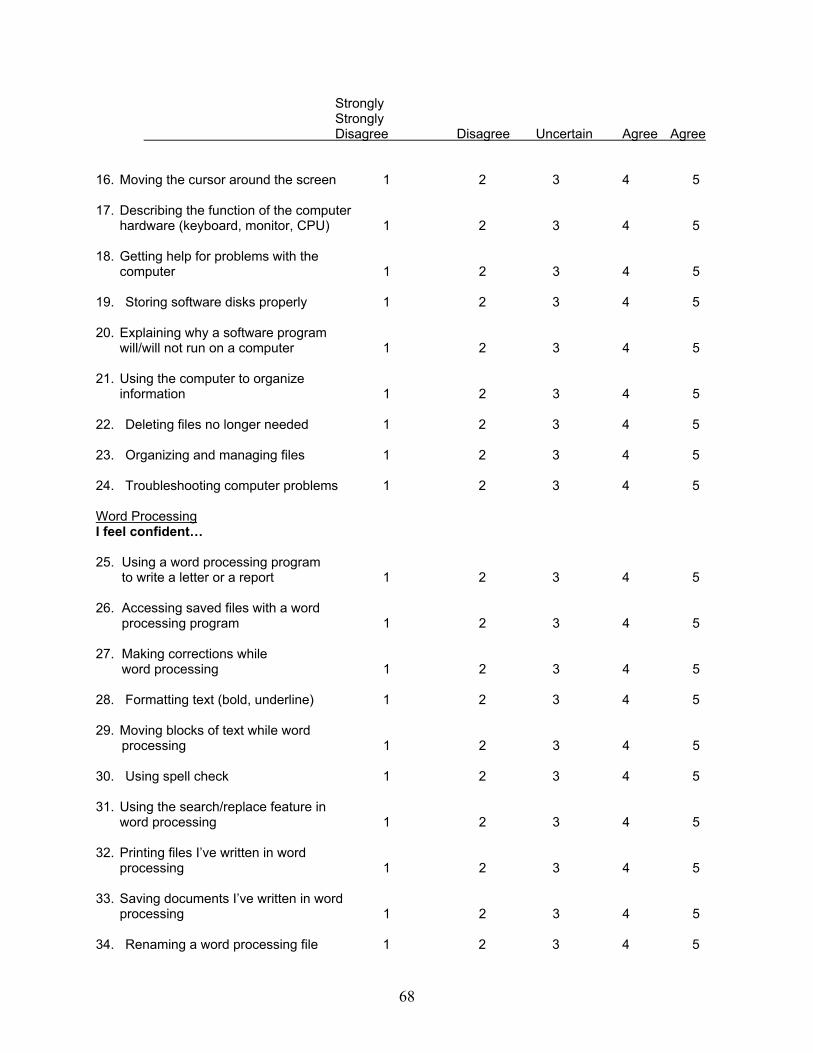
68
Strongly Strongly
Disagree Disagree Uncertain Agree Agree
16. Moving the cursor around the screen 1 2 3 4 5 17. Describing the function of the computer
hardware (keyboard, monitor, CPU) 1 2 3 4 5 18. Getting help for problems with the
computer 1 2 3 4 5 19. Storing software disks properly 1 2 3 4 5 20. Explaining why a software program
will/will not run on a computer 1 2 3 4 5 21. Using the computer to organize
information 1 2 3 4 5 22. Deleting files no longer needed 1 2 3 4 5 23. Organizing and managing files 1 2 3 4 5 24. Troubleshooting computer problems 1 2 3 4 5 Word Processing I feel confident… 25. Using a word processing program
to write a letter or a report 1 2 3 4 5 26. Accessing saved files with a word
processing program 1 2 3 4 5 27. Making corrections while
word processing 1 2 3 4 5 28. Formatting text (bold, underline) 1 2 3 4 5 29. Moving blocks of text while word
processing 1 2 3 4 5 30. Using spell check 1 2 3 4 5 31. Using the search/replace feature in
word processing 1 2 3 4 5
32. Printing files I’ve written in word processing 1 2 3 4 5
33. Saving documents I’ve written in word
processing 1 2 3 4 5 34. Renaming a word processing file 1 2 3 4 5
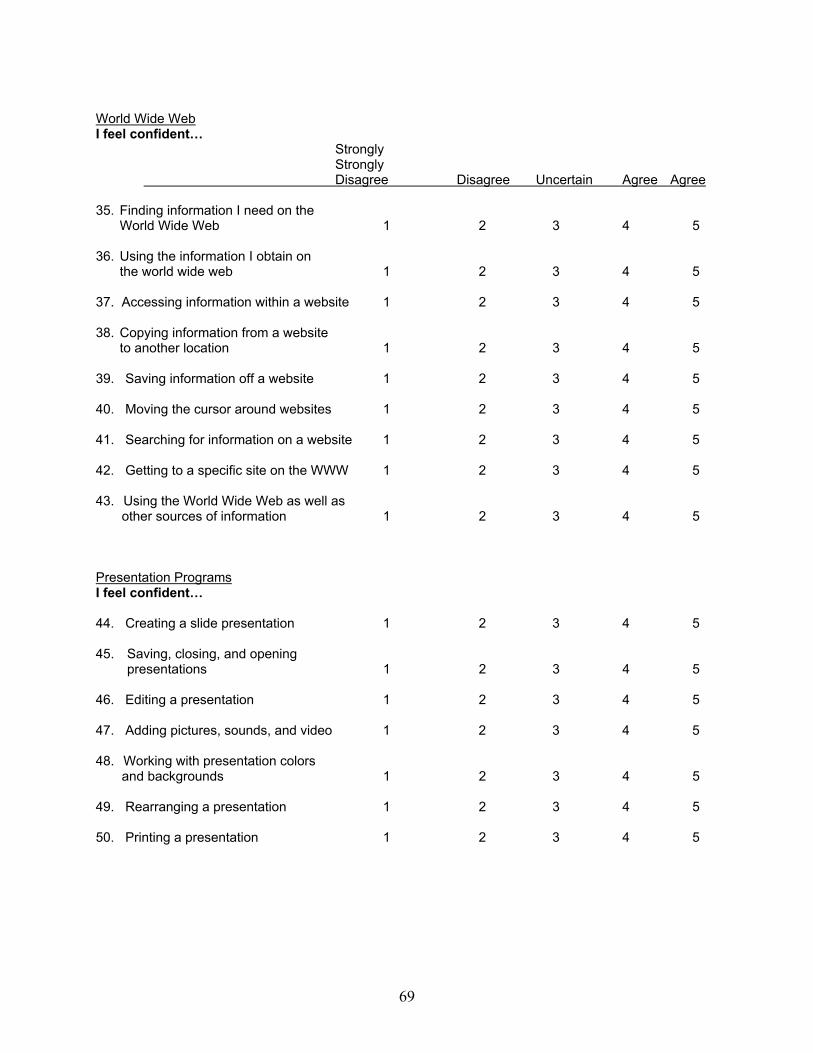
69
World Wide Web I feel confident…
Strongly Strongly
Disagree Disagree Uncertain Agree Agree
35. Finding information I need on the World Wide Web 1 2 3 4 5
36. Using the information I obtain on
the world wide web 1 2 3 4 5 37. Accessing information within a website 1 2 3 4 5 38. Copying information from a website
to another location 1 2 3 4 5 39. Saving information off a website 1 2 3 4 5 40. Moving the cursor around websites 1 2 3 4 5 41. Searching for information on a website 1 2 3 4 5 42. Getting to a specific site on the WWW 1 2 3 4 5 43. Using the World Wide Web as well as
other sources of information 1 2 3 4 5 Presentation Programs I feel confident… 44. Creating a slide presentation 1 2 3 4 5 45. Saving, closing, and opening
presentations 1 2 3 4 5 46. Editing a presentation 1 2 3 4 5 47. Adding pictures, sounds, and video 1 2 3 4 5 48. Working with presentation colors
and backgrounds 1 2 3 4 5 49. Rearranging a presentation 1 2 3 4 5 50. Printing a presentation 1 2 3 4 5

70
APPENDIX C
Preservice Teacher Software Integration Confidence Scale

71
PRESERVICE TEACHER SOFTWARE INTEGRATION CONFIDENCE SCALE
After reading each statement, please indicate the extent to which you agree or
disagree by circling the number to the right of each sentence. Please respond to all
statements. Your responses should reflect your current level of appraisal with the
activity described in each statement. For example:
Strongly Strongly I feel confident instructing students with…Disagree Disagree Uncertain Agree Agree
Ex. Student-generated PowerPoint presentations 1 2 3 4 5 By circling number 4 you indicate that you have some confidence in your ability
to integrate this technology into your lessons with students. Spreadsheet Integration Confidence I feel confident integrating into my mathematics instruction…
Strongly Strongly Disagree Disagree Uncertain Agree Agree
1. Lessons that require students to use
spreadsheet software to graph math problem solutions. 1 2 3 4 5
2. Lessons that ask students to use spreadsheet software as they problem- solve math problems. 1 2 3 4 5
3. Student-directed organization, construction,
and merging of spreadsheet files. 1 2 3 4 5 4. Lessons that require students to use
spreadsheet software to calculate formula math information. 1 2 3 4 5

72
Database Integration Confidence I feel confident integrating into my mathematics instruction…
Strongly Strongly Disagree Disagree Uncertain Agree Agree
5. Lessons that require students to use
database software to organize data. 1 2 3 4 5 6. Lessons that ask students to use database
software to organize financial records. 1 2 3 4 5 7. Student use of database software to
analyze data. 1 2 3 4 5 8. Student-directed use of database software
to organize a directory of information. 1 2 3 4 5 9. Student-directed merging of data from
a spreadsheet software file into a database software file. 1 2 3 4 5
10. Student-directed creating of database
Fields 1 2 3 4 5

73
APPENDIX D
Lesson Plan Technology Infusion/Integration Scale
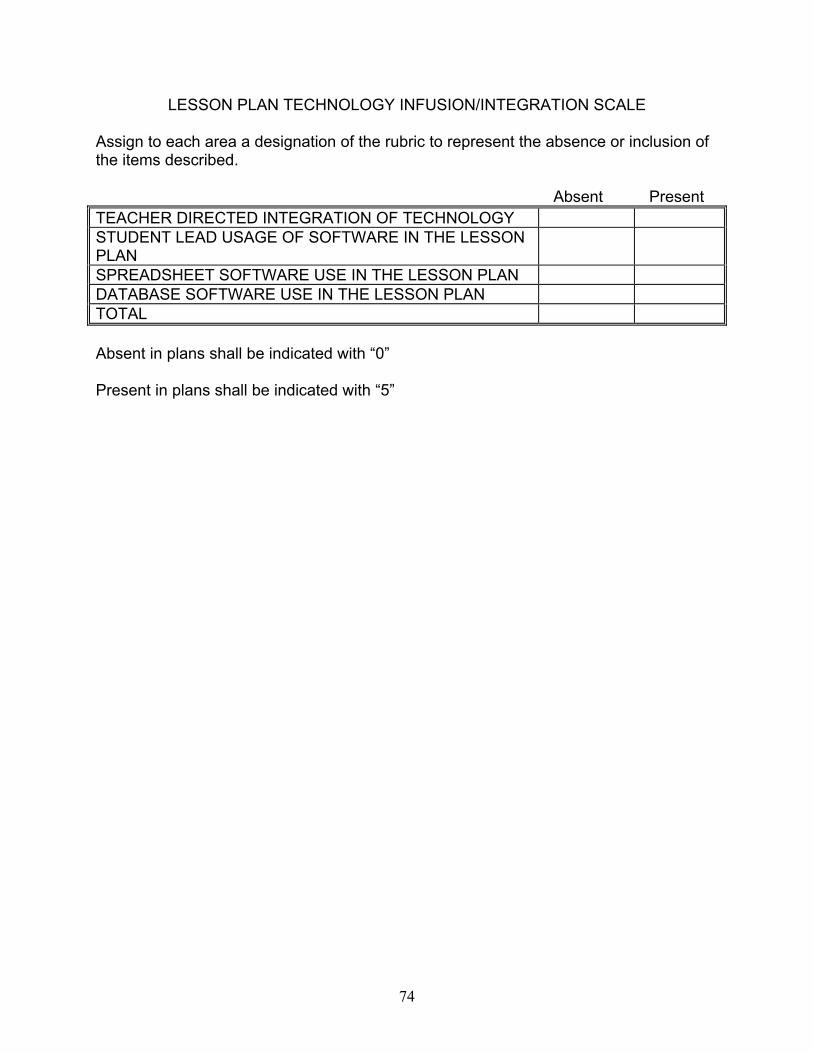
74
LESSON PLAN TECHNOLOGY INFUSION/INTEGRATION SCALE Assign to each area a designation of the rubric to represent the absence or inclusion of the items described. Absent Present TEACHER DIRECTED INTEGRATION OF TECHNOLOGY STUDENT LEAD USAGE OF SOFTWARE IN THE LESSON PLAN
SPREADSHEET SOFTWARE USE IN THE LESSON PLAN DATABASE SOFTWARE USE IN THE LESSON PLAN TOTAL Absent in plans shall be indicated with “0” Present in plans shall be indicated with “5”

75
APPENDIX E
Experimental Group Course Syllabus

76
EXPERIMENTAL GROUP COURSE SYLLABUS
EDEE 4350 Mathematics For The Elementary School
Teacher Education and Administration Bob Maninger Class Meets NWISD – Thursdays 12:00 – 2:50 Texts Kennedy, L. & Tipps, S. (2000). Guiding children’s learning of mathematics. 9th Edition. Boston: Wadsworth Publishing. www.sbec.state.tx.us
http://www.tea.state.tx.us Course Description The purpose of this course is to provide knowledge and skills in elementary mathematics instructional methodology and to provide a context for understanding, through an examination of the national standards in mathematics and TEKS. Course Requirements and the Final Course Grade The instructor reserves the right to change course assignments, projects, and examinations throughout the semester. Each assignment/project must be completed and turned in by the due date given. If you are absent on a due date, the assignment/project must be turned in on the day you return to class. Late assignments will be subject to a point reduction or non-acceptance at the instructor’s discretion. Class attendance and participation will be considered in assigning the final course grade (3 absences = drop 1 letter grade, 4 or more = F for the course). It is expected that all assignments, projects, and examinations will be completed at the mastery level (as designated by the instructor). If in the opinion of the instructor an assignment/project is not satisfactory it may be returned to the student and the student may be required to re-do the work until it is an acceptable level of mastery. If any work is not completed at the mastery level by the end of the course the instructor reserves the right to give the student an “I” or and “F” at his discretion. ADA Policy on Auxiliary Aids and Reasonable Accommodation The College of Education does not discriminate on the basis of disability in the recruitment and employment of faculty and staff, and the operation of any of its programs and activities, as specified by federal laws and regulations. Copies of the College of Education ADA Compliance Document are available from Dr. XXX the ADA liaison for TE.

77
Policy on Cheating and Plagiarism The Code of Student Conduct and Discipline provides penalties for misconduct by students, including academic dishonesty. Academic dishonesty includes cheating and plagiarism. The term “cheating” includes, but is not limited to, (1) use of any unauthorized assistance in taking quizzes, tests, or examinations; (2) dependence upon the aid of sources beyond those authorized by the instructor in writing papers, preparing reports, solving problems, or carrying out other assignments; or (3) the acquisition without permission, of tests, or other academic material belonging to a faculty or staff member of the university. The term “plagiarism” includes, but is not limited to the use by paraphrase or direct quotation, of the published or unpublished work of another person without full and clear acknowledgement. It also includes the unacknowledged use of materials prepared by another person or agency engaged in the selling of term papers or other academic materials. If you engage in academic dishonesty related to this class you will receive a failing grade on the test or assignment and a failing grade in the course. In addition, the case will be referred to the Dean of Students for appropriate disciplinary action. Course Requirements
1. Carefully read the required text and any required supplementary materials. Be prepared prior to class for in-class discussion of readings.
2. Mathematics Notebook – 60% of final grade. Half presented October 10.
Final and total project presented the week before finals (Dec 5). Instructor will provide further instructions.
3. Internet Lesson Plan / e-mail – 10% of final grade. Using a designed step-by-
step guide you will search out math lesson plans on the Internet and email results to me. (Sept 5)
4. PowerPoint Presentation of Textbook Analysis – 30% of final grade. Small
group project to present to the class your combined evaluation of a current math textbook. More specifics from the instructor. ( Nov 21/Dec 5)
The course grade will be based on class attendance and participation, and assigned activities. The course grade is based on your percentage of the total possible points. To receive maximum points on assignments, please consider maximum to be the equivalent of the grade of A+, which means exceptional work. Simply meeting minimal requirements will equate to a B or C grade.
Grading scale: 90-100%= A, 80-89%= B, 70-79%= C. Attendance Policy Students are expected to be in attendance for all class meetings and practicum days. Late papers will be accepted only under extreme circumstances. Each late assignment will receive a reduction in points of 20% per each class day late. Exams may be taken late only in extreme circumstances. Please consider yourselves professionals and act accordingly. Absence and tardiness will be considered in the final calculation of the

78
course grade. This course syllabus is not a contract and may be altered at the discretion of the instructor. Students will be given reasonable notice of any changes.
SCHEDULE OF EVENTS This schedule is a framework and will likely change
WEEK CLASS ACTIVITIES ITEMS DUE Aug 29 Course Overview Sep 5 Standards (Ch1) Internet Plan Sep 12 Problem Solving (Ch2) Sep 19 Numbers, Place Value (Ch6) Sep 26 Addition / Subtraction (Ch7) Oct 3 Multiplication / Division (Ch8) Oct 10 Geometry (Ch9) First ½ Notebook Oct 17 Fractions !!! (Ch10) Oct 24 TCET PRESENTATIONS Oct 31 TCET PRESENTATIONS Nov 7 Ratio, Percentage, and proportion (Ch11) Nov 14 Measurements (Ch12) Nov 21 Data Collection (Ch13) PPT Presentations Nov 28 NO CLASS – THANKSGIVING BREAK Dec 5 PPT Presentations Dec 12 Notebooks Presented During Class

79
MATHEMATICS NOTEBOOK
The notebook serves as a comprehensive demonstration of your progress in teaching mathematics. It will contain a variety of evidence and examples of your knowledge and implementation of mathematics strategies tied to TEKS and NCTM. The first five sections will be due October 10. The completed notebook, all ten sections will be due December 5. The notebook should be organized in the following sections: I. Standards II. Problem Solving III. Numbers, Place Value IV. Addition / Subtraction V. Multiplication / Subtraction VI. Geometry VII. Fractions VIII. Ratio, Percentage, Proportion IX. Measurement X. Data Collection Each of the TEN SECTIONS should include: I. Chapter Summary II. Class notes, activities, and any handouts III. Article critique IV. Planned Lesson with technology integration of some kind V. Reflection of the week of class Explanations Chapter Summary – summarize each textbook chapter as follows:
• Identify five (5) new ideas unfamiliar to yourself – complete sentences • Identify three (3) key concepts covered – complete sentences • Align ten (10) activities in the chapter (blue boxes) with TEKS (activity
#, grade level, TEKS identification) Article Critique
Research an article about the subject matter in the chapter. No more than two (2) pages, one page of explanation of the article including the author’s main ideas and one page of personal reflection. Use APA style to document references. Include a copy of the article.

80
Lesson Plans Must include: Objectives, activities (including a brief description of the
entire lesson), list of materials, and TEKS.
PowerPoint Presentation of Textbook Analysis A mathematics textbook teacher edition will be studied, analyzed, assessed, and reported for recommendation or non-recommendation using the guidelines below. There will be some group work allowed to discuss and bounce around ideas, but EACH STUDENT WILL prepare a 5 – 7 minute PowerPoint presentation to report the final analysis. The analysis must include all of the items listed below, obviously in your PPT presentation you will need to combine appropriate topics on single slides. The PPT should be about 5 – 10 slides. Does the selected text comply with current NCTM standards? Why or why not? Make a recommendation for or against the textbook based on the criteria. The final report is a “pretend” report to a school district committee that is making textbook recommendations to the local school board. These reports will be done beginning November 21 unless otherwise decided by the instructor. You need to provide the instructor with a “handouts (6 slides per page)” copy of the PowerPoint and any other pertinent information. COMPONENTS Find the following components and determine the level of inclusion of each component. • NCTM Principles and Standards for School Mathematics • TEKS • TAAS / Standardized testing formatted activities • Problem Solving Strategies • Rote Learning / Worksheets • Assessment Instruments • Interdisciplinary Connections • Use of manipulatives – which ones and how often • Alternative approaches to instruction (ESL, GT, SPED) • Hands-on learning opportunities for learners • Teacher supplemental materials • Technology Integration

81
APPENDIX F
Control Group Course Syllabus

82
CONTROL GROUP COURSE SYLLABUS
EDEE 4350 Mathematics For The Elementary School
Teacher Education and Administration Bob Maninger Class Meets CES – Wednesdays 12:30 – 3:20 Texts Kennedy, L. & Tipps, S. (2000). Guiding children’s learning of mathematics. 9th Edition. Boston: Wadsworth Publishing. www.sbec.state.tx.us
http://www.tea.state.tx.us Course Description The purpose of this course is to provide knowledge and skills in elementary mathematics instructional methodology and to provide a context for understanding, through an examination of the national standards in mathematics and TEKS. Course Requirements and the Final Course Grade The instructor reserves the right to change course assignments, projects, and examinations throughout the semester. Each assignment/project must be completed and turned in by the due date given. If you are absent on a due date, the assignment/project must be turned in on the day you return to class. Late assignments will be subject to a point reduction or non-acceptance at the instructor’s discretion. Class attendance and participation will be considered in assigning the final course grade (3 absences = drop 1 letter grade, 4 or more = F for the course). It is expected that all assignments, projects, and examinations will be completed at the mastery level (as designated by the instructor). If in the opinion of the instructor an assignment/project is not satisfactory it may be returned to the student and the student may be required to re-do the work until it is an acceptable level of mastery. If any work is not completed at the mastery level by the end of the course the instructor reserves the right to give the student an “I” or and “F” at his discretion. ADA Policy on Auxiliary Aids and Reasonable Accommodation The College of Education does not discriminate on the basis of disability in the recruitment and employment of faculty and staff, and the operation of any of its programs and activities, as specified by federal laws and regulations. Copies of the College of Education ADA Compliance Document are available from Dr. XXXX the ADA liaison for TE.
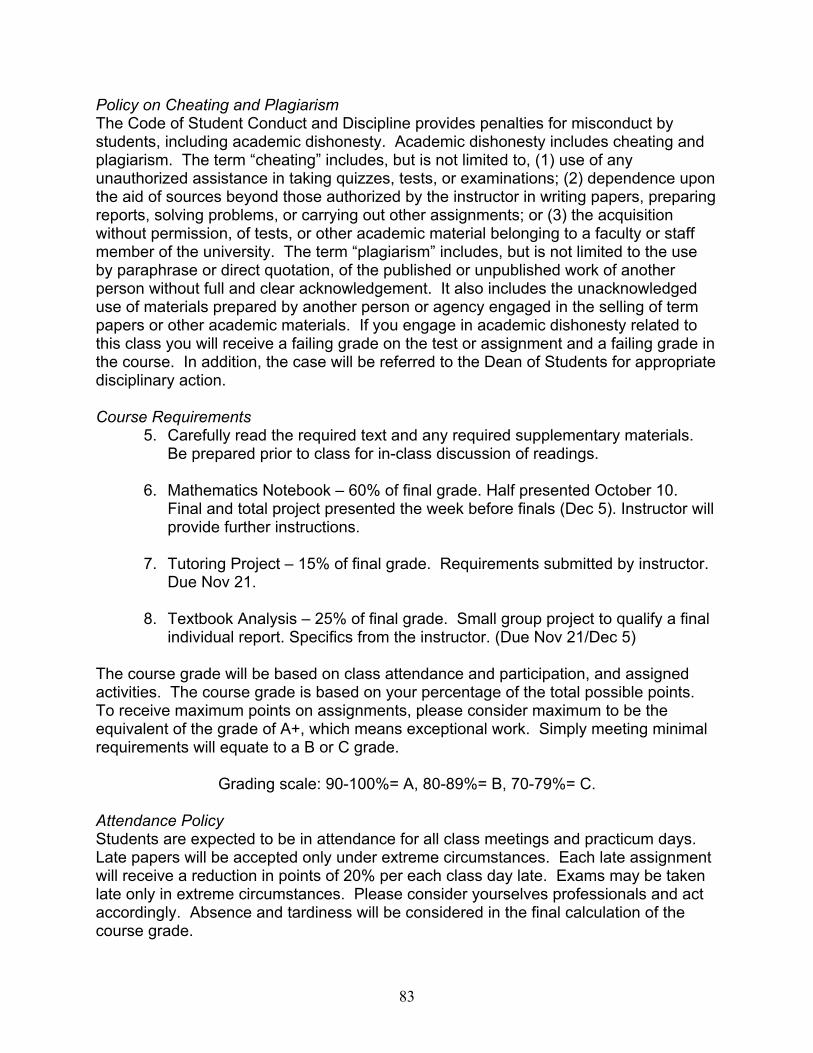
83
Policy on Cheating and Plagiarism The Code of Student Conduct and Discipline provides penalties for misconduct by students, including academic dishonesty. Academic dishonesty includes cheating and plagiarism. The term “cheating” includes, but is not limited to, (1) use of any unauthorized assistance in taking quizzes, tests, or examinations; (2) dependence upon the aid of sources beyond those authorized by the instructor in writing papers, preparing reports, solving problems, or carrying out other assignments; or (3) the acquisition without permission, of tests, or other academic material belonging to a faculty or staff member of the university. The term “plagiarism” includes, but is not limited to the use by paraphrase or direct quotation, of the published or unpublished work of another person without full and clear acknowledgement. It also includes the unacknowledged use of materials prepared by another person or agency engaged in the selling of term papers or other academic materials. If you engage in academic dishonesty related to this class you will receive a failing grade on the test or assignment and a failing grade in the course. In addition, the case will be referred to the Dean of Students for appropriate disciplinary action. Course Requirements
5. Carefully read the required text and any required supplementary materials. Be prepared prior to class for in-class discussion of readings.
6. Mathematics Notebook – 60% of final grade. Half presented October 10.
Final and total project presented the week before finals (Dec 5). Instructor will provide further instructions.
7. Tutoring Project – 15% of final grade. Requirements submitted by instructor.
Due Nov 21.
8. Textbook Analysis – 25% of final grade. Small group project to qualify a final individual report. Specifics from the instructor. (Due Nov 21/Dec 5)
The course grade will be based on class attendance and participation, and assigned activities. The course grade is based on your percentage of the total possible points. To receive maximum points on assignments, please consider maximum to be the equivalent of the grade of A+, which means exceptional work. Simply meeting minimal requirements will equate to a B or C grade.
Grading scale: 90-100%= A, 80-89%= B, 70-79%= C. Attendance Policy Students are expected to be in attendance for all class meetings and practicum days. Late papers will be accepted only under extreme circumstances. Each late assignment will receive a reduction in points of 20% per each class day late. Exams may be taken late only in extreme circumstances. Please consider yourselves professionals and act accordingly. Absence and tardiness will be considered in the final calculation of the course grade.

84
This course syllabus is not a contract and may be altered at the discretion of the instructor. Students will be given reasonable notice of any changes.
SCHEDULE OF EVENTS This schedule is a framework and will likely change
WEEK CLASS ACTIVITIES ITEMS DUE Aug 28 Course Overview Sep 4 Standards (Ch1) Sep 11 Problem Solving (Ch2) Sep 18 Numbers, Place Value (Ch6) Sep 25 Addition / Subtraction (Ch7) Oct 2 Multiplication / Division (Ch8) Oct 9 Geometry (Ch9) First ½ Notebook Oct 16 Fractions !!! (Ch10) Oct 23 Teaching and Learning Mathematics (if time) Oct 30 NO CLASS (Individual time to work on projects) Nov 6 Ratio, Percentage, and proportion (Ch11) Nov 13 Measurements (Ch12) Nov 20 Data Collection (Ch13) Tutoring Project Nov 27 NO CLASS – THANKSGIVING BREAK Dec 4 Notebooks Presented During Class… Textbook Analysis Dec 11 Notebooks Presented During Class…

85
MATHEMATICS NOTEBOOK
The notebook serves as a comprehensive demonstration of your progress in teaching mathematics. It will contain a variety of evidence and examples of your knowledge and implementation of mathematics strategies tied to TEKS and NCTM. The first five sections will be due October 10. The completed notebook, all ten sections will be due December 5. The notebook should be organized in the following sections: XI. Standards XII. Problem Solving XIII. Numbers, Place Value XIV. Addition / Subtraction XV. Multiplication / Subtraction XVI. Geometry XVII. Fractions XVIII. Ratio, Percentage, Proportion XIX. Measurement XX. Data Collection Each of the TEN SECTIONS should include: VI. Chapter Summary VII. Class notes, activities, and any handouts VIII. Article critique IX. Planned Lesson with activities X. Reflection of the week of class Explanations Chapter Summary – summarize each textbook chapter as follows:
• Identify five (5) new ideas unfamiliar to yourself – complete sentences • Identify three (3) key concepts covered – complete sentences • Align ten (10) activities in the chapter (blue boxes) with TEKS (activity
#, grade level, TEKS identification) Article Critique
Research an article about the subject matter in the chapter. No more than two (2) pages, one page of explanation of the article including the author’s main ideas and one page of personal reflection. Use APA style to document references. Include a copy of the article.
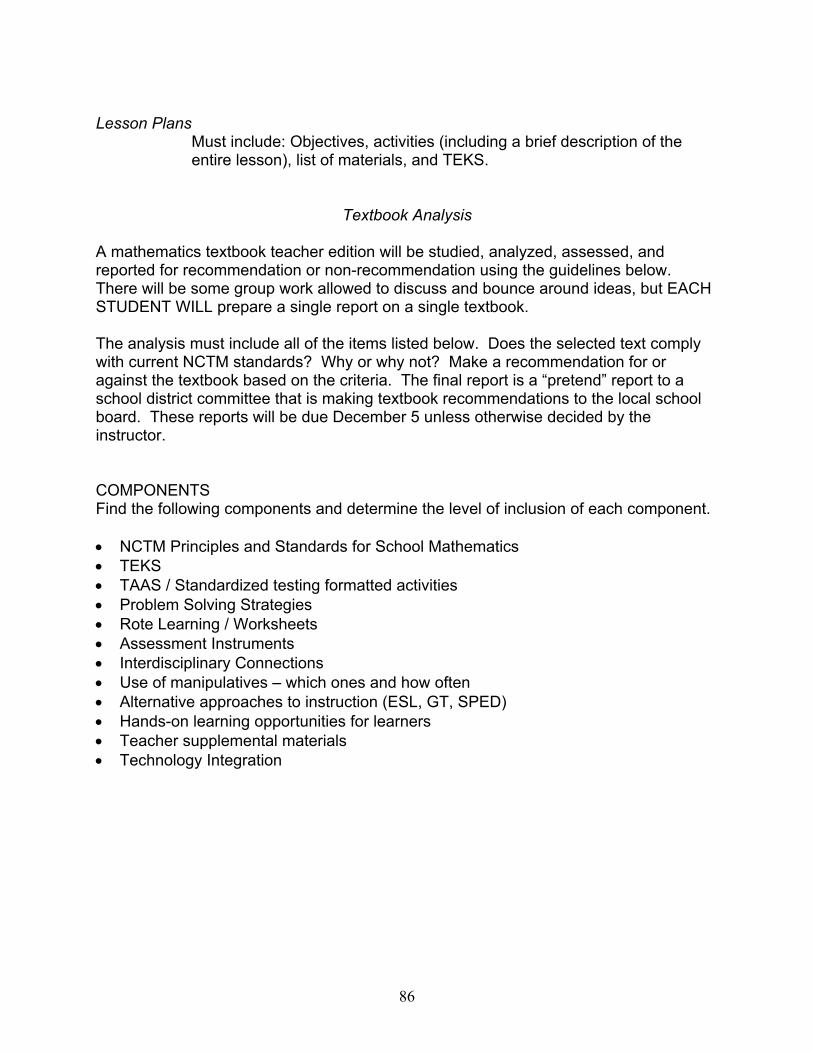
86
Lesson Plans Must include: Objectives, activities (including a brief description of the
entire lesson), list of materials, and TEKS.
Textbook Analysis A mathematics textbook teacher edition will be studied, analyzed, assessed, and reported for recommendation or non-recommendation using the guidelines below. There will be some group work allowed to discuss and bounce around ideas, but EACH STUDENT WILL prepare a single report on a single textbook. The analysis must include all of the items listed below. Does the selected text comply with current NCTM standards? Why or why not? Make a recommendation for or against the textbook based on the criteria. The final report is a “pretend” report to a school district committee that is making textbook recommendations to the local school board. These reports will be due December 5 unless otherwise decided by the instructor. COMPONENTS Find the following components and determine the level of inclusion of each component. • NCTM Principles and Standards for School Mathematics • TEKS • TAAS / Standardized testing formatted activities • Problem Solving Strategies • Rote Learning / Worksheets • Assessment Instruments • Interdisciplinary Connections • Use of manipulatives – which ones and how often • Alternative approaches to instruction (ESL, GT, SPED) • Hands-on learning opportunities for learners • Teacher supplemental materials • Technology Integration

87
TUTORING PROJECT
You will need to find a student in need of mathematics support. This project will require you to spend at least 10+ hours with at least 1+ student(s). Tutoring may take place in an official school setting, or may take place informally elsewhere. You will report on what you do to improve the student’s mathematical knowledge, skill, and attitude. The reporting document should include a time log, reflection on experiences (limit 2 pages), planning, assessment, student work samples, and anything else pertinent to the time you spend together. This is not a time for drill and skill, but a time to improve a students overall performance and attitude towards mathematics. This project will be due November 20. Criteria for Success Not Excellent spresent Project demonstrates development of effective teaching and assessment techniques representing TEKS and NCTM and program goals.
1
2
3
4
Demonstration of organization / management techniques and attention to individualism and specific student needs.
1
2
3
4
Project reflections demonstrate student growth in learning
1
2
3
4
Project reflections demonstrates understanding ways to motivate and challenges the student
1
2
3
4
Demonstration of a variety of instructional activities
1
2
3
4

88
APPENDIX G
Technology Leadership Institute Agenda

89
TECHNOLOGY LEADERSHIP INSTITUTE
SPREADSHEET AND DATABASE AGENDA
October 24 and 31, 2001
Linda Hodges, Ed. D.
October 24
• Introductions
• Demonstration of key functions of spreadsheet software
• Preservice teachers to the computer lab for hands-on activities
• Demonstration of one-computer classroom activity in regular classroom
• Wrap up discussion and questions on spreadsheet software
October 31
• Demonstration of key functions of database software
• Demonstrate model database
• Preservice teachers to the computer lab for hands-on activities
• Wrap up discussion and questions on database software

90
REFERENCES Abbott, J. A., & Farris, S. E. (2000). Integrating technology into preservice literacy
instruction: A survey of elementary education students’ attitudes toward
computers. Journal of Research on Computing in Education, 33(2), 149-61.
Bandura, A. (1986). Social foundations of thought and action. Englewood Cliffs, NJ:
Prentice-Hall.
Beaudrie, B. (2001, March). Prospective k-6 educators attitudes about technology.
paper presented at the Society for Information Technology and Teacher
Education International Conference, Orlando, FL.
Brown, C. A. (2001, April). Utilization, knowledge levels, and instructional application of
technology for teacher education faculty. Paper presented at the American
Educational Research Association, Seattle, WA.
Cavey, L., & Barnes, T. (2001, March). Mathematics: Mathematics teachers on track
with technology. Paper presented at the Society for Information Technology and
Teacher Education International Conference, Orlando, FL.
Eldridge, D. (2001). Confessions of a technology integrator: They thought I was out to
get them. Reading Research and Instruction, 40, 233-42.
Gay, L. R., & Airasian, P. (2000). Educational research: Competencies for analysis and
application. Upper Saddle River, NJ: Prentice-Hall.
Gunter, G. A. (2001). Making a difference: Using emerging technologies and teaching
strategies to restructure an undergraduate technology course for pre-service
teachers. Educational Media International, 38(1), 13-20.

91
Handler, M. (1993). Preparing new teachers to use computer technology: Perceptions
and suggestions for teacher educators. Computers and Education, 20(2), 147-
156.
Hill, R. B., & Somers, J. A. (1996). A process for initiating change: Developing
technology goals for a college education. Journal of Teacher Education, 47,
300-306.
International Society for Technology in Education (ISTE) Accreditation Committee
(1991). Accreditation Standards for Educational Computing and Technology
Preparation Programs. Eugene, OR.
Jensen, K. (2001, March). Teaching technology with technology: How one
faculty member is integrating into his pre-service mathematics methods classes.
Paper presented at the Society for Information Technology and Teacher
Education International Conference, Orlando, FL.
Laffey, J., & Musser, D. (1998). Attitudes of preservice teachers about using technology
in teaching. Journal of Technology and Teacher Education, 6(4), 223-41.
Lan, J. J. (1997, February). Meeting technology challenges in teacher education:
Responses from schools and colleges of education. Paper presented at
American Association of Colleges for Teacher Education, Phoenix, AZ.
Laney, J. D., Moseley, P. A., & Pak, L. K. (1996). Children’s ideas about selected art
and economic concepts before and after an integrated unit of instruction.
Children’s Social and Economics education, 1(1), 61-78.
Milken Exchange on Education Technology (1999). Will new teachers be prepared to
teach in a digital age? A national survey on information technology in teacher

92
education. Santa Monica, CA.
McCoy, A. H. (1999). Integration of technology into higher education teacher
preparation programs. Northwest Educational Technology Consortium/Northwest
Regional Educational Laboratory.
Murphy C. A., Coover, D., & Owen, S. V. (1989). Development and validation of the
computer self-efficacy scale. Educational and Psychological Measurement, 49,
893-899.
National Council for Accreditation of Teacher Education (NCATE) (1995). Standards,
procedures, and policies for the accreditation of professional education units.
Washington DC.
Northrup, P. T., & Little, W. (1996). Establishing instructional technology benchmarks
for teacher preparation programs. Journal of Teacher Education, 47, 213-222.
Quinn, R. (1998). Technology: Preservice teachers’ beliefs and the influence of a
mathematics methods course. Clearing House, 71(6), 375-77.
Ropp, M. (1999). Exploring individual characteristics associated with learning to use
computers in pre-service teacher preparation. Journal of Research on Computing
in Education, 31, 402-24.
Schrum, L. and Dehoney, J. (1998). Meeting the future: A teacher education program
joins the information age. Journal of Technology and Teacher Education, 6, 23-
37.
Stuhlmann, J. (1998). A model for infusing technology into teacher training programs.
Journal of Technology and Teacher Education, 6(2/3), 125-139.

93
Vannatta, R. A. (2000). Evaluation to planning: Technology integration in a school
of education. Journal of Technology and Teacher Education, 8(3), 231-246.
Willis, E. (1997). Technology: Integrated into, not added onto, the curriculum
experiences in pre-service teacher education. Computers in the Schools, 13
(1-2), 141-53.