The Effects of Sintering Parameter to the Microstructure ...ajbasweb.com/old/ajbas/2013/Special,...
16
Australian Journal of Basic and Applied Sciences, 7(5): 350-365, 2013 ISSN 1991-8178 Corresponding Author: M.Z Bukhari, School of Materials Engineering, Universiti Malaysia Perlis (UniMAP), 02600 Jejawi, Perlis, Malaysia E-mail: [email protected] 350 The Effects of Sintering Parameter to the Microstructure and Thermal Properties of CuSiC Composite for Electronic Packaging Application 1,2 M.Z Bukhari, 2 M.S.J Hashmi, 2 D. Brabazon 1 School of Materials Engineering, Universiti Malaysia Perlis (UniMAP), 02600 Jejawi, Perlis, Malaysia 2 School of Mechanical and Manufacturing Engineering, Dublin City University (DCU), Dublin 9, Republic of Ireland Abstract: Microelectronics and nano-electronics play a prominent role in current technologies and will do so to a greater extent in the future. The availability of suitable new materials for the electronic packaging is critical to the continuing advancement (miniaturisation and integration) of electronic components. As matter of fact, a plethora of new products/processes have been brought-in over the last few years. Much of the materials and microstructure research related to packaging has involved investigation toward better thermal management. Miniaturisation of electronic chips which have increasing functionality within the same package size has inducedsignificant increases in requirements for extraction of heat from the integrated circuit (IC). Packaging materials therefore have to be capable to conduct heat efficiently and at the same time have low coefficient of thermal expansion (CTE) to minimize the thermal stress and warping. Since copper (Cu) is a better thermal conductor than aluminium (Al), therefore, copper should be the best candidate as thermal material. With the presence of silicon carbide (SiC) as reinforcement, copper silicon carbide (CuSiC) metal matrix composite (MMC) should be able to perform better as a heat spreader or a heat sink than aluminium silicon carbide (AlSiC) metal matrix composite. In the present study, the focus was toward development of light weight metal matrix composite with high ceramic contents, good thermal dissipation and easy of processability. Copper silicon carbide was chosen as the material basis for focused investigation to solve thermal management problems presented by current IC systems. Powder metallurgy routes were chosen to fabricate the MMC based on this materials system. Copper and silicon carbide powders were mixed together in a planetary ball mill, and the green articles were then compacted and sintered to produce the final product of CuSiC. The effects of sintering parameters were investigated for their effects towards the produced composite density, porosity and specific heat capacity. Sintering parameters investigated included temperature, heating duration and the gaseous environment. Upon sintering, the CuSiC particle bond to one another giving a higher strength and a possibility in attaining desirable density. The higher in density and the lower in porosity of the CuSiC composite, will create a low specific heat capacity characteristic which is closer to the specific heat capacity of pure copper (Cu). Thus to achieve the lower specific heat capacity, the amount of porosity in the CuSiC composite must be minimized through the optimization of the sintering parameters.Finally in a nutshell, in order to boost the specific heat capacity of the CuSiC, the recommended sintering parameter suggests that the CuSiC composite should be sintered at 950 o C for seven hours in nitrogen gas. Key words: Microelectronics, nano-electronics, electronic packaging, electronics component, thermal management, integrated circuit, packaging materials, coefficient of thermal expansion, copper, aluminium, silicon carbide, aluminium silicon carbide, copper silicon carbide, metal matrix composite, powder metallurgy, sintering, specific heat capacity. INTRODUCTION Nowadays consumers demand smaller, slimmer and reliable electronics. As a result, to meet these demands, manufacturers have been pushed to the limit in developing enhanced and improved electronic packages. Improvements have related to aspects of high density packaging, miniaturisation of the electronic chips with increasing speed, enhanced thermal properties and increased reliability which have resulted in the scenario of severe thermal management issues. In the aspect of thermal management, the primary driver of today’s integrated circuit technology is shrinking feature size and increasing functionality on-chip with their associated high heat flux and large temperature gradient. Due to these problems, electronics packaging designers and engineers have to work hard to design the universal thermal materials that are able to conduct heat efficiently
Transcript of The Effects of Sintering Parameter to the Microstructure ...ajbasweb.com/old/ajbas/2013/Special,...
Australian Journal of Basic and Applied Sciences, 7(5): 350-365, 2013 ISSN 1991-8178
Corresponding Author: M.Z Bukhari, School of Materials Engineering, Universiti Malaysia Perlis (UniMAP), 02600 Jejawi, Perlis, Malaysia E-mail: [email protected]
350
The Effects of Sintering Parameter to the Microstructure and Thermal Properties of CuSiC Composite for Electronic Packaging Application
1,2M.Z Bukhari, 2M.S.J Hashmi, 2D. Brabazon
1School of Materials Engineering, Universiti Malaysia Perlis (UniMAP), 02600 Jejawi, Perlis, Malaysia
2School of Mechanical and Manufacturing Engineering, Dublin City University (DCU), Dublin 9, Republic of Ireland
Abstract: Microelectronics and nano-electronics play a prominent role in current technologies and will do so to a greater extent in the future. The availability of suitable new materials for the electronic packaging is critical to the continuing advancement (miniaturisation and integration) of electronic components. As matter of fact, a plethora of new products/processes have been brought-in over the last few years. Much of the materials and microstructure research related to packaging has involved investigation toward better thermal management. Miniaturisation of electronic chips which have increasing functionality within the same package size has inducedsignificant increases in requirements for extraction of heat from the integrated circuit (IC). Packaging materials therefore have to be capable to conduct heat efficiently and at the same time have low coefficient of thermal expansion (CTE) to minimize the thermal stress and warping. Since copper (Cu) is a better thermal conductor than aluminium (Al), therefore, copper should be the best candidate as thermal material. With the presence of silicon carbide (SiC) as reinforcement, copper silicon carbide (CuSiC) metal matrix composite (MMC) should be able to perform better as a heat spreader or a heat sink than aluminium silicon carbide (AlSiC) metal matrix composite. In the present study, the focus was toward development of light weight metal matrix composite with high ceramic contents, good thermal dissipation and easy of processability. Copper silicon carbide was chosen as the material basis for focused investigation to solve thermal management problems presented by current IC systems. Powder metallurgy routes were chosen to fabricate the MMC based on this materials system. Copper and silicon carbide powders were mixed together in a planetary ball mill, and the green articles were then compacted and sintered to produce the final product of CuSiC. The effects of sintering parameters were investigated for their effects towards the produced composite density, porosity and specific heat capacity. Sintering parameters investigated included temperature, heating duration and the gaseous environment. Upon sintering, the CuSiC particle bond to one another giving a higher strength and a possibility in attaining desirable density. The higher in density and the lower in porosity of the CuSiC composite, will create a low specific heat capacity characteristic which is closer to the specific heat capacity of pure copper (Cu). Thus to achieve the lower specific heat capacity, the amount of porosity in the CuSiC composite must be minimized through the optimization of the sintering parameters.Finally in a nutshell, in order to boost the specific heat capacity of the CuSiC, the recommended sintering parameter suggests that the CuSiC composite should be sintered at 950oC for seven hours in nitrogen gas. Key words: Microelectronics, nano-electronics, electronic packaging, electronics component, thermal
management, integrated circuit, packaging materials, coefficient of thermal expansion, copper, aluminium, silicon carbide, aluminium silicon carbide, copper silicon carbide, metal matrix composite, powder metallurgy, sintering, specific heat capacity.
INTRODUCTION
Nowadays consumers demand smaller, slimmer and reliable electronics. As a result, to meet these demands,
manufacturers have been pushed to the limit in developing enhanced and improved electronic packages. Improvements have related to aspects of high density packaging, miniaturisation of the electronic chips with increasing speed, enhanced thermal properties and increased reliability which have resulted in the scenario of severe thermal management issues. In the aspect of thermal management, the primary driver of today’s integrated circuit technology is shrinking feature size and increasing functionality on-chip with their associated high heat flux and large temperature gradient. Due to these problems, electronics packaging designers and engineers have to work hard to design the universal thermal materials that are able to conduct heat efficiently

Aust. J. Basic & Appl. Sci., 7(5): 350-365, 2013
351
and at the same time have low coefficient of thermal expansion (CTE) to minimize the thermal stress and warping.
In the past decade, Metal Matrix Composites (MMC’s) have come into prominence by offering significant improvements over their polymer matrix counterparts due to increase in tolerance of high temperature, transverse strength, chemical stability, hardness and wear resistance, with significantly greater toughness and ductility than ceramic matrix composites. In addition, MMCs are rapidly becoming prime candidates as structural material in engineering application. For example, aluminium reinforced by Al2O3 and SiO2 is used in the aerospace, aircraft and automotive industries because of its excellent thermo-physical properties such as low coefficient of thermal expansion (CTE), lower thermal capacity, and improved mechanical properties such as higher specific strength, better wear resistance, and specific modulus. Recently, metal/ceramic composites with high ceramic contents have become another focus for thermal management applications such as electronic packaging. The widespread use of these composites requires a deep understanding of their thermal expansion and some relative properties. For instance, the packaging materials in microelectronics should have low thermal capacity which inversely proportional to thermal conductivity in dissipating the heat, and low CTE to decrease the thermal expansion mismatch among the devices. Low and suitable CTE, together with lower specific heat capacity, can be achieved by blending appropriate metallic and ceramic phases to form a composite.
Despite many theoretical and experimental studies having been carried out on the subject of CTE of particle-reinforced MMC, few of them are directed toward the effect of particle surface coating on the thermal expansion behaviour and other characteristics of these composites. It was thus considered worthwhile to fabricate the copper-based ceramic-reinforced composites and to study their thermal capacity and thermal expansion characteristics. Copper silicon carbide (CuSiC) metal matrix composites have been widely studied for their excellent electrical conductivity, thermal conductivity, specific heat capacity and frictional properties; and these composites were mainly prepared by powder metallurgy routes which sintering was the dominant process. Typically, surface energy is accessed by the surface area. Smaller particles have high surface areas and more energy per unit volume which promotes faster sintering. With particles, there is an inherent driving force for mass flow, and the smaller particle size, the greater the driving force. The sintering stress is high with small powders, but sintering requires mass flow to respond to the inherent stress. When the temperature is raised and held for longer time, the atoms move faster and the stress direct to the flow. Similarly, two factors are important to mass transport in sintering which are stress (or force) and mobility.
The sintering stress is larger with smaller particles and higher surface areas, and the mobility increases with higher temperatures and longer duration. Heat provides the atomic motion that allows sintering in response to the sintering stress applied. It allows transport by plastic flow or viscous flow. Moreover, the sintering process of CuSiC is thermally activated, meaning that input energy is necessary for mass flow. Sintering is faster at higher temperature with longer sintering time because of the increased number of activated atoms and available sites. Thus, proven by the results, sintering temperature and time are dominant parameters in defining a sintering cycle of CuSiC composite. Besides, the sintering atmosphere influences sinter bonding and compact composition of CuSiC composite. Many materials including CuSiC prove unstable with high vapour pressure during sintering, so a protective atmosphere is selected to inhibit volatilization and loss of composition. During heating, the first task of sintering atmosphere is to assist in extracting surface contaminants and processing organics. The use of nitrogen and argon gases is keys to ensure proper sintered properties of CuSiC composite. Nitrogen is neutral in many situations. It is a very active agent in the sintering, because of its role in preserving the compound stoichiometry. Nitrogen is the major constituent of air and leads to nitrogen absorption at high temperatures. Argon, on the other hand, is an inert gas which is useful in sintering since it reduces evaporation and can be purified to high levels and results in some oxide reduction.
MATERIALS AND METHODS
The sintering parameters investigated included temperature, heating duration and the gaseous environment
towards the microstructure and thermal properties of the composite, in which the main goal is to produce composite with good density, low porosity and low specific heat capacity.
Raw Materials:
The constituent materials used in this study were in powder forms which are the copper and silicon carbide. Thecopper powder used (has a colour tone of light reddish brown) was in spheroidal shape and has particle size of <10 micron. The density of the copper powder used was 8.94 g/cm3, whilst the silicon carbide powder used (in pale grey colour) has mesh size up to 320 with density of 3.217 g/cm3.
Powder Preparation:
Thecomposite to be prepared should compriseof90 volume %of copperand10volume%ofsilicon carbide(90% Cu - 10% SiC). A correct portionofcopper(Cu) andsiliconcarbide(SiC) powder hastobe mixed,

prior to thmaterial wSiC contenduring the
Table1: Weig
%Volume Volume [cmWeight[g] Totalweigh
Tomix
decided.Thdiameteran1 cm3 as th
Procedure
In thissteps in the
Fig. 1: Th (M
Milling Pr
Basedprepared ais shown in
Table 2: 24 s
90%Cu10%Weight of cWeight of sTotal weigh
Each b
process, 10time of 30order to remjar by usinpowders thpowder wa
he next proceswith higher harnt, the harder powder pressin
ghtproportionforC
m3]
ht[g]
xthe powder ofhe weight propnd0.55cm thickhe volume form
es: s study, the Cue experiments w
he sequence ofMMC) producti
rocess: d on the weighand been dividen Table 2 below
samples of copper %SiC copper (Cu) silicon carbide (Siht
batch was calc00g of zirconia
0 minutes. Thismove any impng air gun. Onhat were weighas then proceed
Aust.
sses, in order trdness, therefothe samples wng and would c
CuandSiCpowder C01910
f copper andsilportion for Cuknessistargeted
mulation of a cy
uSiC composiwere indicated
f steps utilisedion
ht proportion fed into 8 batchw.
and silicon carbid
C)
culated to havea balls were ms was then follurity that may nce these conhted, been poud with milling
J. Basic & App
toensuretherighre 90%Cu 10%
would be. Besicause the moul
Cu .9 .08 .655 0.041
liconcarbide,thu and SiC powd. This make a ylindrical pelle
ite is producedd in the flow di
d in the powde
for Cu and Sihes where each
de prepared P901
e 28.965g of coilled in the jar lowed by a wabe collected. T
ntrol measures ured into the mprocess using
pl. Sci., 7(5): 350
htcomposition%SiCis the moides, high contld to be easily
hedesireddimenwder is shown
total volume oet.
d solely by poagram shown i
r metallurgy p
iC as shown ih batch contain
Per sample [g] 9.655 0.386
0.041
opper silicon cr together with ater cleansing The final step twere accomp
milling jar. Eahigh-energy p
0-365, 2013
n been achieveost suitable cotent of SiC wdamaged.
SiC 0.1 0.12 0.386
nsionand/or thin Table 1. In
of a pellet beco
owder metallurin Fig. 1.
process of CuS
in Table 1, Twned of 3 sample
carbide (CuSiCsand at the spand later on fotaken was the d
plished, then oach batch of coplanetaryball-m
ed.Since SiC wombination becould reduce th
e volumeofthenthis study, a ome 0.972cm3
rgy method. Th
SiC metal mat
wenty-four (24es named as A
24 samples [g] 231.720 9.264 240.984
C) powder. Prioeed of 450 rpmollowed by acedrying process
only the coppeopper silicon c
mill for 2 hours
was known ascause the highhe machinabili
e pellet shouldbpelletwith1.5cwhich is near
he sequences
rix composite
4) samples weA, B, and C. Th
or to the millinm, for a duratioetone rinsing, s of the balls aner (Cu) and Sicarbide (CuSiCs and 40 minut
a her ity
be cm to
of
ere his
ng on in nd iC C) tes
Aust. J. Basic & Appl. Sci., 7(5): 350-365, 2013
353
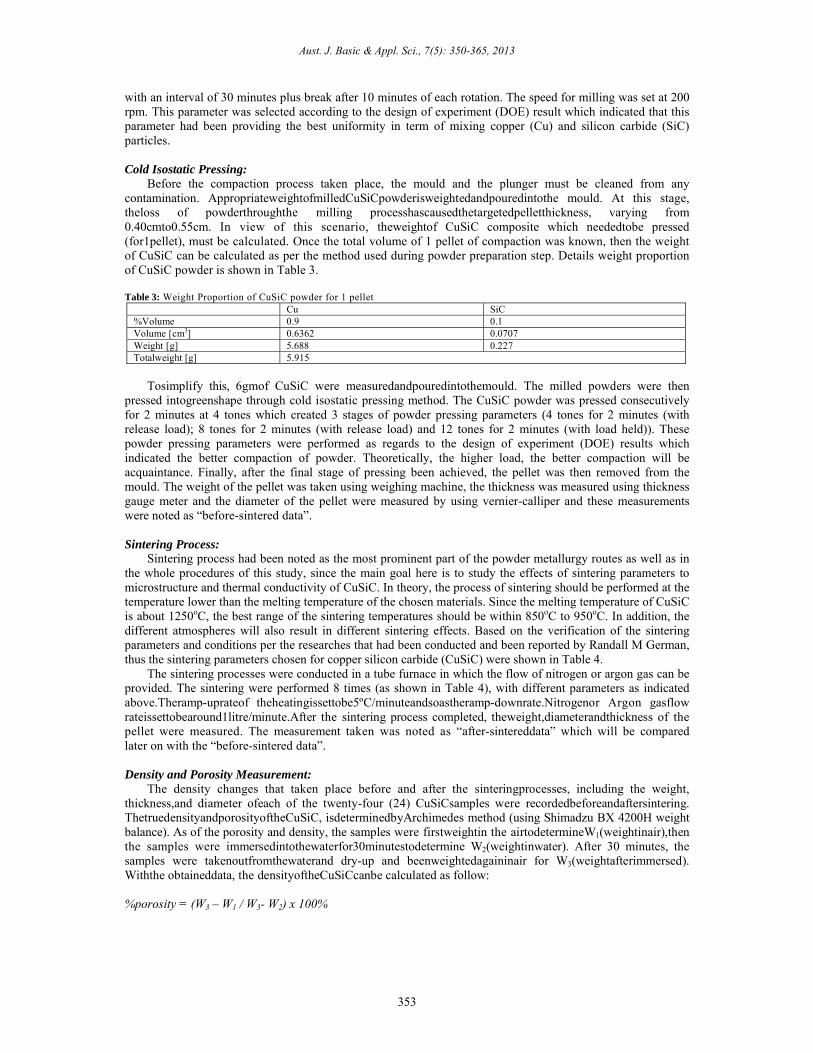
with an interval of 30 minutes plus break after 10 minutes of each rotation. The speed for milling was set at 200 rpm. This parameter was selected according to the design of experiment (DOE) result which indicated that this parameter had been providing the best uniformity in term of mixing copper (Cu) and silicon carbide (SiC) particles.
Cold Isostatic Pressing:
Before the compaction process taken place, the mould and the plunger must be cleaned from any contamination. AppropriateweightofmilledCuSiCpowderisweightedandpouredintothe mould. At this stage, theloss of powderthroughthe milling processhascausedthetargetedpelletthickness, varying from 0.40cmto0.55cm. In view of this scenario, theweightof CuSiC composite which neededtobe pressed (for1pellet), must be calculated. Once the total volume of 1 pellet of compaction was known, then the weight of CuSiC can be calculated as per the method used during powder preparation step. Details weight proportion of CuSiC powder is shown in Table 3.
Table 3: Weight Proportion of CuSiC powder for 1 pellet
Cu SiC %Volume 0.9 0.1 Volume [cm3] 0.6362 0.0707 Weight [g] 5.688 0.227 Totalweight [g] 5.915
Tosimplify this, 6gmof CuSiC were measuredandpouredintothemould. The milled powders were then
pressed intogreenshape through cold isostatic pressing method. The CuSiC powder was pressed consecutively for 2 minutes at 4 tones which created 3 stages of powder pressing parameters (4 tones for 2 minutes (with release load); 8 tones for 2 minutes (with release load) and 12 tones for 2 minutes (with load held)). These powder pressing parameters were performed as regards to the design of experiment (DOE) results which indicated the better compaction of powder. Theoretically, the higher load, the better compaction will be acquaintance. Finally, after the final stage of pressing been achieved, the pellet was then removed from the mould. The weight of the pellet was taken using weighing machine, the thickness was measured using thickness gauge meter and the diameter of the pellet were measured by using vernier-calliper and these measurements were noted as “before-sintered data”.
Sintering Process:
Sintering process had been noted as the most prominent part of the powder metallurgy routes as well as in the whole procedures of this study, since the main goal here is to study the effects of sintering parameters to microstructure and thermal conductivity of CuSiC. In theory, the process of sintering should be performed at the temperature lower than the melting temperature of the chosen materials. Since the melting temperature of CuSiC is about 1250oC, the best range of the sintering temperatures should be within 850oC to 950oC. In addition, the different atmospheres will also result in different sintering effects. Based on the verification of the sintering parameters and conditions per the researches that had been conducted and been reported by Randall M German, thus the sintering parameters chosen for copper silicon carbide (CuSiC) were shown in Table 4.
The sintering processes were conducted in a tube furnace in which the flow of nitrogen or argon gas can be provided. The sintering were performed 8 times (as shown in Table 4), with different parameters as indicated above.Theramp-uprateof theheatingissettobe5ºC/minuteandsoastheramp-downrate.Nitrogenor Argon gasflow rateissettobearound1litre/minute.After the sintering process completed, theweight,diameterandthickness of the pellet were measured. The measurement taken was noted as “after-sintereddata” which will be compared later on with the “before-sintered data”.
Density and Porosity Measurement:
The density changes that taken place before and after the sinteringprocesses, including the weight, thickness,and diameter ofeach of the twenty-four (24) CuSiCsamples were recordedbeforeandaftersintering. ThetruedensityandporosityoftheCuSiC, isdeterminedbyArchimedes method (using Shimadzu BX 4200H weight balance). As of the porosity and density, the samples were firstweightin the airtodetermineW1(weightinair),then the samples were immersedintothewaterfor30minutestodetermine W2(weightinwater). After 30 minutes, the samples were takenoutfromthewaterand dry-up and beenweightedagaininair for W3(weightafterimmersed). Withthe obtaineddata, the densityoftheCuSiCcanbe calculated as follow:
%porosity = (W3 – W1 / W3- W2) x 100%

Aust. J. Basic & Appl. Sci., 7(5): 350-365, 2013
354
Table 4: Sintering parameters for copper silicon carbide (CuSiC) Sample ID Temperature
[oC] Soaking Hour [hrs] Gas Type Ramp Up
[oC/min] Ramp Down [oC/min]
1A 850
3
Nitrogen
5
5
1B 1C 2A
850 7 2B
2C 3A
950 3 3B
3C 4A
950 7 4B
4C 5A
850 3
Argon
5B 5C 6A
850 7 6B
6C 7A
950 3 7B
7C 8A
950 7 8B
8C
Grinding, Polishing and Metallographic Analysis: During sintering processes, some samples were cracked due to the effects of powder press and dimensional
shrinkage. As a result, only one sample out three from each of the batch (with less or no defect at all) was chosen to undergo the metallography analysis as well as the specific heat capacity test. These samples were grinded with 80-grit silicon carbide (SiC) sand paper, by using Buehler Phoenix Beta grinder/polisher machine. Thegrinding andpolishingprocessesare prominent in revealing the microstructure of the producedCuSiC. Theminimalthicknesssusceptible fortestingisaround0.40cm and when the thickness of every sample had reached 0.42cm, these samples were then grinded with silicon carbide (SiC) sand paper with grit sizes of 120, 240, 320, 400, 600, 800, 1000 and 1200 for about half-an-hour until all scratches and defects were fully eliminated. Finally, whenthe pelletthicknessreachedaround0.40cm,thepellets were thensubjected to polishingprocess using polishingpasteof6micron.
Subsequently to the grinding and polishing processes, the samples with lowest and highest sintering parameters (of nitrogen and argon atmospheres) were undergone metallographic analysis through JOEL JSM-6460LA SEM/EDS and Nikon ME600 Light Microscope Image Analyser. The chosen set of samples for the metallographic analysis was sample no. 1, no. 4, no. 5 and no. 8. The reason behind for this selection was to observe and compare the effects of lowest and highest parameters of sintering in term of the distribution of CuSiC particles, presence of porosity, cracks and other defects, effect of using nitrogen and argon gas, as well as the existence of interface reaction zone between Cu and SiC particles.As regards to image analyser, the samples were examined under 3 different magnifications that were 50X, 100X and 200X. The observation focused on the surface conditions of the samples. On the contrary, observations that were conducted under the scanning electron microscope (SEM) were under 4 different magnifications that were 500X, 2000X, 5000X and 10000X. The observations focused on the aspect of particles distribution, porosity and the search for interface reaction zone. Through these observations, the microstructures obtained can be related to their physical and electrical properties.
Heat Capacity Characterization:
Heat capacity often simply called specific heat, or thermal capacity, is the heat capacity per unit mass of a material. Occasionally, in engineering contexts, the volumetric heat capacity is used. Heat capacity is the measurablephysical quantity that specifies the amount of heat required to change the temperature of an object or body by a given amount. The SI unit of heat capacity is joule per kelvin, J/K.Heat capacity is an extensive property of matter, meaning it is proportional to the size of the system. When expressing the same phenomenon as an intensive property, the heat capacity is divided by the amount of substance, mass, or volume, so that the quantity is independent of the size or extent of the sample.
Temperature reflects the average randomized kinetic energy of particles in matter, while heat is the transfer of thermal energy across a system boundary into the body or from the body to the environment. Translation, rotation, and a combination of the two types of energy in vibration (kinetic and potential) of atoms represent the degrees of freedom of motion which classically contribute to the heat capacity of matter, but loosely bound

Aust. J. Basic & Appl. Sci., 7(5): 350-365, 2013
355
electrons may also participate. On a microscopic scale, each system particle absorbs thermal energy among the few degrees of freedom available to it, and at sufficient temperatures, this process contributes to the specific heat capacity.
Fig. 2 illustrates the Phyme-Palmer specific heat capacity measurement equipment used in this study. Apieceoftin (Sn) plate washeated in thefire bricksusing a heating elementcoilat 6V. Thesteadystate temperatureof the heated tin platewasrecordedasT1.ThesampleofCuSiCcomposite was then placed incontactwiththe heatedtin plate and another piece of tin plate was placed on top of the CuSiC, in order to create a “sandwich” of Sn-CuSiC-Sn.At this stage, T2was recorded once the temperature reaches its steadystate. AfterT2hasbeenrecorded,the heating voltagewas doubled to 12V and the Sn-CuSiC-Sn was heated-up to T2+50ºC. Once the heating process completed, the CuSiC sample (with the top cover of tin) were taken out from the fire brick, to let it cool. Thecoolingtemperature of theCuSiCwithtin platewas recordedover time.Log coolingtemperature overtimewillbe plottedanddT/dtatT2was calculatedfrom the plottedgraph. AtT2,thecooling rate ofthetin plateisequalto theheating rateof CuSiC.
Fig. 2: Illustrates the Phyme-Palmer specific heat capacity measurement equipment The specific heat is the amount of heat per unit mass required to raise the temperature by one degree
Celsius. The relationship between heat and temperature change is usually expressed in the form shown below where c is the specific heat. The relationship does not apply if a phase change is encountered, because the heat added or removed during a phase change does not change the temperature. Q = cm∆T
where; Q = heat added c = heat capacity m = mass ∆T = change in temperature
RESULTS AND DISCUSSIONS
Particle Size:
Normally surface energy is accessed by the surface area of the samples, in which it meant that, smaller particles will have higher surface area and more energy per unit volume, which able to promote faster sintering. The size of copper (Cu) and silicon carbide (SiC) powders used were 100µm and 150µm respectively. The selection of these particle sizes was meant to enhance the role of surface area in optimizing the properties of CuSiC during sintering process. Fig. 3 below showed the SEM images of copper (Cu) and silicon carbide (SiC) particles in powder form at the magnification of 500X, whilst Fig. 4 showing the results of the particle size distribution analysis by using Malvern Mastersizer2000.

Fig. 3: SEM
(A) Imparticles w
Fig. 4: Par
A
M image of Cumage of coppewith larger size
rticle size distri
Aust.
u and SiC partir (Cu) particleand angular sh
ibution analysi
J. Basic & App
icles in powderes with smallerhape.
is
pl. Sci., 7(5): 350
r form at magnr size and roun
B
0-365, 2013
nification of 50nd shape (B) I
00X. Image of silico
on carbide (SiC
C)

Since concave ancylindricalspheres. Inmicrostrucforce. Theenergetic. particle siz
In contransport msensitive toof the high
Porosity:
Pores particle voreaction wporosity ofthe lowest the highesparametershad been uoxide and undergone undergone longer soakcontiminan
Fig. 5: The
As su
selected fo a) Sa
time in nitrb) Sa
time in nitrc) Sa
time in argd) Sa
time in arg The S
respectivel
the shape of Cnd convex surfl or angular-shan a system concture that drivee sintering streWith the said
ze, the greater tnsequence, thermechanism is o particle size.h interface cont
were the inheoids. During siith the atmospf all the CuSiCaverage poros
st percentagess which were tused which wecontaminant rethe use of nthe use of arg
king hour will nts.
e percentage of
ch, in order toor comparison p
ample number rogen gas envirample number rogen gas envirample number
gon gas enviromample number
gon gas envirom
SEM micrograly.
Aust.
Cu and SiC arfaces. The use aped particles,sisting of mixe
e mass transporess is larger w
particles, therthe driving forcre are other infparticle size
These interfactent per unit vo
ereted part of sintering, pores here, and capil
C samples wasity percentage
s of porosity. temperature, soere nitrogen aneduction which
nitrogen gas atgon gas at 850o
drive to faster
f porosity in Cu
o examine thepurpose at two
r 1: undergone roment;
r 4: undergone roment
r 5: undergone ment and; r 8: undergone ment.
aphs of sampl
J. Basic & App
re round and cof particles of if properly arred concave andrt. One of the
with smaller pare is an inherece will be. fluences affectdependence. Scial diffusion polume.
sintering procecan form from
llary spreading shown in Figs as compare t
The disimilaoaking hour annd argon did nh contribute tot 950oC for 7oC for 3 hours mass transpor
uSiC samples
e microstructur different extre
the sintering p
the sintering p
the sintering p
the sintering p
e number 1 a
pl. Sci., 7(5): 350
cylindrical, thef elliptical shapranged, would d convex surfaimportant fact
articles and higent driving for
ted by particle Surface diffusiprocesses are f
ess. They werem uneven phasg of a liquid up. 5. It can clea
to other samplearity pattern wnd gas type. Anot bring in a b pores elimina
7 hours of soaof soaking tim
rt which will ev
re of the poreemes which are
process at the t
process at the t
process at the t
process at the t
and sample nu
0-365, 2013
ir combinationpe does not app
reduce the poraces, there are ors to mass tragher surface arce for mass tr
size. Embeddeion and grain favoured at the
e presented in se distributionpon melting. Inarly be seen thes. On the contwas definitely
Although it wasbig influence t
ation. During siaking time, whme. Theoreticalventually reduc
es during sintee as follow:
temperature of
temperature of
temperature of
temperature of
umber 4 are
ns will promotpear to reduce rosity below thfurther energyansport in sintearea. Small paransport, and w
ed in the neck boundary dif
e smaller partic
the powder co, unbalanced d
n this study, that sample numtrary, sample n
y influenced bs known that tto porosity, buintering, samphilst samples lly, the higher ce pores and re
ering process,
f 850oC for 3 h
f 950oC for 7 h
f 850oC for 3 h
f 950oC for 7 h
shown in Fig
te a system withe porosity, b
hat possible wiy gradients in thering is stress
articles are mowith the small
growth for eacffusion are vecle sizes becau
ompact as intediffusion event
he percentages mber 4, indicatenumber 5, showby the sinterinthe gas type thut it does aids le number 4 hanumber 5 hatemperature an
emove oxide an
4 samples we
hours of soakin
hours of soakin
hours of soakin
hours of soakin
. 6 and Fig.
ith but ith he or
ore ler
ch ery use
er-ts, of ed
wn ng hat in ad ad nd nd
ere
ng
ng
ng
ng
7,

Aust. J. Basic & Appl. Sci., 7(5): 350-365, 2013
358
Fig. 6: Microstructure of sample number 1 (at different magnifications) which had undergone the sintering temperature of 850oC for 3 hours of soaking time in nitrogen gas enviroment
(A) 2000X magnification (B) 5000X magnification (C) 10000X magnification
Fig. 7: Microstructure of sample number 4 (at different magnifications) which had undergone the sintering temperature of 950oC for 7 hours of soaking time in nitrogen gas enviroment
(A) 2000X magnification (B) 5000X magnification (C) 10000X magnification In Fig.6, it can obviously been seen that the distribution of SiC particles were scattered around the CuSiC
surfaces. At higher magnification of 5000X and 10000X, it can be seen that the pores were relatively in large quantity. This was dissimilar with what could be seen in Fig. 7 which shows smaller quantity of pores. This is due to the different sintering parameters between the two samples (in the same nitrogen gas environment) which

Aust. J. Basic & Appl. Sci., 7(5): 350-365, 2013
359
proved that at higher temperature and longer soaking time, the higher rate of porescould be eliminated. Pore size, shape and connectivity were the typical concerned during sintering. The size and shape of the pores vary during sintering. The initial stage of sintering was characterized by rapid growth of the inter-particle neck. In the intermediate stage, the pore structure becomes smoother and has an interconnected with cylindrical nature as the compact properties were developed. It is common for grain growth to occur in the later portion of the intermediate stage of sintering, giving a larger average grain size with fewer grain. That is accompanied by possible pore isolation and a slower sintering rate.The open pore becomes geometrically unstable when the porosity has shrunk to approximately 8% (92% of theoretical density). At that point, the cylindrical pores collapse into spherical pores, which are not as effective in slowing grain growth. The appearance of isolated pores indicates the final stage of sintering and slow densification. Gas in the pores will limit the end-point density; accordingly vacuum sintering can produce high final densities as long as the metal does not evaporate. No clear distinctions exist between the sintering stages. The initial stage generally corresponds to a microstructure with a large curvature gradients. Both the neck size ratio and shrinkage are small and the grain size is no longer than the initial particle size. In the intermediate stage, the pores are smoother and the density is between 70 and 92% of theoretical. By the final stage of sintering, the pores are spherical and closed, and the grain size is evident.
On the other hand, the SEM micrographs of sample number 5 and sample number 8 were shown in Fig. 8 and Fig. 9 below, respectively.
Fig. 8: Microstructure of sample 5 (at different magnifications) which had undergone the sintering temperature of 850oC for 3 hours of soaking time in argon gas enviroment
(A) 2000X magnification (B) 5000X magnification (C) 10000X magnification Fig. 8 and Fig. 9above show the microstructure in opposition mode as compare to Fig. 6 and Fig. 7. As
refers to Fig. 8, it can be obviously seen that the distribution of SiC particles is still scattered around the CuSiC surface and at higher magnification of 5000X and 10000X, the pores are relatively in smaller quantity with smaller size compare to Fig. 9. This was opposing the theory of the higher temperature and the longer soaking time, which could produce high rate of pores elimination.
Further to this, one-way ANOVA analysis of the percentages of porosity had been conducted in order to ensure that the obtained data were statistically sound. The summarize paired t-test were shown in Fig. 10. Based on the paired t-test which mean to determine the significance of a difference in term of porosity between all the samples, it can be concluded that sample number 4 shown the highest difference as regards to porosity since its paired ring locates at the bottom of the analysis and away from the rest of the samples. As regards to other samples, it can be noted that there are slightly differences in term of porosity between other samples, since the rings do not stack on each other. This condition was statistically proven by the positive values achieved. Referring to the mean values (in Fig. 10), it can been seen that sample number 4 which had undergone the sintering temperature of 950oC for 7 hours of soaking time in nitrogen gas enviroment, has the lowest

Aust. J. Basic & Appl. Sci., 7(5): 350-365, 2013
360
percentage of porosity of 3.317% whilst sample number 5 which had undergone the sintering temperature of 850oC for 3 hours of soaking time in argon gas enviroment, has the highest percentages of porosity of 4.38%.
Fig. 9: Microstructure of sample 8 (at different magnifications) which had undergone the sintering temperature of 950oC for 7 hours of soaking time in argon gas enviroment
(A) 2000X magnification (B) 5000X magnification (C) 10000X magnification
Fig. 10: One-way ANOVA analysis of porosity percentages In a typical system when one constituent melts or reacts, it will generate an increasein porosity during the
heating stage to the sintering temperature. Besides, the entrapped gas in closed pores will also increase the possibility of porosity due to an internal gas pressure. In addition, sample preparation and etching could also influence the presence of porosity. Etching will usually enlarge pores, leading to an overestimate of the porosity.

The best mepoxy intoprocedure
Density:
Densitthe absolufundamentsintering ispowder cosystems ofand shrinka
Fig. 11: De
The de
were sintehigher (froabiding to per ASTMcompositio8, which wsamples. Aporosity peand its durpores of Cdensity.
One-win Fig. 12. between alwhich samcoupled to (sintered atfor 3 hourduration wuse of gas cause the p
microstructure po the polished sallows final po
ty is the most wute density whtal events occus termed as denompacts withof differing theoage are related
ensity of CuSiC
ensity of all thred in nitrogen
om 850oC to 9the theory of p
M B311 - 08, deon and heat trewere sintered iAs a result, thiercentage, the ration (from 3
CuSiC during
way ANOVA aBased on the p
ll the samples,mple number 4 w
sample numbet 850oC for 7 hrs). These cou
would not have(either nitroge
prime effect wi
Aust.
preservation wsurface, and tholishing withou
widely reportehich depends ouring during nsification. Ev
out a density retical densitie
d measures of p
C samples dete
he samples in n gas environm
950oC) and theporosity whichensity alone caeatment affect tn argon gas ens trend still acbetter density hours to 7 hosintering. The
analysis of denspaired t-test wh, it can be conwas coupled toer 3 (sintered ahours) and finaupling indicatee a significant den or argon) inill only be the t
J. Basic & App
will occurs by rhen repolishingut disturbing th
ed property in son compositionsintering, inde
ven inter-particchange, densi
es or initial porpore eliminatio
ermined by Ar
g/cm3 were shment, an incre
e duration getth states that theannot be used fthe pore-free dnvironment, it ct in accordanc
would be. In ours), helped te trapped gas w
sity had been chich mean to d
ncluded that theo sample numbat 950oC for 3 ally sample numed that the samdifferencewith
n sintering proctemperature an
pl. Sci., 7(5): 350
repeatedly polig and then repohe fragile pore
sintering. It is n, the fractionependent of thle neck growth
ification is a rosities. Densifn during sinter
chimedes techn
hown in Fig. 1emental trending longer (fro
e lower porosityfor evaluating tdensity.On the
has shown thece with the thefact, the incre
to remove the will lead to h
conducted and determine the sere were coupber 8 (sintered hours), sample
mber 1 was comples which w
h the effect of cess, does not
nd the duration
0-365, 2013
shing and etcholishing after tstructure.
defined as thenal or percentahe material. Th, with a loss ouseful concepfication, final dring
nique.
1. For sample can be observ
om 3 hours to y percentage, tthe degree of dother hand, fo
e similar trendeory of porositement in tempegas that has b
higher porosity
the summarizesignificance of led happened at 950oC for 7
e number 2 waupled to samplwere sintered gas environmeaffect the finaof sintering.
hing the samplethe epoxy beco
e mass per unitage density givThe change in of surface areapt especially wdensity, neck si
number 1 to nved as the tem
7 hours). Thuthe better densidensification bor sample numd as the nitrogty, which stateerature (from 8been trapped wy which eventu
e paired t-test da difference inbetween the ta
7 hours), samplas coupled to sle number 5 (swith similar t
ent. Thus, this al density value
es, impregnatinomes rigid. Th
t volume. Unlikves evidence density due
, occurs in somwhen comparinize, surface are
number 4 whicmperature gettinus, this trendsity would be. Aecause chemic
mber 5 to numben atmospherees that the low850oC to 950oC
within the closeually reduce th
data were shown term of densiabulated data, le number 7 wample number
sintered at 850o
temperature anverifies that th
e of the sampl
ng his
ke of to
me ng ea,
ch ng is
As cal ber e’s
wer C) ed he
wn ity in
was r 6 oC nd he les

Aust. J. Basic & Appl. Sci., 7(5): 350-365, 2013
362
Fig. 12: One-way ANOVA analysis of density Referring to the mean values (in Fig.12), it can be noted that sample number 4 has the highest density value
of 7.45 g/cm3, followed by its couple, that was sample number 8 with 7.43 g/cm3. Meanwhile, sample number 5 has the lowest density of 7.04 g/cm3, which followed by its couple, that was sample number 1, with density value of 7.11 g/cm3.
Heat Capacity:
Thermal conductivity and specific heat capacity are inversely proportional for most materials at normal temperatures. This is due to the fact that both thermal conductivity and specific heat capacity have their origin in molecular vibrations. Thermal conductivity is the rate at which a material conducts heat away. It depends on how easily the electrons can move inside the material, whereas specific heat has to do with how much energy is needed to raise an object's temperature, which has to do with the amount of freedom the atoms have in the material.
The specific heat capacity values (in kJ/kg.K) of all samples are shown in Fig. 13. From the bar graphs, it can be seen that sample number 4 has the highest specific heat capacity value of 1.032 kJ/kg.K, followed by sample number 8 with 1.004 kJ/kg.K (these samples were sintered at 950oC for 7 hours). On the other hand, sample number 5 has recorded the lowest value of specific heat of 0.856 kJ/kg.K, followed by sample number 1 which had been sintered at 850oC for 3 hours.
Based on the trend shown, it can be concluded that the specific heat capacity of CuSiC sample is directly proportional to the density and reversely proportional to the porosity. The higher density and lower porosity of CuSiC composite will lead to better specific heat capacity that close to the specific heat of pure copper.
The specific heat values obtained were further subjected for Bivariate analysis which able to show the relationship between two continuous variables. The Bivariate platform analysis results appear in a scatterplot as shown in Fig. 14. By using the Fit Mean command, a horizontal line can be added to the scatterplot which represents the mean of the Y response variable. As refers to the Fit Mean Report in Fig. 14, the mean of the response variable (which actually the specific heat of the CuSiC composite) is recorded as 0.9355 kJ/kg.K.

Fig. 13: Sp
Fig. 14: Bi
The st
the standarBivariate Fcopper (Cucarbide (Clayer betwetime, help copper.
Prediction
Basicaproperties CuSiC comwill be thespecific he
pecific heat cap
ivariate fit of s
tandard deviatird deviation ofFit Analysis isu) which is 1.1
CuSiC). Theoreeen SiC ceramto increase th
Profile of Besally, in accordaof CuSiC com
mposite in term best. Higher d
eat capacity, the
Aust.
pacity (in kJ/kg
specific heat of
ion of the respf the response s 0.9355 kJ/kg156 kJ/kg.K. Tetically, in the
mic and Cu mayhe mechanical
st Sintering Paance with the smposite, there ms of specific hdensity of CuSe porosity perc
J. Basic & App
g.K) of each sa
f each of the Cu
ponse variable mean is 0.023
g.K, which sliThis value is ace copper matrixybe formed, wh
strength. But
arameter: study on the efare few criteriheat. Less perciC will provide
centage of the s
pl. Sci., 7(5): 350
ample
uSiC composit
that obtained 306. As such, ightly lower ascceptable sincex composite rehich may help twith less cont
ffects of sinteria available incentage of pore better specifisamples must b
0-365, 2013
te with fit mean
from Fit Meanthe mean valus compare to e the test sampeinforced withto reducethe retrol, it will red
ring parameter n order to enharosity and highic heat for CuSbe minimized i
n
n Analysis is 0ue of the specithe theoretical
ple is MMCs oh SiC, an interesidual stressesduce the therm
to microstructance the therm
her density of CSiC. Thus, to acin order to opti
0.065223, whilfic heatfrom thl value for puof copper silicorfacial transitios and at the sammal properties
ture and thermmal properties CuSiCcomposichieve the bettimize its densit
lst he
ure on on me of
mal of ite ter ty.

Aust. J. Basic & Appl. Sci., 7(5): 350-365, 2013
364
Fig. 15: The prediction profiler for maximum desirability of properties of CuSiC Based on Fig. 15, the bottom part of the figure (noted with red colour) shows the best sintering parameter
which can be used to boost the best specific heat of CuSiC. The recommended sintering parameter suggests that the CuSiC samples should be sintered at 950oC for seven hours in nitrogen gas. With the sintering parameter, the percentage of porosity in CuSiC can be decreased to 3.37% and the density of CuSiC can be increased up to 7.443 g/cm3. By having those values of porosity percentage and density, it is expected that the specific heat capacity of CuSiC will be closed to the value of 1.024 kJ/kg.K.
Summary:
Customer’s demands of electronic devices to have features like ‘shrinking in size plus increasing in functionality’ had actually created serious ‘thermal management’ problem to all electronics manufacturers. The millennium discovery of ‘new highly potential thermal management material’ like CuSiC metal matrix composite, to be used as heatsink or heat spreader in electronic packages, would be very promising since it has good specific heat capacity, light weight and easy-to-process characteristics. In a nutshell, in order to boost the best specific heat capacity of CuSiC, the recommended sintering parameter suggests that the CuSiC samples should be sintered at 950oC for seven hours in nitrogen gas. With the sintering parameter, the percentage of porosity in CuSiC can be decreased to 3.37% and the density of CuSiC can be increased up to 7.443 g/cm3. By having those values of porosity percentage and density, it is expected that the specific heat capacityof CuSiC will be closed to the value of 1.024 kJ/kg.K. This parameter obey the theory of sintering which states that the lesser percentage of porosity in CuSiC composite, the higher the density of CuSiC will be. Higher density of CuSiC will provide better specific heat for CuSiC. Thus, to achieve the better specific heat capacity, the porosity percentage of the samples must be minimized in order to optimize its density.
ACKNOWLEDGEMENT
The main author would like to thank you, his Ph.D. supervisors (Dr Dermot Brabazon and Emeritus
Professor Saleem Hashmi) for their words of motivation, dedication and support through-out his study, to his wife and mom for their loves, dedication and support through-out his entire life, to his superior, The Vice-Chancellor of UniMAP, for his excellent support prior and during his study, to his sponsors, The Ministry of Higher Education, Malaysia (MoHE) and Universiti Malaysia Perlis (UniMAP), for all the financial assistances during his tenure of Ph.D. study in DCU, Rep. of Ireland.

Aust. J. Basic & Appl. Sci., 7(5): 350-365, 2013
365
REFERENCES An, Z., M. Hirai, M. Kusaka and M. Iwami, 2001. Study of the reaction at Cu/3C-SiC interface. Journal of
Surface Science, 1-3: 182-187. ASTM B311-08, Standard Test Method for Density of Powder Metallurgy (PM) Materials Containing Less
Than Two Percent Porosity. Barmouz, M., M.K.B. Givi and J.Seyfi, 2011. On the role of processing parameters in producing Cu/SiC
metal matrix composites via friction stir processing: Investigating microstructure,microhardness, wear and tensile behaviour. Journal of Materials Characterization, 62: 108-117.
Bukhari, M.Z., M.S.J. Hashmi and D. Brabazon, 2011. Application of Metal Matrix Composite of CuSiC and AlSiC as Electronics Packaging Materials. In the Proceedings of the 28th International Manufacturing Conference, pp: 117-125.
Bukhari, M.Z., M.S.J. Hashmi and D. Brabazon, 2012. Evaluation on Metal Matrix Composite of CuSiC as Candidate for Thermal Management Materials in Electronics Packaging. In the Proceedings of the 2nd International Malaysia-Ireland Joint Symposium on Engineering, Science and Business, pp: 417-430.
http://en.wikipedia.org/wiki/Heat_capacity (source from wikipedia). Kim, J.J. and D.Y. Kim, 2000. Effect of Heating Rate on the Microstructural Evolution. Journal American
Ceramic Society, 70: 322-324. Rado, C., B. Drevet and N. Eustathopoulos, 2000. The role of compound formation in reactive wetting in
the Cu/SiC system. Acta Materialia, 48(18–19): 4483-4491. Randall, M. German., 1996. Sintering Theory and Practice. John Wiley & Sons, Inc. New York. Sundberg, G., P. Paul, C. Sung and T. Vasilos, 2005. Identification and characterization of diffusion
barriers for Cu/SiC systems. Journal of Materials Science, 40: 3383-3393. Sundberg, G., P. Paul, C. Sung and T. Vasilos, 2006. Fabrication of CuSiC metal matrix composites.
Journal of Materials Science, 41: 485-504.