THE EFFECTS OF SHIP LOAD VARIATIONS AND SEASTATE …
111
THE EFFECTS OF SHIP LOAD VARIATIONS AND SEASTATE ON HULL GIRDER DERFLECTION AND COMBAT SYSTEM ALIGNMENT by STUART HAYDEN MENNIT B.S. Naval Architecture and Marine Engineering Webb Institute of Naval Architecture (1986) Submitted to the Department of OCEAN ENGINEERING in Partial Fulfillment of the Requirements for the Degree of MASTER OF SCIENCE IN NAVAL ARCHITECTURE AND MARINE ENGINEERING at the MASSACHUSETTS INSTITUTE OF TECHNOLOGY September, 1990 © Stuart Mennitt, 1990. All rights reserved. The author hereby grants to M.I.T. and the U.S. Government permission to reproduce and to distribute copies of this thesis document in whole or in part. Signature of Author r Department of Ocean Engineering September, 1990 Certified by - - -- -- ' Certifie by i Rchard Celotto Associate Professor, Ocean Engineering Thesis Supervisor Accepted by I AD hMASS tpartmental Graduate Committee OF ENI OGY Department of Ocean Engineering OCT 05 1990 LIBRARES ARCHIVES
Transcript of THE EFFECTS OF SHIP LOAD VARIATIONS AND SEASTATE …

THE EFFECTS OF SHIP LOAD VARIATIONS AND SEASTATEON HULL GIRDER DERFLECTION AND COMBAT SYSTEM
ALIGNMENT
by
STUART HAYDEN MENNIT
B.S. Naval Architecture and Marine EngineeringWebb Institute of Naval Architecture (1986)
Submitted to the Department ofOCEAN ENGINEERING
in Partial Fulfillment of the Requirementsfor the Degree of
MASTER OF SCIENCE IN NAVAL ARCHITECTURE AND MARINEENGINEERING
at the
MASSACHUSETTS INSTITUTE OF TECHNOLOGYSeptember, 1990
© Stuart Mennitt, 1990. All rights reserved.
The author hereby grants to M.I.T. and the U.S. Government permission to reproduce andto distribute copies of this thesis document in whole or in part.
Signature of Author rDepartment of Ocean EngineeringSeptember, 1990
Certified by - - -- --' Certifie by i Rchard Celotto
Associate Professor, Ocean EngineeringThesis Supervisor
Accepted by I AD
hMASS tpartmental Graduate CommitteeOF ENI OGY Department of Ocean Engineering
OCT 05 1990LIBRARES
ARCHIVES

THE EFFECTS OF SHIP LOAD VARIATIONS AND SEASTATE ON HULLGIRDER DEFLECTION AND COMBAT SYSTEM ALIGNMENT
by
Stuart Hayden Mennitt
Submitted to the Department of Ocean Engineering on 17 August 1990in partial fulfillment of the requirements for the Degree of
Master of Science in Naval Architecture and Marine Engineering
ABSTRACT
This thesis computationally analyzes the effect of commonly occurring ship loadvariations and wave induced bending moments on hull girder flexure. The deflection ofthe hull is used to determine the impact on the alignment of the vessel's combat system.Simple beam theory is applied for the structural portion of the analysis. Wave inducedbending moments are determined by using a quasi-static approach with regular waves.Calculations and results are presented for the FFG7 class of U.S. Navy frigates.
It is shown that commonly occurring load conditions produced no significant problemswith the alignment of the ship's combat system. The effect of waves can be moresignificant. Deflections of up to 9 arc minutes are predicted between elements of thecombat system in seastate 6. This is out of the elements' alignment tolerance and couldaffect the operability of the system.
Thesis Supervisor: Professor Richard CelottoTitle: Associate Professor of Naval Construction and Engineering

ACKNOWLEDGEMENTS
I would like to thank Professor Celotto for his guidance through the course of this
thesis. His encouragement and suggestions kept this project moving and focused. This
thesis could not have been realized without his help.
I would like to thank Professor Tibbitts for his assistance. His extensive
knowledge of naval engineering was extremely helpful.
I want to thank my friends at MIT for their generous assistance. Cliff Whitcomb
and Norbert Doerry deserve special recognition for their help in working through often
frustrating technical obstacles.
I owe my appreciation to my colleagues at David Taylor Research Center, Naval
Sea Systems Command, Supervisor of Shipbuilding and Repair, Research, Analysis &
Management Corporation, and George G. Sharp, Incorporated for their prompt response
to my requests for information.
I would like to thank my family for their constant support and encouragement
during this project. They will always be an inspiration.
Finally, I want to thank David Taylor Research Center for providing me with the
opportunity to be at MIT. Without their sponsorship, none of this would have been
possible.
Sincerely,
Stuart Mennitt

CONTENTS
Title Page ............................................ 1
Abstract ..........................................
Acknowledgments.
Contents ..........................................
List of Figures ......................................
List of Tables ......................................
1. Introduction .....................................
2. Description of the FFG7 Class Frigate ...................
3. Alignment Requirements and Tolerance .................
4. Hull Deflections Due to Changes in Loadirng ..............
5. Hull Deflections Due to Wave Induced Bending Moment .....
6. Effects on Combat System Alignment ...................
7. Conclusions ....................................
Appendix A: Longitudinal Weight Distributions ..............
Appendix B: SHCP Graphic and Numerical Output ...........
Appendix C: Hull Flexure, Displacement and Rotation .........
. ...... 2
o ... .... 5
.. ..... 6
...... 12
...... 17
...... 23
, ...... 34
....... 38
...... 47
...... 50
...... .58
..... .100
Bibliography ill
4
. . .
. . .
. . .
. . .
. . .
. . .
. . .
. . .
. . .
. . .
. . .
. . .

List of Figures
Figure 1-1:Figure 1-2:Figure 2-1:Figure 2-2:Figure 4-1:Figure 4-2:Figure 4-3:
Ops.Figure 5-1:Figure 6-1:Figure B-1:Figure B-2:Figure B-3:Figure B-4:Figure B-5:Figure B-6:Figure B-7:Figure B-8:Figure B-9:
Modes of Hull Flexure ................................Thermal Flexure ...................................FFG7 Class Outboard Profile ...........................FFG7 Class Combat System Block Diagram .................SHCP Body Plan of FFG36-61 ..........................SHCP Isometric View of FFG36-61 .......................Hull Deflections for Full Load, 80% Fuel, 60% Fuet, and Min.
Full Load Deflections in Seastates 0, 4, and 6 ....Inter-Element Alignment at Seastates 0, 2, 4, and 6SHCP Results,SHCP Results,SHCP Results,SHCP Results,SHCP Results,SHCP Results,SHCP Results,SHCP Results,SHCP Results,
Full Load, Seastate 0 ......................80% Fuel Condition, Seastate 0 ...............60% Fuel, Seastate 0 ......................Minimum Operating Condition, Seastate 0 .......Full Load, Seastate 2, Hogging ...............Full Load, Seastate 2, Sagging ...............Full Load, Seastate 4, Hogging ...............Full Load, Seastate 4, Sagging ...............Full Load, Seastate 6, Hogging.
Figure B-10: SHCP Results, Full Load, Seastate 6, Sagging
91015152626
31374263687378848591929899
List of Tables
TableTableTableTableTableTableTableTable
1-1:1-2:2-1:2-2:3-1:3-2:5-1:6-1:
Static Alignment Error Sources ............................Dynamic Alignment Error Sources .........................FFG7 Class Dimensions ................................FFG7 Class Combat System .............................FFG7 Roller P-ath Inclination Tolerances ....................FFG7 Train and Elevation Alignment Tolerances ..............Seastate 2, 4, and 6 Characteristics in North Atlantic ............Load Condition Effects on Inter-Element Alignment . ...........
88
131320213541
5
. . .

1. Introduction
A warship's effectiveness in combat depends predominantly on the effectiveness
of its combat system. The effectiveness of a weapon system depends on proper
interaction of its constituent subsystems. Modem naval combat systems are comprised
of many complex subsystems:. These subsystems are integrated in a way that attempts to
maximize the overall performance of the vessel.
Various integrated systems and subsystems comprise a modern warship's combat
system. This integration requires a correct exchange of information between the different
systems and subsystems in order that the combat system function properly as a whole.
The successful exchange of information requires both the actual passing of accurate
electronic data and the use of a common physical frame of spatial reference. The latter
is made possible by the physical alignment of combat system components relative to a
common reference system.
Initial combat system alignment is accomplished at the shipyard as part of new
construction. Once the vessel is in the fleet, the US Navy requires that the combat
system be aligned periodically. A complete combat system alignment can take over a
week and requires a certain ship loading condition as well as nearly constant sea and air
temperature. It is only practical for a warship to undergo a complete combat system
alignment when it is in a shipyard for construction, conversion, repair, or overhaul.
Complete combat system alignments are typically done during selected restricted
availabilities which occur every eighteen to twenty-four months. Selected restricted
availabilities are limited overhauls that usually last less than six months. The initial
alignment, performed at the builder's shipyard, is required to be carried out while the ship
6
is floating at a displacement of at least 90% for Builder's Sea Trials.l] Thereafter,
alignment procedures are required o be performed when the ship is at a condition of at
least 80% of its total load.2]1 Thus, effects such as transition from drydock to afloat,
changed configuration, and settling of ship structure are minimized. While the 90%
Builder's Sea Trial displacement and "total load" specifications are vague, they attempt
to bring the ship close to a fill load condition for alignment.
During the period of time between these alignments, there are many factors that
contribute to alignment degradation. Combat system alignment errors can be categorized
as being either static or dynamic in nature. Tables 1-1 and 1-2t3] summarize these errors
and the causes behind them.
The static misalignment errors in Table 1-1 are the result of improper alignment
procedures and are not inherent in the ship's design. Some of the errors mentioned in
Table 1-2 are the result of poor design or integration of a weapon or component. The
result of the latter is that the element cannot dynamically compensate for the vessel's
motion in a seaway.
Of the remainder of the causes of errors in combat system alignment, three are
common to all surface combatants:
o Structural distortion due to thermal effects
["General Specifications for Ships of the United States Navy,S9AAO-AA-SPN-010/GEN-SPEC, Naval Sea Systems Command, 1989, Section 184.
[2]Combat System Alignment Manual (CSAM) for FFG7 Class,SW225-B6-CSA-010/OP2456 FFG7 CL, 2nd Revision, Naval Sea Systems Command,15 August 1987, p. 1-8.
[3]Technical Manual for Theory of Combat System Alignment,SW225-AO-MMA-010/OP762ALIGNTHEORY, 2nd Revision, Naval Sea SystemsCommand, 1 September 1987, Section 1-2.20.
7

o Structural distortion due to wave induced stresses
o Structural distortion due to loads depletion
Table 1-1: Static Alignment Error Sources
Error Source
1. Step-type a. Transition from drydock to afloaterrors b. Structural distortion due to heavy seas, storms, etc.
c. Structural distortion due to configuration change(e.g., modernization of sonar equipment)d. Fuel and ammunition ioadout.
2. Static a. Roller path inclinations of system equipmentmisalignment b. Dial and synchro zero adjustment
c. Improper alignment from offset centerline, tram settings,benchmarks, etc.
3. Slowly a. Fuel and ammunition depletionvarying errors b. Settling of ship structure (new ship, overhaul, etc.)
c. Solar/thermal expansion
Table 1-2: Dynamic Alignment Error Sources
Error Source
1. Hull distortion a. Wave induced bendingb. Ship maneuvering
2. Other a. Uncompensated roller path changes due to gun movementb. Inability of stable element to reflect ship motionc. Inability of weapon system to respond to ship movementd. Ship internal equipment movement and vibration
The three modes of hull structural distortion are shown in Figure 1-1. Thermal
effects and wave stresses can produce all three components. Load variations can induce
hull flexure in only the vertical bending and torsional modes. The stresses that a seaway
puts in a ship's hull are generally most severe in the vertical bending mode. For this
8

reason, the primary stresses resulting from a wave induced bending moment are
considered the main design criteria for the hull structural strength of most vessels.4]1
A�A
VERTICALBENDING
HORIZONTALBENDING
TORSION
Figure 1-1: Modes of Hull Flexure
Hull flexure caused by changes in loading is also primarily in the vertical bending
mode. It is possible in most vessels to obtain some torsional flexure by diagonally
distributing loads. This would, however, be a very uncommon occurrence for a warship.
Load items tend to be consumed evenly when distributed port and starboard.
Like hull flexure caused by wave action and variations in loading, flexure due to
thermal differentials in the hull structure is most often in vertical bending. The flexure
is due to a temperature differential between regions of the hull structure. This is most
£4 Principles of Naval Architecture, 2nd Revision, The Society of NaVal Architectsand Marine Engineers, Jersey City, NJ, 1988, Vol. 1, Section 3.
9

-700 (AIR CONDITIONED)
-500 ,AMBIENT)
WATER
Figure 1-2: Thermal Flexure
common between the underwater portion of the hull and the above water portion.
Figure 1-2 depicts a vessel that is undergoing flexure in vertical bending due to the
temperature difference between the sea and the air. Uneven solar heating (port or
starboard) would tend to flex the hull horizontally. Only a complex and unlikely
combination of hull heating and cooling would result in a torsional flexure.
These three causes are of potential concern to the warship operator. For example,
assume the vessel's combat system is aligned with the ship near full load condition, in
calm water, and in weather conditions that minimize temperature differences within the
hull. The vessel then puts to sea. Fuel is used up, and ballast water is added. The ship
encounters waves. The sun warms the hull above the waterline. The structure of the ship
distorts as a result of these causes. The operator may assume his ship's combat system
is still in alignment. It is possible that, without the operator's knowledge, one or more
of these causes has distorted the shape of the vessel to the point of creating significant
misalignment between elements of the combat system. If the ship returns to port and the
alignment is checked under conditions of hull temperature, load, and seastate similar to
when the system was initially aligned, everything would be within specifications. The
problem with misalignment in the operational environment would remain undetected.
10

This thesis presents a study of the effects of ship load variation and seastate on
hull girder deflection and combat system alignment. A goal is to assess the possibility
that US Navy ships may be operating at sea with combat systems not in alignment. The
author acknowledges the significance of hull deflections due to temperature variations.
Thermal effects on a ship's structure are relatively complex and require detailed finite
element analysis for meaningful results. Such an undertaking is beyond the scope of this
project. The effects of load variations and seastate on hull girder deflection are, however,
within the scope of this study.
The study focuses on the FFG7 class of US Navy frigates. Due to the nature of
the calculations, it is not realistic to work with a generic ship. Although one can
conjecture on a theoretical basis as to the qualitative effects of shipboard load changes
and seastate on combat system alignment, to determine the magnitude of the effects and
ascertain whether or not any cause for concern exists requires studying a defined vessel.
Specific information is required concerning hullform, scantlings, and lightship and loads
weight distribution. It is expected that this study will be of interest to the operators of
these vessels as well as to US Navy ship designers and combat system engineers.
Calculations are made at four load conditions: full load, 80% fuel load, 60% fuel
load, and minimum operating condition. The still water condition is used to establish
baseline deflection and alignment. Wave effects are analyzed at the full load condition
using the quasi-static method. Regular trochoidal wave profiles of varying heights are
used to represent seastates 2, 4, and 6.
11

2. Description of the FFG7 Class Frigate
The FFG7 class is the most modem frigate in the US Fleet. The first ship of
the class was commissioned in December of 1977. A total of fifty-four have been built,
with the final ship in the class, the FFG61, being commissioned in July of 1989.
Table 2-1 '5][6 contains some characteristics of the FFG7 class. FFG8 and later
ships of the class, FFG36-61, are modified to incorporate the Light Airborne
Multi-Purpose System Mk Ill (LAMPS III). The major components of this upgrade are
the SH-60B helicopter and the Recovery Assist Secure and Traverse (RAST) system. The
transom of these modified ships are angled aft to provide more space for the RAST
equipment and the larger helicopters. The total displacement is higher due to both a
higher lightship weight and additional loads. The hull scantlings on the LAIVIPS UI
frigates are increased slightly to provide the additional hull strength needed due to the
higher displacement.['l
The FFG7's primary mission is anti-submarine warfare (ASW). It also has
secondary capabilities in anti-air (AAW) and anti-surface warfare (ASU). The combat
system of the FFG7 class is described in Table 2-2[8],[9]. Also included in Table 2-2
are navigational and radio elements that are sensitive to alignment. Figure 2-1 contains
[5lJane's Fighting Ships 1988-89, Jane's Publishing Company Limited, London,1988, p. 762.
t61FFG61 Final Weight Estimate, July 1989, Gibbs & Cox, Inc.
[7FFG36-61 Longitudinal Strength and Inertia Sections Drawing, NAVSHIPSDrawing No. PF109-802-5414870.
l8Jane's Fighting Ships 1988-89, pp. 762-3.
[9lNorman Polhnar, The Ships and Aircraft of the U.S. Fleet, 12th Edition, NavalInstitute Press, Annapolis, 1981, pp.1 15-6.
12

Table 2-1: FFG7 Class Dimensions
Item FFG7, 9-35 FFG8, 36-61
ASW LAMPS I LAMPS mIHelicopters 2 x SH-2F 2 x SH-60BRAST No Yes
LBP 408'-0" 408 '-0"LOA 445'-0" 453'-0"B-max 46'-11.5" 46'-11.5"D-amidshlip 30'-0" 30'-0"
Disp.:Lightship 2750 itons 3096 tonsFull Load 3585 tons 3987 tons
Machinery:Main Engines 2 LM2500 gas turbines, 2 LM2500 gas turbines,
41000 shp total 41000 shp totalAuxiliary 2 x 325hp auxiliary 2 x 325hp auxiliary
propulsion units propulsion unitsGenerators 4 x 1000 Kw diesel 4 x 1000 Kw diesel
generators generators
Speed, Sustained 29 knots 29 knotsRange 4500 nm @ 20 knots 4500 nm @ 20 knots
an outboard profile of the FFG7 class and shows the location of many of the items in
Table 2-2. Figure 2-1 also specifies alignment tolerances which are described in
Chapter 3.
13

Table 2-2: FFG7 Class Combat System
[_ Primary Combat System Components
Missiles:Mk 13 Launcher Single arm launcher, 40 round rotary magazine, launches SM1-MR
(medium range) AAW and Harpoon ASU missiles.
Guns:Mk 75 76mm Dual-purpose rapid fire 76mm gun capable of engaging both air and
surface targets.Mk 15 CIWS Close in weapons system, point anti-missile defense, 20mm radar
controlled gun.
Torpedoes:2 Mk 32 Launchers Two triple tube mounts firing Mk 46 lightweight ASW torpedoes.
Countermeasures:4 Mk 36 SRBOC Super rapid-blooming offboard chaff. Launches chaff canisters and
infra-red decoys.SLQ 32V(2) ESM/ECM, threat radar warning receiver.SLQ-25 NIXIE Torpedo decoy/countemeasure system.
Fire Control:Mk 92 Mod 2 FCS Integrated missile and gun fire control.2 Mk 24 TDT Target designation transmitter, optical manual sight for Mk 75 gun.
Radars:SPS 49 Long range two-dimensional (range and bearing) air search radar.SPS 55 Surface search/navigation radar.SPG 60 STIR Separate target illumination radar, director for SM-MR and Mk 75 gun in
AAW mode.Mk 92 CAS Combined antenna system, search and track for Mk 92 FCS and director
for Mk 75 gun in ASU mode.
Sonars:SQS 56 Active/passive hull mounted sonar.SQR 19 TACTAS Passive towed array sonar.
Helicopters:2 SH-2F or LAMPS I2 SH-60B LAMPS mII
Other Alignment Sensitive Equipment
URN-25 TACAN Tactical air navigation system.URD-4 Radio direction finding device.
WSN-2 Gyrocompass, primary.Mk 27 GC Gyrocompass, backup.Pelorus Stand Optical orientation determination apparatus.SGSI Stabilized glide slope indicator, for helicopter landing approach.
14

I,-
tt
901
2
rI
C
9Zo
3
Figure 2-1: FFG7 Class Out
15
n
2u
ma;5tI
I
xw,
r
Q=
_

0wUzf
Figure 2-2: FFG7 Class Combat System Block Diagram
16
0
0OZZc
000U
c L .x cc <ooC OJ J

3. Alignment Requirements and Tolerance
To achieve the performance of which a combat system is capable, each subsystem
must by physically aligned to required tolerances. Alignment tolerant -xe based on
individual equipment criteria and represent the minimum acceptable standards of
alignment. At the same time the ,ignment tolerances must be realistic, considering both
that which is achievable in an industrial environment as well as maintainable in an
operational environment. Only when this alignment is maintained can the combat system
be expected to satisfy tactical requirements.
Each component that is sensitive to alignment must be aligned to a common
reference to ensure a proper exchange of data between the various systems and
subsystems. All missile launchers, gun bores, radar antennas, fire control directors,
gyrocompasses, and other directional pointing equipment must be able to achieve a
parallel condition with each other. These pointing lines must be able to remain parallel
within acceptable tolerances. Combat system alignment refers to establishing this
parallelism.
Combat system alignment is based on the concepts of parallel lines and planes and
reference frames. The lines which are of interest are referred to as pointing lines. The
pointing line may be a centerline of a torpedo tube, a propagation axis of a radar antenna,
or a bore axis of a gun. The planes of interest are usually those in which the individual
combat system components rotate. A reference frame is a combination of a fixed
17

reference point, reference plane, and reference direction. A reference frame is used as a
coordinate system to measure individual component planes and pointing lines.[101
During new vessel construction the ship base plane (SBP) is the first reference
plane to be established. The SBP is a horizonal plane that includes the ship's baseline.
The centerline reference plane (CRP) is a vertical perpendicular to the SBP and includes
the ship's centerline. The master reference plane (MRP) is a plane above the baseline
that is parallel to the SBP. The MRP is defined early in the ship's construction by a
master level block (MLB). The MLB is typically represented by a heavy machinery
foundation or combination of foundations. In the FFG7 class the MLB is located in
Auxiliary Machinery Room 1 (AMR 1). As the name implies, the MLB serics as a
physical reference for further construction alignment. After construction, the MLB is only
used in case of major damage or structural changes. The weapon control reference plane
(WCRP) is then established. During new construction the WCRP is aligned parallel to
the MLB (and thus to the MRP and SBP).
The WCRP serves as a reference plane for all combat system alignment
requirements throughout the life of the ship. Equipment that rotates in a vertical axis
does so about its roller path. For each of these components, the plane in space
perpendicular to its vertical axis of rotation is called the roller path plane for that
component. The roller path plane (RPP) of the Mk 75 76mm gun mount is the WCRP
for the FFG7 class. Figure 2-1 shows the relative location of the Mk 75 gun relative to
the other components of the FFG7 class combat system.
'°0lTechnical Manual for Theory of Combat System Alignment, Section 2.1.
18

Reference marks are required in addition to reference planes. The main reference
marks used are either on the ship's centerline or parallel to the centerline with a horizonal
offset. Like the reference planes, the reference marks are established during new
construction and are not altered under normal conditions.
The RPP's of all equipment in the combat syste_ are aligned to the WCRP. This
is usually done during initial construction by machining the roller paths and or their
foundations. After machining, the parallelism between RPPs is checked. Any angle
between two RPPs is referred to as the roller path inclination (RPI). The machining of
each roller path must meet a specified RPI tolerance. Depending on the particular piece
of equipment, it may be possible to later adjust the RPP with shims, leveling rings, or
adjusting screws. If this second adjustment is possible, there will be a second set of RPI
tolerances referred to as operational RPI tolerances. Both the foundation machining and
operational RPI tolerances for the FFG7 class combat system are shown in Table 3-1 t"].
The next alignment procedure is to perform train and elevation adjustments. The
purpose is to ensure that all relevant elements of the combat system aim at the same point
in space. Two methods are used for train and elevation alignment. One is train and
elevation zero alignment. Each element of the combat system is brought to zero train
(parallel to the CRP) and zero elevation (parallel to Its RPP). This is accurately done
using boresight telescopes and theodolites. A theodolite is an optical device similar to
a surveyor's transit used to verify horizonal and vertical angles with precision. When
zero train and elevation is reached, the controlling mechanism for each item being aligned
is set to reflect the zero train and elevation condition.
["Combat System Alignment Manual (CSAM) for FFG7 Class, p. 2-2.
19

Table 3-1: FFG7 Roller Path Inclination Tolerances
Equipment Foundation machining Operational roller path inclination
Tolerance Reference Tolerance | Reference Remarks
Master Level Block ±0.5' SCBP N/A N/A
SPS-49 ±10' MLB ±20' WCRPSPS-55 ±20' MLB ±20' WCRP Achieved by
shims
AS-3316/SLQ-32 ±90' MLB N/A N/ACW-1 186/SLQ-32 ±30' MLB N/A N/AMk 36 Launcher i20 MLB N/A N/A
CIWS ±20' MLB N/A N/A
SQS-56 Transducer 10' MLB ±10 N/ASVTT 32 ±30' MLB N/A
CAS ±20' MLB ±2' WCRP Achieved byadjusting screws
STIR ±5' MLB ±2' WCRP Achieved byleveling rings
Mk 13 Launcher ±3' MLB ±12' WCRP Achieved bymachining
Mk 75 Gun (WCRP) ±3' MLB ±3' MLB
TDT 24 ±20' MLB ±30' WCRP Achieved byshims
URN-25 ±60' MLB N/A N/AURD-4 ±60' MLB N/A
WSN-2 ±20' MLB ±1' WCRP Achieved byadjusting screws
Mk 27 ±20' MLB N/A
Pelorus Stand ±20' MLB N/A N/ASGSI ±60' MLB N/A N/A
.... , . : .'7. " ' . . , . ' . , ~.~~~~~~~~~~~~~~~~~~~~~~~~~~~~~~~~~~~~~~~~~~~~~~~~~~~~~~~~~~~~~~~~~~~~~~~~~~~~~~~~~~~~~~~~~~~~~~~~~~~
20

Table 3-2: FFG7 Train and Elevation Alignment Tolerances
Equipment Construction tolerance Operational tolerance'
Train2 I Elevation3 Train Elevation,, .. , ., -. =-- z .~ '~,'."= , , _ _ . '
Master Level Block ±0.5' N/A N/A N/A
SPS-49 ±30'" N/A ±30'4 N/ASPS-55 ±30' N/A ±30' 4 N/A
AS-3316/SLQ-32 ±30' 6 N/A N/A N/ACW-1186/SLQ-32 ±30' N/A N/A N/AMk 36 Launcher ±2° N/A N/A N/A
CIWS ±20' N/A N/A N/A
SQS-56 Transducer ±5' N/A N/A N/ASVTT 32 ±60' N/A N/A N/A
CAS ±1' N/A ±2' N/ASTIR ±1' ±1' ±29.10 ±291°
Mk 13 Launcher ±5' ±3' ±6' ±5'Mk 75 Gun(WCRP) ±2' ±2' ±2`9 1° ±2910TDT 24 ±30' ±30' ±30' ±30'
URN-25 ±60' N/A N/A N/AURD-4 ±60' N/A N/A N/A
WSN-2 i1'7 N/A ±122 8 ±2 Mk 27 ±2' 7 N/A ±60'8 N/A
Pelorus Stand ±12' N/A 30' N/ASGSI ±60' N/A N/A N/A
NOTES:1. Operational tolerances are achieved by various shipboard alignment procedures including horizonchecks, star checks.2. Referenced to the CRP.3. Referenced to the RPP.4. Referenced to the CAS.5. Limit for roll and pitch is ±2' operational, and ±l'for optical alignment.6. This tolerance becomes ±12' for ships equipped with the enhanced Band 1 antennas.7. Construction train for these units represents the azimuth alignment tolerance to be met during optical
alignment.8. Operational train tolerance for these units include system alignment errors, heading accuracy, andalignment changes caused by ship's flexure due to mechanical, thermal, and dynamic loading(dockside only)9. Tolerance for benchmarks is ±5'.10. Tolerance for tram checks is ±3'.
21

The alternate method is a train and elevation space alignment. Boresight
telescopes are used to bring the point lines of the combat system components to bear on
a star. The range of the star ensures a negligible parallax error. Table 3-2['2] contains
a summary of the FFG7 class train and elevation tolerances.
1 2 1Combat System Alignment Manual (CSAM) for FFG7 Class, p. 2-3.
22

4. Hull Deflections Due to Changes in Loading
The calculation of hull deflection relies on the application of simple beam theory,
which is commonly used in the analysis of ship hull girder primary stress and deflection.
The hull is treated as a simply supported beam that has a distributed load applied.
"Simply supported" implies that there are no concentrated moments applied to the hull
girder. To be in static equilibrium the sum of the loads in any direction equals zero.
This relates to the hydrostatic principle of a floating body's buoyancy being equal to its
weight. The shear and moment is zero at the ends of the hull girder.?'3]1' t 4]
Many validations of the application of simple beam theory to ship hull bending
behavior prediction have been documented.[t51
The following steps are taken in calculating hull deflections caused by both load
variations and seastate:
1. Develop the longitudinal weight distribution of the ship in a baseline load
condition.
2. Determine the still water longitudinal buoyancy distribution for the ship in the
baseline condition.
3. Calculate the longitudinal shear distribution by integrating the load distribution
(load=buoyancy-weight).
4. Calculate the longitudinal moment distribution by integrating the shear
distribution.
t '3]Principles of Naval Architecture, p. 235.
1'41A. Higdon et al, Mechanics of Materials, 3rd Edition, John Wiley & Sons, Inc.,New York, 1976.
tJ5]Principles of Naval Architecture, p. 235.
23

5. Calculate the hull deflection by performing a double integration of the moment
and structural inertia distributions. The hull material modulus of elasticity must be
inciuded.
6. Repeat steps 1-5 using a new load condition or incorporating wave conditions
in step 2.
The first step is to develop the longitudinal weight distribution of the ship in a
baseline load condition. Dae to minor changes during construction and outfitting, the
weights vary slightly between ships in a class. It is appropriate to choose one ship for
purposes of weight data. A detailed final weight report was available for FFG61. This
weight report for the FFG61 is used throughout this study for all weight information.
The longitudinal strength drawings for FFG36-61 are also used. As mentioned in
Chapter 2, these ships (FFG36-61) are of greater displacement than FFG7-35. FFG36-61
also have heavier scantlings near the keel and shear strake from stations 9 through 13.
The longitudinal strength drawings present a graphical representation of the longitudinal
weight distribution for FFG36-61 in the full load condition. The weight is described by
values in units of long tons (ltons) per foot between each of stations 0 through 20. The
weight of the ship forward of the forward perpendicular and aft of the aft perpendicular
is also included. The weight values are assumned constant between stations.
The full load displacement mentioned on the more generic FFG36-61 strength
drawing, 's slightly lower than the full load displacement in the FFG61 weight report
(3914 l.-ies vs. 3987 ltons). To reconcile this slight discrepancy, the strength drawing full
load weight distribution values are scaled proportionally so that the full load total weight
is that of the FFG61. The final step is to convert the ltons per foot values to ltons. This
24

is done by multiplying the tons per foot values by the appropriate station spacing. The
result is used as input to the Ship Hull Characteristics Program (SHCP). Appendix A
contains spreadsheets that show both the full load longitudinal weight distribution and the
weight distribution for conditions less than full load.
The next three steps are the computation of longitudinal buoyancy, shear, and
moment distribution. The Ship Hull Characteristics Program (SHCP) is used for these
steps. SHCP is the US Navy's standard hydrostatics program. The primary input is a
numerical description of the hullform using a set of hull offsets. SHCP contains
subprograms that perform such naval architectural calculations as trim lines, longitudinal
strength, floodable length, and intact stability.?6'
The longitudinal strength module of SHCP is used to derive the longitudinal
moment distribution in all load and seastate variations studied. Figure 4-1 is a body plan
generated by SHCP using the offsets for FFG36-61. Figure 4-2 presents an isometric
vifew of the hull as modelled.
The longitudinal strength module of SHCP calculates a longitudinal hydrostatic
buoyancy distribution using the longitudinal weight distribution and the hull offsets.
SHCP calculates the longitudinal center of gravity (LCG) and displacement from the
given weight distribution. The program next calculates the draft and trim corresponding
to this LCG and displacement. SHCP determines the buoyancy for each section of the
hull between stations. The net load on each section is the difference between the
buoyancy and the weight. SHCP integrates the load longitudinally to determine the shear
["61Ship Hull Characteristics Program Users Manual, CASDAC #231072,NAVSEC 6133E/6105B, January 1976, p. -1.
25

Figure 4-1: SHCP Body Plan of FFG36-61
at each station. The shear is then integrated to determine the bending moment at each
station.
The SHCP longitudinal strength module output consists of a file containing an
input summary and values for buoyancy, shear, and moment organized by station. SHCP
also provides graphical representations of these data. Appendix B contains the SHCP
output files showing the shear and bending moment values for each condition. The
26

Figure 4-2: SHCP Isometric View of FFG36-61
27

graphic SHCP output is also included in Appendix B. The moment values at each station
are used in the remainder of the calculations.
Simple beam theory is now applied to derive the hull deflection. The differential
equation for the elastic curve of a beam is
ay M(x) (1)ax 2 E(x)
where: x = length along the beam's axis
y = deflection perpendicular to the axis
M(x) = moment along the axis
I(x) = area moment of inertia of beam section
E = modulus of elasticity of beam material
Integrating this equation twice gives an expression for the deflection at any point
along the x-axis of the beam:
dyl M(x ) ax+a (2)
a E 1(x)
dd
y(d )ff axax+ad+b (3)00 I(x)
where: d = distance along x-axis
The hull girder can be assumed to flex relative to a straight line between the
forward and aft ends. The deflections at these points are zero.
y(O,L)=O (4)
28

Applying these boundary conditions allows one to solve for the constants of integration:
L L
a=- 1 f M(x) xax (5)EL j l(x)
b=O (6)
The final equation for the deflection of a beam of length L simply supported at each end
is:
dd LL1 ( a M(x) dff _x Oxx (7)Eo I(x) axax- LE I()ax
The integrations are performed using the trapezoidal rule approximation on a
station-by-station basis. Between each station the appropriate values for the bending
moment and moment of inertia are used. Because the hull material is constructed entirely
of steel, a constant value, 13,400 ltons/in2, is used for the modulus of elasticity."'7
Following the previously described procedure results in the still water deflection
for the FFG61 in full load condition. To investigate the effects of altering the loading
condition, three other load conditions are checked. They are:
1) full load except for an 80 percent fuel load,
2) full load except for a 60 percent fuel load, and
3) minimum operating condition.
The hull flexure is calculated for a condition of all loads at full load except for
fuel, which is at 80% of full load. This second load condition depicts a probable
I7 1]"Longitudinal Strength Calculations", Design Data Sheet (DDS) 2900-1-q,Department of the Navy, 27 December 1950.
29

operational condition. Fuel is the only load item of any significant weight to fluctuate
during routine operations. Warships typically operate with replenishment vessels and take
on fuel and stores often. Frigates will usually refuel when close to the point of 80% fuel
remaining.
The fuel is next reduced to 60% of full load. This condition is a realistic lower
limit for actual operational conditions. US Navy ships will rarely go below the 60% fuel
point. As with the 80% fuel condition, all loads except ship's fuel are left at their full
load values. Ballast seawater is added at the 60% fuel condition. This is discussed later
in this chapter.
The minimum operating condition is used as a lower limit for load conditions.
Minimum operating condition, or Condition B, is a load condition both recognized and
well defined by the US Navy. Appendix A shows how the various loads are adjusted for
the minimum operating condition.['8]
The minimum operating condition is often used for stability predictions. For this
reason, items typically stored high on the ship (missiles, torpedoes, depth charges, and
aircraft) are at their full load values. Most of the other load items (i.e., aircraft and ship
fuel, lube oil, provisions, and ammunition) are at one-third of their full load values in the
minimum operating condition.['9]
The minimum operating condition denotes a worst case load condition from an
operational standpoint. A US Navy frigate at sea would rarely, if ever, reach the
minimum operating condition.
[1'8 Naval Ship's Technical Manual, Chapter 096 "Weights and Stability",NAVSEA S9086-C6-STM-000, 15 February 1976, p.1 9.
[19Ibid.
30

The FFG7 class has fuel oil storage tanks distributed longitudinally from frame
56 to frame 250. How fuel is distributed between these tanks influences the hull
deflection. Each class of US Navy ship is provided with fuel and ballast sequence tables.
These inform the crew as to what order fuel and ballast tanks should be used. The fuel
and ballast sequence tables for the FFG7 class are used for determining the fuel and
ballast distributions for the conditions involving fuel amounts below that of full load.
HULL DEFLECTION IN STILL WATERFFG61, FULL LOAD AND MINIMUM OPERATING CONDITION
4
.,-. 2
1
'1.6 6 . 2 X 4 2.6 11.2 tl i 12. A l2.4 14f 113.2 US.L 216 2.4 214, 15.2 2456 30.1 A. 4 346 .1 .2 At 7, .1 I I
Distance from FP
-- FULL LOAD - 80 % FUEL
-, 60% FUEL - MINIMUM OPERATING CONDITION
Figure 4-3: Hull Deflections for Full Load, 80% Fuel, 60% Fuel, and Min. Ops.
The calculations for the hull deflections, starting with the SHCP generated moment
distributions, are included in Appendix C. Figure 4-3 presents a summary of the hull
deflections for the full load, 80% fuel, 60% fuel, and minimum operating conditions. The
FFG61 is in a hogging condition at full load. This can be predicted by examining the
31

SHCP plot of weight and buoyancy distribution for the full load still water condition
included in Appendix B. The hogging condition increases at the 80% load, 60% load,
and minimum operating condition. This is primarily because the larger fuel tanks are
located towards amidship. These fuel tanks amidship are also the first to be emptied, as
dictated in the FFG7 fuel and ballast sequence tables.
The 60% load and minimum operating condition result in similar deflections. This
is because the primary load item is ship's fuel. As fuel is reduced from 60% to the 33%
specified for the minimum operating condition, seawater ballast is added to empty fuel
tanks. This results in only a small change in weight and its longitudinal distribution.
No seawater ballast is specified at the full load or 80% fuel conditions. At the
60% fuel condition two ballast tanks are full. At minimum operating condition eight
tanks are full of seawater ballast. These eight tanks include all four of the ship's
dedicated seawater ballast tanks. Some of these ballast tanks are towards the ends of the
ship, thus further contributing to the higher hogging deflections at the 63% fuel and
minimum operating condition.
The eight tanks containing ballast water at minimum operating condition include
four fuel tanks that were emptied as fuel was consumed. Ballast water placed in empty
fuel tanks is referred to as dirty ballast. Operators are very hesitant to use fuel tanks for
ballast, even when doing so is specified for stability reasons. The ballast water inevitably
contains some fuel which is discharged overboard when the tanks are emptied. There are
also small amounts of seawater that remain in the fuel tanks and can contaminate the next
load of fuel. The fuel and ballast sequence tables recommend that dirty ballast commence
at a point when approimately 60% of the ship's fuel is remaining. Below the point of
32

about 40% fuel remaining, only dirty ballast tanks remain to be filled. The 60% fuel
condition represents the lowest fuel load attainable without resorting to using dirty ballast,
as prescribed by the fuel and ballast sequencing tables.
33
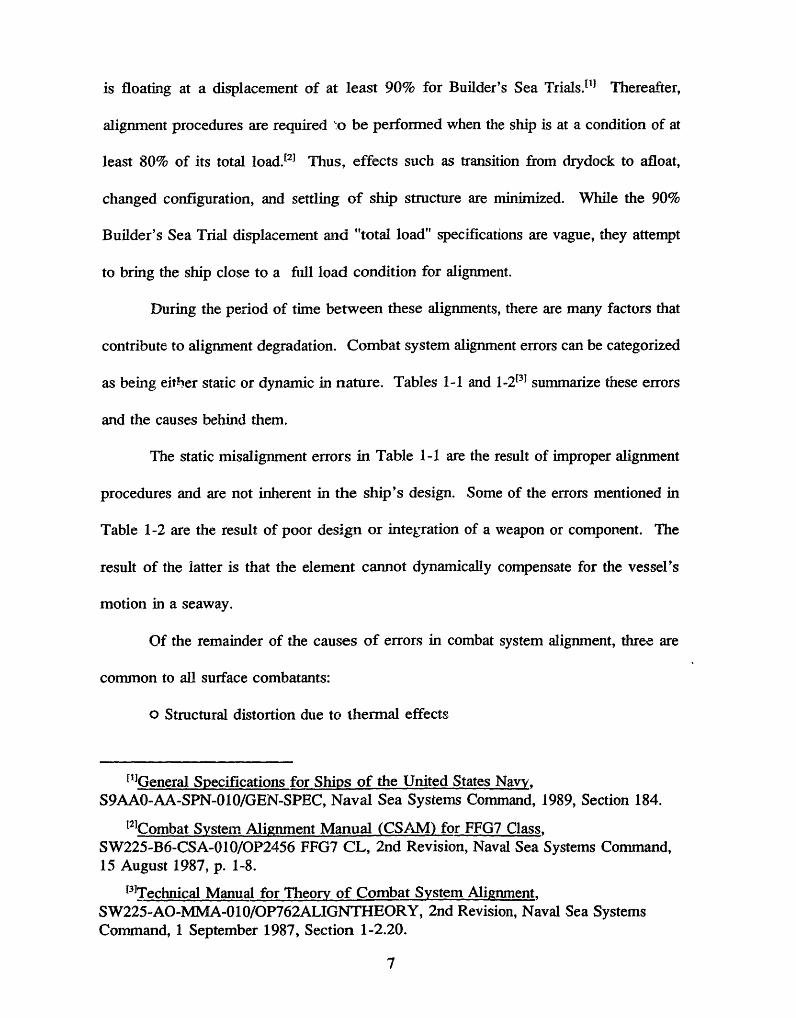
5. Hull Deflections Due to Wave Induced Bending Moment
Analyzing hull deflections due to wave induced bending moments involves the
basic steps presented at the beginning of Chapter 4. Instead of varying the load
conditions, the hull is superimposed on a wave profile of varying height. Wave stresses
are low-frequency dynamic loads that result in negligible dynamic amplification. This
neglects any effects of slamming and hull whipping.
Wave primary stresses in the hull girder are often examined using quasi-static
methods. Typically, the ship is considered in a state of static equilibrium on either the
trough or the crest of a wave. The wavelength is usually taken as equal to the ship's
length to achieve the maximum effect on hull bending moment. As in a still water case,
the weight of water displaced by the hull equals the ship's weight. The longitudinal
buoyancy distribution is calculated using the wave surface instead of the still water draft.
The computations for load, shear, and moment distribution are identical to those for the
still water condition.
SHCP uses the quasi-static method to calculate longitudinal distributions of hull
bending moment in waves. Various combinations of wavelength, height, and longitudinal
position can be specified. Regular trochiodal waves are used. For each wave profile,
SHCP determines the draft that results in the correct displacement.
The quasi-static approach is an approximate method. It neglects the motions of
the vessel and the hydrodynamic pressures between the hull and waves. Experimental
data has shown the quasi-static method tends to overestimate the bending moments caused
by waves.t20l
t20 Principles of Naval Architecture, Vol. I, pp. 212-3.
34

A standard for US Navy hull structural design is the wave stress from a wave of
height equal to I.1'fLBP[21 . For the FFG7, this results in a wave height of 22.2 feet
for initial hull strength design criteria. It was decided to examine the effects of waves
having heights equal to the mean values of the significant wave heights for seastates 2,
4, and 6. Seastate 6 has a average significant wave height of 16.4 feet. This is
considered a sensible upper limit for purposes of evaluating the effects on combat system
alignment. At seastates in this region, a frigate's ability to fight is degraded from other
causes. Ship motions at these higher seastates make conducting combat operations
extremely difficult. Warships of frigate dimensions are typically required only to
maintain mobility and maneuverability in higher seastates.
Table 5-1: Seastate 2, 4, and 6 Characteristics in North Atlantic
SEASTA AVERAGE MODAL WAVE WAVELENGTH, BASEDTE SIGNIFICA PERIOD, T ON L=5.118T 2
NUMBER NT sec. ft.
HWAVE MOST RANGE MOST RANGEHEIGHT, PROBAB PROBABLE
ft.LE
2 1.0 7.5 3.3-12.8 288 56-839
4 6.2 8.8 6.1-15.2 396 190-1182
6 16.4 12.4 9.8-16.2 787 492-1343
Table 5-11221 contains statistical data on seastate occurrences in the North
Atlantic. It must be noted that actual sea conditions are not usually the regular trochoidal
"2'1 "Longitudinal Strength Calculations", Design Data Sheet (DDS) 2900-1-q.
t21Principles of Naval Architecture, Vol. III, p.28.
35

waves that SHCP uses in its quasi-static analysis. Actual sea conditions are irregular and
better represented by a spectrum of frequencies. To use such a spectral representation of
the sea for these purposes would be beyond the scope of this thesis. The quasi-static
method using regular trochoidal waves will yield results that are accurate enough to be
of value.
A constant wavelength equal to the FFG7's LBP is used. Similar to using regular
waves, using a constant value for the wavelength is a practice that simplifies the character
of actual ocean waves. It is a simplification that will provide conservative results. A
wave of any height will have a maximum effect on bending moment when its length is
the same as that of the ship.
The SHCP output for the analyses of the ship in waves are included in
Appendix B. The output lists tabular values for both the quasi-static buoyancy and the
shear and bending moments. Each SHCP output file contains both hogging and sagging
calculations for one wave height. The SHCP graphic output depicts the actual wave
profile as well as the buoyancy, shear, and moment distributions. Figure 5-1 shows the
hull deflection from the full load condition in seastates 0, 4, and 6. The deflections for
seastate 2 are not included in Figure 5-1 because they are not appreciably different from
the deflection at still water. It must be remembered that the deflections shown in Figure
5-1 are due to wave action and are dynamic with respect to the seastate 0 deflection. An
interesting observation is that the hull experiences a true sagging moment only ir. the
trough of a wave of seastate 6 height. As discussed in Chapter 4, this is due to the still
water hogging condition of the ship.
36

HULL DEFLECTION vs SEASTATEFFG61-PULL LOAD CONDITION
10
8
6
a
9_r__A
9E5UPR
2
0
-429 , "l ti .4 11 I, 62 16.0 1224 11t 1 1 16 t I o 4 A 6 Ifi Xs2 1154 161 2 4 I ST12 121 4l1 I2
FEE AFT of PP
B_ 0 , 4-hog x 6-hog + 4-sag ; 6-9sag
TROCHIODAL WAVE, WAVELENGTH408 ftSEASTATES (WAVEHEIGHT, ft): 2(1.0), 4(6.2), 6(16.4)
Figure 5-1: Full Load Deflections in Seastates 0, 4, and 6
37

6. Effects on Combat System Alignment
The vertical deflections caused by load variations and seastate (Figure 4-3 and
Figure 5-1) do not directly effect the combat system alignment. The maximum deflection
from the full load still water condition calculated is about 6.6 inches in the seastate 6
sagging condition. What could pose a problem for the combat system alignment is the
rotation between combat system components due to the hull deflection. As described in
Chapter 3, all alignments are specified in minutes of arc. The angular displacement
between the combat system components must be calculated to assess the impact of load
variations and seastate on combat system alignment.
The steps taken in assessing the angular displacements are as follows:
1. Fit a curve to the displacements calculated in Chapters 4 and 5.
2. Take the derivative of the curve.
3. Use the derivative to obtain values for the slope of the hull at various
longitudinal locations. Convert slopes to minutes of arc units.
4. Determine amount of rotation between various elements in combat system.
5. Evaluate these inter-element rotations relative to the full load condition.
This procedure has been used successfully by at least one shipyard for determining if a
vessel complies with the intent of the 80% and 90% displacement requirements at the
time of combat system alignment.[23 ]
The first step is to fit a curve to the calculated displacements. A fourth order
polynomial is used for this purpose. The polynomial has the form
[23jp. Lacey, "Battery Alignment Hull Deflection Method", Department 86NA, BathIron Works, 24 July 1989.
38

y=C+Dx+Ex2 +Fx3 +Gx4 (8)
The coefficients in Equation (8), C, D, E, and F, are computed so the resulting
polynomial will provide a least squares fit. The coefficients are found using the following
matrix operations:
A=
i ,x 2 3 41 xo Xo X xo
I X X2 3 41 X X Xi x
I Xn X2 X3 Xn
C
D
E
F
G
bo
bi
where x,, x2,...,x~= longitudinal locations where deflections are calculated
b,, b2,...,bn= calculated displacement values at locations x,, x 2,...,x,
The matrix U containing the coefficients for Equation (8) is computed by the following
group of operations involving matrices A and b.
U=(A TA)-A Tb (9)
where AT= the transpose of matrix A
(ATA)-'= the inverse of the matrix product of AT and A
The resulting matrix U contains the coefficients for the least squares fourth order
polynomial curve. The actual matrix calculations are done on spreadsheets. The curve
coefficients for each case are included in Appendix C.
39
U=
b=
bn

The remaining steps in the calculations are straightforward. The spreadsheets in
Appendix C show slopes and rotations in minutes of arc for the following components
of the combat system:
Mk 13 Missile Launcher ( 70 feet aft FP)
CAS Fire Control Radar Antennae (120 feet aft FP)
STIR Fire Control Illuminator (208 eet aft FP)
Mk 75 Gun (240 feet aft FP)
These items were selected for analysis for two reasons. First, the Mk 13 and Mk
75 represent fore and aft limits of the FFG7's combat system. Second, they all are
components associated with the fire control system and have relatively tight alignment
tolerances. Other longitudinal locations can be investigated by using the derivatives of
the appropriate deflection curves in Appendix C.
Table 6-1 shows the effects of the load variations on the inter-element alignment
relative to the full load, condition. It is assumed that the combat system is initially
aligned when the ship is at full load. The still water deflection present in the full load
condition would be taken into account during the alignment procedure. For this reason,
Table 6-1 presents inter-element rotations relative to the full load state.
The rotations shown in Table 6-1 are largely influenced by the elements'
longitudinal separation. The Mk 13 launcher and the Mk 75 gun show the largest rotation
because they are the elements farthest away from each other. Likewise, the CAS and the
Mk 13 are relatively close longitudinally and the alignment between them is not affected
as much by hull flexure.
40

Table 6-1: Load Condition Effects on Inter-Element Alignment
Combat System Element Pairs Rotation Between Elements of Combat System(not all element pairs shown) Relative to Full Load at Specified Load
Conditionin arc-minutes
80% Fuel 60% Fuel MinimumCondition Condition Operating
Condition
Mk 75 - STIR 0.13 0.22 0.22
Mk 75 - CAS 0.41 0.80 0.84
Mk 75 - Mk 13 0.50 1.05 1.14
STIR - CAS 0.28 0.58 0.62
STIR - Mk 13 0.37 0.83 0.92
CAS - Mk 13 0.09 0.25 0.29
The inter-element rotational displacements are determined for the wave induced
deflection cases using the procedure previously described. Figure 6-1 shows the
inter-element rotations of the Mk 13, CAS, STIR, and Mk75 at seastates 0, 2, 4, and 6.
As with the rotations in Table 6-1, those in Figure 6-1 are relative to the baseline full
load seastate 0 condition. It must be remembered that the deflections caused by wave
action are dynamic while those caused by load variations are effectively static. For
example, the alignment between the CAS and the STIR in seastate 4 would be varying
from -2.3 to +2.2 arc minutes as the vessel passes from wave crest to trough.
Comparing the magnitudes of the deflections in Table 6-1 with Figure 6-1
indicates that the deflections caused by seastate can be much more severe than those
caused by load variations. The hull deflection caused from varying the load from full
load to minimum operating condition is similar to the deflection caused by a wave
41

INTER-ELEMENT ALIGNMENT vs SEASTATERI-PULL LMAD CDMITION, DEFLPtIIONS BEIWEEN ELIMs, RL. TO SSTT 0
15
10
- 5
0
-5
-In
-6 -4 -2 0 2 4 6SEASTATE (- sagging, + hogging)
-- MK13-CAS -- K13-STIR i MK13-MK75
CAS-STIR CAS-M75 - STIR-MK75
TROCHIAL WAVE, WAVELENCH-408 ftSEASTAES (WAVEHEIGHT, ft): 2(1.0), 4(6.2), 6(16.4)
Figure 6-1: Inter-Element Alignment at Seastates 0, 2, 4, and 6
slightly larger than the seastate 2 wave height used, about 2 feet.
It was initially intended to run combinations of load variations and seastates in
order to obtain a matrix of results. The difference in magnitudes between the effects of
the two indicated that this effort would be unproductive. A frigate is much more likely
to encounter a seastate in the 4-6 range than it is in obtaining a minimum operating load
condition.
The rotations calculated for both the load conditions and the seastate conditions
are in the vertical centerline plane. The effects that the predicted rotations will have on
the combat system will depend on the actual train and elevation to which the elements
are directed. If, for example, the Mk 75 gun and the Mk 13 missile launcher are both
42

trained to 90 ° (from the bow) and at zero elevation, ther, the rotations previously
described will be along the pointing lines of the gun and launcher and will not effect the
alignment. As the train deviates from 90 ° and/or the elevation angle increases from zero,
the effects become pronounced.
The load variations examined have an insignificant effect on combat system
alignment. The highest inter-element deflection is 1.14 arc minutes between the Mk 75
gun and the Mk 13 missile launcher. This is well within the gun's operational roller path
inclination tolerance of ±3 arc minutes. Additionally, there is no actual need for' the gun
and the missile launcher to be precisely aligned. They are both directionally steered by
the Mk 92 fire control system. The Mk 92 fire control system relies on the CAS, STIR,
and WSN-2 gyrocompass for bearing and elevation input. It then feeds this information
to the gun and launcher. The most demanding tolerance is for the WSN-2 gyrocompass
and is :1 arc minute for its operational roller path inclination. Since the CAS, STIR, and
WSN-2 are longitudinally between the gun and missile launcher, the relative roller plane
inclinations for "drive-driven" combinations of elements will be less than one minute of
arc.
The effects of load variations on alignment becomes even less significant when
one considers how infrequently a frigate attains a load case like the 60% fuel or minimum
operating condition. The 80% fuel condition examined represents a much more realistic
fluctuation from full load. At the 80% fuel condition, the rative inter-element
inclinations are about one-half of the inclinations at the 60% fuel and minimum operating
condition.
43

The effects of seastate on combat systems alignment are more significant than the
effects of loac variations. As previously mentioned, the element with the most
demanding alignment tolerance is the WSN-2 gyrocompass at i± arc minute. The CAS
and STIR radars have a tolerance of ±2 arc minutes. The Mk 75 gun has an elevation
tolerance of ±2 arc minutes and a RPI tolerance of ±3 arc minutes. As shown in
Figure 6-1, only pairs of elements very close to each other (Mk 13-CAS, STIR-Mk 75)
have relative deflections of less than ±1 arc minute at seastate 4. Other combinations
(CAS-STIR, Mk 13-STIR, and CAS-Mk 75) and are in the range of ±2 to ±3 arc minutes
at seastate 4. This amount of rotation is at the limits of the RPI tolerances for these
elements.
There are several operational consequences of the combat system components
being out of alignment. The gun could be misaligned with its ontrolling radar. In the
FFG 7 class the CAS performs both search and track functions for the Mk 92 fire control
system. The gun could also be misaligned with the WSN-2 gyrocompass. The gun is
depending on the gyrocompass for roli and pitch stabilization and the actual aim point
would be fluctuating about the desired target. Both the WSN-2 and the CAS are
longitudinally far from the gun. This amplifies the effects of any hull flexure.[24 ]
Ships with different combat systems can experience other problems. Many
modem US Navy destroyers and cruisers depend on the accurate pointing of radar target
illuminators for AAW engagements. The illuminators have a very narrow beamwidth and
are aimed at the target by a separate tracking radar. Misalignment between the track
l2 "Combat Systems Engineering in Ship Design", Vol. 1, General Electric,Government Electronic Systems Division, Moorestown, New Jersey, p. GA-17.
44

radar and the illuminator could cause an in flight missile to loose its guidance signal. The
FFG7's missile fire control illuminator, the STIR, has its own tracking capability and does
not depend on another radar for train and elevation information once it has acquired a
target. Precision remote electro-optical target designation devices also are sensitive to
alignment variables. The FFG7 class uses an manual optical target designation transmitter
for gun fire control, but it is not as sensitive as newer automated systems. The SPY-ID
phased array radar system aboard the CG47 class cruiser is sensitive to having the array
faces, which are mounted on separate deckhouses, maintaining alignment with respect to
each other. The newer cruisers and destroyers also carry more modem AAW missiles
having inertial reference units for midcourse guidance. These units are also sensitive to
alignment.[2 5]
At seastate 6 all element combinations examined are outside of ±2 arc minutes of
deflection relative to calm water. Two combinations, Mkl3-STIR and Mk 75-CAS, are
in the ±7 to ±10 arc minute range. This is well outside the RPI tolerances for all of these
elements except the Mk 13 launcher. The launcher does have a ±5 arc minute tolerance
for elevation alignment which is exceeded.
The element combination with the most severe relative deflection, the Mk 75 gun
aft and Mk13 launcher forward, is not considered as significant as gun-radar or
launcher-radar combinations. This is because the gun and launcher lack any direct
functional relationship, i.e., one does not direct the other. This is taking a different
approach than the alignment procedure, described in Chapter 3, takes. The alignment
procedure uses the Mk 75 gun's roller path plane as the reference plane for aligning all
t 51"Combat Systems Engineering in Ship Design", Vol. 1, p.GA-17.
45

other elements. After an alignment, we are more concerned with how various factors
degrade the operability of the system. To do this, the interdependence of the combat
system components must be considered.
46

7. Conclusions
It has been shown that load variations do not significantly affect the operational
alignment of the combat system of the FFG61. These results should apply to all of the
LAMPS II equipped frigates in the class (FFG8, FFG36-61). Fuel is the only major load
item that typically varies. Since the LAMPS I versions of the FFG7 class have similar
fuel capacities, it follows that these results should also apply to the LAMPS I versions
as well.
The effect of waves are also calculated. The results indicate that the waves cause
enough flexure in the hull to be of concern. At seastate 4, the inter-element alignment
fluctuates with magnitudes near the alignment tolerance for several of the components.
At seastate 6, hull deflections result in misalignments on the order of 9 arc minutes
between the CAS and Mk 75 gun and between the STIR and Mk 13 launcher. This
exceeds the elements' individual operational roller path inclination and operational
elevation alignment tolerances.
There are several assumptions made in determining the wave induced hull bending
moments. One assumption involves the use of the quasi-static method. As mentioned
in Chapter 5, the quasi-static method tends to overestimate the wave induced bending
moment somewhat. It neglects ship motion and hydrodynamic pressures on the hull. A
second assumption consists of the use of regular waves of length equal to LBP. Like the
quasi-static method, the use of regular waves of length equal to LBP represents a
conservative simplification of a complex situation.
A possibility for future research in this area would be to conduct a study on the
effects of waves using a program based on strip theory. Strip theory would result in a
47

more accurate prediction of the moment distribution along the hull girder. This approach
could also be combined with a statistical representation of waves at various seastates.
Together, these two refinements would yield more accurate results.
This thesis does not attempt to account for misalignment due to deflections in
masts, equipment supporting structures, and/or the ship's superstructure. The analysis of
these structures would be best handled by finite element methods.
This thesis also omits the effects of structural distortions caused by teuiperature
differences. Thermal distortions can' affect the hull girder, the superstructure, and
individual equipment foundations. When a hull encounters both cool water and warm air
it will tend to hog. This flexure would add to the flexure caused by fuel being consumed.
The combination may be significant. The combination of thermal effects and wave
effects should not be of concern because extreme thermal deflections would typically not
occur in unison with high seastates. Finite element analysis would be required to assess
thermal effects.
The Ship Specifications for the DDG51 class of destroyer, the US Navy's most
modem surface combatant, requires the computation of inter-element alignment variances
for changes in loading, sea and air temperature, and wind speed. Based on the findings
of this study, the effects of seastate should be included in this requirement.
The general US Navy requirements specifying a minimum vessel displacement for
alignment purposes, mentioned in Chapter 1, are not effective. The intent is to insure that
the hull is in a state of deflection during alignment hat is similar to that at full load
condition. For the FFG61, the displacement at minimum operating condition is 96% of
the displacement at full load. The loads at minimum operating condition are reasonably
48
distributed because much of the consumed fuel is replaced by ballasting empty fuel tanks.
If the displacement is only at the 80% full load specification, whether from the absence
of loads or the removal of lightship items, the weight distribution could be considerably
different than those analyzed in this thesis. Many load items are removed when a vessel
is in a shipyard for repair or overhaul. Shipyard equipment on board also affects the
weight distribution. It is possible to comply with the letter of this requirement without
complying with the intent of the requirement.
During new construction combat system testing and checkout is usually done
concurrently with the final stages of outfitting. Scheduling difficulties often necessitate
conducting alignment procedures before the ship is near the full load condition. In this
circumstance it would be possible to use the method presented to predict the flexure of
the hull as compared to the flexure at full load condition. The differences could be
included in the alignment process. As a result, the combat system would approach its
desired alignment condition as the ship approaches the full load condition.
Modern naval combat systems have strict alignment tolerances. There is little that
can be done to remedy the alignment problems mentioned after a ship is built. It would
be beneficial to analyze potential problems with combat system alignment during contract
design to ensure against compromising the combat system effectiveness in the conditions
specified by the Top Level Requirements.
49

Appendix A: Longitudinal Weight Distributions
FULL LOAD AND 80% FUEL CONDITION ........................ 52FULL LOAD AND 60% FUEL CONDITION ........................ 54FULL LOAD AND MINIMUM OPERATING CONDITION .............. 56
50

The spreadsheets in this Appendix A present the loads in the FFG61 Final Weight
report in a tabular form. The full load condition is presented in the second column. If
less than full load is desired, the adjustments can be entered, as a percentage of full load,
in the third column. Ballast can be added in a similar fashion. If a load item bas a
capacity load (i.e., tanks) which is higher than its full load value, the capacity load is used
for the percentage. The second portion of each spreadsheet computes a full load
longitudinal 20-station weight distribution based on the FFG36-61 Longitudinal Strength
Drawing. For less than full load conditions, the weight distribution by longitudinal section
is adjusted accordingly.
51

** FULL ID AND 80% FUEL CNDITICN **
ILD ITEMCFfICERS, CREW, & EFFECTSICP]ElES IN TUBeS
MISSILES76m IN MXNT & AG.SALL AICIWS IN N AND MG.ICRPECES IN Mb.SCNXUYSCAD (CARIDG ACrV. DEV.)OTHERIAPS III HEIfCHELO SUPPCRTHELD SPARESA.fNT.HELO OP. FIDSDRY, CHILL, & FREEZE PRVT.SHIP'S S STR4SMALL SESGENERL S~TES, WGEN STES, AFT** LIQID LOADS **PCAE WSE
5-292-2&3 W5-308-1&2 W
COLTZCflM3 & HDITN TANK4-170-0 W
IUBE OIL SCRAGE3-272-2 F3-278-2 F3-286-2 F
SSGD LBE OIL4-208-2 F3-236-1&2 F3-292-8 F
LUE OIL SEILIG3-278-1 F3-286-1 F
DIESEL OIL SICRAGE5-56-0 F5-64-0 F5-84-1&2 F5-100-3&4 F5-116-1&2 F5-140-1&2 F5-164-2&3 F5-250-1&2 F
DIESEL OIL SERVICE5-204-1&2 F5-201-1&3 F3-240-1&2 F3-292-4&6 F2-276-2 J
JP-55-328-0 J5-344-0 J3-316-1 J3-322-1 J
TOML TIfDS:
WTCAP
LCAD
WT % CFFULL FULLIAD IPD
ltons ltons24.39
1.3624.5511.293.154.934.084.290.750.75
15.915.103.141.17
23.583.490.31
10.528.21
100%100%100%100%100100%100%100%100%100%100%100%100%100%100%100%100%100%100%
WTAT
GIVEN %ltons24.391.36
24.5511.293.154.934.084.290.750.75
15.915.103.141.17
23.583.490.31
10.528.21
DIFF LOG FI04 LCG FECMFRM MIM-SHIP FP
WI-FL LC3-MSltcns ft.0.00 54.20.00 -8.90.00 130.00.00 -36.00.00 143.00.00 -107.00.00 -23.00.00 -74.00.00 153.00.00 -45.00.00 -96.00.00 -135.00.00 -61.00.00 25.30.00 13.00.00 4.00.00 146.00.00 160.00.00 -155.0
I-CG-FPft.
149.8212.974.0240.0
61.0311.0227.0278.051.0249.0300.0339.0265.0178.7191.0200.058.044.0359.0
17.44 100% 17.44 0.00 -94.0 298.015.76 100% 15.76 0.00 -116.0 320.0
2.96 0.00 100% 2.96 2.96 30.1 173.9
3.504.002.75
100% 3.50100% 4.00100% 2.75
0.95 100% 0.952.10 100% 2.100.92 100% 0.92
0.00 -70.60.00 -78.00.00 -85.1
0.00 -6.30.00 -34.30.00 -89.1
274.6282.0289.1
210.3238.3293.1
3.58 0.00 100% 3.58 3.58 -77.9 281.92.42 0.00 100% 2.42 2.42 -84.7 288.7
14.8342.05
112.7465.40
133.7257.8619.6168.40
94.62.445.162.491.08
64.580.000.000.000.00
26.5129.803.803.70
100%100%100%66%
100%87%
100%0%
50%50%50%50%50%
100%100%100%100%
891.53 841.38
14.8342.05112.7443.16133.7250.3419.610.00
47.301.222.581.250.54
26.5129.803.803.70
0.000.000.00
-22.240.00-7.520.00
-68.40
-17.281.222.581.250.54
0.000.000.000.00
143.9129.6111.892.375.651.832.0-59.8
-4.01.7
-40.7-89.2-73.1
-131.7-150.8-114.9-120.8
60.174.492.2
111.7128.4152.2172.0263.8
208.0202.4244.7293.2277.1
335.7354.8318.9324.8
740.49
52
-I-
FFG: LODS AD L07 s

WVCAP
TID
WTTFULLIAD
ltcns ltcns
% OF WT DIFF LCG FP(MFULL AT FR1U MID-SHIPILOD GIVEN % WV-FL LCG-MB
% ltons ltons ft.
** SW BA.AST **5-32-0 W5-116-0 W5-250-1&2 F5-328-1&2 W5-100-3&4 F5-140-1&2 W5-64-0 F
TNK CAP45598324
0%0%0%0%
0 00 00 00 0
79 0% 0 00%0%
TCIMS BAL.:TO LOADS, INCIDIS BALST:
0740.5
0-100.9
SPREADSHEET FOR OCMfPUTIN I ITUDINAL WEIGHT DIS1RIBUTI(NFFG36-61
BASEID CN THE ILq.. SREGH DRAW//GS
DESIRED DISPIACEEN 3987.7 ltcns Fran FFG61 FINAL WT REPT (JULY 1989)
SDATICA 00 11 22 33 44 55 66 77 88 99 10
10 1111 1212 1313 1414 1515 1616 1717 1818 1919 2020 B
fromn-28.3
0.020.440.861.281.6102.0122.4142.8163.2183.6204.0224.4244.8265.2285.6306.0326.4346.8367.2387.6408.0
420
FFP/ME CD. FFlU IDW.to
0.020.440.861.281.6
102.0122.4142.8163.2183.6204.0224.4244.8265.2285.6306.0326.4346.8367.2387.6408.0420.0
WT/ft0.380.781.481.963.764.305.205 343.623.524.444.704.524.305.564.703.303.342.282.942.440.50
WT/ft*dx10.815.930.240.076.787.7106.1108.973.871.890.695.992.287.7113.495.967.368.146.560.049.86.0
1495.3
FULL LADWEIGHT, ltons
28.742.480.5106.6204.6233.9282.9290.5196.9191.5241.5255.7245.9233.9302.5255.7179.5181.7124.0159.9132.716.0
3987.7
80% FUEL CXtD.WEIGHT, ltons
28.742.480.5106.6204.6233.9260.7290.5189.4194.5242.8238.4248.5165.5306.6259.4179.5181.7124.0159.9132.716.0
3886.8
53
LOD ITE4
LCG FECFP
ILG-FPft.
44124
263.8341
111.7

** FULL LOAD AND 60% FUEL CNDITICON **
LPD IMCFFICERS, CEW, & EITOPIDOES IN TUBESMISSITS76m IN MT & MG.SmuLL A1tECIM IN MMT D NAG.TPE:iES IN MAG.SaONolUYSCAD (CAMR(DGE ACIr. DEV.)OTHERIAMS III HELSHEO SUPP0c8HEW SPESINT.HEW c P. FLUEDSDRY, CHILL, & FREEZE PROV.SHIP'S STORE StSMLL S WRESGENERAL STES, DGEN STRES, AFT** LIQUID LaDS **POIABE ER
5-292-2&3 W5-308-1&2 W
COCLCTI1 & HLDING TAC4-170-0 W
LJBE OIL SRE3-272-2 F3-278-2 F3-286-2 F
SSGD IUBE OIL4-208-2 F3-236-1&2 F3-292-8 F
LUBE OIL SEFTLIM3-278-1 F3-286-1 F
DIESEL OIL SICRAGE5-56-0 F5-64-0 F5-84-1&2 F5-100-3&4 F5-116-1&2 F5-140-1&2 F5-164-2&3 F5-250-1&2 F
DIESEL OIL SERVICE5-204-1&2 F5-201-1&3 F3-240-1&2 F3-292-4&6 F2-276-2 J
wr WT % CF Wr DIFF LMC FM4 I3O FW~CAP FUL FULL AT FRMMID-SHIP FP
L1MD iOAD LAD GIVEN % W-FLltcm ltcs % Itcns ltcns
24.391.36
24.5511.293.154.934.084.290.750.75
15.915.103.141.17
23.583.490.31
10.528.21
100%100%100%100%100%100%100%100%100%100%100%100%100%100%100%100%100%100%100%
24.391.36
24.5511.293.154.934.084.290.750.75
15.915.103.141.17
23.583.490.31
10.528.21
17.44 100% 17.4415.76 100% 15.76
0.000.000.000.000.000.000.000.000.000.000.000.000.000.000.000.000.000.000.00
LSG-Sft.
54.2-8.9130.0-36.0143.0-107.0-23.0-74.0153.0-45.0-96.0
-135.0-61.025.313.04.0
146.0160.0
-155.0
LCr-FPft.
149.8212.974.0240.061.0311.0227.0278.051.0249.0300.0339.0265.0178.7191.0200.058.044.0
359.0
0.00 -94.0 298.00.00 -116.0 320.0
2.96 0.00 100% 2.96 2.96 30.1 173.9
3.504.002.75
0.952.100.92'
100%100%100%
100%100%100%
3.504.002.75
0.952.100.92
0.000.000.00
0.000.000.00
-70.6-78.0-85.1
-6.3-34.3-89.1
274.6282.0289.1
210.3238.3293.1
3.58 000 100% 3.58 3.58 -77.9 281.92.42 0.00 100% 2.42 2.42 -84.7 288.7
14.8342.05
112.7465.40
133.7257.8619.6168.40
94.62.445.162.491.08
5-328-0 J5-344-0 J3-316-1 J3-322-1 J
64.580.000.000.000.00
26.5129.803.803.70
100%100%100%
0%43%87%
100%0%
50%50%50%50%50%
100%100%100%100%
14.8342.05
112.740.00
56.8350.3419.610.00
47.301.222.581.250.54
26.5129.803.803.70
0.000.000.00
-65.40-76.89-7.520.00
-68.40
-17.281.222.581.250.54
0.000.000.000.00
143.9129.6111.892.375.651.832.0-59.8
-4.01.7
-40.7-89.2-73.1
-131.7-150.8-114.9-120.8
60.174.492.2111.7128.4152.2172.0263.8
208.0202.4244.7293.2277.1
335.7354.8318.9324.8
TRA L IDS: 891.53 841.38
54
620.43
-
FEFG61 MAW AD 10G;'s

WT
LOAD
WTFU.T.
LOADltcns tons
% CFFULLLOAD
wrTAT
DIFFFR1m
% ltons tons
LCOG FRM L F4CMMaD-SHIP FP
I-m tLs-FPft. ft.
** SW BALLAST **5-32-0 W5-116-0 W5-250-1&2 F5-328-1&2 W5-100-3&4 F5-140-1&2 W5-64-0 F
TCtS BAL.:TOM LA DS, INCLJWD BALLAST:
SPREADSHEET FCR CEMPUITI ICNGITUD:NAL WEIGHTFFG36-61BASED cN TH E LCO. STRENSTH DRAWNGS
DESIRED DISPIACEMENT
104 104724.4 -116.9
DISRIBUICN
3987.7 tcns Fran FFG61 FINAL WT REPT (JULY 1989)
fran-28.3
0.020.440.861.281.6102.0122.4142.8163.2183.6204.0224.4244.8265.2285.6306.0326.4346.8367.2387.6408.0
420
FRAE COD. E4 .to
0.020.440.861.281.6
102.0122.4142.8163.2183.6204.0224.4244.8265.2285.6306.0326.4346.8367.2387.6408.0420.0
wT/ft0.380.781.481.963.764.305.205.343.623.524.444.704.524.305.564.703.303.342.282.942.440.50
OTiSS:
Wr/ft*dx10.815.930.240.076.787.7
106.1108.973.871.890.695.992.287.7113.495.967.368.146.560.049.86.0
1495.3
FULL TCPDWEIGHT, ltns
28.742.480.5106.6204.6233.9282.9290.5196.9191.5241.5255.7245.9233.9302.5255.7179.5181.7124.0159.9132.716.0
3987.7
60% FUELNEIGCr, ltons
28.742.480.5
151.6204.6233.9217.5272.6189.4194.5242.8238.4248.5165.5306.6259.4179.5181.7124.0159.9132.716.0
3870.8
55
ILD ITM
TAM( CAP4559832479
100%100%
0%0%0%0%0%
45 4559 59
0 00 00 0
44124
263.8341
111.7
SIcTIA 00 11 22 33 44 55 66 77 88 99 10
10 1111 1212 1313 1414 1515 1616 1717 1818 1919 2020 B

** FUIL LO]AD AND MINIMDM CPERAT/nG (CNDITIC **
iLCAD ITEMCFFICERS, CREW, & EFFECTST RPE~ES IN TUBESMITSST.S76m IN MXINT & 3G.S4UL AR4vCIWS IN T AND G.PEKP2S IN MAG.SCNtBCMYSCAD (CARIDGE ACTV. DEV.)OE HELO CED.IAIvPS III HELOSHELO SUPPc(rHElW SPA 4SINT.HEED CP. FUIDSDRY, CHILL, & FREEZE POV.SHIP'S STCE SM
tLm STcESGENER STOES, EFDGEN SrES, AFT** LIQUID LOADS **
PCOABILE WAER5-292-2&3 W5-308-1&2 W
OCTc Ecr. & UrIDING TANK4-170-0 W
ULBE OIL SRAGE3-272-2 F3-278-2 F3-286-2 F
SSD LUBE OM4-208-2 F3-236-1&2 F3-292-8 F
WBE OIL SEmILIM3-278-1 F3-286-1 F
DIESEL OIL SRAE5-56-0 F5-64-0 F5-84-1&2 F5-100-3&4 F5-116-1&2 F5-140-1&2 F5-164-2&3 F5-250-1&2 F
DIESEL OIL SERVICE5-204-1&2 F5-201-1&3 F3-240-1&2 F3-292-4&6 F2-276-2 J
JP-55-328-0 J5-344-0 J3-316-1 J3-322-1 J
WTrCAP
LOAD
WTrFUELiLOD
ltons ltcns24.391.36
24.5511.293.154.934.084.290.750.75
15.915.103.141.17
23.583.490.31
10.528.21
% cFULL
LCAD
1001100%100%33%33%33%
100%33%33%33%
100%100%
100%100133%33%33%33%33%
WrAT
GIVEN %ltons24.391.36
24.553.761.051.644.081.430.250.25
15.915.103.141.177.861.160.103.512.74
DIFF ILG FRC IG FRMFfU4 MID-SHIP FPWT-FLltCns0.000.000.00
-7.53-2.10-3.290.00
-2.86-0.50-0.500.000.000.000.00
-15.72-2.33-0.21-7.01-5.47
LOS-MSft.
54.2-8.9130.0-36.0143.0-107.0-23.0-74.0153.0-45.0-96.0
-135.0-61.025.313.04.0
146.0160.0-155.0
IGn-FPft.
149.8212.974.0
240.061.0
311.0227.0278.051.0249.0300.0339.0265.0178.7191.0200.058.044.0
359.0
17.44 67% 11.63 -5.81 -94.0 298.015.76 67% 10.51 -5.25 -116.0 320.0
2.96 0.00 100% 2.96 2.96 30.1 173.9
3.50 33% 1.17 -2.334.00 33% 1.33 -2.672.75 33% 0.92 -1.83
0.95 33% 0.32 -0.632.10 33% 0.70 -1.400.92 33% 0.31 -0.61
-70.6-78.0-85.1
-6.3-34.3-89.1
274.6282.0289.1
210.3238.3293.1
3.58 0.00 33% 1.19 1.19 -77.9 281.92.42 0.00 33% 0.81 0.81 -84.7 288.7
14.8342.05
112.7465.40
133.7257.8619.6168.40
94.62.445.162.491.08
64.580.000.000.000.00
26.5129.803.803.70
100%100%100%
0%0%0%0%0%
50%50%50%50%50%
33%33%33%33%
14.8342.05
112.740.000.000.000.000.00
47.301.222.581.250.54
8.849.931.271.23
0.000.000.00
-65.40-133.72-57.86-19.61-68.40
-17.281.222.581.250.54
-17.67-19.87-2.53-2.47
143.9129.6111.892.375.651.832.0-59.8
-4.01.7
-40.7-89.2-73.1
-131.7-150.8-114.9-120.8
60.174.492.2111.7128.4152.2172.0263.8
208.0202.4244.7293.2277.1
335.7354.8318.9324.8
TOML LOADS: 891.53 841.38
56
379.06
-
FEG61 IOA~S AM ICG's

WTCAP
ICoD
WTFULL,LOAD
ltons ltons
% OFFULLLOD
WTAT
GIVEN %% tons
DIFF LCG FRfM LOGFCM MID-SHIP
WT-FL LCG-MS I(ltons ft.
FP0G-FPft.
** SW BALLAST **5-32-0 W5-116-0 W5-250-1&2 F5-328-1&2 W5-100-3&4 F5-140-1&2 W5-64-0 F
TCfS BAL.:TOML LCADS, INCLUDING BALLAST:
SPREADSHEET FOR tCCUTING INGITUDINAL WEIGHTFFG36-61
BASED CN THE ICNG. STRENGTH DRAWINGS
DESIRED DISPLACEMENT
STIaCNA 00 11 22 33 44 55 66 77 88 99 10
10 1111 1212 1313 1414 1515 1616 1717 1818 1919 2020 B
fran-28.3
0.020.440.861.281.6
102.0122.4142.8163.2183.6204.0224.4244.8265.2285.6306.0326.4346.8367.2387.6408.0
420
290 290669.1 -172.3
DISTRIBUTICN
3987.7 ltons From FFG61 FINAL WT REPT (JULY 1989)
FRME CRD. FRLM D.
to0.0
20.440.861.281.6
102.0122.4142.8163.2183.6204.0224.4244.8265.2285.6306.0326.4346.8367.2387.6408.0420.0
WT/ft0.380.781.481.963.764.305.205.343.623.524.444.704.524.305.564.703.303.342.282.942.440.50
ZSLS:
WT/ft*dx10.815.930.240.076.787.7
106.1108.973.871.890.695.992.287.7
113.495.967.368.146.560.049.86.0
1495.3
ULL LADWEIGFr,ltcns
28.742.480.5
106.6204.6233.9282.9290.5196.9191.5241.5255.7245.9233.9302.5255.7179.5181.7124.0159.9132.716.0
3987.7
57
IBD ITEM
AMK CAP4559832479
100%100%100%100%100%
0%0%
45 4559 5983 8324 2479 79
44124
263.8341
111.7
MN. OPS.WEIGHT, ltcns
28.742.480.5
141.8204.6233.9296.5215.8139.1174.8224.7237.8239.6248.0296.3249.5166.0188.098.7159.9132.716.0
3815.4

Appendix B: SHCP Graphic and Numerical Output
FULL LOAD, SEASTATE 0 .................................... 5980% FUEL CONDITION, SEASTATE 0 ............................ 6460% FUEL CONDITION, SEASTATE 0 ............................ 69MINIMUM OPERATING CONDITION, SEASTATE 0 ................. 74FULL LOAD, SEASTATE 2 ................................... 79FULL LOAD, SEASTATE 4 .................................... 86FULL LOAD, SEASTATE 6 .................................... 93
50°

FULL LOAD, SEASTATE 0
SSSSSSSSSS
SS SS
HHHH
HH
HH CCCCHH CCCCCC
HH CC CCSS SS HH HH CCSS HH HH CCSSSS HHHHHH CC
SSSS EHHHHHHHH CCSS HH H CCSS HH HH CC
SS HH HH CC C(SS HH HH CCCCCC
HH HH CCCC
CC PP
PPPPPPPPPPPPPPP
PP PP
CC PP PPPPPPPPPP
PpPPPPPCC PP
CC PPC PP
PPPP
PP
SHIP HULL CHARACTERISTICS PROGRAM
ODESIGN DISPLACEMENTDESIGNDESIGNDESIGNDESIGNDESIGNOLENGTHLENGTH
DRAFTLCGVCGTCGTRIMOVERALLBETWEEN
(+ ABOVE BL)(+ FWD MID)(+ ABOVE BL)(+ STBD)(+ BY STERN)
PERPENDICULARSLENGTH ON DESIGN WATERLINEOSTATION OF MAX AREA (AT DWL)BEAM AT STATION OF MAX AREASECTION AREA COEFFICIENTPRISMATIC COEFFICIENTBLOCK COEFFICIENTOSpecified Tolerances of Volume
~ME4imum Iteration for Volume
3987.720 TONS15.935 FT I-6.110 FT 0. FT 0. FT[0.993 FT
447.780 FEET408.000 FEET409.645 FEET211.429 FEET45.407 FEET0.76670.61600.4723
SW at DI
DESIGN DESIGN DESIGN DESIGN
FRCM FP
ENSITY =
LCBVCBrCBLIST
35.000 FT3/TON
(+ F MID)(+ ABL)(+ STBD)(+ STBD)
-6.110 FT9.971 FT0. FT0. DEG
=0.00001000 and LBP =0.00000500= 20 and LBP = 20
Approximate Bounding OCbe Values:
Forward X location -27.948 Ft (+ Aft FP)After X lccation 419.832 Ft (+ Aft FP)Maximuin Y value on Station 46.938 FtMinimum Z value on Station 0. Ft (+ Abv BL)Maximum Z value on Station 41.893 Ft (+ Abv BL)
Work List and Requested Options:
1 3 Longitudinal Strength
KK 3 NO Main Hull INITIAL & INTERPOLATED OFFSETS PrintedIPLOT 3 Plot Main Hull both BODY PLAN and ISCMETRICLDXF F Plots will be SHCP NEUCLiAL PIXOTFILE foxnatKKAP 3 ND Appendage INITIAL & INTERPOLATED OFFSETS PrintedIPLTAP 0 ND Appendage PLOTSIPLCON 0 Connection fraom Station ENDS to Centerline & DAE SHOWNMSGSAV 0 Do not save HULL/APPENDAGE Evaluation Messages if SuccessfulIUNIT 0 Input/Output units selected are ENGLISH-ENGLISH
1SHIP- FFG61 FUL LOAD SERIAL NMBER- 1 DATE- 6-Aug-900 LCNGITUDINAL STRENGTH CALCULATIONSOWAVE CENTER FROM AMIDSHIPS 0. FEET (+ FWD)WAVE LENGTH/LBP 1.000WAVE HEIGHT=-1.1*SQRT(LBP) 22.22 FEET
OSpecified Tolerances of Volurmre =0.00001000 and LBP =0.00000500Maxirmn Iteration for Volume = 20 and LBP = 20
0 WEIGHT WEIGHT LCG OF WEIGHT -- SECTION MODULUS --
59
SSSSSSSSSSS
SSSS
0+
0

( TCNS ) FRCM AMIDSHIPS(FT,+FWD)
28.6842.4380.51
106.63204.55233.93282.89290.51196.93191.49241.54255.69245.90233.93302.47255.69179.53181.70124.04159.94132.7416.00
(INCH**2-FEET)DECK KEEL
218.15193.80173.40153.00132.60112.20
91.8071.4051.0030.6010.20
-10.20-30.60-51.00-71.40-91.80
-112.20-132.60-153.00-173.40-193.80-210.00
ILsIP- FFG61 FULL LOAD0 LCKNGITUDINAL STRENGTH CAIJLTATICNSODRAFTS AND SECTIONAL AREAS AT VARIOUS INPUT
SERIAL NUMBER-- STILL WTERSTATICNS
1 DATE- 6-Aug-90
DRAFT STICNAL AREAFEET SQUARE FEET
15.39615.40615.41615.42715.43715.44815.45815.46915.47915.48915.50015.51015.52115.53115.54215.55215.56315.57315.58415.59415.60415.61515.62515.63615.64615.65715.66715.67815.68815.698
0.
0.0.0.0.0.0.7.377
18.96731.69345.55460.55176.68393.951
112.353131.892150.826168.393185.591202.451218.962235.125250.939266.405281.522295.832309.383322.759335.960348.986
WCATICKFT FRCM FP
195.718200.200204.682209.3.65213.647218.129222.612227.094231.576236.058240.541245.023249.505253.988258.470262.952267.434271.917276.399280.881285.364289.846294.328298.810303.293307.775312.257316.740321.222325.704
DRAFT SECTIONAL AREAFEET SQUARE FEET
15.91815.92815.93915.94915.96015.97015.98115.99116.00216.0121 .02216.03316.04316.05416.06416.07516.08516.09616.10616.11716.12716.13716.14816.15816.16916.17916.19016.20016.21116.221
548.575552.081554.701555.358555.340554.649553.283551.243548.529545.141541.078536.380531.531525.622518.654510.626501.539491.392480.185467.919454.593440.498426.141411.526396.655381.526366.140350.497334.596318.439
60
STATION(FEm pFP)
-29.000.
20.4040.8061.2081.60
102.00122.40142.80163.20183.60204.00224.40244.80265.20285.60306.00326.40346.80367.20387.60408.00420.00
LOCATICNFT FRMt FP
-27.947-23.914-19.432-14.949-10.467-5.985-1.5032.9807.462
11.94416.42720.90925.39129.87334.35638.83843.32047.80352.28556.76761.24965.73270.21474.69679.17983.66188.14392.62597.108
101.590

106.072 15.709 361.838110.555 15.719 374.516115.037 15.730 387.018119.519 15.740 399.346124.001 15.751 411.480128.484 15.761 423.297132.966 15.772 434.782137.448 15.782 445.936141.931 15.793 456.759146.413 15.803 467.250150.895 15.813 477.409155.377 15.824 487.236159.860 15.834 496.733164.342 15.845 505.755168.824 15.855 513.831173.306 15.866 521.253177.789 15.876 528.023182.271 15.887 534.140186.753 15.897 539.604191.236 15.907 544.416195.718 15.918 548.575
1SHIP- FFG61 FULL LOAD0 LONGITUDINAL STRENGTH CALCUIATIONS
330.186 16.231334.669 16.242339.151 16.252343.633 16.263348.116 16.273352.598 16.284357.080 16.294361.562 16.305366.045 16.315370.527 16.326375.009 16.336379.491 16.346383.974 16.357388.456 16.367392.938 16.378397.421 16.388401.903 16.399406.385 16.409410.867 16.420415.350 16.430419.831 16.440SERIAL NUMBER-
- STILL WATER
302.185286.233270.596255.276240.271225.582211.209197.152183.411170.491157.195143.216128.555113.212
97.18680.47963.08945.017
0.0.0.
1 DATE- 6-Aug-90
3987.72 TONS SW
0XIXCATICN WEIGHT BUOYANCY SHEARSTRESS ( TONS/IN**2 )
FT FM FP TONS TONS TONSDECK KEEL
-29.00 0.28.68 0.00
0. 28.6842.43 16.08
20.40 55.0380.51 57.02
40.80 78.52106.63 105.14
61.20 80.00204.55 148.49
81.60 136.06233.93 186.61
102.00 183.39282.89 220.89
122.40 245.39290.51 252.71
142.80 283.19196.93 280.81
163.20 199.31191.49 303.57
183.60 87.22241.54 318.42
204.00 10.34255.69 323.32
224.40 -57.28245.90 318.09
244.80 -129.47233.93 304.97
265.20 -200.50302.47 280.85
285.60 -178.89255.69 245.47
306.00 -168.67179.53 205.27
LCG -6.009 FT
BENDING M4
FOOT-TONS
0.
405.8
1317.6
2761.1
4455.2
6729.2
10047.6
14477.6
19920.2
24886.1
27840.7
28854.4
28373.6
26453.0
23057.2
19135.5
15524.7
WEIGHT
ORD
0.30
0.64
1.21
1.60
3.08
3.52
4,.26
4.37
2.96
2.88
3.63
3.85
3.70
3.52
4.55
3.85
2.70
qRa AMIDSHIPS (+ FD)
BUOYANCY SHEAR MOMIENT
ORD ORD ORD
0.00
0.24
0.86
1.58
2.23
2.81
3.32
3.80
4.23
4.57
4.79
4.86
4.79
4.59
4.23
3.69
3.09
0.
0.216
0.414
0.591
0.602
1.024
1.380
1.846
2.130
1.499
0.656
0.078
-0.431
-0.974
-1.508
-1.346
-1.269
0.
0.050
0.162
0.339
0.548
0.827
1.235
1.780
2.449
3.059
3.422
3.547
3.488
3.252
2.834
2.352
1.908
61
DISPLACEMENT I

326.40181.70 163.04
346.80124.04 123.41
367.20159.94 86.98
387.60132.74 45.72
408.0016.00 0.86
420.00
MNMENT AT ZERO SHEAR=
-194.40 11750.3 -1.4632.73 2.45
-175.75 7904.4 -1.3221.87 1.86
-175.12 4261.3 -1.3172.41 1.31
-102.16 1369.8 -0.7692.00 0.69
-15.14 96.1 -0.1140.41 0.02
0. 0.6 0.
28870.5 FOOr-TONS I)CATED 207.120 FT FRCM FP
62
1.444
0.972
0.524
0.168
0.012
0.000

i) v m (N er 0 Hr (NI I
HFigurt B-ll
Figure B-1: SHCP Results, Full Load, Seastate
63
0
:o
o0 .
U 0
f ,

80% FUEL CONDITICN, SEASTATE 0
SS'SS"
SSSSSSSSSS
SSSSSS SS
SS SSSS SSSSSSSS
SSSS
;SS HH HH CCCCSSS HH H OCCCC
SS HH HH CC CC P1SS HH HH CC CC PP
HH HH CC CC PPMHHHHHHHHH CC PPPPI
HHHHHMHHH CC PPPPPHH HH CC CC PPHH H CC CC PP
HH HH CC CHH HH CCCCCHH HH CCCC
CC PPPPPP
SHIP HULL CHARACTERISTICS PGRAM
1SHIP- FFG61 80% FUEL COND.
ODESIGN DISPLACEMNTDESIGN DRAFTDESIGN ICGDESIGN VCGDESIGN TCGDESIGN TRIM
OLENGTH OVERALLLENGTH BETWEEN
(+ ABOVE L)(+ FWD MD)(+ ABOVE BL)(+ STED)(+ BY SERN)
PERPENDICULARSLETH CIN DESIGN 1MTERLINE
OSTAICN OF MAX AREA (AT DWL)BEAM AT STATICN OF MAX AREASECTION AREA COEFFICIENTPRISMATIC COEFFICIENTBLOCK OOEFFICIENT
OSpecified Tolerances of Volumek'ximun Iteration for Volume
0
ForwardAfterMaximunMinizun
3987.72015.935-6.110
0.0.0.993
447.780408.000409:645211.42945.4070.76670.61600.4723
SERIAL Nt1ER-
TCNS SW at DIFT IFT I DESIGN:FT DESIGN FT I DESIGN 'FT I DESIGN: FEETFEETFEETFEET PER04 FPFEET
ENSITY =
LCBVCBTCBLIST
7 DATE-17-Aug-90
35.000 FT3/TCN
(+ F MID)(+ ABL)(+ STBD)(+ STB)
-6.1109.9710.0.
FTFTFTDEG
-0.00001000 and LBP =0.00000500= 20 d LBP = 20
Approxinate Bounding Cube Values:
X locationX locationY value onZ value on
StationStation
Nhxinmn Z value on Station0
-27.948 Ft (+ Aft FP)419.832 Ft (+ Aft FP)46.938 Ft
0. Ft (+ Abv BL)41.893 Ft (+ Abv BL)
Work List and Requested Options:
1 3 Longitudinal Strength
KK 3 N Main Hull INITIAL & INTERPOLATED OFFSETS PrintedIPLOT 3 Plot Main Hull both BODY PLAN and ISOMETRICLDXF F Plots will be SHCP NEUTRAL POTFILE fonratMWAP 3 NO Appendage INITIAL & INTERPOLATED OFFSETS PrintedXPLTAP 0 ND Appendage PLOSiPLC)CN 0 Connection frcm Station ENDS to Centerline & DAE SOWNMSGSAV 0 Do not save HULL/APPENDAGE Evaluation Messages if SuccessfulIUNIT 0 Input/Output units selected are ]NLISH-ENGLISH
1SHIP- FFG61 80% FUEL COND. SERIAL NBER- 7 DATE-17-Aug-900 LCNGITDINAL STRENGTH CALCULATICNSOWAVE CENTER FEM AMIDSHIPS 0. FEET (+ FWD)
WAVE LENTH/LBP 1.000WAVE HEIGHI. 1*S$ (LBP) 22.22 FEET
64
PPPPPPPPPPPPPPPP PP
PPPP
PPPPPP

OSpecified Toleranoes of Volume =0.00001000 and LBP 0.00000500Maximum Iteration for Volume = 20 and LBP = 20
0 WEIGHTSTATION(FROM FP)
-29.000.
20.4040.8061.2081.60
102.00122.40142.80163.20183.60204.00224.40244.80265.20285.60306.00326.40346.80367.20387.60408.00420.00
WEIGHT LCG OF WEIGHT( TCNS ) FR1M AMIDSHIPS
(FT,+FWD)
28.6842.4380.51
106.63204.55233.93260.65290.51189.41194.45242.76238.41248.48165.53306.59259.35179.53181.70124.04159.94132.7416.00
- SECTION MDULUS --(INCH**2-FEET)DECK KEEL
218.15193.80173.40153.00132.60112.2091.8071.4051.0030.6010.20-10.20-30.60-51.00-71.40-91.80
-112.20-132.60-153.00-173.40-193.80-210.00
1SHIP- FFG61 80% FUEL OOND.0 LNGrTUDINAL STRENGTH CAlTCUIATINSODRAFTS AND SECTIONAL AREAS AT VARIOUS INPUT
SERIAL NUIBER-- STILL WATERSTATIONS
7 DATE-17-Aug-90
DRAFT SECTIONAL AREAFEET SQUARE FEET
15.015 0.15.027 0.15.039 0.15.052 0.15.065 0.15.077 0.15.090 0.15.103 6.86315.115 17.93515.128 30.15015.141 43.50715.153 58.00715.166 73.65015.179 90.43515.191 108.36415.204 127.43415.216 145.90815.229 163.01415.242 179.78615.254 196.22115.267 212.32215.280 228.08715.292 243.51615.305 258.61015.318 273.36915.330 287.33615.343 300.560
LOCATIONFT FRC FP
195.718200.200204.682209.165213.647218.129222.612227.094231.576236.058240.541245.023249.505253.988258.470262.952267.434271.917276.399280.881285.364289.846294.328298.810303.293307.775312.257
DRAFT SECTICNAL AREAFEET SQUARE FEET
15.64615.65915.67215.68415.69715.71015.72215.73515.74715.76015.77315.78515.79815.81115.82315.83615.84915.86115.87415.88715.89915.91215.92415.93715.95015.96215.975
536.424539.959542.622543.344543.399542.787541.508539.562536.949533.669529.721525.145520.428514.656507.828499.945491.006481.012469.962457.857444.697430.774416.593402.159387.472372.532357.340
65
ICATIONFT FRCM FP
-27.947-23.914-19.432-14.949-10.467-5.985-1.5032.9807.462
11.94416.42720.90925.39129.87334.35638.83843.32047.80352.28556.76761.24965.73270.21474.69679.17983.66188.143

92.625 15.356 313.62397.108 15.368 326.526
101.590 15.381 339.269106.072 15.393 351.851110.555 15.406 364.272115.037 15.419 376.533119.519 15.431 388.633124.001 15.444 400.560128.484 15.457 412.195132.966 15.469 423.513137.448 15.482 434.515141.931 15.495 445.199146.413 15.507 455.566150.895 15.520 465.616155.377 15.533 475.348159.860 15.545 484.764164.342 15.558 493.721168.824 15.570 501.746173.306 15.583 509.129177.789 15.596 515.870182.271 15.608 521.971186.753 15.621 527.430191.236 15.634 532.247195.718 15.646 536.424
ISHIP- FFG61 80% FUEL CND.0 IaGITUDINAL SINGTH CAICULATICNS
DISPLACEMENT 3886.82 TONS SW
316.740321.222325.704330.186334.669339.151343.633348.116352.598357.080361.562366.045370.527375.009379.491383.974388.456392.938397.421401.903406.385410.867415.350419.831SERIAL
- STILL
15.98816.00016.01316.02616.03816.05116.06416.07616.08916.10116.11416.12716.13916.15216.16516.17716.19016.20316.21516.22816.24016.25316.26616.278
NUdMBER-WATER
341.894326.196310.245294.200278.454263.022247.905233.102218.613204.438190.578177.031164.292151.182137.400122.947107.82292.02775.56158.42440.616
0.0.0.
7 DATE-17-Aug-90
LCG -6.002 FT FRCM AMIDSHIPS (+ FD)
OLOCATION WEIGHT BUOYANCYSTRESS ( TCNS/N**2 )
FT M FP TONS TCNSDECK KEEL-29.00
28.680.
42.43
0.00
15.30
80.51 54.93
106.63 101.84
204.55 144.11
233.93 181.32
260.65 214.87
290.51 246.16
189.41 273.91
194.45 296.51
242.76 311.34
238.41 316.37
248.48 311.38
165.53 298.60
306.59 274.88
SHEAR BENDING MOM
TCNS FOOT-TCINS
0.
28.68
55.81
81.39
86.18
146.62
0.
405.8
1323.3
2801.8
4586.3
7029.2
199.22 10615.5
245.00 15202.0
289 35 20702.9
204.85 25787.7
102.79 28957.4
34.21 30373.3
-43.75 30274.4
-106.65 28725.1
-239.71 25162.7
-208.00 20544.8
WEIGHT IBUSANCY SHEAR
ORD
0.31 0.00
0.65 0.24
1.24 0.85
1.65 1.57
3.16 2.22
3.61 2.80
4.02 3.32
4.48 3.80
2.92 4.23
3.00 4.58
3.75 4.81
3.68 4.88
3.84 4.81
2.56 4.61
4.73 4.24
ORD ORD
0. 0.
0.221 0.051
0.431 0.167
0.628 0.353
0.665 0.578
1.132 0.887
1.538 1.339
1.891 1.917
2.233 2.611
1.581 3.252
0.793 3.652
0.264 3.831
-0.338 3.818
-0.823 3.623
-1.850 3.173
-1.605 2.591
66
20.40
40.80
61.20
81.60
102.00
122.40
142.80
163.20
183.60
204.00
224.40
244.80
265.20
285.60

259.35
179.53
181.70
124.04
159.94
132.74
16.00
239.94
200.24
158.56
119.46
83.54
42.87
0.68
ZERID SHEAR=
-188.59
-209.30
-186.16
-181.58
-105.19
-15.32
-0.00
16434.6
12306.2
8202.7
4388.6
1401.3
96.0
0.4
4.00
2.77
2.80
1.91
2.47
2.05
0.42
30526.2 FOOT-TCS IOCATED
3.70-1.456
3.09-1.615
2.45-1.437
1.84-1.402
1.29-0.812
0.66-0.118
0.02-0.000
212.926 T FRCM FP
67
306.00
326.40
346.80
367.20
387.60
408.00
420.00
VENT AT
2.073
1.552
1.035
0.553
0.177
0.012
0.000

U) Vr g ci r4 o r 4 NI I
00b
'CIti:k
fir,,3 II
U" -MSfMM
Figure B-2: SHCP Results, 80% Fuel Condition, Seastate 0
68
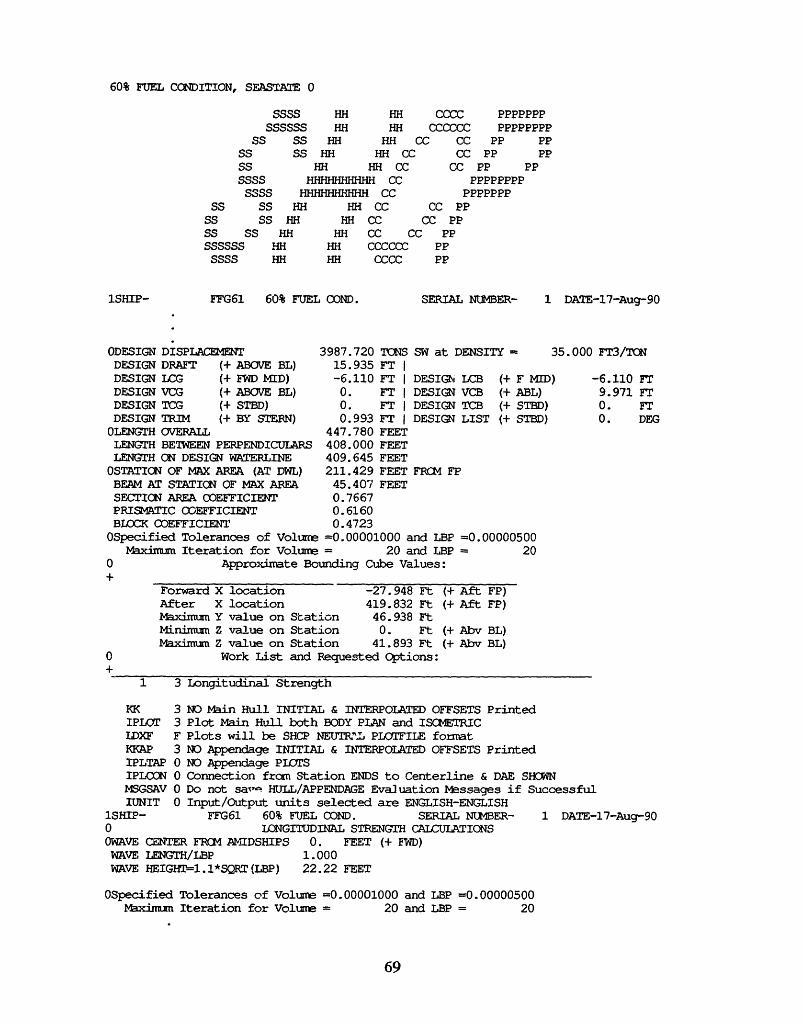
60% FUEL CCNDITION, SEAST ATE 0
SSSS HHSSSSSS HH
SS SS HHSS SS HH
HHHH
HH (HH CC
SS HH HH CCSSSS HHFRHHHH CC
SSSS HHHHHHHHH CCSS HH HH CCSS HH HH CC
SS HH HH CC (
CCCCCCCCCC
CC CCCC E
PPPPPPPPPPPPPP
PP PP'P PP
CC PP PPPPPPPPPP
PPPPPPPCC PP
CC PPIC PP
SSSSSS HH HH CCCCCC PPSSSS HH HH CCCC PP
FFG61 60% FUEL COND.
ODESIGN DISPLACEMENTDRAFTLCGVCGTCGTRIMOVERALLBETWEEN
(+ ABOVE BL)(+ FWD MID)(+ ABOVE BL)(+ STBD)(+ BY STERN)
PERPENDICULARSLENGTH ON DESIGN WATERLINEOSTATION OF MAX AREA (AT DWL)BEAM AT STATION OF MAX AREASECTION AREA COEFFICIENTPRISMATIC COEFFICIENTBLOCK COEFFICIENT
OSpecified Tolerances of VolurreMaximun Iteration for Volurre
ForwardAfterMaximnninimumn
Maximum
3987.72015.935-6.1100.0.0.993
447.780408.000409.645211.429
45.4070.76670.61600.4723
SERIAL NWMBER-
TONS SW at D]FTIFT I DESIGNFT I DESIGN FT I DESIGN FT I DESIGN :FEETFEETFEETFEET FRCM FPFEET
ENSITY =
LCBVCBrCBLIST
1 DATE-17-Aug-90
35.000 FT3/TCN
(+ F MID)(+ ABL)(+ STBD)(+ STBD)
-6.1109.9710.0.
FTFTFTDEG
=0.00001000 and LBP =0.00000500= 20 and LBP = 20
Approximate Bounding Cube Values:
X locationX locationY value on StationZ value on StationZ value on Station
-27.948 Ft (+ Aft FP)419.832 Ft (+ Aft FP)46.938 Ft0. Ft (+ Abv BL)
41.893 Ft (+ Abv BL)0 Work List and Requested Options:
1 3 Longitudinal Strength
KK 3 ND Main Hull INITIAL & INTERPOLATED OFFSETS PrintedIPLOT 3 Plot Main Hull both BODY PLAN and ISCMETRICLDXF F Plots will be SHCP NEUTR:L PLOTFILE formatKKAP 3 NO Appendage INITIAL & INTERPOLATED OFFSETS PrintedIPLTAP 0 NO Appendage PLOTSIPLOCN 0 Connection from Station ENDS to Centerline & DAE SHOWNMSGSAV 0 Do not sait HULL/APPENDAGE Evaluation Messages if SuccessfulIUNIT 0 Input/Output units selected are ENGLISH-ENGLISH
1SHIP- FFG61 60% FUEL COND. SERIAL NUMBER- 1 DATE-17-Aug-900 LONGITUDINAL STRENGTH CALCULATIONSOWAVE CENTER FRCM AMIDSHIPS 0. FEET (+ FWD)WAVE LENGTH/LBP 1.000WAVE HEIGHT=1.l *SQRT (LBP) 22.22 FEET
OSpecified Tolerances of Volume =0.00001000 and LBP =0.00000500MPximumn Iteration for Volume = 20 and LBP = 20
69
SSSSSS
1SHIP-
DESIGNDESIGNDESIGNDESIGNDESIGNOLENGTHLENGTH
0+

O WEIGHTSIATION
(FpaR FP)-29.00
0.20.4040.8061.2081.60
102.00122.40142.80163.20183.60204.00224.40244.80265.20285.60306.00326.40346.80367.20387.60408.00420.00
WEIT LG OF WEIGHT( TCNS ) FCM AMIDSHIPS
(FT,+FWD)
28.6842.4380.51
151.63204.55233.93217.49272.62189.41194.45242.76238.41248.48165.53306.59259.35179.53181.70124.04159.94132.7416.00
- SETION MULUS --(ICH**2-ET)
DECK KEEL
218.15193.80173.40153.00132.60112.2091.8071.4051.0030.6010.20
-10.20-30.60-51.00-71.40-91.80
-112.20-132.60-153.00-173.40-193.80-210.00
AT ZER) SHEAR= 87372.9 FOXT-TCNSFFG61 60% FUEL COND.
L.C1GITU¶DINAL STRENGT H CAICULATICNSAND SECTICNAL AREAS AT VARICOUS INPUT
LOCATIOFT FRM FP
-27.947-23.914-19.432-14.949-10.467-5.985-1.5032.9807.462
11.94416.42720.90925.39129.87334.35638.83843.32047.80352.28556.76761.24965.73270.21474.69679.17983.66188.14392.62597.108
DRAFT S1ICAL AREAFEET SARE FEET
15.05815.06815.07915.09015.10215.11315.12415.13515.14615.15815.16915.18015.19115.20215.21315.22515.23615.24715.25815.26915.28115.29215.30315.31415.32515.33715.34815.35915.370
0.
0.0.0.0.0.0.6.906
18.02130.27443.66558.19573.86390.670108.616127.700146.182163.292180.064196.496212.588228.341243.754258.827273.562287.500300.692313.720326.584
OCDATED 209.914 FT FRM FPSERIAL NUMBER- 1 DATE-17-Aug-90
- STIl WATERSTATINS
LOCATIONFT FM FP
195.718200.200204.682209.165213.647218.129222.612227.094231.576236.058240.541245.023249.505253.988258.470262.952267.434271. 17276.399280.881285.364289.846294.328298.810303.293307.775312.257316.740321.222
DRAFT SECTICNAL AREAFEET SQARE FEET
15.61615.62815.63915.65015.66115.67215.68315.69515.70615.71715.72815.73915.75115.76215.77315.78415.79515.80715.81815.82915.84015.85115.86315.87415.88515.89615.90715.91815.930
535.085538.546541.136541.788541.774541.094539.747537.735535.056531.711527.700523.060518.284512.454505.570497.632488.641478.595467.496455.344442.137428.171413.950399.480384.760369.790354.571339.102323.383
70
Ml4ENTiSHIP-0ODRAFTS

101.590 15.381106.072 15.393110.555 15.404115.037 15.415119.519 15.426124.001 15.437128.484 15.448132.966 15.460137.448 15.471141.931 15.482146.413 15.493150.895 15.504155.377 15.516159.860 15.527164.342 15.538168.824 15.549173.306 15.560177.789 15.572182.271 15.583186.753 15.594191.236 15.605195.718 15.616 !
lSHIP- FFG61 60% 10 MLNGITUDINAL STRE2
DISPLACEMENT 3870.77
OLOCATION WEIGHT BYANCYSTRESS ( TCNS/IN**2 )
FT M FP TONS TCNSDECK KEEL
-29.0028.68 0.00
0.42.43 15.36
20.4080.51 55.07
40.80151.63 102.00
61.20204.55 144.25
81.60233.93 181.38
102.00217.49 214.82
122.40272.62 245.95
142.80189.41 273.53
163.20194.45 295.94
183.60242.76 310.58
204.00238.41 315.41
224.40248.48 310.25
244.80165.53 297.30
265.20306.59 273.45
285.60259.35 238.40
306.00
339.285351.822364.195376.405388.451400.320411.897423.154434.093444.713455.015464.997474.661484.007192.892500.844508.155514.824520.852526.237530.982535.085rEL COND.NGTH CALCULATICtS
7 TONS SW LCG
SHEAR
TONS
0.
28.68
55.75
81.19
130.82
191.12
243.67
246.35
273.02
188.89
87.40
19.58
-57.42
-119.20
-250.97
-,217.83
-196.87
BENDING M
FOOT-TON
405
1322
2798
5036
8388
12882
17935
23283
28038
30888
31997
31609
29792
25987
21154
16859
325.704 15.941 307.4330.186 15.952 291.3.334.669 15.963 275.5339.151 15.974 260.1!343.633 15.986 245.0348.116 15.997 230.2.352.598 16.008 215.7357.080 16.019 201.5i361.562 16.030 187.71366.045 16.042 174.1!370.527 16.053 161.4:375.009 16,064 148.3:379.491 16.075 134.5,383.974 16.086 120.1:388.456 16.097 105.0:392.938 16.109 89.21397.421 16.120 72.8'401.903 16.131 55.8(406.385 16.142 38.0'410.867 16.153 0.415.350 16.165 0.419.831 16.176 0.SERIAL NUMBER- 1 DATE-:
- STILL WATER
-5.602 FT FRCM AMIDSHIPS (+
KMY WEIGHT BUOYANCY SHEAR
IS ORD ORD ORD
0. 0.0.31 0.00
.8 0.2220.66 0.24
2.8 0.4321.25 0.85
.8 0.6292.35 1.58
.6 1.0143.17 2.24
.8 1.4813.63 2.81
.2 1.8893.37 3.33
.6 1.9094.23 3.81
.3 2.1162.94 4.24
.4 1.4643.01 4.59
.1 0.6773.76 4.81
.5 0.1523.70 4.89
.7 -0.4453.85 4.81
.6 -0.9242.57 4.61
.2 -1.9454.75 4.24
.0 -1.6884.02 3.70
.0 -1.526
15569959352735600259201447203283740372
L7-Aug-90
MD)
ORD
0.
0.051
0.168
0.354
0.638
1.062
1.631
2.271
2.949
3.551
3.912
4.052
4.003
3.773
3.291
2.679
2.135
71

179.53 198.61326.40
181.70 156.89346.80
124.04 117.79367.20
159.94 81.88387.60
132.74 41.32408.00
16.00 0.59420.00
MFMENT AT ZERO SHEAR=
2.78 3.08-215.96 12577.9 -1.674
2.82 2.43-191.15 8355.8 -1.482
1.92 1.83-184.90 4456.7 -1.433
2.48 1.27-106.84 1418.7 -0.828
2.06 0.64-15.41 95.9 -0.119
0.42 0.020.00 0.3 0.000
32048.3 FOrOT-TS LOCATED 209.188 FT FRCM FP
72
1.593
1.058
0.564
0.180
0.012
0.000

An u r) (4 0 o H
I !
00%I
I
11d? oreUre .^fEmObv
rl4r4 4 4 4
a hFiur I-:SC eut,60 uLSatt
Figure B-3: SHCP Results, 60% Fuel, Seastate 0
73

MINIMUM OPERATING ONDITICN, SEASTATE 0
SSSS HH HHSSSSSS HH HH
SS SS HH HHSS SS HH HH CCSS HH HH CCSSSS HHHHHHHRH CCSSSS HHHHHHHHHH CC
SS SS HHSS SS HHSS SS HHSSSSSS HHSSSS HH
HHHH
HHHHH
COCCCCCCCC
CC CC
CC CC PPCC CC PPCC CC PPCCCCCC PP
CCCC PP
PPPPPPPPPPPPPPP
PP PPCC PP
CC PP PPPPPPPPPP
PPPPPPP
SHIP HULL CHARACERISTICS PROGRAM
ISHIP- FFG61 MIN. . OP. CD. (CCND. B)
ODESIGN DISPLACEMENTDESIGNDESIGNDESIGNDESIGNDESIGNOLENGTHLENGTH
DRAFTLCGVCGTCGTRIMOVERALLBETWEEN
(+ ABOVE BL)(+ FWD MID)(+ ABOVE BL)(+ STBD)(+ BY STERN)
PERPENDICULARSLENGTH CN DESIGN WATERLINEOSTATION OF MAX AREA (AT DWL)BEAM AT STATION OF MAX AREASECTION AREA OOEFFICIENTPRISMATIC OEFFICIENTBLOCK COEFFICIENTOSpecified Tolerances of Volume
Maximzn Iteration for Volume
SERIAL NUMBER-
38i7.301 TNS SW at DENSITY =15.441-7.700
0.0.1.984
447.780408.000409.498214.460
45.3630.75980.61330.4660
FTIFT I DESIGN LCBFT I DESIGN VCBFT I DESIGN TCBFT I DESIGN LISTFEETFEETFEETFEET FRCM FP
FEET
2 DATE-15-Aug-90
35.000 FT3/TN
(+ F MID)(+ ABL)(+ STBD)(+ STBD)
-7.700 FT9.720 FT0. FT0. DEG
=0.00001000 and LBP =0.00000500= 20 and LBP = 20
Approximate Bounding Cube Values:
Forward X location -27.948 Ft (+ Aft FP)After X location 419.832 Ft (+ Aft FP)Maximun Y value on Station 46.938 FtMinimu Z value on Station 0. Ft (+ Abv BL)Maximum Z value on Station 41.893 Ft (+ Abv BL)
Work List and Requested Options:
1 3 Longitudinal Strength
KK 3 NO Main Hull INITIAL & INTERPOLATED OFFSETS PrintedIPLOT 3 Plot Main Hull both BODY PLAN and ISCMETRICLDXF F Plots will be SHCP NEUTRAL POYiFILE fonratMKKAP 3 NO Appendage INITIAL & INTERPOLATED OFFSETS PrintedIPLTAP 0 NO Appendage PLOTSIPLXON 0 Connection from Station ENDS to Centerline & DAE SHCVNMSGSAV 0 Do not save HULL/APPENDAGE Evaluation Messages if SuccessfulIUNIT 0 Input/Output units selected are ENGLISH-ENGLISH
1SHIP- FFG61 MIN. OP. CWND. (COND. B) SERIAL NUMBER- 2 DATE-15-Aug-900 LONGITUDINAL STRENGTH CALCULATICNSOWAVE CENTER FROM AMIDSHIPS 0. FEET (+ FWD)WAVE LENGTH/LBP 1.000WAVE HEIGHT-1. *SQCT (LBP) 22.22 FEET
OSpecified Tolerances of Volume =0.00001000 and LBP --0.00000500Maximum Iteration for Volume = 20 and LBP - 20
74
PP
0+
0+t

O WEIGHTSTrACN(FRZM FP)
-29.000.
20.4040.8061.2081.60
102.00122.40142.80163.20183.60204.00224.40244.80265.20285.60306.00326.40346.80367.20387.60408.00420.00
WEIGHT LXG OF WEIGHT( TCNS ) FRP AMIDSHIPS
(FT,+FWD)
28.6842.4380.51
141.81204.55233.93296.49215.79139.07174.84224.72237.78239.55248.03296.35249.48165.99188.0398.70
159.94132.7416.00
- SECTION MODULUS --(INCH**2-FEET)
DECK KEEL
218.15193.80173.40153.00132.60112.2091.8071.4051.0030.6010.20
-10.20-30.60-51.00-71.40-91.80
-112.20-132.60-153.00-173.40-193.80-210.00
FFG61 MIN. OP. OCND. (CCND. B)IaGITUDINAL STRENGTH CAICULATICNS
.ND S CTIAL AREAS AT VARICUS INPUT
SERIAL NUMBER-.- STILL WATERSTATICNS
2 DATE-15-Aug-90
DRAFT SECTIONAL AREAFEET SQUARE FEET
14.86514.87614.88814.90014. 91214.92514. 93714.94914. 96114.97314.98514.99715.00915.02115.03315.04515.05815.07015.08215.09415.10615.11815.13015.14215.15415.16615.17915.19115.203
0.
0.0.0.0.0.0.6.666
17.51529.50742.64056.91472.33188.889
106.589125.431143.674160.550177.093193.302209.178224.721239.930254.805269.347283.101296.117308.975321.676
LOCATIONFT FREM FP
195.718200.200204.682209.165213.647218.129222.612227. 094231.576236.058240. 541245.023249.505253.988258.470262.952267.434271.917276.399280.881285.364289.846294.328298.810303.293307.775312.257316.740321.222
DRAFT SCTICNAL AREAFEET SQUARE FEET
15.46915.48115.49315.50515.51715.52915.54115.55315.56615.57815.59015. 60215. 61415.62615.63815.65015.66215.67415.68715. 69915.71115.72315.73515.74715.75915.77115.78315.79515.807
528.494531. 956534.555535.232535.246534.597533.285531.311528.673525.372521.409516.821512.106506.340499.523491. 653482.733472.760461.736449.660436.533422.650408.516394.134379.506364.631349.510334.141318.526
75
ISHIP-0ODRAFTS
LOCATICNFT FRCM FP
-27.947-23.914-19.432-14. 949-10.467-5.985-1.5032.9807.462
11.94416.42720. 90925.39129. 87334r35638.83843.32047.80352.28556.76761.24965.73270.21474.69679.17983.66188.14392.62597.108

101.590 15.215 334.221106.072 15.227 346.608110.555 15.239 358.839115.037 15.251 370.912119.519 15.263 382.828124.001 15.275 394.578128.484 15.287 406.048132.966 15.299 417.208137.448 15.312 428.055141.931 15.324 438.591146.413 15.336 448.816150.895 15.348 458.729155.377 15.360 468.330159.860 15.372 477.621164.342 15.384 486.459168.824 15.396 494.371173.306 15.408 501.648177.789 15.420 508.289182.271 15.433 514.294186.753 15.445 519.663191.236 15.457 524.397195.718 15.469 528.494
1SHIP- FFG61 MIN. CP. OOND. (CCND. B)0 IJGITUDINAL STRENGTH CALCILATICNS
325.704330.186334.669339.151343.633348.116352.598357.080361.562366.045370.527375.009379.491383.974388.456392.938397.421401.903406.385410. 867415.350419.831
SERIAL- STILL
15.82015.83215.84415.85615.86815.88015.89215.90415.91615.92815.94115.95315.96515.97715.98916.00116.01316.02516.03716.04916.06116.074
NUIBER-WTER
302.663286.713271.064255.730240.712226.010211.623197.552183.797170.358157.713144.707131.048116.735101.76886.14869.87552.94835.368
0.0.0.
2 DATE-15-Aug-90
DISPLACEMENT
OLOCATION WEIGHT ISTRESS ( TCNS/IN**2
FT M FP TONSDECK KEEL
-29.0028.68
0.42.43
20.4080.51
40.80141.81
61.20204.55
81.60233.93
102.00296.49
122.40215.79
142.80139.07
163.20174.84
183.60224.72
204.00237.78
224.40239.55
244.80248.03
265.20296.35
285.60249.48
306.00
3815.41 T]NS SW
BUOYANCY)
TCNS
0.00
14.97
54.01
100.31
141.99
178.64
211.67
242.49
269.87
292.15
306.74
311.61
306.55
293.75
270.08
235.25
SHEAR
TCNS
0.
28.68
56.14
82.64
124.14
186.70
241.99
326.81
300.11
169.32
52.00
-30.02
-103.85
-170.85
-216.57
-190.30
-176.07
LCG -5.
BENDING MaM4
FOOT-TCNS
0.
405.8
1325.6
2819.1
5002.5
8240.4
12670.8
18527.2
24971.6
29803.1
32091.9
32334.4
30967.1
28149.7
24168.6
19967.3
16165.7
.524 FT FROM AMIDSHIPS (+
WEIGHT BYANCY SHEAR
ORD ORD ORD
0.32
0.67
1.27
2.23
3.22
3.68
4.66
3.39
2.19
2.75
3.53
3.74
3.77
3.90
4.66
3.92
0.00
0.24
0.85
1.58
2.23
2.81
3.33
3.81
4.24
4.59
4.82
4.90
4.82
4.62
4.25
3.70
0.
0.226
0.441
0.650
0.976
1.468
1.903
2.570
2.360
1.331
0.409
-0.236
-0.817
-1.343
-1.703
-1.496
-1.384
76
FWD)
CRD
0.
0.052
0.170
0.362
0.643
1.059
1.628
2.380
3.208
3.829
4.123
4.154
3.979
3.617
3.105
2.565
2.077
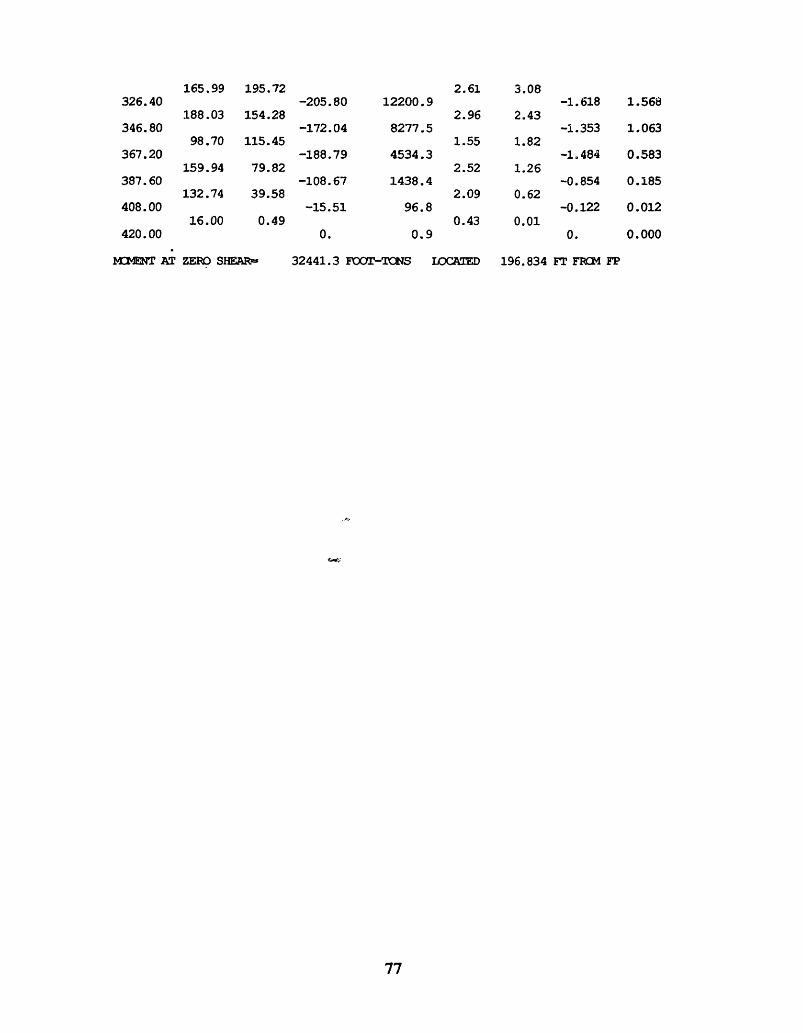
165.99 195.72326.40
188.03 154.28346.80
98.70 115.45367.20
159.94 79.82387.60
132.74 39.58408.00
16.00 0.49420.00
M2MENT AT ZERO SHEAR=
-205.80
-172.04
-188.79
-108.67
-15.51
12200.9
8277.5
4534.3
1438.4
96.8
2.61
2.96
1.55
2.52
2.09
0.43
3.08
2.43
1.82
1.26
0.62
0.01
-1.618
-1.353
-1.484
-0.854
-0.122
0. 0.9 0.
32441.3 FOOCTTCzNS LoCATED 196.834 FT FR]M FP
77
1.568
1.063
0.583
0.185
0.012
0.000

u p I N r- 0 -4 NI I
0
tP
ie0II
zg H HH l H WW
~~~~~ 1- i Iium 4ra C i, s
Figure B-4: SHCP Results, Minimum Operating Condition, Seastate 0
78

FULL LOAD, SEASATE 2
SSSSSSSSSS
SS SSSS SSSSSSSS I
SSSS HSS SS HH
SS SS HHSS SS HHSSSSSS HH
SSSS HH
NH H
HH HH
HH HH (
HH HH CCWIFHH CC
HH CCHH CCHH
HH CCHH CCCCCHH CCOC
C
CCCC PPPPPPPCCCCCC PPPPPPPP
cc CC PP PPCC PP PP
CC PP PPPPPPPPPP
PPPPPPPCC PP
CC PPCC PP
PPPP
SHIP HULL CHARACTERISTICS PROGRAM
ODESIGN DISPLACEMENTDESIGN DRAFTDESIGN LCGDESIGN VCGDESIGN TCGDESIGN TRIM
OLENGTH OVERALL
(+ ABOVE BL)(+ FWD MID)(+ ABOVE BL)(+ STBD)(+ BY STERN)
LENTH BETWEEN PERPENDICULARSLENGTH CON DESIGN WATERLINE
OSTATICN OF MAX AREA (AT DWL)BEAM AT STATION OF MAX AREASECTION AREA COEFFICIENTPRISMATIC OOEFFICIENTBIOCK COEFFICIENTOSpecified Tolerances of Volume
fMtdiran Iteration for Volume0+
3987.72015.935-6.110
0.0.0.993
447.780408.000409.645211.429
45.4070.76670.61600.4723
TCNS SW at D]FTIFT I DESIGN FT I DESIGN FT I DESIGN FT I DESIGN FEETFEETFEETFEET FRCM FPFEET
ENSITY =
LCBVCBTCBLIST
35.000 FT3/TON
(+ F MD)(+ ABL)(+ STBD)(+ STBD)
-6.1109.9710.0.
FTFTFTDEG
=0.00001000 and LBP =0.00000500= 20 and LBP = 20
Approximate Bounding Cube Values:
Forward X location -27.948 Ft (+ Aft FP)After X location 419.832 Ft (+ Aft FP)Maximum Y value on Station 46.938 FtMinimnm Z value on Station 0. Ft (+ Abv BL)Maxinan Z value on Station 41.893 Ft (+ Abv BL)
Work List and Requested COptions:0
1 3 Longtudinal Strength
KK 3 ND Main Hull INITIAL & INTERPOLATED OFFSETS PrintedIPLOT 3 Plot Main Hull both BODY PLAN and ISCMETRICLDXF F Plots will be SHCP NEUTRAL PLOTFILE fonmatKKAP 3 ND Appendage INITIAL & INTERPOLATED OFFSETS PrintedIPLTAP 0 ND Appendage PLOTSIPLON 0 Connection fron Station ENDS to Centerline & DAE SHOWNMSGSAV 0 Do not save HULL/APPENDAGE Evaluation Messages if SuccessfulIUNIT 0 Input/Output units selected are ENGLISH-ENGLISH
1SHIP- FFG61 FULL LOAD OCND. (COND. D) SERIAL NUMBER- 15 DATE-10-Aug-900 ONGITUDINAL STRENGTH CALCULATICNSOWAVE CENTER FRCM AMIDSHIPS 0. FEET (+ FWD)
WAVE LENGTH/LBP 1.000WAVE HEIGHT INPUT 1.01 FEET
OSpecified Tolerances of Volume 0.00001000 and LBP 20.00000500
Maxinun Iteration for Volume = 20 and LBP = 20
0 WEIGHT WEIGHT LOG OF WEIGHT - SECTION MDULUS --
79
!

STATICN ( TC1S ) FRM AMIDSHIPS(FR1M FP) (FT,+FW)
-29.000. 28.68 218.15
20.40 42.43 193.8040.80 80.51 173.4061.20 106.63 153.0081.60 204.55 132.60
102.00 233.93 112.20122.40 282.89 91.80142.80 290.51 71.40163.20 196.93 51.00183.60 191.49 30.60204.00 241.54 10.20224.40 255.69 -10.20244.80 245.90 -30.60265.20 233.93 -51.00285.60 302.47 -71.40306.00 255.69 -91.80326.40 179.53 -112.20346.80 181.70 -132.60367.20 124.04 -153.00387.60 159.94 -173.40408.00 132.74 -193.80420.00 16.00 -210.00
1SHIP- FFG61 FULL LOAD DCND. (CCND. D)0 IaqITUDINAL STRENGTH CAICULATISODRAFTS AND SECTICNAL AREAS AT VARIC S INPUT
(INCH**2-FEET)DECK KE
SERIAL NUMER-- SAGGINGSTATICTS
15 DATE-10-Aug-90
DRAFT SECTICNAL AREAFEET SQUARE FEET
16.23116.24716.26516.27716.28816.29816.30916.31216.31216.31316.31316.31216.30116.29116.28016.27016.25516.23516.21616.19716.17816.15216.12716.10116.07516.04816.02015.99115.96215.93315.90515.876
0.0.0.0.0.0.0.8.835
21.63935.51650.46566.48783.580
101.747120.986141.297160.907178.999196.615213.754230.418246.606262.318277.554292.313306.118319.039331.696344.089356.218368.083379.684
L0CATIKNFT FCM FP
195.718200.200204.682209.165213.647218.129222.612227.094231.576236.058240.541245.023249.505253.988258.470262.952267.434271.917276.399280.881285.364289.846294.328298.810303.293307.775312.257316.740321.222325.704330.186334.669
DRAFT SECTICNAL AREAFEET SQMaRE FEET
15.55715.55715.55915.57015.58115.59215.60215. 62015. 64115.66215.68315.70515.73415.76415.79415.82415.85715.89315.93015. 96616.00216.04216.08216.12216.16116.20116.24116.28116.32116.36116.39816.435
532.188535.227537.488537.955537.859537.201535. 980534.196531.849528.940525. 468521. 473517.446512.417506.387499.355491.321482.286472.250461.211449.171436.393423.327409.980396.351382.439368.246353.771339.014323.974308.764293.770
80
/LCATIC!FT FWr FP
-27. 947-23.914-19. 432-14.949-10.467-5.985-1.5032.9807.462
11.94416.42720.90925.39129.87334.35638.83843.32047.80352.28556.76761.24965.73270.21474.69679.17983. 66188.14392.62597.108
101.590106.072110.555

115.037119.519124.001128.484132.966137.448141.931146.413150.895155.377159.860164.342168.824173.306177.789182.271186.753191.236195.718
1SHIP- FFG61
15.84815.81915.79215.76615.74115.71615.69115.67115.65215.63415.61515.59915.58915.57915.56915.55915.55615.55615.557FULL LAD
391.022402.095412.885423.339433.474443.291452.790461.970470.831479.374487.599495.374502.299508.668514.483519.742524.446528.595532.188COND. (CCND. D)
0 LONGITUDINAL STRENGTH CAICULATIOWAVE HEIGHT, 1.01 FT CENTER
DISPLACEMENT0. P.
398772 TINS SW
OLOCATICN WEIGHT BUOYANCYSTRESS ( TNS/IN**2 )
FT FM FP TONS TCNSDECK KEEL
-29.0028.68 0.01
0.42.43 18.02
20.4080.51 61.62
40.80106.63 111.44
61.20204.55 155.03
81.60233.93 191.85
102.00282.89 223.61
122.40290.51 252.02
142.80196.93 276.63
163.20191.49 296.28
183.60241.54 309.05
204.00255.69 313.18
224.40245.90 308.60
244.80233.93 297.42
265.20302.47 276.10
285.60255.69 244.06
306.00179.53 207.08
326.40181.70 167.62
SHEAR
TONS
0.
28.67
53.09
71.98
67.16
116.68
158.76
218.04
256.53
176.83
72.05
4.53
-52.96
-115.66
-179.15
-152.78
-141.16
-168.71
BEND]I
FOOT
11
2
2
2
2
2
2
1
1
1
339.151 16.472 279.010343.633 16.509 264.487348.116 16.544 250.198352.598 16.574 236.145357.080 16.604 222.328361.562 16.635 208.746366.045 16.665 195.399370.527 16.689 182.806375.009 16.711 169.730379.491 16.732 155.858383.974 16.754 141.189388.456 16.773 125.724392.938 16.784 109.463397.421 16.796 92.405401.903 16.807 74.551406.385 16.818 55.901410.867 16.824 0.415.350 16.827 0.419.831 16.828 0.SERIAL NUMBER- 15 DATE-10-Aug-90
IONS - SAGGINGr FROM AMIDSHIPS (+ FWD) LENGTH/LBP 1.000LCG -6.009 FT FRCM AMIDSHIPS (+ FWD)
ING MCM WEIGHT BUOYANCY SHEAR M)MT
r--TLCS ORD ORD ORD cOD
0. 0. 0.0.30 0.00
405.8 0.216 0.0500.64 0.27
1302.9 0.399 0.1601.21 0.93
2663.7 0.541 0.3271.60 1.68
4161.9 0.505 0.5123.08 2.33
6106.4 0.878 0.7513.52 2.89
8972.6 1.194 1.1034.26 3.36
.2867.2 1.640 1.5824.37 3.79
.7752.9 1.930 2.1822.96 4.16
.2211.8 1.330 2.7302.88 4.46
.4777.8 0.542 3.0463.63 4.65
25574.9 0.034 3.1443.85 4.71
'5079.0 -0.398 3.0833.70 4.64
'3345.5 -0.870 2.8703.52 4.48
20312.4 -1.348 2.4974.55 4.15
6880.2 -1.149 2.0753.85 3.67
3821.9 -1.062 1.6992.70 3.12
0595.7 -1.269 1.3022.73 2.52
81

-154.63 7231.1124.04 129.85
159.94 94.27
132.74 52.60
16.00 1.38
-160.43
-94.76
-14.62
3955.8
1290.1
95.3
0. 0.1
1.87 1.95
2.41 1.42
2.00 0.79
0.41 0.04
-1.207 0.486
-0.713 0.159
-0.110 0.012
0. 0.000
b13.ONT AT ZEIO SHEAR- 25578.5 FXOOT-TONSISHIP- FFG61 FLL I2AD COND. (CCND. D)0 LaGITUDINAL STRENGTH CACUIATICNSODRAFTS AND SECTICAL AREAS AT VARIUS INPUT
DRAFT SECTICNAL AREAFEET SQUARE FEET
14.558 0.14.562 0.14.565 0.14.573 0.14.584 0.14.595 0.14.605 0.14.623 6.24814.643 16.61914.664 28.18614.685 40.95114.707 54.91214.738 70.07114.768 86.42714.799 103.98014.830 122.73014.866 140.96614.906 157.95914.945 174.72814.985 191.27515.025 207.59915.071 223.70015.117 239.57915.163 255.23415.209 270.66715.257 285.44115.306 299.58615.356 313.64915.405 327.63115.455 341.53315.505 355.35415.554 369.09415.604 382.75315.654 396.33215.703 409.81215.749 423.00315.796 435.85115.842 448.35815.889 460.52315.930 472.34515.970 483.82516.010 494.96416.050 505.76016.088 516.06216.120 525.31616.151 533.816
ICATED 205.608 FT FRlM FPSERIAL Nt4BER- 15 DATE-10-Aug-90
- HOGGINGSTATINS
WCATIONFT FRC FP
195.718200.200204.682209.165213.647218.129222.612227.094231.576236.058240.541245.023249.505253.988258.470262.952267.434271.917276.399280.881285.364289.846294.328298.810303.293307.775312.257316.740321.222325.704330.186334.669339.151343.633348.116352.598357.080361.562366.045370.527375.009379.491383.974388.456392.938397.421
DRAFT SECTICtHAL AREAFEET SQUARE FEET
16.280 565.00616.300 569.98216.320 571.96216.329 572.81616.339 572.88016.349 572.15416.359 570.63716.363 568.32916.362 565.23116.361 561.34316.361 556.66416.360 551.23216.350 545.54116.341 538.73316.331 530.80716.322 521.76416.309 511.60416.293 500.32616.278 487.93116.262 474.41816.246 459.78816.227 444.36516.208 428.70816.189 412.82416.170 396.71116.151 380.37016.132 363.80116.114 347.00416.095 329.97916.076 312.72616.060 295.45916.045 278.58116.029 262.10016.014 246.01616.001 230.32915.992 215.03915.983 200.14615.974 185.65015.965 171.55115.962 158.34515.962 144.86415.962 130.80915.962 116.18215.964 100.98215.974 85.20815.984 68.862
82
367.20
387.60
408.00
420.00
IOCATICK7FT F FP
-27.947-23.914-19.432-14.949-10.467-5.985-1.5032.9807.462
11.94416.42720.90925.39129.87334.35638.83843.32047.80352.28556.76761.24965.73270.21474.69679.17983.66188.14392.62597.108
101.590106.072110.555115.037119.519124.001128.484132.966137.448141.931146.413150.895155.377159.860164.342168.824173.306
346.80 -1.163 0.889

177.789 16.182 541.563 401.903 15.994 51.944182.271 16.214 548.555 406.385 16.004 34.452186.753 16.238 554.793 410.867 16.018 0.191.236 16.259 560.277 415.350 16.036 0.195.718 16.280 565.006 419.831 16.056 0.
lSHIP- FFG61 FULL LOAD CCND. (CCND. D) SERIAL NUMBER- 15 DATE-10-Aug-900 I~CGITUDn4L STRENmRH CAICULATICNS - HOGGINGOWAVE HEIGHT, 1.01 FT CENTER 0. FT FRM AMIDSHIPS (+ FWD) LENGTH/LBP 1.000
DISPLACEMENT 3987.72 TCNS SW LCG -6.009 FT FRCM AMIDSHIPS (+ F))
0ICCATICK WEIGHT BUYAEY SHEAR BENDING MM WEIGHT BUOYANCY SHEAR M WMENTSTRESS ( TrS/IN**2 )
FT PM FP TONS TCS TCNS FO-aS CRD CD ORD CEDDECK REEL
-29.0028.68
0.42.43
20.4080.51
40.80106.63
61.20204.55
81.60233.93
102.00282.89
122.40290.51
142.80196.93
163.20191.49
183.60241.54
204.00255.69
224.40245.90
244.80233.93
265.20302.47
285.60255.69
306.00179.53
326.40181.70
346.80124.04
367.20159.94
387.60132.74
408.0016.00
420.00
0.00
14.32
52.59
98.94
141.96
181.27
218.02
253.26
284.90
310.86
327.81
333.48
327.57
312.46
285.50
246.74
203.32
158.41
117.01
79.82
39.03
0.46
0.
28.68
56.79
84.71
92.40
154.99
207.66
272.53
309.78
221.80
102.44
16.16
-61.63
-143.30
-221.83
-204.86
-195.90
-219.69
-196.40
-189.37
-109.25
-15.54
0.
0.
405.8
1330.3
2850.9
4732.8
7327.0
11089.3
16048.9
22045.7
27518.1
30861.9
32092.8
31627.1
29518.6
25759.9
21350.5
17191.3
12876.1
8557.4
4556.4
1446.9
98.9
3.0
0.30
0.64
1.21
1.60
3.08
3.52
4.26
4.37
2.96
2.88
3.63
3.85
3.70
3.52
4.55
3.85
2.70
2.73
1.87
2.41
2.00
0.41
0.00
0.22
0.79
1.49
2.14
2.73
3.28
3.81
4.29
4.68
4.93
5.02
4.93
4.70
4.30
3.71
3.06
2.38
1.76
1.20
0.59
0.01
0.
0.216
0.427
0.637
0.695
1.166
1.562
2.050
2.330
1.669
0.771
0.122
-0.464
-1.078
-1.669
-1.541
-1.474
-1.653
-1.478
-1.425
-0.822
-0.117
0.
0.
0.050
0.164
0.350
0.582
0.901
1.363
1.973
2.710
3.383
3.794
3.945
3.888
3.629
3.167
2.625
2.113
1.583
1.052
0.560
0.178
0.012
0.000
MMENT AT ZERO SHEAR= 32127.0 FOOT-TCNS LOCATED 208.239 FT FR FP
83

Lr) W cq0 C H 0 H N
- ~ ~ ~ ~ * -*- -
0
I
O
g0
U
HHHHH
A § IU
InH-4 is RIgmCa
I I
Figure B-5: SHCP Results, Full Load, Seastate 2, Hogging
84
_ . 3

n) C ) N I 0 o 4 CII I
0o01I0
r4
a
OU oa
r "
;RR"... HHWHH
011 in
r4 M U8 4 ~ E-(P4 ZM
rl 3 VoliEvm-. w w m-u - *I* Cal
Figure B-6: SHCP Results, Full Load, Seastate 2, Sagging
85

FULL LOAD, SEASTATE 4
SSSS HH MH CCCC PPPPPPPSS HH3S HHSS HH
HH H!HHHHHHHHHH
HHHHHHHHH
HHHHHHHHMHH
SSSSSSS I
HHHH
HH
iH
SSSSSSSS
SSSSSS SS
SS SSSS SSSSSSSS I$SSS I
HH CCCCCC PPPPPPPPHH CC CC PP PP PPHH CC CC PP PPi CC CC PP PP
CC PPPPPPPPCC PPPPPPP
CC CC PPCC CC PPCC CC PPCCCCCC PP
CCCC PP
SHIP HULL CHARACTERISTICS PROGRAM
ODESIGN DISPLACEMENTDESIGNDESIGNDESIGNDESIGNDESIGN
OLENGTHL~NH
DRAFTLCGVCGTCGTRIMOVERALLBETWEEN
(+ ABOVE BL)(+ FWD MID)(+ ABOVE BL)(+ STBD)(+ BY STERN)
PERPENDICULARSLENGTH CN DESIGN WATERLINE
OSTATICN OF MAX AREA (AT DWL)BEAM AT STATICN OF MAX AREASECTION AREA COEFFICIENTPRISMATIC OOEFFICIENTBLOCK COEFFICIENT
OSpecified Tolerances of VolumeMximun Iteration for Volume
3987.72015.935
TONJSFT I
SW at DENSITY =
-6.110 FT DESIGN0. FT I DESIGN0. FT, I DESIGN0.993 FT DESIGN
447.780408.000409.645211.42945.4070.76670.61600.4723
FEETFEETFEETFEET FRM FPFEET
LB
TCBLIST
35.000 PT3/TCN
(+ F MID),+ ABL)(+ STBD)(+ STBD)
-6.1109.9710.0.
FTFTFTDEG
=0.00001000 and LBP =0.0000050020 and LBP = 20
Approximate Bounding Cube Values:Forward X location -27.948 Ft (+ Aft FP)After X location 419.832 Ft (+ Aft FP)Maxiunm Y value on Station 46.938 FtMinimum Z value on Station 0. Ft (+ Abv BL)Maximunm Z value on Station 41.893 Ft (+ Abv BL)
Work List and Requested Options:
1KKIPLaLDXFKKAPIPLTIPI/
MSGSJ
IUNI1SHIP-
%P
kV
3 Longitudinal Strength3 NO Mtin Hull INITIAL & INTERPOLATED OFFSETS Printed3 Plot Main HuJl both BODY PLAN and ISCMETRICF Plots will be SHCP NEUTRAL PLOTFILE format3 NO Appendage INITIAL & INTERPOLATED OFFSETS Printedo NO Appendage PL(rS0 Connection from Station ENDS to Centerline & DAE SHOWN0 Do not save HULL/APPENDAGE Evaluation Messages if Successful0 Input/Output units selected are ENGLISH-ENGLISHFFG61 FULL LOAD OCND. (CCOND. D) SERIAL NtUMBER- 12 DATE- 9-Aug-90
LONGIMTUINAL STRENGTH CAICULATICNSOWAVE CENTER FRM AMIDSHIPS 0.. FEET (+ FWD)WAVE LENGTH/LBP 1.000WAVE HEIGHT INPUT 6.20 FEET
OSpecified Tolerances of Volume 0.00001000 and LBP =0.00000500Maximum Iteration for Volume = 20 and LBP = 20
0 WEIGHTSTATION(FRCM FP)
WEIGHT LOG OF WEIGHT( TONS ) FROM AMIDSHIPS
(FT,+FWD)
- SECTICON MDULUS --
(INCH**2-FEET)DECK KEEL
86
0
0+ _
0
C
-

-29.000. 28.68 218.1520.40 42.43 193.8040.80 80.51 173.4061.20 106.63 153.0081.60 204.55 132.60
102.00 233.93 112.20122.40 282.89 91.80142.80 290.51 71.40163.20 196.93 51.00183.60 191.49 30.60204.00 241.54 10.20224.40 255.69 -10.20244.80 245.90 -30.60265.20 233.93 -51.00285.60 302.47 -71.40306.00 255.69 -91.80326.40 179.53 -112.20346.80 181.70 -132.60367.20 124.04 -153.00387.60 ].59.94 -173.40408.00 132.74 -193.80420e00 16.00 -210.00
ISHIP- FFG61 FULL LOAD CrND. (COND. D) SERIAL NUMBER- 12 DATE- 9-Aug-900 LITOMUDINAL STRINGTH CALCIATICONS - SAGGINGODRAFTS AND SECTIONAL AREAS AT VARIOUS INPUT STATIONS
LOCATION DRAFT SECTIONAL AREA LOCATICN DRAFT SECTIONAL AREAFT FRCM FP FEET SQUARE FEET FT FBRM FP FEET SQUARE FEET
-27.947 20.443 0. 195.718 13.702 448.757-23.914 20.500 0. 200.200 13.653 449.454-19.432 20.563 0. 204.682 13.614 449.908-14.949 20.593 0. 209.165 13.626 449.522-10.467 20.607 0. 213.647 13.638 449.074
-5.985 20.621 0. 218.129 13.651 448.565-1.503 20.635 4.390 222.612 13.663 447.9942.980 20.604 20.897 227.094 13.710 447.36i7.462 20.549 40.107 231.576 13.781 446.667
11.944 20.494 60.004 236.058 13.852 445.91116.427 20.439 80.586 240.541 13.923 445.09320.909 20.376 101.854 245.023 13.996 444.27325.391 20.253 123.808 249.505 14.119 444.18529.873 20.129 146.448 253.988 14.242 443.39034.356 20.006 169.774 258.470 14.364 441.88938.838 19.882 193.786 262.952 14.487 439.68143.320 19.728 216.384 267.434 14.630 436.7,5647.803 19.548 236.609 271.917 14.793 433.14552.285 19.369 255.694 276.399 14.957 428.81756.767 19.190 273.641 280.881 15.120 423.78361.249 19.010 290.448 285.364 15.283 418.04265.732 18.795 306.116 289.846 15.471 411.80670.214 18.579 320.646 294.328 15.659 405.23174.696 18.363 334.036 298.810 15.848 398.31479.179 18.147 346.287 303.293 16.036 391.05483.661 17.924 356.849 307.775 16.227 383.45388.143 17.693 365.988 312.257 16.422 375.50992.625 17.462 374.482 316.740 16.617 367.22497.108 17.230 382.330 321.222 16.811 358.596
101.590 16.999 389.534 325.704 17.006 349.627106.072 16.774 396.093 330.186 17.188 340.222110.555 16.549 402.007 334.669, 17.368 330.624115.037 16.324 407.276 339.151 17.547 320.866119.519 16.099 411.900 343.633 17.727 310.946
87

124.001 15.883 415.889128.484 15.683 419.540132.966 15.484 422.975137.448 15.284 426.193141.931 15.084 429.195146.413 14.917 431.980150.895 14.758 434.549155.377 14.599 436.901159.860 14.440 439.037164.342 14.294 440.874168.824 14.187 442.322173.306 14.080 443.663177.789 13.972 444.897182.271 13.865 446.023186.753 13.799 447.042191.236 13.751 447.953195.718 13.702 448.757
iSHIP- FFG61 FULL LOAD CCND. (CCND. D)0 LaCGITUDINAL STRENGTH CAICUILATICNSOWAVE HEIGHT, 6.20 FT CENTER 0. FT FR
DISPLACEMENT 3987.72 TONS SW LCG
348.116 17.895352.598 18.038357.080 18.181361.562 18.324366.045 18.466370.527 18.568375.009 18.655379.491 18.742383.974 18.829388.456 18.903392.938 18.922397.421 18.940401.903 18.959406.385 18.977410.867 18.965415.350 18.930419.831 18.879SERIAL NUMBER- 12
- SAGGING
300.865290 623280.220269.656258.930248.448236.873223.902209.538193.780176.627158.082138.141116.80730.250
0.0.
DATE- 9-Aug-90
Ci AMIDSHIPS (+ FWD) LENG-I/LBP 1.000-6.009 FT FROM AMIDSHIPS (+ FWD)
L0CATICN WEIGHT ISTRESS ( TNS/IN**2
FT FM FP TOINSDECK
-29.00
0.
20.40
40.80
61.20
81.60
102.00
122.40
142.80
163.20
183.60
204.00
224.40
244.80
265.20
285.60
306.00
326.40
346.80
KEEL
28.68
42.43
80.51
106.63
204.55
233.93
282.89
290.51
196.93
191.49
241.54
255.69
245.90
233.93
302.47
255.69
179.53
181.70
124.04
3tK)YANCY SHEAR
TCNS TCNS
0.0.41
28.2730.76
39.9487.88
32.57145.34
-6.14188.45
9.96217.06
26.83235.16
74.56246.27
118.80253.83
61.90258.55
-5.16261.31
-24.94261.68
-30.93260.02
-45.05257.92
-69.03250.18
-16.74234.72
4.23214.46
-30.70190.19
-39.19163.36
BENDING MCM
FOOT-¶TtS
0.
405.3
1191.0
2034.7
2389.2
2489.8
2902.4
3960.7
5948.1
7801.9
8386.4
8083.0
7511.0
6732.7
5563.2
4667.9
4509.3
4201.4
3444.6
WEIGHT BUYANCY SHEAR
ORD
0.30
0.64
1.21
1.60
3.08
3.52
4.26
4.37
2.96
2.88
3.63
3.85
3.70
3.52
4.55
3.85
2.70
2.73
ORD
0.00
0.46
1.32
2.19
2.84
3.27
3.54
3.71
3.82
3.89
3.93
3.94
3.91
3.88
3.76
3.53
3.23
2.86
1.87 2.46
ORD
0.
0.213
0.300
0.245
-0.046
0.075
0.202
0.561
0.894
0.466
-0.039
-0.188
-0.233
-0.339
-0.519
-0.126
0.032
-0.231
ORD
0.
0.050
0.146
0.250
0.294
0.306
0.357
0.487
0.731
0.959
1.031
0.994
0.923
0.828
0.684
0.574
0.554
0.516
-0.295 0.423
88

-78.50 2196.9159.94 133.43
132.74 90.49
16.00 6.26
-51.99
-9.74
0.
807.2
90.0
2.3
2.41 2.01
2.00 1.36
0.41 0.16
-0.391 0.099
-0.073 0.011
0. 0.000
GNWT AT ZERO SHEAR= 2395.5 FOOT-TCNSFMMENT AT ZER) SHEAR- 2377.5 FOO-TC~SM[1]NT AT ZERO SHEAR- 8390.4 FOOr-TNS
2KMENT AT ZEIRO SHEAR- 4503.1 FOCT-TCNSrE=NT AT ZERO SHEAR= 4513.3 FOT-TCNS
iSHIP- FFG61 FULL LOAD OCD. (OCtD. D)0 LOIT'UDINAL STREITH CALCUAOItSODRAFTS AND SECTI~CAL AREAS AT VARIOUS INPUT
IC2ATICNFT F]M FP
-27.947-23.914-19.432-14.949-10.467-5.985-1.5032.9807.462
11.94416.42720.90925.39129.87334.35638.83843.32047.80352.28556.76761.24965.73270.21474.69679.17983.66188.14392.62597.108
101.590106.072110.555115.037119.519124.001128.484132.966137.448141.931146.413150.895155.377159.860164.342
DRAFT SECTIOCAL AREAFEET SQUARE FEET
10.222 0.10.197 0.10.170 0.10.171 0.10.185 0.10.199 0.10.213 0.10.265 2.87410.336 9.17610.407 16.44710.478 24.68610.556 33.89310.686 44.06810.816 55.21110.946 67.32311.075 80.40311.234 93.94';11.416 107.61311.598 121.67611.779 136.13511.961 150.98912.184 166.23912.406 181.88412.628 197.92412.850 214.36013.084 230.88113.332 247.48513.579 264.55313.827 282.08614.074 300.08314.327 318.54514.581 337.47114.835 356.86115.088 376.71615.337 397.07615.575 417.42315.814 437.42016.052 457.06916.291 476.36916.500 495.32116.701 513.92316.903 532.17617.105 550.08117.292 567.417
LOCATED 59.111 FT FRCMLOCATED 65.230 FT FRCMLOCATED 182.064 FT FRfCMLOCATED 303.014 FT FROMI.OCATED 307.927 FT FaCMSERIAL NUMBER- 12 DATE-- HOGGINGSITATICNS
I NCATINFT FRC FP
195.718200.200204.682209.165213.647218.129222.612227.094231.576236.058240.541245.023249.505253.988258.470262.952267.434271.917276.399280.881285.364289.846294.328298.810303.293307.775312.257316.740321.222325.704330.186334.669339.151343.633348.116352.598357.080361.562366.045370.527375.009379.491383.974388.456
FPFPFPFPFP9-Aug-90
DRAFT SECTICNAL AREAFEET SQUARE FEET
18.129 649.70218.207 656.15418.273 660.99418.277 662.84218.281 663.24818.285 662.21018.289 659.72918.252 655.80518.188 650.43818.123 643.62918.058 635.37617.991 625.71417.871 615.28417.751 603.45817.630 590.23617.510 575.61617 372 559.60117.215 542.18817.058 523.37916.901 503.17316.744 481.57116.572 459.14816.400 436.71316.228 414.27016.056 391.81915.886 369.36015.720 346.89415.554 324.41915.388 301.93715.222 279.44715.078 257.49514.937 236.39614.796 216.11214.655 196.64314.526 177.99014.426 160.15114.326 143.12814.226 126.92014.126 111.52814.064 97.22414.016 83.47013.968 70.11713.919 57.16613.882 44.617
89
387.60
408.00
420.00
-0.591 0.270367.20

168.824 17.438 583.149173.306 17.585 597.556177.789 17.731 610.636182.271 17.877 622.391186.753 17.974 632.820191.236 18.052 641.924195.718 18.129 649.702
1SHIP- FFG61 FULL LOAD OND. (ND. D)0 GIE)r SIEGTH CALCULATIOAVE HEIGHT, 6.20 FT
DISPLACMET 3!CNTER 0.,
987.72 TNS SWFT
OLOCATION WEIGHTSTRESS ( TONS/IN**2FT M FP TONSDECK KEEL-29.00
28.680.
42.4320.40
80.5140.80
106.6361.20
204.5581.60
233.93102.00
282.89122.40
290.51142.80
196.93163.20
191.49183.60
241.54204.00
255.69224.40
245.90244.80
233.93265.20
302.47285.60
255.69306.00
179.53326.40
181.70346.80
124.04367.20
159.94387.60
132.74408.00
16.00420.00
)BUOYNCYTOCNS
0.
8.36
33.77
68.75
108.66
152.58
201.05
253.83
304.39
347.79
376.17
385.82
375.80
349.36
306.87
250.24
190.66
133.04
84.01
44.67
11.89
0.
SHEAR
TCS
0.
28.68
62.75
109.48
147.37
243.25
324.61
406.45
443.12
335.66
179.36
44.73
-85.40
-215.30
-330.73
-335.13
-329.68
-340.81
-292.15
-252.12
-136.85
-16.00
0.
0.
405.8
1371.6
3181.4
5865.1
9921.3
15791.1
23335.0
32090.2
40116.2
45431.3
47751.8
47334.7
44235.7
38608.3
31729.9
24847.8
17907.4
11359.5
5732.9
1705.3
96.0
-0.1
BEND]
FOO
392.938 13.893 32.469397.421 13.903 20.722401.903 13.913 9.377406.385 13.924 0.410.867 13.959 0.415.350 14.014 0.419.831 14.082 0.SERIAL NUMBER- 12 DATE- 9-Aug-90
ICNS - HOGGINGr FcOM aMDSHIPS (+ FD) LENGrLaP 1.00oooLCG -6.009 FT FR]M AMIDSHIPS (+ FD)
NG MM WEIGHT BUDYANCY SHEAR 1MM
-ITNs OD ORD OC) OD
0.
0.216
0.472
0.824
1.109
1.830
2.442
3.058
3.334
2.525
1.349
0.337
-0.642
-1.620
-2.488
-2.521
-2.480
-2.564
-2.198
-1.897
-1.030
-0.120
0.
0.
0.050
0.169
0.391
0.721
1.220
1.941
2.868
3.945
4.931
5.585
5.870
5.819
5.438
4.746
3.900
3.054
2.201
1.396
0.705
0.210
0.012
-0.000
0.30
0.64
1.21
1.60
3.08
3.52
4.26
4.37
2.96
2.88
3.63
3.85
3.70
3.5i2
4.55
3.85
2.70
2.73
1.87
2.41
2.00
0.41
0.
0.13
0.51
1.03
1.63
2.30
3.03
3.82
4.58
5.23
5.66
5.81
5.65
5.26
4.62
3.77
2.87
2.00
1.26
0.67
0.18
0.
47908.7 FOCI-TCNS IOCATED 211.012 FT FRC FP= AT ZERO SHEAR
90

D q C') C 4 o0 H N -
i i~~~~~~~~~~~~~~
0
ir4
a
0 a
INO
R'~C
rrlrcrl el
FIig B SC R l Pl La SI
Figure B-7: SHCP Results, Full Load, Seastate 4, Hogging
91

u,) * r N r4 0 "4
Figure B-8: SHCP Results, Full Load, Seastate 4, Sagging
92

FULL LOAD, SEASTATE 6
SSSSSSSSSS
SSSSSS SSS SSS SSSSSSSS
SSSS
SSSS HH HH CCCC PPPPPPIWSSSSS HH RH CCCOCC PPPPPP]
SS HH HH CC CC PPSS HH HH CC CC PP
HH NH CC CC PP PPHHHHHHHHHH CC PPPPPPPP
H HH~iHHHH CC PPPPPPP3 HH HH CC CC PP
HH NH CC CC PPHH HH CC CC PP
HH HH CCCCCC PPHH HH CCCC PP
SHIP HULL CHARACTERISTICS PROGRAM
ODESIGN DISPLAEMENTDESIGNDESIGNDESIGNDESIGNDESIGN
OLENGTHLENTH
DRAFTLCGVCGTCGTRIMOVERALLBEWEEN
(+ ABOVE BL)(+ FWD MD)(+ ABOVE BL)(+ STD)(+ BY STERN)
PERPENDICULARSLENGTH CN DESIGN WATERLINE
OSTATICN OF MAX AREA (AT DWL)BEAM AT STATICN OF MAX AREASECTION AREA OOEFFICIENTPRISMATIC COEFFICIENTBICK COEFFICIENT
OSpecified Tolerances of VolumeMaximnm Iteration for Volume
3987.72015.935-6.110
0.0.0.993
447.780408.000409.645211.42945.4070.76670.61600.4723
TCNSFTIFTIFTIFTIFTI
SW at DENSITY =
DESIGNDESIGNDESIGNDESIGN
FEETFEETFEETFEET FRCM FPFEET
LCBVQCBTCBLIST
35.000 FT3/TCN
(+ F MED)(+ ABL)(+ STBD)(+ STBD)
-6.1109.9710.0.
FTFTFTDEG
=0.00001000 and LBP =0.00000500= 20 and LBP = 20
Approximate Bounding Cube Values:
Forward X location -27.948 FtAfter X location 419.832 FtMaxiuci m Y value on Station 46.938 FtMinimum Z value on Station 0. FtMaximu Z value on Station 41.893 Ft
Work List and Requested COptions:
(+ Aft FP)(+ Aft FP)
(+ Abv BL)(+ Abv BL)
1 3 Longitudinal Strength
IPLOTLDXFKKAPIPLTAP
3 N Min Hull INITIAL & INTERPOLATED OFFSETS Printed3 Plot Main Hull both BODY PLAN and ISCMETRICF Plots will be SHCP NEUTRAL PLOTFILE fonmat3 1D Appendage INITIAL & INTERPOLATED OFFSETS Printed0 ND Appendage PLOTS
IPLO(N 0 Connection from Station ENDS to Centerline & DAE SHOWNMSGSAV 0 Do not save HULL/APPENDAGE Evaluation Messages if SuccessfulIUNIT 0 Input/Output units selected are ENGLISH-ENGLISH
iSHIP- FFG61 FULL LOAD COND. (CCND. D) SERIAL NMBER- 13 DATE-0 LNGITUDINAL STRENGTH CALCULATIaCSOWAVE CENTER FRM AMIDSHIPS 0. FEET (+ FWD)
WAVE LENGTH/LBP 1.000WAVE HEIGHT INPUT 16.40 FEET
9-Aug-90
OSpecified Tolerances of Volume =--0.00001000 and LBP 0.00000500Maximumx Iteration for Volume = 20 and LBP 20
0 WEIGHT WEIGHT LCG OF WEIGHT - SECTION MDULUS --
93
PPPPPPP
0+
0

S:TICN ( ItNS ) FM AMIDSHIPS(F!RM FP) (FT, +F)
-29.000. 28.68 218.15
20.40 42.43 193.8040.80 80.51 173.4061.20 106.63 153.0081.60 204.55 132.60
102.00 233.93 112.20122.40 282.89 91.80142.80 290.51 71.40163.20 196.93 51.00183.60 191.49 30.60204.00 241.54 10.20224.40 255.69 -10.20244.80 245.90 -30.60265.20 233.93 -51.00285.60 302.47 -71.40306.00 255.69 -91.80326.40 179.53 -112.20346.80 181.70 -132.60367.20 124.04 -153.00387.60 159.94 -173.40408.00 132.74 -193.80420.00 16.00 -210.00
1SHIP- FFG61 FULL IOAD CO)D. (ND. D)0 LNGITUDINAL STRENGTH CALCUATIOCNSODRAFTS AND SECTICINAL AREAS AT VARIOUS INPUT
(INCH**2-FEET)DECK KEEL
SERIAL NtBER-- SAGGINGSTATIMOS
13 DATE- 9-Aug-90
DRAFT SECTICIAL AREAFEET SQUARE FEET
28.05428.22528.41528.50628.54928.59228.63528.53728.36728.19828.02927.83627.46227.08926.71526.34225.88525.36224.84024.31723.79423.19222.59021.9882..38620.77820.16219.54718.93118.31617.73717.162
0.0.0.0.0808.762
21.57338.51267.624
100.879133.407165.210196.286226.637256.261285.159313.330338.037358.630376.889392.814406.406417.664426.588433.178437.435438.957438.653437.354435.059431.769427.484422.204
LOCATICNFT FERM FP
195.718200.200204.682209.165213.647218.129222.612227.094231.576236.058240.541245.023249.505253.988258.470262.952267.434271.917276.399280.881285.364289.846294.328298.810303.293307.775312.257316. 740321.222325.704330.186334.669
DRAFT SECTICNAL AREAFEET SQUARE FEET
10.1029.9769.8719.8849.8969.9089.921
10.01510.16210.31010.45810.61210.88511.15911.43211.70512. C 212.41412.79513.17613.55714.01514.47714.93815.40015.87816. 38016.88217.38417.88618.37718.866
291.826289.052286.824284.684283.339282.791283.040284.084285.926288.564291.998296.290302.085307.776313.363318.845324.223329.496334.665339.729344.690349.792354.751359.553364.196368.682373.009377.179381.190385.044388.538391.260
94
LOCATIONFT FRCM FP
-27.947-23.914-19.432-14.949-10.467-5.9d5-1.503
2.9807.462
11.94416.42720.90925.39129.87334.35638.83843.32047.80352.28556.76761.24965.73270.21474.69679.17983.66188.14392.62597.108
101.590106.072110.555

115.037 16.587 415.929 339.151 19.354119.519 16.012 408.659 343.633 19.843124.001 15.465 400.517 348.116 20.308128.484 14.970 392.335 352.598 20.717132.966 14.476 384.237 357.080 21.126137.448 13.981 376.222 361.562 21.535141.931 13.486 368.291 366.045 21.944146.413 13.079 360.444 370.527 22.243150.895 12.692 352.680 375.009 22.503155.377 12.305 345.000 379.491 22.763159.860 11.919 337.404 383.974 23.023164.342 11.564 329.803 388.456 23.244168.824 11.303 322.389 392.938 23.300173.306 11.042 315.638 397.421 23.356177.789 10.781 309.550 401.903 23.412182.271 10.519 304.125 406.385 23.469186.753 10.353 299.362 410.867 23.431191.236 10.228 295.263 415.350 23.320195.718 10.102 291.826 419.831 23.165
1SHIP- FFG61 FULL LOAD COND. (COND. D) SERIAL NUMBER- 130 LCOGITUDINAL STRENGTH CALCTTIONS - SAGGINGOWAVE HEIGHT, 16.40 FT CENTER 0. FT FRCM AMIDSHIPS (+ FWD)
DISPLACEMENT 3987.72 TCNS SW
393.200394.357394.730394.321393.128391.153388.395384.615378.259369.153357.301342. 699325.350305.252282.406256.813161.672
0.0.
DATE- 9-Aug-90
LENGTH/LBP 1.000ILCG -6.009 FT FRCM AMIDSHIPS (+ FWD)
OLCCATION WEIGHT BUOYANCY SHEAR BENDING M]MSTRESS ( TONS/IN**2 )FT FM FP TONSDECK KEEL-29.00
28.68 8.02
42.43 70.06
80:51 151.76
106.63 215.59
204.55 248.61
233.93 254.60
282.89 244.31
290.51 224.38
196.93 203.50
191.49 184.23
241.54 171.24
255.69 165.48
245.90 168.04
233.93 180.08
302.47 194.34
255.69 207.62
179.53 219.47
181.70 228.20
WEIGHT BUOYANCY SHEAR
ORD
0. 0.
20.66
-6.97
-78.22
369.9
655.8
-81.7
-187.18 -2708.6
-231.24 -6944.2
-251.91 -11879.6
-213.33 -16652.7
-147.20 -20366.5
-153.76 -23470.8
-146.50 -26562.4
-76.20 -28849.2
14.01 -29487.3
91.87 -28394.8
145.72 -25946.0
253.85 -21847.2
-01.92 -16156.6
261.98 -10386.3
0.30 0.08
0.64 1.05
1.21 2.28
1.60 3.24
3.08 3.74
3.52 3.83
4.26 3.68
4.37 3.38
2.96 3.06
2.88 2.77
3.63 2.58
3.85 2.49
3.70 2.53
3.52 2.71
4.55 2.92
3.85 3.12
2.70 3.30
2.73 3.43
ORD ORD
0. 0.
0.155 0.045
-0.052 0.081
-0.588 -0.010
-1.408 -0.333
-1.740 -0.854
-1.895 -1.460
-1.605 -2.047
-1.107 -2.504
-1.157 -2.885
-1.102 -3.265
-0.573 -3.546
0.105 -3.625
0.691 -3.490
1.096 -3.189
1.910 -2.686
2.271 -1.986
1.971 -1.277
95
0.
20.40
40.80
61.20
81.60
102.00
122.40
142.80
163.20
183.60
204.00
224.40
244.80
265.20
285.60
306.00
326.40
TOai TCNS FOOr-TCS ORD
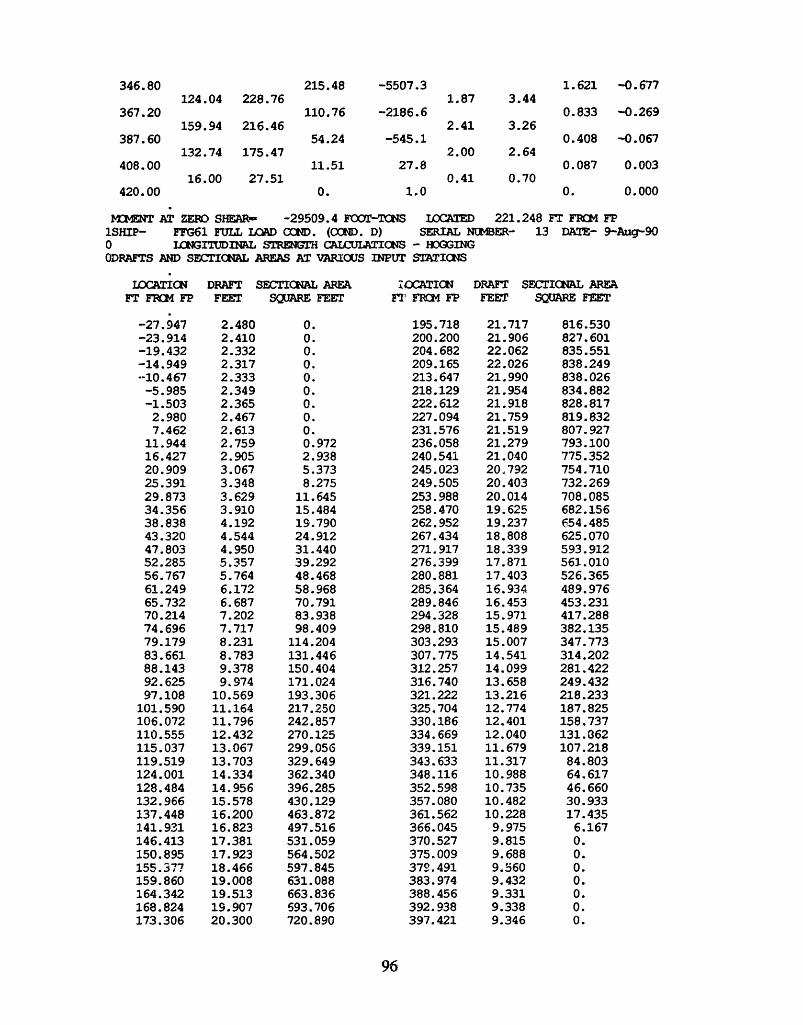
215.48 -5507.3124.04 228.76
159.94 216.46
132.74 175.47
16.00 27.51
110.76 -2186.6
54.24
11.51
-545.1
27.8
0. 1.0
1.87 3.44
2.41 3.26
2.00 2.64
0.41 0.70
0.833 -0.269
0.408 -0.067
0.087 0.003
0. 0.000
MOMENT AT ZERO SHEAR- -29509.4 FOOT-NS LOCATED 221.248 FT FRCM FPISHIP- FFG61 FULL LOAD COND. (CCND. D) SERIAL NUMBER- 13 DATE- 9-Aug-900 LCIGVDINAL STRENGTH CALCULATNS - HOGGINGODRAFTS AND SECTICNAL AREAS AT VARIOUS INPUT STATICINS
DRAFT SECTICNAL AREAFEET SQUARE FEET
2.4802.4102.3322.3172.3332.3492.3652.4672.6132.7592.9053.0673.3483.6293.9104.1924.5444.9505.3575.7646.1726.6877.2027.7178.2318.7839.3789.974
10.56911.16411.79612.43213.06713.70314.33414.95615.57816.20016.82317.38117. 92318.46619.00819.51319.90720.300
0.
0.0.0.0.0.0.0.0.0.9722.9385.3738.275
11.64515.48419.79024.91231.44039.29248.46858.96870.79183.93898.409
114.204131.446150.404171.024193.306217.250242.857270.125299. 056329.649362.340396.285430.129463.872497.516531.059564.502597.845631.088663.836593.706720.890
FOCATICFr' FRfC FP
195.718200.200204.682209.165213. 647218.129222.612227.094231.576236.058240.541245.023249.505253.988258.470262. 952267.434271. 917276.399280.881285.364289.846294.328298.810303.293307.775312.257316.740321.222325.704330.186334.669339.151343.633348.116352.598357.080361.562366.045370.527375.009379. 491383.974388.456392.938397.421
DRAFT SECTICNAL AREAFEET SQUARE FEET
21.71721. 90622.06222.02621.99021.95421.91821.75921.51921.27921.04020 79220.40320.01419.62519.23718.80818.33917.87117.40316.93416.45315. 97115.48915.00714.54114.09913. 65813.21612.77412.40112.04011.67911.31710.98810.73510.48210.2289.9759.8159.6889.5609.4329.3319.3389.346
816.530827.601835.551838.249838.026834.882828.817819.832807.927793.100775.352754.710732.269708.085682.156654.485625.070593.912561.010526.365489.976453.231417.288382.135347.773314.202281.422249. 432218.233187.825158.737131.062107.21884.80364.61746.66030.93317.435
6.1670.0.0.0.0.0.0.
96
367.20
387.60
408.00
420.00
CATICNFT FPM FP
-27.947-23.914-19.432-14.949-10.467-5.985-1.503
2.9807.462
11.94416.42720.90925.39129.87334.35638.83843.32047.80352.28556.76761.24965.73270.21474.69679.17983.66188.14392.62597.108
101.590106.072110.555115.037119.519124.001128.484132.966137.448141.931146.413150.895155.377159.860164.342168.824173.306
1.621 -0.677346.80

177.789 20.694 745.389182.271 21.088 767.202186.753 21.338 786.330191.236 21.527 802.773195.718 21.717 816.530
1SHIP- FFG61 FULL MAD COND. (COND. D)O G-L SRENGT CUL
40:40141(41!41!
SEcONS - I
' FLM-6 LnX -6,
1.903 9.354 0.6.385 9.361 0.0.867 9.426 0.5.350 9.536 0.9.831 9.673 0.ERIAL NUMBER- 13 DATE- 9-Aug-90HOGGINGAISHIPS (+ FD) U*~LBP 1.000.009 FT F AMIDSHIPS (+ FWD)
WEIGHT BYANCY SHEAR MMIENT
CED ORD ORD ORD
KAVE HEIGHT, 16.40 FT CENTER 0. Fl3987.72 TONS SWDISPLAJZbENTf
OLOCATION WEIGHT BMOYNCY SEARSTRESS ( TCNS/IN*2 )FT M FP TMNS TNS TCNSDECK KEEL-29.00 0.
28.68 0.0. 28.68
42.43 0.7 320.40 70.38
80.51 7.3740.80 143.52
106.63 22.1861.20 227.97
204.55 51.7581.60 380.78
233.93 98.23102.00 516.47
282.89 164.36122.40 635.00
290.51 249.05142.80 676.47
196.93 338.11163.20 535.29
191.49 419.14183.60 307.64
241.54 471.33204.00 77.85
255.69 486.85224.40 -153.30
245.90 463.79244.80 -371.20
233.93 408.51265.20 -545.78
302.47 330.47285.60 -573.78
255.69 236.84306.00 -554.93
179.53 148.00326.40 -523.40
181.70 71.63346.80 -413.33
124.04 19.30367.20 -308.59
159.94 0.09387.60 -148.74
132.74 0.408.00 -16.00
16.00 0.420.00 0.
BENDING MM
FO-TS
0.
405.8
1421.1
3619.4
7445.3
13718.4
22965.7
34840.2
48369.7
60880.1
69594.3
73587.6
72808.7
67389.8
57921.8
46351.9
34680.0
23538.1
13871.7
6441.9
1776.4
96.1
0.
O.
0.216
0.529
1.080
1.715
2.865
3.885
4.777
5.089
4.027
2.314
0.586
-1.153
-2.793
-4.106
-4.317
-4.175
-3.938
-3.110
-2.322
-1.119
-0.120
0.
0.
0.050
0.175
0.445
0.915
1.686
2.823
4.283
5.946
7.484
8.555
9.046
8.950
8.284
7.120
5.698
4.263
2.893
1.705
0.792
0.218
0.012
0.
0.30
0.64
1.21
1.60
3.08
3.52
4,26
4.37
2.96
2.88
3.63
3.85
3.70
3.52
4.55
3.85
2.70
2.73
1.87
2.41
2.00
0.41
0.
0.01
0.11
0.33
0.78
1.48
2.47
3.75
5.09
6.31
7.09
7.33
6.98
6.15
4.97
3.56
2.23
1.08
0.29
0.00
O.
O.
MMENT AT ZERO SHEAR= 73854.1 FOOT-TONS CATED 210.836 FT FR FP
97

0c-I
cr. aw tC- Lfn ma 6 0 ( N C.) IV t i I I I I
0
-
I
0
M
S e.
.
Aig vi H HH4HH
X0i11111 - H,4
t IL)ii = c-
.,, ... .I I I I Ie B-: SHCP Rsults, Full Load, Seastate 6, Hogging
Figure B-9: SHCP Results, Full Load, Seastate 6, Hogging
98
_ · 1 _I _·

un v Cn NC H 0 H CN I vI I I I
0
I0
Q1
a a
0 -
o 2
oco r.t·
I..H 9H f
C.i
H- H H H H
>d1)
M 4: E4
OtCD>4 raZHO
Figure B-10: SHCP Results, Full Load, Seastate 6, Sagging
99

Appendix C: Hull Flexure, Displacement and Rotation
FULL LOAD, SEASTATE 0 ................................... 10180% FUEL CONDITION, SEASTATE 0 ........................... 10260% FUEL CONDITION, SEASTATE 0 ........................... 103MINIMUM OPERATING CONDITION, SEASTATE 0 ................ 104FULL LOAD, SEASTATE 2, HOGGING .......................... 105FULL LOAD, SEASTATE 2, SAGGING ........................... 106FULL LOAD, SEASTATE 4, HOGGING .......................... 107FULL LOAD, SEASTATE 4, SAGGING ........................... 108FULL LOAD, SEASTATE 6, HOGGING .......................... 109FULL LOAD, SEASTATE 6, SAGGING ........................... 110
100

FULL flAD, SEAST 0
FULL LCAD0N/A
E: 13400Station Spacing : 20.1Max Dist Fwd FP : 29.0Max Dist Aft FP : 420.0
Sta Dist Aft FPft
-1.42 -29.00 0.01 20.42 40.83 61.24 81.65 102.06 122.47 142.88 163.29 183.6
10 204.011 224.412 244.813 265.214 285.615 306.016 326.417 346.818 367.219 387.620 408.0
20.59 420.0
MENTft-ltons
0-405.8-1317.6-2761.1-4455.2-6729.2-10047.6-14477.6-19920.2-24886.1-27840.7-28854.4-28373.6-26453
-23057.2-19135.5-15524.7-11750.3-7904.4-4261.3-1369.8-96.1-0.6
Iin^2ft'
0104300106400108500110681112994102384136770130123133311154307165435162374152744135444110066894676908457188392002770016200
0
M/E/I 1st Irft^-
0.OOOE+00-2.904E-07-9.241E-07-1.899E-06-3.004E-06-4.444E-06-7.324E-06-7.900E-06-1.142E-05-1.393E-05-1.346E-05-1.302E-05-1.304E-05-1.292E-05-1.270E-05-1.297E-05-1.295E-05-1.269E-05-1.031E-05-8.112E-06-3. 690E-06-4.427E-07
0.000E+00
-4.21E--1.66E-C-4.54E-C-9.54E-C-0.0001)-0.0002-0.00044-0.00064-0.0009C-0.00118-0.00145-0.00171-0.00198-0.00224-0.00250-0.0027
-0.00303-0.00326-0.00345-0.00j37-0.00361-0.00362
it 2nd Int- ft
0 0)6 -6.105E-05)5 -0.0002733)5 -0.0009056)5 -0.002341871 -0.00506391 -0.009783417 -0.01731214 -0.0284349)2 -0.044206232 -0.065465752 -0.0923306.8 -0.124661483 -0.1624044.4 -0.205515316 -0.253964'7 -0.307781532 -0.366963967 -0.431207955 -0.499762875 -0.571462917 -0.644820922 -0.718655
LEAST-SQARES PCEL CURVE FI-0.000725 xAO dY/dX=0.000025 xl15.47E-07 xf2
-1.69E-08 xA31.49E-ll xf4
'ITM X-LOCATICNFT AFT FP
MK 13 GMLCASSTIRMK 75 GUN
70120208240
SIOPE INUES ARC
-0.000127 -0.44-0.000473 -1.63-0.001411 -4.85-0.001818 -6.25
(x.Ft Aft FP, ft; y-2nd Iter.,ft)
0.0000251.09E-06 xl
-5.08E-08 x25.95E-11 x"3
DIFFERENE M=TRX (ARC-MTn)
MK 130
1.194.425.81
CAS STIR "K75
0.003.234.62
0.001.40
101
C/DITICN:SEASTATE:HOG/SA:
ltons/in^2ftftft
2nd Intinches0.0000
-0.0007-0.0033-0.0109-0.0281-0.0608-0.1174-0.2077-0.3412-0.5305-0.7856-1.1080-1.4959-1.9489-2.4662-3.0476-3.6934-4.4036-5.1745-5.9972-6.8576-7.7379-8.6239
Corrinches0.0000.55630.94551.32981.70442.06352.39872.70022.95853.16113.29783.36723.37113.31003.18452.99492.74092.42252.04341.61261.14400.65550.0000
FORH CORDERY=
0.00
W%

80% FUEL CXIDTICN, SEASTIE 0
80% FUEL LOAD0N/A
E: 13400Station Spacing : 20.4Mbx Dist Fwd FP : 29.0Mbx Dist Aft FP : 420.0
Sta Dist Aft FP M2MEbft ft-ltor
-1.420123456789
1011121314151617181920
20.59
-29.00.0
20.440.861.281.6
102.0122.4142.8163.2183.6204.0224.4244.8265.2285.6306.0326.4346.8367.2387.6408.0420.0
* -405.* -1323.* -2801.* -4586.* -7029.* -10615.* -1520* -20702.* -25787.* -28957.* -30373.* -30274.* -28725.* -25162.* -20544.* -16434.* -12306.* -8202.* -4388.* -1401.* -9* -- 0.
is in^2ft ^
0 08 104300 -3 106400 -8 108500 -3 110681 -2 112994 -5 102384 -
12 136770-9 130123-7 133311 -4 154307 -3 165435 -4 162374 -1 152744 -7 135444 -8 110066 -6 89467 -2 69084 -7 57188 -6 39200 -3 27700 -6 16200 -4 0
I WME/I 1st Irft.^-1
0.OOOE+00-2.904E-07-9.281E-07-1.927E-06-3.092E-06-4.642E-06-7.738E-06-8.295E-06-1.187E-05-1.444E-05-1.400E-05-1.370E-05-1.391E-05-1.403E-05-1.386E-05-1.393E-05-1.371E-05-1.329E-05-1.070E-05-8.355E-06-3.775E-06-4.422E-070.000E+00
-4.21E-C-1.66E-C-4.58E-0-9.70E-0-0.00017-0.00030-0.00046-0.00067-0.0009-0.0012
-0.00151-0.00179-0.00207-0.00236-0.00264-0.00292-0.00320-0.00344-0.00364-0.00376-0.0038
-0.00381!
it 2rd Int 2rnd Int- ft inches0 0 0.0000)6 -6.105E-05 -0.0007)5 -0.0002737 -0.0033)5 -0.0009102 -0.010935 -0.002366 -0.028476 -0.0051487 -0.0618)2 -0.0100241 -0.1203;6 -0.0179556 -0.214371 -0.0294533 -0.3534'4 -0.0458866 -0.5506>3 -0.068016 -0.81622 -0.0959868 -1.1518'4 -0.1297133 -1.55669 -0.1692206 -2.0306j4 -0.2145382 -2.57457 -0.26565 -3.18789 -0.3225291 -3.87035 -0.3850929 -4.62119 -0.4529627 -5.43564 -0.5253121 -6.30377 -0.6009064 -7.21091 -0.6782015 -8.13845 -0.7559814 -9.0718
LFAST-SQUARES PCOLY IAL CURVE FIT-0.000861 x0O dY/dX=0.0000219 xl7.18E-07 x2
-1.88E-08 ex31.64E-11 xe4
ITEM X-LOCATCONFT AFT FP
SLOPE INUTES ARC
70 -0.000131 -0.45120 -0.000503 -1.73208 -0.001522 -5.23240 -0.001966 -6.76
(x--Ft Aft FP, ft; y-=2d Iter.,ft)
0.00002191.44E-06 xl
-5.63E-08 x26.58E-11 x3
DIFFERENCE M ATRIX (ARC-MIN)
MK 130
1.284.786.31
CAS STIR b75
0.003.51 0.005.03 1.52 0.00
102
OCITIS :SEASTAhE:IH/SAG:
ltons/in^2ftftft
Corrinches0.00000.58520.99481.39931.79402.17282.52652.84473.11773.33263.47933.55583.56323.50133.36973.16852.89812.55952.15731.70121.20630.69090.0000
FORH ORDERY=
N 13 GMLCASSTIRMK 75 GUN
TT

60% FUEL CINDTIC', SEAST 0
60% FUEL LOAD0N/A
E: 13400 tons/in^2Station Spacing : 20.4 ftMbx Dist Fwd FP : 29.0 ftMbx Dist Aft FP : 420.0 ft
Dist Aft FPft
-29.0 *0.0 *
20.4 *40.8 *61.2 *81.6 *
102.0 *122.4 *142.8 *163.2 *183.6 *204.0 *224.4 *244.8 *265.2 *285.6 *306.0 *326.4 *346.8 *367.2 *387.6 *408.0 *420.0 *
rmqENTft-ltons
0-405.8
-1322.8-2798.8-5036.6-8388.8
-12882.2-17935.6-23283.3-28038.4-30888.1-31997.5-31609.7-29792.6-25987.2-21154-16859
-12577.9-8355.8-4456.7-1418.7-95.9-0.3
Iin^2ft'
0104300106400108500110681112994102384136770130123133311154307165435162374152744135444110066894676908457188392002770016200
0
IL/E/I 1st Intft^-1
0.OOOE+00-2.904E-07-9.278E-07-1.925E-06-3.396E-06-5.540E-06-9.390E-06-9.786E-06-1.335E-05-1.570E-05-1. 494E-05-1.443E-05-1.453E-05-1.456E-05-1.432E-05-1.434E-05-1.406E-05-1.359E-05-1.090E-05-8.484E-06-3.822E-06-4.418E-07
0. OOE+00
-4.21E-06-1.66E-05-4.57E-05
-0.0001-0.000191-0.000343-0.000539-0.000775-0.001071-0.001384-0. 0C1683-0.001979-0.002275-0.00257
-0.002862-0.003152-0.003434-0.003684-0.003882-0.004007-0.004051-0.004055
2nd Int 2nd Intft inches
0 0.0000-6.105E-05 -0.0007-0.0002737 -0.0033-0.0009098 -0.0109-0.0023964 -0.0288-0.0053663 -0.0644-0.0108192 -0.1298-0.0198206 -0.2378-0.0332245 -0.3987-0.052058 -0.6247-0.077101 -0.9252-0.1083871 -1.3006-0.1457422 -1.7489-0.1891363 -2.2696-0.2385604 -2.8627-0.2939705 -3.5276-0.3553178 -4.2638-0.4224971 -5.0700-0.495101 -5.9412
-0.5722702 -6.8672-0.6527368 -'7.8328-0.7349275 -8.8191-0.8176077 -9.8113
LEAST-SQUARES PLYNMTIAL CURVE FIT-0.000642 x0 cdY/dX=0.000044 x'14.50E-07 x"2
-1.98E-08 xA3
1.82E-11 x"4
TM X-ILXCTICNlFT AFT FP
MK 13 GMLCASSTIRMK 75 GUN
SIOPE INIES ARC(
70 -0.000159120 -0.000578208 -0.001684240 -0.002155
-0.55-1.99-5.79-7.41
(x=Ft Aft FP,ft; y=2nd Iter.,ft)
0.0000449.00E-07 xAl
-5.94E-08 x'27.28E-11 xA3
DIFFERENCE MATRC (ARC-MN)
NK 130
1.445.246.86
CAS STIR
0.003.80 0.005.42 1.62
103
CCNDITI:SEASTATE:IW/SAG:
Sta
-1.420123456789
1011121314151617181920
20.59
FOIFH CDERY=
A

1MJMM CPEERATIl3 CXODITICN, SEASIIE 30
bMIN4 CPERATIM LAD0/A
Station Spa(Max Dist FwMax Dist AfD
ENTft-ltons
0-405.8
-1325.6-2819.1-5002.5-8240.4
-12670.8-18527.2-24971.6-29803.1-32091.9-32334.4-30967.1-28149.7-24168.6-19967.3-16165.7-12200.9-8277.5-4534.3-1438.4
-96.8-0.9
Iin^2ft
0104300106400108500110681112994102384136770130123133311154307165435162374152744135444110066
894676908457188392002770016200
0
E: 13400,cj : 20.4
F : 29.0% FP : 420.0
M/E/I 1st Intft^- -
0.000E+00-2.904E-07-9.297E-07-1.939E-06-3.373E-06-5.442E-06-9.236E-06-1. 011E-05-1.432E-05-1.668E-05-1.552E-05-1.459E-05-1.423E-05-1.375E-05-1.332E-05-1.354E-05-1.348E-05-1.318E-05-1.080E-05-8.632E-06-3.875E-06-4.459E-07
0. 000E+00
0-4.21E-06-1.67E-05-4.59E-05
-0.0001-0.00019-0.00034
-0.000537-0.000786-0.001102-0.001431-0.001738-0.002032-0.002317-0.002594-0.002867-0.003143-0.003415-0.00366
-0.003858-0.003985-0.00403
-0.004034
LEAST-SQUARES POLYNlMIAL CURVE FIT-0.00059 x0O dY/dX=
0.0000565 xl3.47E-07 x'2
-2.01E-08 x31.92E-11 xA4
ITEM X-ICATCFFT AFT FP
MK 13 GMLCASSIR75 IYc 75 GUN
70120208240
SLOPE MINTIES ARC
-0.000164-0.000595-0.001715-0.002185
-0.56-2.05-5.89-7.51
(x=Ft Aft FP,ft; y=2nd Iter.,ft)
0.00005656.94E-07 xl
-6.03E-08 x27.70E-11 x"3
DIFFEREZE MIXTX (ARC-M)
MK 130
1.485.336.95
CAS STIR M75
0.003.855.47
0.001.62
104
CODITIC1:SEASTATE:HOG/SAG:
Sta
-1.420123456789
1011121314151617181920
20.59
Dist Aft FPft
-29.00.0
20.440.861.281.6
102.0122.4142.8163.2183.6204.0224.4244.8265.2285.6306.0326.4346.8367.2387.6408.0420.0
ltcns/in^2ftftft
2nd Intft0
-6.105E-05-0.0002739-0.0009121-0.0024014-0.0053606-0.010764
-0.0197071-0.0332046-0.0524697-0.078311
-0.1106351-0.1490897-0.1934543-0.2435467-0.2992495-0.3605576-0.4274513-0.4996141-0.5762939-0.6562968-0.7380505-0.8203003
2rnd Intinches0.0000
-0.0007-0.0033-0.0109-0.0288-0.0643-0.1292-0.2365-0.3985-0.6296-0.9397-1.3276-1.7891-2.3215-2.9226-3.5910-4.3267-5.1294-5.9954-6.9155-7.8756-8.8566-9.8436
Corrinches0.00000.63501.07971.51931.94872.36042.74283.08273.36803.58403.72123.78053.76633.68123.52733.30613.01762.66222.24341.77051.25770.72390.0000
FORTH ORDERy-
0.00
I

FULL I~D, SEASITE 2, HOGGING
FULL LoID2
E: 13400Station Spacing : 20.4Max Dist Fwd FP : 29.0Max Dist Aft FP : 420.0
METrft-ltcns
0-405.8
-1330.3-2850.9-4732.8
-7327-11089.3-16048.9-22045.7-27518.1-30861.9-32092.8-31627.1-29518.6-25759.9-21350.5-17191.3-12876.1-8557.4-4556.4-1446.9
-98.9-3
in^2ft'0
104300106400108500110681112994102384136770130123133311154307165435162374152744135444110066894676908457188392002770016200
0
I M/E/I 1st Intft^-l
0.000E+00-2.904E-07-9.330E-07-1. 961E-06-3.191E-06-4.839E-06-8.083E-06-8.757E-06-1.264E-05-1.540E-05-1.493E-05-1.448E-05-1.454E-05-1.442E-05-1.419E-05-1.448E-05-1.434E-05-1.391E-05-1.117E-05-8.674E-06-3.898E-06-4.556E-07
0.000E+00
0-4.21E-06-1.67E-05-4.62E-05-9.88E-05-0.000181-0.000312-0.000484-0.000703-0.000989-0.001298-0.001598-0.001894-0.002189-0.002481-0.002773-0.003067-0.003356-0.003611-0.003814-0.003942-0.003986-0.003991
LEAST-SQRES PLYg4IPAL-0.000905 xfO0.0000262 xA17.62E-07 ex2
-1.99E-08 x31.77E-11 x4
I'cm X-IOCATICET AT FP
MK 13 GMLCASSTIRMK 75 GUN
70120208240
CURVE FITdY/dX=
SIOPE MINUTES ARC
-0.000135 -0.46-0.000528 -1.81-0.001601 -5.51-0.002067 -7.11
(x--Ft Aft FP,ft; y-=2nd Iter.,ft)
0.00002621.52E-06 xl
-5.96E-08 x27.06E-11 x3
DIFFERECE FITRIX (ARC-Ml)
N 130
1.355.046.64
CAS STIR M75
0.003.695.29
0.001.60
105
ltons/in^2ftftft
SEA.s1E:/SAG:
Sta
-1.420123456789
1011121314151617181920
20.59
Dist Aft FPft
-29.00.0
20.440.861.281.6
102.0122.4142.8163.2183.6204.0224.4244.8265.2285.6306.0326.4346.8367.2387.6408.0420.0
2nd Intft0
-6.105E-05-0.0002742-0.0009157-0.0023944-0.0052445-0.0102744-0.0184008-0.0305057-0.0477552-0.0710783-0.1006161-0.1362313-0.1778778-0.2255141-0.2791104-0.3386874-0.4042014-0.4752633-0.5509985-0.6301059-0.7109743-0.7923431
2nd Intinches0.0000
-0.0007-0.0033-0.0110-0.0287-0.0629-0.1233-0.2208-0.3661-0.5731-0.8529-1.2074-1.6348-2.1345-2.7062-3.3493-4.0642-4.8504-5.7032-6.6120-7.5613-8.5317-9.5081
Corrinches0.C00000.61341.04281.46711.88142.27922.65082.98533.27203.49703.64913.72673.73133.66353.52393.31273.02982.67562.25491.77801.26070.72230.0000
FCORTH RDERY=
0.00
A

FULrL IOAD, SEASITE 2, SGN
E:Station Spacing :Mx Dist Fwd FP :M1x Dist Aft FP :
13400 ltcns/in^220.4 ft29.0 ft
420.0 ft
Dist Aft FP 1O-ENTft
-29.00.0
20.440.861.281.6
102.0122.4142.8163.2183.6204.0224.4244.8265.2285.6306.0326.4346.8367.2387.6408.0420.0
ft-ltons0
-405.8-1302.9-2663.7-4161.9-6106.4-8972.6
-12867.2-17752.9-22211.8-24777.8-25574.9
-25079-23345.5-20312.4-16880.2-13821.9-10595.7-7231.1-3955.8-1290.1
-95.3-0.1
in^2ft'0
104300106400108500110681112994102384136770130123133311154307165435162374152744135444110066
894676908457188392002770016200
0
I WE/I lst Irft^-1
0.OOOE+00-2.904E-07-9.138E-07-1.832E-06-2.806E-06-4.033E-06-6.540E-06-7.021E-06-1.018E-05-1.243E-05-1.198E-05-1. 154E-05-1.153E-05-1.141E-05-1.119E-05-1.145E-05-1.153E-05-1.145E-05-9.436E-06-7.531E-06-3.476E-06-4.390E-07
0.OOOE+00
-4.21E-C-1.65E-C-4.45E-0-9.18E-0-0.00016-0.00026-0.00040-0.00058-0.00081-0.00106-0.00130-0.00153-0.00177-0.00200-0.00223-0.00246-0.00270-0.00291-0.00308
-0.003-0.0032
-0.00324
it 2nd t 2rid Int- ft inches0 0 0.0000)6 -6.105E-05 -0.0007)5 -0.0002722 -0.0033)5 -0.0008944 -0.0107)5 -0.0022847 -0.0274;2 -0.0048692 -0.0584;9 -0.0092653 -0.1112)8 -0.0161723 -0.1941:3 -0.0262798 -0.3154L4 -0.04053 -0.48643 -0.0596735 -0.7161)3 -0.0838044 -1.00578 -0.1127818 -1.353472 -0.1465445 -1.7585)2 -0.1850441 -2.22053 --0.22825 -2.7390;8 -0.2762012 -3.31442 -0.328933 -3.94725 -0.3862277 -4.63478 -0.4474602 -5.36952 -0.5116031 -6.13924 -0.5772983 -6.92765 -0.6434465 -7.7214
LIAS-SQUARES POLYNCIAL CURVE FIT-0.000592 x0 rY/dX=0.0000249 xl3.69E-07 x2
-1.50E-08 x31.29E-11 x4
I:EM X-LOCATICNFT AFT FP
MK 13 GMLCASSTIRlC 75 GUN
70120208240
SLOPE MINUIES ARC
-0.000126-0.000444
-0.0013-0.001671
-0.43-1.53-4.47-5.75
(xFt Aft FP,ft; y2nd Iter.,ft)
0.00002497.39E-07 xAl
-4.49E-08 x25.18E-11 x3
DIFFERENCE MATPIX (ARC-MI)
M 130
1.094.045.31
CAS STIR MK75
0.002.94 0.004.22 1.28 0.00
106
SEASMTrE:HDS/SAG:
FULL LICD2sAGGMG
Sta
-1.420123456789
1011121314151617181920
20.59
Corrinches0.00000.49800.84631.18961.52371.84352.14162.40952.63912.81892.94003.00123.00432.94992.83882.67112.44652.16451.82781.44381.02490.58740.0000
FCH MDERY=
I

FULL IAD, SEASIIE 4, HOGGING
ONDITImN:SEASAG:HG/SAG:
FULL D4
E:Statin Spacing:Max Dist Fwd FP :Max Dist Aft FP :
13400 ltons/in^220.4 ft29.0 ft
420.0 ft
Sta Dist Aft FP
-1.420123456789
1011121314151617181920
20.59
ft-29.0
0.020.440.861.281.6
102.0122.4142.8163.2183.6204.0224.4244.8265.2285.6306.0326.4346.8367.2387.6408.0420.0
ft-ltons0
-405.8-1371.6-3181.4-5865.1-9921.3
-15791.1-23335
-32090.2-40116.2-45431.3-47751.8-47334.7-44235.7-38608.3-31729.9-24847.8-17907.4-11359.5-5732.9-1705.3
-960.1
in^2ft,0
104300106400108500110681112994102384136770130123133311154307165435162374152744135444110066
894676908457188392002770016200
0
I W/E/I 1st Intft^-1
0.000E+00-2.904E-07-9.620E-07-2.188E-06-3.955E-06-6.553E-06-1.151E-05-1.273E-05-1.840E-05-2.246E-05,--2.197E-05- .154E-05-2.175E-05-2.161E-05-2.127E-05-2.151E-05-2.073E-05-1.934E-05-1. 482E-05-1.091E-05-4.594E-06-4.422E-07
0.OOOE+00
0-4.21E-06-1.70E-05-4.91E-05-0.000112-0.000219-0.000403-0.00065
-0.000968-0.001385-0.001838-0.002282-0.002723-0.003166-0.003603-0.00404-0.00447
-0.004879-0.005228-0.00549
-0.005648-0.0057
-0.005704
2nd Int 2nd Intft0
-6.105E-05-0.0002772-0.0009515-0.0025925-0.0059658-0.0123115-0.0230586-0.0395673-0.0635667-0.0964395-0.1384618-0.1895155-0,2495857-0.3186295-0.3965865-0.4833896-0.5787562-0.6818465-0.7911694-0.9047835-1.020535
-1.1368565
inches0.0000
-0.0007-0.0033-0.0114-0.0311-0.0716-0.1477-0.2767-0.4748-0.7628-1.1573-1.6615-2.2742-2.9950-3.8236-4.7590-5.8007-6.9451-8.1822-9.4940
-10.8574-12.2464-13.6423
LEAST-SQUARES PCLYZINMIAL CURVE FIT-0.00179 x0 dY/dX=
0.0000236 eA1
rEtM X--CCATICNFT AFT FP
W 13 GMLCASSTIRM 75 GN
70120208240
1.88E-06-3.22E-082.99E-11
x"2x3x4
SLOPE MINUIES ARC
-0.000146-0.000711-0.002302-0.002991
-0.50-2.45-7.91
-10.28
(x--Ft Aft FP, ft; y2nd Iter.,ft)
0.00002363.76E-06 xl
-9.67E-08 x21.20E-10 x3
DIFFERENCE TRX (ARC-I)
N 130
1.947.419.78
CAS STIR MK75
0.005.477.84
0.002.37
107
Corrinches0.00000.88041.49762.10942.70953.28883.83254.32344.74515.07695.30235.41795.42505.32405.11534.79974.37793.85333.23602.54401.80041.03130.0000
FOBIH CRDERy=
0.00
/%

FULL LAD, SEAS=IE 4, S&Cu3
FULL LOAD4SAGGING
E:Statin Spacing:bMx Dist FwdFP :Mx Dist Aft FP :
Sta Dist Aft FP
-1.420123456789
1011121314151617181920
20.59
ft-29.0
0.020.440.861.281.6
102.0122.4142.8163.2183.6204.0224.4244.8265.2285.6306.0326.4346.8367.2387.6408.0420.0
KTENT
ft-ltcns0
-405.3-1191
-2034.7-2389.2-2489.8-2902.4-3960.7-5948.1-7801.9-8386.4
-8083-7511
-6732.7-5563.2-4667.9-4509.3-4201.4-3444.6-2196.9-807.2
-90-2.3
I M/E/I 1st Int 2nd inA2ft
0104300106400108500110681112994102384136770130123133311154307165435162374152744135444110066
894676908457188392002770016200
0
ft^-10.OOOE+00
-2.900E-07-8.353E-07-1.399E-06-1.611E-06-1.644E-06-2.116E-06-2.161E-06-3.411E-06-4.367E-06-4.056E-06-3.646E-06-3.452E-06-3.289E-06-3.065E-06-3.165E-06-3.761E-06-4.538E-06-4.495E-06-4.182E.-06-2.175E-06-4.146E-07
0. OOE000E
0-4.20E-06-1.57E-05-3.85E-05-6.92E-05-0.000102-0.000141-0.000184-0.000241-0.000321-0.000406-0.000485-0.000557-0.000626-0.000691-0.000755-0.000825-0.00091
-0.001002-0.001091-0.001155-0.001182-0.001186
-6.097E--0.00026-0.00081-0.00191-0.00366-0.00614-0.00946-0.01380-0.0195
-0.02694-0.03603-0.04667-0.05874-0.07218-0.08692-0.10303-0.12073-0.14023-0.16158-0.18448-0.20832-0.23247
It 2nd Intft inches0 0.0000
-05 -0.0007638 -0.0032.63 -0.0098.44 -0.0230645 -0.0440444 -0.0737;04 -0.1135)12 -0.1656531 -0.2344464 -0.3234396 -0.4325725 -0.560154 -0.704908 -0.866255 -1.043189 -1.236565 -1.448875 -1.682911 -1.939089 -2.213974 -2.499985 -2.7897
LEASrT-SQURES PCLYNMIAL CURVE FIT0.0001318 xO dY/dXc0.0000161 xl-5.32E-07 x2-2.27E-09 x38.61E-13 xA4
IlEM X-LCATINFT AFT FP
MK 13 GMLCASSTIRM1 75 GVN
70120208240
bMCPE MINUFIS ARC
-9.06E-05-0.000204-0.000469-0.000584
-0.31-0.70-1.61-2.01
(xFt Aft FP,ft; y=2nd Iter.,ft)
0.0000161-1.06E-06 x^l-6.80E-09 x23.44E-12 x3
DIFFERENCE ?MARkX (ARC-MEN)
M 130
0.391.301.69
CAS STIR NK75
0.000.911.31
0.000.40
108
CCNDITIN:SEAS :ISG/SG:
1340020.429.0
420.0
ltmns/in^2ftftft
Corrinches0.00000.17950.30380.42390.53750.64320.74020.82720. 90180.95980.99761.01521.01440.99620.96180.91160.84500.75930.65210.52270.37460.21530.0000
FRIEM CRDERY=
0.00
I

FULL DOXD, SEASIRIE 6, XXZGf
FUIL LID6
E: 13400 ltcns/in^2Station Spacirng : 20.4 ftMkx Dist Fwd FP : 29.0 ftMx Dist Aft FP : 420.0 ft
ft-ltcvs0
-405.8-1421.1-3619.4-7445.3-13718.4-22965.7-34840.2-48369.7-60880.1-69594.3-73587.6-72808.7-67389.8-57921.8-46351.9-34680
-23538.1-13871.7-6441.9-1776.4-96.1
0
Iin^2ft
0104300106400108500110681112994102384136770130123133311154307165435162374152744135444110066894676908(574 j8'392002770016200
0
WE/I ist Int
-4.21E-06-1.73E-05-5.29E-05-0.000129-0.000273-0.000536-0.000901-0.001378-0.002008-0.002699-0.003381-0.004061-0.004738-0.0054
-0.006046-0.006661-0.007216-0.00766-0.007969-0.008143-0.008197-0.008201
^ ft^_1
0.000E1 00-2.904E-07-9.967E-07-2.489E-06-5.020E-06-9.060E-06-1.674E-05-1. 901E-05-2.774E-05-3.408E-05-3.366E-05-3.319E-05-3.346E-05-3.292E-05-3.191E-05-3.143E-05-2.893E-05-2.543E-05-1.810E-05-1.226E-05-4.786E-06-4.427E-07
0.000E+00
2nd Int 2nd Intft inches0 0.0000
-6.105E-05 -0.0007-0.0002808 -0.0034-0.0009972 -0.0120-0.0028576 -0.0343-0.0069642 -0.0836-0.0152199 -0.1826-0.0298793 -0.3586-0.0531219 -0.6375-0.0876604 -1.0519-0.1356781 -1.6281-0.1976987 -223724-0.2736096 -3.2833-0.3633626 -4.3604-0.4667685 -5.6012-0.5835101 -7.0021-0.7131211 -8.5575-0.0546665 -10.2560r-1.0063955 -12.0767-1.1658125 -13.9897-1.3301625 -15.9620-1.4968304 -17.9620-1.6640882 -19.9691
LEAST-E S PCX CURVE FIT-0.003548 xA0 dY/dX=9.72E-06 xl14.09E-06 xA2
-5.47E-08 xe35.45E-11 x4
(x=Ft Aft FP,ft; y=2nd Iter.,ft)
9.72E-068.18E-06 x"l
-1.64E-07 x22.18E-10 x3
ITEM X-ILCATICNET AFT FP
MK 13 GM5CASSTIR4 75 GUN
70120208240
SLOPE MINUTES ARC
-0.000147 -0.51-0.000996 -3.42-0.003429 -11.79-0.004469 -15.36
DIFFERENCE M =ERUX (ARC-MN)
130
2.9211.2814.86
CAS STIR MK75
0.008.37 0.00
11.94 3.57
109
NDMITICN:SEASrAG:HOG/SAG:
Sta
-1.420123456789
1011121314151617181920
20.59
Dist Aft FPft
-29.00.0
20.440.861.281.6
102.0122.4142.8163.2183.6204.0224.4244.8265.2285.6306.0326.4346.8367.2387.6408.0420.0
Corrinches0.00001.28902.19373.09243.97734.83535.64356.37497.00337.49617.82717.99027.98657.81687.48326.98966.34155.55024.63683.63112.56611.47340.0000
0.00

FULL LOAD, EASATE 6, SAGGING
FULL IAD6SAGGIN
E:Static spacing:Max Dist Fwd FP :Max Dist Aft FP :
in^2ft0
104300106400108500110681112994102384136770130123133311154307165435162374152744135444110066894676908457188392002770016200
0
I /E/I ist ItftA^-
0.000E+00-2.647E-07-4.600E-075.619E-081.826E-064.586E-068.659E-069.086E-061.168E-051.314E-051.285E-051.301E-051.355E-051.387E-051.430E-051. 481E-051.348E-051.122E-057.187E-064.163E-061.469E-06
-1.281E-070.OOEr+00
-3.8E-(-1.12E-{-1.53E-
3.85E-C0.0000690.0002040.0003850.0005970.00085C0.0011150.001370.00165C0.0019290.0022170.0025140.0028020.0030540.0032420.00335E0.0034150.0034290.003427
It 2rd Int 2nd Int- ft inches0 0 0.0000)6 -5.565E-05 -0.0007)5 -0.0002093 -0.0025)5 -0.0004804 -0.0058)6 -0.0005976 -0.0072)3 0.00014815 0.0018L4 0.00293913 0.035354 0.00895437 0.107572 0.0189764 0.2277)3 0.03374119 0.404954 0.05379166 0.645592 0.0792361 0.9508)1 0.11013495 1.3216)9 0.14665105 1.759872 0.18895116 2.267441 0.23721039 2.846527 0.2914413 3.497346 0.35118486 4.21423 0.41541282 4.9850B1 0.48273656 5.792855 0.55182697 6.621992 0.62164274 7.459779 0.69158464 8.2990
LEAST-SQU S PC L CURVE FIT0.0010591 x0 dY/dC=-2.90E-05 xA1
ITM X-ICATICNFT AFT FP
-1.62E-062.24E-08
-2.19E-11
x2x3x4
SICPE MINUIES ARC
(x=Ft Aft FP,ft; y2nd Iter.,ft)
-2.90E-05-3.24E-06 xAl6.71E-08 x2
-8.74E-11 x"3
DIFFERENCE EMRIX (ARC-M)M
CAS STIR MK75
0.00-3.49-5.00
0.00-1.50 0.00
CXDITICW:SFAST: .HOG/SAG:
1340020.429.0
420.0
ltons/in^2ftftft
Sta
-1.420123456789
1011121314151617181920
20.59
Dist Aft FPft
-29.00.0
20.440.861.281.6
102.0122.4142.8163.2183.6204.0224.4244.8265.2285.6306.0326.4346.8367.2387.6408.0420.0
ft-ltons0
-369.9-655.8
81.72708.66944.2
11879.616652.720366.523470.826562.428849.229487.328394.8
2594621847.216156.610386.35507.32186.6545.1-27.8
-1
Corrinches0.0000
-0.5367-0.9156-1.2959-1.6744-2.0425-2.3860-2.6909-2.9477-3.1476-3.2841-3.3558-3.3621-3.3009-3.1704-2.9683-2.6946-2.3548-1.9611-1.5303-1.0782-0.6175
0.0000
PFIRE CDERY=
K 13 GML
STIRNK 75 GUN
70120208240
0.00004330.00039790.00141440.001851
0.151.374.866.36
MK 130
-1.22-4.71-6.21
110
I

Bibliography
Combat System Alignment Manual (CSAM) for FFG7 Class,SW225-B6-CSA-010/0P2456 FFG7 CL, 2nd Revision, Naval Sea SystemsCommand, 15 August 1987.
"Combat Systems Engineering in Ship Design", Vol. 1, General Electric, GovernmentElectronic Systems Division, Moorestown, New Jersey, p. GA-17.
FFG8 Booklet of General Plans, NAVSHIPS Drawing No. FFG7-801-5350827.
FFG36-61 Booklet of General Plans, NAVSHIPS Drawing No. PF109-801-5416826.
FFG36-61 Longitudinal Strength and Inertia Sections Drawing, NAVSHIIPS Drawing No.PF109-802-5414870.
FFG61 Final Weight Estimate, July 1989, Gibbs & Cox, Inc.
General Specifications for Ships of the United States Navy,S9AA0O-AA-SPN-010/GEN-SPEC, Naval Sea Systems Command, 1989.
Higdon, Archie, Ohlsen, Edward H., Stiles, William B., Weese, John A.,Riley, William F., Mechanics of Materials, 3rd Edition, John Wiley & Sons, Inc.,New York, 1976.
Jane's Fighting Ships 1988-89, Jane's Publishing Company Limited, London, 1988.
Jane's Weapon Systems 1987-88, Jane's Publishing Company Limited, London, 1987.
Lacey, Peter, "Battery Alignment Hull Deflection Method", Department 86NA, Bath IronWorks, 24 July 1989.
Lewis, Edward V. (Editor), Principles of Naval Architecture, 2nd Revision, Vols. 1-3, TheSociety of Naval Architects and Marine Engineers, Jersey City, NJ, 1988.
"Longitudinal Strength Calculations", Design Data Sheet (DDS) 2900-1-q, Department ofthe Navy, 27 December 1950.
Naval Ship's Technical Manual, Chapter 096 "Weights and Stability",NAVSEA S9086-C6-STM-000, 15 February 1976.
Polmar, Norman, The Ships and Aircraft of the U.S. Fleet, 12th Edition, Naval InstitutePress, Annapolis, 1981.
Ship Hull Characteristics Program Users Manual, CASDAC #231072,NAVSEC 6133E/6105B, January 1976.
Technical Manual for Theory of Combat System Alignment,SW225-AO-MMA-010/OP762ALIGNTHEORY, 2nd Revision, Naval Sea SystemsCommand, 1 September 1987.
111

![VARIATIONS GOLDBERG [ARIA et 30 variations] · Title: VARIATIONS GOLDBERG [ARIA et 30 variations] Author: Bach, Johann Sebastian - Arranger: Montreuille, Pierre - Publisher: Montreuille,](https://static.fdocuments.net/doc/165x107/610885d0028fe95f64358299/variations-goldberg-aria-et-30-variations-title-variations-goldberg-aria-et.jpg)