The Effects of Ranging Noise on Multihop Localization: An Empirical Study from UC Berkeley Abon.
21
The Effects of Ranging Noise on Mul tihop Localization: An Empirical Study from UC Berkeley Abon
-
Upload
liliana-wheeler -
Category
Documents
-
view
213 -
download
0
Transcript of The Effects of Ranging Noise on Multihop Localization: An Empirical Study from UC Berkeley Abon.

The Effects of Ranging Noise on Multihop LocalizationAn Empirical Study from UC Berkeley
Abon
Outline
Motivation Approach Terms Deployment setup Simulation and experimental results Contribution
Motivation
Eliminate the discrepancy in simulation and real-world performance
Capture the ranging characteristic in real world
Discover the effect of each component in simulation model
Approach
Use the combination of existing simulation model to compare with the real-world performance
Determine the critical part in different localization deployment
Provide a new technique for simulation model
Term ~ Noisy Disk model
Two components Noise component indicates the distribution of
the error between the measured distance and the actual distance (eg Gaussian uniform)
Connectivity component indicates the maximum distance dmax between two nodes at which a distance estimate can be obtained
abon
Although noise disk model is useful for evaluating and developing multihop localization algorithms no study has verified that it accurately predicts the performance of real-world deployments
Parametric model
Gaussian noise is generated with the function N(dij σ)
Unit Disk connectivity is generated using the inequality dij le dmax
The typical data collection technique for ranging is to place a transmitter and receiver at several known distances and measure the response although this technique doesnrsquot account for several sources of noise such as node variability
Statistical sampling
We generate data for simulation by randomly
drawing measurements from an empirical data set
M(δ ε) to be the empirical distribution of all observed ranging estimates for distances in the interval [δ minus ε 1048594 δ + ε ]
A ranging estimate for simulation by using the error of a random sample from M(dij ε)
Statistical sampling
We generate a ranging estimate dij for simulation by using the error of a random
sample from M(dij ε)
dij=dij+( d minus da)
Deployment setup
The first is a 49 node network over a 13x13m asphalt area localized using ultrasound (Medusa node)
The others are 25 and 49 node networks over a 50x50m grassy area localized using RSS (Chipcon CC1000 FSK radio)
Deployment setup
Topology generated by APS
NSLAB
corners to be the anchor node
Simulation
Two techniques for simulation Parametric models Statistical sampling
NSLAB
connectivity noiseG gaussianS samplingNnone
Results
Results
The 49 node RSS deployment is well predicted by both the G and S simulations but not the N simulations This trend indicates that noise is the dominant cause of the localization error in this deployment
Results
49 node ultrasound deployment in Figure 3(c) is well predicted by the S simulations but not the D simulations This indicates that the ultrasound connectivity is different than the Unit Disk model and these deviations dominate noise as the source of error in this deployment
Results
The 25 node RSS deployment shows a similar trend the S simulations predict observed error better than the D simulations but no connectivitynoise combination correctly predicts all the error in this deployment This indicates that ranging characteristics besides noise and connectivity are causing localization error
What kind of model you need
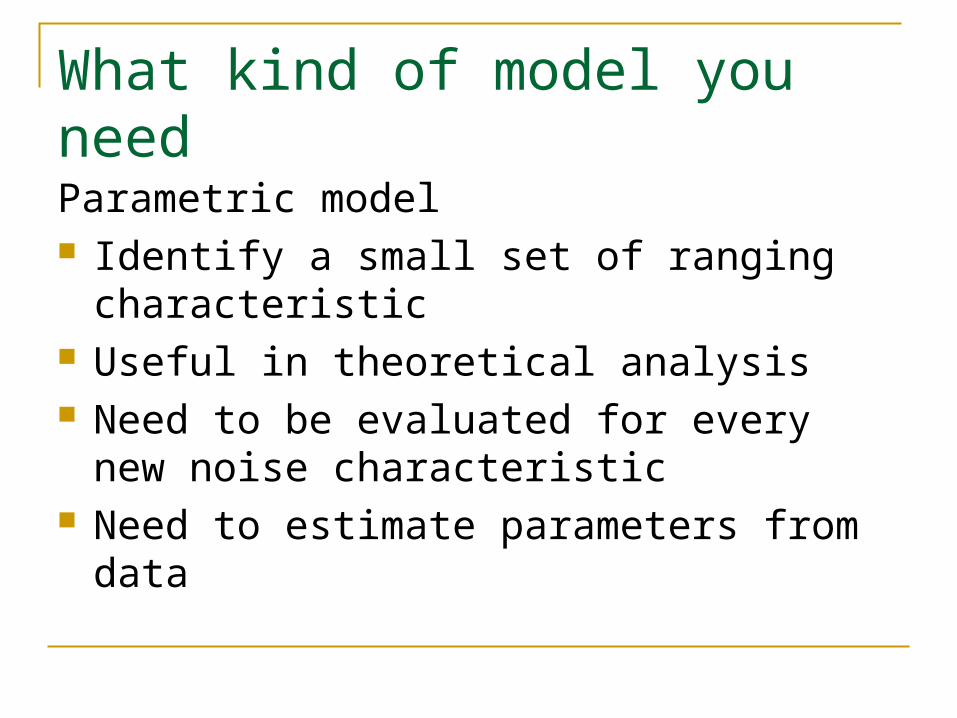
Parametric model Identify a small set of ranging characteristic Useful in theoretical analysis Need to be evaluated for every new noise
characteristic Need to estimate parameters from data
What kind of model you need
Statistical sampling New models do not need to be created for
new empirical distribution But it does not reveal insights about the data Need to identify which data subset is
important You can extend the parameters in the model
Conclusion
At low node density for ultra sonic ranging connectivity model dominates the error for RSS ranging connectivity and noise model deviation in radio all affect the error
At high node density noise disk model predicts deployment error fairly well
Contribution
This study suggests a top-down approach to evaluating models by comparing each modelrsquos predictions with empirical observatio
ns of localization deployments This is in contrast with the commonly used bottom-up approach f
or deriving models by analyzing raw empirical data A bottom-up approach is useful for identifying and characterizing the few most important features of empirical data and building them into a model
A top-down approach can evaluate whether the model is a sufficient representation of those features and whether that set of features is sufficient to represent the empirical data
Thank you
Outline
Motivation Approach Terms Deployment setup Simulation and experimental results Contribution
Motivation
Eliminate the discrepancy in simulation and real-world performance
Capture the ranging characteristic in real world
Discover the effect of each component in simulation model
Approach
Use the combination of existing simulation model to compare with the real-world performance
Determine the critical part in different localization deployment
Provide a new technique for simulation model
Term ~ Noisy Disk model
Two components Noise component indicates the distribution of
the error between the measured distance and the actual distance (eg Gaussian uniform)
Connectivity component indicates the maximum distance dmax between two nodes at which a distance estimate can be obtained
abon
Although noise disk model is useful for evaluating and developing multihop localization algorithms no study has verified that it accurately predicts the performance of real-world deployments
Parametric model
Gaussian noise is generated with the function N(dij σ)
Unit Disk connectivity is generated using the inequality dij le dmax
The typical data collection technique for ranging is to place a transmitter and receiver at several known distances and measure the response although this technique doesnrsquot account for several sources of noise such as node variability
Statistical sampling
We generate data for simulation by randomly
drawing measurements from an empirical data set
M(δ ε) to be the empirical distribution of all observed ranging estimates for distances in the interval [δ minus ε 1048594 δ + ε ]
A ranging estimate for simulation by using the error of a random sample from M(dij ε)
Statistical sampling
We generate a ranging estimate dij for simulation by using the error of a random
sample from M(dij ε)
dij=dij+( d minus da)
Deployment setup
The first is a 49 node network over a 13x13m asphalt area localized using ultrasound (Medusa node)
The others are 25 and 49 node networks over a 50x50m grassy area localized using RSS (Chipcon CC1000 FSK radio)
Deployment setup
Topology generated by APS
NSLAB
corners to be the anchor node
Simulation
Two techniques for simulation Parametric models Statistical sampling
NSLAB
connectivity noiseG gaussianS samplingNnone
Results
Results
The 49 node RSS deployment is well predicted by both the G and S simulations but not the N simulations This trend indicates that noise is the dominant cause of the localization error in this deployment
Results
49 node ultrasound deployment in Figure 3(c) is well predicted by the S simulations but not the D simulations This indicates that the ultrasound connectivity is different than the Unit Disk model and these deviations dominate noise as the source of error in this deployment
Results
The 25 node RSS deployment shows a similar trend the S simulations predict observed error better than the D simulations but no connectivitynoise combination correctly predicts all the error in this deployment This indicates that ranging characteristics besides noise and connectivity are causing localization error
What kind of model you need
Parametric model Identify a small set of ranging characteristic Useful in theoretical analysis Need to be evaluated for every new noise
characteristic Need to estimate parameters from data
What kind of model you need
Statistical sampling New models do not need to be created for
new empirical distribution But it does not reveal insights about the data Need to identify which data subset is
important You can extend the parameters in the model
Conclusion
At low node density for ultra sonic ranging connectivity model dominates the error for RSS ranging connectivity and noise model deviation in radio all affect the error
At high node density noise disk model predicts deployment error fairly well
Contribution
This study suggests a top-down approach to evaluating models by comparing each modelrsquos predictions with empirical observatio
ns of localization deployments This is in contrast with the commonly used bottom-up approach f
or deriving models by analyzing raw empirical data A bottom-up approach is useful for identifying and characterizing the few most important features of empirical data and building them into a model
A top-down approach can evaluate whether the model is a sufficient representation of those features and whether that set of features is sufficient to represent the empirical data
Thank you

Statistical sampling
We generate a ranging estimate dij for simulation by using the error of a random
sample from M(dij ε)
dij=dij+( d minus da)
Deployment setup
The first is a 49 node network over a 13x13m asphalt area localized using ultrasound (Medusa node)
The others are 25 and 49 node networks over a 50x50m grassy area localized using RSS (Chipcon CC1000 FSK radio)
Deployment setup
Topology generated by APS
NSLAB
corners to be the anchor node
Simulation
Two techniques for simulation Parametric models Statistical sampling
NSLAB
connectivity noiseG gaussianS samplingNnone
Results
Results
The 49 node RSS deployment is well predicted by both the G and S simulations but not the N simulations This trend indicates that noise is the dominant cause of the localization error in this deployment
Results
49 node ultrasound deployment in Figure 3(c) is well predicted by the S simulations but not the D simulations This indicates that the ultrasound connectivity is different than the Unit Disk model and these deviations dominate noise as the source of error in this deployment
Results
The 25 node RSS deployment shows a similar trend the S simulations predict observed error better than the D simulations but no connectivitynoise combination correctly predicts all the error in this deployment This indicates that ranging characteristics besides noise and connectivity are causing localization error
What kind of model you need
Parametric model Identify a small set of ranging characteristic Useful in theoretical analysis Need to be evaluated for every new noise
characteristic Need to estimate parameters from data
What kind of model you need
Statistical sampling New models do not need to be created for
new empirical distribution But it does not reveal insights about the data Need to identify which data subset is
important You can extend the parameters in the model
Conclusion
At low node density for ultra sonic ranging connectivity model dominates the error for RSS ranging connectivity and noise model deviation in radio all affect the error
At high node density noise disk model predicts deployment error fairly well
Contribution
This study suggests a top-down approach to evaluating models by comparing each modelrsquos predictions with empirical observatio
ns of localization deployments This is in contrast with the commonly used bottom-up approach f
or deriving models by analyzing raw empirical data A bottom-up approach is useful for identifying and characterizing the few most important features of empirical data and building them into a model
A top-down approach can evaluate whether the model is a sufficient representation of those features and whether that set of features is sufficient to represent the empirical data
Thank you

Deployment setup
Topology generated by APS
NSLAB
corners to be the anchor node
Simulation
Two techniques for simulation Parametric models Statistical sampling
NSLAB
connectivity noiseG gaussianS samplingNnone
Results
Results
The 49 node RSS deployment is well predicted by both the G and S simulations but not the N simulations This trend indicates that noise is the dominant cause of the localization error in this deployment
Results
49 node ultrasound deployment in Figure 3(c) is well predicted by the S simulations but not the D simulations This indicates that the ultrasound connectivity is different than the Unit Disk model and these deviations dominate noise as the source of error in this deployment
Results
The 25 node RSS deployment shows a similar trend the S simulations predict observed error better than the D simulations but no connectivitynoise combination correctly predicts all the error in this deployment This indicates that ranging characteristics besides noise and connectivity are causing localization error
What kind of model you need
Parametric model Identify a small set of ranging characteristic Useful in theoretical analysis Need to be evaluated for every new noise
characteristic Need to estimate parameters from data
What kind of model you need
Statistical sampling New models do not need to be created for
new empirical distribution But it does not reveal insights about the data Need to identify which data subset is
important You can extend the parameters in the model
Conclusion
At low node density for ultra sonic ranging connectivity model dominates the error for RSS ranging connectivity and noise model deviation in radio all affect the error
At high node density noise disk model predicts deployment error fairly well
Contribution
This study suggests a top-down approach to evaluating models by comparing each modelrsquos predictions with empirical observatio
ns of localization deployments This is in contrast with the commonly used bottom-up approach f
or deriving models by analyzing raw empirical data A bottom-up approach is useful for identifying and characterizing the few most important features of empirical data and building them into a model
A top-down approach can evaluate whether the model is a sufficient representation of those features and whether that set of features is sufficient to represent the empirical data
Thank you

Results
Results
The 49 node RSS deployment is well predicted by both the G and S simulations but not the N simulations This trend indicates that noise is the dominant cause of the localization error in this deployment
Results
49 node ultrasound deployment in Figure 3(c) is well predicted by the S simulations but not the D simulations This indicates that the ultrasound connectivity is different than the Unit Disk model and these deviations dominate noise as the source of error in this deployment
Results
The 25 node RSS deployment shows a similar trend the S simulations predict observed error better than the D simulations but no connectivitynoise combination correctly predicts all the error in this deployment This indicates that ranging characteristics besides noise and connectivity are causing localization error
What kind of model you need
Parametric model Identify a small set of ranging characteristic Useful in theoretical analysis Need to be evaluated for every new noise
characteristic Need to estimate parameters from data
What kind of model you need
Statistical sampling New models do not need to be created for
new empirical distribution But it does not reveal insights about the data Need to identify which data subset is
important You can extend the parameters in the model
Conclusion
At low node density for ultra sonic ranging connectivity model dominates the error for RSS ranging connectivity and noise model deviation in radio all affect the error
At high node density noise disk model predicts deployment error fairly well
Contribution
This study suggests a top-down approach to evaluating models by comparing each modelrsquos predictions with empirical observatio
ns of localization deployments This is in contrast with the commonly used bottom-up approach f
or deriving models by analyzing raw empirical data A bottom-up approach is useful for identifying and characterizing the few most important features of empirical data and building them into a model
A top-down approach can evaluate whether the model is a sufficient representation of those features and whether that set of features is sufficient to represent the empirical data
Thank you

Results
The 25 node RSS deployment shows a similar trend the S simulations predict observed error better than the D simulations but no connectivitynoise combination correctly predicts all the error in this deployment This indicates that ranging characteristics besides noise and connectivity are causing localization error
What kind of model you need
Parametric model Identify a small set of ranging characteristic Useful in theoretical analysis Need to be evaluated for every new noise
characteristic Need to estimate parameters from data
What kind of model you need
Statistical sampling New models do not need to be created for
new empirical distribution But it does not reveal insights about the data Need to identify which data subset is
important You can extend the parameters in the model
Conclusion
At low node density for ultra sonic ranging connectivity model dominates the error for RSS ranging connectivity and noise model deviation in radio all affect the error
At high node density noise disk model predicts deployment error fairly well
Contribution
This study suggests a top-down approach to evaluating models by comparing each modelrsquos predictions with empirical observatio
ns of localization deployments This is in contrast with the commonly used bottom-up approach f
or deriving models by analyzing raw empirical data A bottom-up approach is useful for identifying and characterizing the few most important features of empirical data and building them into a model
A top-down approach can evaluate whether the model is a sufficient representation of those features and whether that set of features is sufficient to represent the empirical data
Thank you
What kind of model you need
Parametric model Identify a small set of ranging characteristic Useful in theoretical analysis Need to be evaluated for every new noise
characteristic Need to estimate parameters from data
What kind of model you need
Statistical sampling New models do not need to be created for
new empirical distribution But it does not reveal insights about the data Need to identify which data subset is
important You can extend the parameters in the model
Conclusion
At low node density for ultra sonic ranging connectivity model dominates the error for RSS ranging connectivity and noise model deviation in radio all affect the error
At high node density noise disk model predicts deployment error fairly well
Contribution
This study suggests a top-down approach to evaluating models by comparing each modelrsquos predictions with empirical observatio
ns of localization deployments This is in contrast with the commonly used bottom-up approach f
or deriving models by analyzing raw empirical data A bottom-up approach is useful for identifying and characterizing the few most important features of empirical data and building them into a model
A top-down approach can evaluate whether the model is a sufficient representation of those features and whether that set of features is sufficient to represent the empirical data
Thank you

Thank you