The Effects of Plug-in Electric Vehicles on a Sample Grid Team Members: Jeff Eggebraaten Brendin...
25
The Effects of Plug-in Electric Vehicles on a Sample Grid Team Members: Jeff Eggebraaten Brendin Johnson Anne Mousseau Justin Schlee 1
-
date post
19-Dec-2015 -
Category
Documents
-
view
214 -
download
0
Transcript of The Effects of Plug-in Electric Vehicles on a Sample Grid Team Members: Jeff Eggebraaten Brendin...

The Effects of Plug-in Electric Vehicles on a
Sample Grid
Team Members:Jeff EggebraatenBrendin JohnsonAnne Mousseau
Justin Schlee
1

Overview
1) Defining the problem
2) Market Research
3) Load Analysis
4) Time of Day
5) Future Work
2

Problem StatementThe demand for plug-in electric vehicles is
increasing rapidly, which will
pose new challenges for power
utilities in terms of
understanding how this
additional load will effect their distribution
grids.
Idaho Power asked EVI to perform this
analysis.3

Car Types•Plug-in Electric Vehicles• Run only on electricity • Do not have another fuel source
•Plug-in Hybrid Electric Vehicles (PHEV)• Run on electricity and fuel• Gas engine can drive the wheels or act as a generator
4

5
Market ResearchWhy is market research needed?
- To predict the future number of PHEV’s on the road.

Source: EPRI
Share
of
New
Vehic
le S
ale
s
Year
Projected Plug-in Electric Vehicle Market Share
6

7
Market ResearchGathered Information
National Numbers National Yearly Sales (Autodata) Projected PHEV new car sales (E.P.R.I.) Number of cars on the road per year (D.O.T.)
Regional Numbers Number of cars registered in Idaho (Idaho D.M.V) Number of cars registered in Ada county (Idaho D.M.V)
ResultsProjected number of PHEV’s in Idaho (2010–2040)Projected number of PHEV’s in Ada county (2010–
2040)

2005 2010 2015 2020 2025 2030 2035 20400
50000
100000
150000
200000
250000
388.418549728019
6825.91971828836
35585.9529971167
83252.7266516132
130365.094258967
176243.814324969
222438.780192429
Year
Pro
ject
ed
Nu
mb
er
of
PH
EV
’s in
Bo
ise
Projected Number of PHEV’s in Boise
8

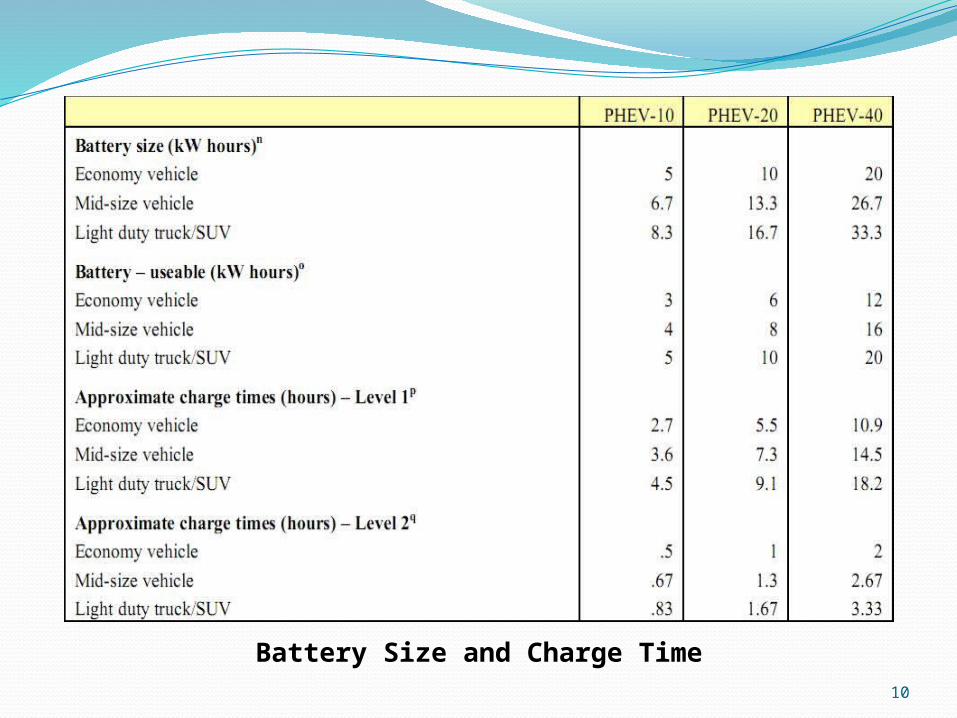
Conductive Charger LevelsLevel 1ConveniencePlug into common wall outlet
1-Phase120 V AC, 15 A* AC1.44 kW (max)
Level 2Private/PublicRequires EV Supply equipment installation
1 Phase208-240 V AC, 30-60A AC14.4 kW (max)
Level 3Opportunity Requires commercial equipment installation
3 Phase208-600 V AC, 400 A AC240 kW (max)**
* Receptacle rating (maximum continuous current of 12 A).** Maximum allowed by standards
Source: C.C Chan, K.T. Chau
9
10
Battery Size and Charge Time

Line Voltages before PHEV loadingYear 2010
11
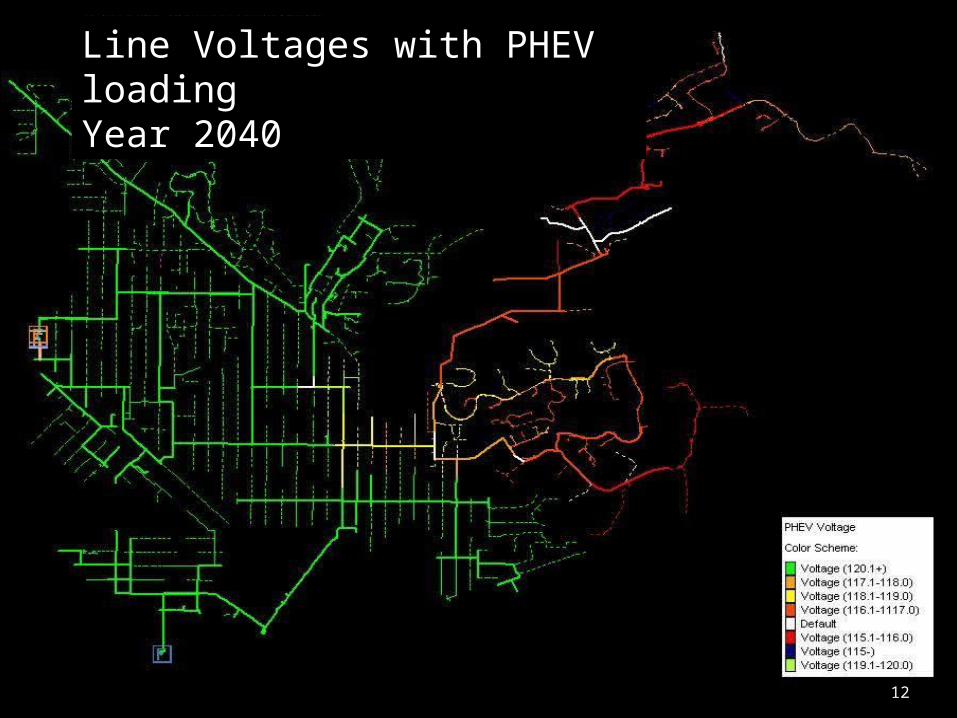
Line Voltages with PHEV loadingYear 2040
12

2010 2015 2020 2025 2030 2035 20400
10
20
30
40
50
60
70
80
90
Low Voltage
Fuse
Switch
% Loading
After Mitigation
Number of Distribution Grid Issueswith PHEV loading Year 2010 -2040
13

PHEV Loading Mitigation• Added Voltage Regulators
• Re-conductored Overloaded Lines
• Added Capacitors
• Approximated Cost of $132,000
14

Line Voltages with PHEV loading and Mitigation Year 2040
Capacitor Added
Re conductor
2 Voltage Regulators
15

Time of Day Charging• Customer comes home and plugs in the car (~5 pm)
• Normal utility peak (~5 pm)
• To reduce this load, shift the charge time (~10 pm)
16

Time of Day Analysis
1 2 3 4 5 6 7 8 9 10 11 12 13 14 15 16 17 18 19 20 21 22 23 242000
3000
4000
5000
6000
7000
8000
PHEV Charging at 5PM and at 10PM
10PM PHEV Loading, 2040 Baseline 2010 Load 5PM PHEV Loading, 2040
To
tal P
ow
er
Usag
e (
MV
A)
7.73%
17

18
Variable Power RatesPros of PSE’s Variable Rate Plan:
About 5% of total power usage was shifted to off-
peak hours
Overall electricity usage was reduced by 6%
An overall positive reaction from the customers for
the incentive to use energy more
efficiently
Source: Puget Sound Energy

19
Variable Power RatesCons of PSE’s Variable Rate Plan:
To break even customers would have needed to use
more than half their electricity during the lowest
rate hours.
This was an inconvenience for some families who
felt that the time-of-day plan was incompatible with
their lifestyle.
Source: Puget Sound Energy

20
Power Sellback – V2GElectric vehicles can be used to provide
power during peak usage timesBenefitsPeak ShavingLoad Regulation
ChallengesHarmonicsProtection TrippingSafety

Future WorkPower Quality
Effects of Higher Charging Levels
Transmission, Generation, and Protection
21

22
Conclusions• By 2040 PHEV’s charging will increase load by 18%
• Additional load results in voltage drop
•Equipment will need to be upgraded to accommodate load
•Shifting charge time results in a 7.73% peak load reduction
• Time of day plan can incentivize a shift in charging time

Thanks:Idaho Power
Marc Patterson, Mel Trammel, Mary Graesch
University of IdahoDr. Herbert Hess, Dr. Greg Donohoe, Dr. Joseph Law,
John Jacksha
23
24
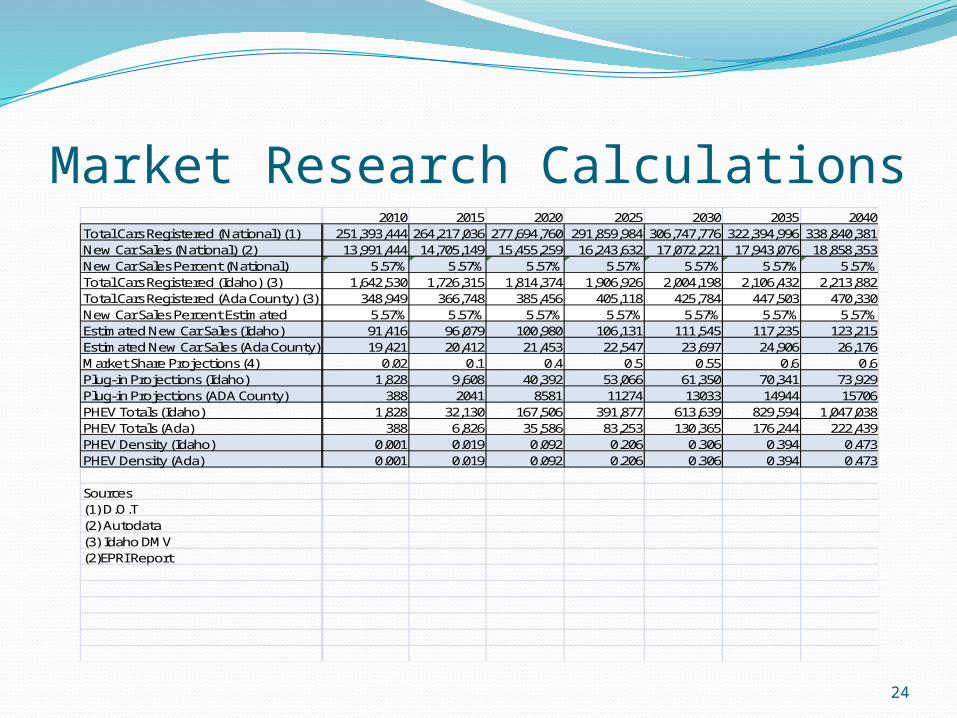
2010 2015 2020 2025 2030 2035 2040Total Cars Registered (National) (1) 251,393,444 264,217,036 277,694,760 291,859,984 306,747,776 322,394,996 338,840,381New Car Sales (National) (2) 13,991,444 14,705,149 15,455,259 16,243,632 17,072,221 17,943,076 18,858,353New Car Sales Percent (National) 5.57% 5.57% 5.57% 5.57% 5.57% 5.57% 5.57%Total Cars Registered (Idaho) (3) 1,642,530 1,726,315 1,814,374 1,906,926 2,004,198 2,106,432 2,213,882Total Cars Registered (Ada County) (3) 348,949 366,748 385,456 405,118 425,784 447,503 470,330New Car Sales Percent Estimated 5.57% 5.57% 5.57% 5.57% 5.57% 5.57% 5.57%Estimated New Car Sales (Idaho) 91,416 96,079 100,980 106,131 111,545 117,235 123,215Estimated New Car Sales (Ada County) 19,421 20,412 21,453 22,547 23,697 24,906 26,176Market Share Projections (4) 0.02 0.1 0.4 0.5 0.55 0.6 0.6Plug-in Projections (Idaho) 1,828 9,608 40,392 53,066 61,350 70,341 73,929Plug-in Projections (ADA County) 388 2041 8581 11274 13033 14944 15706PHEV Totals (Idaho) 1,828 32,130 167,506 391,877 613,639 829,594 1,047,038PHEV Totals (Ada) 388 6,826 35,586 83,253 130,365 176,244 222,439PHEV Density (Idaho) 0.001 0.019 0.092 0.206 0.306 0.394 0.473PHEV Density (Ada) 0.001 0.019 0.092 0.206 0.306 0.394 0.473
Sources(1) D.O.T(2) Autodata(3) Idaho DMV(2)EPRI Report
Market Research Calculations

25
Additional Load Due to PHEVs
2005 2010 2015 2020 2025 2030 2035 20400
1,000
2,000
3,000
4,000
5,000
6,000
7,000
14228
1,130
2,515
3,748
4,821
5,789
Year
Pro
jecte
d L
oad
fro
m P
HEV
's
in S
am
ple
Gri
d [
kW
]