The Effects of MFA Quota Removal on Apparel...
215
Report No. 39994 - AFR VERTICAL AND REGIONAL INTEGRATION TO PROMOTE AFRICAN TEXTILES AND CLOTHING EXPORTS A CLOSE KNIT FAMILY? July 2007 Poverty Reduction and Economic Management 1 Southern Africa Africa region ___________________________________________________ _________
Transcript of The Effects of MFA Quota Removal on Apparel...

Report No. 39994 - AFR
VERTICAL AND REGIONAL INTEGRATIONTO PROMOTE AFRICAN TEXTILES AND CLOTHING EXPORTSA CLOSE KNIT FAMILY?
July 2007
Poverty Reduction and Economic Management 1Southern AfricaAfrica region
____________________________________________________________
Document of the World Bank________________________

ACRONYMS AND ABBREVIATIONS
ACP African Caribbean and Pacific AGOA African Growth and Opportunity ActATC WTO Agreement on Textiles and ClothingCMT Cut, make and trimCOMESA Common Market for Eastern and Southern AfricaEBA Everything but ArmsEPZ Export Processing ZoneFTAs Free trade agreementsGATT General Agreement on Tariffs and TradeGSP Generalized System of PreferencesLDCs Least Developed CountriesMFA Multifiber ArrangementMMTZ Malawi, Mozambique, Tanzania and ZambiaMUB Manufacture-under-bondROOs Rules of originSACU Southern African Customs UnionSADC Southern African Development CommunityT&C Textiles and clothingTCF Third-country fabricTMB Textiles Monitoring BodyWTO World Trade Organization
Vice President Obiageli K. EzekwesiliSector Manager Emmanuel AkpaTask Team Leaders Ian John Douglas Gillson, Caglar Ozden
2
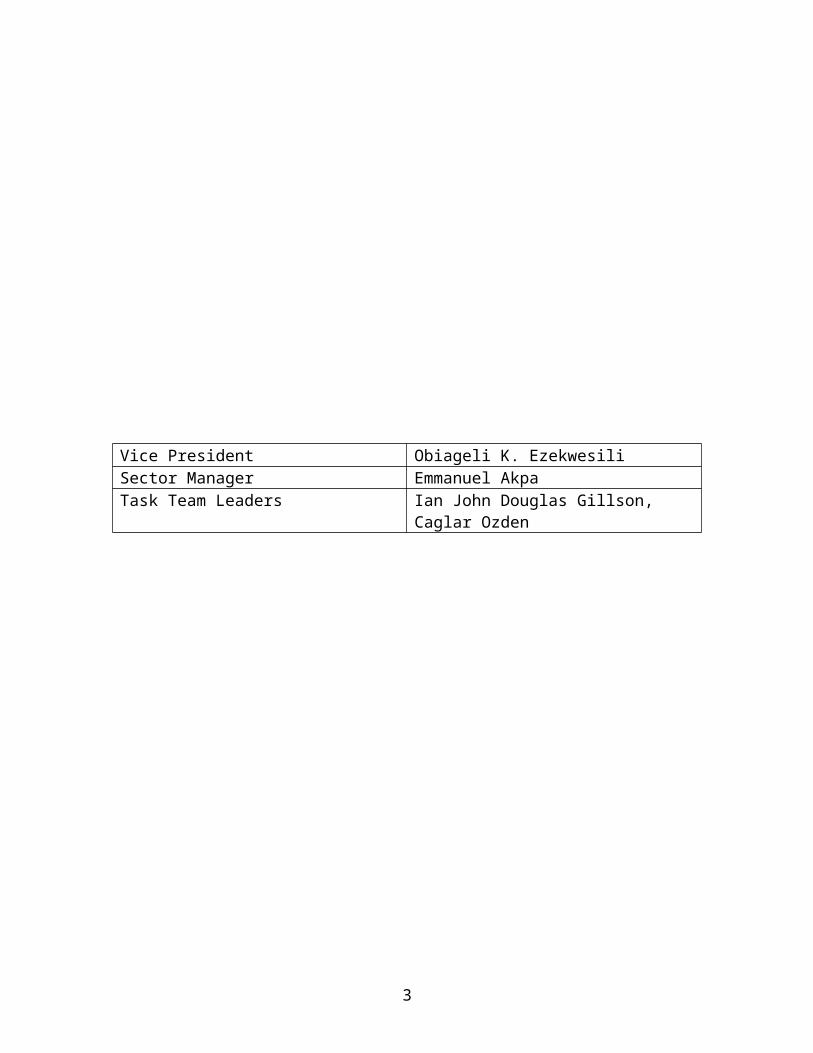
TABLE OF CONTENTS
AcknowledgementsExecutive Summary
1. INTRODUCTION........................................................................................................................................1
2. PROTECTION AND PREFERENCES IN THE GLOBAL MARKET FOR TEXTILES AND CLOTHING......................................................................................................................................................3
2.1 THE AGREEMENT ON TEXTILES AND CLOTHING: QUOTAS HAVE GONE BUT HIGH TARIFFS REMAIN.....32.2 EU GSP AND EVERYTHING BUT ARMS..................................................................................................42.3 THE EU ACP/COTONOU AGREEMENT...................................................................................................52.4 US GSP AND THE AFRICAN GROWTH AND OPPORTUNITY ACT............................................................5
3. TRADE PATTERNS IN TEXTILES AND CLOTHING............................................................................7
3.1 CHINA DOMINATES IN WORLD EXPORTS OF TEXTILES AND CLOTHING..................................................73.2 TEXTILES AND CLOTHING EXPORTS ARE IMPORTANT TO SOME AGOA COUNTRIES..............................93.3 DEVELOPED COUNTRIES ARE THE MAIN MARKETS FOR IMPORTS OF TEXTILES AND CLOTHING............9
3.3.1 The US market for textiles and clothing is growing strongly but the sources of imports are changing................................................................................................................................................103.3.2 The EU market for textiles and clothing is fragmented and rules of origin are a constraint......11
4. APPAREL EXPORTS FROM AFRICA UNDER AGOA – PAST, PRESENT AND THE FUTURE....13
5. VERTICAL AND REGIONAL INTEGRATION IN AFRICAN TEXTILES AND CLOTHING TRADE........................................................................................................................................................................20
5.1 THE RATIONALE FOR VERTICAL AND REGIONAL INTEGRATION...........................................................205.2 INTRA-AGOA TRADE IN COTTON, YARN, FABRIC AND CLOTHING......................................................21
5.2.1 Cotton...........................................................................................................................................215.2.2 Yarn.............................................................................................................................................225.2.3 Fabric..........................................................................................................................................235.2.4 Clothing.......................................................................................................................................24
5.3 CONSTRAINTS TO VERTICAL AND REGIONAL INTEGRATION.................................................................255.3.1 Competitiveness and production capacity..................................................................................255.3.2 Quality and service delivery.......................................................................................................275.3.3 Lead times....................................................................................................................................285.3.4 Costs of production......................................................................................................................295.3.5 Rules of origin..............................................................................................................................335.3.6 Other policy constraints..............................................................................................................36
6. THE TEXTILES AND CLOTHING SECTOR IN SELECTED AFRICAN COUNTRIES.....................38
6.1 SOUTH AFRICA.....................................................................................................................................396.2 MAURITIUS...........................................................................................................................................436.3 MADAGASCAR......................................................................................................................................476.4 LESOTHO..............................................................................................................................................506.5 KENYA..................................................................................................................................................546.6 ZAMBIA................................................................................................................................................58
7. CONCLUSION..........................................................................................................................................61
REFERENCES...............................................................................................................................................63
LIST OF EXPERTS CONSULTED..............................................................................69
3

TABLES
TABLE 1: AFRICAN GROWTH AND OPPORTUNITY ACT ELIGIBLE COUNTRIES..........................6
TABLE 2: POTENTIAL REGIONAL SUPPLY CHAIN FOR T&C FOR AFRICAN COUNTRIES........25
TABLE 3: WAGE COSTS IN THE T&C SECTOR AMONG SELECTED AFRICAN COUNTRIES......30
TABLE 4: ELECTRICITY COSTS AMONG SELECTED COUNTRIES..................................................31
TABLE 5: FREIGHT COSTS AMONG SELECTED COUNTRIES...........................................................32
TABLE 6: WATER AND TELECOMMUNICATIONS COSTS AMONG SELECTED COUNTRIES....33
TABLE 7: NUMBER OF WORKERS AND FIRMS BY PRODUCT IN LESOTHO: 2004-2005..............52
TABLE 8: THE IMPACT OF AGOA ON CLOTHING EXPORTS FROM KENYA’S EPZ......................57
Table 9: Phase-out of quotas under the ATC.................................................................................................74
FIGURES
FIGURE 1: APPAREL EXPORTS TO THE US ($ MILLIONS).................................................................13
FIGURE 2: RELATIVE PRICES OF APPAREL EXPORTS (WEIGHTED BY EXPORT VALUE)........15
FIGURE 3: RELATIVE PRICES OF EXPORTS (WEIGHTED BY US IMPORT VALUE).....................16
FIGURE 4: MARKET SHARES OF APPAREL EXPORTERS TO THE US.............................................16
FIGURE 5: AVERAGE RELATIVE PRICES..............................................................................................17
FIGURE 6: MARKET SHARES...................................................................................................................18
FIGURE 7: MARKET SHARE OF THE CHINA REGION IN EXPORT CATEGORIES.........................18
FIGURE 8: MARKET SHARE OF QUOTA COUNTRIES IN EXPORT CATEGORIES.........................19
FIGURE 9: MAIN INTRA- AND EXTRA-REGIONAL FLOWS OF AGOA TRADE IN COTTON........21
FIGURE 10: MAIN INTRA- AND EXTRA-REGIONAL FLOWS OF AGOA TRADE IN YARN..........22
FIGURE 11: MAIN INTRA- AND EXTRA-REGIONAL FLOWS OF AGOA TRADE IN FABRIC.......23
Figure 12: Main intra- and extra-regional flows of AGOA trade in clothing................................................24
ANNEXES
ANNEX 1: THE WTO AGREEMENT ON TEXTILES AND CLOTHING................................................73
ANNEX 2: MFN TARIFFS ON INTERNATIONAL TRADE IN TEXTILES............................................75
ANNEX 3: MFN TARIFFS ON INTERNATIONAL TRADE IN CLOTHING..........................................76
ANNEX 4: THE EU’S GSP...........................................................................................................................77
ANNEX 5: EU TARIFFS ON TEXTILES AND CLOTHING PRODUCTS 2005......................................79
ANNEX 6: LIST OF LEAST DEVELOPED COUNTRIES.........................................................................80
ANNEX 7: EU TRADE ARRANGEMENTS WITH THE ACP COUNTRIES...........................................81
ANNEX 8: US TARIFFS ON TEXTILES AND CLOTHING PRODUCTS 2005......................................83
ANNEX 9: THE AFRICAN GROWTH AND OPPORTUNITY ACT.........................................................84
ANNEX 10: TRADE DATA AVAILABILITY............................................................................................85
ANNEX 11: MAJOR EXPORTERS OF TEXTILES 1994-2005 (EXCLUDING INTRA-EU TRADE)....87
4

ANNEX 12: AGOA EXPORTS OF TEXTILES 1994-2005.........................................................................88
ANNEX 13: WORLD EXPORTS OF CLOTHING 1994-2005 (EXCLUDING INTRA-EU TRADE)......89
ANNEX 14: AGOA EXPORTS OF CLOTHING 1994-2005.......................................................................90
ANNEX 15: THE IMPORTANCE OF AGOA EXPORTS OF T&C, 2004.................................................91
ANNEX 16: WORLD IMPORTS OF TEXTILES 1994-2005 (EXCLUDING INTRA-EU TRADE).........92
ANNEX 17: AGOA IMPORTS OF TEXTILES 1994-2005.........................................................................93
ANNEX 18: WORLD IMPORTS OF CLOTHING 1994-2005 (EXCLUDING INTRA-EU TRADE).......94
ANNEX 19: AGOA IMPORTS OF CLOTHING 1994-2005.......................................................................95
ANNEX 20: US IMPORTS OF TEXTILES 1994-2005...............................................................................96
ANNEX 21: AGOA EXPORTS OF TEXTILES TO US 1994-2005............................................................97
ANNEX 22: US IMPORTS OF CLOTHING 1994-2005..............................................................................98
ANNEX 23: AGOA EXPORTS OF CLOTHING TO US 1994-2005..........................................................99
ANNEX 24: EU IMPORTS OF TEXTILES 1994-2005 (EXCLUDING INTRA-EU TRADE)................100
ANNEX 25: AGOA EXPORTS OF TEXTILES TO EU 1994-2005..........................................................101
ANNEX 26: EU IMPORTS OF CLOTHING 1994-2005 (EXCLUDING INTRA-EU TRADE)..............102
ANNEX 27: AGOA EXPORTS OF CLOTHING TO EU 1994-2005........................................................103
ANNEX 28: SEED COTTON PRODUCTION IN AGOA COUNTRIES 1994-2005...............................104
ANNEX 29: AGOA COTTON LINT PRODUCTION AND EXPORTS 2003..........................................105
ANNEX 30: INTRA AGOA COTTON TRADE 2003 (US$ 1000S)..........................................................106
ANNEX 31: THE IMPORTANCE OF AGOA REGIONAL TRADE IN COTTON, YARN, FABRIC AND CLOTHING (2003)......................................................................................................................................108
ANNEX 32: INTRA AGOA YARN TRADE 2003 (US$ 1000S)...............................................................109
ANNEX 33: INTRA AGOA FABRIC TRADE 2003 (US$ 1000S)...........................................................111
ANNEX 34: INTRA AGOA CLOTHING TRADE 2003 (US$ 1000S).....................................................113
ANNEX 35: COSTS OF DOING BUSINESS.............................................................................................115
ANNEX 36: SEED COTTON YIELDS IN SOUTHERN AND EASTERN AFRICA 1994-2005............116
ANNEX 37: COTTON LINT EXPORTS FROM SOUTHERN AND EASTERN AFRICA 1994-2004...117
ANNEX 38: COTTON LINT IMPORTS FOR SOUTHERN AND EASTERN AFRICA 1994-2004.......118
5

ACKNOWLEDGMENTS
This report presents the results of research undertaken by the World Bank and close dialogue with the private sector and researchers in six African countries: Kenya, Lesotho, Madagascar, Mauritius, South Africa and Zambia.
The report was prepared by a team consisting of Ian Gillson (Task Team Leader, AFTP1), Caglar Ozden (Task Team Leader, DECRG) and Fahrettin Yagci (AFTP1). The team received strong support from Robert Keyfitz (AFTP1), Marie Sheppard (AFTPS), Mombert Hoppe (PRMTR), Lolette Kritzinger-van Niekerk (AFCRI), Shirley Faragher (AFCS1), Beatrice Abade (AFCE2) and Paula Lamptey (AFCS1). Matilde Bordon (AFTPS) provided outstanding advice for the Kenya component of the work. The peer reviewers were Sonia Plaza (AFCRI) and Paul Brenton (PRMTR).
The report was prepared under the supervision of Emmanuel Akpa, Sector Manager for AFTP1. He offered conceptual guidance, provided critical analytical advice and ensured quality control and management support. Assistance with editing, dissemination and budget management was provided by Rose Kumsinda (AFTP1).
On the private sector side the team would like to thank all of the textile and clothing firms we visited on field interviews in Kenya, Mauritius, South Africa and Zambia as well as business associations and local experts who provided important insights for this study. An exhaustive list of those consulted is included at the end of the report. The field interviews were facilitated by Joop de Voest who kindly provided details of firms in the region to approach.
6

EXECUTIVE SUMMARYIntroduction
1. Export diversification into higher value-added products and away from primary commodities with their associated price risks (volatility and long-term decline) remains a major trade policy objective for many African countries. Textiles and clothing (T&C) are sectors that provided an opportunity for a few African countries for export diversification. Clothing production is labor intensive, involving relatively low start-up costs and easily transferable technology. Labor requirements can be met with low and semi-skilled workers, especially women. Consequently, countries with competitive labor costs, especially in South and East Asia, have been able to capture significant shares of the world market. Despite the potential benefits and their various sources of comparative advantage, few African countries, until recently, have managed to establish a meaningful presence in the world clothing market. Consequently, despite being a net exporter of cotton Africa remains a net importer of textiles and clothing.
2. Nevertheless, clothing exports from sub-Saharan Africa have expanded rapidly during the past decade mainly due to the unilateral market access preferences granted by the US and the EU. Since most other developing countries faced restrictive access to the European and US markets, due to quotas and high tariffs, the quota-free and duty-free access granted to African exporters of clothing led to rapid export growth. A main feature of these preferences, especially the Africa Growth and Opportunity Act (AGOA) of the US, has been the permission to use imports of third-country yarns and fabrics in the production of exports while maintaining eligibility for preferences. This allows cheap fabrics, often sourced from Asia, to be processed in Africa and exported to the US. Over 85% of the clothing exports currently eligible for AGOA preferences in the US market are made from third-country fabric. As a result, apparel exports from eligible AGOA countries to the US have increased threefold.
3. For the AGOA countries, the share of T&C exports in their total exports is rather low, at 0.5% and 2.8%, respectively. This is mainly due to the large share of raw materials, minerals and oil in the exports from the region. But for some individual countries, T&C form an important share of manufactured exports. These are Lesotho (accounting for 97% of total exports), followed by Mauritius (51%), Madagascar (41%), Cape Verde (39%), Swaziland (25%) and Kenya (12%).
4. The future of clothing production for export in sub-Saharan Africa is rather uncertain as it faces two major challenges:
increased competition from large and competitive producers such as China, Bangladesh, India, and Pakistan following the phase-out of the quotas after the expiration of the WTO Agreement on Textiles and Clothing (ATC); and,
expiration of the third-country fabric derogation under AGOA scheduled to occur in 2013.

5. After the expiration of the ATC in 2005, AGOA countries have seen their recent growth of exports turn into a decline. Many factories have closed, resulting in the loss of tens of thousands of jobs in Kenya, Lesotho, Madagascar, Mauritius, Namibia, South Africa and Swaziland. Producers in sub-Saharan Africa can no longer depend on displaced production from quota-bound countries to boost their exports. Instead, they need to be more cost competitive, deliver their products to market on-time, and, be prepared to meet higher quality and service requirements. The expiration of the third-country fabric derogation under AGOA will generate a further significant decline for the African clothing industry unless the region is able to supply all of the various yarns and fabrics that US buyers demand.
6. This study explores the options the region has to overcome these two challenges. In particular, it assesses the potential for and identifies challenges to the regional and vertical integration in the sector. Timing is crucial since both the EU and the US have recently imposed limited trade restrictions on China (until 2008) to protect certain domestic T&C industries. These safeguards might provide a brief opportunity for sub-Saharan African producers to integrate their T&C sector both domestically and regionally.
7. In terms of policy recommendations, in addition to sector-specific policies, the report suggests that African countries should implement economy-wide reforms for long-term competitiveness that would benefit all sectors. These would include i) addressing infrastructure and regulatory weaknesses that limit access to and raise the cost of backbone services: electricity, water, transport, telecommunications, ports and finance; ii) reviewing trade, tax and labor market policies that limit the incentives to invest in productive activities including external tariffs and rules of origin in regional trade agreements that limit access to the most appropriate and lowest cost inputs; and, iii) developing pro-active export and investment promotion policies to overcome informational barriers that limit access to foreign markets and investors.
8. For developed countries, the EU should implement non-restrictive rules of origin that support exports of clothing from Africa under the available preference schemes by allowing efficient sourcing of inputs. The US should broaden its coverage of textiles under AGOA (for all beneficiaries not just those classified as lesser developed) to encourage investment in African spinning and weaving. And all industrialized countries should provide aid for trade to support countries that implement well-defined competitiveness reform programs that address the key infrastructure and policy constraints that limit exports and investment in goods and services.
ii

Protection and preferences in the global market for textiles and clothing
With the removal of the ATC, quotas are gone but high tariffs remain
9. On January 1 2005, the ATC expired. The quotas that once shaped the global apparel trade were removed and tariffs were left as the only trade restrictions in place. The ATC and its predecessor, the Multi-Fiber Arrangement (MFA), had governed world trade in T&C by providing a framework for bilateral and unilateral restrictions and limiting imports into developed-country markets whose domestic industries were facing decline. Preferential access to protected markets favored exports from some developing countries (e.g. Kenya) while quotas restricted exports from others (e.g. India and China).
10. A key impact of the ATC is that restrictions on imports from the more competitive East and South Asian manufacturers (such as China, Japan, South Korea and Hong Kong) led to a displacement of clothing production to less developed but less competitive locations such as Mexico, Central America, Bangladesh, Sri Lanka and Mauritius. The initial driving force behind this process was large retailers such as Wal-Mart and brands such as Nike who began to outsource production to low-wage countries. For example, in the 1990s Korean and Taiwanese producers expanded their operations to the Caribbean and Sub-Saharan Africa.
11. While ATC required the eventual elimination of quotas, it did not mandate a reduction in tariff protection. Consequently, the global market for T&C products remains heavily distorted, especially in OECD markets for finished products. Average applied tariffs on imports of textiles are 6.7% in the EU and 7.5% in the US but are higher for imports of clothing at 11.5% and 10.8% respectively. However, in many categories, the US and the EU impose tariffs that are over 20% whereas their average tariffs on manufactured goods are below 3%. Tariff peaks on imports of certain T&C products can reach 32 percent in the US.
12. Since apparel exports are subject to some of the highest tariffs on manufactured goods in the major importing OECD countries, preferential access offered by the US and EU may still make a substantial positive impact on the export volumes of eligible countries. However, the rules of origin (ROO) in these preference programs, particularly in the EU, have imposed serious constraints on exporters.
AGOA is the most generous among the four preferential programs for sub-Saharan exports of textiles and clothing
13. There are four preferential arrangements.
EU and the US GSP. The EU implemented its Generalised System of Preferences (GSP) in 1971. The EU GSP can be used by all developing countries. For textiles, the general GSP reduces average EU import tariffs from 6.70% (under MFN) to 5.42% and, for clothing, from 11.54% to 9.23%. The most favourable
iii

arrangements under the EU’s GSP are reserved for LDCs. The US GSP program offers duty-free treatment for specified products from designated countries but excludes most T&C products. Consequently, the US GSP reduces average US import tariffs marginally since most categories are excluded. Tariffs are lowered for few eligible categories textiles from 7.5% (under MFN) to only 7.4% and, for clothing, from 10.8% to 10.6%.
EU Everything but Arms (EBA). With its Everything but Arms (EBA) amendment, effective from March 2001, the EU extended duty- and quota-free access to all products originating in LDCs, except arms and ammunition. This covers (where the ordinary GSP does not) all agricultural products, including ‘sensitive’ products (banana, rice, beef, sugar). In T&C, the African LDCs cannot benefit from the EBA initiatives because (a) the ROO require double transformation (two significant processes should be performed within the country), and (b) there is no cumulation provision for inputs originating in other African countries (clothing must be manufactured of fabrics made in the exporting country or the EU.)
The EU ACP/Cotonou Agreement. 77 African, Caribbean and Pacific (ACP) countries (excluding South Africa) have traditionally received more generous tariff preferences on a broader range of products than those covered under the EU’s GSP. The ACP/Cotonou Agreement eliminates import duties on clothing meeting its ROO. For textiles, it reduces average EU import tariffs from 6.7% (under MFN) to 0.3%. ROOs allow full ACP cumulation for almost all products.
US GSP and the African Growth and Opportunity Act. For sub-Saharan exporters, the US introduced AGOA in 2000 and expanded it three times afterwards. The current program extends until 2015. 37 of 48 Sub-Saharan African countries are AGOA-eligible. The main advantage is its extension of product coverage to include almost all clothing and textiles products. A second advantage is the eligibility guarantee for longer terms – up to eight years – whereas GSP needs to be renewed by the US congress every year. Finally, AGOA provides very generous and flexible ROOs for eligible LDCs. It requires only single transformation until 2013 - the third-country fabric (TCF) derogation. The only major countries that are currently ineligible for the use of the TCF derogation are Mauritius and South Africa.
Trade patterns in textiles and clothing
14. The pattern of trade in T&C has been shaped by two factors. First, the MFA/ATC regime served as a negative preference system, helping some developing country suppliers (such as Central American and sub-Saharan African countries) at the expense of others (many East and South Asian countries such as China and India). The current tariff levels and preference programs continue this pattern. In short, quotas in T&C shielded
iv

less competitive suppliers in Latin America and Africa from competition from Asian exporters.
15. Second, the emergence of global supply chains for T&C has provided retailers with the ability to increasingly manage their supply networks and dictate non-price conditions such as quality, delivery schedule and choices over raw materials.
China dominates in world exports of textiles and clothing
16. China region1 is the world’s largest exporter of T&C. Following the end of the ATC, China region’s world market share has risen from 32.8% in 2004 to 36.3% in 2005 for textiles and from 39.3% to 42.4% in the same period for clothing.
17. This increase in market share, largely in the US and EU, has led to the imposition of safeguards on Chinese T&C products until December 2008. Other countries, such as Turkey, Argentina, Brazil and South Africa have also imposed safeguards on imports of Chinese T&C products or have taken steps to be able to use them. After these safeguards are removed, many analysts expect the country’s market share to grow to more than 50%. According to some projections, the elimination of quotas have transformed T&C manufacturing so drastically that it will eventually resemble footwear and toys, in which over 90% of all global trade is imported from China.
18. Other major exporters of textiles are the EU, US, India and South Korea. In 2004, the largest AGOA exporters of textiles were South Africa, followed by Mauritius, Nigeria and Tanzania, accounting for 82% of total exports from the region.
19. In the clothing sector, the major exporters (in addition to the China region) are the EU, Turkey, Bangladesh, Mexico and India. In 2004, the largest AGOA exporters of clothing were Mauritius, followed by Madagascar, Lesotho, Kenya and South Africa, jointly accounting for 86% of total exports from the region.
Developed countries are the main markets for imports of textiles and clothing
20. In 2004, the largest importer of textiles in the world was the EU (17%) followed by the US (16%). AGOA countries are net importers of textiles, accounting for 1.7% of world imports in 2000 which increased to 2.4% in 2004.
21. For the clothing sector, the largest importer was the US (34%) followed by the EU (33%) in 2004. Although there is a rather small and specialized clothing industry left in the US and Japan, a significant domestic clothing sector remains in the EU, especially in Southern Europe. AGOA countries account for 0.5% of world clothing imports.
1 China region includes China, Taiwan (China), Hong Kong and Macao which is treated as a single entity for the purposes of this report.
v

The US market for textiles and clothing is growing strongly but the sources of imports are changing
22. The growth rate of US imports of textiles during 1994-2005 was 7.8% per year in nominal dollar terms. The second half of the 1990s witnessed important changes in the source of US imports of T&C. While Mexico, China region (the largest supplier of textiles to the US market with a share of 35%), India and Pakistan have increased their shares, the EU and South Korea have lost market share.
23. US imports of clothing grew more slowly than imports of textiles during 1994-2005, at an average annual rate of 6.5% in nominal dollar terms. The shares of China (24%) and Mexico increased, while the shares of the EU and South Korea decreased. US clothing imports from the Caribbean and Central America remained relatively stable.
24. The majority of sub-Saharan African clothing exports to the US have entered under AGOA, the principal mechanism stimulating and maintaining clothing production in these countries. Eligible sub-Saharan African countries shipped over 90% of their clothing exports to the US under AGOA preferences. Following the introduction of AGOA in 2000, the share of AGOA countries in US clothing imports increased from 1.1% in 1999 to 2.7% in 2004 before falling to 2.1% in 2005. Imports of textiles (not covered under AGOA until 2007) from the eligible countries remained largely unchanged (about 0.2%).
The EU market for textiles and clothing is fragmented and rules of origin are a constraint
25. Intra-EU trade accounted for 68% of EU’s textile imports in 1994, falling to 59% in 2004. Extra-EU imports of textiles grew by an average of 4.5 percent per year in nominal dollar terms over the same period. Behind this import growth is a substantial shift from intra-EU trade to imports from lower cost suppliers. Turkey’s market share, following the introduction of the EU-Turkey customs union in 1996, rose from 7.1% in 1994 to 15.0% in 2005. China region increased its market share of EU textile imports from 14.0% in 1994 to 24.0% in 2004, reaching 28.7% in 2005. Among those countries that lost market share are Switzerland, South Korea, Indonesia and the US. AGOA countries maintained their EU market share, accounting for 1.3% of total extra-EU imports of textiles.
26. Intra-EU imports of clothing as a share of the total EU imports fell from 46% to 31% over the same period with imports from third-country suppliers growing by an average of 7.8% per year. China region is largest supplier of clothing to the EU market: its share in total extra-EU clothing imports decreased from 31.0% in 1994 to 29.1% in 2004, but increased to 35.7% in 2005. Turkey is the second largest supplier and its share of extra-EU clothing imports rose from 11.2% to 14.9% over the same period. Romania has more than doubled its market share, from 3.2% in 1994 to 7.3% in 2004. In comparison to textiles, the share of imports from AGOA countries in total extra-EU imports of clothing fell from 2.3% in 1994 to 1.4% in 2004. Mauritius is the largest
vi

exporter of clothing to the EU, followed by Madagascar. South African exporters supply specialized clothing to the UK market.
27. A key factor in explaining why exports to the US have grown much faster than those to the EU is the ROOs of the preference programs. The EU rules do not allow producers in African LDCs the flexibility they (currently) have under the AGOA to source fabrics from anywhere.
Clothing exports under AGOA
28. The initial performance of the export sectors that targeted the US market under AGOA was remarkable. However, when the ATC quotas faced by South and East Asian countries were removed, exports from many AGOA eligible countries declined sharply. This pattern indicates the relative fragility of the apparel export industries in these countries and their over-reliance on the restrictions imposed on competing exporters from other developing countries.
29. An interesting picture emerges on the impact of AGOA preferences and of the recent removal of ATC quotas faced by major exporters in South and East Asia. A detailed analysis of the data for 1996-2006 shows the following characteristics of the apparel exports to the US:
AGOA benefited only a handful of countries, although a large number of countries are eligible.
30. Apparel exports from the region to the US increased rapidly after the implementation of AGOA in 2000. However, only a handful of the eligible countries really took advantage of these preferences. Even though dozens of countries were eligible, over 95 percent of the apparel exports to the US since 2000 were from Lesotho, Kenya, Madagascar, Mauritius, Swaziland and South Africa. Of these countries, South Africa and Mauritius were existing exporters before AGOA. In other words, AGOA really benefited Lesotho, Kenya, Madagascar and Swaziland. The vast majority of the apparel exports from these countries go to the US which implies exporters in these countries completely rely on AGOA preferences and AGOA failed to create strong apparel industries which can compete in other markets (such as the EU).
The sharp decline in exports under AGOA is due to the expiry of the ATC and the changes in the apparel industry.
31. Apparel exports to the US peaked in 2003 for Mauritius and South Africa and in 2004 for the other exporters. Since then, the decline in exports has been rather dramatic for some of these countries. For example, South African and Mauritian exports declined by 65 percent and 50 percent, respectively. Other countries weathered slightly better with declines ranging from 25 percent (Swaziland and Madagascar) to 15 percent in Lesotho and 5 percent in Kenya.
vii

32. A key factor for the decline is the change in the nature of apparel industry. Apparel retail became dominated by large chains (such as Wal Mart, Carrefour, GAP) and labels (such as Polo, Levi’s) which do not produce any of their merchandise. In many cases they design the product and outsource the production to a manufacturer. They have strict requirements for the fabric, other raw materials as well as logistics details such as delivery frequency, location and schedule. Most retailers prefer to carry low inventories and require merchandise to be delivered in small quantities as they are sold. In short, exporters that manage to integrate themselves into the supply chains of the major retailers, deliver the products on short notice and satisfy all the requirements earn superior profits. Countries with well established textiles industries and low transportation costs have natural advantages and, unfortunately, this is not the case with most sub-Saharan African countries that suffer from infrastructure shortcomings and relatively underdeveloped industries.
The data show that African exporters of apparel are moving into higher quality T&C products while China Region concentrates on lower quality, lower margin, high volume products.
33. Despite the sharp decline in export volumes during the last three years, relative prices of exports particularly from Mauritius, South Africa and Madagascar increased which indicates that these exporters are moving into higher quality products.
34. China Region captured significant market share from other exporters over the last several years, mostly at the expense of the preference recipients in Latin America. However, the rapid quantity surge came at the expense of prices and quality of the exports. This indicates that the exporters are moving into high volume, lower quality and lower margin products while all other exporters are moving into higher priced categories. The country most exposed to competition from China Region is Madagascar, followed by Kenya.
Vertical and regional integration in African textiles and clothing trade
There are numerous reasons to encourage vertical and regional integration in the region
35. Competition in the world market for T&C is based on price and a host of other factors related to the efficient management of both production and logistics. In order to compete effectively in the world market, producers of T&C must provide rapid delivery and respond quickly to frequent shifts in consumer preferences and changes in retail practices. So while comparative costs (for clothing, especially those related to labor) remain important, production planning and delivery times are key determinants of comparative advantage in T&C. Competitiveness in the T&C market is therefore being increasingly driven by the ability of producers to bring products to market just-in-time in order to reduce the costs faced by retailers associated with keeping inventories.
viii

Sustainability of apparel as an important export sector requires decreased reliance on trade preferences and shifts to permanent sources of comparative advantage. Creation of a regional market for production would be an important source of comparative advantage. 36. The benefits of vertical domestic and regional integration of the T&C supply chain stem from cost reductions associated with lower transport and inventory costs, border delays, which otherwise would lead to shipping inputs and final products over larger distances. Vertical integration, in particular, can also increase control over production and the ability to sample fabrics and clothing more quickly. For these reasons retailers are increasingly sourcing from companies that are vertically integrated or located in regions that house the whole industry.
37. While these arguments would favor the development of a fully integrated African T&C sector in order to benefit from proximity to the region’s abundant supply of cotton and other raw materials, such regional integration has not materialized. For example, while AGOA countries are traditional suppliers of seed cotton, accounting for 4.6% of world production, they have failed to become significant processors of raw cotton into T&C products. They account for less than 1% of world exports in such products and just three countries - Mauritius, South Africa and Lesotho - account for three-quarters of total volume.
38. Similarly, domestic cotton production in some but not all T&C producing countries.2 Cotton can be shipped long distances and stored without significant degradation in quality. Certain cotton-producing countries are relatively unattractive locations for manufacturing investment and they lack the workforce capabilities necessary to develop a T&C sector. Thus, it is economically desirable to promote intra-AGOA regional trade in cotton, yarn, fabric and clothing and establish an integrated industry.
Intra-AGOA trade in cotton, yarn, fabric and clothing
39. Cotton: As a group, AGOA countries export 83% of their cotton lint production, accounting for 9% of world exports. The largest producers (Cameroon, Côte d’Ivoire and Mali) export virtually all of their production. Nigeria is the only large producer of cotton lint in the region that domestically consumes most of its production (80%).
40. Over one-third of AGOA cotton exports go to China and the EU while only 8% of AGOA cotton exports are to the other countries in the region and this is only half of all cotton imported by the region. South Africa imports 61% of AGOA cotton traded regionally. Mauritius’ imports of cotton account for a further 13% and Nigeria 9%. Almost half of intra AGOA trade in cotton comes from Zambia and virtually all of this is exported to South Africa.
2 For example, while China has integrated its cotton sector through textiles to clothing, supplying over 90% of its cotton lint requirements, Mexico (a much smaller cotton producer) imports virtually all of its cotton to supply the T&C sector.
ix

41. Other major exporters to the other countries in the region include Benin (12%, mostly to Nigeria), Malawi (8%, to South Africa and Zambia), Mozambique (6%, to South Africa) and Mali (6% to Mauritius).
42. Yarn: As a group, AGOA countries are net importers of yarn (both cotton and man-made). One third of AGOA yarn imports are from the EU, US and China. While one-fifth of AGOA yarn exports are to the region they comprise less than 10% of all yarn imports to the region. Mauritius’ imports of yarn from AGOA countries account for one half of intra-regional trade in these products. South African imports of yarn account for a further 19%, followed by Uganda (6%) and Kenya (4%).
43. Two-fifths of intra AGOA trade in yarn is sourced from South Africa (mostly to Mauritius but also to other AGOA countries). Other major exporters in and to the region include Zambia (30%, to South Africa, Mauritius and Malawi), Kenya (10%, mostly to Uganda but also South Africa) and Madagascar (9%, virtually all to Mauritius but also to South Africa).
44. Fabric: AGOA countries are net importers of fabrics (cotton and man-made). Over half of AGOA fabric imports are from the EU, US and China. While 37% of AGOA fabric exports are to the region, only 5% of AGOA fabric imports are sourced regionally. One-third of AGOA fabric exports go to the EU (10% to the US, and virtually nothing to China). One-sixth of intra AGOA trade in fabric is accounted for by Mauritian imports from the region. Benin imports of fabric account for a further 15%, followed by Namibia (10%) and Malawi (6%).
45. Almost half fabric of fabric traded regionally is sourced from South Africa (mostly to Mauritius, Namibia and Malawi but also to other AGOA countries). Other major exporters in and to the region include Nigeria (13%, mostly to Benin), Côte d’Ivoire (11%, mostly to Benin but also Niger), Ghana (8%, to Nigeria and Benin) and Mauritius (7% to Madagascar and South Africa).
46. Clothing: AGOA countries are net exporters of clothing, accounting for 1% of world exports in 2003. Less than 5% of AGOA clothing exports are to the region, while 11% of AGOA clothing imports are sourced regionally (see Annex 34). 59% of AGOA clothing exports go to the US (34% to the EU, virtually nothing to China).
47. Nearly one-third of intra AGOA trade in clothing is accounted for by Namibian imports from the region. South African imports of clothing account for a further 19%, followed by Zambia (10%). Over one-half of intra AGOA trade in clothing is sourced from South Africa (mostly to Namibia, Zambia and Mozambique but also to other AGOA countries). Other major exporters to the region include Malawi (15%, almost exclusively to South Africa), Kenya (10%, mostly to Uganda and Tanzania), and Côte d’Ivoire (7% mostly to West and Central Africa).
Potential for vertical and regional integration exists …
x

48. The previous section shows that intra-AGOA trade in inputs required by the region’s clothing industry is low (less than 40% for fabrics and 20% for yarns) and more limited for products further up the cotton-clothing value chain (yarn production is more capital intensive than fabric production). But assuming the TCF derogation under AGOA expires in 2013 and is not extended, this will require African exporters to use regionally (or US) sourced yarn and fabric to maintain AGOA-eligibility for their clothing exports to the US market. Although AGOA beneficiaries will not necessarily need to develop their own cotton, spinning, weaving, knitting, dyeing, cutting and assembly operations, they will need to source these from other AGOA countries in order for exports to qualify for preferences. And there may be potentially significant competitiveness gains from this by reducing transport and logistics costs and shortening lead times through more coordinated planning, production and shipping.
49. Coughlin et al. (2001) propose the following possible supply chains for basic clothing for 11 African countries. They conclude that no country in the region has an absolute advantage in all stages of production and that the most competitive supply chain is a regional one.
Potential Regional Supply Chain for T&C for African Countries
Production stage Countries
Spinning Botswana, Lesotho, Mozambique, Mauritius, Namibia, South Africa, Swaziland, Malawi, Zambia, Zimbabwe, Tanzania
Knitting Botswana, Lesotho, Malawi, Mauritius, Namibia, South Africa, Swaziland, Zambia Zimbabwe
Weaving Botswana, Namibia, Lesotho, Mauritius, South Africa, Zimbabwe Zambia, Malawi
Dying and finishing Lesotho, Mauritius, South Africa, Zimbabwe, Zambia, Malawi
Basic clothing Lesotho, Mozambique, Malawi, Zambia, Zimbabwe, Tanzania
Fashion clothing Botswana, Mauritius, Swaziland, Namibia, South Africa
Product design, marketing Mauritius, South Africa
….. but challenges to realize this potential are daunting
50. Only if the clothing sector has long-term viability in Africa can there be any chance of developing sustainable backward and forward linkages. Interventions that compromise the competitiveness of the clothing sector (trade policies that raise the domestic cost of intermediate inputs, policies in overseas markets, especially ROOs that limit access to those markets) will not be conducive with the emergence of integrated production in Africa. In other words, investments will not be made in spinning and
xi

weaving if there is uncertainty concerning the viability of the downstream sources of demand: the clothing producers. In the modern global clothing market, those best able to perceive profitable opportunities for additional investments in other segments of the value chain, especially in small economies with limited domestic demand, are likely to be the clothing exporters. T&C firms in these countries must, therefore, determine their strategies depending on their position in the supply chain, their links to the international market and the type and value of products they export. For firms with unique, niche products (e.g. high quality suits in Mauritius) the best option may be to pursue branding to secure greater rents associated with the product’s uniqueness, or to enter a product niche (e.g. workwear in Zambia) where demand does not vary significantly throughout the year and there are fewer competitors. For large firms, with many operations offering standardized products (e.g. knitwear in Lesotho and menswear in Kenya), increased vertical integration within the country or regional integration with producers in other countries may be the best strategy for reducing costs associated with profit margins and transport costs and for controlling risks that delay shipments. But this will require significant investment in the region’s textile sector to develop production capacity and improve quality. Efforts will also be required to obtain buyer approval for new regional sources of yarns and fabrics. The alternative model, where a significant proportion of total output is destined for sale to the domestic market (e.g. as in South Africa) is not likely to be successful or sustainable, especially in small economies where domestic demand is limited or where competition is fierce from large Asian competitors that benefit from economies of scale or subsidies to their T&C industries. Domestic demand may also be limited where sales of second-hand clothing have already captured the low-middle range of the clothing market, failing to support the higher prices required by local manufacturers.
51. The use of trade policy instruments (high duties on clothing, textiles and yarns in African countries; restrictive ROOs for preferences in the EU market, even with regional cumulation) have not been successful in supporting the clothing sector in Africa or in encouraging linkages with different part of the clothing chain. What is necessary is that Governments in Africa address the availability and cost of key backbone services that undermine the competitiveness of all sectors, improve the business climate and ensure that domestic firms have access to inputs at global prices. There may also be scope for pro-active sector specific policies that address critical constraints related to labor skills and market information.
xii

1. Introduction
Diversification into higher-value added export products away from commodities continues to be a major development and trade policy objective for many developing countries. During the last decade, textiles and apparel were presented as potential export sectors that would create such opportunities. Apparel production is especially labor intensive, with low start-up investments and easily transferable technology. Furthermore, the labor requirements can be easily met with low and semi-skilled workers, especially women. As a result, many countries with competitive labor costs, especially in South and East Asia, have captured significant shares in the world market during the last four decades. Despite the potential development benefits and their various sources of comparative advantage, few African countries have managed to establish a presence in the global textiles and apparel markets until recently. As a result, Africa as a whole, remains a net importer of textiles and clothing even though it is a net exporter of cotton.
The biggest boost to the African apparel sector came through the unilateral market access preferences granted by the US and the European Union via the African Growth and Opportunity Act (for the US) and Cotonou, EBA (for the EU) initiatives. Since the vast majority of the main apparel exporters in other developing countries faced rather restrictive access to the European and US markets (due to ATC quotas and high tariffs), the unilateral quota and tariff-free access granted to African countries led to rapid growth of exports from the region. The main feature of the preference programs, especially AGOA, was the permission to use fabric from third-countries which is not granted in other US bilateral and unilateral preference programs. This allows cheap fabrics, especially from Asia, to be processed in Africa and exported to the US – a process which is not allowed under the rules of origin under other preferential market access programs. The growth of apparel exports from Africa has been praised and identified as a success of unilateral preference programs.
The future of apparel exporters in sub-Saharan Africa is, however, rather uncertain as they face two major challenges for their products: i) increased competition from large, low-wage producers such as India, China, Bangladesh and Pakistan following the phase-out of quotas after the expiry of the ATC; and, ii) the expiration of the third-country fabric derogation under AGOA scheduled for 2013.
Since the expiration of the ATC in 2005, Africa has seen its recent growth of exports transformed into a decline. Many factories have closed, resulting in the loss of tens of thousands of jobs in Kenya, Lesotho, Madagascar, Mauritius, Namibia, South Africa and Swaziland. Producers in sub-Saharan Africa can no longer depend on displaced production from quota-bound countries to boost their exports. In order to attract buyers, they must be cost competitive (within the margins of preference they receive in developed country export markets); able to deliver to market on-time; and, be prepared to meet quality and service requirements.

The African clothing industry faces many challenges as it struggles to maintain its recently-found place in the global market. One of the main developments is increasing demands by retailers for faster lead times from their suppliers to satisfy changing fashions and to reduce the inventory costs. In other words, fast production is becoming the norm in an industry which favors countries that have flexible supply chains and lower transportation costs to main consumer markets in the West. Secondly, there is increased need for a large and nearby supplier base for raw materials. National clothing industries can no longer rely exclusively on distant sources of yarns and fabrics to satisfy clothing industry demand. But no national textile industry can survive without local clothing manufacturers as a demand base for their production.
Unilateral preference programs such as AGOA promote the development of regional yarn and fabric production capacity via a yarn-forward rule which requires yarn and fabric to be locally supplied. This requirement enhances regional development by encouraging more of the production to be done locally as well as discouraging transshipment. However it fails to fully capture the realities of today’s global market. It is both unrealistic and inefficient to force any regional textile sector to supply all of the various yarns and fabrics that US buyers specify, especially in small and poorer countries with less developed domestic markets. Even China, a diversified textiles producer, imports a significant portion of the needed yarns and fabrics to satisfy its buyers’ wide range of demands. Therefore, AGOA’s objective to develop a vertically integrated textiles-to-clothing supply chain within the region could deny African clothing manufacturers access to yarns and fabrics specified by their US customers if such inputs are unavailable in the region and the third country fabric derogation expires. This would generate a significant decline for the African clothing industry. Currently, over 85% of clothing exports currently eligible for preferences in the US market are made from third-country fabric.
This study explores the potential for regional and vertical integration to overcome these challenges and identifies obstacles to this. Timing is important since both the EU and the US have recently imposed trade restrictions on China (until 2008) to protect their domestic textiles and clothing industries. These safeguards provide a brief opportunity for sub-Saharan African producers to integrate their textiles and clothing industries both domestically and regionally.
2

2. Protection and preferences in the global market for textiles and clothing
2.1 The Agreement on Textiles and Clothing: quotas have gone but high tariffs remain
On 1 January 2005, the WTO Agreement on Textiles and Clothing (ATC) expired. The quotas that once shaped the global apparel trade were removed and tariffs were left as the only trade restrictions in place (see Annex 1). The Multifiber Arrangement (MFA) that preceded the ATC governed trade in textiles and clothing (T&C) by providing a framework for bilateral and unilateral restrictions limiting imports into developed-country markets whose domestic industries were facing decline. Preferential access to protected markets (see Section 2.2) served to protect exports from some developing countries (e.g. Kenya) while quotas restricted others (e.g. India and China).
Under the MFA, quotas fundamentally affected the production and trade of T&C in two ways (Cline, 1990; Hamilton, 1990; Minor, 2002). First, for exporting countries, quotas imposed a limit on exports but also secured market access, providing an incentive for producers to geographically diversify their export markets. The quota regime led production of T&C to spread to a larger number of countries. Secondly, importing countries were forced to source from exporting countries that had been allocated quotas that remained unfilled. For example, at the beginning of the 1990s half of T&C exports from Hong Kong would have gone to other countries had there been no quotas (Lande et al., 2005). Restrictions on imports from the more competitive East Asian manufacturers (such as China, Japan, South Korea and Hong Kong) led to a displacement of clothing production to less developed but less competitive locations such as Bangladesh, Indonesia, Sri Lanka and Mauritius. The initial driving force behind this process was the larger retailers such as Wal-Mart and brands such as Nike who began to outsource production to low-wage countries. While they carried out no production of their own, they maintained control over design and marketing of products, standard setting and sourcing of raw materials, distributing them globally and then importing the final products (Morris, 2006). This was followed by the establishment of ‘triangular production networks’, where countries with established relationships with these brands and retailers began to outsource their own production to (lower waged) countries (Gereffi, 1999). For example, in the 1990s Korean and Taiwanese producers expanded their operations to the Caribbean and Sub-Saharan Africa and the Mauritian clothing sector had developed operations in Madagascar.
While ATC required the eventual elimination of quotas, it did not mandate a reduction in tariff protection. Consequently, the global market for these products remains heavily distorted, especially in developed country markets for finished products and in those developing countries that produce clothing. Average applied tariffs on imports of textiles to the largest markets are 6.70% for the EU and 7.54% for the US (see Annex 2) but are higher for imports of clothing at 11.54% and 10.76% respectively (see Annex 3). However, in many categories, the US and the EU impose over 20% tariffs whereas their average tariffs on manufactured goods are below 3%. Tariff peaks on imports of T&C products can reach 32 percent in the US. Average tariffs on imports of T&C products in
3
many developing countries are also high, sometimes averaging over 20 percent with peaks of over 100 percent for certain products.
Since apparel exports are subject to some of the highest tariffs on manufactured goods in the major importing developed countries, preferential access offered in the US and EU can have a substantial positive impact on the eligible countries. However, the rules of origin in these preference programs can impose serious constraints on exporters.
2.2 EU GSP and Everything but Arms
The EU implemented its Generalised System of Preferences (GSP) in 1971. The range of beneficiaries were gradually expanded, graduation criteria for the higher income developing countries were introduced and greater benefits for the LDCs in the scheme were offered (see Annex 4). In 2003, EU imports under GSP (for all goods) totalled US$59 billion, compared to US$18 billion under the US GSP (see section 2.4). The EU GSP can be used by all developing countries except Myanmar (which has been suspended). For textiles, the general GSP reduces average EU import tariffs from 6.70% (under MFN) to 5.42% and, for clothing, from 11.54% to 9.23% for clothing (see Annex 5). The most favourable arrangements under the EU’s GSP is reserved for LDCs (see Annex 6). With its Everything but Arms (EBA) amendment, effective from March 2001, the EU extended duty- and quota-free access to all products originating in LDCs, except arms and ammunition. This includes (where the ordinary GSP does not) all agricultural products, including ‘sensitive’ products.3
Rules of origin (ROOs) under EU preferential trade agreements vary widely. In general, EU ROOs under its GSP require two significant processes be performed within a country in order to confer origin and eligibility for the tariff preference. In many cases ‘significant’ processing requires a product to be reclassified from one four-digit tariff heading to another. In industry terms for clothing, this means that production, including cutting and sewing, must be combined with another process, such as manufacture of fabrics or yarns. In other words, dying and finishing is not sufficient to confer origin under the EU’s GSP. A 10 percent tolerance for third country content for trimmings and non-originating fibers and yarns is allowed. All exports for which preferential treatment is sought must be shipped directly to the EU without entering another country, although there is provision for transhipments as long as they are stored solely for onward freight. For African producers, there is no cumulation provision under the GSP for inputs originating in other African countries. Clothing must be constructed of fabrics made (including drying and finishing) in the country or the EU. However, a number of Asian countries eligible for GSP (Indonesia, Cambodia, Vietnam, Bangladesh and Pakistan) benefit from a regional cumulation rule that allows producers to source fabric and yarns from each other and from large textile producing countries such as India, as long as the 3 Only three most sensitive agricultural products were not liberalised immediately for LDCs: bananas, rice and sugar. For bananas, EBA provides for full liberalisation between 1 January 2002 and 1 January 2006 by reducing the full (out-of-quota) tariff by 20% every year. For rice and sugar, duty-free quotas have increased by 15 percent each year from base levels of 2,517 tons (for rice) and 74,185 tons (for sugar) in 2001/02 and will continue to do so until 2009, when all quota restrictions will be eliminated. Rules of origin still apply but (unlike preferences under the ordinary GSP) EBA does not expire.
4

fabric originates in the region and certain value-added criterion have been met (China and India have graduated from GSP and face full MFN tariffs). ROOs under EBA are also more restrictive for sub-Saharan African countries than for LDCs in South and South East Asia. Asian LDCs may use fabrics from neighboring countries as long as 51 percent of the value of the final product is added in the making up process and the fabrics come from designated partner countries. Moreover a temporary derogation (in place until 31 December 2006) for Cambodia, Laos and Nepal eliminates the value added rule (Minor, 2006). African LDCs should petition the EU for cumulation rules under EBA comparable to their counterparts in Asia.
2.3 The EU ACP/Cotonou Agreement
The group of African, Caribbean and Pacific (ACP) countries, now 77 (excluding South Africa), have traditionally received more generous tariff preferences on a broader range of products than those covered under the EU’s GSP (see Annex 7 for a chronology). The ACP/Cotonou Agreement eliminates import duties on clothing meeting its ROO (see Annex 5). For textiles, it reduces average EU import tariffs from 6.70% (under MFN) to 0.34%. ROOs specify that articles of clothing, including those made cotton, wool and manmade fibers, must be constructed from ACP yarn or fabrics i.e. full cumulation is allowed. As with ROOs under AGOA (see Section 2.4), the yarn used in knit-to-shape garments must be spun in an ACP country, in addition to the fabric construction and making-up. Exceptions to this general ROO exist for products containing significant embroidery or impregnated fabrics. Non-ACP fabrics can be used in made-up clothing if the fabrics are printed in an ACP country and the printing adds at least 52 percent of the value to the fabric – a significant barrier for basic garments. A 15 percent tolerance for non-ACP content including trimmings and non-originating fibers and yarns is allowed.
2.4 US GSP and the African Growth and Opportunity Act
The US GSP took effect in 1976 and was initially intended to operate until 1985, although it continues to function to the present day. The US GSP offers duty-free treatment for specified products from designated countries but excludes most T&C products. Consequently, the US GSP reduces average US import tariffs marginally since most categories are excluded. Tariffs are lowered for textiles from 7.54% (under MFN) to only 7.36% and, for clothing, from 10.76% to 10.64% (see Annex 8).
For African imports, the US introduced AGOA in 2000, and expanded it three times afterwards. In order to be eligible to receive tariff preferences under AGOA, countries must also be eligible under its GSP. Although GSP eligibility does not necessarily imply AGOA eligibility, the majority (45 of 48) of sub-Saharan African countries are currently GSP-eligible and 37 of these are also AGOA-eligible (see Table 1 for the dates of eligibility).
5

Table 1: African Growth and Opportunity Act eligible countries
Country Date declared AGOA eligible
Date declared eligible for apparel provisions
Country Date declared AGOA eligible
Date declared eligible for apparel provisions
Angola 30 December 2003 Lesotho 2 October 2000 23 April 2001Benin 2 October 2000 28 January 2004 Madagascar 2 October 2000 6 March 2001Botswana 2 October 2000 27 August 2001 Malawi 2 October 2000 15 August 2001Burkina Faso 10 December 2004 4 August 2006 Mali 2 October 2000 11 December 2003Burundi 1 January 2006 Mauritius 2 October 2000 18 January 2001Cameroon 2 October 2000 1 March 2002 Mozambique 2 October 2000 8 February 2002Cape Verde 2 October 2000 28 August 2002 Namibia 2 October 2000 3 December 2001Chad 2 October 2000 26 April 2006 Niger 2 October 2000 17 December 2003Congo 2 October 2000 Nigeria 2 October 2000 14July 2004Democratic Republic of Congo 31 December 2002 Rwanda 2 October 2000 4 March 2003
Djibouti 2 October 2000 Sao Tome and Principe 2 October 2000
Ethiopia 2 October 2000 2 August 2001 Senegal 2 October 2000 23 April 2002Gabon 2 October 2000 Seychelles 2 October 2000 Gambia 31 December 2002 Sierra Leone 2 October 2000 5 April 2004Ghana 2 October 2000 20 March 2002 South Africa 2 October 2000 7 March 2001Guinea 2 October 2000 Swaziland 2 October 2000 26 July 2001Guinea-Bissau 2 October 2000 Tanzania 2 October 2000 4 February 2002
Kenya 2 October 2000 18 January 2001 Uganda 2 October 2000 23 October 2001Zambia 2 October 2000 17 December 2001
The main advantage of AGOA is its extension of product coverage of GSP to include an additional 1,835 items. Notably, AGOA includes some clothing products (normally excluded from US preferences) with the requirement that countries (i) have procedures in place to prevent trans-shipments and use of counterfeit documents and (ii) meet rules of origin requirements (see Annex 9). AGOA also includes (from 2007) textiles products from eligible lesser developed African countries (defined as sub-Saharan African countries with a per capita GNP of less than US$1,500 in 1998). A second advantage is the eligibility guarantee for longer terms – up to eight years – whereas GSP needs to be renewed by the US congress every year.
AGOA, when compared to other preference programs of the US (such as NAFTA with Mexico or CBI with the Central American countries) provides more flexible ROOs for lesser developed countries. It requires only single transformation until 2013 (although this has been extended twice: initially scheduled for 20 September 2004 and then 30 September 2007). Simply put, the third-country fabric (TCF) derogation makes eligible for preferences clothing made from non-AGOA imported yarn or cloth, that (from 2007) is not deemed to be in abundant supply within the region (e.g. denim - see Annex 9). Of the 37 AGOA-eligible countries, 26 are eligible for apparel benefits and 24 for the TCF derogation. The only major countries that are ineligible for the use of the TCF derogation are Mauritius and South Africa. The US Congress approved legislation in November 2004 that included Mauritius, for a period of one year, under the TCF derogation. Mauritius had previously been excluded from the list (and is once again now), as a result of its relatively high income per capita. Currently, clothing exports from Mauritius have to be produced using regionally or US-sourced raw materials in order to qualify for AGOA preferences. Less than 50% of its exports to the US meet these requirements.
6

3. Trade patterns in textiles and clothing
This section analyzes global trade in T&C during the period 1994-2004, using the most recent data for 2005 where available (see Annex 10).4
The MFA/ATC regime served as a negative preference system, helping some developing country suppliers at the expense of others (especially East and South Asian countries such as China and India). Quotas in T&C shielded less competitive suppliers in Latin America and Africa from competition. The MFA, therefore, induced the expansion of T&C industries across a wide range of countries which did not necessarily have comparative advantage in these sectors. Over time, as quotas became more restrictive in certain products and exporters, investment flowed to unconstrained countries. Initially T&C production for export was concentrated in Japan, then spreading to Hong Kong, South Korea and Taiwan (China). Thereafter it relocated rapidly throughout Southeast Asia, the Indian subcontinent and to Turkey, Brazil, the Middle East Gulf and Mauritius. Exports of T&C from China and Vietnam grew rapidly once these countries received MFN status and have increased further following the removal of quotas under the ATC.
The emergence of global supply chains for T&C has provided retailers with the ability to increasingly manage their supply networks and dictate non-price conditions such as quality, delivery schedule and choices over raw materials (Flanagan, 2003; Kaplinsky, 2005). In 2001, the largest 5 US retailers accounted for over three-quarters of clothing sales, while in the UK the largest 10 retailers accounted for 52% of sales (Weathers, 2003; Gibbon, 2002). By 2010 it is predicted that the largest 10 retailers in the world will account for 25-30% of world T&C trade (Morris, 2006). Retailer power has also been increasing for two other reasons. First, consumers demand for varieties is increasing which is leading to shorter product seasons, faster product cycles and smaller orders (Salinger et al, 1998). Secondly, mergers and acquisitions have led to a greater concentration of retailers in developed countries (Morris and Sedowski, 2006).
3.1 China dominates in world exports of textiles and clothing
China is the country most likely to gain market share following the end of the ATC. The China region5 was the world’s largest exporter of both T&C in 2004. Its world market share (excluding intra-EU trade) of both textiles and clothing remained relatively constant between 1994 and 2004 at for textiles 33.0% and 32.8% respectively (see Annex 11) and for clothing at 39.5% and 39.3% over the same period (see Annex 13) for clothing. China currently offers the cheapest cost of production because of low (but increasing) wages, economies of scale and high productivity of its producers. The availability of cheap, high quality fabric, both domestically and from neighboring Asian countries, is also an advantage (Kaplinsky, 2005). China continues to expand its range of T&C products and has improved its capacity to meet international quality standards
4 Textiles are defined here as ISIC Rev.3 section 17 (excluding components relating to HS chapter 61) and clothing is defined as HS chapters 61-62 respectively.5 China region includes China, Taiwan (China), Hong Kong and Macao which is treated as a single entity.
7

(Morris, 2006). A large increase in exports from China followed the country’s accession to the WTO in 2001, as quotas were lifted or expanded on a number of China’s T&C products. Upon its membership of the WTO, China benefited not only from the third phase of integration under the ATC on 1 January 2002 but also from the integration of T&C products (granted to other WTO members when China was not a member) during the first two phases. Consequently, on 1 January 2002, 29 categories of quotas were removed on imports from China. Some of the highest import growth rates were in eight categories of products containing cotton. According to the National Cotton Council, US imports of products from China covered by these eight categories grew by an average of more than 640% in 2002.
Following the final phase of the ATC, figures for 2005 show that China region’s world market share has risen to 36.3% for textiles and 42.4% for clothing. This increase in exports from China, largely to the US and EU, has led to the imposition of safeguards on Chinese T&C products. Temporary quotas, agreed under the special T&C safeguard clause of China’s WTO accession, limit the (volume) growth in imports of certain T&C products to 7.5 percent per annum until December 2008. In June 2005, the EU concluded a bilateral agreement that further limits imports of T&C from China until the end of 2007, covering one-third of T&C products. And in November 2005, the US concluded a similar bilateral agreement limiting 22 clothing categories (or one-fifth) of T&C imports from China to an increase of between 10-17% per year until December 2008 (de Voest, 2006). The safeguards cover some 90 percent of T&C products integrated under the final stage of the ATC (IMF, 2006). Other countries, such as Turkey, Argentina, Brazil and South Africa (see Section 6.1) have also imposed safeguards on imports of Chinese T&C products or have taken steps to be able to use them.
After China is freed of bilateral constraints, many analysts expect the country’s market share of T&C to grow to more than 50%. Others believe that the elimination of quotas will transform T&C manufacturing so drastically that it will eventually resemble footwear and toys, in which upwards of 90% of all merchandise is imported from China.
Other major exporters of textiles are the EU, US, India and South Korea (see Annex 11). Developed countries, therefore dominate in world textile exports. The world export share in textiles of countries eligible for AGOA’s clothing provisions (hereafter simply defined as AGOA countries) fell from 0.52%, in 2000 to 0.45% in 2004, while increasing slightly to 0.47% in 2005. In 2004, the largest AGOA exporters of textiles were South Africa, followed by Mauritius, Nigeria and Tanzania, accounting for 82% of total textiles exports from the group (see Annex 12).
In the clothing sector, the major exporters (in addition to the China region) were the EU, Turkey, Bangladesh, Mexico and India (see Annex 13). The world export share in clothing for all AGOA countries rose from 1.24%, in 2000, to 1.43% in 2004 before falling to 1.22% in 2005 (see Annex 14). Exports from the region are mainly low-price basic items such as trousers, T-shirts and sweaters that typically have long production runs and few styling changes (ITC, 2004; EIU, 2004). In 2004, the largest AGOA exporters of clothing to the world were Mauritius, followed by Madagascar, Lesotho,
8

Kenya and South Africa, jointly accounting for 86% of total clothing exports from the group.
3.2 Textiles and clothing exports are important to some AGOA countries
For the AGOA group of countries as a whole the share of T&C exports in total exports is low, at 0.54% and 2.77% respectively (see Annex 15). But for some individual countries within the AGOA group, clothing exports are an important component of foreign exchange. Exports of clothing are most important for Lesotho (accounting for 97.24% of total exports), followed by Mauritius (51.45%), Madagascar (41.19%), Cape Verde (39.48%), Swaziland (24.58%) and Kenya (11.97%).
In 2004, the EU took the largest share of AGOA countries’ textiles exports (47.18%) followed by the US (6.69%). For clothing exports from AGOA countries, the US market accounts for 62.64% of total clothing exports, followed by the EU (33.53%).
The Canadian and Japanese markets are far less important for AGOA countries. In 2004, Canada and Japan accounted for 1.30% and 1.74%, respectively, of textile exports from AGOA countries while their share of clothing exports was 0.98% and 0.22%. For textiles, the Canadian market is most important for South Africa (accounting for 1.96% of South Africa’s textile exports) while Japan is most important for Tanzania (4.60%) and Mali (4.24%). Turning to clothing, Canada is most significant for Burkina Faso (accounting for 17.45% of its clothing exports and Nigeria (14.19%) while the Japanese market is most significant for Cameroon (14.06%) and Niger (6.49%).
3.3 Developed countries are the main markets for imports of textiles and clothing
In 2004, the largest importer of textiles was the EU followed by the US. Since 1994, the share of the ATC countries (EU, US and Canada) in world imports of textiles (excluding intra-EU trade) has increased from 31.1% to 35.8% in 2004. The increase was mainly due to an increase in the share of the EU and US from 16.7% to 17.0% and from 11.2% to 15.9%, respectively (see Annex 16). Canada’s share of world textiles imports has remained stable throughout the period at about 3%. AGOA countries are net importers of textiles, accounting for 1.65% of world imports in 2000, increasing to 2.37% in 2004 (see Annex 17).
For the clothing sector, the largest importer is the US followed by the EU and Japan. Although there is virtually no clothing industry left in the US or Japan, a significant domestic clothing sector remains in the EU, especially Southern Europe (Morris et al., 2006). Since 1994 the ATC countries’ combined shared of world imports has increased from 63.3% to 69.2%. The world share of clothing imports for the US and Canada increased marginally from 32.8% to 33.7% and from 2.1% to 2.3%, respectively, between 1994 and 2004 (see Annex 18). By contrast, the EU share of world clothing imports rose sharply from 28.4% to 33.2% over the same period. AGOA countries accounted for 0.30% of world clothing imports in 2000, increasing to 0.47% in 2004 (see Annex 19).
9

Given the larger share of ATC countries in world imports of clothing, these countries are relatively more important markets for exporters of clothing than for exporters of textiles.
3.3.1 The US market for textiles and clothing is growing strongly but the sources of imports are changing
US imports of T&C have grown strongly in nominal terms over the past decade. Growth in US imports of textiles during 1994-2005 was 7.8% annually in nominal dollar terms (see Annex 20). The second half of the 1990s saw changes in the source of US imports of T&C. There has been a sharp increase in Mexico’s share in US imports of textiles, from 4.8% in 1994 to 6.8% in 2005 (peaking at 10.1% in 2000). EU market share of US textiles imports has fallen from 23.2% to 12.6% over the same period. The China region (the largest supplier of textiles to the US market) increased its share of US imports from 23.2% in 1994 to 35.2% in 2005. India and Pakistan have also increased their shares of the US market while South Korea has lost market share.
US imports of clothing have grown more slowly than imports of textiles, at an average annual rate of 6.5% in nominal dollar terms between 1994 and 2005 (see Annex 22). The China region’s market share has fallen from 36.3% in 1994 to 32.2% in 2005 (but within this China’s share has increased from 15.4% to 24.0% over the same period). Mexico’s market share rose from 5.1% in 1994 to a peak of 14.3% in 1999 before dropping to 8.5% in 2005. The EU share in total US imports of clothing has also fallen from 4.9% in 1994 to 3.2% in 2005. There have also been sharp decreases in the market shares of a number of relatively high cost Asian suppliers over the period, particularly South Korea. US clothing imports (mostly incorporating US cut-to-shape pieces) from the Caribbean and Central America (the largest suppliers being Honduras, Dominican Republic and Guatemala) have remained relatively stable. This production has always benefited from close proximity to the US and the fact that duty is paid only on the value-added in the region. During the 1990s, with the advent of NAFTA and preferences under the Caribbean Basin Initiative, imports from these sources increased rapidly to a point where they rivaled, in value terms, those from East Asia.
The majority of sub-Saharan African clothing exports to the US have been via AGOA, which has been the principal mechanism stimulating and maintaining clothing production in these countries. Eligible sub-Saharan African countries have exported over 90% of their clothing to the US under AGOA. Following the introduction of AGOA in 2000, the share of AGOA countries in US clothing imports increased from 1.10% in 1999 to 2.66% in 2004 before falling to 2.07% in 2005 – see Annex 23. Imports of textiles (not covered under AGOA until 2007) from the group of countries remained largely unchanged: the AGOA share in total US textile imports was 0.18% in 1999 and 0.19% in 2004, falling to 0.16% in 2005 – see Annex 21.
10

3.3.2 The EU market for textiles and clothing is fragmented and rules of origin are a constraint
With 447 million consumers the EU is potentially over 50 percent larger than the US market. However, sales and retail channels vary by member state which makes the task of identifying potential buyers more challenging and limits the size of orders. The largest clothing markets in the EU are the UK and Germany. These are also the most price sensitive markets, dominated by large retailers requiring bulk orders of standardized products. In contrast, retail laws in southern Europe support a highly fragmented sourcing model. The relationship between retailers in the EU and suppliers is different from that between US retailers and their suppliers. EU retailers favor long-term partnerships and tend to finance on the basis of open lines of credit as opposed to US buyers who rely heavily on letters of credit (Minor, 2006).
Total (intra- plus extra-) EU imports of textiles rose from US$43 billion to US$61 billion between 1994 and 2004. Of this 68% of textile imports were accounted for by intra-EU trade in 1994, falling to 59% in 2004. Extra-EU imports of textiles grew by an average of 4.5 percent per year in nominal dollar terms over the period (see Annex 24). Behind this import growth, therefore, lies a substantial shift from intra-EU trade to imports for lower cost third-country suppliers. Turkey’s market share following the introduction of the EU-Turkey customs union (in 1996) rose from 7.1% in 1994 to 15.0% in 2004 (this remained constant in 2005). The China region also increased its share of EU textile imports from 14.0% in 1994 to 24.0% in 2004, reaching 28.7% in 2005. Among those countries that have lost market share are Switzerland, South Korea, Indonesia and the US. The AGOA group of countries has maintained EU market share, accounting for 1.26% of total extra-EU imports of textiles in 1994 and 1.25% in 2004 (see Annex 25).
Total (intra- plus extra-) EU imports of clothing rose from US$57 billion to US$100 billion between 1994 and 2004. Intra-EU imports of clothing as a proportion of the total fell from 46% to 31% over the same period with clothing imports from third-country suppliers growing by an average of 7.8% per year (see Annex 26). The China region has been the largest supplier of clothing products to the EU market: its share in total extra-EU clothing imports decreased from 31.0% in 1994 to 29.1% in 2004, but increased to 35.7% in 2005. Turkey is the second largest supplier and its share of extra-EU clothing imports has risen from 11.2% to 14.9% over the period. Romania has more than doubled its EU market share in clothing products over the past decade from 3.2% in 1994 to 7.3% in 2004. In contrast to textiles, the share of imports from AGOA countries in total extra-EU imports of clothing has fallen from 2.33% in 1994 to 1.45% in 2004 (see Annex 27). Mauritius is the largest exporter of clothing to the EU (US$687.0 million), followed by Madagascar (US$214.6 million).
Most EU clothing imports originate from integrated producers in the China region and Turkey, or from cut-make-trim operations in Morocco, Tunisia and Eastern Europe. These countries offer low cost, fast delivery, local fabrics and services such as design, while also often having preferential access to the EU market. To compete, AGOA
11

countries will have to match these advantages. To-date, the most successful sub-Saharan African exporters to the EU of T&C products have been Mauritius, Madagascar and South Africa. Mauritius and Madagascar traditionally supply the French market and South African firms typically export to the UK. All three countries have local textile producers in the knit and woven clothing sector and are capable of satisfying EU ROOs, which require the fabrics to be produced in the preference-receiving country. Many South African suppliers to the UK are full-package manufacturers and have long-established links with retailers. South African firms supply specialized clothing to the UK market, such as surgical garments, and basic fashion garments such as woolen suits and lingerie.
Exports of T&C products from AGOA countries to the EU have stagnated, despite preferences, while exports to the US have grown strongly. Exports of T&C products from AGOA countries to the EU in 2000 (US$1.7 billion) exceeded those to the US (US$1.0 billion), but by 2004 the value of exports to the US (US$2.5 billion) was 30% greater than the value of exports to the EU (US$1.8 billion).
A key factor in explaining why exports to the US have grown much faster than those to the EU is the ROOs. EU rules stipulate production from yarn, entailing (for clothing) a double transformation process that must take place in the beneficiary country with the yarn being woven into fabric and then cut into clothing. These ROOs prohibit the use of imported fabric, although cumulation provisions allow for the use of imported inputs from other ACP countries. To be eligible for preferences in the EU market, African clothing producers must use local, EU or ACP fabrics. They may not source fabrics from low-cost producers in Asia and still qualify for preferential treatment – a binding restriction since few countries in Africa can produce fabrics (of a variety and quality acceptable to EU buyers) competitively. The EU rules do not allow producers in African LDCs the flexibility they (currently) have under the US AGOA to source fabrics from anywhere.
12

4. Apparel exports from Africa under AGOA – past, present and the future
The previous section identified and explored the main patterns in world trade for textiles and clothing products and the role sub-Saharan African countries have in this. This section will focus more on the details of the performance of the export sector under AGOA, paying attention to the developments over the last decade. One of the main goals is to identify the role that unilateral trade preferences granted by developed countries can play in promoting export sectors in developing countries. As mentioned earlier, export diversification and moving into higher value added products (and away from raw materials and natural resources) is one of the main challenges faced by developing countries. As far as preferential market access programs can enhance the export promotion and diversification processes in developing countries and lead to sustainable export industries, they should be encouraged. As this section will show, the initial performance of the export sectors that targeted the US market under AGOA was remarkable. However, when the ATC quotas faced by South and East Asian countries were removed, exports in many AGOA eligible countries declined sharply. This pattern indicates the relative fragility of the apparel export industries in these countries and their over-reliance on the restrictions imposed on competing exporters from other developing countries. After presenting the main characteristics of the apparel exports to the US, a discussion of the importance of unilateral preferences and the role of the removal of the quotas on (main Asian) exporters will be discussed.
Figure 1: Apparel exports to the US ($ millions)
Source: US ITC
As Figure 1 illustrates, apparel exports from the region to the US increased rapidly after the implementation of AGOA in 2000. However, the figure also shows that only a handful of the eligible countries really took advantage of these preferences. Even though dozens of countries were eligible, over 95 percent of the apparel exports to the US are from Lesotho, Kenya, Madagascar, Mauritius, Swaziland and South Africa. Namibia,
0
100
200
300
400
500
1996 1997 1998 1999 2000 2001 2002 2003 2004 2005 2006
Botswana Kenya Lesotho Madagascar Malawi
Mauritius Namibia South Africa Swaziland
13

Malawi and Botswana export small amounts of apparel as well. Of these countries, South Africa and Mauritius were existing exporters before AGOA. In other words, AGOA really benefited Lesotho, Kenya, Madagascar and Swaziland. The vast majority of the apparel exports from these countries go to the US which implies exporters in these countries completely rely on AGOA preferences and that AGOA has failed to create strong apparel industries which can compete in other markets (such as the EU). However, as the figure shows, the growth of the apparel sector in these countries has been nothing short of spectacular, at least until 2005 when the ATC quotas were removed. Lesotho’s exports grew over 500 percent since 1996 whereas Kenya, Madagascar and Swaziland’s exports grew over ten-fold. Mauritius and South Africa also benefited from AGOA preferences. Exports from Mauritius almost doubled between 1996 and 2003 whereas South African exports increased over four-fold. However, their exports declined rapidly after 2003, especially in the case of South Africa (see Section 6.1).
Apparel exports to the US peaked in 2003 for Mauritius and South Africa and in 2004 for the other exporters. Since then, the decline in exports has been rather dramatic for some of these countries. For example, South African and Mauritian exports declined by 65 percent and 50 percent, respectively. Other countries weathered slightly better with declines ranging from 25 percent (Swaziland and Madagascar) to 15 percent in Lesotho and 5 percent in Kenya. The key question that everybody in the apparel industry in these countries asks, and that this report aims to provide predictions for, concerns the future of the sector – whether these declines are the beginning of the eventual demise of the industry or simply a wake-up call for changes to build a competitive sector.
There are several factors that will influence the long term survival of the apparel export sectors in these countries. As explained in Section 2, the nature of the global apparel industry has shifted dramatically over the last two decades. Apparel retail is dominated by chains (such as Wal Mart, Carrefour, GAP) and labels (such as Polo, Levi’s) which do not produce any of their merchandise. In many cases they design the product and outsource the production to a manufacturer. They have strict requirements for the fabric, other raw materials as well as logistics such as delivery time and schedule. Most retailers prefer to carry low inventories and require merchandise to be delivered in small quantities as they are sold. In short, exporters that can integrate themselves into the supply chains of the major retailers, deliver the products on short notice and satisfy all the requirements earn superior profits. Countries with well established textiles industries and low transportation costs have natural advantages and unfortunately this is not the case with most sub-Saharan African countries that suffer from infrastructure shortcomings and relatively underdeveloped industries. Figure 2 presents the relative prices obtained by the exporters in the US market. It is calculated by taking the ratio of export prices obtained by each country in each HS 6 digit category relative to the average US import price and then weighted by the export value from that country. As can be seen, the relative prices of exports from Mauritius are consistently above 120 percent and have actually reached 140 percent in the last two years. This indicates that exports from Mauritius sell at a higher price than average US imports in the same categories. Furthermore, despite the sharp decline in export volumes during the last three years, relative prices have increased which indicates that the exporters are moving into higher quality products. The same pattern is
14

observed in South Africa as well where the average relative prices have increased from 80 percent to 130 percent in three years – a sharp increase in the average quality of exports. Madagascar is another notable performer where the average relative prices have hovered slightly above 110 percent over the last decade. This relative performance is partly due to the role played by firms from Mauritius in this country. All other exporters have similar relative price profiles. They were between 60 and 80 percent until 2003 and increased gradually to 90 percent in 2006. This pattern indicates that the main beneficiaries of AGOA export lower quality items but have improved their quality over the last three years. These performances are more remarkable given that the average import prices in the US declined rapidly in real terms as a result of trade liberalization and increased competition among exporters.
Figure 2: Relative prices of apparel exports (weighted by export value)
Figure 3 also presents relative prices but they are weighted by total US imports in each category rather than the exports of the countries. The figure is qualitatively similar with higher quality exports from Mauritius and rapid improvement from South Africa. The main observation is that the relative prices from the exporters are much higher. For example, the average relative prices from Mauritius are close to 250 percent when weighted by total US imports rather than Mauritius exports. This indicates that the average prices (hence the quality) of exports from Mauritius are significantly higher in categories where the US imports are large relative to exports from Mauritius. In other words, Mauritius has started targeting categories where it has high quality products but small volumes. This actually bodes well for the future of the industry if they can capture a larger share of these categories and exit other categories where they have lower price/quality exports. The same pattern is observed for South Africa and Madagascar as well, but not for the other countries. In short, what is happening is that Mauritius, South Africa and Madagascar are entering new categories with higher quality products whereas the other three countries are producing slightly higher quality products in their existing categories.
60%
80%
100%
120%
140%
160%
1996 1997 1998 1999 2000 2001 2002 2003 2004 2005 2006
Kenya Lesotho Madagascar Mauritius South Africa Swaziland
15

Figure 3: Relative prices of exports (weighted by US import value)
One of the most commonly heard complaints in the African apparel sector is competition from China in their export markets especially the US. The next several figures explore the factual basis for these worries. Figure 4 presents the market shares of main exporters to the US. As clearly seen, the China region has captured significant market share from other exporters over the last several years, mostly at the expense of the preference recipients in Latin America.
Figure 4: Market shares of apparel exporters to the US
50%
100%
150%
200%
250%
1996 1997 1998 1999 2000 2001 2002 2003 2004 2005 2006
Kenya Lesotho Madagascar Mauritius South Africa Swaziland
0%
10%
20%
30%
40%
1989 1991 1993 1995 1997 1999 2001 2003 2005
Developed Countries CBI NAFTA China Region Asia Region
16

However, the rapid export surge has come at the expense of prices from the China Region as the next figure shows. Most developed country exporters, such as France and Italy, export very high quality and priced products to the US. On the other hand, the China region’s relative prices were around 110 percent as of 2000 but declined to 90 percent in 2005. This indicates that the exporters are moving into lower quality and lower margin products while all other exporters, such as Nafta and Caribbean countries are moving into higher priced categories. This pattern, as observed in several AGOA countries as well, is related to the flexible supply chain regime in the global markets. Whereas the China region is becoming a supplier of low priced products that compete mostly on price, other exporters are improving their quality and competing on rapid delivery and other product attributes.
Figure 5: Average relative prices
Key information about competition can be obtained by analyzing the market share of exporters from the China region and other countries, especially in the US market, as is presented in the Figure 6. This illustrates the market share of the China region as well as all of the previously quota facing countries in the US weighted by the exports of the AGOA countries. The reason for using these weights is to attach more importance to categories in which the AGOA countries have larger export volumes. The removal of the ATC quotas have had the expected effect with an increase in market shares since 2005. However, it should be noted that the quotas were actually being relaxed gradually over the previous decade. As a result, a large number of quotas were no longer binding and their removal would not have a significant impact on export volumes. Another point to note is that Chinese exports increase much more than the overall exports from the China region as a whole. This indicates that some exports from countries like Hong Kong moved to China after the quota removal. As of 2006, the market share of China region in export categories of AGOA countries stood at 22 percent and that of the quota countries was at 60 percent. However, the share of China region in the total US import market
17

stands at 27 percent whereas the quota countries have a total market share of 68 percent as of 2006. The difference indicates that the China region and quota countries in general have lower market shares in categories important to AGOA countries compared to the overall US market.
Figure 6: Market shares
Figure 7 presents the market share of the China region as a whole in markets of individual AGOA countries. This is a measure of which countries are more exposed to competition from exporters in the China region. As seen, there has been a sharp increase in the market share of China region after the quota removal but this was from a relatively low base. The country most exposed to competition is Madagascar, followed by Kenya. However, these levels are not higher than average China region market shares in the overall US market.
Figure 7: Market share of the China region in export categories
0%
20%
40%
60%
1996 1997 1998 1999 2000 2001 2002 2003 2004 2005 2006
China Region Quota countries
10%
15%
20%
25%
1996 1997 1998 1999 2000 2001 2002 2003 2004 2005 2006
Kenya Madagascar Mauritius South Africa SwazilandLesotho
18

The same pattern is observed with the market shares of all quota countries in the export categories of AGOA countries as presented in Figure 8. There is a sharp increase in 2005 but from a low level in each country. The country that is most exposed is Mauritius and this is likely to be due to entry into new categories as discussed earlier.
Figure 8: Market share of quota countries in export categories
An interesting picture emerges in this section on the impact of AGOA preferences and recent removal of ATC quotas faced by major exporters in South and East Asia. First, only a handful of sub-Saharan African countries truly benefited from AGOA – Kenya, Lesotho, Madagascar and Swaziland – by entering or increasing their exports in markets. However, the export growth has been remarkable. These countries mostly exported lower quality items. Mauritius and South Africa benefited as well by increasing their exports and improving their quality. The impact of ATC quota removal has been rather negative on all exporters, especially South Africa and Mauritius. Since their economies are more diversified, however, the overall impact is likely to be less severe. One response of the AGOA countries to increased competition from quota facing countries has been to move to higher priced and quality items, especially in the case of South Africa and Mauritius. The other countries improved their quality as well which is a positive sign for the future. However, sustainability of apparel as an important export sector requires decreased reliance on trade preferences and shifts to permanent sources of comparative advantage. One key issue in this regard is the creation of a regional market for production. Fortunately, the EU rules of origin allow for regional sourcing and it is possible that AGOA can be modified along these lines as well. The potential benefits of regionally integrated apparel and textiles industry and the challenges along the way are discussed in the next section.
30%
40%
50%
60%
70%
1996 1997 1998 1999 2000 2001 2002 2003 2004 2005 2006
Kenya Lesotho Madagascar Mauritius South Africa Swaziland
19

5. Vertical and regional integration in African textiles and clothing trade
5.1 The rationale for vertical and regional integration
Competition in the world market for T&C is based on price and also a whole host of other factors requiring the efficient management of both production and logistics. To compete effectively in the world market, producers of T&C must provide speed of delivery and respond quickly to frequent shifts in demand and changes in the supply chain, often arising from new retail practices and changing consumer preferences. So while comparative costs (for clothing especially those related to labor) remain important, production planning, information systems, management practices and delivery times are a key determinant of comparative advantage in T&C (Abernathy et al., 1999). Competitiveness in the T&C market is therefore being increasingly driven by the ability of producers to bring products to market just-in-time, reducing the costs faced by retailers associated with keeping inventories. The benefits of vertical (domestic) and regional integration of the T&C supply chain stem from cost reductions associated with less transport, storage, border delays, tariffs and spoilage resulting from shipping inputs and final products larger distances. Vertical integration in particular can also increase control over production and the ability to sample fabrics and clothing more quickly. For these reasons retailers are increasingly sourcing from vertically integrated companies.
While these arguments would favor the development of an fully integrated African T&C sector, to benefit from proximity to the region’s abundant supply of cotton, this has not materialized. For example, while AGOA countries are traditional suppliers of seed cotton, accounting for 4.6% of world production (see Annex 28) they have failed to become significant processors of this into T&C products, accounting for less than 1% of world exports in these products (and just three countries - Mauritius, South Africa and Lesotho - account for three-quarters of these). Similarly, domestic cotton production is a characteristic of some but not all T&C producing countries.6 Cotton can be shipped long distances and stored without significant degradation in quality and some cotton-producing countries are relatively unattractive locations for investment into manufacturing and lack workforce capabilities necessary to develop a T&C sector. The following sections examine intra-AGOA regional integration of trade in cotton, yarn, fabric and clothing in more detail.
6 For example, while China has integrated its cotton sector through textiles to clothing, supplying over 90% of its cotton lint requirements, Mexico (a much smaller cotton producer) imports virtually all of its cotton to supply the T&C sector.
20

5.2 Intra-AGOA trade in cotton, yarn, fabric and clothing
5.2.1 Cotton7
As a group AGOA countries export 83% of their cotton lint production (see Annex 29), accounting for 9% of world cotton lint exports. The largest producers in West and Central Africa export virtually all of their production i.e. Cameroon, Côte d’Ivoire and Mali. Nigeria is the only large producer of cotton lint in the region that consumes most of its production domestically (80%).
Over one-third of AGOA cotton exports go to China and the EU (see Figure 9). The US does not import cotton lint from AGOA countries (it is the largest exporter and second largest producer of cotton). While only 8% of AGOA cotton exports are to the region, half of all AGOA-imported cotton is sourced regionally (see Annex 30). South Africa imports 61% of AGOA cotton traded regionally. Mauritius imports of cotton account for a further 13% and Nigeria 9%. Almost half of intra AGOA trade in cotton is sourced from Zambia and virtually all of this is exported to South Africa.
Figure 9: Main intra- and extra-regional flows of AGOA trade in cotton(US$ millions)
Other major exporters to the region include Benin (12%, mostly to Nigeria), Malawi (8%, to South Africa and Zambia), Mozambique (6%, to South Africa) and Mali (6% to Mauritius).
7 Cotton is defined as HS5201, 5202 and 5203.
21

Most AGOA countries import more than 40% of their cotton imports from the region: Botswana (100%), Cameroon (67%), Ghana (99%), Kenya (97%), Madagascar (42%), Malawi (89%), Mali (89%), Mauritius (46%), Niger (96%), Nigeria (41%), Rwanda (99%), South Africa (51%), Swaziland (93%), Uganda (97%) and Zambia (100%).
In contrast, few countries export more than 40% of their cotton exports to the region: Madagascar (40%), Malawi (100%) and Zambia (85%).
5.2.2 Yarn8
As a group, AGOA countries are net importers of yarn (cotton and man-made) accounting for 1% of world imports in 2003. One third of AGOA yarn imports are from the EU, US and China (see Figure 10). While one-fifth of AGOA yarn exports are to the region, less than 10% of AGOA yarn imports are sourced regionally (see Annex 32). Half of AGOA yarn exports go to the EU (4% to the US and 8% to China). Mauritius’ imports of yarn from AGOA countries account for one half of intra-regional trade in these products. South African imports of yarn account for a further 19%, followed by Uganda (6%) and Kenya (4%).
Figure 10: Main intra- and extra-regional flows of AGOA trade in yarn(US$ millions)
Two-fifths of intra AGOA trade in yarn is sourced from South Africa (mostly to Mauritius but also to other AGOA countries). Other major exporters in and to the region include Zambia (30%, to South Africa, Mauritius and Malawi), Kenya (10%, mostly to Uganda but also South Africa) and Madagascar (9%, virtually all to Mauritius but also to South Africa).
8 Yarn is defined in this section as HS5204-5207, 5301-5308, 5401-5406 and 5501-5511.
22

Few AGOA countries import more than 40% of their yarn imports from the region - Botswana (47%), Niger (41%), Rwanda (54%) and Uganda (44%) - while many AGOA countries export more than 40% of their yarn exports regionally: Benin (50%), Botswana (100%), Madagascar (44%), Malawi (100%), Mauritius (57%), Rwanda (100%), Senegal (100%), Uganda (100%), and Zambia (45%).
5.2.3 Fabric9
AGOA countries are net importers of fabrics (cotton and man-made), accounting for 2% of world imports in 2003. Over half of AGOA fabric imports are from the EU, US and China (see Figure 11). While 37% of AGOA fabric exports are to the region, only 5% of AGOA fabric imports are sourced regionally (see Annex 33). One-third of AGOA fabric exports go to the EU (10% to the US, and virtually nothing to China). One-sixth of intra AGOA trade in fabric is accounted for by Mauritian imports from the region. Benin imports of fabric account for a further 15%, followed by Namibia (10%) and Malawi (6%).
Figure 11: Main intra- and extra-regional flows of AGOA trade in fabric(US$ millions)
Almost half fabric of fabric traded regionally is sourced from South Africa (mostly to Mauritius, Namibia and Malawi but also to other AGOA countries). Other major exporters in and to the region include Nigeria (13%, mostly to Benin), Côte d’Ivoire (11%, mostly to Benin but also Niger), Ghana (8%, to Nigeria and Benin) and Mauritius (7% to Madagascar and South Africa). No AGOA country imports more than 40% of its
9 Fabric is defined as HS5208-5212, 5309-531, 5407-5408, 5512-5516, chapters 56, 57, 58, 59 and 60.
23

fabric imports from the region while many export more than 40% of their fabric exports regionally: Benin (59%), Botswana (68%), Côte d’Ivoire (58%), Ghana (100%), Kenya (61%), Malawi (67%), Nigeria (100%), Rwanda (100%), Senegal (54%), Tanzania (52%), Uganda (72%) and Zambia (61%).
5.2.4 Clothing10
AGOA countries are net exporters of clothing, accounting for 1% of world exports in 2003. Almost 60% of AGOA clothing imports are from the EU, US and China (see Figure 12). Less than 5% of AGOA clothing exports are to the region, while 11% of AGOA clothing imports are sourced regionally (see Annex 34). 59% of AGOA clothing exports go to the US (34% to the EU, virtually nothing to China).
Figure 12: Main intra- and extra-regional flows of AGOA trade in clothing(US$ millions)
Nearly one-third of intra AGOA trade in clothing is accounted for by Namibian imports from the region. South African imports of clothing account for a further 19%, followed by Zambia (10%). Over one-half of intra AGOA trade in clothing is sourced from South Africa (mostly to Namibia, Zambia and Mozambique but also to other AGOA countries). Other major exporters to the region include Malawi (15%, almost exclusively to South Africa), Kenya (10%, mostly to Uganda and Tanzania), and Côte d’Ivoire (7% mostly to West and Central Africa). Only Namibia imports more than 40% of its clothing imports from the region (91%) while several AGOA countries export more than 40% of their clothing exports regionally: Benin (65%), Côte d’Ivoire (94%), Malawi (44%), Mozambique (45%), Niger (42%), Tanzania (64%) and Zambia (65%).
10 Clothing is defined as HS chapters 61, 62 and 63.
24

5.3 Constraints to vertical and regional integration
The results from the previous section suggest strongly that intra-AGOA trade in inputs required by the region’s clothing industry is low (less than 40% for fabrics and 20% for yarns – see Annex 31) and more limited for products further up the cotton-clothing value chain (yarn production is more capital intensive than fabric production). But assuming the TCF derogation under AGOA expires in 2013 and is not extended, this will require African exporters to use regionally (or US) sourced yarn and fabric to maintain AGOA-eligibility for their clothing exports to the US market. Although AGOA beneficiaries will not necessarily need to develop their own cotton, spinning, weaving, knitting, dyeing, cutting and assembly operations, they will need to source these from other AGOA countries in order for exports to qualify for preferences. And there may be potentially significant competitiveness gains from this by reducing transport and logistics costs and shortening lead times through more coordinated planning, production and shipping. This section identifies constraints to effectively integrating domestic and regional T&C production networks in the AGOA region and examines the viability of this strategy for maintaining the competitiveness of the sector.
5.3.1 Competitiveness and production capacity
Coughlin et al. (2001) propose possible supply chains for basic clothing for 11 African countries (see Table 2). They conclude that no country in the region has an absolute advantage in all stages of production and that the most competitive supply chain is a regional one.
Table 2: Potential regional supply chain for T&C for African countries
Production stage Countries CommentsSpinning Botswana Lesotho Mozambique
Mauritius Namibia South AfricaSwazilandMalawi ZambiaZimbabwe Tanzania
Must improve electricity supplyMust improve electricity supply & investment climate
Knitting Botswana LesothoMalawiMauritius Namibia South AfricaSwazilandZambia Zimbabwe
Hand & automatedHand; automated if electricity supply improvedAutomatedAutomatedHand & automated (see comments under spinning)
Weaving Botswana NamibiaLesotho Mauritius South AfricaZimbabwe Zambia Malawi
Low water usage weaving
See comments under spinningDying & finishing Lesotho Mauritius South Africa
Zimbabwe Zambia Malawi See comments under spinningBasic clothing production
Lesotho MozambiqueMalawi Zambia ZimbabweTanzania
See comments Ander spinningMust improve electricity supply
Fashion clothing production
Botswana Mauritius SwazilandNamibiaSouth Africa
Also a logistics centerHigh-end fashion products
Product design, and marketing
Mauritius South Africa
25

Source: Coughlin et al. (2001).But a major drawback with the concept of a regional supply chain for AGOA countries is that as a group, they are net importers of yarn and fabric. In 2004, imports of these products were US$3.07 billion while exports totaled US$0.58 billion. The countries, therefore, face a significant shortfall in woven fabric production to satisfy regional demand for clothing production: in 1999, total production was 345 million m2 against a consumption of 652 million m2.
Cotton and man-made fibers
Cotton is the fiber used most for textile production, and while there are abundant supplies throughout the region the main barrier to increased regional trade in cotton is transport costs due to poor infrastructure. For example, in Zambia it costs US$0.06/kg (6% of the cotton price) to transport cotton within then country (Coughlin et al., 2001). Acrylics and polyester are the most frequently used man-made fibers in the textiles sector. These are produced in the region but output falls short of demand since most firms produce for their own consumption and not for export to third-parties. And some important man-made fibers e.g. rayon are not produced at all in sub-Saharan Africa. Man-made fiber production is capital intensive and takes at least two years to establish. The main suppliers to AGOA countries are South Africa and Southeast Asia. But South Africa’s output of man-made fibers are insufficient for even its own domestic consumption. Consequently over 10 percent of man-made fiber is imported from outside the region as well as half of the man-made fabric used by the clothing industry. Limited production capacity for man-made fibers and fabric in the region is particularly severe because there has been an increase in demand for synthetic fibers by the AGOA clothing industry due to fashion requirements in the West and the US duty structure. Under AGOA, US imports of clothing made from synthetics (with tariffs peaking at 32 percent) attract a higher margin of preference than for cotton clothing (peaking at 17 percent).11 EU tariffs on clothing made from man-made fibers and cotton are similar so preferences in the EU market do not confer the same opportunity (Minor et al, 2004). Since most AGOA countries lack domestic supplies of man-made yarns and fabrics, firms exporting clothing made from such materials currently import these inputs from outside the region, mostly Asia. Under AGOA, this may no longer be possible when the TCF derogation expires in 2013.
Yarn
Yarn production in the region is balanced with current demand. The main countries in the region from which cotton and polycotton yarns can be currently sourced are Botswana, Lesotho, Mauritius, South Africa, Uganda and Zambia (de Voest, 2006). These countries have a combined production capacity of 60,000-70,000 tons. There are also integrated spinning mills in DR Congo, Ethiopia, Kenya, Madagascar, Malawi, Tanzania and Nambia but these generally supply their own knitting and weaving functions. A large 11 Although the effective rate of protection for AGOA countries is actually higher than the nominal tariff rate suggests. Given that lesser developed AGOA countries can import fabric from third countries, the effective preference AGOA provides relative to Asian competitors is between 27-84%, depending on the product (Kaplinsky and Morris, 2006).
26

increase in production would be required to enable the region to export more under AGOA if the TCF derogation expires in 2013 but the potential to install new capacity is constrained by the high capital requirement. Some authors have suggested that unused capacity does exist for producing textiles in the region. There are currently idle plants in Zambia, Mozambique, Malawi and Tanzania (Coughlin et al., 2001). The synthetic yarn spinning industry in the region is particularly small. There are only 5 mills in South Africa where yarns manufactured from polyester, viscose and polyviscose could be sourced.
Knitted Fabric
While knitted fabrics can be sourced from a number of countries in Africa, production is mostly integrated vertically into clothing production (especially in Namibia, Swaziland and Tanzania) so there is insufficient supply to satisfy the entire region’s knit clothing requirements. And as with yarn production, the volume of synthetic knit fabrics is less than that for cotton fabrics. Knit fabrics can be currently sourced from Botswana, Kenya, Uganda, Mauritius and South Africa, of which 25,000-30,000 tons of fabric could be made available to export to third parties in the region (de Voest, 2006).
Denim Fabric
Among AGOA countries, denim mills are located in Lesotho, South Africa and Mauritius. While denim has been determined by AGOA IV to be in abundant supply (and consequently clothing made from this will not be eligible for the TCF derogation post-2009 unless all regional supplies can be demonstrated to be exhausted) the region has lost significant production capacity since 2004. Firm closures have reduced output by 2.5-3.0 million linear meters, leaving the denim firms that remain with a combined capacity of 5.0-5.5 million linear meters per month (de Voest, 2006). If all denim is to be sourced from the region, supply will fall short of regional demand in the absence of new investment.12
5.3.2 Quality and service delivery
Quality is important for both textiles (as inputs) and (final) clothing products. For finished products, the international benchmark for returns is 1.5% of total sales and for rejects is below 5%. While T&C firms in most African countries are competitive in terms of quality, a key constraint is whether regional sourcing of raw materials, including fibers, yarns, fabrics and trims, are approved by buyers and retailers. In order to gain approval, firms must lobby buyers and be able to provide samples quickly. This implies that market access, although important, is not sufficient to make sales. Major brand and retail buyers often specify the firms from which fabric is to be supplied. If a buyer does not prequalify a particular plant, a country’s access to potential clothing customers will be severely limited (Minor, 2006). Market information is also an important component of
12 In the production of denim clothing, Lesotho consumes 2.7 million lm/month and Kenya 1.1 million lm/month. Only 1.5 million lm/month would therefore be available to supply jean manufacturers in Mauritius, Madagascar, South Africa and Swaziland.
27

regional integration: buyers and clothing manufacturers need to be familiar with fabric knitters and yarn spinners in the region in order to inform their sourcing decisions.
Since the phase-out of quotas on international trade in T&C, retailers are taking advantage of the increased flexibility and have reduced the number of companies from which they source. Retailers are increasingly buying from firms with the ability to provide a wide range of services such as financing, lean production techniques and with sample and design capabilities. This means that African clothing producers are facing an increasingly challenging market. The rise of buyer-driven supply chains in the T&C sector, where retailers entirely outsource production, is increasingly requiring suppliers of clothing to take responsibility for yarn and fabric sourcing, design, inventory management, product development and sample making. This has a number of implications. First barriers to entry are increasing. Firms can only integrate into global supply chains if they can provide the services buyers and retailers are demanding. Secondly, transactions costs for buyers wanting to change suppliers are higher since they must evaluate firms on the basis of their ability to supply these services in addition to the cost and quality of their basic manufacturing output. This implies fewer opportunities for producers wishing to enter the export market or expand their sales to more buyers.
5.3.3 Lead times
Lead times are those required for a company to produce yarn, fabric or clothing and have it delivered. A general perception among clothing producers in sub-Saharan Africa is that lead times for yarns and fabric are too long compared to sourcing these inputs from Asia. However there may be a misunderstanding comparing shipping times from Asia with manufacturing and transport time from the region. For example, a fabric factory based in Lesotho will have a delivery advantage of 25 days when compared to sourcing fabric from Asia (de Voest, 2006) but because Western buyers have established relationships with fabric suppliers in Asia, the textiles mills there are better prepared to produce fabrics to the specifications required and can manufacture more quickly. Lead times throughout the supply chain are more important for some final clothing products than for others. Weil (2006) shows that for fashion products with limited prospects for stock replenishment, such as dresses and blouses, traditional costs factors related to labor, inputs and tariffs continue to determine where these products, and the yarns and fabrics used to produce them, are sourced. But for clothing in which retailers seek continuous stock replenishment throughout the year, for example jeans and T-shirts, traditional costs are increasingly being balanced with lead times and the associated costs of keeping inventories. Consequently vertical and regional integration of T&C industries, as well as proximity to clothing importers in western markets, is important to the extent that lead times can be reduced.
While reduced lead times are a potential advantage of regional integration, transport is costly in African countries (see Section 5.3.4) and shipments often suffer from delays. A number of factors in Sub-Saharan Africa adversely affect intra-regional delivery times: port congestion; lack of feeder roads to ports; weak transport infrastructure; and, lengthy customs procedures. Retailers expect over 95% of deliveries to arrive on time and impose
28

heavy penalties for delays, as much as 1% of the product price per day of late delivery. Coughlin et al. (2001) in a study of the SADC T&C sector find that few textile manufacturers are meeting this benchmark. And while the textile industry’s delivery times are poor for international orders, they find that they are worse for domestic deliveries. Only manufacturers in Botswana, Mauritius, Namibia and Lesotho were found to deliver consistently on-time. Complex and time-consuming procedures for import and export in the region are partly to blame. Annex 35 illustrates the time that is required to satisfy import and export procedures. On average it takes 39.6 days to export a consignment from an AGOA country, versus a global average of 27.6 days. For imports, it takes on average 51.2 days to fulfill administrative procedures for a consignment entering an AGOA country versus an average of 34.5 days for the world as a whole. Customs clearance is often a lengthy process. For example, South Africa has placed imported fabric on a high-risk list of products that should be inspected in transit to other countries in the region. In Zambia border delays are common at Chirundu where trucks can wait for 2-4 days. And at Lusaka airport, shipment clearance may take up to 4 days (World Bank, 2005). The costs of these delays in importing and exporting have been estimated at 0.5-1.0 percentage points of ad valorem tariff per day of delay (Hummels, 2001). AGOA countries, especially those that are least developed, face much higher trade-related costs. Sometimes this is a reflection of weak institutions within the countries themselves such as inefficient customs procedures, which could be corrected with policy changes. Since customs inspections mainly occur to prevent fraud, two ways to reduce the need for them are: i) the reduction of harmonization of tariffs (on all goods, not just T&C); and, ii) the use of sophisticated risk analysis coupled with random inspections.
5.3.4 Costs of production
Wages are a major cost component for clothing production because the sector is labor intensive. Wage costs and productivity vary among the AGOA countries (see Table 3). Productivity and labor cost comparisons (see Coughlin et al., 2001) have shown that manufacturers in many AGOA countries can be competitive with suppliers in Asia. There are two notable exceptions: Botswana and South Africa, both with high unit costs for clothing assembly. Before the phase-out of quotas under the ATC, duty-free privileges under the ACP/Cotonou Agreement and AGOA gave African suppliers a cost advantage of 30% over South Asia and 45% over China. All countries were, therefore, potentially competitive with China and all but South Africa were potentially competitive with India. Following the expiration of the ATC, and with it the quotas set for trade in T&C, the only advantage AGOA countries have over India and China are duties, which average about 20%. Consequently, based on labor costs and productivity comparisons, South Africa is no longer competitive with China and India and Botswana has lost its competitive advantage over India.
29

Table 3: Wage costs in the T&C sector among selected African countries
Labor costNew hire
US$/month
Labor cost5 years experience
US$/month
Minimum wage
US$/monthBotswana 100.00 178.00 n.a.Ethiopia n.a. n.a. 25-30Kenya n.a. n.a. 100-110Lesotho 69.00 105.00 n.a.Madagascar n.a. n.a. 35-40Malawi 19.50 32.00 n.a.Mauritius 66.15 149.75 170-190Mozambique 36.00 44.00 n.a.Namibia 101.56 234.00 n.a.South Africa 213.00 283.00 n.a.Swaziland 93.46 117.26 n.a.Tanzania 61.50 82.14 n.a.Uganda n.a. n.a. 60-70Zambia 49.86 70.98 n.a.Zimbabwe 70.00 89.67 n.a.Source: Compiled from Coughlin et al. (2001) and Bedi (2006).
Improving labor productivity is therefore an important means to raise the industry’s competitiveness. Paying workers per unit assembled is a recognized way of increasing labor productivity in clothing manufacturing. It is common practice in the clothing sector in high productivity countries such as the US and Asia. In Mauritius, one of the higher productivity counties in the region, most clothing firms pay their workers on a piece-rate basis. In other countries this is less common as most have labor regulations and union prohibitions against piece rates (Coughlin et al., 2001). Hiring and firing costs in most AGOA countries are comparable to those within major competitors in the global clothing market. However there are some notable exceptions. Firing workers is particularly burdensome for firms in Zambia, Sierra Leone, Mozambique, Malawi and Ghana (see Annex 35). In Zambia, for example, labor laws enforce high terminal benefits for employees. These consist of 2-3 months salary, which imposes a large burden on firms. This results in firms being unable to afford to let go of unproductive workers and also surpresses salaries (Chikosi et al., 2005). Another important factor is the cost of energy, particularly for the production of fabric and, especially, yarn which are both capital intensive. The main sources of energy used by the T&C industries are electricity for lighting and operating machinery and fuel oil (or coal) to produce steam. Diesel is mainly used for transportation. Fuel oil consumption is greatest in the dyeing and fabric finishing industries. Electricity costs vary widely in the region (see Table 4). Electricity in the highest cost country, Tanzania, is 6.6 times the price of that in the lowest cost country, South Africa (US$0.04/Kwh). In Kenya,
30

electricity is 2.75-4.75 times more than that in South Africa (LLC, 2004a). Manufacturers in China pay US$0.05 per kWh.
Table 4: Electricity costs among selected countries
Electricity costUS$/kWh if factory works 48hrs/week
Electricity costUS$/kWh if factory works 168hrs/week
Botswana 0.053 0.032China 0.05Ethiopia 0.05-0.07Kenya 0.08-0.09Lesotho n.a. 0.067Madagascar 0.06Malawi n.a. 0.050Mauritius 0.063 0.052Mozambique 0.045 0.032Namibia n.a. 0.044South Africa 0.032 0.031South Korea 0.06-0.08Swaziland 0.056 0.031Taiwan, China 0.06-0.08Tanzania n.a. 0.206Uganda 0.03-0.05Zambia 0.055 0.035Zimbabwe n.a. 0.051Source: Compiled from Coughlin et al. (2001) and Bedi (2006).
Electricity costs vary, in part, due to the different taxes countries charge on the fuel used for generation. For example, in Madagascar the T&C sector is the largest consumer of electricity in the country, accounting for 15% of total costs in textile production and 4-7% in clothing. Electricity costs in Madagascar are US$0.06-0.08/kwH, almost twice that paid in South Africa. Salinger (2003) highlights that the national electricity company JIRAMA generates half of Madagascar’s electricity by purchasing diesel from the national refinery, Galana, at a price that includes VAT (20%), road tax (5%) and a petroleum products tax (6%). Mauritius, by contrast, is able to import fuel from Galana without charging taxes to its industrial consumers.
Reliability of electricity service is as important as it cost. The loss in production time and output from outages, the loss of equipment from power surges and the efficiency loss caused by interruption and uncertainty constitute severe competitive disadvantages. Interruptions in supply are particular disruptive to dyeing and washing operations. In countries where interruptions in supply are common firms often rely on back-up generators. The need for these adds to energy costs. In Zambia, for example, firms recorded an average of 37.2 power outages in 2004. The percentage of production lost in Zambia due to these outages is very high at 4.5-5.6 percent of output (Chikosi et al., 2005). More than a third of all firms and over 60 percent of large enterprises have generators. And in Kenya, where the electricity network is predominatly hydro-based exposing the country to power shortages in times of drought, the electric utilities are also
31

subject to considerable inefficiencies. Power losses in transmission and distribution average 21 percent of total energy produced. In 2002, Kenyan firms experienced 33 outages losing 9 percent of their production as a result. To cope with frequent outages, 70 percent of Kenyan firms own a generator to produce on average 14.5 percent of their energy requirements (Blattman et al., 2004). South Africa has one of the most efficient and reliable power grids in the world. Integration of neighboring countries with this power grid could allow the T&C industry in these countries access to cheap and reliable sources of energy.
For some countries packaging costs are also high. In 2003 Lesotho introduced VAT on these inputs. This dramatically changed sourcing in the clothing industry and increased costs. Given that the sector is mostly cut-make-trim, raw materials such as packaging materials, labels, plastics and threads were once sourced domestically. Following the introduction of VAT, however, local sourcing has virtually been eliminated since clothing manufacturers now import from South Africa to avoid paying the tax. In principle, VAT is refunded on exported products, but clothing manufacturers have complained about delays in obtaining refunds. Between July 2003 and January 2004, less than 30% of VAT paid by exporters in the sector had been refunded (LLC, 2004).
International freight costs have risen by a third over the last few years due to increased demand by China for imports of raw materials and increases in fuel costs. Examples of shipping costs are illustrated in Table 5. The cost of road transport is particularly high in the region. Whereas cheaper rail transport can be used, it can take up to 7 days longer to deliver goods than via road. Consequently road transport has become the preferred mode and for some countries (e.g. Zambia) it costs more to send a container to the nearest port (Dar es Salaam) than from the port to the Far East.
Table 5: Freight costs among selected countries
Container size From/to Cost (US$)By sea
40 feet China/South Africa 3,00040 feet India/Mauritius 2,20020 feet Mauritius/South Africa 70040 feet Dar es Dalaam/Far East 2,00040 feet Tanzania/South Africa 1,900
By road40 feet Ndola/Dar es Salaam 4,00040 feet South Africa/Lesotho 2,50040 feet South Africa/Lesotho 3,06540 feet South Africa/Lesotho 1,95040 feet Arusha/Dar es Salaam 1,50040 feet Kenya to Kenyan port 350-1,80040 feet Uganda to Ugandan port 4,500-5,00040 feet Ethiopia to Ethiopian port 4,500-5,00040 feet Mauritius to Mauritian port 1,000
By rail40 feet Kenya to Kenyan port 1,500Source: Compiled from de Voest (2006) and Bedi (2006).
32

Some countries are also disadvantaged, vis-à-vis Asian competitors, because of costs related to water and telecommunications (see Table 6).
Table 6: Water and telecommunications costs among selected countries
Water cost
US$/m3
Local phone call
US$/3 min.
Phone call to the US
US$/3 min.
Internet monthly service chargeUS$
Internet phone useUS$/min.
Botswana 0.614 0.02 3.6 14.7 0.14Kenya 0.43 0.04 7.35 65.6 0.46Lesotho 0.420 0.01 n.a. 12.3 0.17Madagascar 0.34 0.08 8.98 66.5 0.44Malawi n.a. n.a. n.a. n.a. n.a.Mauritius 0.29 0.03 4 22.9 0.38Mozambique n.a. n.a. n.a. n.a. n.a.Namibia 0.632 n.a. n.a. n.a. n.a.Sri Lanka 0.36 0.04 3.05 6.5 0.05South Africa n.a. 0.09 1.98 8.5 0.33Swaziland 0.490 n.a. n.a. n.a. n.a.Tanzania n.a. n.a. n.a. n.a. n.a.Zambia n.a. n.a. n.a. n.a. n.a.Zimbabwe n.a. n.a. n.a. n.a. n.a.Source: Compiled from Coughlin et al. (2001) and Maminirinarivo (2006).
5.3.5 Rules of origin
Though regional trade agreements such as the SADC Trade Protocol and COMESA have promoted intra-regional trade, the slow pace of liberalization and restrictive ROOs have hampered the development of the region’s T&C industry. ROOs are used in preferential trade arrangements (PTAs) to ensure that goods claiming tariff preferences in importing markets originate from an eligible exporting country in order to prevent trade deflection. The basis for ROOs in most PTAs is the definition of a minimum level of processing or manufacturing that is required to confer originating status to the exporting country. Other purposes for which ROOs are used are protective to limit import competition arising from the formation of a PTA.
ROOs restrict producer access to inputs from the lowest-cost source and therefore raise the costs of producing goods for export. This, in turn, reduces the ability of producers to utilize preferences and reduces regional trade. ROOs encourage producers to use domestically or regionally sourced inputs, thus providing protection to the producers of such inputs. The burden of ROOs is borne in the form of higher downstream costs, making final goods more expensive and less competitive internationally.
Five preferential trade arrangements, all with different ROOs, affect the pattern of trade in T&C products among Southern African countries. The ACP/Cotonou Agreement, the
33

EU-South Africa Free Trade Agreement and the SADC Trade Protocol all contain fabric-forward provisions for clothing. COMESA’s free trade area uses a minimum percentage value-added ROO and the US AGOA use a yarn-forward ROO.
While most trade covered by these agreements is in clothing, it is the sourcing of yarn and fabrics that is the most important issue. Unlike the production of clothing which is labor intensive, the manufacture of fabric, and especially yarn, is highly capital intensive requiring abundant supplies of water, cheap and reliable power and skilled labor. Consequently the expansion of clothing industries in African countries, many which lack the capital and infrastructure to develop domestic yarn and fabric manufacturing facilities, is often dependent on imports of these products from already established producers outside the region. But preference-giving countries are concerned that without appropriate ROOs for preferential clothing imports, trade preferences may result in trade deflection providing substantial benefits to third-country textile manufacturers.
ROOs for T&C under the ACP/Cotonou Agreement
The ACP/Cotonou Agreement has a double transformation ROO, which prevents ACP clothing manufacturers from utilizing Asian fabric in the production of clothing that can be exported to the EU under preference. Yarn, however, can be sourced from anywhere without compromising the preferential status of the final clothing product as long as imported inputs from any country do not exceed a maximum of 15% of the ex-works price. In Mauritius, the effect has been to encourage the creation of fabric production (but not yarn production) and this remains the only African country to make substantial use of clothing preferences in the EU market. The ACP/Cotonou Agreement provides for horizontal and diagonal cumulation in its ROOs. Diagonal cumulation refers to South Africa, SACU and a ‘neighboring developing country, other than an ACP state, belonging to a coherent geographical entity’. However there are three factors that make the application of diagonal cumulation unlikely. First, diagonal cumulation is conditional upon conclusion of administrative cooperation agreements which to-date have not been completed. Secondly there is a long list of product exemptions with detailed conditions applicable to each. Thirdly, the value-added in the ACP country must exceed the value of the imported inputs.
ROOs for T&C under the EU GSP
While all ACP countries can export to the EU market under the ACP/Cotonou Agreement, ACP LDCs can also export under the Everything but Arms Initiative (EBA) and ACP-non-LDCs can export under the EU’s GSP. EBA is governed by the ROOs of the EU’s GSP in which it is embedded. ROOs under EBA are more difficult to meet than those under the ACP/Cotonou Agreement (Brenton, 2003). First, imported inputs from any country cannot exceed a maximum of 10% of the ex-works price (the limit is 15% under the ACP/Cotonou Agreement). Secondly, while the level of processing required under both arrangements is the same (double transformation), diagonal cumulation can only occur under the EU’s GSP between four regional groups: ASEAN, CACM, the Andean Community and SAARC. Consequently, cumulation under EBA can only take
34

place between a few Asian LDCs: Cambodia and Laos (in ASEAN) and Bangladesh, Bhutan. Maldives and Nepal (in SAARC). Under the ACP/Cotonou Agreement full cumulation is provided for among ACP countries. Thirdly, under EBA cumulation is limited by the requirement that the value-added in the final production location exceed the highest customs value of any inputs used from countries in the regional group. Under the ACP/Cotonou Agreement there is no such requirement.
ROOs for T&C under the US AGOA
The general features of AGOA ROOs are as follows. First, in order to be eligible for preferences a product must be exported directly from an AGOA beneficiary country to the US. Secondly, goods must be ‘growth, product or manufacture’ from one or more AGOA beneficiary countries. Thirdly, products may incorporate inputs sourced from third countries provided that the value-added in the AGOA country (or countries) exceeds 35% of the product’s value at the US port of entry. Up to 15% of the 35% value may consist of inputs originating from the US.
AGOA ROOs differ across two types of products: non-clothing exports and clothing exports (Mattoo, et al., 2002). For non-clothing products, duty-free treatment is given to any product that meets the ROOs of the ordinary US GSP (the main requirement is the 35% value-added rule). For clothing (see section 2.4) AGOA ROOs require that these products be assembled in eligible AGOA countries and that the yarn and fabric be made either in the US or in AGOA countries. Clothing imports manufactured from regional fabric are subject to a percentage limit in total US clothing imports.13 For lesser developed countries there is a special derogation (lasting until 2013) allowing the utilization of third-country fabric for the manufacture of AGOA-eligible clothing exports, as long as (from 2007) this is not determined to be in abundant regional supply. The yarn-forward ROO under AGOA was ostensibly designed to promote the development of an African yarn and fabric industry. The TCF derogation provided to lesser developed countries, allowing for single transformation without compromising the AGOA-eligibility of the final clothing product, was intended to give these countries time to develop new textiles capacity. Unfortunately this has not happened. A notable difference between the ROOs for clothing under AGOA and those under the ACP/Cotonou Agreement is the concept of double transformation. Under the ACP/Cotonou Agreement, yarn can be sourced from anywhere in the world whereas under AGOA the yarn must come from an AGOA country or from the US.
ROOs for T&C under SADC
The liberalization of intra-SADC trade in T&C has been slow. Most non-SACU countries have postponed significant tariff reductions while SACU delayed full liberalization on SADC imports of textiles until 2005 and even later in the case of clothing. Many SADC countries apply high MFN tariff rates on imports of T&C so duty-free intra-SADC trade would confer high margins of preference. The SADC Trade Protocol has a double
13 1.5% of total US clothing imports, growing to 3.5% of total clothing imports over an 8 year period. AGOA II doubled the applicable percentage of this limit.
35

transformation ROO for clothing: products must be made from regionally-produced fabrics and yarns. Within SADC the most important clothing market is South Africa, which is also the region’s largest producer of T&C (see Section 4.1). While SADC ROOs are less restrictive than the standard AGOA ROO for clothing products, they remain difficult to satisfy for most regional clothing producers. Consequently SADC ROOs effectively prevent most countries in the region, except for SACU members, from exporting clothing to South Africa. SACU has granted the LDCs in SADC – Malawi, Mozambique, Tanzania and Zambia – a temporary exemption (until July 2006) as long as these products have undergone single transformation. But preferential imports from these countries are restricted by quotas for yarn and fabric. The annual preferential quota is zero for fabric made from filament yarn; 433 tons for yarn and fabric produced from man-made staple fiber; and, 7610 tons for cotton yarn and fabric. This equates to less than 5 percent of South Africa’s output in the sector (Coughlin et al., 2001). The single transformation rule, therefore, applies in practice only to simple garments and made-up textile products such as blankets, bedsheets and tenting, and then only to small amounts. The quotas are very restrictive such that existing firms exhaust them, reducing the incentive for investment in increased production capacity. South Africa’s stated rationale for double transformation ROOs is to encourage regional sourcing of T&C. But within SADC there is little evidence of this. Clothing producers in South Africa primarily supply the domestic market and use imported yarns and fabrics from the Far East since many fabrics used by South African clothing producers are not produced by textile producers in SADC. Another reason for South Africa’s support of the double transformation ROO is to protect its domestic T&C sectors. South Africa currently imposes tariffs in excess of 20 percent on imports of woven and knitted textiles from Asia. This, in turn, imposes a large cost on the South African clothing sector. Currently South African clothing producers are compensated for these costs by selling to the domestic market in which there are import duties of 40 percent or more on clothing. In export markets they are compensated by duty credit certificates. With duty-free intra-SADC trade, and under a single transformation ROO, non-SACU countries with low MFN tariffs on imports of yarns and fabrics from Asia would have preferential access to the protected South African market, undermining South Africa’s clothing industry (Flatters, 2004).
5.3.6 Other policy constraints
There are a number of constraints relating to policy that must be changed to facilitate regional integration of the T&C industry in sub-Saharan Africa. The most common problems are: i) the non-existence of provisions or unnecessary limitations on EPZs; ii) the failure to rebate, suspend or eliminate tariffs and VAT on (imported) inputs; and, iii) the lack of a level playing field in the world market for T&C.
African producers of clothing need to import a wide range of intermediary inputs, including fabrics and yarns. Textile producers often import supplies of cotton and man-made-fibers to spin yarn which is then knitted into fabric. For many African countries imports of textiles, in particular, are subject to high import tariffs thereby increasing the costs faced by clothing producers and undermining the competitiveness of both actual and potential exporters. The average import tariff imposed by AGOA countries on
36

textiles is 17.8% (see Annex 2). While duty drawback schemes exist for exports in these countries, they are often poorly implemented and costly for firms to administer involving long delays in reimbursement. In Zambia, for example, reimbursements take 3 months at a minimum. Some exporters have reported delays of 6-9 months (World Bank, 2005).
Whereas some countries in the region (Tanzania, Zambia, Lesotho and South Africa) have free-functioning EPZs, others impose restrictions. For example, Malawi prohibits EPZ firms from selling domestically, whereas most countries allow a tolerance of 15-20% of output to be sold on the domestic market (once duties and taxes have been paid on these sales). Prohibitions on domestic sales ignore a key characteristics of the T&C sectors, namely that they always produce overruns and seconds which in most cases can only be sold locally.
There are also policy issues in major competitor countries, such as India and China. While tax rates on company profits (which average 51.5% in AGOA countries) are comparable with those faced by firms in competitor countries (see Annex 35), there are accusations that there is no level playing field in the global market for T&C. India and China provide subsidies to cotton production and their T&C sectors. The Indian textile industry up-gradation fund offers soft loans (20 years) with subsidized interest rates (reduced by 5%) and a capital subsidy of 10%. China’s currency is undervalued and the Government provides export incentives and subsidizes both cotton production and bank loans to the T&C industry. There is also suspicion of fraud in the valuation of imports from China. Denim trousers have imported to South Africa at a price of 2 Rand/pair; impossible given the shipping costs from the Far East. And there are complaints that African countries are being targeted to dump overruns and distressed T&C products from China (merchandise that Western retailers reject). In South Africa, for example, the average price of clothing imports is US$1.11 per piece versus US$3.35 in the US.
37

6. The textiles and clothing sector in selected African countries
The previous sections identified patterns and constraints to sub-Saharan African trade in T&C products at both the multilateral and regional levels. This section analyzes the structure of T&C in the main apparel exporting countries in sub-Saharan Africa and pays close attention to the challenges faced by the sector in each.
Trade preferences granted by developed country markets and the trade policies of African countries themselves have been the most important factors influencing the development of the T&C sector in Africa. Mauritius, for example, developed a successful clothing sector based on preferential access to the EU market while T&C production in countries such as South Africa, Kenya, Madagascar, Zambia and (non-AGOA) Zimbabwe were originally established as import substitution industries. Under sanctions South Africa and Zimbabwe developed large T&C sectors. Zimbabwe remains one of the largest cotton producers in the region and South Africa produces nearly all the synthetic fiber in the region. During apartheid, South Africa influenced the pattern of production in SACU. Under sanctions, a number of South African firms relocated to Lesotho. Botswana, which has always maintained a greater degree of independence, also succeeded in developing a T&C sector during this period while Namibia, which remained under South African control until 1990, had no T&C sector until recently. Elsewhere in the region, Mozambique and Angola were affected by civil wars that adversely affected their industrial base. Only two other countries, Tanzania and Zambia, had meaningful production capacity in both T&C, focusing on supplying their domestic markets (mainly, for landlocked Zambia, due to high transport costs). But years of state ownership resulted in poor production efficiency and low capacity utilization while imports of second-hand clothing reduced both the domestic demand for new clothing and the textiles base to produce them.
Most African countries have low-priced labor favoring competitiveness in clothing manufacturing. Those countries where labor is more expensive (South Africa, Mauritius) have more sophisticated, high precision clothing factories better suited to producing designs for the high end of the market. But the T&C sector in Africa does have some important weaknesses. First, while many countries can produce cotton competitively, trade barriers (especially to countries outside regional trade agreements) and high transport costs reduce this advantage. Secondly, lack of capital appears to be an important constraint in increasing production of textiles and improving capacity since countries vary greatly in their ability to attract FDI (Darga, 2004). Thirdly, while some countries in the region have significant spare textile production capacity, enough to produce an additional 179 million square meters of fabric (Coughlin et al., 2001), South Africa remains the sole producer of man-made fibers in the region. South Africa, therefore, is key for regional integration of the African T&C industry because of its production capacity (especially in textiles), capital, know-how, design skills and established links to retailers. But its trade relations are influenced by strong, and often conflicting, protectionist interests in its textiles and clothing industries, supported by the trade unions. ROOs are among the key tools South Africa uses to restrict regional imports of T&C.
38
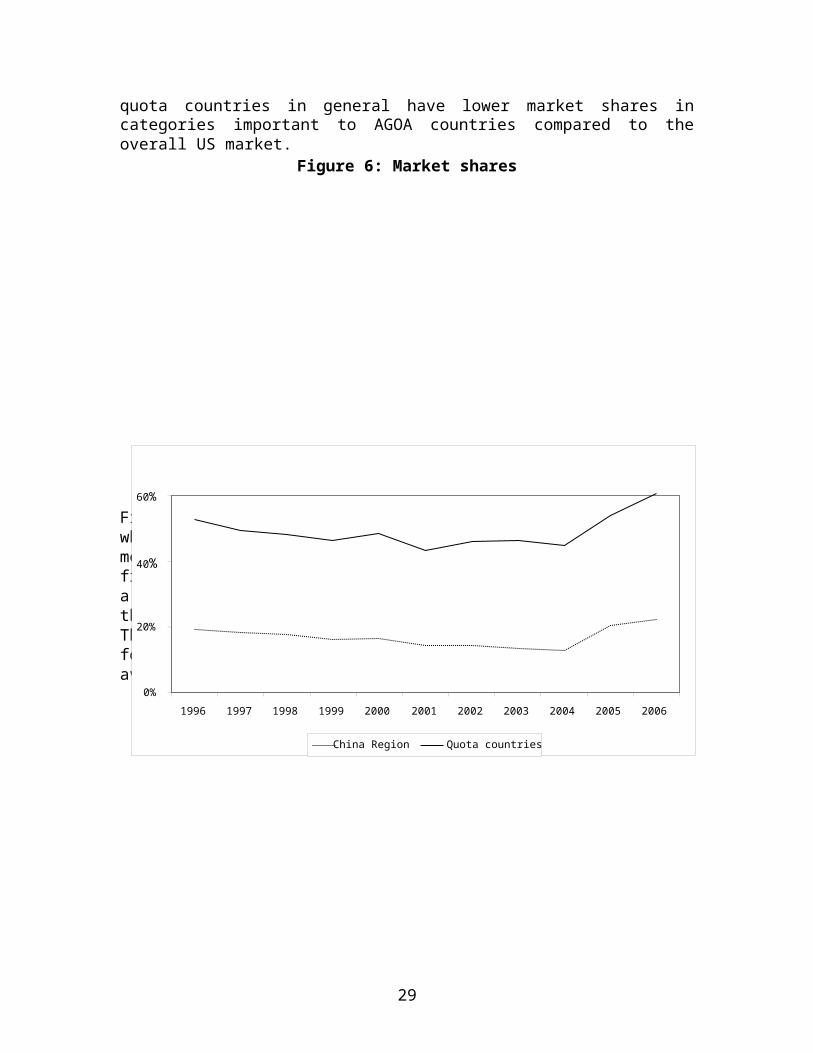
Among all African countries, the T&C sector represents more than 10% of manufacturing employment in Tanzania, South Africa, Zimbabwe, Botswana, Mauritius and Lesotho. But there are wide variations both in the size and structure of the T&C sector between countries. The following sections examine some of these differences by exploring the T&C sectors in six AGOA countries:
1) South Africa - with the largest T&C sector in Africa, supplying mostly to its large domestic market;
2) Mauritius - an island economy with the most developed, export-orientated clothing sector in Africa;
3) Madagascar – the third largest exporter of clothing under AGOA whose success has been linked to Mauritian companies relocating their T&C operations;
4) Lesotho – the largest exporter of clothing under AGOA;
5) Kenya - the second largest exporter of clothing under AGOA and with a clothing industry completely dependent on imports of third country fabric;
6) Zambia – a Least Developed, landlocked economy where freight costs largely prohibit clothing production for export.
6.1 South AfricaSouth Africa has the largest T&C sector of all AGOA countries with a turnover of US$2.0 billion (see Coughlin et al., 2001) comprising 1,600 firms producing mostly for domestic consumption. Production is split almost evenly between textiles and clothing, but in total sales only 18.7% of textiles output and 9.4% of clothing output are exported (Vlok, 2006). Despite having a high endowment of capital, and a relatively high cost of labor, the T&C industry remains a significant source of employment in South Africa and is concentrated in the Western Cape, KwaZulu-Natal, the Free State and Gauteng provinces. Combined the T&C sectors employ over 250,000 people (EIU, 2006c). The clothing sector reached its peak two decades ago when it employed 100,000 workers. Currently it employs 42,000-45,000 people. Three distinct phases in the development of the T&C industry in South Africa can be identified (Vlok, 2006). Under apartheid the T&C industry developed under protective import substitution policies. This resulted in a concentration of production on low-value products but also generated inefficiencies and, with them, the failure of the industry to compete successfully on world markets. With the end of apartheid, South Africa began to open its market to imports following its accession to the WTO in 1994. At the time, the Rand was depreciating which, combined with an export incentive scheme (the Duty Credit Certificate), allowed the T&C industry to rapidly increase sales abroad while remaining competitive against imports (despite lower tariffs). But beginning in 2002, the value of the Rand appreciated substantially offsetting the previous gain in exports. This combined with the substantial trade liberalization in the decade following South Africa’s accession to the WTO also led to rapid increases in
39

T&C imports, particularly from China. Consequently there was a dramatic decline in the South African clothing sector. Almost 55,000 jobs have been lost since 2003. Many of these have occurred in rural areas, where wages are lowest and unemployment is already very high.
South Africa produces one-quarter of its domestic cotton requirements (65,000-70,000 tons of seed cotton per year). Cotton production is more limited than in neighboring countries because the climate for cultivating cotton is not as ideal and low world cotton prices have encouraged farmers to diversify into more profitable crops. The bulk of South African cotton imports originate from Zimbabwe, Zambia and Malawi. There is no tariff on intra-SADC imports of cotton but South Africa does impose a duty of 1.6 Rand/kg on third-country cotton imports. This cost is faced by those spinners in South Africa that require long staple varieties of cotton, from Egypt for example, not grown in the region. Nylon, synthetic and polyester fibers and polyester filament yarn are produced in South Africa in quantities sufficient to supply 90% of domestic demand. But acrylic fibers and specialty types of synthetic fiber (e.g. flame retardant) are imported. South Africa is also a large producer of wool (90,000 tons per year), the bulk of which is exported to Korea, Italy and Germany.
Spinning, weaving, knitting and dyeing operations are highly developed in South Africa but the import substitution policies under apartheid have left many segments of the textile industry uncompetitive (Salinger et al., 1998). While there has been significant trade liberalization (prior to 1994, tariffs on imports of T&C were over 100%) South Africa’s T&C sector remains heavily protected and regulated at all stages in the supply chain. Tariffs are high and there is tariff escalation, with tariff rates of 10-18 percent for yarn, 20-22 percent for fabric and 40 percent for clothing. The structure of protection has maintained the focus on supplying the domestic market.
While retail sales of clothing in South Africa have grown by over 40% in the last five years, domestic clothing production has declined. The industry has failed to maintain sales in the face of increased import competition following trade liberalization, currency appreciation and the increasing competitiveness of major foreign suppliers such as China. In turn, the domestic demand base for South African textiles by the clothing industry has reduced dramatically. A key factor behind this trend has been high and rising wage costs.
While wages in the T&C sector are the lowest in the South African manufacturing sector and only just above the minimum wage,14 they are higher than in neighboring countries. In the clothing sector, this is partially compensated for by higher output per worker compared to other countries in sub-Saharan Africa and competitors such as China, Lithuania and Brazil (Clarke et al., 2005). But the industrial labor force is well organized which is resulting in wage increases that are failing to be compensated by higher productivity. Consequently labor productivity is lower than in Malaysia or Poland. The labor movement has also proliferated in South Africa with some firms having to negotiate with two or more unions. If disputes do occur it is common for strikes to spread to other
14 As of 1 May 2005, the minimum wage in industrial areas was US$34.02 per week while the rate for a qualified machinist in these areas was US$47.57 per week (Vlok, 2006).
40

firms along a company’s supply chain. Rural wages in South Africa are about one-half of those in urban areas. As a result a number of South African T&C firms relocated their manufacturing operations to rural areas, keeping their design and distribution services in central urban areas. But unions have recently lobbied for wages to be equalized across the country. Workers in urban areas now receive a 5% annual wage increase while rural workers receive 10%. So many South African manufacturers are now relocating to Lesotho, Swaziland and Mozambique to access lower cost labor, and other incentives. In Lesotho, for example, the Government has reduced its company taxes from 15% to 0% for T&C firms that sell to the US market, and from 15% to 10% for those firms that export to SACU. Labor regulations are also restrictive in South Africa. On average it takes 2.7 months to retrench an entry-level worker. It costs R9,000 to hire and R2,160-2,900 to fire a least skilled worker. As a result, 40% of those firms that remain in South Africa employ fewer workers, use more machinery, hire temporary staff or subcontract (Clarke et al., 2005).
China’s import penetration in the South African market for T&C products has shown dramatic growth. Currently, China accounts for over 90% of South Africa’s T&C imports with India accounting for a further 3%. South African imports of clothing products from China increased by 335% between 2002 and 2004. Of the total fabric consumed in South Africa, 55% originates from China.15 But South Africa remains close enough to fashion trends in the EU and US for the purpose of supplying higher-value clothing to its domestic market. Consequently there remain niche opportunities for South African clothing firms in the production of smaller runs with greater fashion content.
As a response to increased competition, South Africa has imposed (from 1 January 2007) quotas to limit T&C imports from China to 60% of 2006 levels. These will remain in place for a period of two years. The quotas have been applied to 31 major product lines,16
although articles such as T-shirts are not included. The adoption of quotas has been strongly opposed by South African retailers although the decision to implement them at the beginning of 2007, and not sooner, was a compromise to appease some of their objections since it delayed the imposition of quantitative restrictions until after the 2006 summer season. Since the majority of T&C produced in South Africa are to supply its domestic market, South Africa’s T&C retailers yield considerable power in the supply chain.17
The two year timetable for the imposition of quotas is, ostensibly, intended to allow a Customized Sector Program (CSP) to be introduced. The CSP has been planned as a support package to the T&C sector in South Africa, to lever the competitiveness of the industry by establishing an integrated value chain and clusters of excellence in Durban and Cape Town. The package will support export promotion, examine trade remedy measures, provide training and upgrade technologies in the sector. It is proposed that 8 billion Rand will be provided under the CSP for the T&C sector over the next 10 years but to date there remains no indication of where the resources will come from. 15 In 2001/02 China’s import share of T&C in the South African market was 10%.16 The product coverage of the quotas is highly specific: defined at the HS 8-digit level for clothing items and the HS 4-digit level for textiles.17 The largest five retailers account for over 70% of South African clothing sales (Vlok, 2006).
41

The determination of quota limits on Chinese imports has been based on imports during the base year July 2005-June 2006 but there are concerns within the T&C sector about the application of the quotas. On the one hand, there are arguments that quotas will fail to have any protective effect. They were imposed late (original proposals for their application date back to 2003) and imports from other major Asian competitors, such as Bangladesh and India, will be unaffected. Quotas for some products e.g. denim have been set far higher than current imports. Moreover quotas will not be SACU-wide so trade deflection may occur via Chinese exports to other SACU members. On the other hand, there are fears that quotas in most products will prove to be overly restrictive. In 2006 South Africa imported 230 million garments from China in the product categories that have been identified for restrictions. The quota limit in these products is for 172 million garments. The difference will require 42,000 South African workers to be trained and employed in the South African clothing industry. This will not be possible to achieve in the short term so the net result will be a shortfall in clothing that will be made up by a combination of transshipment or a shift in the sourcing base.
For South African clothing exporters, quotas on imports of textiles from China will dissuade US buyers who may not be willing to obtain quotas for Chinese fabric. The US is the largest export destination for South African clothing, accounting for half of clothing exports.
As is to be expected, there are stark opposing interests between the textiles and clothing sectors in South Africa on the impact the AGOA TCF derogation has had on the region. The textiles industry in South Africa believes that imports of third country fabric have denied both investment to the textiles sector in Africa and anticipation of returns (following two previous extensions to the TCF derogation in 2004 and 2006). In contrast, the clothing industry in South Africa maintains that the only way for African countries to develop a viable textiles industry is for them to first build a critical mass of clothing production, based initially on imports of third-country fabric, that could then support a (capital intensive) regional textiles base which, in turn, would support a (very capital intensive) regional yarn spinning industry. Currently African textiles producers do not offer the varieties that African clothing producers (and their buyers) demand and lead times are perceived to be poor.
In the EU market, South Africa has never been granted access to non-reciprocal trade preferences that ACP countries receive. But South Africa has successfully negotiated a free trade agreement (FTA) with the EU under the Trade, Development and Cooperation Agreement (TDCA) which came into effect on 1 January 2000.
The FTA will be established over a transitional period of not longer than 12 years on the South Africa side and not longer than 10 years on the EU side. At the end of these periods ‘substantially all trade’ between the EU and South Africa will be duty free. Most EU liberalization was completed before 2002, while the biggest tariff reductions for South Africa will take place between 2006-2012.
42

Certain products have been excluded from the FTA altogether, in order to protect sensitive sectors on both sides. Most of South Africa’s excluded products are manufactures, including some T&C products, while the EU has mainly excluded agricultural products. For those T&C products that are included under the FTA, the EU agreed to phase out tariffs on imports from South Africa over a period of six years. South Africa will reduce its tariff on imports of T&C from the EU over a longer period: up to 12 years.
The general ROO under the TDCA specifies that non-originating products must not account for more than 15% of the ex-works price in order for the product to be considered as originating. The TDCA also allows for cumulation, including both bilateral (between the EU and South Africa)18 and diagonal (among the ACP countries)19, as well as full cumulation for South African products made from imported inputs from other SACU members. But an additional requirement relating to ACP cumulation is that administrative cooperation agreements must be concluded between South Africa and the ACP countries in order for South African customs to certify the origin of products imported from the ACP countries. Joubert et al. (2003) find that none of these agreements have been reached and therefore ACP cumulation is not yet permitted. Notably, the TDCA does not cover cumulation in the case of South African inputs used in the production of goods in either BNLS or other ACP countries destined for the EU market. ACP countries, however, will be able to rely on cooperation agreements with South Africa under the terms of the ACP/Cotonou Agreement in order to use inputs from South Africa without compromising the preferential status of their exports to the EU market.
6.2 Mauritius
Of all AGOA countries, the T&C sector is most important for Mauritius accounting for 9% of GDP in 2004. The T&C sector peaked in Mauritius during the 1990s when it contributed 12% to GDP and employed over 90,000 people directly (20% of the population) (Rosunee, 2005). The textile sector in Mauritius supplies yarn and fabric primarily to domestic clothing producers for export. Currently the textiles sector is composed of 4 woolen yarn spinning mills; 2 cotton yarn spinning mills; 2 cotton weaving mills; and, 30 knitted fabric producers. The two cotton-spinning mills were established in 2003/2004 and now produce one-third of the Mauritian cotton yarn requirements (Joomun, 2006). Prior to this, Mauritius imported all of its yarn from India and Zambia. Most of the clothing produced in Mauritius is for export. The largest clothing firms are vertically integrated and also produce their own yarns and fabrics. Only a handful of local producers, mainly small factories and the informal sector, produce for the domestic market. Most clothing for domestic consumption is imported. From April 2005 clothing has been imported from Mauritius duty-free (tariffs were previously 80%).
18 Inputs originating in the EU or South Africa are considered as originating in the other.19 If the value added in the EU or South Africa exceeds the value of materials used originating in any of the ACP countries, then products are considered as originating in the EU or South Africa. However, if this is not the case then the products are considered as originating in the ACP country that accounts for the highest value of the inputs used.
43

Mauritius was the first country to take advantage of preferential access to the EU market in T&C under the Lomé Convention. Three-quarters of Mauritian clothing sales are to Europe while the share of total clothing exports to the US has fallen from 30% to 25%. Gibbon (2003) finds that due to the different requirements of buyers clothing firms in Mauritius export either to the US or to the EU, but rarely both. Orders from US buyers are generally larger (accounting for over 30% of a firm’s production capacity), contracts are stricter and quality standards more stringent. Morris and Sedowski (2006) show that Mauritian clothing firms (including those based in Madagascar) exporting to the US are larger, younger and more likely to be Asian owned than those exporting to the EU (which are often domestically or EU-owned). From the 1960s both domestic and foreign firms invested in T&C operations attracted by low labor costs and duty-free access to the European market. Hong Kong is the largest source of foreign investment and accounts for 22% of total FDI. Other major investors are China, France, Germany, Taiwan (China) and the UK. Mauritian clothing companies have invested heavily in production in Madagascar, due to its close proximity (facilitating managerial oversight) and to overcome labor supply constraints in Mauritius. But the political instability of 2002 led to the departure of many Mauritian investors, many of whom refuse to return. There have also been efforts to establish production facilities elsewhere in the region. Senegal, for example, has an excellent geographical locatation to the US market (10 days shipping time by seas versus 45 days from Mauritius). But such attempts have failed, often due to political obstacles. Investment conditions, in particular, are often relatively unfavorable. In India, for example, land has been provided for a Mauritian plant with the only condition being that 60,000 jobs are created.
The phase-out of quotas under the ATC has left the Mauritian T&C industry weakened. Employment, investment and contribution to GDP have shown a negative trend. Employment in the sector declined from 81,438 (71.1% of manufacturing employment) in 2000 to 67,249 (66.1%) in 2004 (Joomun, 2006). Employment in the sector is currently around 58,000. Wage rates have risen, reducing the competitiveness of T&C exports on the world market. Labor costs in Mauritius are 3-4 times higher than in India or China.
As an island economy, most clothing is exported from Mauritius by sea freight but short-term orders are sent by air. A distinct disadvantage faced by Mauritius over competing producers in Tunisia or Morocco is distance: the latter countries can ship to Europe by road in just 3 days, while orders from Mauritius take 4 days by air freight. Air freight is also expensive. For example, a pair of jeans costs US$0.20 to ship from Mauritius to the EU by sea versus US$1.50 by air. Retailers are often reluctant to add the extra cost of air freight to their final price, even for higher-value products such as suits. Direct sea shipping from Mauritius (due to increased demand from China) is also becoming more costly and is infrequent (every 10-12 days). Transshipment via South Africa (Durban) is possible but often subject to congestion at the port.
The combination of rising wages and higher freight costs is resulting in a downsizing of the T&C sector in Mauritius. With the departure of foreign firms, local investors are becoming dominant. In the face of increased competition with China and India on bulk clothing exports firms are investing in new technology and shifting to higher-value
44

production. Consequently, while there has been a decline in T&C exports from Mauritius over the past four years exports are expected to stabilize in 2006 as clothing firms have diversified into exports of trousers, pillows and shirts. Some firms are offering a wider range of services, including warehousing and design, to maintain favor with buyers and retailers. But the development of such services requires skilled personnel. At present technicians are being imported from Europe and the Far East, adding to the 15,000 foreign workers (mostly from China, Bangladesh and India) already present in the Mauritian T&C industry.
South Africa will become an increasingly important market for Mauritius since under SADC duties on imports of T&C have been removed. Mauritius produces higher quality products in some categories of clothing (e.g. jeans) than those that are produced in South Africa. The South African market is also large (50 million people) with an emerging middle class demanding premium products. And South Africa is only 6 days by sea from Mauritius.
The Mauritian government has made a concerted effort to restructure the sector and improve its performance. In July 2003, Mauritius established the Textile Emergency Support Team (TEST), jointly chaired by the private sector and the Ministry of Finance, the mandate of which was to review structural constraints in the sector. TEST identified five key problems: inefficiencies in the production process; poor financial management; a lack of international marketing linkages; a lack of effective strategic and budgetary planning; and the need to improve the skills of textiles workers. Following TEST there have been attempts to bring about a change in mindset of entrepreneurs that used to be focused on preferences and producing low-value exports. Support has also been provided to firms for training, productivity improvements and marketing. A similar program launched in October 2004, called Enterprise Mauritius, will combine the activities of the Mauritius Industrial Development Authority and the EPZ Development Authority (EIU, 2006a).
Mauritius has lobbyied for a value-added ROO under AGOA, following the expiry of the TCF derogation (see Box 1). This would be similar to ROOs for T&C under the ACP/Cotonou Agreement. However, the US uses the yarn-forward ROO in all its preferential agreements (including those with Central America) so the US may be reluctant to train its customs officials to deal with a new set of ROOs for imports under AGOA (which constitute only 2% of US clothing imports). Another implementation problem could be AGOA countries’ monitoring of value-added (but this is being done in other preferential agreements e.g. ACP/Cotonou).
Efforts to generate clusters of independently-owned, small firms linked to a single supply chain are showing success in Mauritius. Clusters of SMEs are headed by a (larger) single firm focusing on activities where scale economies are important i.e. productivity development, finance, customer relations (sampling services, design) and sourcing. Clusters are being used to supply the middle-upper market of small retailers in Europe, while there has also been a recent expansion of cluster operations in Madagascar to cater for high volume products.
45

Following the end of the MFA, the T&C industry in Mauritius is becoming polarized. Firms are either becoming vertically integrated to compete on services offered, reliability of supply and speed of delivery within a closely integrated customer supply chain or small firms are clustering, with a focus on smaller customers and an ablilty to produce a wide range of products. Vertically integrated firms have the disadvantage of being capital
Box 1: The African Cotton and Textile Industries Federation (ACTIF)
ACTIF is a sub-Saharan African regional body, based in Nairobi, formed in June 2005 by the cotton, textile and clothing sectors to create a unified and recognized voice both in regional and global trade negotiations. ACTIF was formed in part as a response to AGOA as countries within the region began to recognize that they could no longer act in isolation and remain fragmented in the face of the expiry of the TCF derogation. ACTIF has an elected Board of Directors, the composition of which represents the ginning, lint trade, textile and clothing sectors. In addition, four action committees have been created comprised of national business associations from member countries, dealing with issues relating to global trade initiatives, investment and finance, inter-regional trade and the supply chain.
ACTIF is formed on the following principles:
1) Emphasis on private sector ownership.2) Endorses private/public partnerships in the sector.3) Builds cooperation, interaction, partnerships, alliances, networks and market
linkages.4) Promotes a regional supply chain focusing on trade issues faced by all sectors in
the value chain and building a platform for reducing constraints to regional trade.5) Addresses post-MFA challenges and increases competitiveness in the post-quota
environment.6) Collects market data, generates information exchange and shares regional
expertise.7) Promotes investment and creates international alliances and affiliations.
ACTIF has lobbyed the US Congress for a number of changes to be made to AGOA:
1) Starting 1 October 2006 and continuing through 2015, the TCF derogation should be gradually replaced (to ensure predictability) by a simple value added ROO modeled on the Egyptian Qualified Investment Zones, which in turn is based on GSP ROOs. The specific percentages in the value added criterion will be worked out in consultation among the US Congress and Executive, US buyers and other stakeholders. The proposed new value added ROO would apply to all AGOA countries (i.e. including Mauritius and South Africa).
2) The US International Trade Commission should apply its rules and procedures as per its short supply criteria to yarns and fabric production in Africa and should define those that are already produced in commercial quantities in Africa as ‘exceptions’ to the proposed ROOs.
3) Discrimination against African textiles (yarns, fabrics and home furnishings) both within AGOA and versus US FTA imports (where preferences are sometimes granted on these products) will be eliminated by making these products AGOA-eligible.
46

intensive, meaning that they must operate at full capacity in order to break even. Vertically integrated firms also rely heavily on logistics, so their model is more easily replicable in countries closer to Europe (with shorter delivery times). Coordination is key to the success of the cluster approach. Consequently clusters can only be used effectively in countries where SME managerial competence is already present. Trust and long-terms relationships between cluster members are also vital.
6.3 Madagascar
Madagascar has had significant success in developing a T&C industry orientated towards export production. As a Francophone island economy located off the coast of a predominantly Anglophone region, and as only a recent member of SADC, Madagascar is less well integrated into the regional market than neighboring countries. This has, perhaps, sustained its domestic manufacturing base, but the SADC Trade Protocol will expose its producers to increased competition from the region.
During the 1960s and 1970s Madagascar’s government attached prime importance to the production of traditional cash crops such as vanilla while at the same time implementing a policy of import substitution through state-owned companies to produce manufactured goods, including T&C products. Consequently, the textile sector became one of the fastest growing industries. Six textile firms remained in operation until the 1980s, employing more than 2,000 workers. The growth of the sector was supported by a cotton processing industry which provided the raw material to the textile industry. In the late 1980s the textile sector in Madagascar began to decline due to mismanagement of state-owned companies combined with high levels of debt and competition from imports of textiles and second hand clothing (Maminirinarivo, 2006).
Since the 1990s, Madagascar has experienced a dramatic recovery in its T&C sector driven by three factors. First, Madagascar’s promotion of EPZs has resulted in substantial investment in T&C activities. About half of the companies licensed to operate within the EPZ are textiles and clothing industries (World Bank, 2003c). Firms that export 95% of their production may access imported inputs duty-free and benefit from capital depreciation and tax advantages.20 Currently, industries in the EPZ account for 2.9% of GDP, represent 43% of Malagasy exports and 80% of foreign investment (EIU, 2005), with China, France, Hong Kong, India, Malaysia and Mauritius being the main sources of capital. At its peak in 2001, the T&C sector engaged 158 firms in the EPZ, concentrated in the capital Antananarivo and Antsirabe, and employed 120,000 people (Salinger, 2003). Secondly, the rise in clothing exports during the 1990s was closely related to the export success of Mauritius where rapid growth and a shortage of labor combined with rising wages led Mauritian companies to relocate their T&C operations offshore.21
Thirdly, Madagascar has also taken advantage of preferential access to the US market
20 A grace period on corporate income tax for the first 2-15 years of operation; a post-grace period tax rate that is reduced by an amount based on 75% of subsequent investment; exemptions from customs duties and taxes on imported equipment, inputs, spare parts, packaging and building materials; dividend taxes of 10 percent instead of 25 percent; 99 year leases for investment in land; and, free repatriation of profits after payment of taxes, as well as provisions for 100% foreign ownership (World Bank, 2003c).21 Average wage costs in Madagascar’s EPZ are US$50 per month compared with US$150 in Mauritius.
47

under AGOA. In 2005, 42% of Malagasy T&C exports went to the EU versus 56% to the US. Madagascar is the second largest exporter of clothing to the US after Lesotho. In 2001, exports of T&C accounted for 38% of total Malagasy exports and employed approximately 80 percent of the labor force in the EPZ (Lande et al., 2005).
The success of the T&C sector was dramatically interrupted during the political crisis of 2002, which saw a large decline in manufacturing when exports were halted for most of the first seven months of the year by the blockade of Antananarivo. An estimated 40,000 workers lost their jobs in the T&C sector as many foreign investors switched production from Madagascar to Mauritius, Kenya and Asia. One quarter of the T&C firms in the EPZ closed and turnover in textiles and leather products fell by 89% (World Bank, 2003c). The buying offices for MAST, Li & Fung, Eddie Bauer, Gap, Dockers and Levis closed during the crisis and failed to reopen (Morris and Sedowski, 2006). In the four years that have followed, the T&C sector has recovered. Although some investment was lost permanently, it has been replaced by new investment and expansion of the remaining plants. In 2004, T&C employment rose to 85,000 and production of T&C rose by 28% (EIU, 2005; 2006b). By the beginning of 2005 there were 118 T&C firms operating in Madagascar (Morris and Sedowski, 2006). But the sector now faces new challenges. The elimination of quotas under the ATC has exposed Malagasy T&C firms to low cost competition from India and China. Between January and May 2005, five firms had closed with the loss of 5,000 jobs. As of June 2006 the sector had lost 10,000 jobs as a result of the ATC. To some extent this decline has been offset by the depreciation of the franc malgache losing half of its value against the dollar between February and June 2004 (Morris and Sedowski, 2006).
The cotton sector in Madagascar has potential for growth to supply the high demand for cotton yarn and fabric for Malagasy clothing exports. Cotton is a key input into textiles production in Madagascar since cotton-based knit or woven garments represent almost two-thirds of the country’s clothing exports - mostly jeans, T-shirts and knitwear. Pullovers alone account for 20% of Madagascar’s clothing exports (Lande et al., 2005). Salinger (2003) estimates Madagascar’s demand for cotton lint to be 27,500 tons (equivalent to 69,000 tons of seed cotton) although current production is well below these levels. The cotton region in Madagascar is located in the North and South, with two-thirds of cultivation occurring in the North. Three companies gin cotton seed in Madagascar. The dominant firms, accounting for 74 percent of cotton lint is HASYMA, a paratstatal firm. HASYMA has been losing market share in recent years to two private companies, COTONA and DRAMCO, both of which have operated in the Northwest since 1995 (World Bank, 2003c). The structure of the sector, with significant (although decreasing) market power exercised by the parastatal, administered price policies and the linking of exports to domestic sales limits the expansion of the sector (World Bank, 2003a). Madagascar produces high quality cotton of the Acala and Pima varieties in medium and long staple lengths. Between 1994 and 2001 Madagascar’s output of seed cotton has varied between 20,000-40,000 tons per year. However, since 2002 seed cotton production has fallen dramatically with production in 2005 reaching only 13,000 tons (see Annex 28). This decline has been caused by low world cotton prices and internal financial difficulties of HASYMA, on which cotton production in Madagascar is
48

dependent for seeds, chemical inputs, research and marketing. Seed cotton yields average about one ton per hectare (see Annex 36), but there are large regional differences. For example, in the northwest of the country where most mechanized, large-scale farms are located yields are in the region of 2 tons per hectare, while in the southwest yields average only 0.8 tons per hectare (Salinger, 2003). Average national yields have declined since cotton is increasingly being grown in the southwest of the country, as the northwest is diversifying into the production of other cash crops e.g. tobacco.
In addition to the limited domestic supply of cotton, there are also processing constraints. Madagascar imports very little lint (less than 1000 tons per year - see Annex 38) with most cotton being imported already processed into thread, yarn and fabric. Mauritius is the dominant supplier of lighter weight cotton fabrics to Madagascar, while heavier cotton fabrics such as denim and corduroy are imported from Hong Kong, France, China, and South Africa. Of the domestic production capacity that does exist for cotton lint (40,000 tons) about half is sold domestically (mostly to the textile group COTONA) and the rest exported, typically 2,000-6,000 tons per year (see Annex 37). The small textile industry in Madagascar comprises two textile mills that currently produce cotton yarn and fabric (COTONA and SOMACOU) and two integrated firms that produce knit fabric clothing (SAMAF and Festival). Some clothing firms in Madagascar are supplied with cotton fabric from the COTONA, but there are problems with quality, quantity and the reliability of supply (Maminirinarivo, 2006). There are a number of factors that adversely affect the competitiveness of the Malagasy clothing industry. First, are the high costs associated with transport (delays) and logistics. Madagascar’s clothing exports incur greater transport and insurance costs than their competitors for similar products traveling similar distances. Due to Madagascar’s distance from suppliers of raw materials and final markets, it takes up to four months for Malagasy clothing firms to complete an order, eliminating the feasibility of producing the most time-dependent fashion products and encouraging a focus on cut-make-trim operations (Morris and Sedowski, 2006). For example, children’s clothes originating in Sri Lanka destined for Paris face two-thirds the transport costs of those coming from Madagascar. To ship from Hong Kong (again to Paris) costs less than half of shipping from Madagascar (World Bank, 2003c). Clothing exports are normally shipped from Antananarivo to the seaport in Toamasina by road, and then by sea to final destinations. It can take up to one week for containers to travel between the factory and the port. Cargo trucks going in and out of Antananarivo are limited by law to traveling only at night (Morris and Sedowski, 2006). Airfreight is used by producers of high-value garments such as cashmere jumpers. Toamasina is the largest port in Madagascar. In 2001, it handled 80,350 containers. With its existing capacity, Toamasina has little difficulty copying with existing freight levels. But parts of the port have been leased to manufacturers and the railway, displacing areas that could otherwise be used for cargo handling and storage. The Port of Toamasina is the least efficient in the Indian Ocean. On average it takes more than two days to unload ships at rates of less than 6.3 containers per hour (World Bank, 2003c). Consequently vessel turnaround time is low, translating into higher sea shipping costs and longer transit times. Furthermore, Antananarivo and Toamasina are connected by a road, which is congested due to cargo traffic. It costs as
49

much to ship a container between Antananarivo and Toamasina as it does from Toamasina to New York (Salinger, 2003). Shipping by sea does not route directly from Toamasina to the US, but transits via Mauritius, South Africa or Mombassa. Sea freight to the US takes a minimum of four weeks. Air freight from Madagascar to New York takes seven days versus 4 days for a consignment originating in Sri Lanka. Madagascar’s main airport is Ivato, located 25 kilometers from Antananarivo. It’s main problem is its extremely limited cargo storage capacity, barely able to handle 13,600 tons of airfreight.
Secondly, while labor in Madagascar is relatively low paid, this advantage is partially offset by lower productivity. While wages are low - US$35 per month22 - Malagasy clothing workers are only 70-75% as productive as those in Mauritius (Tait, 2002). And the supply of labor, especially for relatively skilled workers in mid-level management, engineering, technical support, fashion design, branding, marketing, sales, contracting, quality control and logistics is constrained. This shortage of skilled labor drives up wage costs for these workers and limits the ability of the sector to diversify into higher value-added products and more capital-intensive operations such as spinning and weaving. There is only one technical training institute for textiles and clothing workers (FORMACO) and most firms choose to conduct their own training in-house (World Bank, 2003c).
Finally, Madagascar’s clothing sector lacks a number of necessary support services, namely spare parts providers, trim manufacturers, training institutes, market research and advertising firms.
6.4 LesothoLesotho has a developed clothing industry that has always been export orientated, employing 40,000 workers (Bennet, 2006) from a peak of 54,000 in 2004. Until 2000, much of Lesotho’s clothing exports were to SACU and the EU but following the introduction AGOA, Lesotho’s clothing industry switched its focus to the American market. Consequently, the vast majority of Lesotho’s clothing exports (98%) are now to the US (see Annex 15) and the country is the largest exporter of clothing products under AGOA (see Annex 23). T&C exports to neighboring countries in SADC are now small and to the EU virtually non-existent (see Annexes 25 and 27). Over half of all Lesotho’s clothing exports are in girls’ trousers and knitted blouses (LLC, 2004b). However much of this has very low value-added in Lesotho, with most inputs being imported. As a result, with the notable exception of denim, linkages between the clothing sector and the textiles sector in Lesotho are limited (World Bank, 2003b).
In addition to preferential access to the US market, the availability of low-cost labor and the country’s eligibility to source fabric from Asia under the TCF derogation attracted increased (mostly Taiwanese) investment for clothing production. Lesotho is competitive in terms of labor costs, despite productivity levels being around half of those in East Asia (World Bank, 2003b). In 2006, the minimum wage for a general worker in the textile sector was 640 Maloti (US$90) per month and for a trained machine operator 686 Maloti
22 Compared with US$50 for Sri Lanka; US$65 for Botswana, Kenya and Lesotho; US$75 for India; US$133 for Mauritius; US$150 for China; and, US$255 for South Africa.
50

(US$96) per month. These advantages have helped to overcome high transport costs associated with (land-locked) Lesotho’s shipments to the US and, to some extent, offset demands from buyers for preproduction skills in sample making, financing and fabric and trim sourcing. The critical question is whether this competitive edge can be maintained. The expansion of the clothing sector has led to upward pressure on wage rates. Since 1998, wages in the clothing sector have risen faster than in other sectors (IMF, 2002).
The T&C sector is the largest source of employment in Lesotho (LLC, 2004c). Approximately 34 large companies operate in the sector, focusing exclusively on cut, make and trim operations i.e. clothing is simply manufactured leaving design, sampling, input purchasing and financing to head offices located overseas. With the notable exception of denim fabric, produced within Lesotho and also imported from South Africa, virtually all inputs are sourced from outside the region mostly from China, South Korea and Taiwan (China). Attempts made to import other fabrics from South Africa, have failed due to the quality of the fabric being unacceptable to US buyers (LLC, 2004c).
Lesotho established clothing production for export during the 1980s, largely as a response by South African manufacturers to avoid sanctions imposed by the US and Europe. At the time, the government of Lesotho offered incentives to investors by offering discounted rents on factories, relatively cheap and well educated labor, five year tax holidays and subsidized wages for a designated training period. The initial development of the industry took place in Maputsoe, the closest industrial area in the country to Durban (Salm et al., 2002). Lesotho benefited from preferential access to the US market under GSP and duty-free access to the EU under the Lomé Agreement, although (initially) ROOs for the latter required fabric sourcing and clothing manufacture be carried out within the ACP countries. In the late 1980s Lesotho applied for a derogation to the Lomé ROOs and received the (temporary) right to manufacture clothing eligible for preferences in the EU market from fabrics sourced outside the ACP countries. This derogation was initially for four years but was later extended through 1995. This attracted foreign investments in the clothing sector especially from South East Asia: from Taiwan (65%) but also Hong Kong (13%), South Africa (5%), Israel (3%) and Singapore (3%). Approximately 10% of the sector was domestically owned (LLC, 2004c). Several factories closed or downsized when the derogation expired in 1995 but many firms successfully shifted their exports from the EU market to the US.23
Lesotho was declared eligible for the clothing provisions under AGOA in April 2001. AGOA initially attracted considerable new investments in Lesotho’s T&C sectors. Textile investments were made to supply Lesotho’s clothing sector with local fabric in expectation of the expiration of the TCF derogation, initially scheduled for 2004. These investments were also made in anticipation of increased regional demand for regionally-produced fabrics. But by 2004, no decision had been reached in the US regarding an extension to the TCF derogation. Consequently, buyers were uncertain that their clothing orders from Lesotho would enter duty-free and orders started to fall (de Voest, 2006).
23 At that time, Lesotho’s clothing exports to the US were subject to an average import duty of 17% as well as a preferential quota allocation.
51

This decline was aggravated by the phase-out of quotas under the ATC and a large appreciation of the currency, which was (and remains) linked to the South African Rand. By 2005, employment in Lesotho’s T&C industry had fallen from 54,000 to under 40,000. The knit garment sector has experienced the greatest decline (see Table 7).
Table 7: Number of workers and firms by product in Lesotho: 2004-2005
July 2004 July 2005Workers Firms Workers Firms
Denim jeans 14,445 8 14,754 8Knitted clothing 35,472 37 20,889 30Denim fabric 0 0 950 1Embroidered and screen printed fabrics
670 4 171 3
Temporary workers 2,500 - 3,600 -
Total 53,087 49 40,364 42Source: Bennet (2006).
Lesotho’s clothing industry is recovering. During 2006 employment in the clothing sector rose to 47,000 and all of the factories that closed in 2005 have reopened. But the expiry of the TCF derogation under AGOA, scheduled for 2013, will once again present a challenge to Lesotho’s clothing manufacturers. In particular, while Lesotho has sufficient denim fabric to make its jeans, it still lacks facilities to make 20,000-26,000 tons of knitted fabric to supply its knitted clothing industry.
Lesotho is known as the ‘jeans capital of Africa’. The clothing sector manufactures 26 million pairs of denim jeans every year, employing 15,000 workers, for retailers such as Gap, Wal-Mart, Levi Strauss and Jones Apparel while the textile sector produces more than 6,300 tons of denim fabric and 10,800 tons of knitting yarn. Denim fabric is produced at the Formosa textile mill which imports cotton lint from Malawi, South Africa, Zambia and Zimbabwe, to spin into yarn, dye and weave. The mill supplies jean factories in Lesotho but also sells denim fabric to Botswana, Kenya, Madagascar, Mauritius, South Africa and Jordan. Lesotho has eight factories that produce jeans and cotton chino trousers. The two main jeans manufacturers, each employing 7,000 workers, are the Nien Hsing Group (with three factories) and the CGM Group (also with three factories). Lesotho also produces 70 million knitted garments per year and has 28 companies making knitted (mainly cotton) clothing. Most of these are Chinese owned. A wide range of knitted garments are produced, from jersey, pique, interlock and rib fabrics. A number of firms are now beginning to manufacture fleece knitwear from synthetics. The knitwear sector collectively employs 28,000 workers (Bennet, 2006).
Recognizing it cannot compete in standardized bulk exports of clothing against competitors in the Far East, Lesotho is seeking to produce quality, higher value-added clothing and also to appeal to those western consumers who are willing to pay higher prices for products made in countries with high standards of employment practices and
52

good human rights records. There are also training projects aimed at making the Basotho workforce more productive and providing skills which will enable them to move into supervisory and middle-management positions. Initial indications are that US and EU clothing retailers have responded positively by increasing their orders from Lesotho. This autumn Gap will begin buying T-shirts from Lesotho bearing the ‘Product Red’ logo. Edun, an ethical clothing company, began importing clothing from Lesotho in 2005 as a way to provide fashion clothing to socially conscious consumers. More recently, Edun has been trying to develop a full value finished product (T-shirts) from Africa made from organic cotton by link spinners and weavers in Kenya and Lesotho with farmers and ginneries in Tanzania.24
Since the T&C industry in Lesotho is export-orientated and dependent on imported inputs the access, quality, cost and timeliness of transport services is of key importance to the competitiveness of the T&C sector. Delays caused by late deliveries of inputs from ports in South Africa to factories in Lesotho occasionally force firms to subcontract to higher cost local firms to complete orders on time. And the threat of delays provides an incentive for clothing manufacturers in Lesotho to use higher-cost road transport than rail services to deliver inputs and send finished goods to the ports.25 Currently the majority of raw materials for the clothing industry are imported into Lesotho by rail. Remaining competitive in the context of delivery times will therefore be contingent on Lesotho improving its transport services. The facilities at the Maseru rail yard are inadequate to handle any more than 40 containers a day brought into the station. No part of the station is paved which delays loading and unloading of containers, particularly in wet conditions. Because of the lack of storage capacity, large numbers of containers consigned to Lesotho are stored on a regular basis at Bloemfontein at a cost of 295 Maloti per day (World Bank, 2003b).
While transport may incur delays, so too can delays in import and export clearance. All raw materials imported under rebate are inspected by Customs during unloading. In addition, Customs verifies all exports to the US and Europe during loading. On average, imports of inputs take 7-14 days to clear but there may be significantly longer delays in obtaining a rebate certificate from the Ministry of Trade or passing inspections from the Customs and Excise Division which lacks capacity.
24 Organic cotton attracts 30-40% premiums over the world price and has a number of positive externalities (not least because farms must be certified as organic and therefore other crops grown on them are automatically classified as organic). Less than 0.6% of world cotton production is certified as organic. Consequently, organic cotton currently occupies a niche market, but there are signs that it is moving into the mass market, with large companies such as Coop in Switzerland, and Nike and Levi Strauss in the US, taking an interest. The Coop, for example, which began selling organic fabrics in 1993, sold one million organic items in 1997. At present 2 million tones of organic cotton are being demanded by the global textiles and clothing industry (10% of world cotton production). But certification of organic farms is expensive and different importing countries use different systems. A single global system of organic accreditation is required. 25 While road transport costs 75% more than transport by rail, a truck can deliver from Maseru to Port Elizabeth in one day. Transporting via rail can take 9-30 days for the same journey (LLC, 2004).
53

6.5 Kenya
The T&C sector is the fourth largest industry in Kenya, comprising 11% of all manufacturing firms, contributing 2% to total manufacturing output and employing 42,646 workers (in 2004), or 2.5% of total employment. There are 255 licensed manufacturers of yarn, fabrics and clothing in Kenya. There is also a large informal component of the sector, comprising at least 1,000 firms. The sector is entirely private-owned since the paratstatals that used to operate closed after liberalization in 1991. Kenya produces a wide range of T&C products. Spinning firms produce yarn and sewing thread while integrated mills produce yarn, fabrics (knitted and woven), canvas, blankets, shawls, uniforms, towels, nappies and knitted garments. About half of Kenya’s clothing firms produce menswear while the rest produce woven chemise and robes, pants, Kaunda suits, school and traveling bags.
Cotton production was first introduced into Kenya in the Nyanza province at the turn of the last century. During the two decades following Kenya’s independence in 1963, import substitution policies and government controls promoted the backward integration of the country’s textile mills with the cotton sector. During this time regulation ensured cooperatives bought ginneries from colonial settlers; controlled marketing margins; and, fixed producer prices. The main cotton varieties grown in Kenya are HART 89M (grown in Central and Eastern Provinces) and KSA 81M (grown in Western and Nyanza Provinces), producing lint of medium staple length. Cotton is grown in marginal and arid parts of the country by 140,000 smallholder farmers, down from a peak of 200,000 in the mid-1980s (EPZA, 2005). While there is abundant land for cotton cultivation, estimated at 360,000 hectares with a potential to produce 260,000 bales of seed cotton annually, the acreage under cotton is only 40,000 hectares. The production of cotton peaked in 1985, reaching 38,000 tons, but has since fallen to a current level of 20,000 tons (see Annex 28). Although cotton prices have improved since the market was liberalized production remains below potential and 80% of Kenya’s cotton requirements for its textile industry are imported from Uganda and Tanzania. There are a number of reasons for this (LLC, 2004a). First, farmers’ groups are poorly organized and there is no body to link cotton farmers to ginners in order to coordinate production and marketing activities. The Kenya Cotton Board which used to perform this role has now closed (from 28 August 2006), but proposals are being developed for a cotton regulatory framework (the Cotton Development Authority) to guide pricing, quality and research.26 Secondly, cotton yields are low (400kg/ha of seed cotton – see Annex 36), in part due to problems with seed contamination. Thirdly, the staple length and quality of Kenyan cotton is poor leading to higher waste and low quality yarn. Fourth, the cost of agrochemical inputs is high (accounting for one-third of production costs) leading farmers to spray fewer times than is normal to prevent crop loss.27 Distribution and sale of pirated and contaminated 26 Constitutional i.e. financial constraints have hindered the enactment of the proposed regulation and the creation of the new institution.27 Kenya’s tax regime discourages local formulation of agrochemicals by imposing duty and VAT on concentrates, active ingredients and packaging material. There is also a restrictive and complex registration process for imported agrochemicals, resulting in fewer agents (less competition) and an absence of cheaper
54

pesticides continues to be a problem. Fifth, the appreciation of the Kenyan shilling in the mid-1990s made imported cotton more competitive and placed downward pressure on the prices Kenyan farmers could receive for their seed cotton.
The ginning sector in Kenya is weak. While liberalization of Kenya’s cotton sector allowed cotton growers to negotiate prices directly with ginners, a lack of regulation has led to undifferentiated sales of different qualities of cotton on the market. LLC (2004a) estimates that there are currently 24 ginners operating 327 (mostly roller) gins in Kenya with a capacity of 140,000 bales (132,375 tons of cotton lint) per year. But actual production is well below capacity. Only about 10 ginners are currently operational with the others having ceased production due to a shortage of seed cotton and general mismanagement (Omolo, 2006). Ginning outturn is relatively low (actual outturn is 33% versus a potential outturn of 40-42%) attributed to the short staple length of seed cotton and the poor state of ginning equipment (often lacking drying and moisture-restoration devices). While there are donor interventions to correct these weaknesses (see Box 2) the implications of low seed cotton production and weak ginning capacity are that Kenya’s supply of lint is low, and well below domestic demand.
Box 2: The World Bank Value Chain Matching Grants Program in Kenya
The World Bank is funding a value chain matching grants program in Kenya, a five year operation that started in 2005. The program focuses on coffee, cotton and pyrethrum. In the cotton sector, its objective is to improve the competitiveness of the cotton-textiles-clothing supply chain in Kenya and to increase domestic value added. The program provides grants to match investments made on the part of its beneficiaries. The grants must be spent on knowledge and skills-related activities. Matching grant proposals are presented to a committee comprising of stakeholders involved at all levels of the cotton-clothing value chain. The committee decides which proposals to award grants to. The minimum requirement for matching grant proposals to be accepted is that at least two stages in the cotton-clothing value chain must benefit from the matching grant. To date, most grants have been provided to increase the quantity of locally-available cotton. For example, a pilot project is providing farmers with technical advice on best agricultural practice. The beneficiaries of the matching grant are providing investment into ginning and cotton inputs. A key benefit of the World Bank matching grants program in Kenya has been the dialogue and relationships it has facilitated along the value chain, particularly among those that sit on the stakeholder committee. The matching grant program is also developing guidelines to determine the price cotton farmers should receive for their crop, based on the world price of cotton, and disseminating this information at farm-level.
Under import substitution there was substantial public investment in Kenya’s textile mills and the domestic industry was protected by 100% tariffs on imported textile products. This ensured rapid growth of the domestic textile industry which achieved an average production capacity of over 70 percent (Omolo, 2006). The sustainability of import substitution began to weaken by the early 1980s. Inward looking policies had created inefficiencies making it difficult for the country’s T&C exports to compete internationally. And increased imports of second hand clothing and illegal fabric imports decreased demand for new clothing in the domestic market by as much as US$1 billion in annual gross revenue per year for the entire cotton-textile sector (LLC, 2004a). In 1990,
generic products on the market.
55
imports of new and used clothing accounted for over half the Kenyan market. Today, over three-quarters of total Kenyan demand for T&C is met by imports.
The cotton-to-clothing supply chain in Kenya has also experienced difficulty remaining competitive in export markets vis-à-vis large Asian producers, for example China, and regional competitors such as South Africa and Lesotho. While the country’s clothing sector recovered following a US ban on Kenyan imports in 1994 (alleging transshipments of goods from Asia), the T&C sector remained far from reaching its full potential. Consequently, the number of functioning textile mills has declined from a peak of 52 in 1983 (LLC, 2004a) to 20 (Lande et al., 2005). Only 6 are integrated textile mills which have spinning, weaving and knitting facilities, and there are only 2 spinners in operation in Kenya. Most of the textile industry in Kenya is foreign owned (by Indian investors) and caters mainly for the domestic clothing industry.
The shift from import substitution to an export orientated development strategy in Kenya was accompanied by the emergence of Export Processing Zones (EPZs). Kenya implemented its EPZ program in 1990 providing exporting firms with a 10-year tax holiday, no restrictions on foreign ownership nor employment and the freedom to repatriate earnings. The EPZ has been of particular benefit to the clothing sector which has been the highest growth sector in Kenya in recent years, principally driven by preferential access to the US market under AGOA. Kenya was quick to register for AGOA and the Kenya Association of Manufacturers established a well-functioning Visa Control System, learning from the serious re-labeling problems of 1994. Consequently clothing firms were able to set up fast in Kenya, compared to most AGOA countries (Government of Kenya, 2005). At its peak in 2003, the Kenyan clothing sector comprised 40 firms and employed over 37,000 workers. Over 80 percent of inputs for the export-orientated clothing industry are sourced from imports.28 The total annual fabric demand in Kenya is 225 million square meters but installed capacity within domestic fabric manufacturing is only 115 million square meters (although the textile industry operates at less than 50% capacity). Raw materials used in the clothing sector include wool, viscose, polyester, nylon and acrylic fibers and fabrics.
Currently 37 large clothing manufacturers export to the US under AGOA of which 25 are located within the three EPZ at Nairobi, Mombassa and Athi River, 7 have manufacture-under-bond (MUB) status and 5 operate outside the EPZ and MUB. Exports of clothing under AGOA have averaged 75% of total EPZ exports during the last five years. Local investor participation in the EPZ has grown significantly, with one-tenth of companies wholly owned by Kenyans, and three-quarters operating under joint venture arrangements with foreign investors (Blattman et al., 2004).
Until 2005 growth in Kenya’s clothing sector was also driven by the existence of quotas under the MFA. Quotas provided Kenyan clothing producers with a cost advantage of 22% in addition to preferences, which under AGOA range from 17% to 32% depending
28 Except for wool, where some quantity is available domestically. For synthetic raw materials Kenya does not possess the necessary chemicals to produce them, though this might be possible from the crude oil refinery in Mombassa.
56

on the fiber used i.e. cotton or synthetic or blends thereof. Now that quotas have been removed, costs of doing business must be reduced by at least 20% to ensure that firms remain attractive to US buyers. The elimination of quotas in international trade for T&C at the beginning of 2005 has resulted in a decline in exports and employment in the sector for those firms based in the EPZ (see Table 8). The sector has suffered a loss of 6000 jobs compared to 2004 and 17 factories in the EPZ and MUB have closed since mid-2005 (Bedi, 2006).
Table 8: The impact of AGOA on clothing exports from Kenya’s EPZ
2000 2001 2002 2003 2004 2005Number of firms 6 17 30 35 30 25Employment 5,565 12,002 25,288 36,348 34,614 34,234Investment (US$ mil.) 16 48 88 128 108 120Source: EPZA (2005).
A number of constraints face the clothing sector in Kenya. These include low labor productivity, dilapidated infrastructure, burdensome customs regulations and the high cost of energy. The bulk of labor used in the sector is semi-skilled. On average, wages are US$80-100 per month, which is higher than in competitor countries like China (US$30) and Bangladesh (US$25). Higher Kenyan wages are warranted if labor and firms are highly productive, but unit labor cost/productivity comparisons suggest that Kenyan wages are only justified when compared to Tanzania or Uganda. Compared to Asian countries, the cost of labor is high (Blattman et al., 2004). Labor costs constitute 48.6% of total value-added in the sector, which is much higher than in China (15.1%), India (10.1%), Malaysia (8.8%) and Mauritius (10.7%). Wages in Kenya’s EPZ are also increasing, rising on average by 40 percent between 2001 and 2004. Real wages in Kenya as a whole have tripled since 1994 while firm productivity has remained stagnant. Unless costs are dramatically reduced the clothing industry will contract significantly (Government of Kenya, 2005).
Poor quality roads directly reduce the competitiveness and profitability of firms. The high cost of internal transportation within Kenya appear to be neutralizing much of Kenya’s advantage as a coastal location. For example, the costs of transporting goods from Mombasa to Nairobi or Kisumu are about 25-30 percent of the total cost of transportation to Europe (World Bank, 2006). 84 percent of firms in Kenya use road transport services. But delays at weigh bridges and road congestion means a Nairobi-Mombasa roundtrip takes an average of 2.5 days instead of one day. And truck maintenance as a consequence of poor roads can absorb up to 8-10 percent of overhead costs (Blattman, 2004). The Kenyan rail service has deteriorated in the last two decades. Only 35 percent of firms use rail transport. Kenya railways has declined from once carrying the dominant share of freight between Mombassa and Nairobi and almost all goods to Uganda to now carrying one-fifth of cargo between Mombassa and Uganda. To ship by rail can cost up to twice that of sending goods by road. But Kenya’s ports are its single most important infrastructure constraint. For example, the charge for unloading at Mombasa is around six times that of unloading at Felixstowe (in the UK). Container loading times at Mombasa
57

are between two and three times that of international norms. While the time for customs clearance is approximately 10 days, around 6 days can be accounted for by delays in paperwork (World Bank, 2003d).
The appreciation of the Kenyan shilling by over 10% during the last two years has also reduced the competitiveness of Kenyan clothing exports especially since wage costs are not dollar linked (as opposed to other production inputs which are imported). Kenya also suffers from long lead times on imports of raw materials and exports. The country is located far from the US market (it takes 35-40 days to ship clothing from Mombassa to the US) while, at the same time, the country is distant from its sources of raw materials (fabrics sourced from South East Asia).
6.6 Zambia
The T&C industry in Zambia has played an important role in the country’s economic development. Cotton products, such as lint, yarn and clothing account for more than US$40 million in annual export earnings. Exports of cotton and polycotton yarn alone account for over 90% of these (World Bank, 2005). Under import substitution policies, following independence through to the mid-1980s, Zambia’s T&C sector received substantial government support by a combination of tariffs, quotas and exchange rate management (Turok, 1989). The result was to limit foreign competition, reduce the role of the market and increase state involvement in the level and composition of investment in the sector (Koyi, 2006). Because of this support, the relative importance of the T&C sector grew from 10.1% of total manufacturing value-added in 1964 to 18.4% in 1980 (World Bank, 1984). High rates of protection for T&C made the domestic market more profitable than for exports and allowed inefficiencies to persist. At its peak in the 1980s, the T&C sector consisted of over 140 firms, employing over 25,000 workers (Chikoti amd Mutonga, 2002). But with the fall in copper earnings (from 1975) the Zambian T&C sector began to experience capacity underutilization due to the scarcity of foreign exchange available for imported inputs and spare parts (Gweynne, 1996). In 1991 Zambia undertook structural adjustment and trade policy reform. Trade liberalization exposed firms to foreign competition resulting in closures of clothing factories and down-sizing of textiles operations. By 2002, fewer than 50 firms remained in the sector and employment had dropped to below 10,000.
In Zambia there are approximately 227,000 smallholder cotton farmers cultivating seed cotton production often alongside staple food crops such as maize. Annual seed cotton production in Zambia varies between 62,000 and 140,000 tons (see Annex 28). Most of Zambia’s cotton production is produced in Eastern, Central and Southern Provinces, with some production in areas around Lusaka and the north of the Western Province. During the 1970s, the Zambian government established a number of companies in T&C. Lintco was set up to develop cotton and ginning and by 1987 the company had planted over 78,000 hecatres producing 64,000 tons of seed cotton annually. Lintco was privatized in 1995 and its gins sold to Lonrho and Clark Cotton, which was subsequently bought by Dunavant. Today, the largest ginners in Zambia are Dunavant, followed by Mulungushi and Continental. Zambia’s total ginning capacity is 256,000 tons. Ginning outturn ratios
58

are 40%, which is higher than in Kenya and in line with other countries in the region. But domestic consumption of Zambian cotton lint is low (14,500 tons) with most (typically three-quarters) being exported. Most Zambian spinners import cotton lint since domestic cotton is a medium staple length variety while Zimbabwe, for example, produces long staple cotton necessary to spin export quality yarns (RATES, 2003).
During the 1980s a number of fully integrated textiles mills were established in Zambia. The most prominent were Kafue Textiles and Mulungushi, which combined supplied 80 percent of Zambia’s textiles demand. A small number of spinning mills, such as SWARP Spinning and Sakiza Spinning Limited also coexisted along the two major state-owned firms. The 1990s witnessed major private investment into Zambia’s weaving, knitting and clothing sectors. SWARP Spinning Mills, in particular, was substantially modernized, doubling its capacity and allowing it to export all of its yarn (Chikoti and Mutonga, 2002). Since then, the domestic market for Zambian yarn and fabric has declined due to competition from cheap imports, escalating local production costs and the failure of the sector to achieve economies of scale. The future of the Zambian spinning sector will depend on its ability to produce and export products with higher value added, such as bleached/dyed yarns and acrylic yarns (LLC, 2006).
Currently, the largest remaining spinning mill in Zambia is SWARP Spinning with an annual output of 14,000 tons of yarn. SWARP spins various types of cotton yarn: open end, ring and combed yarns. It also has a facility to add more value to its yarns via dyeing and bleaching. SWARP employs over 1,000 workers. To produce yarn, SWARP sources cotton from Zambia but also longer staple varieties (and of different colors) from the region (Zimbabwe and Malawi). Within Zambia cotton is also sourced from different provinces. Using different sources enables the company to maintain cotton supply should a consignment from a particular province/country be delayed or be found to have quality problems. SWARP once sold its yarn to T&C producers in South Africa, some of which was used as inputs into apparel for exports to the US under AGOA. At this time, 40-50% of its turnover was for the regional market. But as demand from the region has fallen, SWARP has had to diversify its export markets to include, most recently, Europe. The regional market for SWARP’s yarn has declined for two reasons. First, Mauritius was granted temporary eligibility to the TCF derogation under AGOA in 2005. Prior to this SWARP supplied Mauritius with yarn for its clothing exports to the US to comply with AGOA’s yarn-forward ROO. Secondly, SWARP lost market share in the South African market because of the appreciation of the Rand and competition from cheaper suppliers in China. The shift to supplying Europe with yarns has been based on producing short-runs of specialty yarns with specific counts customized to individual customer specifications. This strategy has been adopted to avoid direct competition with standardized yarn producers in China, India and Pakistan.
There are a number of constraints currently facing the Zambian T&C sector. First are those cost increases associated with the recent recovery in world copper prices. Demand for transport by Zambian copper mines has increased the shipping costs faced by all sectors. And the appreciation of the kwacha has increased labor costs in the sector (paid in local currency) while electricity prices have remained constant (despite depreciation of
59

the currency being cited in the past as the rationale for increasing electricity tariffs). Secondly, the skill level of workers in Zambia also limits the performance of the textiles sector. Worker productivity is well below that in China and India but higher than in Uganda and Tanzania (Chikosi et al, 2005). There is no textiles training available nationally and all training must be done in-house. But those workers trained as electricians or engineers by the textiles sector are now relocating to the mining sector which is currently offering higher salaries on the back of high returns to copper.
The bulk of clothing produced in Zambia comprises specialized workwear for the mining, manufacturing and security services sectors. Imports of second hand clothing have steadily captured the lower end of the clothing market accounting for 60-65% of total clothing sales. Zambia is one of the few countries which permits unlimited imports of second-hand clothing (Koyi, 2006) and while there is a tariff of 25% on clothing imports, second-hand products have no value in the country of supply and are therefore imported at little or no cost. For sales of new clothing, South African retail stores have established in Zambia to supply the medium to upper end of the market (Pep Stores, Woolworth, Truworth). It is estimated that South African retailers account for one-quarter of the Zambian clothing market. Consequently, all seven of Zambia’s remaining clothing firms only supply 10-15% of the domestic clothing market, primarily producing niche workwear products.
Zambia’s clothing industry has largely failed to benefit from preferential access to the US clothing market under AGOA. This is partly explained by Zambia’s slow ratification of AGOA but also because the country is landlocked and freight costs are prohibitive. For example, to ship a container from Dar es Salaam to the Far East by sea freight costs US$2,000. To send the same container by road from Ndola to Dar es Salaam costs US$4,000. South African and Zimbabwean firms dominate international road transport to, from and through Zambia. Long journey times, eight to ten days to travel from Durban to Lusaka, and the absence of standardized documents all serve as barriers to trade. Rail transport from the Copper belt to South Africa costs US$75 per ton. The imbalance in freight flows between South Africa and Zambia results in southbound haulage costing 60 percent of the rate of northbound transport (World Bank, 2005). Consequently Zambian clothing firms are largely unable to import fabric from China in order to make clothing for the US market. And there are no textiles mills in Zambia orientated towards making fabric of a sufficient quality to meet US buyer requirements. Only one clothing firm in Zambia exports to the US under AGOA. Unity clothing exports hospital scrubs. Hospital scrubs are a high volume, low margin product that are not subject to seasonal trends.
7. Conclusion
To realize the potential for effectively integrating domestic and regional T&C production networks in the AGOA-region, competitiveness need to be significantly improved at
60

every stage of the supply chain. And, T&C firms in these countries must determine their strategies depending on their position in the supply chain, their links to the international market and the type and value of products they export. For firms with unique, niche clothing products (e.g. high quality suits in Mauritius) the best option may be to pursue branding to secure greater rents associated with the product’s uniqueness, or to enter a product niche (e.g. workwear in Zambia) where demand does not vary significantly throughout the year and there are fewer competitors. For large firms, with many operations offering standardized products (e.g. knitwear in Lesotho and menswear in Kenya), increased vertical integration within the country or regional integration with producers in other countries may be the best strategy for reducing costs associated with profit margins and transport costs and for controlling risks that delay shipments. But this will require significant investment in the region’s textile sector to develop production capacity and improve quality. Efforts will also be required to obtain buyer approval for new regional sources of yarns and fabrics. The alternative model, where a significant proportion of total output is destined for sale to the domestic market (e.g. as in South Africa) is not likely to be successful or sustainable, especially in small economies where domestic demand is limited or where competition is fierce from large Asian competitors that benefit from economies of scale or subsidies to their T&C industries. Domestic demand may also be limited where sales of second-hand clothing have already captured the low-middle range of the clothing market, failing to support the higher prices required by local manufacturers.
To facilitate vertical and region integration of the T&C industry in sub-Saharan Africa, countries should try to reduce costs and enhance efficiency in several key areas by improving:
Air, sea, road and (especially) rail transport to reduce costs associated with dilapidated infrastructure, congested ports and high freight charges.
The reliability of electricity and water supplies at internationally competitive prices.
Investment climate to encourage foreign and domestic investment particularly in the capital and technology intensive textiles sector.
The productivity of the workforce in the region through the provision of training in relatively skilled areas such as textiles engineering, fashion and design, branding, marketing, advertising, sales and logistics.
Regional integration by eliminating tariffs on intra-regional trade in cotton, textiles and clothing and relaxing ROOs, reforming customs administrations and procedures to reduce lead times and penalties associated with delays.
Market intelligence for the region’s T&C sector to encourage increased awareness and interaction between regional cotton, textiles and clothing firms to develop regional trade linkages and alternative sources of input supply.
61

ROO especially by allowing Africa-wide cumulation in the case of EU preferential imports.
The above broad program requires actions at the national and regional level. Developed countries (the EU in particular) can help by improving their ROO especially allowing Africa-wide cumulation in the T&C industry.
South Africa is the key for regional integration of the African T&C industry because of its production capacity (especially in textiles), capital, know-how, design skills and established links to retailers. But its trade relations are influenced by strong, and often conflicting, protectionist interests in its textiles and clothing industries. ROOs are among the key tools South Africa uses to restrict regional imports of T&C.
62

References
Abernathy, F., J. Dunlop, J. Hammond and D. Weil (1999), A stitch in time: lean retailing and the transformation of manufacturing – lessons from the apparel and textile industries, Oxford University Press: New York.
Bedi, J. (2006), ‘KAM Textile Industry Position Paper’, Kenya Association of Manufacturing, Nairobi.
Bennet. M. (2006), ‘Lesotho’s Export Textiles and Garment Industry’, Friedrich-Ebert-Stiftung.
Blattman, C., L. Cotton, V. Desai, I. Elbadawi, J. Habyarimana, J. Marchat, V. Ramachandran, M. Shah, K. Ajayi, P. Kimuyu, R. Ngugi, A. Bigsten and M. Soderbom (2004), ‘Kenya: Investment Climate Assessment – Enhancing the competitiveness of Kenya’s manufacturing sector’, Africa Private Sector Group, World Bank.
Brenton, P. (2003), Integrating the Least Developed Countries into the world trading system: The current impact of EU preferences under Everything But Arms, World Bank: Washington, D.C..
Chikosi, C., V. Ramachandran, L. Cotton, C. Leechor and J. Habyarimana (2005), ‘An assessment of the investment climate in Zambia’, Africa Private Sector Group, World Bank.
Chikoti, S. and C. Mutonga (2002), ‘Textiles and clothing in Zambia’, Ministry of Commerce, Trade and Industry: Lusaka.
Clarke, G., B. Eifert, J. Habyarimana, M. Ingram, W. Kapery, D. Kaplan, M. Schwartz and V. Ramachandran (2005), ‘South Africa: An assessment of the investment climate’, Africa Private Sector Group (World Bank), Department of Trade and Industry (Rsa) and Citizen Surveys.
Cline, W. (1990), The future of world trade in textiles and apparel, Institute for International Economics, Washington, D.C..
Coughlin, P., M. Rubin and L. Amedée Darga (2001), ‘The SADC textile and garment industries: constraints and opportunities’, Study commissioned by the Southern African Development Community.
Darga, L. (2004), ‘The impact of preferential rules of origin on the development of the textile and clothing sectors in SADC countries’, in Grynberg, R. (ed.), The impact of preferential rules of origin in the textile and clothing sectors in Africa, Economic Paper 65, Commonwealth Secretariat.
63

EIU (2004), ‘African consumer goods: clothing industry is shrinking’, Economist Intelligence Unit, London.
EIU (2005), ‘Country Profile 2005: Madagascar’, Economist Intelligence Unit, London.
EIU (2006a), ‘Country Profile 2006: Mauritius’, Economist Intelligence Unit, London.
EIU (2006b), ‘Country Report 2006: Madagascar’, Economist Intelligence Unit, London.
EIU (2006c), ‘Bale Out’, in Business Africa, July 16-31, Economist Intelligence Unit, London.
EPZA (2005), Annual Report, Export Processing Zones Authority, Nairobi.
Flanagan, M. (2003), ‘Clothing sourcing in the 21st century: the 10 lessons so far’, www.Just-Style.com
Flatters, F. (2004), ‘SADC Rules of Origin in Textiles and Garments: Barriers to Regional Trade and Global Integration’, , in Grynberg, R. (ed.), The impact of preferential rules of origin in the textile and clothing sectors in Africa, Economic Paper 65, Commonwealth Secretariat.
Francois, J., H. Glisman and D. Spinanger (2000), ‘The cost of EU protection in textiles and clothing’, Kiel Institute of World Economics, Working Paper mo. 997.
Gereffi, G. (1999), ‘International trade and industrial upgrading in the clothing commodity chain’, Journal of International Economics, Vol. 48; pp. 37-70.
Gibbon, P. (2002), ‘At the cutting edge? Financialisation and UK clothing retailers’ global sourcing patterns and practices’, Competition and Change 6(3); pp. 289-308.
Gibbon, P. (2003), ‘The African Growth and Opportunity Act and the global commodity chain for clothing’, World Development Vol. 31 (11).
Government of Kenya (2005), ‘National Export Strategy Implementation Action Plan 2005-2008’, Government Printers, Nairobi.
Gweynne, R. (1996), ‘Trade and developing countries’, in Daniels, P. and W. Lever (eds.), Global Economy in Transition, Longman: Essex,
Hamilton, C. (1990), The Uruguay Round: textiles trade and the developing countries – eliminating the Multi-Fibre Arrangement in the 1990s, World Bank, Washington, D.C..
Haveman, J. and H. Shatz (2004), ‘Trade barriers and the LDCs’ in Guha-obis, B. (ed.), The WTO, developing countries and the Doha Development Agenda: prospects and
64

challenges for trade-led growth, World Institute for Development Research, United Nations University, Helsinki,
Hummels, D. (2001), ‘Time as a trade barriers’, Department of Economics, Purdue University, West Lafayette.
IMF (2002), ‘Background note for Lesotho IF study’, Staff note, Trade Policy Division, International Monetary Fund, Washington, D.C..
IMF (2006), ‘Trade in textiles and clothing after the elimination of MFA quotas’, Staff note, Trade Policy Division, International Monetary Fund, Washington, D.C..
ITC (2004), ‘Textiles and clothing: assessment of the competitiveness of certain foreign suppliers to the US market’, Vol. 1, Investigation No. 332-448, US International Trade Commission.
Joomun, G. (2006), ‘The textile and clothing industry in Mauritius’ in Jauch, H. and R. Traub-Merz (eds.), The future of the textile and clothing industry in Sub-Saharan Africa, Friedrich-Ebert-Stiftung: Bonn.
Joubert, N., L. Padayachee and G. Erasmus (2003), ‘The SA-EU Trade, Development and Cooperation Agreement – Comparison of the TDCA, Cotonou, EBA and AGOA’, Trade Law Centre for Southern Africa, Stellenbosch.
Kaplinsky, R. (2005), ‘Globalisation, poverty and inequality: between a rock and a hard place’, Polity Press.
Kaplinsky, R. and M. Morris (2006), ‘Dangling by a thread: how sharp are the Chinese scissors?’, Report for DFID.
KIPPRA (2005), ‘Improving the Enabling Environment for Business in Kenya’, Kenyan Institute for Policy Analysis and Research, Nairobi.
Koyi, G. ‘The textiles and clothing industry in Zambia’, in Jauch, H. and R. Traub-Merz (eds.), The future of the textile and clothing industry in Sub-Saharan Africa, Friedrich-Ebert-Stiftung: Bonn.
Lande, S., M. Gale, R. Arora and N. Sodhi (2005), ‘Impact of the end of MFA quotas on COMESA’s textile and apparel exports under AGOA: Can the Sub-Saharan African textile and apparel industry survive and grow in the post-MFA world?’, East and Central Africa Global Competitiveness Trade Hub.
LLC (2004a), ‘Value chain analysis of selected strategic sectors in Kenya’, Global Development Solutions – LLC.
65

LLC (2004b), ‘Market analysis of selected strategic sectors in Lesotho: Vol. 1’, Global Development Solutions – LLC. LLC (2004c), ‘Market analysis of selected strategic sectors in Lesotho: Vol. 2’, Global Development Solutions – LLC.
LLC (2006), ‘Value Chain Analysis for the Cotton-to-Garment Sector in Zambia’, Global Development Solutions – LLC.
Maminirinarivo, R. (2006), ‘The textile and clothing industry of Madagascar’, in Jauch, H. and R. Traub-Merz (eds.), The future of the textile and clothing industry in Sub-Saharan Africa, Friedrich-Ebert-Stiftung: Bonn.
Mattoo, A., D. Roy and A. Subramanian (2002), The Africa Growth and Opportunity Act and its Rules of Origin, World Bank: Washington, D.C..
Minor, P. (2002), Changes in global trade rules for textiles and apparel, Report prepared for USAID, Nathan Associates.
Minor, P., T. Simpson Lojewski, M. Velia and A. Bernard (2004), ‘Diversification into man-made fiber apparel exports: a strategic option for Madagascar to maximize post-2004 preferential tariff margins’, Trade Developments, USAID.
Minor, P. (2006), ‘Market diversification of the Lesotho garment industry’, Study commissioned by FIAS with support from the ComMark Trust.
Morris, M. (2006), ‘Globalisation, China and industrialization strategies in Sub-Saharan Africa’, in Jauch, H. and R. Traub-Merz (eds.), The future of the textile and clothing industry in Sub-Saharan Africa, Friedrich-Ebert-Stiftung, Bonn.
Morris, M., Barnes and Esselaar (2006), ‘Globalisation, the changed global dynamics of the clothing and textile value chains and the impact of sub-Saharan Africa’ in Memedovic (ed.), Global value chains and production networks: prospects for upgrading by developing countries, UNIDO, Vienna.
Morris, M. and L. Sedowkski (2006), ‘The competitive dynamics of the clothing industry in Madagascar in the post-MFA environment’, University of Cape Town and University of KwaZulu-Natal.
Nordas, H., ‘The global textile and clothing industry post the Agreement on Textiles and Clothing’, Discussion Paper No. 5, World Trade Organization, Geneva.
Omolo, J. (2006), ‘The textiles and clothing industry in Kenya’, in Jauch, H. and R. Traub-Merz (eds.), The future of the textile and clothing industry in Sub-Saharan Africa, Friedrich-Ebert-Stiftung, Bonn.
66

Onguglo, B. (1999), ‘Developing countries and unilateral trade preferences in the new international trading system’, in Mendoza, M., Low, P. and Kotschwar, B. (eds.), Trade rules in the making: challenges in regional and multilateral negotiations, The Brookings Institution Press, Washington DC.
Page, S. and P. Kleen (2004), ‘Special and differential treatment of developing countries in the World Trade Organization’, Report for the Ministry of Foreign Affairs, Sweden, Overseas Development Institute.
RATES (2003), Cotton-textile-apparel value chain report Zambia’, Regional Agricultural Trade Expansion Support Program, Nairobi.
Roberts, S. and J. Thoburn (2002), ‘Globalisation and the South African textiles industry’, Globalisation and Poverty, Discussion Paper 9.
Rosunee, S. (2005), ‘The Mauritian textile and clothing industry: facing the challenges associated with globalisation’, Department of Textile Technology, Faculty of Engineering, University of Mauritius.
Salinger, L., H. Bhorat, D. Flaherty and M. Keswell (1998), Promoting the competitiveness of textiles and clothing manufacture in South Africa, prepared for USAID.
Salinger, L. (2003), ‘Competitiveness audit of Madagascar’s cotton, textiles and garments sector’, prepared for USAID/Madasacar by Nathan Associates Inc. Salm, A., W. Grant, T. Green, J. Haycock and J. Raimondo (2002), ‘Lesotho garment industry subsector study’, Study commissioned by the UK Department for International Development.
Tait, N. (2002), ‘Sourcing extra: back to business in Madagascar’, Bobbin, November.
Turok, B. (1989), Mixed economy in focus: Zambia’, Institute for African Alternatives.
UN (2006), COMTRADE database, United Nations Statistics Division, New York.
UNCTAD (2006), Trade-related analysis and information system database, CD-ROM, United Nations Conference on Trade and Development, Geneva.
Vlok, E. (2006), ‘South Africa’, in Jauch, H. and R. Traub-Merz (eds.), The future of the textile and clothing industry in Sub-Saharan Africa, Friedrich-Ebert-Stiftung: Bonn.
Weathers, N. (2003), ‘Marketing strategy to enhance the competitiveness of African clothing firms under the African Growth and Opportunity Act’, Philadelphia University.
67

Weil, D. (2006), ‘Lean retailing and supply chain restructuring: implications for private and public governance’, Boston University School of Management.
World Bank (1984), Zambia: industry policy and performance, World Bank: Washington, D.C..
World Bank (2003a), ‘Madagascar: increasing integration into world markets as a poverty reduction strategy’, prepared under the Integrated Framework for Trade-related Technical Assistance.
World Bank (2003b), ‘Lesotho: Integration into the World Trading Environment’, prepared under the Integrated Framework for Trade-related Technical Assistance.
World Bank (2003c), ‘Madagascar: Diagnostic Trade Integration Study’, prepared under the Integrated Framework for Trade-related Technical Assistance.
World Bank (2003d), ‘Kenya: A policy agenda to restore growth’, Country Economic Memorandum, World Bank: Washington, D.C..
World Bank (2005), ‘Zambia: Diagnostic Trade Integration Study’, Trade component of Private Sector Development Program for Zambia, World Bank: Washington, D.C..
World Bank (2006a), ‘Doing business database’, www.doingbusiness.org.
World Bank (2006b), ‘Kenya growth analytic work: aide memoire of the World Bank Mission: July 4-July 21, 2006’, World Bank: Washington, D.C..
WTO (2001), ‘Comprehensive report of the textiles monitoring body to the Council of Trade in Goods on the implementation of the Agreement of Textiles and Clothing during the second stage of the integration process’, G/L/459.
68

List of experts consulted
Name Title Address Tel. number E-mailMauritius
Mr Francois Woo
Managing Director
Compagnie Mauricienne de Textile Ltee,DBM Industrial Estate,Phoenix.
+230 601 8888
Mr Mario Jullienne
General Manager
Corona Clothing (HK) Ltd.,La Brasserie Road,Forest Side.
+230 674 2613
Mr Maurice Vigier de Latour
General Manager
Denim de l’Ile Limited,Royal Road,Rivière du Rempart.
+230 412 5190
Ms Razia Sayed-Fakim
Sales Manager Socota Textile Mills Ltd.,Sayed Hossen Road,Curepipe.
+230 426 6003
Mr Olivier Stekelorom
General Manager
Socota Textile Mills Ltd.,Sayed Hossen Road,Curepipe.
+230 426 6003
Ms Danielle Wong
Mauritius Export Promotion Association,6th Floor, Unicorn House,5 Royal Street,Port Louis.
+230 256 1951
Mr Raj Makoond
Director Joint Economic Council,3rd Floor,Plantation House,Place d’Armes,Port Louis.
+230 211 2980
Dr Krishnalal Coonjan
Executive Director
National Productivity and Competitiveness Council,7th Floor, St James Court,St Denis Street,Port Louis.
+230 211 8118
Arif Currimjee
Managing Director
Vieo Industries,Royal Road,Goodlands.
+230 281 1700
South AfricaBrian Bink Executive
DirectorTextile Federation of South Africa,2nd Floor,Liberty Gardens,No. 10 South Boulevard,Bruma.
+27 11 615 4007
Joop de Voest
Marketing and Planning Consulting Services
+27 12 667 2844 667
69

1952Name Title Address Tel. number E-mailSelwyn Gershman
Managing Director
Gregory Knitting Mills (Pty) Ltd.,32 Elansfontein.
+27 11 828 0300
Igsaan Salie President Textile Federation,2nd Floor Easy Wing,10 South Boulevard,Liberty Gardens Building,Bruma.
+27 83 635 5755
Jack Kipling
President Clothing Trade Council of South Africa,6 Hawthornden Road,Kenilworth,Cape Town.
+27 21 761 0610
KenyaFred Kariuki
Executive Officer
Kenya Association of Manufacturers,Mwanzi Road,Westlands,Po Box 30225-00100,Nairobi.
+254 734 646 005
Betty Maina
Chief Executive
Kenya Association of Manufacturers,Mwanzi Road,Westlands,Po Box 30225-00100,Nairobi.
+254 722 524 625
Samuel Mwaura Waweru
Chief Executive Officer
Kenya Private Sector Alliance,Bishops Garden Towers,1st Floor,Bishops Road,PO Box 3556-00100,Nairobi.
+254 20 273 0371
Jaswinder Bedi
Director Fine Spinners Ltd.,PO Box 78114-00507,Viwandani,Nairobi.
+254 20 556 144
Tejal Shah Operations Manager
Mideo Textiles Ltd.,PO Box 18160,Nairobi.
+254 733 721 166
Nick Mason
Sustainable Development
Edun Apparel Ltd.,30/32 Sir John Rogerson’s Quay,Dublin,Ireland.
+353 1 256 1289
Arun Seth Managing Dircetor
Sunflag Textile and Knitwear Mills Ltd.,PO Box 41627-00100,Nairobi.
+254 20 559 550
70

Name Title Address Tel. number E-mailBarry Fisher
Cotton/textile specialist
ACTIF Secretariat,Westlands Office Park,Acacia House,1st Floor,Waiyaki Way.PO Box 1555-00606,Sarit Centre,Nairobi.
+254 20 421 2000
Fred Kong’ong’o
Trade linkages and facilitation coordinator
ACTIF Secretariat,Westlands Office Park,Acacia House,1st Floor,Waiyaki Way.PO Box 1555-00606,Sarit Centre,Nairobi.
Anthony Getambu
Team Leader,Matching Grant Fund
Deloitte,Kirungii,Ring Road,Westlands,PO Box 40092,Nairobi.
+254 20 444 1344
Dennis Ochwada
National Chairman
Kenya Cotton Growers Association,PO Box 15487,Accosca House,Valley Road,Ralph Bunche Road Junction,Nairobi.
+254 20 272 1509
Stefan Skrzypczak
Operations Manager
Alltex EPZ Limited,PO Box 30500-00100,Export Processing Zone,Athi River\.
+254 452 2593
ZambiaMusho Shandavu
Managing Director
SWARP Spinning Mills Plc.,PO Box 71846,Ndola,Zambia.
+260 2 650821
Christopher Mtonga
Director of Administration
SWARP Spinning Mills Plc.,PO Box 71846,Ndola.
+260 2 650821
Kam Shah Operations Manager
UNITY,3292 Ulengo Road,PO Box 71697,Ndola.
+260 2 650 222
71

ANNEXES
72

Annex 1: The WTO Agreement on Textiles and Clothing
For more than forty years, trade in textiles and clothing (T&C) was restricted by special measures: the Short Term Cotton Arrangement (1961) affecting trade in cotton textile products followed, and signed under the GATT, by the Long Term Cotton Arrangement (1962-73) which was renegotiated several times until being replaced (and extended to cover restrictions on products made from wool, man-made fibre and, from 1986, certain vegetable fibres) by the Multifibre Arrangement (MFA) in 1974. The MFA was renegotiated four times until it finally came to an end with the completion of the Uruguay Round in 1994 and introduction of the ATC.
Traditionally, production of T&C was located in developed countries and provided employment in both small and large firms, in urban and rural areas and favored female workers. Later, developing countries became major exporters and production declined in developed countries although it often remained significant in terms of employment. Most of the job losses in developed countries have been concentrated in small and medium-sized firms, while larger firms have outsourced production to neighboring countries (Heron, 2002).
In the years leading up to the WTO Uruguay Round Agreement, six importer countries actively applied quotas under the MFA – the US, EU, Canada, Norway, Finland and Austria. Gradually, importing countries left the MFA (Sweden, Switzerland and Australia). Sweden liberalized its T&C sector in 1991 and withdrew from the MFA but effectively rejoined upon its accession to the EU. Two other developed countries, Japan and Switzerland, did not impose quotas under the MFA but instead restricted imports of T&C by signaling a readiness to apply quantitative restrictions by remaining signatories to the MFA and carrying out import surveillance. By 1994, only four importers (US, EU, Canada and Norway) and 31 developing countries adhered to the MFA, with 1300 applied quotas that varied from product to product and from supplier to supplier but almost exclusively to imports from developing countries (Francois et al., 2000).
The MFA was a major departure from GATT rules. It violated the most favored nation principle; applied quantitative restrictions rather than tariffs; discriminated against and between developing countries; and was non-transparent (Nordas, 2004). During the Uruguay Round negotiations, WTO member countries agreed that the T&C sectors should progressively come under normal GATT rules. The basic aim of the ATC was to integrate trade in T&C into these disciplines by requiring countries maintaining quotas to eliminate them over a period of 10 years. The US, Canada, EU and Norway carried 81 restraint agreements under the MFA (comprising 1,325 individual quotas) and 29 non-MFA agreements (mostly unilateral measures) into the ATC.
The elimination of quotas under the ATC took place as two separate processes. First, products were progressively integrated into the GATT and were no longer included under the ATC (i.e. not restricted by quotas). Second, for those products that remained in the ATC quotas were increased (see Table 9).29 The choice of products to be integrated in any of the stages was at the discretion of each importing country provided that products consisted of items from each of the four main groups - tops and yarns, fabrics, made-up textile products and clothing - and were previously subject to MFA or MFA-type quotas in ‘at least one’ importing country (Article 2). This meant that, in the early stages of the ATC, each country’s list of products to be integrated could include items that had never been restricted by it.
29 The percentages of trade in textiles and clothing to be liberalized refer to the total volume of trade in textiles and clothing in the base year 1990.
73

Table 9: Phase-out of quotas under the ATC
Date Minimum volume of on trade in T&C not restricted by quotas
Accumulated volume of trade in T&C not restricted by quotas
Growth rate in remaining quotas
1 January 1995 16 16 161 January 1998 17 33 251 January 2002 18 51 271 January 2005 49 100 No quotasSource: Nordas (2004).
The first phase of the ATC, beginning on 1 January 1995, required the integration of products comprising at least 16 percent of the total volume of each member’s T&C products (as listed in the Annex to the Agreement) during the base year 1990. The second phase, beginning on 1 January 1998, required the integration of a further 17 percent of trade. The third phase, beginning on 1 January 2002, required that another 18 percent of imports be brought under normal GATT rules. At the end of the final phase, on 1 January 2005, the remaining 49% of trade (or all remaining quotas) were eliminated for T&C trade.
Products that remained restricted during the first three phases of the ATC were liberalized progressively by increasing quotas. Annual quota growth rates previously applied under the MFA were increased by a factor of 16 percent in the first phase; 25 percent in the second phase; and, 27 percent in the third phase.
The ATC allowed for a ‘special transitional safeguard mechanisms’, to provide importing countries protection against import surges. To use this an importing country was first required to determine that total imports of a specific product were causing or threatening to cause serious injury to its domestic industry and secondly, the importing country had to show which exporting countries were causing the injury (or threat). If injury could be demonstrated, the importing country was required to seek consultations with the exporting country (or countries). The special transitional safeguard mechanism could then be applied on a country-by-country basis by mutual agreement or, if agreement could not be reached through the consultation process within 60 days, by unilateral action. The quota subsequently applied could not be lower than the actual level of imports from the exporting country during 12 months in the previous 14 month period and the safeguard imposed could remain in place for a maximum of three years. If the safeguard quota remained in place for more than one year, the quota was required to increase by at least 6 percent per year. Thirty three requests for consultations were registered during the first stage of the ATC; 26 from the US and 7 from Brazil. Most of the measures were found to be unjustified when challenged by the Textile Monitoring Body (see below). During the second stage of the ATC there were 29 requests for consultations regarding safeguards (1 by the US, 9 by Colombia, 2 by Poland and 17 by Argentina).
Although there was full compliance with the quota growth rate commitments (WTO, 2001),30 liberalization of trade in T&C under the ATC (with the exception of Norway, which eliminated all restrictions on a unilateral basis on 1 January 2001) was backloaded. Out of 1,325 quotas originally carried over to the ATC, only 219 were eliminated during the first three phases of the Agreement. Consequently the remaining 1,106 were left until the final phase on 1 January 2005.31 Consequently, 60-65 percent of US and EU imports of T&C were not integrated until 2005 (IMF, 2006). This was due, in part, to the integration of T&C products not actually restricted under the MFA during the first phases of the ATC but also because importing countries were able to integrate the least sensitive products first, or those that were quota-free. Furthermore, the average quota growth rate did not provide significant improvements in market access primarily because this was applied to low (pre-ATC) growth in MFA quotas.
30 ATC commitments were fully met in volume terms since importing countries first integrated low-value textile mill products such as yarns, fabrics and made-up clothing.31 For the US, 701 out of 757 quotas remained, 164 out of 219 for the EU and 241 out of 195 in the case of Canada.
74

Annex 2: MFN tariffs on international trade in textiles
Country Average applied tariff (%)
Min. applied tariff (%)
Max. applied tariff (%)
Average bound tariff (%)
Min. bound tariff (%)
Max. bound tariff (%)
Year
Major importing marketsEU 6.70 0.00 12.00 6.70 0.00 12.00 2005US 7.54 0.00 32.00 7.54 0.00 32.00 2005Canada 7.03 0.00 18.00 11.21 0.00 18.00 2005Japan 5.91 0.00 14.20 5.91 0.00 14.20 2005
AGOA countriesBenin 16.85 0.00 20.00 20.87 5.00 60.00 2005Botswana 18.28 0.00 40.00 23.90 0.00 60.00 2005Burkina Faso 16.85 0.00 20.00 23.39 5.00 100.00 2005Cameroon 20.18 0.00 30.00 75.71 50.00 80.00 2005Chad 20.18 0.00 30.00 80.00 80.00 80.00 2005Ethiopia 31.13 0.00 40.00 .. .. .. 2002Ghana 17.27 0.00 20.00 88.88 45.00 99.00 2004Kenya 20.47 0.00 50.00 100.00 100.00 100.00 2005Lesotho 18.28 0.00 40.00 62.94 60.00 200.00 2005Madagascar 5.96 0.00 25.00 25.88 10.00 30.00 2005Malawi 19.28 0.00 25.00 125.00 125.00 125.00 2001Mali 16.85 0.00 20.00 20.87 5.00 60.00 2005Mauritius 3.94 0.00 65.00 122.00 122.00 122.00 2005Mozambique 19.27 2.50 25.00 100.00 100.00 100.00 2005Namibia 18.28 0.00 40.00 23.90 0.00 60.00 2005Niger 16.85 0.00 20.00 39.23 5.00 50.00 2005Nigeria 16.59 5.00 20.00 150.00 150.00 150.00 2005Rwanda 18.46 0.00 30.00 61.34 18.00 100.00 2005Senegal 16.85 0.00 20.00 30.00 30.00 30.00 2005South Africa 18.28 0.00 40.00 23.90 0.00 60.00 2005Swaziland 18.28 0.00 40.00 23.90 0.00 60.00 2005Tanzania 20.47 0.00 50.00 120.00 120.00 120.00 2005Uganda 20.47 0.00 50.00 80.00 80.00 80.00 2005Zambia 17.34 0.00 25.00 125.00 125.00 125.00 2005
Major competitors to AGOA countriesChina 10.01 1.00 40.00 10.24 2.00 40.00 2005Costa Rica 8.76 0.00 15.00 45.03 45.00 60.00 2005Honduras 8.83 0.00 15.00 34.01 15.00 35.00 2005India 15.56 15.00 75.00 29.56 20.00 150.00 2005Mexico 16.59 0.00 35.00 34.80 9.00 50.00 2005Morocco 36.28 3.00 50.00 41.70 23.00 45.00 2005Tunisia 25.73 0.00 43.00 58.15 17.00 150.00 2005Turkey 6.70 0.00 12.00 6.70 0.00 12.00 2005Vietnam 32.60 0.00 50.00 .. .. .. 2000
Source: UNCTAD (2006).
75

Annex 3: MFN tariffs on international trade in clothing
Country Average applied tariff (%)
Min. applied tariff (%)
Max. applied tariff (%)
Average bound tariff (%)
Min. bound tariff (%)
Max. bound tariff (%)
Year
Major importing marketsEU 11.54 0.00 12.00 11.54 0.00 12.00 2005US 10.76 0.00 32.00 10.76 0.00 32.00 2005Canada 16.38 0.00 18.00 16.38 0.00 18.00 2005Japan 9.30 3.20 20.00 9.36 3.20 20.00 2005
AGOA countriesBenin 19.63 10.00 20.00 14.93 5.00 15.00 2005Botswana 36.87 0.00 40.00 44.89 15.00 60.00 2005Burkina Faso 19.63 10.00 20.00 14.93 5.00 15.00 2005Cameroon 29.98 20.00 30.00 .. .. .. 2005Chad 29.98 20.00 30.00 .. .. .. 2005Ethiopia 39.75 30.00 40.00 .. .. .. 2002Ghana 20.00 20.00 20.00 .. .. .. 2004Kenya 24.66 10.00 50.00 .. .. .. 2005Lesotho 36.87 0.00 40.00 60.00 60.00 60.00 2005Madagascar 24.47 0.00 25.00 .. .. .. 2005Malawi 24.97 10.00 25.00 .. .. .. 2001Mali 19.63 10.00 20.00 14.93 5.00 15.00 2005Mauritius 1.33 0.00 40.00 .. .. .. 2005Mozambique 24.42 7.50 25.00 .. .. .. 2005Namibia 36.87 0.00 40.00 44.89 15.00 60.00 2005Niger 19.63 10.00 20.00 28.01 5.00 50.00 2005Nigeria 19.67 10.00 20.00 .. .. .. 2005Rwanda 29.38 15.00 30.00 98.44 15.00 100.00 2005Senegal 19.63 10.00 20.00 30.00 30.00 30.00 2005South Africa 36.87 0.00 40.00 44.89 15.00 60.00 2005Swaziland 36.87 0.00 40.00 44.89 15.00 60.00 2005Tanzania 24.66 10.00 50.00 .. .. .. 2005Uganda 24.66 10.00 50.00 .. .. .. 2005Zambia 24.92 15.00 25.00 .. .. .. 2005
Major competitors to AGOA countriesChina 16.33 10.00 25.00 16.37 10.00 25.00 2005Costa Rica 14.79 0.00 15.00 45.17 45.00 60.00 2005Honduras 14.82 0.00 15.00 34.94 30.00 35.00 2005India 14.94 0.00 15.00 38.75 35.00 40.00 2005Mexico 33.72 10.00 35.00 35.13 35.00 50.00 2005Morocco 49.60 10.00 50.00 40.17 40.00 45.00 2005Tunisia 42.48 15.00 43.00 59.60 38.00 60.00 2005Turkey 11.54 0.00 12.00 11.54 0.00 12.00 2005Vietnam 47.65 0.00 50.00 .. .. .. 2005
Source: UNCTAD (2006).
76

Annex 4: The EU’s GSP
Between 1995 and 2005, the EU’s GSP applied to imports from developing countries that paid tariffs on entering the EU market i.e. to those products that were not already duty-free under MFN. During this period, the EU’s GSP applied to about 6,900 of the 9000 non-zero MFN tariff lines (of the approximately 11,000 tariff lines in the EU, about 2,000 are duty-free under MFN). Under the scheme there were five types of preferences. For the general scheme, goods were designated as either ‘non-sensitive’ or ‘sensitive’ depending on the extent to which they competed with domestic production. Non-sensitive products entered duty-free and sensitive goods entered at an MFN tariff reduction of 3.5 percentage points.
There were two schemes that tied additional preferences to recognition of labor rights and environmental standards. These schemes reduced the MFN tariff for sensitive products by 8.5 percentage points.
There was also a special GSP to combat drug production and trafficking. The number of products covered by this scheme was higher than for the general scheme (around 7,200 tariff lines) on which duty-free access was conferred to the EU market. The incentives designed to reduce drug production, initially aimed at the Andean countries before being extended to Central America and then Pakistan, were successfully challenged by India as not being in accordance with the Enabling Clause (Page and Kleen, 2004).
The latest implementation cycle of the EU’s GSP came into force on 1 January 2006 (although a provisional form of it was fast-tracked from 1 July 2005) and will remain in effect until the end of 2008. The revised system was ostensibly designed to be simpler, more transparent and stable. There are now three types of preferences instead of five:
1) The general scheme: product coverage has increased from 6,900 tariff lines to 7,200. The new products are mostly in the agricultural and fishery sectors.
2) A new ‘GSP+’ scheme to replace the labour/forestry/drug variants, covering 7,200 products which can enter the EU duty-free. The beneficiaries must meet a number of criteria including ratification and effective application of 23 out of 27 key international conventions on sustainable development and good governance.
3) Everything but Arms (which remains unchanged).
To benefit from GSP+, countries need to demonstrate that their economies are poorly diversified, and therefore ‘dependent and vulnerable’. This is defined as meaning the largest five GSP-covered exports to the EU represent more than 75% of total GSP-covered exports. GSP-covered exports from the country must also represent less than 1% of total EU imports under GSP. Countries also have to ratify and implement the 16 core conventions on human and labor rights and 7 (out of 11) of the conventions related to good governance and environmental protection (all must be ratified and implemented by 2009).32
32 Including the International Covenant on Civil and Political Rights; International Covenant on Economic Social and Cultural Rights; International Convention on the Elimination of All Forms of Racial Discrimination; Convention on the Elimination of All Forms of Discrimination Against Women; Convention Against Torture and other Cruel, Inhuman or Degrading Treatment or Punishment; Convention on the Rights of the Child; Convention on the Prevention and Punishment of the Crime of Genocide; Minimum Age for Admission to Employment (N° 138); Prohibition and Immediate Action for the Elimination of the Worst Forms of Child Labour (N° 182); Abolition of Forced Labour Convention (N° 105); Forced Compulsory Labour Convention (N° 29); Equal Remuneration of Men and Women Workers for Work of Equal Value Convention (N° 100); Discrimination in Respect of Employment and Occupation Convention (N° 111); Freedom of Association and Protection of the Right to Organise Convention (N° 87); Application of the Principles of the Right to Organise and to Bargain Collectively Convention (N°98); International Convention on the Suppression and Punishment of the Crime of Apartheid (which must have been ratified by the end of October 2005). The remaining conventions must be ratified within the lifetime of the regulations i.e. by December 2008. These conventions include Montreal Protocol on Substances that deplete the Ozone Layer; Basel Convention on the Control of Transboundary Movements of Hazardous Wastes and Their Disposal; Stockholm Convention on persistent Organic Pollutants; Convention on International Trade in Endangered Species; Convention on Biological Diversity; Cartagena Protocol on Biosafety; Kyoto Protocol to the UN Framework Convention on Climate Change; UN Single Convention on Narcotic Drugs (1961); UN Convention on Psychotropic Substances (1971); UN Convention against Illicit Traffic in Narcotic Drugs and Psychotropic Substances (1988); Mexico UN Convention Against Corruption.
77

Currently, the European Commission has granted GSP+ benefits to the five Andean countries (Bolivia, Columbia, Ecuador, Peru & Venezuela), six Central America countries (Costa Rica, El Salvador, Guatemala, Honduras, Nicaragua and Panama), Moldova, Georgia, Mongolia and Sri Lanka.
Under the GSP product-country combinations can be graduated from the GSP if they became competitive on the EU market. Under the previous scheme (1995-2005), the combinations excluded were chosen (ostensibly) objectively, by a complex formula designed by the Commission to assess a beneficiary’s level of industrial development and sectoral specialisation. In addition to this, any beneficiary that took over 25 percent of the benefits for a given product lost preferences for that product. As a result, certain products from large countries (e.g. Brazil, China, India, and Indonesia) were excluded.
Under the latest EU GSP, graduation has been made simpler. Product-country combinations are now excluded if the country’s share of exports to the EU are greater than 15% of exports from all GSP countries in the product. For T&C, the threshold is 12.5%.
78

Annex 5: EU tariffs on textiles and clothing products 2005
HS Chapter Product Average MFN tariff (%)
Average GSP tariff (%)
Average ACP tariff (%)
Average EBA tariff (%)
Textile products50 Silk 5.46 4.37 0.13 0.0051 Wool 4.00 3.23 0.00 0.0052 Cotton 6.99 5.59 0.00 0.00
53 Vegetable textile fibers 2.96 2.36 0.00 0.00
54 Manmade filaments 5.61 4.66 0.86 0.00
55 Manmade staple fibers 6.37 5.13 0.17 0.00
56 Wadding 5.45 4.64 1.49 0.0057 Carpets 7.65 6.11 0.00 0.00
58 Special woven fabrics 7.28 5.82 0.07 0.00
59 Laminated textile fabrics 6.48 5.39 1.13 0.00
60Knitted or crocheted fabrics
7.95 6.36 0.00 0.00
63 Textile articles 10.25 8.24 0.23 0.00Average textiles 6.70 5.42 0.34 0.00
Clothing products
61Clothing & apparel: knitted or crocheted
11.68 9.34 0.00 0.00
62
Clothing & apparel: not knitted or crocheted
11.45 9.15 0.00 0.00
Average clothing 11.54 9.23 0.00 0.00Source: UNCTAD (2006).
79

Annex 6: List of Least Developed Countries
Afghanistan Madagascar
Angola MalawiBangladesh MaldivesBenin MaliBhutan MauritaniaBurkina Faso MozambiqueBurundi MyanmarCambodia NepalCape Verde NigerCentral African Republic RwandaChad SamoaComoros Sao Tome and PrincipeDemocratic Republic of Congo SenegalDjibouti Sierra LeoneEquatorial Guinea Solomon IslandsEritrea SomaliaEthiopia SudanGambia TogoGuinea TuvaluGuinea Bissau UgandaHaiti TanzaniaKiribati VanuatuLaos YemenLesotho ZambiaLiberia
80

Annex 7: EU trade arrangements with the ACP countries
The country-coverage of EU/ACP arrangements has evolved through the two Yaoundé Conventions (1964-76), the four Lomé Conventions (1976-2000) and the ACP/Cotonou Agreement (2000-08) - see Table 10. Yaoundé I and II provided for tariff preferences on imports of industrial products from former African colonies along with financial assistance. The Arusha Convention in 1969 gave separate benefits to Kenya, Uganda and Tanzania. The UK’s accession to the EU in 1973 led to the first Lomé Convention, which expanded membership to a number of former British colonies in Africa and the Caribbean. The subsequent Lomé Conventions significantly broadened country coverage such that by Lomé IV all ACP LDCs were included.
Table 10: Chronology of interactions between the EU and the ACP
EU-ACP Arrangement
Effective SignatoriesEuropean Developing Countries
Treaty of Rome – Convention of Application Part IV
Signed: 28/2/57Effective: 1/1/58
BelgiumFranceGermanyItalyLuxembourgNetherlands
Overseas Countries and Territories (31)French: Algeria, Chad, Comoros, Dahomey, Cameroon, French Somaliland, Sudan, Gabon, Guinea, Côte d’Ivoire, Madagascar, Mauritania, French Congo, Niger, Reunion, Senegal, Togo, Ubangi-Chari, Guadeloupe, Guyana, French Polynesia, French Southern Antarctic Territories, Martinique, New Caledonia, St. Pierre and MiquelonBelgian: Belgian Congo, Ruanda-UrundiItalian: SomalilandNetherlands: New Guinea
Youndé I Signed: 20 /7/63Effective: 1/7/64
As above Association of African States and Madagascar (16) Burundi, Central African Republic, Chad, People’s Republic of Congo, Democratic Republic of Congo, Benin, Gabon, Côte d’Ivoire, Madagascar, Mali, Mauritania, Senegal, Somalia, Togo, Cameroon, Burkina Faso
Youndé II Signed: 1/7/69Effective: 1/1/71Expired: 31/7/76
As above + DenmarkIrelandUK
16 AASM states (cf. Youndé I) Plus Mauritius (1972) Plus Kenya, Tanzania and Uganda (through Arusha Convention in 1969)
Lomé I Signed: 28/2/75Effective: 1/4/76Expired: 1/3/80
As above ACP (46)African ACP: As before plus, Botswana, Equatorial Guinea, Ethiopia, Gambia, Ghana, Sierra Leone, Sudan, Swaziland, ZambiaCaribbean ACP: Bahamas, Barbados, Grenada, Guyana, Jamaica, Trinidad and TobagoPacific ACP: Fiji, Samoa, Tonga
Lomé II Signed: 1/10/79Effective: 1/1/81
As above + Greece ACP (57)African ACP: As before plus, Cape Verde, Djibouti, Sao Tome and Principe, Seychelles, ZimbabweCaribbean ACP: As before plus, Dominica, Saint Lucia, SurinamePacific ACP: As before plus, Kiribati, Papua New Guinea, Solomon Islands, Tuvalu
Lomé III Signed: 8/12/84Effective: 1/5/86
As above + SpainPortugal
ACP (66)African ACP: As before plus, Angola, MozambiqueCaribbean ACP: As before plus, Antigua and Barbuda, Belize, St. Christopher and Nevis, St. Vincent and GrenadinesPacific ACP: As before plus, Vanuatu
Lomé IV Signed: 15/12/89Effective: 1/1/90Expired: 21/2/00
As above ACP (71)African ACP: As before plus, Eritrea, Namibia, RSACaribbean ACP: As before plus, Dominican Republic, HaitiPacific ACP: As before
ACP/Cotonou Agreement
Signed: 23 June 2000
As above + Austria SwedenFinland
ACP (78)As before plus, Cuba, Cook Islands, Marshall Islands, Nauru, Niue, Palau
The successive Lomé agreements provided duty-free access for all industrial products as well as for most tropical and mineral products. Some agricultural products received tariff preferences (restricted by quota) and some ACP countries benefited from Special Trade Protocols (for bananas, sugar, beef/veal, and rum) which provided (limited) access to the highly protected European market. They were also subject to less restrictive ROOs which allowed cumulation among all ACP beneficiary countries (whereas GSP only allows cumulation within designated groups of countries). Lomé also liberalized its ROOs over time to allow cumulation among certain non-ACP developing countries, with exceptions for certain products, and
81

increases in permissible import-content. The ACP/Cotonou Agreement replaced the Lomé Convention and marked a shift from non-reciprocal tariff preferences to establishing reciprocal trade arrangements for all ACP countries. During an eight-year period, the Cotonou Agreement maintains Lomé IV non-reciprocal preferences while the EU and regional groups of ACP countries negotiate Economic Partnership Agreements (EPAs) which, if successful, will enter into force by 1 January 2008 and be phased in over a period of 10-12 years.
82

Annex 8: US tariffs on textiles and clothing products 2005
HS Chapter Product Average MFN tariff (%)
Average GSP tariff (%)
Average GSP tariff for LDCs
(%)
Average AGOA tariff with textile
and clothing provisions (%)
Textile products50 Silk 0.92 0.60 0.60 0.6051 Wool 6.68 6.49 6.49 6.4952 Cotton 8.56 8.44 8.44 8.44
53 Vegetable textile fibers 1.66 1.46 1.46 1.46
54 Manmade filaments 10.16 10.02 10.02 10.02
55 Manmade staple fibers 10.99 10.99 10.99 10.99
56 Wadding 4.26 3.66 3.66 3.6657 Carpets 2.80 2.65 2.65 2.65
58 Special woven fabrics 6.96 6.96 6.96 6.96
59 Laminated textile fabrics 3.10 2.76 2.76 2.76
60Knitted or crocheted fabrics
10.10 10.10 10.10 10.10
63 Textile articles 6.72 6.33 6.33 6.33Average textiles 7.54 7.36 7.36 7.36
Clothing products
61Clothing & apparel: knitted or crocheted
11.58 11.46 11.46 0.00
62
Clothing & apparel: not knitted or crocheted
10.11 9.99 9.99 0.00
Average clothing 10.76 10.64 10.64 0.00Source: UNCTAD (2006).
83

Annex 9: The African Growth and Opportunity Act
The original AGOA (AGOA I) allowed duty-free access to the US market for clothing incorporating fabrics knitted or woven in eligible sub-Saharan African countries from yarns spun in those countries or the US. For the first year of the program (1 October 2000 – 30 September 2001) a preferential quota of 1.5% of total US imports (during the previous year) was established. This amount grew to 3.5% at the end of the fourth year and was to continue at that level until the termination of the program, originally set (but see below) for 20 September 2008. Duty-free access was provided for fabrics, made-up goods and clothing that were hand-loomed, hand woven or certified as being folkloric or ethnic in nature.
In 2002, AGOA II expanded the preferential quota for clothing incorporating fabrics and yarns made in sub-Saharan Africa or the US from 3 percent in AGOA year-3 to 7 percent in AGOA year-8. Knit-to-shape clothing began to qualify for duty-free and quota-free treatment. AGOA II also made eligible hybrid cutting-apparel partially cut both in the US and AGOA countries. Finally, AGOA II removed an arbitrary weight requirement for woolen sweaters. A more liberal ROO was introduced. The definition of full-assembly, a requirement for AGOA eligibility, was modified to allow the use of third-country inputs namely, collars, cuffs, drawstrings, padding, waistbands, belts attached to garments, straps with elastic and elbow patches. AGOA producers were allowed to incorporate up to 10% by value of non-qualifying inputs into their clothing exports to the US without losing AGOA eligibility.
The AGOA Acceleration Act of 2004 (AGOA III) extended preferences from 2008 until 2015. It also extended the TCF derogation for three years (until 30 September 2007).
AGOA IV, officially called ‘Extension of preferences for Africa, Haiti, Andean countries and the Generalized System of Preferences; PNTR for Vietnam, and Miscellaneous Trade Bills’, was passed by the US Senate on 9 December 2006. This will extend the TCF derogation until 2013. It also introduces new rules regarding the availability of locally produced fabric. An annual determination will be made on which fabrics are sufficiently available within the region. This would require lesser developed countries eligible for the TCF derogation to use such regional fabrics prior to the use of foreign fabric in the year following that when such a determination is made. Already, denim is determined to be in abundant supply. If fabric is determined to be in abundant supply but not used for two successive years, then clothing made from this fabric will not be eligible for preferences in the US market under AGOA in subsequent years unless such fabric (available to lesser developed countries) has already been used by South Africa and Mauritius in the manufacture of preference-receiving clothing exports. AGOA IV also extends preferences to textiles products that are wholly produced in AGOA lesser developed countries i.e. excluding Mauritius and South Africa. All materials must be originating in lesser developed AGOA beneficiaries for preferences to be granted on these products.
84

Annex 10: Trade data availability
Year Countries1994 Algeria, Argentina, Australia, Austria, Bangladesh (exports only), Belice, Bermuda (exports only), Bhutan, Bolivia, Brazil, Brunei, Burundi, Canada,
Central African Republic, Chile, China, Colombia, Congo, Rep., Costa Rica, Croatia, Cyprus, Czech Republic, Denmark, Dominica, Ecuador, Egypt, Arab Rep., El Salvador, Finland, France, French Guiana, Gabon, Germany, Greece, Greenland, Grenada, Guadeloupe, Guatemala, Haiti (exports only), Honduras, Hong Kong, Hungary, Iceland, India, Indonesia, Ireland, Italy, Japan, Jordan, Korea, Rep., Latvia, Lithuania, Macao, Macedonia, FYR, Madagascar, Malawi, Malaysia, Malta, Martinique, Mauritius, Mexico, Moldova, Morocco, Mozambique, Nepal, Netherlands, New Zealand, Nicaragua, Norway, Oman, Paraguay, Peru, Poland, Portugal, Reunion, Romania, Saudi Arabia, Seychelles, Singapore, Slovak Republic, Slovenia, South Africa, Spain, Sri Lanka, St. Kitts and Nevis, St. Lucia, St. Vincent and the Grenadines, Suriname, Sweden, Switzerland, Thailand, Togo, Trinidad and Tobago, Tunisia, Turkey, Uganda, United Kingdom, United States, Uruguay, Vanuatu, Venezuela
1995 Algeria, Andorra, Argentina, Australia, Austria, Bangladesh, Belgium-Luxembourg, Belize, Bermuda, Bolivia, Brazil, Burkina Faso, Burundi, Cameroon, Canada, Central African Republic, Chad (imports only), Chile, China, Colombia, Comoros, Congo, Rep., Costa Rica, Cote d'Ivoire, Croatia, Cyprus, Czech Republic, Denmark, Dominica, Ecuador, Egypt, Arab Rep., El Salvador, Estonia, Ethiopia, Finland, France, French Guiana, Gambia, Germany, Greece, Greenland, Grenada, Guadeloupe, Guatemala, , Guinea, Haiti (exports only), Honduras, Hong Kong, Hungary, Iceland, India, Indonesia, Ireland, Israel, Italy, Japan, Jordan, Kazakhstan, Kiribati, Korea, Rep., Kyrgyz Republic, Latvia, Lithuania, Macao, Macedonia, FYR, Madagascar, Malawi, Malaysia, Maldives, , Malta, Martinique, Mauritius, Mexico, Moldova, Morocco, Mozambique, Netherlands, New Zealand, Nicaragua, Niger, Norway, Oman, Panama, Paraguay, Peru, Poland, Portugal, Reunion, Romania, Saudi Arabia, Seychelles, Singapore, Slovak Republic, Slovenia, South Africa, Spain, St. Kitts and Nevis, St. Lucia, St. Vincent and the Grenadines, Sudan, Suriname, Sweden, Switzerland, Tanzania (imports only), Thailand, Togo, Trinidad and Tobago, Tunisia, Turkey, Uganda, United Kingdom, United States, Uruguay, Venezuela, Zambia, Zimbabwe
1996 Albania, Algeria, Andorra, Argentina, Australia, Austria, Azerbaijan, Bangladesh, Belgium-Luxembourg, Belize, Bolivia, Brazil, Bulgaria, Burkina Faso, Burundi, Cameroon, Canada, Central African Republic, Chile, China, Colombia, Comoros, Costa Rica, Cote d'Ivoire, Croatia, Cyprus, Czech Republic, Denmark, Dominica, Dominican Republic (exports only), Ecuador, Egypt, Arab Rep., El Salvador, Estonia, Faeroe Islands, Finland, France, French Polynesia, Gabon., Gambia, Georgia, Germany, Ghana, Greece, Greenland, Grenada, Guatemala, Guinea, Haiti (exports only), Honduras, Hong Kong, Hungary, Iceland, India, Indonesia, Ireland, Israel, Italy, Jamaica, Japan, Kazakhstan, Kiribati, Korea, Rep., Kyrgyz Republic, Latvia, Lithuania, Macao, Macedonia, FYR, Madagascar, Malawi (exports only), Malaysia, Maldives, Mali, Malta, Mauritius, Mexico, Moldova, Mongolia, Morocco, Mozambique, Netherlands, New Zealand, Nicaragua, Niger, Nigeria, Norway, Oman, Panama, Paraguay, Peru, Philippines, Poland, Portugal, Romania, Russian Federation, Rwanda, Saudi Arabia, Senegal, Seychelles, Singapore, Slovak Republic, Slovenia, Solomon Islands (imports only), South Africa, Spain, St. Kitts and Nevis, St. Lucia, St. Vincent and the Grenadines (exports only), Sudan, Suriname, Sweden, Switzerland, Tanzania (imports only), Thailand, Togo, Trinidad and Tobago, Tunisia, Turkey, Uganda, Ukraine, United Kingdom, United States, Uruguay, Venezuela, Yugoslavia, Zambia
1997 Albania, Algeria, Andorra, Argentina, Armenia, Australia, Austria, Azerbaijan, Bahamas, Bangladesh, Barbados, Belgium-Luxembourg, Belize, Bermuda (imports only), Bolivia, Brazil, Brunei, Bulgaria, Burkina Faso, Burundi, Cameroon, Canada, Cape Verde, Central African Republic, Chile, China, Colombia, Comoros, Costa Rica, Cote d'Ivoire, Croatia, Cyprus, Czech Republic, Denmark, Dominica, Dominican Republic (exports only), Ecuador, Egypt, Arab Rep., El Salvador, Estonia, Ethiopia, Faeroe Islands, Finland, France, French Polynesia, Gabon, Gambia, Georgia, Germany, Ghana, Greece, Greenland, Grenada, Guatemala, Guinea, Guyana, Haiti (exports only), Honduras, Hong Kong, Hungary, Iceland, India, Indonesia, Iran , Ireland, Israel, Italy, Jamaica, Japan, Jordan, Kazakhstan, Kenya, Kiribati, Korea, Rep., Latvia, Lebanon, Lithuania, Macao, Macedonia, FYR, Madagascar, Malawi (exports only), Malaysia, Maldives, Mali, Malta, Mauritius, Mexico, Moldova, Mongolia, Morocco, Mozambique, Netherlands, New Zealand, Nicaragua, Niger, Nigeria, Norway, Oman, Panama, Paraguay, Peru, Philippines, Poland, Portugal, Romania, Russian Federation, Rwanda, Senegal, Seychelles, Singapore, Slovak Republic, Slovenia, South Africa, Spain, St. Kitts and Nevis, St. Lucia, St. Vincent and the Grenadines, Sudan, Sweden, Switzerland, Taiwan (China), Tanzania, Thailand, Togo, Trinidad and Tobago, Tunisia, Turkey, Turkmenistan, Tuvalu (imports only), Uganda, Ukraine, United Kingdom, United States, Uruguay, Venezuela, Yugoslavia, Zambia
1998 Albania, Algeria, Andorra, Argentina, Australia, Austria, Azerbaijan, Bahamas, Bangladesh, Barbados, Belarus, Belgium-Luxembourg, Belize, Benin, Bhutan, Bolivia, Brazil, Brunei, Bulgaria, Burkina Faso, Burundi, Cameroon (imports only), Canada, Cape Verde, Central African Republic, Chile, China, Colombia, Comoros, Costa Rica, Cote d'Ivoire, Croatia, Cyprus, Czech Republic, Denmark, Ecuador, Egypt, Arab Rep., El Salvador, Estonia, Ethiopia, Faeroe Islands, Finland, France, French Polynesia, Gabon, Gambia, Georgia, Germany, Ghana, Greece, Greenland, Grenada, Guatemala, Guinea, Guyana, Honduras, Hong Kong, Hungary, Iceland, India, Indonesia, Iran, Ireland, Israel, Italy, Jamaica, Japan, Jordan, Kazakhstan, Kenya, Kiribati, Korea, Rep., Latvia, Lebanon, Lithuania, Macao, Macedonia, FYR, Madagascar, Malawi (exports only), Malaysia, Maldives, Mali, Malta, Mauritius, Mexico, Moldova , Mongolia, Morocco, Nepal, Netherlands, New Zealand, Nicaragua, Niger, Nigeria, Norway, Oman, Panama, Papua New Guinea, Paraguay, Peru, Philippines, Poland, Portugal, Romania, Russian Federation, Rwanda, Saudi Arabia, Senegal, Seychelles, Singapore, Slovak Republic, Slovenia, South Africa, Spain, St. Lucia, St. Vincent and the Grenadines, Sudan, Sweden, Switzerland, Taiwan (China), Tanzania, Thailand, Togo, Trinidad and Tobago, Tunisia, Turkey, Turkmenistan, Tuvalu (imports only), Uganda, Ukraine, United Kingdom, United States, Uruguay, Venezuela, Yugoslavia, Zambia
1999 Albania, Algeria, Andorra, Antigua and Barbuda, Argentina, Armenia, Australia, Austria, Azerbaijan, Bahamas , Barbados, Belarus, Belgium, Belize, Benin, Bhutan, Bolivia, Brazil, Bulgaria, Burkina Faso, Burundi, Cameroon (imports only), Canada, Cape Verde, Central African Republic, Chile, China, Colombia, Comoros, Costa Rica, Cote d'Ivoire, Croatia, Cuba, Cyprus, Czech Republic, Denmark, Dominica, Ecuador, Egypt, Arab Rep., El Salvador, Estonia, Ethiopia, Faeroe Islands, Finland, France, French Polynesia, Gabon, Gambia, Georgia, Germany, Ghana, Greece, Greenland, Grenada, Guatemala, Guinea, Guyana, Honduras, Hong Kong, Hungary, Iceland, India, Indonesia, Iran, Ireland, Israel, Italy, Jamaica, Japan, Jordan, Kazakhstan, Kenya, Kiribati, Korea, Rep., Latvia, Lebanon, Lithuania, Luxembourg, Macao, Macedonia, FYR, Madagascar, Malawi, Malaysia, Maldives, Mali, Malta, Mauritius, Mexico, Moldova, Mongolia, Montserrat, Morocco, Mozambique (exports only), Nepal, Netherlands, New Caledonia, New Zealand, Nicaragua, Niger, Nigeria, Norway, Oman, Panama, Paraguay, Peru, Philippines, Poland, Portugal, Romania, Russian Federation, Rwanda, Sao Tome and Principe, Saudi Arabia, Senegal, Seychelles, Singapore, Slovak Republic, Slovenia, South Africa, Spain, Sri Lanka, St. Kitts and Nevis, St. Lucia, St. Vincent and the Grenadines, Sudan, Suriname, Sweden, Switzerland, Taiwan (China), Tanzania, Thailand, Togo, Trinidad and Tobago, Tunisia, Turkey, Turkmenistan, Turks and Caicos Isl., Tuvalu (imports only), Uganda, Ukraine, United Arab Emirates, United Kingdom, United States, Uruguay, Venezuela, Yugoslavia, Zambia
85

Year Countries2000 Albania, Algeria, Andorra, Anguila, Antigua and Barbuda, Argentina, Armenia, Australia, Austria, Azerbaijan, Bahamas, Bahrain, Bangladesh,
Barbados, Belarus, Belgium, Belize, Benin, Bolivia, Botswana, Brazil, Bulgaria, Burkina Faso, Burundi, Cambodia, Canada, Cape Verde, Central African Republic, Chile, China, Colombia, Comoros, Cook Islands (exports only), Costa Rica, Cote d'Ivoire, Croatia, Cuba, Cyprus, Czech Republic, Denmark, Dominica, Ecuador, Egypt, Arab Rep., El Salvador, Estonia, Ethiopia, Fiji (exports only), Finland, France, French Polynesia, Gabon, Gambia, Georgia, Germany, Ghana, Greece, Greenland, Grenada, Guatemala, Guinea, Guyana, Honduras, Hong Kong, Hungary, Iceland, India, Indonesia, Iran, Ireland, Israel, Italy, Jamaica, Japan, Jordan, Kazakhstan, Kenya, Korea, Rep., Kuwait, Kyrgyz Republic, Latvia, Lebanon, Lesotho, Lithuania, Luxembourg, Macao, Macedonia, FYR, Madagascar, Malawi, Malaysia, Maldives, Mali, Malta, Mauritius, Mexico, Moldova, Mongolia, Montserrat, Morocco, Mozambique, Namibia, Nepal, Netherlands, New Caledonia, New Zealand, Nicaragua, Niger, Nigeria, Norway, Oman, Panama, Papua New Guinea, Paraguay, Peru, Philippines, Poland, Portugal, Qatar, Romania, Russian Federation, Sao Tome and Principe, Saudi Arabia, Senegal, Singapore, Slovak Republic, Slovenia, South Africa, Spain, St. Kitts and Nevis, St. Lucia, St. Vincent and the Grenadines, Sudan, Suriname, Swaziland, Sweden, Switzerland, Taiwan (China), Tajikistan, Tanzania, Thailand, Togo, Tonga, Trinidad and Tobago, Tunisia, Turkey, Turkmenistan, Turks and Caicos Isl., Uganda, Ukraine, United Arab Emirates, United Kingdom, United States, Uruguay, Vanuatu, Venezuela, Yugoslavia, Zambia, Zimbabwe (exports only)
2001 Albania, Algeria, Andorra, Anguila, Argentina, Australia, Austria, Azerbaijan, Bahamas, Bahrain, Bangladesh, Barbados, Belarus, Belgium, Belize, Benin, Bolivia, Botswana, Brazil, Brunei, Bulgaria, Burkina Faso, Burundi, Cambodia, Cameroon, Canada, Cape Verde, Central African Republic, Chile, China, Colombia, Cook Islands, Costa Rica, Croatia, Cuba, Cyprus, Czech Republic, Denmark, Dominica, Dominican Republic, Ecuador, Egypt, Arab Rep., El Salvador, Estonia, Ethiopia, Finland, France, French Polynesia, Gabon, Gambia, Georgia, Germany, Ghana, Greece, Greenland, Grenada, Guatemala, Guinea, Guyana, Honduras, Hong Kong, Hungary, Iceland, India, Indonesia, Iran, Ireland, Israel, Italy, Jamaica, Japan, Jordan, Kazakhstan, Kenya, Korea, Rep., Kuwait, Kyrgyz Republic, Latvia, Lebanon, Lesotho, Lithuania, Luxembourg, Macao, Macedonia, FYR, Madagascar, Malawi, Malaysia, Maldives, Mali, Malta, Mauritius, Mexico, Moldova, Mongolia, Montserrat, Morocco, Mozambique, Namibia, Netherlands, New Caledonia, New Zealand, Nicaragua, Niger, Nigeria, Norway, Oman, Panama, Papua New Guinea, Paraguay, Peru, Philippines, Poland, Portugal, Qatar, Romania, Russian Federation, Rwanda, Samoa, Sao Tome and Principe, Saudi Arabia, Senegal, Seychelles (imports only), Singapore, Slovak Republic, Slovenia, South Africa, Spain, Sri Lanka, St. Kitts and Nevis, St. Lucia, St. Vincent and the Grenadines, Sudan, Suriname, Swaziland, Sweden, Switzerland, Syrian Arab Republic, Taiwan (China), Tanzania, Thailand, Togo, Trinidad and Tobago, Tunisia, Turkey, Turks and Caicos Isl., Uganda, Ukraine, United Arab Emirates, United Kingdom, United States, Uruguay, Venezuela, Wallis and Futura Isl. (imports only), Yugoslavia, Zambia, Zimbabwe
2002 Albania, Algeria, Andorra, Anguila, Argentina, Armenia, Aruba, Australia, Austria, Azerbaijan, Bahrain, Bangladesh, Barbados, Belarus, Belgium, Belize, Benin, Bolivia, Brazil, Brunei, Bulgaria, Burkina Faso, Burundi, Cambodia, Canada, Cape Verde, Central African Republic, Chile, China, Colombia, Cook Islands, Costa Rica, Cote d'Ivoire, Croatia, Cyprus, Czech Republic, Denmark, Dominica, Ecuador, Egypt, Arab Rep., El Salvador, Estonia, Ethiopia, Faeroe Islands, Fiji, Finland, France, French Polynesia, Gabon, Gambia, Georgia, Germany, Ghana (imports only), Greece, Greenland, Grenada, Guatemala, Guinea, Guyana, Honduras, Hong Kong, Hungary, Iceland, India, Indonesia, Iran, Ireland, Israel, Italy, Jamaica, Japan, Jordan, Kenya, Korea, Rep., Kyrgyz Republic, Latvia, Lebanon, Lesotho, Lithuania, Luxembourg, Macao, Macedonia, FYR, Madagascar, Malawi, Malaysia, Maldives, Malta, Mauritius, Mexico, Moldova, Mongolia (exports only), Montserrat, Morocco, Mozambique, Namibia, Netherlands, New Caledonia, New Zealand, Nicaragua, Niger, Nigeria, Norway, Oman, Panama, Papua New Guinea, Paraguay, Peru, Philippines, Poland, Portugal, Qatar, Romania, Russian Federation, Rwanda, Samoa, Sao Tome and Principe, Saudi Arabia, Senegal, Seychelles (imports only), Sierra Leone,, Singapore, Slovak Republic, Slovenia, South Africa, Spain, Sri Lanka, St. Kitts and Nevis, St. Lucia, St. Vincent and the Grenadines, Sudan, Swaziland, Sweden, Switzerland, Syrian Arab Republic, Taiwan (China), Tanzania, Togo, Trinidad and Tobago, Tunisia, Turkey, Turks and Caicos Isl., Uganda, Ukraine, United Kingdom, United States, Uruguay, Venezuela, Wallis and Futura Isl. (imports only), Yugoslavia, Zambia, Zimbabwe
2003 Albania, Algeria, Andorra, Anguila, Argentina, Armenia, Aruba, Australia, Austria, Azerbaijan, Bahrain, Bangladesh, Barbados, Belarus, Belgium, Belize, Bolivia, Bosnia and Herzegovina, Brazil, Brunei, Bulgaria, Burkina Faso, Burundi, Cambodia, Cameroon, , Canada, Cape Verde, Central African Republic, Chile, China, Colombia, Cook Islands, Costa Rica, Cote d'Ivoire, Croatia, Cyprus, Czech Republic, Denmark, Dominica, Ecuador, Egypt, Arab Rep., El Salvador, Eritrea, Estonia, Ethiopia, Faeroe Islands, Fiji, Finland, France, French Polynesia, Gabon, Gambia, Georgia, Germany, Ghana, Greece, Grenada, Guatemala, Guyana, Honduras, Hong Kong, Hungary, Iceland, India, Indonesia, Iran, Ireland, Israel, Italy, Japan, Jordan, Kazakhstan, Kenya, Korea, Rep., Kyrgyz Republic, Latvia, Lebanon, Lithuania, Luxembourg, Macao, Macedonia, FYR, Madagascar, Malawi, Malaysia, Maldives, Malta, Mauritius, Mexico, Moldova, Mongolia, Montserrat, Morocco, Namibia, Nepal, Netherlands, New Caledonia, New Zealand, Nicaragua, Niger, Nigeria, Norway, Oman, Pakistan, Panama, Papua New Guinea, Paraguay (exports only), Peru, Philippines, Poland, Portugal, Qatar, Romania, Russian Federation, Rwanda, Samoa, Sao Tome and Principe, Saudi Arabia (imports only), Senegal, Seychelles, Singapore, Slovak Republic, Slovenia, South Africa, Spain, Sri Lanka, St. Kitts and Nevis, St. Lucia, St. Vincent and the Grenadines, Sudan, Sweden, Switzerland, Syrian Arab Republic, Taiwan (China), Tanzania, Thailand, Togo, Trinidad and Tobago, Tunisia, Turkey, Turks and Caicos Isl., Uganda, Ukraine, United Kingdom, United States, Uruguay, Venezuela, Wallis and Futura Isl. (imports only), Zambia
2004 Albania, Algeria, Andorra, Anguila, Argentina, Armenia, Aruba, Australia, Austria, Azerbaijan, Bangladesh, Barbados, Belarus, Belgium, Bolivia, Bosnia and Herzegovina, Brazil, Bulgaria, Burkina Faso, Burundi, Cambodia, Cameroon, Canada, Cape Verde, Chile, China, Colombia, Cook Islands, Costa Rica, Croatia, Cyprus, Czech Republic, Denmark, Dominica, Ecuador, Egypt, Arab Rep., El Salvador, Estonia, Faeroe Islands, Fiji, Finland, France, French Polynesia, Gabon, Georgia, Germany, Ghana, Greece, Guatemala, Guyana, Hong Kong, Hungary, Iceland, India, Indonesia, Ireland, Israel, Italy, Japan, Jordan, Kazakhstan, Kenya, Korea, Rep., Kyrgyz Republic, Latvia, Lithuania, Luxembourg, Macao, Macedonia, FYR, Madagascar, Malawi, Malaysia, Maldives, Malta, Mauritius, Mexico, Moldova, Montserrat, Morocco, Netherlands, New Caledonia, New Zealand, Nicaragua, Norway, Oman, Pakistan, Panama (exports only), Paraguay, Peru, Philippines, Poland, Portugal, Qatar, Romania, Russian Federation, Samoa, Senegal, Seychelles, Singapore, Slovak Republic, Slovenia, South Africa, Spain, Sri Lanka, St. Lucia, St. Vincent and the Grenadines, Sweden, Switzerland, Syrian Arab Republic, Taiwan (China), Tanzania, Thailand, Togo, Tunisia, Turkey, Turks and Caicos Isl., Uganda, Ukraine, United Kingdom, United States, Uruguay, Venezuela, Yemen, Yugoslavia, Zambia, Zimbabwe
2005 Albania, Australia, Austria, Bahrain, Belarus, Belgium, Canada, Central African Republic, China, Croatia, Denmark, Dominica, Estonia, Finland, France, French Polynesia, Germany, Greece, Hong Kong, Iceland, Indonesia, Ireland, Italy, Japan, Jordan, Korea, Rep., Kyrgyz Republic, Macedonia, FYR, Malawi, Maldives, Mexico, Montserrat, Mozambique, New Caledonia, New Zealand, Philippines, Romania, Senegal, Singapore, South Africa, Switzerland, Thailand, Togo, Ukraine, United Kingdom, United States
Source: UN (2006).
86

Annex 11: Major exporters of textiles 1994-2005 (excluding intra-EU trade)
US$ billions (% of world exports)1994 1995 1996 1997 1998 1999 2000 2001 2002 2003 2004 2005*
World 81.25 93.18 95.87 100.67 97.79 97.13 106.60 104.13 105.73 116.84 129.20 130.62
China 13.69(16.8%)
15.30(16.4%)
14.56(15.2%)
15.31(15.2%)
14.18(14.5%)
14.97(15.4%)
18.48(17.3%)
18.51(17.8%)
20.61(19.5%)
25.76(22.0%)
31.24(24.2%)
38.95(29.8%)
EU 11.17(13.7%)
13.59(14.6%)
14.62(15.2%)
14.98(14.9%)
15.81(16.2%)
15.06(15.5%)
15.44(14.5%)
15.89(15.3%)
16.54(15.6%)
18.63(15.9%)
20.49(15.9%)
14.76(11.3%)
US 5.93(7.3%)
6.77(7.3%)
7.42(7.7%)
8.38(8.3%)
8.69(8.9%)
9.44(9.7%)
10.26(9.6%)
9.30(8.9%)
9.04(8.6%)
8.86(7.6%)
9.20(7.1%)
9.26(7.1%)
Taiwan, China
9.28(11.4%)
9.70(10.4%)
10.25(10.7%)
10.35(10.3%)
9.71(9.9%)
9.33(9.6%)
9.67(9.1%)
8.74(8.4%)
7.79(7.4%)
7.53(6.4%)
7.64(5.9%)
6.38(4.9%)
India 3.00(3.7%)
3.92(4.2%)
4.57(4.8%)
5.70(5.7%)
5.23(5.3%)
5.10(5.3%)
5.48(5.1%)
5.37(5.2%)
5.65(5.3%)
6.30(5.4%)
7.22(5.6%)
8.34(6.4%)
Korea, Rep.
7.97(9.8%)
9.16(9.8%)
9.12(9.5%)
8.83(8.8%)
7.86(8.0%)
7.97(8.2%)
8.80(8.3%)
8.11(7.8%)
7.53(7.1%)
7.33(6.3%)
7.00(5.4%)
6.51(5.0%)
Japan 5.52(6.8%)
5.95(6.4%)
5.81(6.1%)
5.89(5.9%)
5.23(5.3%)
5.47(5.6%)
5.99(5.6%)
5.37(5.2%)
4.94(4.7%)
5.42(4.6%)
5.99(4.6%)
5.79(4.4%)
Pakistan 3.04(3.7%)
3.79(4.1%)
3.88(4.0%)
4.07(4.0%)
3.90(4.0%)
3.70(3.8%)
4.11(3.9%)
4.27(4.1%)
4.36(4.1%)
4.83(4.1%)
5.56(4.3%)
6.43(4.9%)
Turkey 1.32(1.6%)
1.68(1.8%)
1.87(2.0%)
2.28(2.3%)
2.70(2.8%)
2.85(2.9%)
2.87(2.7%)
3.30(3.2%)
3.58(3.4%)
4.41(3.8%)
5.30(4.1%)
7.90(6.0%)
Hong Kong 3.88(4.8%)
3.89(4.2%)
3.72(3.9%)
3.31(3.3%)
3.27(3.3%)
3.19(3.3%)
3.38(3.2%)
3.66(3.5%)
3.68(3.5%)
3.73(3.2%)
3.50(2.7%)
2.06(1.6%)
Indonesia 1.82(2.2%)
2.19(2.4%)
2.33(2.4%)
2.44(2.4%)
2.58(2.6%)
2.35(2.4%)
2.38(2.2%)
2.35(2.3%)
2.26(2.1%)
2.37(2.0%)
2.42(1.9%)
2.15(1.6%)
Thailand 1.14(1.4%)
1.39(1.5%)
1.43(1.5%)
1.59(1.6%)
1.49(1.5%)
1.49(1.5%)
1.58(1.5%)
1.55(1.5%)
1.54(1.5%)
1.67(1.4%)
1.97(1.5%)
1.80(1.4%)
Canada 0.90(1.1%)
1.09(1.2%)
1.29(1.3%)
1.48(1.5%)
1.62(1.7%)
1.72(1.8%)
1.89(1.8%)
1.90(1.8%)
1.88(1.8%)
1.87(1.6%)
1.95(1.5%)
1.97(1.5%)
Mexico 0.60(0.7%)
1.00(1.1%)
1.19(1.2%)
1.46(1.5%)
1.52(1.6%)
1.62(1.7%)
1.84(1.7%)
1.73(1.7%)
1.81(1.7%)
1.74(1.5%)
1.78(1.4%)
1.77(1.4%)
Switzerland 1.71(2.1%)
1.91(2.0%)
1.71(1.8%)
1.52(1.5%)
1.60(1.6%)
1.44(1.5%)
1.34(1.3%)
1.28(1.2%)
1.25(1.2%)
1.38(1.2%)
1.44(1.1%)
2.13(1.6%)
Brazil 0.83(1.0%)
0.80(0.9%)
0.83(0.9%)
0.86(0.9%)
0.80(0.8%)
0.73(0.8%)
0.80(0.8%)
0.79(0.8%)
0.75(0.7%)
0.99(0.8%)
1.15(0.9%)
1.07(0.8%)
Australia 1.14(1.4%)
1.37(1.5%)
1.31(1.4%)
1.35(1.3%)
1.06(1.1%)
1.00(1.0%)
1.08(1.0%)
1.02(1.0%)
0.94(0.9%)
0.92(0.8%)
0.86(0.7%)
0.76(0.6%)
Malaysia 0.68(0.8%)
0.85(0.9%)
0.97(1.0%)
1.15(1.1%)
0.98(1.0%)
0.95(1.0%)
1.03(1.0%)
0.95(0.9%)
0.77(0.7%)
0.74(0.6%)
0.80(0.6%)
0.67(0.5%)
Israel 0.31(0.4%)
0.34(0.4%)
0.35(0.4%)
0.37(0.4%)
0.41(0.4%)
0.42(0.4%)
0.45(0.4%)
0.51(0.5%)
0.53(0.5%)
0.58(0.5%)
0.68(0.5%)
0.83(0.6%)
Others 7.32(9.0%)
8.49(9.1%)
8.64(9.0%)
9.35(9.3%)
9.15(9.4%)
8.33(8.6%)
9.73(9.1%)
9.53(9.2%)
10.28(9.7%)
11.78(10.1%)
13.01(10.1%)
11.09(8.5%)
* Preliminary. Data reported as world imports from countries.Source: UN (2006).
87

Annex 12: AGOA exports of textiles 1994-2005
US$ thousands (% of world exports)1994 1995 1996 1997 1998 1999 2000 2001 2002 2003 2004 2005*
World (US$ billions)
81.25 93.18 95.87 100.67 97.79 97.13 106.60 104.13 105.73 116.84 129.20 130.62
Benin 5,225 5,615 6,213 8,476 7,496 7,136 18,536 2,584 15,371 5,607 3,893 456Botswana .. .. .. .. .. .. 1,475 2,497 2,732 71 1,170 316Burkina Faso 330 275 197 103 1,488 344 3,143 4,611 5,482 2,571 590 1,473
Cameroon 8,951 13,452 12,280 14,103 12,538 7,191 7,197 7,412 3,656 2,753 1,356 1,694Cape Verde 19 4 120 34 8 84 275 291 97 13 127 100Chad 70 86 20 1,624 15 0 154 309 249 566 63 32Ethiopia 1,912 1,382 2,561 5,166 1,835 1,679 2,151 3,715 10,339 10,159 8,884 16,995Ghana 1,583 1,864 1,443 2,842 5,165 5,444 5,252 5,468 10,304 6,096 2,600 885Kenya 15,578 17,778 14,619 25,317 13,817 12,737 15,298 14,119 15,240 23,633 21,919 20,435Lesotho .. .. .. .. .. .. 217 1,278 68 710 705 1,504Madagascar 14,389 15,725 13,066 13,068 14,432 11,468 14,432 14,671 10,339 12,117 13,520 21,336Malawi 13,004 16,642 12,979 14,140 16,903 14,956 4,141 1,192 822 184 830 871Mali 531 661 654 15,605 16,418 2,517 1,274 1,808 1,463 636 448 910Mauritius 21,423 39,645 37,383 25,302 21,289 19,127 56,593 35,665 31,792 25,314 35,623 27,871Mozambique 3,189 3,480 674 7,787 6,609 4,243 1,908 1,511 1,776 2,131 2,289 2,812Namibia .. .. .. .. .. .. 470 515 737 521 1,543 1,664Niger 616 1,297 365 398 165 344 907 15,773 3,289 830 1,470 675Nigeria 7,781 26,260 27,575 34,456 30,970 22,401 23,826 20,035 16,738 20,597 32,559 24,458Rwanda 83 255 109 773 1,068 98 54 114 1,096 278 567 272Senegal 2,990 3,461 4,638 3,553 3,240 1,671 1,807 1,048 2,126 2,537 2,864 1,854Sierra Leone 891 750 376 680 214 386 1,037 845 1,135 911 1,864 2,193South Africa 214,266 252,802 284,849 308,052 261,351 274,607 349,576 367,333 359,737 339,083 377,189 418,237Swaziland .. .. .. .. .. .. 3,054 1,826 1,745 4,759 5,127 2,784Tanzania 25,558 26,805 22,434 12,968 6,637 6,414 11,713 15,787 13,171 19,561 31,689 16,447Uganda 310 87 1,348 4,726 680 742 446 421 695 1,220 1,786 1,203Zambia 17,939 32,011 36,414 44,800 37,545 33,465 29,794 32,798 27,413 26,116 31,411 40,775
All AGOA 356,639(0.44%)
460,336(0.49%)
480,319(0.50%)
543,974(0.54%)
459,885(0.47%)
427,053(0.44%)
554,729(0.52%)
553,626(0.53%)
537,614(0.51%)
508,978(0.44%)
582,086(0.45%)
608,252(0.47%)
* Preliminary. Data reported as world imports from AGOA countries.Source: UN (2006).
88
Annex 13: World exports of clothing 1994-2005 (excluding intra-EU trade)
US$ billions (% of world exports)1994 1995 1996 1997 1998 1999 2000 2001 2002 2003 2004 2005*
World 106.54 120.01 127.89 138.12 143.79 150.35 164.97 165.58 168.06 188.19 207.83 270.76
China 30.70(28.8%)
32.87(27.4%)
36.34(28.4%)
38.47(27.9%)
37.01(25.7%)
41.17(27.4%)
48.08(29.1%)
49.18(29.7%)
50.10(29.8%)
59.86(31.8%)
69.63(33.5%)
102.34(37.8%)
EU 9.42(8.8%)
11.21(9.3%)
12.11(9.5%)
11.78(8.5%)
11.66(8.1%)
10.95(7.3%)
11.01(6.7%)
11.28(6.8%)
11.34(6.7%)
12.43(6.6%)
13.15(6.3%)
10.86(4.0%)
Turkey 4.09(3.8%)
5.26(4.4%)
5.41(4.2%)
5.71(4.1%)
6.46(4.5%)
6.47(4.3%)
6.68(4.0%)
7.21(4.4%)
8.73(5.2%)
10.97(5.8%)
12.31(5.9%)
20.53(7.6%)
Hong Kong
10.13(9.5%)
10.46(8.7%)
10.22(8.0%)
10.62(7.7%)
10.92(7.6%)
10.98(7.3%)
10.42(6.3%)
9.57(5.8%)
10.51(6.3%)
9.22(4.9%)
9.53(4.6%)
10.06(3.7%)
Bangladesh 1.95(1.8%)
2.54(2.1%)
2.75(2.1%)
3.35(2.4%)
3.70(2.6%)
3.84(2.6%)
4.84(2.9%)
5.03(3.0%)
4.91(2.9%)
6.21(3.3%)
7.81(3.8%)
11.52(4.3%)
Mexico 1.85(1.7%)
2.87(2.4%)
3.89(3.0%)
5.46(4.0%)
6.93(4.8%)
7.99(5.3%)
8.93(5.4%)
8.37(5.1%)
7.99(4.8%)
7.48(4.0%)
7.28(3.5%)
6.70(2.5%)
India 3.74(3.5%)
4.23(3.5%)
4.21(3.3%)
4.12(3.0%)
4.33(3.0%)
4.58(3.0%)
5.13(3.1%)
5.10(3.1%)
5.36(3.2%)
6.22(3.3%)
6.89(3.3%)
12.13(4.5%)
Romania 1.03(1.0%)
1.40(1.2%)
1.66(1.3%)
1.93(1.4%)
2.43(1.7%)
2.55(1.7%)
2.72(1.6%)
3.36(2.0%)
3.89(2.3%)
4.79(2.5%)
5.31(2.6%)
9.30(3.4%)
Indonesia 2.90(2.7%)
3.26(2.7%)
3.49(2.7%)
3.93(2.8%)
3.98(2.8%)
4.07(2.7%)
4.69(2.8%)
4.81(2.9%)
4.24(2.5%)
4.72(2.5%)
5.19(2.5%)
6.79(2.5%)
Vietnam 0.64(0.6%)
0.83(0.7%)
1.11(0.9%)
1.35(1.0%)
1.33(0.9%)
1.42(0.9%)
1.69(1.0%)
1.60(1.0%)
2.43(1.4%)
4.00(2.1%)
4.48(2.2%)
5.44(2.0%)
Thailand 2.48(2.3%)
2.71(2.3%)
2.69(2.1%)
2.89(2.1%)
3.12(2.2%)
3.30(2.2%)
3.68(2.2%)
3.57(2.2%)
3.41(2.0%)
3.66(1.9%)
3.89(1.9%)
4.49(1.7%)
Tunisia 1.76(1.7%)
2.40(2.0%)
2.61(2.0%)
2.55(1.8%)
2.87(2.0%)
2.81(1.9%)
2.65(1.6%)
2.90(1.8%)
3.07(1.8%)
3.44(1.8%)
3.59(1.7%)
6.19(2.3%)
Morocco 1.84(1.7%)
2.25(1.9%)
2.31(1.8%)
2.34(1.7%)
2.57(1.8%)
2.52(1.7%)
2.45(1.5%)
2.66(1.6%)
2.82(1.7%)
3.21(1.7%)
3.45(1.7%)
5.18(1.9%)
Korea, Rep.
4.77(4.5%)
4.42(3.7%)
3.76(2.9%)
3.54(2.6%)
4.06(2.8%)
4.47(3.0%)
4.59(2.8%)
4.15(2.5%)
3.66(2.2%)
3.34(1.8%)
3.39(1.6%)
2.69(1.0%)
Sri Lanka 1.48(1.4%)
1.68(1.4%)
1.81(1.4%)
2.04(1.5%)
2.17(1.5%)
2.20(1.5%)
2.52(1.5%)
2.44(1.5%)
2.40(1.4%)
2.57(1.4%)
2.97(1.4%)
3.93(1.5%)
Honduras 0.68(0.6%)
0.97(0.8%)
1.29(1.0%)
1.75(1.3%)
1.98(1.4%)
2.29(1.5%)
2.52(1.5%)
2.56(1.5%)
2.65(1.6%)
2.71(1.4%)
2.93(1.4%)
2.88(1.1%)
US 3.50(3.3%)
4.40(3.7%)
5.28(4.1%)
6.22(4.5%)
6.36(4.4%)
5.50(3.7%)
5.16(3.1%)
4.57(2.8%)
3.83(2.3%)
3.29(1.7%)
2.84(1.4%)
2.84(1.0%)
Philippines 1.99(1.9%)
2.21(1.8%)
2.20(1.7%)
2.32(1.7%)
2.36(1.6%)
2.42(1.6%)
2.61(1.6%)
2.55(1.5%)
2.51(1.5%)
2.58(1.4%)
2.65(1.3%)
2.76(1.0%)
Pakistan 1.10(1.0%)
1.28(1.1%)
1.29(1.0%)
1.34(1.0%)
1.45(1.0%)
1.51(1.0%)
1.73(1.1%)
1.80(1.1%)
1.88(1.1%)
2.26(1.2%)
2.63(1.3%)
3.39(1.3%)
Macao 1.24(1.2%)
1.38(1.2%)
1.44(1.1%)
1.73(1.2%)
1.69(1.2%)
1.67(1.1%)
1.94(1.2%)
1.86(1.1%)
1.83(1.1%)
2.17(1.2%)
2.46(1.2%)
2.41(0.9%)
Cambodia 0.03(0.0%)
0.06(0.1%)
0.13(0.1%)
0.29(0.2%)
0.58(0.4%)
0.96(0.6%)
1.22(0.7%)
1.43(0.9%)
1.62(1.0%)
1.97(1.0%)
2.43(1.2%)
3.20(1.2%)
Others 19.22(18.0%)
21.32(17.8%)
21.90(17.1%)
24.40(17.7%)
25.84(18.0%)
26.67(17.7%)
29.71(18.0%)
29.60(17.9%)
28.88(17.2%)
31.10(16.5%)
33.01(15.9%)
35.12(13.0%)
* Preliminary. Data reported as world imports from countries.Source: UN (2006).
89

Annex 14: AGOA exports of clothing 1994-2005
US$ thousands (% of world exports)1994 1995 1996 1997 1998 1999 2000 2001 2002 2003 2004 2005*
World (US$ billions)
106.54 120.01 127.89 138.12 143.79 150.35 164.97 165.58 168.06 188.19 207.83 270.76
Benin 160 316 77 76 57 139 462 78 73 237 96 130Botswana .. .. .. .. .. .. 25,799 22,658 15,331 14,305 34,634 43,085Burkina Faso 75 121 59 554 98 77 317 428 463 77 149 472
Cameroon 636 950 940 1,003 2,162 1,254 1,096 1,451 1,600 2,149 1,806 2,217Cape Verde 0 454 2,414 2,700 1,880 2,150 3,445 4,687 5,841 7,483 8,455 7,903Chad 10 48 33 19 84 21 128 60 157 475 32 489Ethiopia 1,269 1,202 846 493 2,613 1,230 563 824 1,457 2,174 4,684 6,169Ghana 1,299 3,802 1,169 1,674 8,189 4,062 781 592 1,004 5,334 8,395 6,117Kenya 48,812 46,473 34,679 38,746 42,364 46,672 50,033 72,405 139,677 208,478 305,490 295,416Lesotho .. .. .. .. .. .. 152,527 233,589 347,957 427,504 494,155 422,345Madagascar 98,971 117,734 169,220 205,631 247,277 293,982 368,963 446,606 237,440 363,023 559,793 747,452Malawi 18,476 23,241 33,878 38,774 39,638 43,511 26,819 31,932 34,880 42,209 48,261 48,202Mali 788 2,012 593 541 265 1,881 1,635 496 413 418 400 710Mauritius 748,218 846,460 863,228 929,332 970,146 967,817 960,451 915,714 899,140 970,747 952,474 1,292,650Mozambique 1,786 1,354 1,895 4,300 4,132 5,788 4,555 3,112 3,439 4,271 4,589 5,750Namibia .. .. .. .. .. .. 252 340 7,302 45,111 82,971 56,518Niger 80 205 75 96 90 186 157 919 926 249 231 27Nigeria 2,682 3,177 2,983 1,487 1,453 568 607 749 1,356 903 296 515Rwanda 52 30 30 38 64 24 15 22 348 386 178 22Senegal 1,144 878 658 713 746 779 615 422 789 627 588 783Sierra Leone 1,175 1,277 2,275 1,242 2,035 1,941 3,016 3,330 2,958 6,368 3,456 1,898South Africa 217,966 243,537 257,826 285,171 306,118 356,860 396,319 405,169 361,678 415,476 254,925 185,866Swaziland .. .. .. .. .. .. 36,644 55,762 102,222 153,054 190,538 169,543Tanzania 14,531 14,758 17,444 17,053 17,014 7,081 2,616 2,518 3,136 5,221 8,072 9,383Uganda 18 190 70 38 57 175 92 108 134 3,361 4,699 5,412Zambia 1,270 546 329 319 393 426 507 274 181 99 349 298
All AGOA 1,159,418(1.09%)
1,308,766(1.09%)
1,390,720(1.09%)
1,530,001(1.11%)
1,646,873(1.15%)
1,736,623(1.16%)
2,038,415(1.24%)
2,204,244(1.33%)
2,169,899(1.29%)
2,679,738(1.42%)
2,969,717(1.43%)
3,309,374(1.22%)
* Provisional.Data reported as world imports from AGOA countries.Source: UN (2006).
90

Annex 15: The importance of AGOA exports of T&C, 2004
Share of textiles exports in total
exports
Share of clothing in total
exports
Share of textiles exports going to: Share of clothing exports going to:US EU Canada Japan US EU Canada Japan
Benin 1.24% 0.03% 2.05% 1.54% 0.00% 0.00% 2.08% 46.88% 0.00% 0.00%Botswana 0.04% 1.22% 0.17% 5.81% 0.00% 0.00% 61.91% 37.32% 0.40% 0.00%Burkina Faso 0.18% 0.04% 1.69% 67.63% 0.17% 2.54% 26.17% 39.60% 17.45% 0.00%Cameroon 0.04% 0.06% 4.94% 49.12% 0.00% 1.33% 13.23% 60.13% 1.50% 14.06%Cape Verde 0.59% 39.48% 0.00% 99.21% 0.00% 0.00% 39.02% 60.89% 0.00% 0.09%Chad 0.00% 0.00% 0.00% 3.17% 0.00% 0.00% 81.25% 0.00% 0.00% 0.00%Ethiopia 1.80% 0.95% 0.52% 91.57% 0.00% 0.00% 79.31% 18.15% 0.64% 0.00%Ghana 0.12% 0.40% 2.38% 24.77% 0.35% 0.00% 96.19% 1.57% 0.05% 0.00%Kenya 0.86% 11.97% 0.65% 19.27% 0.02% 0.36% 96.74% 1.06% 0.87% 0.02%Lesotho 0.14% 97.24% 11.21% 0.00% 0.00% 0.00% 97.50% 0.23% 2.18% 0.06%Madagascar 0.99% 41.19% 0.50% 65.18% 0.01% 0.02% 61.76% 36.05% 1.03% 0.36%Malawi 0.17% 9.66% 0.00% 6.27% 0.48% 0.00% 59.68% 0.26% 0.22% 0.00%Mali 0.14% 0.12% 18.08% 33.71% 0.00% 4.24% 5.25% 38.75% 0.00% 1.50%Mauritius 1.92% 51.45% 0.90% 31.65% 0.02% 0.14% 25.17% 72.13% 0.52% 0.39%Mozambique 0.14% 0.29% 0.96% 85.28% 0.00% 0.00% 53.21% 7.69% 0.00% 0.00%Namibia 0.11% 5.88% 13.67% 59.82% 0.06% 0.00% 99.42% 0.43% 0.11% 0.00%Niger 0.24% 0.04% 3.88% 31.63% 0.07% 0.00% 2.60% 31.17% 0.00% 6.49%Nigeria 0.10% 0.00% 0.61% 77.37% 0.10% 0.01% 32.09% 21.62% 14.19% 0.00%Rwanda 0.16% 0.05% 0.00% 0.88% 0.00% 0.00% 0.56% 2.81% 0.00% 0.00%Senegal 0.42% 0.09% 0.87% 37.64% 0.24% 0.17% 2.38% 61.05% 0.51% 0.85%Sierra Leone 0.84% 1.57% 0.27% 81.49% 0.54% 0.00% 44.13% 49.25% 0.95% 0.00%South Africa 0.78% 0.53% 9.67% 47.14% 1.96% 2.23% 58.61% 28.88% 1.20% 0.05%Swaziland 0.66% 24.58% 0.80% 18.47% 0.10% 0.00% 98.91% 0.58% 0.40% 0.00%Tanzania 2.99% 0.76% 2.65% 23.47% 0.35% 4.60% 34.64% 53.15% 3.37% 0.00%Uganda 0.37% 0.97% 0.00% 11.14% 0.22% 0.00% 95.83% 0.40% 2.83% 0.00%Zambia 2.35% 0.03% 0.08% 71.62% 0.00% 0.00% 8.60% 34.38% 0.00% 0.00%
All AGOA 0.54% 2.77% 6.69% 47.18% 1.30% 1.74% 62.64% 33.53% 0.98% 0.22%
Source: UN (2006).
91

Annex 16: World imports of textiles 1994-2005 (excluding intra-EU trade)
US$ billions (% of world imports)1994 1995 1996 1997 1998 1999 2000 2001 2002 2003 2004 2005*
World 81.25 93.18 95.87 100.67 97.79 97.13 106.60 104.13 105.73 116.84 129.20 130.62
EU 13.60(16.7%)
16.00(17.2%)
15.72(16.4%)
16.86(16.7%)
17.39(17.8%)
15.99(16.5%)
16.16(15.2%)
15.70(15.1%)
15.96(15.1%)
18.62(15.9%)
22.02(17.0%)
18.08(13.8%)
US 9.12(11.2%)
9.83(10.5%)
9.98(10.4%)
11.63(11.6%)
12.68(13.0%)
13.52(13.9%)
15.31(14.4%)
14.85(14.3%)
16.48(15.6%)
17.94(15.4%)
20.54(15.9%)
22.49(17.2%)
China 9.14(11.2%)
10.74(11.5%)
11.51(12.0%)
11.75(11.7%)
10.49(10.7%)
10.78(11.1%)
12.46(11.7%)
12.17(11.7%)
12.44(11.8%)
13.34(11.4%)
14.27(11.0%)
14.43(11.0%)
Hong Kong 14.86(18.3%)
15.98(17.2%)
15.82(16.5%)
15.49(15.4%)
12.75(13.0%)
12.06(12.4%)
13.09(12.3%)
11.70(11.2%)
11.64(11.0%)
12.40(10.6%)
13.60(10.5%)
13.36(10.2%)
Japan 6.10(7.5%)
6.87(7.4%)
6.87(7.2%)
6.45(6.4%)
4.80(4.9%)
5.07(5.2%)
5.53(5.2%)
5.39(5.2%)
5.13(4.8%)
5.63(4.8%)
6.18(4.8%)
6.34(4.9%)
Mexico 2.06(2.5%)
1.68(1.8%)
2.09(2.2%)
2.69(2.7%)
3.27(3.3%)
4.61(4.8%)
5.61(5.3%)
5.16(5.0%)
5.35(5.1%)
5.19(4.4%)
5.53(4.3%)
5.77(4.4%)
Canada 2.64(3.2%)
2.89(3.1%)
2.94(3.1%)
3.48(3.5%)
3.63(3.7%)
3.59(3.7%)
3.73(3.5%)
3.47(3.3%)
3.46(3.3%)
3.53(3.0%)
3.81(2.9%)
4.02(3.1%)
Turkey 0.98(1.2%)
1.59(1.7%)
1.70(1.8%)
2.01(2.0%)
1.97(2.0%)
1.62(1.7%)
1.80(1.7%)
1.65(1.6%)
2.46(2.3%)
3.03(2.6%)
3.69(2.9%)
4.11(3.1%)
Romania 0.63(0.8%)
0.94(1.0%)
1.05(1.1%)
1.25(1.2%)
1.47(1.5%)
1.57(1.6%)
1.71(1.6%)
2.00(1.9%)
2.37(2.2%)
2.87(2.5%)
3.33(2.6%)
3.32(2.5%)
Korea, Rep. 3.06(3.8%)
3.54(3.8%)
3.39(3.5%)
3.15(3.1%)
1.91(2.0%)
2.68(2.8%)
3.04(2.9%)
2.87(2.8%)
3.10(2.9%)
2.95(2.5%)
3.16(2.4%)
3.35(2.6%)
Australia 1.63(2.0%)
1.69(1.8%)
1.71(1.8%)
1.67(1.7%)
1.52(1.5%)
1.56(1.6%)
1.54(1.4%)
1.24(1.2%)
1.41(1.3%)
1.61(1.4%)
1.78(1.4%)
1.74(1.3%)
Morocco 0.33(0.4%)
0.38(0.4%)
0.37(0.4%)
0.37(0.4%)
1.42(1.4%)
1.38(1.4%)
1.35(1.3%)
1.38(1.3%)
1.46(1.4%)
1.68(1.4%)
1.77(1.4%)
2.54(1.9%)
Thailand 1.30(1.6%)
1.44(1.5%)
1.30(1.4%)
1.15(1.1%)
1.05(1.1%)
1.25(1.3%)
1.51(1.4%)
1.43(1.4%)
1.32(1.2%)
1.50(1.3%)
1.69(1.3%)
1.78(1.4%)
Tunisia 1.05(1.3%)
1.28(1.4%)
1.28(1.3%)
1.23(1.2%)
1.43(1.5%)
1.33(1.4%)
1.20(1.1%)
1.43(1.4%)
1.42(1.3%)
1.49(1.3%)
1.65(1.3%)
3.11(2.4%)
Switzerland 1.71(2.1%)
1.86(2.0%)
1.66(1.7%)
1.47(1.5%)
1.51(1.5%)
1.40(1.4%)
1.29(1.2%)
1.24(1.2%)
1.26(1.2%)
1.43(1.2%)
1.58(1.2%)
1.60(1.2%)
Sri Lanka 1.00(1.2%)
0.86(0.9%)
0.84(0.9%)
1.16(1.2%)
1.17(1.2%)
1.29(1.3%)
1.29(1.2%)
1.33(1.3%)
1.29(1.2%)
1.35(1.2%)
1.50(1.2%)
1.44(1.1%)
Bangladesh 1.09(1.3%)
1.47(1.6%)
1.39(1.4%)
0.99(1.0%)
1.55(1.6%)
1.53(1.6%)
1.12(1.0%)
1.45(1.4%)
1.36(1.3%)
1.37(1.2%)
1.44(1.1%)
2.24(1.7%)
India 0.39(0.5%)
0.44(0.5%)
0.44(0.5%)
0.50(0.5%)
0.49(0.5%)
0.51(0.5%)
0.58(0.5%)
0.70(0.7%)
0.89(0.8%)
1.14(1.0%)
1.37(1.1%)
2.31(1.8%)
Russia 0.60(0.7%)
1.02(1.1%)
0.74(0.8%)
0.76(0.8%)
0.63(0.6%)
0.59(0.6%)
0.72(0.7%)
0.79(0.8%)
0.76(0.7%)
1.00(0.9%)
1.16(0.9%)
1.20(0.9%)
Bulgaria 0.20(0.2%)
0.31(0.3%)
0.29(0.3%)
0.34(0.3%)
0.38(0.4%)
0.40(0.4%)
0.50(0.5%)
0.62(0.6%)
0.72(0.7%)
0.97(0.8%)
1.11(0.9%)
1.15(0.9%)
Others 9.76(12.0%)
12.37(13.3%)
14.78(15.4%)
16.27(16.2%)
16.28(16.6%)
14.4(14.8%)
17.06(16.0%)
17.56(16.9%)
15.45(14.6%)
17.8(15.2%)
18.02(13.9%)
16.24(12.4%)
* Preliminary. Mirror data in italics.Source: UN (2006).
92

Annex 17: AGOA imports of textiles 1994-2005
US$ thousands (% of world imports)1994 1995 1996 1997 1998 1999 2000 2001 2002 2003 2004 2005*
World (US$ billions)
81.25 93.18 95.87 100.67 97.79 97.13 106.60 104.13 105.73 116.84 129.20 130.62
Benin 78,907 160,777 187,238 230,577 74,700 80,080 56,109 63,198 62,961 352,803 410,175 530,833Botswana .. .. .. .. .. .. 43,769 32,316 11,701 6,672 13,854 15,869Burkina Faso 7,129 16,972 16,306 14,761 16,640 10,463 8,388 11,877 10,854 15,058 19,821 5,469
Cameroon 14,070 16,955 14,916 17,498 15,822 13,602 19,204 15,173 21,836 20,620 22,255 24,425Cape Verde 1,964 2,381 2,792 2,405 2,051 2,088 2,023 1,956 2,649 2,262 3,122 6,573Chad 663 2,510 7,224 7,550 5,163 4,128 1,217 1,619 3,167 5,593 5,779 5,393Ethiopia 24,521 39,568 32,412 54,777 58,550 54,261 54,638 69,068 65,725 90,961 39,234 57,928Ghana 34,992 50,290 42,067 34,683 35,757 51,355 64,821 75,061 60,874 56,405 75,575 195,104Kenya 94,063 114,852 104,644 48,722 54,575 49,902 43,464 59,280 53,044 56,763 69,568 249,789Lesotho .. .. .. .. .. .. 43,956 22,842 96,010 159,051 185,350 141,743Madagascar 6,553 7,739 10,610 13,713 11,480 10,295 194,957 84,928 9,913 29,576 44,810 305,997Malawi 24,506 24,983 37,014 37,925 42,483 31,113 25,504 32,536 29,122 36,788 44,583 44,366Mali 14,972 27,587 22,714 18,761 18,308 13,414 9,246 11,742 51,105 55,666 61,637 97,902Mauritius 411,510 451,196 466,870 451,824 476,295 422,086 414,529 373,952 357,725 360,598 334,106 253,592Mozambique 20,221 25,650 26,100 44,212 25,031 25,844 33,466 12,397 12,529 37,655 49,301 27,976Namibia .. .. .. .. .. .. 23,677 22,116 26,682 49,256 44,623 26,563Niger 35,210 20,372 18,662 17,310 19,386 16,898 15,508 6,455 19,643 21,867 57,548 42,888Nigeria 138,110 186,846 28,286 44,978 56,405 36,482 52,372 65,789 74,901 144,431 585,730 543,578Rwanda 1,534 3,722 4,550 12,366 3,912 3,250 1,910 2,756 4,967 3,296 3,767 2,993Senegal 25,995 43,672 44,134 31,732 32,446 44,663 35,408 41,395 37,659 45,373 57,287 64,539Sierra Leone 4,698 2,882 5,112 3,735 5,173 8,507 7,696 13,538 2,439 14,548 11,299 4,570South Africa 603,784 689,447 620,655 635,718 552,391 514,083 507,512 452,637 470,961 577,809 759,679 806,436Swaziland .. .. .. .. .. .. 33,736 28,461 73,469 42,545 52,848 38,154Tanzania 38,819 20,673 26,207 25,994 37,799 28,506 29,613 41,620 41,573 46,453 43,720 59,185Uganda 29,015 41,800 28,557 25,839 22,765 22,203 17,625 23,165 25,633 35,287 37,189 41,032Zambia 20,285 7,158 13,446 13,744 15,068 16,325 20,227 19,986 18,456 34,303 34,360 16,985
All AGOA 1,631,521(2.01%)
1,958,032(2.10%)
1,760,516(1.84%)
1,788,824(1.78%)
1,582,200(1.62%)
1,459,548(1.50%)
1,760,575(1.65%)
1,585,863(1.52%)
1,645,598(1.56%)
2,301,639(1.97%)
3,067,220(2.37%)
3,609,882(2.76%)
* Preliminary. Mirror data in italics.Source: UN (2006).
93

Annex 18: World imports of clothing 1994-2005 (excluding intra-EU trade)
US$ billions (% of world imports)1994 1995 1996 1997 1998 1999 2000 2001 2002 2003 2004 2005*
World 106.54 120.01 127.89 138.12 143.79 150.35 164.97 165.58 168.06 188.19 207.83 270.76
US 34.98(32.8%)
37.79(31.5%)
39.54(30.9%)
46.39(33.6%)
51.61(35.9%)
54.56(36.3%)
61.74(37.4%)
60.82(36.7%)
61.37(36.5%)
65.73(34.9%)
69.96(33.7%)
74.15(27.4%)
EU 30.29(28.4%)
34.40(28.7%)
36.70(28.7%)
38.76(28.1%)
40.79(28.4%)
42.02(27.9%)
42.83(26.0%)
44.14(26.7%)
47.89(28.5%)
58.65(31.2%)
68.91(33.2%)
63.59(23.5%)
Japan 14.22(13.3%)
17.66(14.7%)
18.62(14.6%)
15.98(11.6%)
14.10(9.8%)
15.63(10.4%)
18.61(11.3%)
18.02(10.9%)
16.56(9.9%)
18.38(9.8%)
20.46(9.8%)
21.17(7.8%)
Hong Kong 11.40(10.7%)
11.57(9.6%)
12.60(9.9%)
13.99(10.1%)
13.40(9.3%)
13.88(9.2%)
14.95(9.1%)
15.11(9.1%)
14.77(8.8%)
14.96(7.9%)
15.97(7.7%)
17.25(6.4%)
Canada 2.21(2.1%)
2.40(2.0%)
2.28(1.8%)
2.71(2.0%)
2.94(2.0%)
2.95(2.0%)
3.26(2.0%)
3.48(2.1%)
3.57(2.1%)
4.02(2.1%)
4.68(2.3%)
5.38(2.0%)
Switzerland 3.25(3.1%)
3.60(3.0%)
3.47(2.7%)
3.20(2.3%)
3.32(2.3%)
3.22(2.1%)
3.02(1.8%)
3.01(1.8%)
3.22(1.9%)
3.71(2.0%)
4.05(1.9%)
4.13(1.5%)
Korea, Rep. 0.62(0.6%)
0.94(0.8%)
1.31(1.0%)
1.29(0.9%)
0.47(0.3%)
0.72(0.5%)
1.24(0.8%)
1.55(0.9%)
2.13(1.3%)
2.41(1.3%)
2.59(1.2%)
2.72(1.0%)
Australia 1.00(0.9%)
1.11(0.9%)
1.25(1.0%)
1.35(1.0%)
1.36(0.9%)
1.50(1.0%)
1.68(1.0%)
1.48(0.9%)
1.64(1.0%)
1.99(1.1%)
2.42(1.2%)
2.84(1.0%)
Mexico 1.70(1.6%)
1.84(1.5%)
2.31(1.8%)
3.25(2.4%)
3.62(2.5%)
3.52(2.3%)
3.47(2.1%)
3.32(2.0%)
3.20(1.9%)
2.89(1.5%)
2.42(1.2%)
2.31(0.9%)
Singapore 1.48(1.4%)
1.55(1.3%)
1.63(1.3%)
1.71(1.2%)
1.34(0.9%)
1.58(1.1%)
1.82(1.1%)
1.63(1.0%)
1.75(1.0%)
2.03(1.1%)
2.16(1.0%)
2.05(0.8%)
Norway 1.19(1.1%)
1.31(1.1%)
1.28(1.0%)
1.30(0.9%)
1.33(0.9%)
1.30(0.9%)
1.21(0.7%)
1.15(0.7%)
1.26(0.8%)
1.43(0.8%)
1.55(0.7%)
2.23(0.8%)
China 0.57(0.5%)
0.90(0.8%)
0.99(0.8%)
1.06(0.8%)
1.03(0.7%)
1.06(0.7%)
1.14(0.7%)
1.21(0.7%)
1.29(0.8%)
1.34(0.7%)
1.43(0.7%)
1.51(0.6%)
Taiwan, China
0.92(0.9%)
1.04(0.9%)
1.00(0.8%)
0.96(0.7%)
0.89(0.6%)
0.83(0.6%)
0.94(0.6%)
0.89(0.5%)
0.80(0.5%)
0.78(0.4%)
0.94(0.5%)
1.03(0.4%)
Russia 1.33(1.2%)
1.49(1.2%)
0.36(0.3%)
0.37(0.3%)
0.24(0.2%)
0.11(0.1%)
0.15(0.1%)
0.27(0.2%)
0.53(0.3%)
0.48(0.3%)
0.63(0.3%)
0.80(0.3%)
Tunisia 0.32(0.3%)
0.42(0.4%)
0.47(0.4%)
0.48(0.4%)
0.51(0.4%)
0.47(0.3%)
0.43(0.3%)
0.50(0.3%)
0.53(0.3%)
0.53(0.3%)
0.62(0.3%)
0.86(0.3%)
Chile 0.20(0.2%)
0.26(0.2%)
0.37(0.3%)
0.39(0.3%)
0.41(0.3%)
0.37(0.2%)
0.45(0.3%)
0.45(0.3%)
0.44(0.3%)
0.46(0.2%)
0.62(0.3%)
0.68(0.3%)
Romania 0.11(0.1%)
0.15(0.1%)
0.17(0.1%)
0.20(0.1%)
0.25(0.2%)
0.27(0.2%)
0.30(0.2%)
0.36(0.2%)
0.42(0.3%)
0.53(0.3%)
0.59(0.3%)
0.65(0.2%)
Israel 0.17(0.2%)
0.24(0.2%)
0.30(0.2%)
0.31(0.2%)
0.33(0.2%)
0.32(0.2%)
0.44(0.3%)
0.54(0.3%)
0.51(0.3%)
0.51(0.3%)
0.59(0.3%)
0.65(0.2%)
Turkey 0.03(0.0%)
0.04(0.0%)
0.13(0.1%)
0.20(0.1%)
0.21(0.1%)
0.18(0.1%)
0.23(0.1%)
0.20(0.1%)
0.24(0.1%)
0.37(0.2%)
0.58(0.3%)
0.81(0.3%)
Others 0.55(0.5%)
1.30(1.1%)
3.13(2.4%)
4.22(3.1%)
5.63(3.9%)
5.86(3.9%)
7.08(4.3%)
7.44(4.5%)
5.94(3.5%)
6.99(3.7%)
6.66(3.2%)
65.95(24.4%)
* Preliminary. Mirror data in italics.Source: UN (2006).
94

Annex 19: AGOA imports of clothing 1994-2005
US$ thousands (% of world imports)1994 1995 1996 1997 1998 1999 2000 2001 2002 2003 2004 2005*
World (US$ billions) 106.54 120.01 127.89 138.12 143.79 150.35 164.97 165.58 168.06 188.19 207.83 270.76
Benin 24,909 29,220 37,727 33,672 10,538 7,507 6,214 6,742 10,016 30,106 17,346 47,274Botswana .. .. .. .. .. .. 48,773 32,620 11,178 11,382 28,658 32,317Burkina Faso 756 2,677 2,568 3,217 3,745 3,432 1,980 1,577 1,939 2,606 2,739 4,561Cameroon 8,344 2,007 2,148 2,517 2,737 4,040 14,801 5,180 19,976 9,157 10,694 13,338Cape Verde 619 1,507 2,083 1,308 1,887 2,327 2,070 1,852 2,149 2,577 3,068 3,063Chad 423 1,553 1,208 609 980 749 700 1,443 879 1,023 732 973Ethiopia 9,858 8,047 13,109 8,524 19,029 25,420 25,324 32,877 41,844 54,875 38,302 32,461Ghana 21,661 27,689 9,504 9,179 10,758 10,939 10,149 8,613 10,905 22,321 18,950 32,657Kenya 40,736 44,102 37,965 8,044 10,686 10,770 7,044 9,911 6,652 8,930 9,813 55,670Lesotho .. .. .. .. .. .. 18,234 18,588 18,064 2,528 2,618 1,979Madagascar 1,217 1,156 1,724 2,008 2,325 2,096 6,115 5,611 3,185 5,641 3,026 19,110Malawi 4,348 1,736 3,742 3,480 3,306 2,323 4,784 3,388 3,348 5,931 9,552 7,758Mali 15,875 13,445 2,553 2,034 3,230 4,796 5,191 4,663 10,018 5,802 8,096 9,141Mauritius 20,124 18,236 17,179 20,060 17,400 16,746 16,745 16,874 22,848 25,302 28,812 35,725Mozambique 2,165 1,489 2,783 5,551 11,536 18,413 6,691 4,059 3,257 16,735 15,917 12,482Namibia .. .. .. .. .. .. 50,073 43,633 35,089 33,069 4,625 3,513Niger 2,054 1,552 1,335 1,121 2,771 1,640 2,602 2,046 3,389 3,253 9,684 8,525Nigeria 23,150 26,088 412 2,788 8,533 9,975 5,594 3,626 9,638 5,383 142,678 122,611Rwanda 1,539 922 960 1,061 605 1,075 2,428 1,393 1,368 2,235 2,172 1,350Senegal 27,372 15,953 5,419 4,358 6,696 6,195 5,246 6,590 5,579 9,303 12,201 12,900Sierra Leone 1,578 1,449 2,687 1,303 1,002 2,521 3,232 6,147 536 3,878 3,009 2,189South Africa 135,936 113,656 161,802 163,186 159,100 170,632 192,195 171,138 177,098 308,894 565,267 752,248Swaziland .. .. .. .. .. .. 28,257 22,344 22,504 5,101 4,945 3,315Tanzania 49,413 4,179 5,921 11,152 19,697 21,012 11,938 13,577 15,378 15,505 11,258 42,537Uganda 14,712 15,502 12,896 10,248 15,638 14,790 11,642 13,020 12,231 15,066 19,956 22,314Zambia 9,351 3,508 5,269 6,789 7,820 8,573 9,896 10,816 9,506 10,853 12,930 9,517
All AGOA 416,140(0.39%)
335,673(0.28%)
330,994(0.26%)
302,209(0.22%)
320,019(0.22%)
345,971(0.23%)
497,918(0.30%)
448,328(0.27%)
458,574(0.27%)
617,456(0.33%)
987,048(0.47%)
1,289,528(0.48%)
* Preliminary. Mirror data in italicsSource: UN (2006).
95

Annex 20: US imports of textiles 1994-2005
US$ billions (% of total US imports of textiles)1994 1995 1996 1997 1998 1999 2000 2001 2002 2003 2004 2005
World 9.12 9.83 9.98 11.63 12.68 13.52 15.31 14.85 16.48 17.94 20.54 22.49
China 1.32(14.5%)
1.34(13.7%)
1.24(12.4%)
1.57(13.5%)
1.67(13.1%)
1.93(14.2%)
2.29(15.0%)
2.32(15.6%)
3.13(19.0%)
4.24(23.6%)
5.56(27.1%)
7.23(32.1%)
EU 2.12(23.2%)
2.18(22.2%)
2.17(21.8%)
2.31(19.9%)
2.42(19.1%)
2.40(17.7%)
2.57(16.8%)
2.40(16.2%)
2.48(15.1%)
2.62(14.6%)
2.87(14.0%)
2.82(12.6%)
India 0.54(5.9%)
0.66(6.7%)
0.69(6.9%)
0.84(7.3%)
0.97(7.6%)
1.09(8.0%)
1.25(8.2%)
1.19(8.0%)
1.42(8.6%)
1.61(9.0%)
1.88(9.2%)
2.15(9.5%)
Canada 0.70(7.7%)
0.84(8.5%)
1.01(10.1%)
1.16(10.0%)
1.34(10.6%)
1.46(10.8%)
1.61(10.5%)
1.62(10.9%)
1.63(9.9%)
1.62(9.0%)
1.66(8.1%)
1.65(7.3%)
Pakistan 0.35(3.8%)
0.43(4.4%)
0.47(4.7%)
0.61(5.2%)
0.79(6.3%)
0.80(5.9%)
1.00(6.5%)
1.08(7.3%)
1.20(7.3%)
1.31(7.3%)
1.53(7.5%)
1.79(8.0%)
Mexico 0.44(4.8%)
0.68(6.9%)
0.82(8.2%)
1.08(9.3%)
1.19(9.4%)
1.32(9.8%)
1.55(10.1%)
1.47(9.9%)
1.55(9.4%)
1.47(8.2%)
1.51(7.4%)
1.53(6.8%)
Korea, Rep.
0.61(6.7%)
0.64(6.5%)
0.67(6.7%)
0.78(6.7%)
0.76(6.0%)
0.81(6.0%)
0.87(5.7%)
0.83(5.6%)
0.95(5.8%)
0.90(5.0%)
0.92(4.5%)
0.89(3.9%)
Taiwan, China
0.58(6.4%)
0.60(6.1%)
0.66(6.6%)
0.74(6.4%)
0.73(5.7%)
0.77(5.7%)
0.76(5.0%)
0.72(4.9%)
0.74(4.5%)
0.68(3.8%)
0.66(3.2%)
0.60(2.7%)
Turkey 0.18(2.0%)
0.18(1.9%)
0.18(1.8%)
0.22(1.9%)
0.30(2.4%)
0.37(2.8%)
0.44(2.9%)
0.44(3.0%)
0.53(3.2%)
0.53(3.0%)
0.65(3.2%)
0.72(3.2%)
Japan 0.59(6.5%)
0.49(5.0%)
0.47(4.7%)
0.50(4.3%)
0.48(3.8%)
0.46(3.4%)
0.49(3.2%)
0.39(2.6%)
0.37(2.3%)
0.41(2.3%)
0.48(2.3%)
0.45(2.0%)
Thailand 0.20(2.2%)
0.21(2.2%)
0.19(1.9%)
0.22(1.9%)
0.28(2.2%)
0.30(2.2%)
0.34(2.2%)
0.34(2.3%)
0.36(2.2%)
0.33(1.8%)
0.39(1.9%)
0.34(1.5%)
Brazil 0.21(2.3%)
0.19(1.9%)
0.14(1.4%)
0.16(1.4%)
0.14(1.1%)
0.15(1.1%)
0.20(1.3%)
0.18(1.2%)
0.27(1.7%)
0.33(1.8%)
0.38(1.9%)
0.38(1.7%)
Israel 0.10(1.1%)
0.11(1.2%)
0.11(1.1%)
0.13(1.1%)
0.15(1.2%)
0.16(1.2%)
0.18(1.2%)
0.20(1.4%)
0.21(1.3%)
0.24(1.3%)
0.28(1.4%)
0.29(1.3%)
Indonesia 0.15(1.6%)
0.14(1.4%)
0.15(1.5%)
0.21(1.8%)
0.22(1.8%)
0.16(1.2%)
0.19(1.2%)
0.18(1.2%)
0.19(1.1%)
0.17(1.0%)
0.20(1.0%)
0.19(0.8%)
Egypt 0.07(0.8%)
0.09(0.9%)
0.06(0.6%)
0.08(0.7%)
0.11(0.9%)
0.10(0.7%)
0.12(0.8%)
0.13(0.9%)
0.13(0.8%)
0.16(0.9%)
0.15(0.7%)
0.18(0.8%)
Bangladesh 0.06(0.7%)
0.08(0.8%)
0.07(0.7%)
0.06(0.5%)
0.09(0.7%)
0.10(0.7%)
0.11(0.7%)
0.12(0.8%)
0.13(0.8%)
0.12(0.7%)
0.13(0.6%)
0.12(0.5%)
Iran 0.00(0.0%)
0.00(0.0%)
0.00(0.0%)
0.00(0.0%)
0.00(0.0%)
0.00(0.0%)
0.12(0.8%)
0.12(0.8%)
0.13(0.8%)
0.13(0.7%)
0.13(0.6%)
0.13(0.6%)
Philippines 0.06(0.7%)
0.07(0.7%)
0.08(0.8%)
0.09(0.8%)
0.11(0.9%)
0.15(1.1%)
0.14(0.9%)
0.10(0.7%)
0.10(0.6%)
0.12(0.6%)
0.11(0.5%)
0.07(0.3%)
Hong Kong 0.21(2.3%)
0.21(2.1%)
0.18(1.8%)
0.17(1.5%)
0.20(1.6%)
0.23(1.7%)
0.24(1.6%)
0.22(1.5%)
0.16(1.0%)
0.11(0.6%)
0.10(0.5%)
0.08(0.4%)
Switzerland 0.08(0.9%)
0.08(0.8%)
0.09(0.9%)
0.09(0.8%)
0.10(0.8%)
0.09(0.7%)
0.09(0.6%)
0.08(0.5%)
0.07(0.5%)
0.08(0.4%)
0.09(0.4%)
0.08(0.4%)
Dominican Republic
0.02(0.2%)
0.03(0.3%)
0.04(0.4%)
0.04(0.3%)
0.04(0.3%)
0.03(0.3%)
0.04(0.2%)
0.05(0.3%)
0.07(0.4%)
0.08(0.4%)
0.08(0.4%)
0.09(0.4%)
Vietnam 0.00(0.0%)
0.00(0.0%)
0.00(0.0%)
0.00(0.0%)
0.00(0.0%)
0.00(0.0%)
0.00(0.0%)
0.00(0.0%)
0.01(0.1%)
0.04(0.2%)
0.07(0.4%)
0.07(0.3%)
Malaysia 0.07(0.8%)
0.07(0.7%)
0.06(0.6%)
0.05(0.4%)
0.05(0.4%)
0.06(0.5%)
0.07(0.5%)
0.05(0.4%)
0.06(0.4%)
0.06(0.3%)
0.06(0.3%)
0.05(0.2%)
Others 0.46(5.0%)
0.51(5.2%)
0.43(4.3%)
0.52(4.5%)
0.54(4.3%)
0.58(4.3%)
0.64(4.2%)
0.62(4.2%)
0.59(3.6%)
0.58(3.2%)
0.65(3.2%)
0.59(2.6%)
Source: UN (2006).
96

Annex 21: AGOA exports of textiles to US 1994-2005
US$ thousands (% of US imports of textiles)1994 1995 1996 1997 1998 1999 2000 2001 2002 2003 2004 2005
US imports from world(US$ billions)
9.12 9.83 9.98 11.63 12.68 13.52 15.31 14.85 16.48 17.94 20.54 22.49
Benin 1,853 1,199 290 63 256 98 6 43 1 167 80 0Botswana .. .. .. .. .. .. 38 13 0 0 2 7Burkina Faso 3 4 7 16 15 36 26 6 9 1 10 6Cameroon 96 368 791 2,155 3,494 2,828 2,663 1,633 1,043 181 67 39Cape Verde 0 0 0 0 0 3 0 0 0 0 0 0Chad 0 0 0 0 0 0 0 0 0 0 0 0Ethiopia 0 0 3 4 0 1 25 355 17 1 46 12Ghana 935 503 36 187 325 173 270 270 114 92 62 75Kenya 2,796 2,797 675 459 122 262 168 166 316 344 143 352Lesotho .. .. .. .. .. .. 2 12 37 79 79 111Madagascar 10 228 11 28 15 33 50 49 46 62 68 76Malawi 2,708 1,667 277 37 17 0 1 1 0 0 0 0Mali 249 321 331 215 234 147 287 108 94 86 81 84Mauritius 845 525 403 22 343 535 193 55 143 94 322 357Mozambique 24 2 0 0 1 0 0 0 2 12 22 0Namibia .. .. .. .. .. .. 26 22 13 15 211 28Niger 499 388 169 110 19 13 23 20 22 120 57 14Nigeria 523 1,819 1,479 2,007 3,402 695 489 163 70 297 199 26Rwanda 0 0 0 0 0 0 23 0 3 3 0 0Senegal 8 750 1,029 743 571 160 281 74 285 63 25 28Sierra Leone 0 313 33 170 5 77 118 3 0 2 5 10South Africa 12,941 12,879 16,014 19,615 19,468 19,012 26,764 28,238 27,902 30,910 36,488 33,217Swaziland .. .. .. .. .. .. 51 10 15 1 41 125Tanzania 3,810 2,589 1,081 0 3 9 211 455 189 1,059 841 947Uganda 0 0 0 0 0 0 5 1 1 3 0 5Zambia 1,340 0 231 1 3 1 6 10 6 16 26 32
All AGOA 28,640(0.31%)
26,353(0.27%)
22,864(0.23%)
25,834(0.22%)
28,294(0.22%)
24,085(0.18%)
31,786(0.21%)
32,061(0.22%)
30,342(0.18%)
33,611(0.19%)
38,919(0.19%)
35,560(0.16%)
Data reported as US imports from AGOA countries.Source: UN (2006).
97

Annex 22: US imports of clothing 1994-2005
US$ billions (% of total US imports of clothing)1994 1995 1996 1997 1998 1999 2000 2001 2002 2003 2004 2005
World 34.98 37.79 39.54 46.39 51.61 54.56 61.74 60.82 61.37 65.73 69.96 74.15
China 5.38(15.4%)
4.91(13.0%)
5.28(13.4%)
6.27(13.5%)
5.91(11.4%)
6.06(11.1%)
6.51(10.5%)
6.72(11.0%)
7.47(12.2%)
9.16(13.9%)
11.31(16.2%)
17.80(24.0%)
Mexico 1.80(5.1%)
2.80(7.4%)
3.78(9.6%)
5.29(11.4%)
6.76(13.1%)
7.80(14.3%)
8.70(14.1%)
8.10(13.3%)
7.70(12.5%)
7.15(10.9%)
6.90(9.9%)
6.28(8.5%)
Hong Kong 4.56(13.0%)
4.48(11.8%)
4.12(10.4%)
4.15(8.9%)
4.63(9.0%)
4.48(8.2%)
4.71(7.6%)
4.38(7.2%)
4.10(6.7%)
3.91(5.9%)
4.07(5.8%)
3.69(5.0%)
Honduras 0.66(1.9%)
0.95(2.5%)
1.27(3.2%)
1.72(3.7%)
1.94(3.8%)
2.24(4.1%)
2.46(4.0%)
2.49(4.1%)
2.56(4.2%)
2.62(4.0%)
2.80(4.0%)
2.74(3.7%)
Vietnam 0.00(0.0%)
0.02(0.0%)
0.03(0.1%)
0.03(0.1%)
0.03(0.1%)
0.04(0.1%)
0.05(0.1%)
0.05(0.1%)
0.95(1.6%)
2.51(3.8%)
2.68(3.8%)
2.83(3.8%)
Indonesia 1.10(3.1%)
1.26(3.3%)
1.41(3.6%)
1.70(3.7%)
1.76(3.4%)
1.80(3.3%)
2.19(3.6%)
2.34(3.8%)
2.17(3.5%)
2.28(3.5%)
2.55(3.7%)
3.05(4.1%)
EU 1.73(4.9%)
1.97(5.2%)
2.18(5.5%)
2.28(4.9%)
2.48(4.8%)
2.39(4.4%)
2.50(4.1%)
2.49(4.1%)
2.39(3.9%)
2.51(3.8%)
2.52(3.6%)
2.36(3.2%)
India 1.31(3.7%)
1.27(3.4%)
1.36(3.4%)
1.52(3.3%)
1.68(3.3%)
1.70(3.1%)
2.00(3.2%)
1.90(3.1%)
2.10(3.4%)
2.20(3.4%)
2.43(3.5%)
3.28(4.4%)
Dominican Republic
1.57(4.5%)
1.73(4.6%)
1.75(4.4%)
2.23(4.8%)
2.36(4.6%)
2.35(4.3%)
2.44(3.9%)
2.27(3.7%)
2.17(3.5%)
2.14(3.3%)
2.08(3.0%)
1.87(2.5%)
Guatemala 0.61(1.7%)
0.70(1.9%)
0.82(2.1%)
0.99(2.1%)
1.17(2.3%)
1.27(2.3%)
1.53(2.5%)
1.66(2.7%)
1.71(2.8%)
1.81(2.8%)
2.01(2.9%)
1.87(2.5%)
Bangladesh 0.91(2.6%)
1.06(2.8%)
1.08(2.7%)
1.41(3.0%)
1.58(3.1%)
1.63(3.0%)
2.09(3.4%)
2.04(3.4%)
1.88(3.1%)
1.87(2.9%)
2.00(2.9%)
2.42(3.3%)
Thailand 0.96(2.7%)
1.10(2.9%)
1.12(2.8%)
1.34(2.9%)
1.54(3.0%)
1.61(3.0%)
1.96(3.2%)
1.94(3.2%)
1.87(3.0%)
1.84(2.8%)
1.93(2.8%)
1.94(2.6%)
Korea, Rep.
1.99(5.7%)
1.75(4.6%)
1.49(3.8%)
1.62(3.5%)
1.99(3.9%)
2.22(4.1%)
2.38(3.9%)
2.28(3.7%)
2.17(3.5%)
1.89(2.9%)
1.92(2.7%)
1.24(1.7%)
Philippines 1.39(4.0%)
1.57(4.2%)
1.53(3.9%)
1.66(3.6%)
1.81(3.5%)
1.87(3.4%)
1.98(3.2%)
1.97(3.2%)
1.92(3.1%)
1.94(3.0%)
1.87(2.7%)
1.92(2.6%)
El Salvador 0.41(1.2%)
0.60(1.6%)
0.74(1.9%)
1.08(2.3%)
1.20(2.3%)
1.36(2.5%)
1.64(2.7%)
1.67(2.7%)
1.71(2.8%)
1.76(2.7%)
1.76(2.5%)
1.66(2.2%)
Sri Lanka 0.88(2.5%)
0.98(2.6%)
1.06(2.7%)
1.26(2.7%)
1.36(2.6%)
1.33(2.4%)
1.55(2.5%)
1.57(2.6%)
1.49(2.4%)
1.52(2.3%)
1.64(2.3%)
1.75(2.4%)
Taiwan, China
2.13(6.1%)
2.01(5.3%)
1.91(4.8%)
2.03(4.4%)
2.08(4.0%)
1.96(3.6%)
2.06(3.3%)
1.78(2.9%)
1.58(2.6%)
1.62(2.5%)
1.56(2.2%)
1.15(1.5%)
Canada 0.60(1.7%)
0.78(2.1%)
0.96(2.4%)
1.22(2.6%)
1.43(2.8%)
1.61(3.0%)
1.76(2.9%)
1.59(2.6%)
1.60(2.6%)
1.58(2.4%)
1.52(2.2%)
1.30(1.8%)
Macao 0.64(1.8%)
0.78(2.1%)
0.78(2.0%)
0.95(2.1%)
1.04(2.0%)
1.04(1.9%)
1.16(1.9%)
1.14(1.9%)
1.19(1.9%)
1.33(2.0%)
1.51(2.2%)
1.26(1.7%)
Cambodia 0.00(0.0%)
0.00(0.0%)
0.00(0.0%)
0.10(0.2%)
0.38(0.7%)
0.63(1.1%)
0.85(1.4%)
0.97(1.6%)
1.10(1.8%)
1.30(2.0%)
1.51(2.2%)
1.81(2.4%)
Pakistan 0.48(1.4%)
0.60(1.6%)
0.61(1.5%)
0.66(1.4%)
0.73(1.4%)
0.80(1.5%)
1.01(1.6%)
1.01(1.7%)
0.96(1.6%)
1.12(1.7%)
1.25(1.8%)
1.38(1.9%)
Turkey 0.56(1.6%)
0.67(1.8%)
0.61(1.6%)
0.71(1.5%)
0.82(1.6%)
0.88(1.6%)
1.11(1.8%)
1.10(1.8%)
1.26(2.1%)
1.33(2.0%)
1.23(1.8%)
0.99(1.3%)
Others 5.31(15.2%)
5.77(15.3%)
5.65(14.3%)
6.16(13.3%)
6.94(13.4%)
7.46(13.7%)
9.09(14.7%)
9.38(15.4%)
9.31(15.2%)
10.32(15.7%)
10.92(15.6%)
9.57(12.9%)
Source: UN (2006).
98

Annex 23: AGOA exports of clothing to US 1994-2005
US$ thousands (% ofUS imports of clothing)1994 1995 1996 1997 1998 1999 2000 2001 2002 2003 2004 2005
US imports from world(US$ billions)
34.98 37.79 39.54 46.39 51.61 54.56 61.74 60.82 61.37 65.73 69.96 74.15
Benin 9 3 1 0 4 0 0 2 0 1 2 6Botswana .. .. .. .. .. .. 8,990 2,676 6,908 7,665 21,441 31,452Burkina Faso 8 4 6 228 5 2 15 6 121 3 39 12Cameroon 359 459 65 151 1,762 397 114 238 49 176 239 342Cape Verde 0 31 0 0 1 7 963 1,273 1,795 3,119 3,299 2,430Chad 0 1 0 0 0 0 0 0 0 0 26 2Ethiopia 1,241 971 458 142 31 3 6 440 1,388 1,924 3,715 3,819Ghana 1,164 2,713 951 1,171 7,919 3,763 445 313 543 4,871 8,075 5,675Kenya 39,349 37,743 29,245 33,635 37,142 41,939 46,701 68,967 135,180 201,749 295,520 286,129Lesotho .. .. .. .. .. .. 146,364 223,549 342,432 418,995 481,787 408,227Madagascar 2,938 7,247 11,660 16,258 23,459 48,668 115,377 188,102 96,706 211,742 345,728 293,682Malawi 1,361 843 1,407 204 241 1,479 7,653 11,655 12,056 24,681 28,803 24,018Mali 30 322 14 135 29 108 40 37 64 109 21 23Mauritius 199,918 201,319 174,758 196,305 247,597 245,977 259,414 252,369 272,000 286,218 239,731 175,433Mozambique 490 256 474 160 138 47 0 192 547 2,282 2,442 2,722Namibia .. .. .. .. .. .. 167 99 7,042 44,253 82,489 56,025Niger 2 1 33 3 5 75 4 34 5 14 6 3Nigeria 385 205 179 210 592 124 133 304 41 190 95 178Rwanda 0 0 0 0 0 17 0 0 0 0 1 2Senegal 59 47 204 174 87 37 53 44 25 33 14 62Sierra Leone 69 177 10 2 334 128 237 1,317 463 953 1,525 132South Africa 122,487 142,364 151,212 187,964 214,745 252,881 150,313 183,713 193,376 248,532 149,402 69,844Swaziland .. .. .. .. .. .. 33,356 50,340 95,352 149,683 188,467 168,645Tanzania 3,686 3,496 4,491 7,574 8,815 2,863 43 7 179 999 2,796 3,491Uganda 0 0 0 0 14 0 0 14 0 1,851 4,503 5,139Zambia 0 0 246 121 0 1 264 229 0 0 30 2
All AGOA 373,555(1.07%)
398,202(1.05%)
375,414(0.95%)
444,436(0.96%)
542,922(1.05%)
598,514(1.10%)
770,651(1.25%)
985,921(1.62%)
1,166,272(1.90%)
1,610,043(2.45%)
1,860,197(2.66%)
1,537,493(2.07%)
Data reported as US imports from AGOA countries.Source: UN (2006).
99

Annex 24: EU imports of textiles 1994-2005 (excluding intra-EU trade)
US$ billions (% of total EU imports of textiles)1994 1995 1996 1997 1998 1999 2000 2001 2002 2003 2004 2005*
World 13.60 16.00 15.72 16.86 17.39 15.99 16.16 15.70 15.96 18.62 22.02 18.08
China 1.54(11.3%)
1.69(10.6%)
1.63(10.4%)
1.80(10.7%)
1.92(11.0%)
1.93(12.1%)
2.42(15.0%)
2.33(14.8%)
2.70(16.9%)
3.69(19.8%)
4.90(22.3%)
4.93(27.3%)
Turkey 0.97(7.1%)
1.25(7.8%)
1.36(8.7%)
1.59(9.4%)
1.85(10.6%)
1.90(11.9%)
1.86(11.5%)
2.05(13.1%)
2.14(13.4%)
2.74(14.7%)
3.30(15.0%)
2.63(14.5%)
India 1.39(10.2%)
1.82(11.4%)
1.88(12.0%)
1.99(11.8%)
1.97(11.3%)
1.86(11.6%)
1.87(11.6%)
1.89(12.0%)
1.77(11.1%)
2.07(11.1%)
2.57(11.7%)
2.13(11.8%)
Pakistan 0.86(6.3%)
1.08(6.8%)
1.09(6.9%)
1.14(6.8%)
1.17(6.7%)
1.07(6.7%)
1.05(6.5%)
1.09(6.9%)
1.20(7.5%)
1.51(8.1%)
1.85(8.4%)
1.27(7.0%)
Switzerland 1.40(10.3%)
1.53(9.6%)
1.34(8.5%)
1.17(6.9%)
1.26(7.2%)
1.11(6.9%)
1.01(6.3%)
0.94(6.0%)
0.86(5.4%)
0.99(5.3%)
1.05(4.8%)
0.87(4.8%)
US 1.02(7.5%)
1.31(8.2%)
1.40(8.9%)
1.47(8.7%)
1.45(8.3%)
1.22(7.6%)
1.16(7.2%)
1.06(6.8%)
0.95(6.0%)
0.92(4.9%)
0.89(4.0%)
0.78(4.3%)
Korea, Rep. 0.54(4.0%)
0.64(4.0%)
0.62(3.9%)
0.83(4.9%)
0.86(4.9%)
0.81(5.1%)
0.88(5.4%)
0.80(5.1%)
0.80(5.0%)
0.76(4.1%)
0.76(3.5%)
0.51(2.8%)
Indonesia 0.61(4.5%)
0.77(4.8%)
0.74(4.7%)
0.74(4.4%)
0.75(4.3%)
0.59(3.7%)
0.55(3.4%)
0.53(3.4%)
0.51(3.2%)
0.49(2.6%)
0.49(2.2%)
0.31(1.7%)
Romania 0.06(0.4%)
0.08(0.5%)
0.08(0.5%)
0.10(0.6%)
0.13(0.7%)
0.13(0.8%)
0.15(0.9%)
0.19(1.2%)
0.25(1.6%)
0.34(1.8%)
0.44(2.0%)
0.40(2.2%)
Japan 0.58(4.3%)
0.63(3.9%)
0.55(3.5%)
0.58(3.4%)
0.66(3.8%)
0.63(3.9%)
0.56(3.5%)
0.47(3.0%)
0.42(2.6%)
0.41(2.2%)
0.44(2.0%)
0.33(1.8%)
Taiwan, China
0.37(2.7%)
0.42(2.6%)
0.44(2.8%)
0.61(3.6%)
0.71(4.1%)
0.65(4.1%)
0.60(3.7%)
0.48(3.1%)
0.44(2.8%)
0.40(2.1%)
0.38(1.7%)
0.26(1.4%)
Egypt 0.37(2.7%)
0.42(2.6%)
0.33(2.1%)
0.44(2.6%)
0.34(2.0%)
0.27(1.7%)
0.31(1.9%)
0.26(1.7%)
0.26(1.6%)
0.32(1.7%)
0.35(1.6%)
0.31(1.7%)
Thailand 0.30(2.2%)
0.41(2.6%)
0.42(2.7%)
0.45(2.7%)
0.43(2.5%)
0.39(2.4%)
0.35(2.2%)
0.30(1.9%)
0.27(1.7%)
0.30(1.6%)
0.34(1.5%)
0.24(1.3%)
Tunisia 0.11(0.8%)
0.13(0.8%)
0.14(0.9%)
0.13(0.8%)
0.12(0.7%)
0.13(0.8%)
0.15(0.9%)
0.20(1.3%)
0.22(1.4%)
0.25(1.3%)
0.30(1.4%)
0.27(1.5%)
Iran 0.60(4.4%)
0.56(3.5%)
0.49(3.1%)
0.41(2.4%)
0.40(2.3%)
0.36(2.3%)
0.32(2.0%)
0.26(1.7%)
0.22(1.4%)
0.24(1.3%)
0.26(1.2%)
0.21(1.2%)
Bangladesh 0.06(0.4%)
0.11(0.7%)
0.12(0.8%)
0.12(0.7%)
0.12(0.7%)
0.11(0.7%)
0.13(0.8%)
0.13(0.8%)
0.14(0.9%)
0.15(0.8%)
0.23(1.0%)
0.19(1.1%)
Bulgaria 0.07(0.5%)
0.08(0.5%)
0.07(0.4%)
0.08(0.5%)
0.08(0.5%)
0.07(0.4%)
0.06(0.4%)
0.09(0.6%)
0.12(0.8%)
0.16(0.9%)
0.23(1.0%)
0.21(1.2%)
Israel 0.17(1.3%)
0.20(1.3%)
0.21(1.3%)
0.20(1.2%)
0.21(1.2%)
0.20(1.3%)
0.18(1.1%)
0.17(1.1%)
0.17(1.1%)
0.19(1.0%)
0.21(1.0%)
0.19(1.1%)
Russia 0.14(1.0%)
0.19(1.2%)
0.13(0.8%)
0.14(0.8%)
0.13(0.7%)
0.11(0.7%)
0.14(0.9%)
0.15(1.0%)
0.16(1.0%)
0.18(1.0%)
0.20(0.9%)
0.11(0.6%)
South Africa
0.09(0.7%)
0.08(0.5%)
0.12(0.8%)
0.11(0.7%)
0.13(0.7%)
0.12(0.8%)
0.11(0.7%)
0.12(0.8%)
0.12(0.8%)
0.15(0.8%)
0.18(0.8%)
0.14(0.8%)
Others 2.35(17.3%)
2.6(16.3%)
2.56(16.3%)
2.76(16.4%)
2.7(15.5%)
2.33(14.6%)
2.3(14.2%)
2.19(13.9%)
2.24(14.0%)
2.36(12.7%)
2.65(12.0%)
1.79(9.9%)
* PreliminarySource: UN (2006).
100

Annex 25: AGOA exports of textiles to EU 1994-2005
US$ thousands (% of EU imports of textiles)1994 1995 1996 1997 1998 1999 2000 2001 2002 2003 2004 2005*
EU imports from world(US$ billions)
13.60 16.00 15.72 16.86 17.39 15.99 16.16 15.70 15.96 18.62 22.02 18.08
Benin 1,224 1,117 2,102 4,460 4,660 2,874 531 163 123 49 60 87Botswana .. .. .. .. .. .. 1,097 186 1 6 68 79Burkina Faso 170 59 46 30 35 54 2,275 3,183 2,546 1,615 399 579Cameroon 8,115 10,596 10,571 9,778 8,229 3,431 3,337 3,104 1,995 1,426 666 471Cape Verde 4 0 6 20 8 22 17 84 90 13 126 0
Chad
2 0 0 0 0 0 1 0 2 0 2 15Ethiopia 4 1,244 2,507 5,016 1,749 1,653 1,911 2,944 9,998 9,302 8,135 7,783Ghana 21 85 324 118 79 107 56 1,051 2,496 705 644 116Kenya 5,042 3,065 2,928 7,239 3,145 1,645 2,602 641 1,458 2,681 4,224 3,066Lesotho .. .. .. .. .. .. 3 16 15 1 0 2Madagascar 9,361 10,056 7,583 8,209 7,197 7,255 5,856 6,340 4,532 4,831 8,812 6,700Malawi 5,744 6,009 3,601 1,668 1,510 241 8 18 28 64 52 0Mali 67 77 175 32 100 47 249 241 125 89 151 175Mauritius 16,680 25,255 25,326 14,138 10,336 7,386 7,862 6,168 13,250 11,125 11,274 9,697Mozambique 3,146 3,460 600 7,677 6,482 4,161 1,737 1,366 1,504 1,810 1,952 1,466Namibia .. .. .. .. .. .. 251 434 661 447 923 622Niger 17 727 107 140 37 120 194 284 43 305 465 449Nigeria 4,321 12,974 15,638 24,662 20,012 14,799 17,666 13,695 8,379 14,532 25,191 3,658Rwanda 33 2 46 0 5 38 8 13 0 0 5 10Senegal 928 1,532 1,384 1,168 1,849 493 383 487 781 888 1,078 791Sierra Leone 822 187 157 417 119 191 869 552 954 760 1,519 2,024South Africa 88,099 81,702 119,281 108,148 130,999 122,422 108,873 116,873 122,983 150,299 177,813 140,602Swaziland .. .. .. .. .. .. 1,920 716 558 824 947 359Tanzania 11,557 14,160 8,623 5,541 1,697 1,307 3,810 6,132 2,188 2,032 7,438 2,187Uganda 39 8 40 261 102 43 16 5 124 209 199 360Zambia 15,650 30,440 35,667 42,795 37,131 32,399 27,360 21,745 14,747 15,386 22,496 18,119
All AGOA 171,046(1.26%)
202,757(1.27%)
236,711(1.51%)
241,518(1.43%)
235,482(1.35%)
200,688(1.26%)
190,009(1.18%)
186,443(1.19%)
189,581(1.19%)
219,398(1.18%)
274,639(1.25%)
199,415(1.10%)
*Preliminary. Data reported as EU imports from AGOA (T&C) countries.Source: UN (2006).
101

Annex 26: EU imports of clothing 1994-2005 (excluding intra-EU trade)
US$ billions (% of total EU imports of clothing)1994 1995 1996 1997 1998 1999 2000 2001 2002 2003 2004 2005*
World 30.29 34.40 36.70 38.76 40.79 42.02 42.83 44.14 47.89 58.65 68.91 63.59
China 4.87(16.1%)
4.60(13.4%)
5.25(14.3%)
5.71(14.7%)
5.79(14.2%)
6.58(15.7%)
7.71(18.0%)
7.94(18.0%)
8.61(18.0%)
13.04(22.2%)
16.50(23.9%)
19.99(31.4%)
Turkey 3.38(11.2%)
4.40(12.8%)
4.59(12.5%)
4.76(12.3%)
5.33(13.1%)
5.29(12.6%)
5.24(12.2%)
5.64(12.8%)
6.84(14.3%)
8.89(15.2%)
10.26(14.9%)
8.81(13.9%)
Bangladesh 0.95(3.1%)
1.36(3.9%)
1.52(4.1%)
1.74(4.5%)
1.93(4.7%)
2.00(4.7%)
2.48(5.8%)
2.72(6.2%)
2.75(5.8%)
3.87(6.6%)
5.13(7.4%)
4.13(6.5%)
Romania 0.98(3.2%)
1.32(3.8%)
1.57(4.3%)
1.82(4.7%)
2.26(5.5%)
2.41(5.7%)
2.54(5.9%)
3.16(7.2%)
3.69(7.7%)
4.54(7.7%)
5.01(7.3%)
4.51(7.1%)
India 1.78(5.9%)
2.21(6.4%)
2.10(5.7%)
1.90(4.9%)
1.91(4.7%)
1.96(4.7%)
2.05(4.8%)
2.15(4.9%)
2.40(5.0%)
3.02(5.2%)
3.51(5.1%)
3.86(6.1%)
Tunisia 1.74(5.7%)
2.37(6.9%)
2.59(7.1%)
2.52(6.5%)
2.82(6.9%)
2.77(6.6%)
2.59(6.0%)
2.83(6.4%)
2.98(6.2%)
3.35(5.7%)
3.46(5.0%)
3.00(4.7%)
Morocco 1.78(5.9%)
2.19(6.4%)
2.25(6.1%)
2.27(5.9%)
2.44(6.0%)
2.40(5.7%)
2.31(5.4%)
2.51(5.7%)
2.67(5.6%)
3.04(5.2%)
3.25(4.7%)
2.23(3.5%)
Hong Kong 4.00(13.2%)
4.231(2.3%)
4.30(11.7%)
4.32(11.1%)
4.38(10.7%)
4.48(10.7%)
3.25(7.6%)
2.76(6.2%)
4.09(8.5%)
2.96(5.0%)
3.05(4.4%)
2.36(3.7%)
Indonesia 1.24(4.1%)
1.31(3.8%)
1.35(3.7%)
1.61(4.2%)
1.61(3.9%)
1.64(3.9%)
1.85(4.3%)
1.83(4.1%)
1.58(3.3%)
1.80(3.1%)
1.95(2.8%)
1.55(2.4%)
Bulgaria 0.26(0.9%)
0.35(1.0%)
0.39(1.1%)
0.48(1.2%)
0.60(1.5%)
0.64(1.5%)
0.73(1.7%)
0.92(2.1%)
0.88(1.8%)
1.18(2.0%)
1.44(2.1%)
1.30(2.0%)
Thailand 0.81(2.7%)
0.79(2.3%)
0.80(2.2%)
0.83(2.1%)
0.92(2.2%)
1.01(2.4%)
1.03(2.4%)
0.97(2.2%)
0.98(2.1%)
1.17(2.0%)
1.33(1.9%)
0.99(1.6%)
Pakistan 0.54(1.8%)
0.59(1.7%)
0.60(1.6%)
0.59(1.5%)
0.61(1.5%)
0.60(1.4%)
0.60(1.4%)
0.65(1.5%)
0.77(1.6%)
1.02(1.7%)
1.26(1.8%)
0.92(1.5%)
Sri Lanka 0.53(1.7%)
0.62(1.8%)
0.66(1.8%)
0.69(1.8%)
0.72(1.8%)
0.78(1.9%)
0.84(2.0%)
0.75(1.7%)
0.77(1.6%)
0.91(1.6%)
1.16(1.7%)
1.07(1.7%)
Vietnam 0.33(1.1%)
0.37(1.1%)
0.51(1.4%)
0.62(1.6%)
0.68(1.7%)
0.73(1.7%)
0.78(1.8%)
0.76(1.7%)
0.72(1.5%)
0.66(1.1%)
0.92(1.3%)
0.80(1.3%)
Korea, Rep. 0.66(2.2%)
0.59(1.7%)
0.57(1.6%)
0.64(1.7%)
0.72(1.8%)
0.85(2.0%)
0.86(2.0%)
0.73(1.7%)
0.65(1.4%)
0.72(1.2%)
0.82(1.2%)
0.38(0.6%)
Cambodia 0.03(0.1%)
0.05(0.2%)
0.11(0.3%)
0.16(0.4%)
0.15(0.4%)
0.23(0.5%)
0.27(0.6%)
0.40(0.9%)
0.41(0.9%)
0.54(0.9%)
0.73(1.1%)
0.60(0.9%)
Mauritius 0.51(1.7%)
0.59(1.7%)
0.65(1.8%)
0.69(1.8%)
0.68(1.7%)
0.69(1.6%)
0.66(1.5%)
0.64(1.4%)
0.60(1.3%)
0.66(1.1%)
0.69(1.0%)
0.55(0.9%)
Ukraine 0.15(0.5%)
0.17(0.5%)
0.22(0.6%)
0.25(0.6%)
0.31(0.8%)
0.34(0.8%)
0.37(0.9%)
0.42(1.0%)
0.43(0.9%)
0.51(0.9%)
0.63(0.9%)
0.58(0.9%)
Macao 0.51(1.7%)
0.50(1.5%)
0.55(1.5%)
0.63(1.6%)
0.53(1.3%)
0.50(1.2%)
0.64(1.5%)
0.57(1.3%)
0.41(0.9%)
0.57(1.0%)
0.58(0.8%)
0.39(0.6%)
Croatia 0.55(1.8%)
0.60(1.7%)
0.58(1.6%)
0.54(1.4%)
0.56(1.4%)
0.51(1.2%)
0.44(1.0%)
0.49(1.1%)
0.46(1.0%)
0.51(0.9%)
0.57(0.8%)
0.51(0.8%)
Others 4.69(15.5%)
5.19(15.1%)
5.52(15.1%)
5.99(15.5%)
5.84(14.3%)
5.63(13.4%)
5.56(13.0%)
5.32(12.1%)
5.19(10.8%)
5.69(9.7%)
6.67(9.7%)
5.06(8.0%)
* PreliminarySource: UN (2006).
102

Annex 27: AGOA exports of clothing to EU 1994-2005
US$ thousands (% of EU imports of clothing)1994 1995 1996 1997 1998 1999 2000 2001 2002 2003 2004 2005*
EU imports from world(US$ billions)
30.29 34.40 36.70 38.76 40.79 42.02 42.83 44.14 47.89 58.65 68.91 63.59
Benin 32 17 16 31 19 30 296 11 13 120 45 71Botswana .. .. .. .. .. .. 15,343 18,722 7,246 6,224 12,924 5,346Burkina Faso 61 77 35 312 84 65 75 109 80 61 59 157Cameroon 96 98 16 227 126 141 290 841 693 1,331 1,086 845Cape Verde 0 422 2,409 2,700 1,874 2,138 2,403 3,317 4,044 4,314 5,148 303Chad 2 3 6 4 23 0 70 54 151 445 0 484Ethiopia 9 156 359 226 556 966 461 264 33 129 850 1,217Ghana 93 1,019 90 391 81 200 219 147 350 181 132 168Kenya 6,329 5,762 3,562 2,677 2,419 2,566 1,822 1,696 1,028 1,427 3,239 1,205Lesotho .. .. .. .. .. .. 1,700 3,385 1,708 1,183 1,123 776Madagascar 89,110 106,713 155,662 185,111 217,558 239,465 246,839 247,331 131,521 145,437 201,831 214,617Malawi 6 390 2,043 51 36 229 1,030 904 1 37 124 228Mali 710 1,672 546 351 176 1,698 1,457 372 139 242 155 569Mauritius 510,285 594,099 653,584 691,756 683,972 685,237 660,474 636,012 600,410 659,420 687,001 545,510Mozambique 52 86 111 89 51 1,618 987 1,456 774 21 353 349Namibia .. .. .. .. .. .. 33 150 210 533 358 249Niger 69 202 28 61 49 63 28 796 139 118 72 9Nigeria 2,214 2,171 2,369 968 558 234 57 123 90 67 64 147Rwanda 52 28 19 33 64 6 11 0 309 308 5 12Senegal 759 465 210 131 143 225 193 148 604 352 359 306Sierra Leone 876 779 2,138 972 1,119 1,510 2,616 1,920 2,416 5,145 1,702 718South Africa 83,144 86,787 92,048 75,557 72,868 76,775 79,774 73,823 67,294 87,557 73,634 48,993Swaziland .. .. .. .. .. .. 1,164 667 130 179 1,103 43Tanzania 10,792 10,955 12,673 9,159 7,135 3,272 1,766 2,092 2,702 3,391 4,290 2,908Uganda 15 160 43 10 6 22 18 43 96 1,450 19 2Zambia 1,023 419 63 163 314 390 185 27 87 5 120 149
All AGOA 705,729(2.33%)
812,479(2.36%)
928,032(2.53%)
970,979(2.51%)
989,230(2.43%)
1,016,849(2.42%)
1,019,311(2.38%)
994,409(2.25%)
822,269(1.72%)
919,675(1.57%)
995,796(1.45%)
825,379(1.30%)
* Preliminary. Data reported as EU imports from AGOA (T&C) countries.Source: UN (2006).
103

Annex 28: Seed cotton production in AGOA countries 1994-2005
1000s Tons (% of world production)1994 1995 1996 1997 1998 1999 2000 2001 2002 2003 2004 2005
World 52,717 56,669 55,648 54,608 52,126 53,000 53,058 59,809 52,911 55,287 69,936 68,298Benin 260 328 430 377 364 376 340 393 486 420 425 425Botswana 3 3 3 3 2 2 3 3 3 3 3 3Burkina Faso 177 150 203 343 325 257 213 395 439 472 535 535Cameroon 153 195 223 193 195 197 204 207 200 200 180 170Cape Verde .. .. .. .. .. .. .. .. .. .. .. ..Chad 157 157 213 263 162 186 180 200 200 140 233 233Ethiopia 43 46 46 46 46 46 46 46 46 65 65 65Ghana 23 26 35 40 46 38 36 18 18 15 17 17Kenya 18 24 34 22 23 24 20 20 20 20 20 20Lesotho .. .. .. .. .. .. .. .. .. .. .. ..Madagascar 27 24 27 36 39 35 27 27 8 11 13 13Malawi 17 68 83 45 36 53 37 37 40 40 54 54Mali 293 406 452 523 518 460 243 571 440 621 590 600Mauritius .. .. .. .. .. .. .. .. .. .. .. ..Mozambique 51 52 52 73 91 91 50 55 50 50 50 50Namibia 1 1 2 2 3 5 5 5 6 5 5 5Niger 8 14 10 8 4 10 10 10 10 10 10 10Nigeria 218 251 301 341 348 381 399 402 403 397 417 415Rwanda 0 0 0 0 0 0 0 0 0 0 0 0Senegal 29 31 38 40 12 15 20 34 39 55 40 42Sierra Leone .. .. .. .. .. .. .. .. .. .. .. ..South Africa 68 64 113 72 104 136 76 104 47 41 72 52Swaziland 11 9 20 25 24 23 13 10 7 7 7 7Tanzania 125 248 253 207 93 106 123 243 190 155 330 330Uganda 38 39 54 37 45 66 67 60 67 67 67 67Zambia 33 17 37 64 59 140 62 62 62 62 62 62
All AGOA 1,753(3.3%)
2,153(3.8%)
2,629(4.7%)
2,760(5.1%)
2,539(4.9%)
2,647(5.0%)
2,174(4.1%)
2,902(4.9%)
2,781(5.3%)
2,856(5.2%)
3,195(4.6%)
3,175(4.6%)
Source: FAO (2006).
104

Annex 29: AGOA cotton lint production and exports 2003
Production (tons)
Exports (tons)
ExportsProduction
Exports to AGOA
Benin 148,000 163,307 110% 5%Botswana 770 462 60% 0%Burkina FasoCameroon 93,000 92,185 99% 1%Cape Verde 0 0Etiopía 14,000 1,500 11% 7%Ghana 7,000 3,190 46% 12%Kenya 5,000 291 6% 0%Lesotho 0 0Madagascar 6,000 2,304 38% 40%Malawi 10,000 5,473 55% 100%Mali 261,000 255,829 98% 2%Mauritius 0 2 33%Mozambique 25,000 24,681 99% 13%Namibia 1,683 2,493 0%Niger 1,000 156 16% 5%Nigeria 140,000 26,127 19% 0%Rwanda 0 0Senegal 22,000 24,314 111% 13%Sierra Leone 0 0South Africa 16,348 5,579 34% 2%Swaziland 2,000 1,260 63% 0%Tanzania 51,000 40,337 79% 5%Uganda 22,200 1,669 8% 5%Zambia 22,000 35,144 160% 85%All AGOA 1,000,001 830,458 83% 8%
Source: FAO (2006).
105
Annex 30: Intra AGOA Cotton Trade 2003 (US$ 1000s)
ImporterExporter
World EU US China Benin Botswana Cameroon Cape Verde Côte d’Ivoire
Ethiopia Ghana Kenya Lesotho Madagascar Malawi
World 8,615,573 1,273,651 34,559 1,187,046 6,056 32 45 70 872 11 1,849 1,984 0 172 135EU 604,361 231,875 2,779 14,064 1 70 9 11 6 11 10US 3,339,359 87,461 663,331 2 0China 183,621 7,875 138 11 1 1 8Benin 166,067 13,591 68,251Botswana 248Cameroon 102,806 38,057 18,303Cape Verde 0Côte d’Ivoire 101,475 10,918 27,882 1Ethiopia 15,580 136Ghana 3,930 759 1,516 462Kenya 2,412Lesotho 0Madagascar 5,626 3,379Malawi 4,852Mali 184,342 40,184 28,325 42 2Mauritius 692 210 72Mozambique 30,653 13,270Namibia 33Niger 1,482 621 67Nigeria 21,215 619 26Rwanda 0Senegal 21,598 3,313 4,966 1,828Sierra Leone 132 132South Africa 34,604 1,269 461 29 6Swaziland 2,272 10Tanzania 50,492 4,400 6,088 32 1,075Uganda 22,502 7,620 2,153 859Zambia 35,489 170 2,139 114All AGOA 808,502 138,658 0 160,084 555 32 30 0 42 0 1,830 1,934 0 72 120
Continued.

ImporterExporter
World Mali Mauritius Mozambique Namibia Niger Nigeria Rwanda Senegal Sierra Leone
South Africa
Swaziland Tanzania Uganda Zambia All AGOA
World 8,615,573 348 18,553 32 1,722 467 14,430 310 157 679 76,803 581 61 96 2,343 127,808EU 604,361 12 2 2 15 356 3 111 679 2,578 1 3 3,880US 3,339,359 24 58 785 1 870China 183,621 390 388 3 636 11 66 1,515Benin 166,067 733 443 5,889 449 7,514Botswana 248 1 1Cameroon 102,806 1,028 1,028Cape Verde 0 0Côte d’Ivoire 101,475 3 229 233Ethiopia 15,580 480 541 1,021Ghana 3,930 462Kenya 2,412 0Lesotho 0 0Madagascar 5,626 1,659 589 2,248Malawi 4,852 2,597 2,256 4,853Mali 184,342 2,864 621 3,529Mauritius 692 146 7 225Mozambique 30,653 544 3,382 55 3,981Namibia 33 0Niger 1,482 67Nigeria 21,215 2 11 39Rwanda 0 0Senegal 21,598 1,059 2,887Sierra Leone 132 0South Africa 34,604 399 7 72 7 2 26 548Swaziland 2,272 0Tanzania 50,492 311 90 954 91 2,553Uganda 22,502 142 217 1,218Zambia 35,489 51 29,927 30,092All AGOA 808,502 311 8,479 7 72 448 5,896 307 0 0 39,385 541 7 93 2,338 62,499
Source: UNCTAD (2006).

Annex 31: The importance of AGOA regional trade in cotton, yarn, fabric and clothing (2003)
% imports from region % exports to region
Cotton Yarn Fabric Clothing Cotton Yarn Fabric Clothing
Benin 7% 4% 4% 5% 5% 50% 59% 65%Botswana 100% 47% 6% 0% 0% 100% 68% 1%Cameroon 67% 6% 8% 4% 1% 0% 2% 2%Cape Verde 0% 0% 1% 1% - - 0% 0%Côte d’Ivoire 5% 5% 8% 2% 0% 11% 58% 94%Ethiopia 0% 0% 0% 2% 7% 0% 0% 1%Ghana 99% 5% 7% 1% 12% 7% 100% 7%Kenya 97% 4% 12% 7% 0% 21% 61% 5%Lesotho - 0% 0% 0% - 6% 10% 0%Madagascar 42% 9% 13% 4% 40% 44% 39% 0%Malawi 89% 29% 20% 24% 100% 100% 67% 44%Mali 89% 9% 8% 28% 2% 0% 11% 12%Mauritius 46% 13% 8% 5% 33% 57% 29% 0%Mozambique 22% 34% 17% 27% 13% 25% 10% 45%Namibia 4% 11% 27% 91% 0% 0% 7% 0%Niger 96% 41% 23% 3% 5% 0% 22% 42%Nigeria 41% 2% 2% 8% 0% 2% 100% 18%Rwanda 99% 54% 30% 16% - 100% 100% 11%Senegal 0% 1% 12% 5% 13% 100% 54% 34%Sierra Leone 0% 6% 0% 4% 0% 7% 2% 1%South Africa 51% 4% 1% 6% 2% 15% 28% 15%Swaziland 93% 0% 0% 1% 0% 1% 0% 0%Tanzania 11% 4% 4% 7% 5% 20% 52% 64%Uganda 97% 44% 12% 17% 5% 100% 72% 13%Zambia 100% 30% 28% 34% 85% 45% 61% 65%All AGOA 49% 8% 5% 11% 8% 19% 37% 4%
Source: UNCTAD (2006).

Annex 32: Intra AGOA Yarn Trade 2003 (US$ 1000s)
ImporterExporter
World EU US China Benin Botswana Cameroon Cape Verde Côte d’Ivoire
Ethiopia Ghana Kenya Lesotho Madagascar Malawi
World 39,385,001 14,251,514 2,407,664 5,507,205 3,126 2,706 2,945 104 12,094 23,158 3,184 33,802 1,662 3,341 2,193EU 13,887,858 10,043,684 464,474 391,489 143 37 760 87 1,150 3,597 214 11,602 399 31US 2,300,314 367,618 208,391 38 2 962 77 16 861China 3,330,812 212,984 61,361 856 104 224 1 1,012 10,173 558 355 126 802 273Benin 10 4 5Botswana 1 1Cameroon 38 3Cape Verde 0Côte d’Ivoire 572 200 18Ethiopia 350 341Ghana 346 216 28Kenya 18,942 6,120 19 4,013 21 13 94 123 72 215Lesotho 34 2Madagascar 7,375 2,195 1,105Malawi 6Mali 416 1Mauritius 1,290 87 139 254 1 211Mozambique 97 72 1Namibia 18 18Niger 52 52Nigeria 23,200 22,681 119 2 57Rwanda 46Senegal 290 4 1 188Sierra Leone 562 458 1 32South Africa 102,019 42,952 8,554 9,511 168 208 14 9 763 24 293Swaziland 7,292 5,098Tanzania 11,707 5,741 1,379 678Uganda 352 23 15Zambia 25,594 15,124 1,013 115All AGOA 200,609 101,005 8,606 16,507 140 1,267 183 0 547 14 155 1,496 1 307 641

ImporterExporter
World Mali Mauritius Mozambique Namibia Niger Nigeria Rwanda Senegal Sierra Leone
South Africa
Swaziland Tanzania Uganda Zambia All AGOA
World 39,385,001 1,247 140,174 2,302 9,354 174 34,048 1,456 6,541 946 186,392 2,124 10,417 4,920 3,677 492,087EU 13,887,858 351 7,748 156 27 38 11,767 14 770 553 60,500 23 593 113 727 101,400US 2,300,314 1,131 96 1,451 2,189 6,659 730 14,212China 3,330,812 202 8,050 189 3,640 33 7,631 12 777 161 6,958 22 417 259 15 42,850Benin 10 5Botswana 1 1Cameroon 38 0Cape Verde 0 0Côte d’Ivoire 572 37 7 62Ethiopia 350 0Ghana 346 24 24Kenya 18,942 4 18 12 173 74 935 207 2,015 3,976Lesotho 34 2Madagascar 7,375 3,127 128 3,255Malawi 6 5 1 6Mali 416 2 2Mauritius 1,290 251 20 737Mozambique 97 24 24Namibia 18 0Niger 52 0Nigeria 23,200 96 69 4 104 1 452Rwanda 46 46 46Senegal 290 59 43 290Sierra Leone 562 9 41South Africa 102,019 17 9,812 725 994 748 3 15 172 116 1,107 15,188Swaziland 7,292 77 77Tanzania 11,707 74 63 304 1,163 1 2,283Uganda 352 10 304 352Zambia 25,594 5,582 4,690 11,400All AGOA 200,609 117 18,796 793 994 71 784 784 85 58 7,304 0 399 2,177 1,110 38,223
Source: UNCTAD (2006).

Annex 33: Intra AGOA Fabric Trade 2003 (US$ 1000s)
ImporterExporter
World EU US China Benin Botswana Cameroon Cape Verde Côte d’Ivoire
Ethiopia Ghana Kenya Lesotho Madagascar Malawi
World 96,928,879 33,374,708 8,528,587 9,398,616 345,544 3,688 12,810 1,112 19,873 59,537 44,650 36,475 157,153 24,095 26,656EU 37,420,375 24,031,371 1,783,692 313,297 31,920 149 3,718 1,015 9,583 3,384 5,982 5,118 34 4,871 84US 7,479,303 732,808 181,134 291 403 3 105 48 1,736 224 166 161 141China 12,401,166 1,469,095 941,703 266,215 1,513 3,521 26 5,692 40,085 20,449 6,902 18,740 6,531 2,713Benin 5,129 29 165 86 68 479Botswana 41 12 4 3Cameroon 2,248 1,368 63 47Cape Verde 5 5Côte d’Ivoire 16,709 6,035 64 4,044 485 7 89Ethiopia 8,029 7,570 1 2 1Ghana 6,619 490 42 2,829 1 210 928 6Kenya 5,063 611 276 7 155 9 19 119Lesotho 598 1 1 62Madagascar 3,972 2,623 33 439Malawi 128 61Mali 280 37 20 2Mauritius 19,759 7,930 6 67 122 68 75 54 3,011 4Mozambique 1,938 1,713 4 51Namibia 472 416 11Niger 591 228 96 2 116 5 1Nigeria 11,390 547 292 262 5,930 26 1,136 2 1Rwanda 215Senegal 1,126 234 58 13 5 12 447Sierra Leone 326 201South Africa 139,544 50,671 19,868 242 1 209 24 13 1,517 837 199 4,759Swaziland 1,886 9 1Tanzania 9,698 1,176 1,045 53 68 65 3,174 13Uganda 722 166 1 335 76Zambia 403 193 4 2 49 1 122All AGOA 236,891 82,326 22,047 593 12,811 225 1,084 12 1,583 256 3,348 4,429 493 3,229 5,211

ImporterExporter
World Mali Mauritius Mozambique Namibia Niger Nigeria Rwanda Senegal Sierra Leone
South Africa
Swaziland Tanzania Uganda Zambia All AGOA
World 96,928,879 48,464 189,691 29,072 30,921 19,128 123,769 1,570 30,079 11,929 446,260 39,197 35,295 19,338 16,235 1,772,541EU 37,420,375 36,446 36,480 407 1,962 10,539 13,222 180 5,692 8,079 122,492 23 529 403 828 303,140US 7,479,303 60 1,678 1 215 5,077 103 452 19,430 10 26 67 91 30,488China 12,401,166 930 79,496 5,167 1,250 1,882 5,530 15 11,692 1,506 96,398 5,702 12,813 4,270 1,361 600,399Benin 5,129 296 2,122 3,051Botswana 41 13 8 28Cameroon 2,248 47Cape Verde 5 0Côte d’Ivoire 16,709 470 18 2,697 16 1,627 192 9,645Ethiopia 8,029 1 13 17Ghana 6,619 26 6 401 2,071 16 115 1 9 6,619Kenya 5,063 117 237 11 369 1,821 207 3,064Lesotho 598 62Madagascar 3,972 1,113 1 1,553Malawi 128 1 2 39 1 2 41 86Mali 280 22 4 1 1 30Mauritius 19,759 673 1 1,814 5,822Mozambique 1,938 136 8 199Namibia 472 35 35Niger 591 7 131Nigeria 11,390 3,244 959 13 4 12 3 10 50 11,390Rwanda 215 5 2 207 214Senegal 1,126 47 1 5 62 6 23 608Sierra Leone 326 5 5South Africa 139,544 113 13,217 4,236 8,390 108 266 14 3 17 1,055 220 4,240 39,438Swaziland 1,886 0Tanzania 9,698 65 118 93 1,305 67 62 5,083Uganda 722 107 1 519Zambia 403 1 73 246All AGOA 236,891 3,901 14,452 5,032 8,415 4,483 2,533 470 3,757 33 3,731 13 1,439 2,326 4,626 87,892
Source: UNCTAD (2006).

Annex 34: Intra AGOA Clothing Trade 2003 (US$ 1000s)
ImporterExporter
World EU US China Benin Botswana Cameroon Cape Verde Côte d’Ivoire
Ethiopia Ghana Kenya Lesotho Madagascar Malawi
World 247,420,125 103,810,296 72,842,028 1,406,203 58,442 11,944 43,908 5,845 22,373 69,300 77,698 46,029 2,748 13,151 22,203EU 53,931,508 39,800,968 3,005,701 96547 23,987 43 28,416 1,580 11,677 2,015 26,907 18,557 78 3,872 3,716US 4,301,485 456,033 17,103 4,251 801 508 1,138 380 19,479 3,547 68 2,022China 66,584,738 14,376,690 11,701,657 15,140 9,448 4,452 528 1,840 47,471 3,651 1,495 257 6,706 2,148Benin 768 136 32 2Botswana 14,415 6,229 7,665 5 4 14Cameroon 2,504 1,351 192 1 7 2Cape Verde 7,483 4,314 3,119Côte d’Ivoire 9,753 3,653 395 2,624 1,418 65 1 121 2Ethiopia 4,010 1,861 1,925 6 2 3Ghana 6,037 209 4,890 268 7 29 3 3 3Kenya 218,440 1,512 201,776 2 1 1 586 17 13 756Lesotho 427,588 1,183 419,072 1 1Madagascar 365,368 147,489 211,771 20 2Malawi 42,294 40 24,681 10 1 2 1Mali 650 293 170 17 1Mauritius 974,369 661,990 286,347 210 1 64 1 31 2 112 374 90Mozambique 4,394 57 2,282 1 37Namibia 45,175 563 44,258 10 1 13Niger 551 141 39 69 1 80Nigeria 2,761 225 195 26 20 69 2 6Rwanda 455 308 3 1Senegal 1,847 1,009 37 5 11 71 365 7 1Sierra Leone 6,551 5,276 953 10 31 3South Africa 453,350 99,841 253,472 597 5 121 28 41 766 2,371 42 2,069Swaziland 153,092 189 149,684 1 2Tanzania 10,940 3,439 1,009 364 663 1,992Uganda 3,893 1,457 1,853 7 4 3 249Zambia 289 90 11 2 8 9 1 63All AGOA 2,756,977 942,855 1,615,799 828 2,971 32 1,702 71 421 1,067 966 3,275 1 550 5,303

ImporterExporter
World Mali Mauritius Mozambique Namibia Niger Nigeria Rwanda Senegal Sierra Leone
South Africa
Swaziland Tanzania Uganda Zambia All AGOA
World 247,420,125 15,724 33,401 33,886 40,887 26,064 14,845 13,133 22,778 9,531 364,986 6,419 52,250 52,723 37,336 1,097,604EU 53,931,508 5,286 6,569 4,659 314 2,307 3,922 3,467 7,874 3,724 26,546 208 8,064 10,238 4,083 208,109US 4,301,485 361 128 2,256 86 17,435 1,949 145 2,578 1,183 4,836 15 12,559 5,119 2,509 83,353China 66,584,738 362 8,576 1,816 1,375 1,393 4,313 205 3,232 356 222,896 171 4,887 6,932 3,584 353,234Benin 768 468 1 503Botswana 14,415 62 65 61 211Cameroon 2,504 4 28 42Cape Verde 7,483 0Côte d’Ivoire 9,753 3,737 59 2 1,114 8 3 2 9,156Ethiopia 4,010 1 7 1 1 37 1 59Ghana 6,037 6 29 8 19 16 1 40 17 449Kenya 218,440 4 2 18 39 1,157 88 211 32 1,114 7,249 507 11,797Lesotho 427,588 5 6Madagascar 365,368 803 1 8 32 2 848Malawi 42,294 4 1,238 2 4 17,152 1 24 42 18,481Mali 650 2 15 41 1 77Mauritius 974,369 11 268 1 93 2,909 14 55 135 4,161Mozambique 4,394 1 1,951 6 1,996Namibia 45,175 1 2 3 17 47Niger 551 21 22 40 233Nigeria 2,761 2 303 3 5 1 13 34 2 486Rwanda 455 2 1 2 45 51Senegal 1,847 124 1 21 5 16 1 628Sierra Leone 6,551 27 71South Africa 453,350 114 900 7,127 37,040 2 1,081 73 6 283 2,382 1,094 10,253 65,798Swaziland 153,092 1 2 6Tanzania 10,940 395 537 1 1 654 426 189 1,729 6,951Uganda 3,893 148 1 2 77 491Zambia 289 1 6 6 76 3 13 188All AGOA 2,756,977 4,392 1,707 9,188 37,111 884 1,136 2,082 1,226 408 22,836 37 3,675 8,928 12,767 122,736
Source: UNCTAD (2006).

Annex 35: Costs of doing business
Country Trading across borders Employing workers Paying taxesTime for export
(days)
Time for import
(days)
Hiring cost
(% of salary)
Firing cost
(weeks of wages)
Tax rate
(% of profit)Major importing markets
France 15 15 47.4 31.8 68.2Germany 6 6 19.3 69.3 57.1UK 12 12 11.0 22.1 35.4US 9 9 8.5 0.0 46.0Canada 7 10 13.6 28.0 43.0Japan 11 11 12.7 8.6 52.8
AGOA countriesBenin 35 48 29.0 35.8 68.5Botswana 37 42 0.0 90.0 53.3Burkina Faso
69 66 20.0 33.6 51.1
Cameroon 38 51 16.2 32.5 46.2Chad 87 111 21.2 35.8 68.2Ethiopia 45 52 0.0 40.1 32.8Ghana 21 42 12.5 177.7 32.3Kenya 25 45 4.3 47.3 74.2Lesotho 46 51 0.0 44.3 25.6Madagascar 48 48 18.0 30.3 43.2Malawi 44 60 1.0 84.3 32.6Mali 66 61 26.9 31.4 50.0Mauritius 16 16 6.0 34.7 24.8Mozambique 39 38 4.0 142.9 39.2Namibia 32 25 0.1 24.3 25.6Niger .. 89 17.4 31.4 46.0Nigeria 25 45 8.5 49.8 31.4Rwanda 60 95 5.0 26.0 41.1Senegal 22 26 21.4 37.9 47.7Sierra Leone 29 33 10.0 328.7 277.0South Africa 31 34 2.4 24.0 38.3Swaziland 9 35 2.8 53.2 39.5Tanzania 24 39 16.0 32.0 45.0Uganda 42 67 10.0 13.0 32.2Zambia 60 62 10.6 177.7 22.2
Major competitors to AGOA countriesChina 18 22 44.0 91.0 77.1Costa Rica 36 42 26.0 35.3 83.0Honduras 28 39 9.5 43.3 51.4India 27 41 16.8 55.9 81.1Mexico 17 26 23.9 74.3 37.1Morocco 18 30 17.7 85.1 52.7Tunisia 18 29 21.8 17.3 58.8Turkey 20 25 21.6 94.7 46.3Vietnam 35 36 17.0 86.7 41.6
Source: World Bank (2006a).

Annex 36: Seed cotton yields in Southern and Eastern Africa 1994-2005
kg/ha1994 1995 1996 1997 1998 1999 2000 2001 2002 2003 2004 2005
World average 1,643 1,594 1,608 1,601 1,554 1,627 1,662 1,730 1,724 1,754 1,985 1,939Angola 1,091 1,091 1,091 1,091 1,091 1,000 1,000 1,000 1,000 1,000 1,000 1,000Benin 1,394 1,330 1,199 1,006 965 1,014 1,064 1,102 1,174 1,120 1,104 1,104Botswana 2,727 2,727 2,727 2,500 2,556 2,526 2,727 2,727 2,727 2,727 2,727 2,727Burundi 1,161 764 640 689 946 866 717 960 831 811 811 811Cameroon 1,083 1,035 1,169 1,120 1,129 1,088 1,027 1,042 948 1,105 1,387 791Cape Verde .. .. .. .. .. .. .. .. .. .. .. ..Chad 770 759 789 682 545 587 643 630 714 549 777 777Comoros .. .. .. .. .. .. .. .. .. .. .. ..Congo .. .. .. .. .. .. .. .. .. .. .. ..Côte d’Ivoire 1,178 1,059 881 1,075 1,367 1,290 1,210 1,025 1,380 1,200 1,454 1,429D.R. of Congo 404 403 403 407 385 404 400 429 429 429 429 429Djibouti .. .. .. .. .. .. .. .. .. .. .. ..Egypt 2,243 2,144 2,481 2,548 1,894 2,277 2,543 2,710 2,579 2,427 2,615 2,603Eritrea .. .. .. .. .. .. .. .. .. .. .. ..Ethiopia 1,049 1,083 1,083 1,083 1,083 1,058 1,058 1,034 1,034 1,012 1,012 1,012Gabon .. .. .. .. .. .. .. .. .. .. .. ..Gambia 587 424 475 443 304 729 510 400 356 385 385 385Ghana 841 931 853 821 799 847 710 500 954 781 680 680Guinea 1,180 1,180 1,155 1,288 1,288 1,250 1,251 1,222 1,143 1,143 1,143 1,143Guinea-Bissau 1,294 1,214 1,216 1,214 1,214 1,212 1,212 1,286 1,286 1,286 1,286 1,286Kenya 364 488 1,002 584 602 600 500 400 400 400 400 400Lesotho .. .. .. .. .. .. .. .. .. .. .. ..Madagascar 1,274 1,069 1,108 1,724 1,838 1,648 961 936 974 938 1,033 1,033Malawi 451 897 1,044 638 807 990 905 782 855 925 845 845Mali 1,087 1,207 1,075 1,051 1,028 953 1,066 1,074 979 1,131 1,044 1,090Mauritania .. .. .. .. .. .. .. .. .. .. .. ..Mauritius .. .. .. .. .. .. .. .. .. .. .. ..Mozambique 658 599 678 439 460 479 473 478 435 435 435 435Namibia 1,000 1,091 1,171 1,176 1,280 1,439 1,362 1,457 1,500 1,457 1,457 1,457Niger 1,179 1,167 1,152 1,143 724 2,000 5,000 3,333 3,333 3,333 3,333 3,333Nigeria 530 582 666 808 725 741 742 742 660 659 660 660Rwanda 0 0 0 0 0 0 0 0 0 0 0 0Sao Tome & Principe .. .. .. .. .. .. .. .. .. .. .. ..
Senegal 844 896 763 748 241 684 917 1,087 1,106 1,191 911 1,177Seychelles .. .. .. .. .. .. .. .. .. .. .. ..Sierra Leone .. .. .. .. .. .. .. .. .. .. .. ..South Africa 1,020 1,066 1,404 861 813 771 622 767 821 758 758 758Sudan 1,207 1,408 1,241 1,025 1,340 1,231 858 1,367 1,197 1,519 1,312 1,274Swaziland 877 880 1,333 790 730 655 442 526 500 464 464 464Tanzania 381 682 576 470 464 538 579 579 485 525 846 786Uganda 329 329 450 285 258 264 268 240 268 268 268 268Zambia 653 471 560 1,430 1,324 1,326 1,129 1,127 1,127 1,127 1,127 1,127Zimbabwe 785 459 916 1,019 924 917 884 845 494 570 736 736
Source: FAO (2006).

Annex 37: Cotton lint exports from Southern and Eastern Africa 1994-2004
1000s Tons (% of world exports)1994 1995 1996 1997 1998 1999 2000 2001 2002 2003 2004
World 6,156 5,816 5,559 5,500 5,730 4,956 5,784 5,937 6,146 6,884 6,850Angola 0 0 0 0 0 0 0 0 0 0 0Benin 74 99 89 112 128 163 134 108 146 163 108Botswana 1 1 1 1 1 2 0 0 0 0 0Burundi 2 1 0 0 0 0 0 0 0 0 0Cameroon 59 54 66 51 61 73 73 89 100 92 98Cape Verde 0 0 0 0 0 0 0 0 0 0 0Chad 32 62 50 72 68 60 63 47 47 49 46Comoros 0 0 0 0 0 0 0 0 0 0 0Congo 0 0 0 0 0 0 0 0 0 0 0Côte d’Ivoire 100 88 75 94 122 131 161 113 138 144 113D.R. of Congo 1 1 1 0 0 0 0 0 0 0 0Djibouti 0 0 0 0 0 0 0 0 0 0 0Egypt 113 67 23 42 66 112 63 82 161 197 184Eritrea .. .. .. .. .. .. .. .. .. .. ..Ethiopia 0 8 1 0 0 0 4 4 2 0 7Gabon 0 0 0 0 0 0 0 0 0 0 0Gambia 1 1 1 0 0 0 0 0 0 0 1Ghana 7 1 0 0 1 7 10 3 3 3 7Guinea 6 4 4 2 2 9 4 1 0 3 1Guinea-Bissau 1 1 1 1 1 1 1 3 4 1 0Kenya 7 1 0 0 0 0 0 0 1 0 0Lesotho 0 0 0 0 0 0 0 0 0 0 0Madagascar 2 3 4 6 6 6 4 3 0 2 2Malawi 0 0 0 9 5 3 7 5 4 5 13Mali 90 105 130 140 160 138 164 201 185 256 207Mauritania 0 0 0 0 0 0 0 0 0 0 0Mauritius 0 0 0 0 0 0 0 0 0 0 1Mozambique 16 13 16 16 17 10 10 15 20 25 20Namibia 0 0 0 0 0 0 0 0 1 0 7Niger 0 5 2 2 1 2 2 1 1 0 1Nigeria 3 2 22 32 9 7 0 20 11 26 14Rwanda 0 0 0 0 0 0 0 0 0 0 0Sao Tome & Principe .. .. .. .. .. .. .. .. .. .. ..
Senegal 15 9 11 15 14 5 7 7 15 24 19Seychelles 0 0 0 0 0 0 0 0 0 0 0Sierra Leone .. .. .. .. .. .. .. .. .. .. ..South Africa 0 0 0 4 7 5 6 5 1 6 9Sudan 78 96 104 75 63 30 43 40 71 95 49Swaziland 4 3 4 2 0 0 0 1 0 1 1Tanzania 60 71 82 69 23 30 30 30 31 40 47Uganda 4 6 10 10 5 14 14 3 5 2 3Zambia 1 1 5 17 12 25 3 5 13 28 100Zimbabwe 47 27 44 91 78 80 140 69 83 70 173
All AGOA 484(7.9%)
539(9.3%)
575(10.3%)
655(11.9%)
643(11.2%)
691(13.9%)
697(12.1%)
664(11.2%)
728(11.9%)
870(12.6%)
825(12.0%)
AGOA with textiles provisions
443(7.2%)
470(8.1%)
518(9.3%)
580(10.6%)
572(10.0%)
621(12.5%)
629(10.9%)
613(10.3%)
677(11.0%)
817(11.9%)
777(11.3%)
Lesser developed AGOA with textiles provisions
443(7.2%)
470(8.1%)
518(9.3%)
576(10.5%)
565(9.9%)
616(12.4%)
623(10.8%)
608(10.2%)
676(11.0%)
811(11.8%)
767(11.2%)
SADC AGOA 85(1.4%)
93(1.6%)
113(2.0%)
124(2.3%)
71(1.2%)
81(1.6%)
60(1.0%)
64(1.1%)
70(1.1%)
107(1.6%)
200(2.9%)
COMESA AGOA
19(0.3%)
23(0.4%)
25(0.5%)
44(0.8%)
28(0.5%)
48(1.0%)
32(0.6%)
21(0.4%)
25(0.4%)
38(0.6%)
127(1.9%)
SADC 132(2.1%)
120(2.1%)
157(2.8%)
215(3.9%)
149(2.6%)
161(3.3%)
200(3.5%)
133(2.2%)
153(2.5%)
177(2.6%)
373(5.5%)
COMESA 259(4.2%)
214(3.7%)
196(3.5%)
252(4.6%)
235(4.1%)
270(5.5%)
278(4.8%)
212(3.6%)
340(5.5%)
400(5.8%)
533(7.8%)
Source: FAO (2006).

Annex 38: Cotton lint imports for Southern and Eastern Africa 1994-2004
1000s Tons (% of world imports)1994 1995 1996 1997 1998 1999 2000 2001 2002 2003 2004
World 5,945 5,914 5,952 6,063 5,511 5,211 5,949 5,913 5,634 6,179 7,186Angola 0 0 0 0 0 0 0 0 0 0 0Benin 0 0 0 0 0 0 0 0 0 0 0Botswana 1 2 1 1 2 1 0 0 0 0 0Burundi 0 0 0 0 0 0 0 0 0 0 0Cameroon 0 0 0 0 0 0 0 0 0 0 0Cape Verde 0 0 0 0 0 0 0 0 0 0 0Chad 0 0 0 0 0 0 0 0 0 0 0Comoros 0 0 0 0 0 0 0 0 0 0 0Congo 0 0 0 0 0 0 0 0 0 0 0Côte d’Ivoire 0 3 2 0 0 0 0 0 2 1 0D.R. of Congo 6 6 6 6 7 6 6 2 1 0 0Djibouti 0 0 0 0 0 0 0 0 0 0 0Egypt 5 31 36 7 1 5 8 23 2 8 82Eritrea .. .. .. .. .. .. .. .. .. .. ..Ethiopia 0 0 0 0 0 0 0 0 0 0 0Gabon 0 0 0 0 0 0 0 0 0 0 0Gambia 0 0 0 0 0 0 0 0 0 0 0Ghana 1 0 1 0 0 0 0 0 0 0 158Guinea 0 0 0 0 0 0 0 0 0 0 0Guinea-Bissau 0 0 0 0 0 0 0 1 0 0 0Kenya 5 2 2 2 2 1 2 0 0 2 3Lesotho .. .. .. .. .. .. .. .. .. .. ..Madagascar 0 0 0 0 0 0 0 0 0 0 0Malawi 0 0 0 0 0 0 0 0 0 0 1Mali 0 0 0 0 0 0 0 29 0 1 1Mauritania 0 0 0 0 0 0 0 0 0 0 0Mauritius 7 10 12 12 14 10 14 11 9 12 19Mozambique 0 0 0 0 0 0 0 0 0 0 0Namibia 0 0 0 0 0 0 0 0 9 0 0Niger 0 8 0 0 0 0 1 1 0 0 0Nigeria 25 13 13 13 13 13 9 2 37 2 2Rwanda 0 0 0 1 0 0 0 0 0 0 0Sao Tome & Principe .. .. .. .. .. .. .. .. .. .. ..
Senegal 0 0 0 0 0 0 0 0 0 0 0Seychelles 0 0 0 0 0 0 0 0 0 0 0Sierra Leone .. .. .. .. .. .. .. .. .. .. ..South Africa 44 44 38 42 48 27 27 37 56 72 90Sudan 0 0 0 0 0 0 0 0 0 0 0Swaziland 0 0 0 4 7 7 3 6 6 6 0Tanzania 0 0 0 0 0 0 0 0 0 0 0Uganda 0 0 0 0 0 0 0 0 0 0 0Zambia 0 4 1 0 0 2 3 3 2 2 3Zimbabwe 0 3 9 4 2 1 0 0 0 0 11
All AGOA 89(1.5%)
92(1.6%)
76(1.3%)
81(1.3%)
93(1.7%)
67(1.3%)
65(1.1%)
92(1.6%)
122(2.2%)
98(1.6%)
277(3.9%)
AGOA with textiles provisions
83(1.4%)
86(1.5%)
70(1.2%)
75(1.2%)
86(1.6%)
61(1.2%)
59(1.0%)
89(1.5%)
121(2.2%)
98(1.6%)
277(3.9%)
Lesser developed AGOA with textiles provisions
32(0.5%)
32(0.5%)
20(0.3%)
21(0.4%)
24(0.4%)
24(0.5%)
18(0.3%)
41(0.7%)
56(1.0%)
14(0.2%)
168(2.3%)
SADC AGOA 58(1.0%)
66(1.1%)
58(1.0%)
65(1.1%)
78(1.4%)
53(1.0%)
53(0.9%)
59(1.0%)
83(1.5%)
92(1.5%)
113(1.6%)
COMESA AGOA
18(0.3%)
22(0.4%)
21(0.4%)
25(0.4%)
30(0.5%)
26(0.5%)
28(0.5%)
22(0.4%)
18(0.3%)
22(0.4%)
26(0.4%)
SADC 58(1.0%)
69(1.2%)
67(1.1%)
69(1.1%)
80(1.5%)
54(1.0%)
53(0.9%)
59(1.0%)
83(1.5%)
92(1.5%)
124(1.7%)
COMESA 23(0.4%)
56(1.0%)
66(1.1%)
36(0.6%)
33(0.6%)
32(0.6%)
36(0.6%)
45(0.8%)
20(0.4%)
30(0.5%)
119(1.7%)
Source: FAO (2006).


![Case study in Korea of manufacturing SRF for polyurethanes ...for e-waste [10, 11]. When a responsibility of manufactures and importers for collecting and recycling met their quota,](https://static.fdocuments.net/doc/165x107/5e93a4df24d46006cc3405e2/case-study-in-korea-of-manufacturing-srf-for-polyurethanes-for-e-waste-10.jpg)