The Effects of Martensite Content on the Mechanical ...
13
The Effects of Martensite Content on the Mechanical Properties of Quenched and Tempered 0.2%C-Ni-Cr-Mo Steels John M. Tartaglia (Submitted February 13, 2009; in revised form June 2, 2009) Three martensite contents (approximately 35, 50, and 100%) were obtained in a SAE8822 steel by altering the quenching media and section size. Another variation in martensite content (approximately 80 versus 97%) was achieved by quenching a SAE8622 steel in the same section size. The impact toughness and fatigue properties were determined after tempering to various levels of monotonic strength. Toughness and strength-toughness combinations improved with increased as-quenched martensite contents at all levels of as-tempered ultimate tensile strength (UTS). Even at higher levels of yield strength (YS), increased mar- tensite contents produced higher impact energies and lower fracture appearance transition temperatures. The cyclic YS was independent of martensite content (at the same level of UTS), even though the monotonic YS increased with martensite content. When fatigue test results were compared at a tensile strength of 1240 MPa (180 ksi), actual and predicted fatigue lives in the high cycle regime increased with martensite content, but low cycle fatigue resistance was relatively unaffected. Fatigue strength and UTS were directly related, and all the quenched and tempered steels exhibited cyclic softening. Keywords carbon/alloy steels, heat treating, material selection, mechanical testing, optical microscopy 1. Introduction Quenched and tempered (Q&T) steels are widely used in structural applications. Depending on the alloy content of the steels and the section size of the part being quenched, various microstructures will be obtained in the as-quenched condition. Higher alloy contents and decreasing section sizes (increasing cooling rates) promote the formation of martensite versus bainite, pearlite, and ferrite, which form at higher temperatures. After quenching, hardened steels are usually tempered to improve ductility and toughness, with a concomitant loss in strength. Q&T product specifications commonly omit microstructural requirements in the as-quenched condition. Usually the spec- ifications contain only the yield strength (YS), tensile strength, or hardness in the Q&T condition. However, the as-quenched microstructure is important because it can affect other proper- ties, such as toughness and fatigue resistance, in the as-tempered condition. Numerous component failures have resulted from steel heat treatments that effect acceptable tensile properties, but toughness and fatigue resistance are too low due to the presence of nonmartensitic constituents in the as-quenched condition. When hardened steels contain other constituents besides martensite, they are often called ‘‘slack quenched.’’ The toughness of tempered steels is strongly affected by the microstructure in the hardened state. For example, the Charpy V-Notch (CVN) impact toughness of a 0.7%Cr-0.32%Mo steel was compared at four different carbon contents and four different microstructures in the as-hardened condition (Ref 1). After tempering to the same hardness, the ductile-to-brittle impact transition temperature for any carbon level was 25-50 ŶC (45-90 ŶF) lower for fully martensitic microstructures than for microstructures containing only 50% martensite. This author and others have shown that SAE 4340 steel has better impact toughness when it is austempered (isothermally trans- formed) to 100% lower bainite than when it is quenched to 100% martensite and tempered to the same strength level (Ref 1, 2). However, steels with mixed microstructures resulting from incomplete bainitic treatments and partial transformation to martensite possess much lower toughness (higher transition temperatures) than steels with microstructures containing either 100% lower bainite or 100% tempered martensite (Ref 1). Microstructure also influences the high cycle fatigue resistance of medium carbon steels. Martensitic steels give better high cycle fatigue resistance than ferrite-pearlite steels whereas microstructures resulting in good long-life fatigue resistance will generally give lower thresholds for crack growth (Ref 3). Borik et al. (Ref 4) evaluated the fatigue strength of five medium carbon alloy steels in the 10 5 to 10 8 cycle range. The steels were continuously cooled (rather than isothermally transformed) to various as-quenched martensite contents and tempered to 36 Rockwell C hardness (HRC). These investiga- tors found that the fatigue limits decreased as the martensite content decreased from 100 to 85%; however, further decreases in the martensite content did not lower fatigue resistance more (Ref 4). John M. Tartaglia, Stork Climax Research Services, 51229 Century Court, Wixom, MI 48393. Contact e-mail: [email protected]. JMEPEG (2010) 19:572–584 ȑASM International DOI: 10.1007/s11665-009-9503-x 1059-9495/$19.00 572—Volume 19(4) June 2010 Journal of Materials Engineering and Performance
Transcript of The Effects of Martensite Content on the Mechanical ...
The Effects of Martensite Content on the MechanicalProperties of Quenched and Tempered
0.2%C-Ni-Cr-Mo SteelsJohn M. Tartaglia
(Submitted February 13, 2009; in revised form June 2, 2009)
Three martensite contents (approximately 35, 50, and 100%) were obtained in a SAE8822 steel by alteringthe quenching media and section size. Another variation in martensite content (approximately 80 versus97%) was achieved by quenching a SAE8622 steel in the same section size. The impact toughness andfatigue properties were determined after tempering to various levels of monotonic strength. Toughness andstrength-toughness combinations improved with increased as-quenched martensite contents at all levels ofas-tempered ultimate tensile strength (UTS). Even at higher levels of yield strength (YS), increased mar-tensite contents produced higher impact energies and lower fracture appearance transition temperatures.The cyclic YS was independent of martensite content (at the same level of UTS), even though the monotonicYS increased with martensite content. When fatigue test results were compared at a tensile strength of1240 MPa (180 ksi), actual and predicted fatigue lives in the high cycle regime increased with martensitecontent, but low cycle fatigue resistance was relatively unaffected. Fatigue strength and UTS were directlyrelated, and all the quenched and tempered steels exhibited cyclic softening.
Keywords carbon/alloy steels, heat treating, material selection,mechanical testing, optical microscopy
1. Introduction
Quenched and tempered (Q&T) steels are widely used instructural applications. Depending on the alloy content of thesteels and the section size of the part being quenched, variousmicrostructures will be obtained in the as-quenched condition.Higher alloy contents and decreasing section sizes (increasingcooling rates) promote the formation of martensite versusbainite, pearlite, and ferrite, which form at higher temperatures.After quenching, hardened steels are usually tempered toimprove ductility and toughness, with a concomitant loss instrength.
Q&T product specifications commonly omit microstructuralrequirements in the as-quenched condition. Usually the spec-ifications contain only the yield strength (YS), tensile strength,or hardness in the Q&T condition. However, the as-quenchedmicrostructure is important because it can affect other proper-ties, such as toughness and fatigue resistance, in theas-tempered condition. Numerous component failures haveresulted from steel heat treatments that effect acceptable tensileproperties, but toughness and fatigue resistance are too lowdue to the presence of nonmartensitic constituents in theas-quenched condition. When hardened steels contain other
constituents besides martensite, they are often called ‘‘slackquenched.’’
The toughness of tempered steels is strongly affected by themicrostructure in the hardened state. For example, the CharpyV-Notch (CVN) impact toughness of a 0.7%Cr-0.32%Mo steelwas compared at four different carbon contents and fourdifferent microstructures in the as-hardened condition (Ref 1).After tempering to the same hardness, the ductile-to-brittleimpact transition temperature for any carbon level was25-50 �C (45-90 �F) lower for fully martensitic microstructuresthan for microstructures containing only 50% martensite. Thisauthor and others have shown that SAE 4340 steel has betterimpact toughness when it is austempered (isothermally trans-formed) to 100% lower bainite than when it is quenched to100% martensite and tempered to the same strength level(Ref 1, 2). However, steels with mixed microstructures resultingfrom incomplete bainitic treatments and partial transformation tomartensite possess much lower toughness (higher transitiontemperatures) than steels with microstructures containing either100% lower bainite or 100% tempered martensite (Ref 1).
Microstructure also influences the high cycle fatigueresistance of medium carbon steels. Martensitic steels givebetter high cycle fatigue resistance than ferrite-pearlite steelswhereas microstructures resulting in good long-life fatigueresistance will generally give lower thresholds for crack growth(Ref 3). Borik et al. (Ref 4) evaluated the fatigue strength offive medium carbon alloy steels in the 105 to 108 cycle range.The steels were continuously cooled (rather than isothermallytransformed) to various as-quenched martensite contents andtempered to 36 Rockwell C hardness (HRC). These investiga-tors found that the fatigue limits decreased as the martensitecontent decreased from 100 to 85%; however, further decreasesin the martensite content did not lower fatigue resistance more(Ref 4).
John M. Tartaglia, Stork Climax Research Services, 51229 CenturyCourt, Wixom, MI 48393. Contact e-mail: [email protected].
JMEPEG (2010) 19:572–584 �ASM InternationalDOI: 10.1007/s11665-009-9503-x 1059-9495/$19.00
572—Volume 19(4) June 2010 Journal of Materials Engineering and Performance
Landgraf (Ref 5) reviewed the influence of microstructureon the fatigue properties of ferrous alloys. As a class ofmaterials, Q&T martensitic steels exhibit cyclic softening(except for ausformed and quenched steels). Maximum soften-ing occurs in quenched and tempered SAE1045 steel at Brinellhardness values between 225 and 600, and cyclic stability(equivalent monotonic and cyclic offset yield strengths) occursat both hardness extremes (Ref 5). The mechanisms influencingsuch complex fatigue behavior have been discussed both byLandgraf (Ref 5) and by Stoloff and Duquette (Ref 6).
Although the influence of as-quenched microstructure ontoughness and high cycle fatigue resistance has been evaluatedextensively, as-quenched microstructural effects on low cyclefatigue properties have not been investigated. In this study,SAE8622 and SAE8822 steels were quenched to producevarious martensite contents and tempered to various ultimatetensile strengths. The effects of martensite content on fatigueresistance and toughness were then evaluated.
2. Experimental Procedures
2.1 Materials
One 57 kg (125 lb) laboratory heat was cast for each ofthree compositions. Each heat was induction-melted in air,aluminum-killed, and poured into two 130 mm (5.25 in.)diameter by 220 mm (8.63 in.) long molds. Table 1 shows thecompositions for the three heats; the compositions weredetermined from button specimens on an integral part of oneof the ingots per heat. Steel 2 meets the midrange of thechemical requirements for SAE8622 steel, which contains amaximum of 0.25%Mo. Steels 1A and 1B meet the require-ments for SAE8822 steel, which is a high molybdenummodification of SAE8622 steel.
The ingots were forged into cylindrical bars in thetemperature range of 1065-1205 �C (1950-2200 �F). One32 mm (1.25 in.) diameter bar and a number of bars withdiameters between 27 and 29 mm (1.06 and 1.13 in.) wereforged for each steel. A number of 19 mm (0.75 in.) bars ofSteel 1A were forged and rolled in the same temperature range.
2.2 Heat Treatment
All the bar stock was annealed by austenitizing at 925 �C(1700 �F) and furnace cooling. The 32 mm (1.25 in.) diameterbars were machined into standard Jominy end-quench speci-mens. The 27-29 mm (1.06-1.13 in.) and 19 mm (0.75 in.)diameter bars were machined to diameters of 25 and 17 mm(1.00 and 0.65 in.), respectively, and cut to various lengths.
These latter bars were austenitized at 845 �C (1550 �F) for 1 hbefore quenching in either water or oil. Some bars weretempered for 2 h at temperatures between 205 and 650 �C (400and 1200 �F), and these bars were air-cooled after tempering.Mechanical test blanks were machined from these quenchedand Q&T bars.
Bars of Steel 1Awere subjected to quenching treatments thatproduced three levels of martensite. The different martensitelevels were obtained by varying the section size [17 mm(0.65 in.) versus 25 mm (1.0 in.) diameter] and quenchingmedia (water versus oil). The hardened bars were thentempered to ultimate tensile strengths between 869 and1138 MPa (126 and 165 ksi). This series of specimensprovided a comparison of different microstructures whilemaintaining constant composition.
Bars of Steels 1B and 2 were water quenched in the 25 mm(1.0 in) section size and tempered (for 2 h) to a ultimate tensilestrength (UTS) of 1240 MPa (180 ksi). This series of specimensprovided a comparison of different microstructures obtained byalloying effects (0.20 versus 0.37%Mo) on hardenability.
2.3 Hardness and Metallography
Rockwell hardness (HRC) was determined as the average ofthree readings taken near the centers of transverse sections ofthe heat-treated bars in accordance with ASTM standard E18.The conversions shown in ASTM standard A370 were used toselect the tempering conditions that would result in the desiredUTS value. Rockwell C hardness measurements were also usedto ensure uniform quenching in the longitudinal bar direction.
An approximate martensite content was assigned to eachalloy/quench condition based on as-quenched hardness. Mea-suring martensite contents using quantitative metallographictechniques is extremely difficult and time consuming, butquantitative microstructural analysis does not guarantee accu-rate results. Admittedly, martensite contents assigned byhardness are decidedly approximate. The hardness methodused in this study for assigning martensite contents is deemedadequate, because quantitative correlations of various mechan-ical properties with martensite content were not attempted.
A transverse metallographic specimen was prepared forselected heat treatment conditions. Each piece was mountedand mechanically polished. The metallographic specimens wereetched in 4 g picric acid and 1 mL nitric acid in 95 mL ethanol(4PIN) and photographed using an optical metallograph.
The retained austenite was measured by x-ray diffraction,and a Vickers hardness (HV10) gradient was obtained with a10-kg load in accordance with ASTM standard E92 ontransverse sections from the undeformed shoulders of somefractured tensile specimens. At least two hardness readingswere obtained at each radial position.
Table 1 Compositions of test steels, wt.%
Steel Heat no. C Mn Si Ni Cr Mo P S N
Al
Total Acid soluble
1A 6530 0.23 0.81 0.22 0.51 0.51 0.36 0.017 0.018 0.012 0.036 ND1B 6429 0.21 0.82 0.24 0.55 0.50 0.38 0.013 0.017 0.013 0.094 0.0752 6428 0.21 0.82 0.27 0.54 0.50 0.20 0.017 0.017 0.0152 0.091 0.071
ND, not determined
Journal of Materials Engineering and Performance Volume 19(4) June 2010—573
The prior austenite grain sizes of all the steels weredetermined from small pieces austenitized at 925 �C (1700 �F)for 1 h and water quenched. After the quenched pieces weretempered at 230 �C (450 �F) for 3 days, transverse sectionswere cut and metallographically prepared. After etching withsaturated aqueous picric acid reagents, the prior austenite grainsizes were determined by the linear intercept method inaccordance with ASTM standard E112.
2.4 Jominy End-Quench Tests
Jominy end-quench tests were performed for each steel inaccordance with ASTM standard A255. The Jominy specimenswere austenitized at 925 �C (1700 �F) for 30 min prior to endquenching. Two bars were tested for Steel 1A and one wastested for each of Steels 1B and 2. After quenching, parallelflats were surface ground on opposite sides of each bar, andRockwell hardness (HRC) was determined as a function ofdistance from the quenched end.
Values for the ideal critical diameter (DI), the diameter of acylindrical steel bar which will form 50% martensite at itscenter when subjected to an ideal quench, were determinedexperimentally from each Jominy curve using the hardnessdrop method (Ref 7). DI values for each steel were alsocalculated from known alloying contributions (Ref 7, 8).
2.5 Tensile Tests
Tensile specimens were prepared from heat-treated bars andtested at room temperature on a screw-driven tensile machinein accordance with ASTM standard E8. The specimens hadgauge sections that were 6.3 mm (0.25 in.) in diameter and25 mm (1 in.) in length. Strain rates of 18 and 300%/h wereused in the elastic and plastic ranges, respectively. At least twospecimens were tested for each alloy/heat treatment combina-tion. The quench and temper treatments, which produced thedesired ultimate tensile strengths, were selected for furthermechanical property evaluation.
2.6 Charpy V-Notch Impact Tests
Standard CVN impact specimens were prepared for eachalloy/heat treatment combination that achieved the desiredstrength levels. The impact energy and per cent shear fracturewere determined in accordance with ASTM standard E23, as afunction of test temperature.
2.7 Fatigue Tests
Fatigue specimens were prepared for a selected number ofthe alloy/heat treatment combinations which resulted in thedesired ultimate strengths. The cylindrical specimens possessedgauge sections that were 19 mm (0.75 in.) in length and6.4 mm (0.25 in.) in diameter. The specimens were preparedsuch that no heating of the gauge sections occurred; the gaugesections were polished by machine to a �0.05 lm (�2 l-in.)finish.
Fully reversed fatigue tests were performed at roomtemperature on a servohydraulic fatigue machine in accordancewith ASTM standard E606. A longitudinal extensometer wasmounted on each specimen. The tests were performed in straincontrol at constant strain rates of 0.005/s for Steel 1A and 0.01/s for Steels 1B and 2. Total strain and load were recorded
throughout each test, and load-strain hysteresis loops weregenerated for the first few cycles. The saturation stress (Dr/2)and actual total strain (DeT/2) amplitudes were measured athalf-life, i.e., one-half the number of cycles to failure (Nf)defined as specimen fracture. The elastic modulus (E) of eachspecimen was obtained from the first quarter cycle (monotonicstress-strain curve). For applied total strain amplitudes less than±0.3%, fatigue tests were performed in strain control untilsaturation was reached, i.e., until the load amplitude remainedconstant. These low cyclic strain tests were then continued inload control using a 30-Hz sinusoidal waveform until failurewas reached, thereby minimizing machine time.
The plastic strain amplitude (Dep/2) and fatigue liferegression constants (rf¢, b, ef¢, and c) were evaluated usingthe procedures outlined in ASTM standard E606 and theAppendix of this paper. For Steels 1B and 2, the cyclic strengthcoefficient (K¢) and cyclic strain hardening exponent (n¢)were calculated (see Appendix) using the saturation stress andplastic strain amplitudes obtained from the strain-life tests.However, for Steel 1A, these parameters were obtained usingincremental step tests (ISTs) (Ref 9).
The ISTs were performed in fully reversed strain controlusing a constant strain rate of 0.01/s. The specimens werecycled once at ±1.5, ±1.4, ±1.3,…, ±0.2, and ±0.1 totalstrain amplitudes resulting in fifteen ±0.1% strain incrementsfor each ‘‘unloading’’ IST block. The specimens were thenreloaded starting with ±0.1% total strain amplitude andcontinuing in a similar progression to ±1.5% total strainamplitude. The entire process was repeated until the cyclicstress-strain curve (on unloading) was stabilized, i.e., when nochanges in the load-strain values between the last twounloading IST blocks were observed. Load-time plots, strain-time plots, and load-strain hysteresis loops were generatedthroughout each test. The last unloading IST block wasanalyzed for the cyclic stress-strain curve parameters (K¢ andn¢) at saturation.
The monotonic strength coefficient (K) and strain hardeningexponent (n) were also obtained for all the fatigue testconditions. These quantities were calculated (see Appendix)using the monotonic true stress and true plastic strain valuesobtained from the first loading to ±1.5% strain in either astrain-life or IST. These K and n determination procedures areessentially equivalent to those contained in ASTM standardE646 for tensile tests.
3. Results
3.1 End-Quench Hardenability
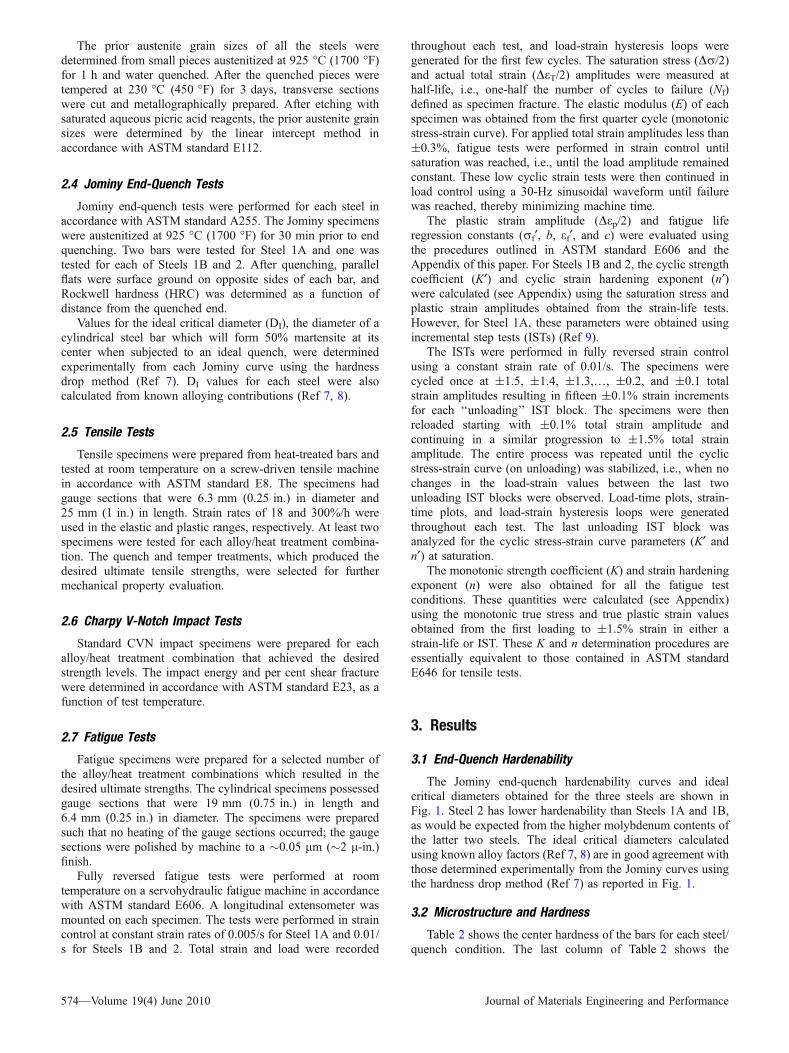
The Jominy end-quench hardenability curves and idealcritical diameters obtained for the three steels are shown inFig. 1. Steel 2 has lower hardenability than Steels 1A and 1B,as would be expected from the higher molybdenum contents ofthe latter two steels. The ideal critical diameters calculatedusing known alloy factors (Ref 7, 8) are in good agreement withthose determined experimentally from the Jominy curves usingthe hardness drop method (Ref 7) as reported in Fig. 1.
3.2 Microstructure and Hardness
Table 2 shows the center hardness of the bars for each steel/quench condition. The last column of Table 2 shows the
574—Volume 19(4) June 2010 Journal of Materials Engineering and Performance
martensite contents obtained at the centers of the quenchedpieces. These martensite contents were assigned by interpola-tion and extrapolation of the hardness data of Hodge andOrehoski (Ref 10). Steel 1A was fully hardened in the water-quenched condition. Its hardness is in excellent agreement withthe hardness obtained by Hodge and Orehoski (Ref 10) at adistance of 1.6 mm (1/16 in.) from the quenched end of Jominybars, as well as the fully martensitic hardness values obtainedby several other investigators as compiled by Krauss (Ref 11).
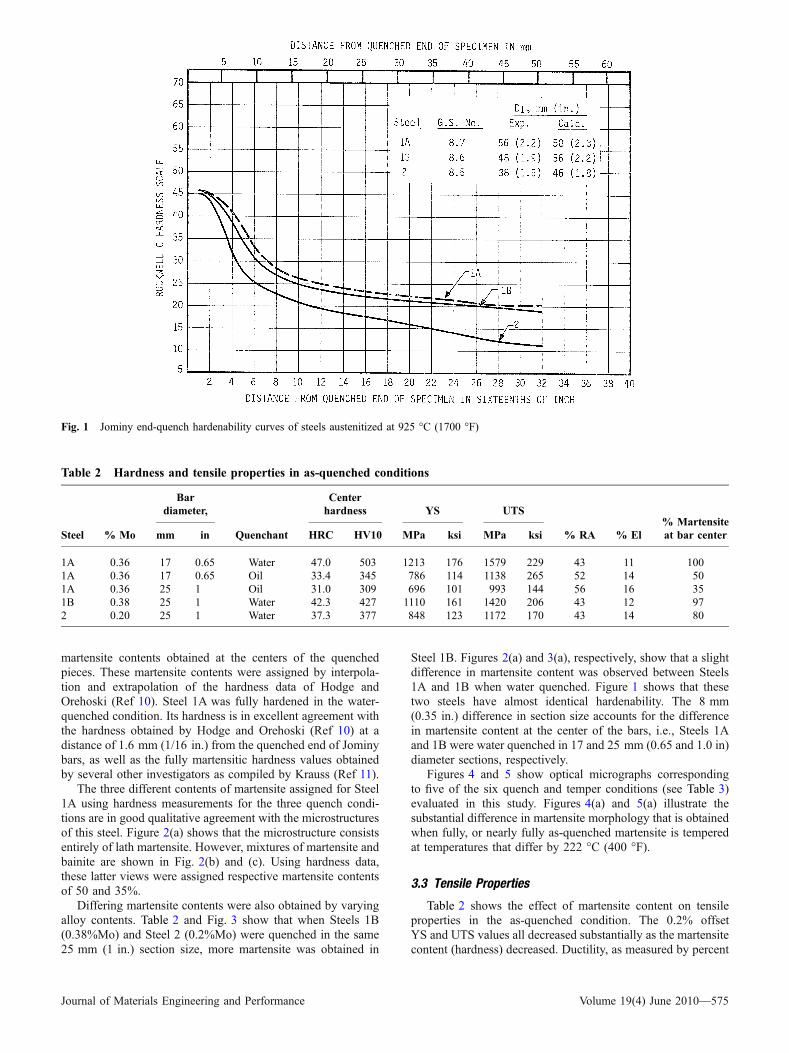
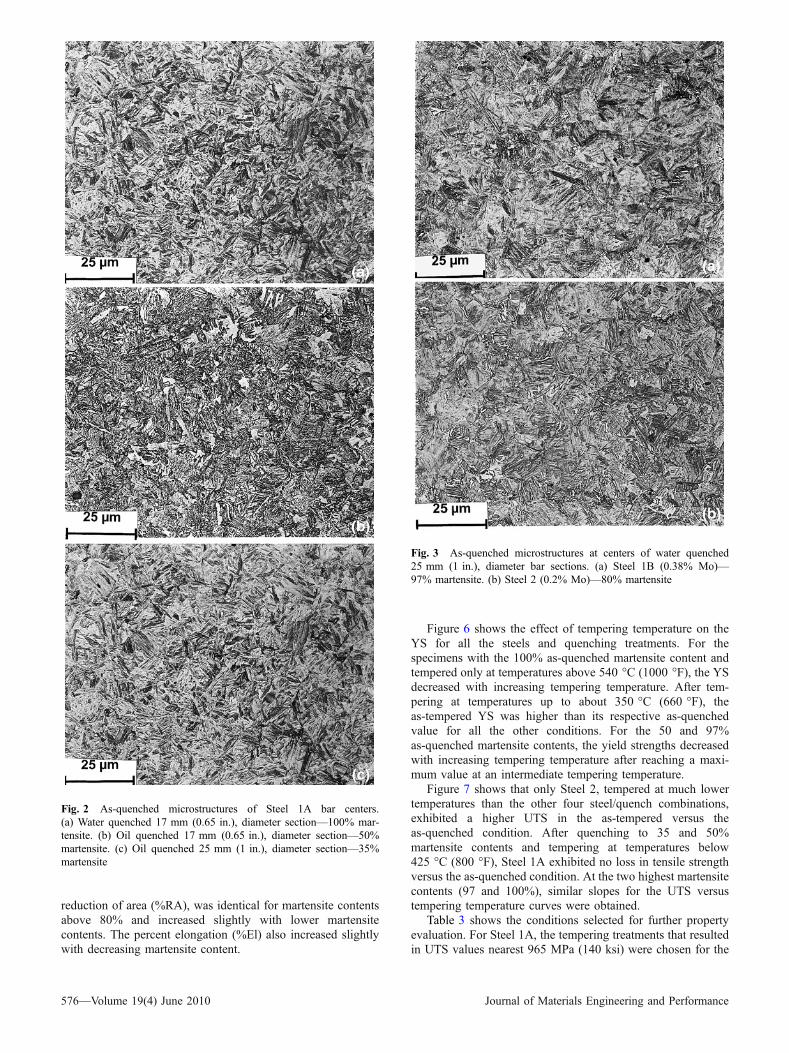
The three different contents of martensite assigned for Steel1A using hardness measurements for the three quench condi-tions are in good qualitative agreement with the microstructuresof this steel. Figure 2(a) shows that the microstructure consistsentirely of lath martensite. However, mixtures of martensite andbainite are shown in Fig. 2(b) and (c). Using hardness data,these latter views were assigned respective martensite contentsof 50 and 35%.
Differing martensite contents were also obtained by varyingalloy contents. Table 2 and Fig. 3 show that when Steels 1B(0.38%Mo) and Steel 2 (0.2%Mo) were quenched in the same25 mm (1 in.) section size, more martensite was obtained in
Steel 1B. Figures 2(a) and 3(a), respectively, show that a slightdifference in martensite content was observed between Steels1A and 1B when water quenched. Figure 1 shows that thesetwo steels have almost identical hardenability. The 8 mm(0.35 in.) difference in section size accounts for the differencein martensite content at the center of the bars, i.e., Steels 1Aand 1B were water quenched in 17 and 25 mm (0.65 and 1.0 in)diameter sections, respectively.
Figures 4 and 5 show optical micrographs correspondingto five of the six quench and temper conditions (see Table 3)evaluated in this study. Figures 4(a) and 5(a) illustrate thesubstantial difference in martensite morphology that is obtainedwhen fully, or nearly fully as-quenched martensite is temperedat temperatures that differ by 222 �C (400 �F).
3.3 Tensile Properties
Table 2 shows the effect of martensite content on tensileproperties in the as-quenched condition. The 0.2% offsetYS and UTS values all decreased substantially as the martensitecontent (hardness) decreased. Ductility, as measured by percent
Fig. 1 Jominy end-quench hardenability curves of steels austenitized at 925 �C (1700 �F)
Table 2 Hardness and tensile properties in as-quenched conditions
Steel % Mo
Bardiameter,
Quenchant
Centerhardness YS UTS
% RA % El% Martensiteat bar centermm in HRC HV10 MPa ksi MPa ksi
1A 0.36 17 0.65 Water 47.0 503 1213 176 1579 229 43 11 1001A 0.36 17 0.65 Oil 33.4 345 786 114 1138 265 52 14 501A 0.36 25 1 Oil 31.0 309 696 101 993 144 56 16 351B 0.38 25 1 Water 42.3 427 1110 161 1420 206 43 12 972 0.20 25 1 Water 37.3 377 848 123 1172 170 43 14 80
Journal of Materials Engineering and Performance Volume 19(4) June 2010—575
reduction of area (%RA), was identical for martensite contentsabove 80% and increased slightly with lower martensitecontents. The percent elongation (%El) also increased slightlywith decreasing martensite content.
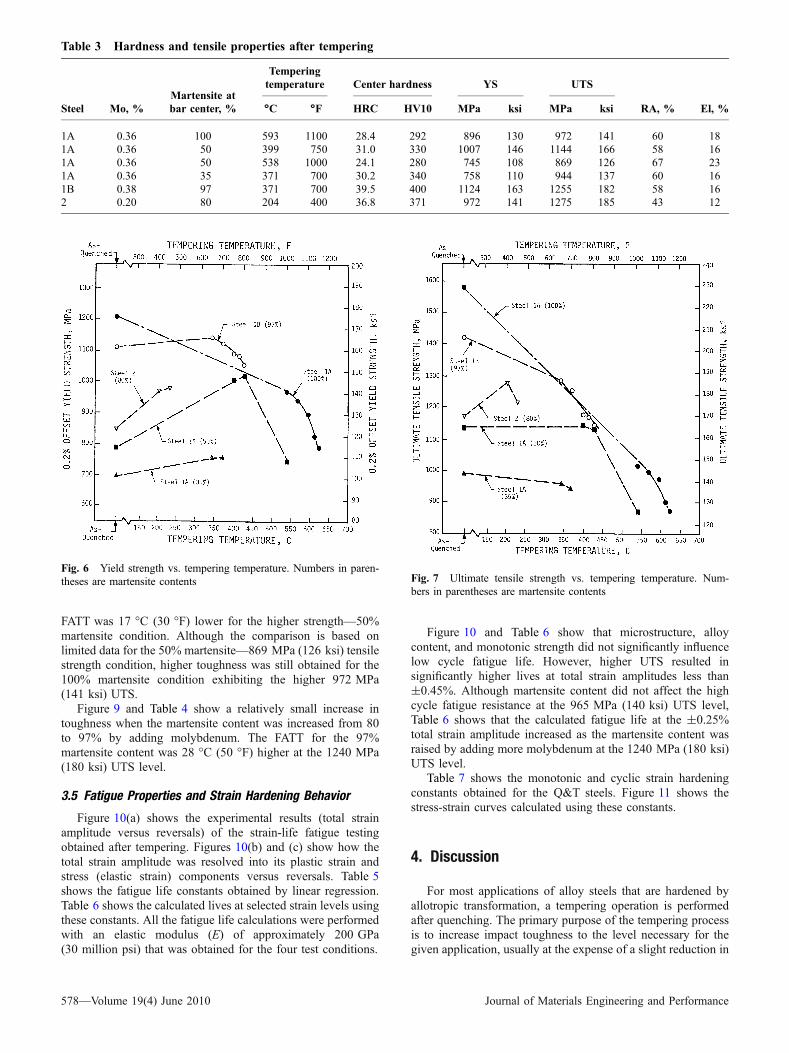
Figure 6 shows the effect of tempering temperature on theYS for all the steels and quenching treatments. For thespecimens with the 100% as-quenched martensite content andtempered only at temperatures above 540 �C (1000 �F), the YSdecreased with increasing tempering temperature. After tem-pering at temperatures up to about 350 �C (660 �F), theas-tempered YS was higher than its respective as-quenchedvalue for all the other conditions. For the 50 and 97%as-quenched martensite contents, the yield strengths decreasedwith increasing tempering temperature after reaching a maxi-mum value at an intermediate tempering temperature.
Figure 7 shows that only Steel 2, tempered at much lowertemperatures than the other four steel/quench combinations,exhibited a higher UTS in the as-tempered versus theas-quenched condition. After quenching to 35 and 50%martensite contents and tempering at temperatures below425 �C (800 �F), Steel 1A exhibited no loss in tensile strengthversus the as-quenched condition. At the two highest martensitecontents (97 and 100%), similar slopes for the UTS versustempering temperature curves were obtained.
Table 3 shows the conditions selected for further propertyevaluation. For Steel 1A, the tempering treatments that resultedin UTS values nearest 965 MPa (140 ksi) were chosen for the
Fig. 2 As-quenched microstructures of Steel 1A bar centers.(a) Water quenched 17 mm (0.65 in.), diameter section—100% mar-tensite. (b) Oil quenched 17 mm (0.65 in.), diameter section—50%martensite. (c) Oil quenched 25 mm (1 in.), diameter section—35%martensite
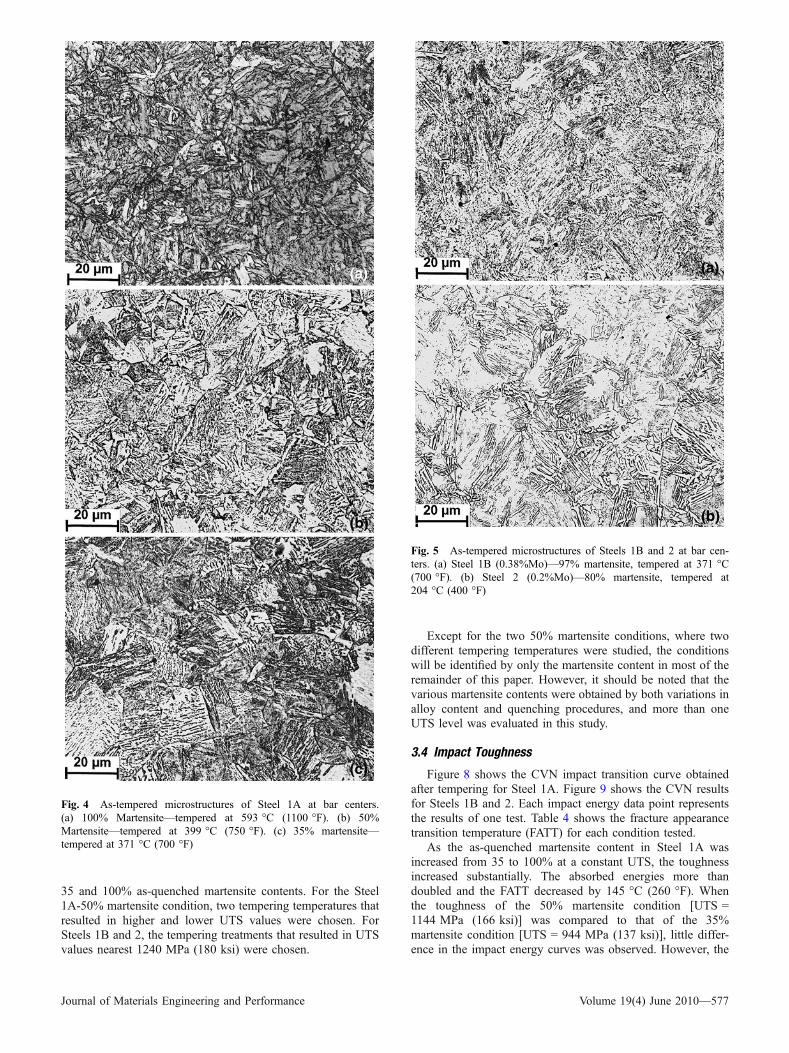
Fig. 3 As-quenched microstructures at centers of water quenched25 mm (1 in.), diameter bar sections. (a) Steel 1B (0.38% Mo)—97% martensite. (b) Steel 2 (0.2% Mo)—80% martensite
576—Volume 19(4) June 2010 Journal of Materials Engineering and Performance
35 and 100% as-quenched martensite contents. For the Steel1A-50% martensite condition, two tempering temperatures thatresulted in higher and lower UTS values were chosen. ForSteels 1B and 2, the tempering treatments that resulted in UTSvalues nearest 1240 MPa (180 ksi) were chosen.
Except for the two 50% martensite conditions, where twodifferent tempering temperatures were studied, the conditionswill be identified by only the martensite content in most of theremainder of this paper. However, it should be noted that thevarious martensite contents were obtained by both variations inalloy content and quenching procedures, and more than oneUTS level was evaluated in this study.
3.4 Impact Toughness
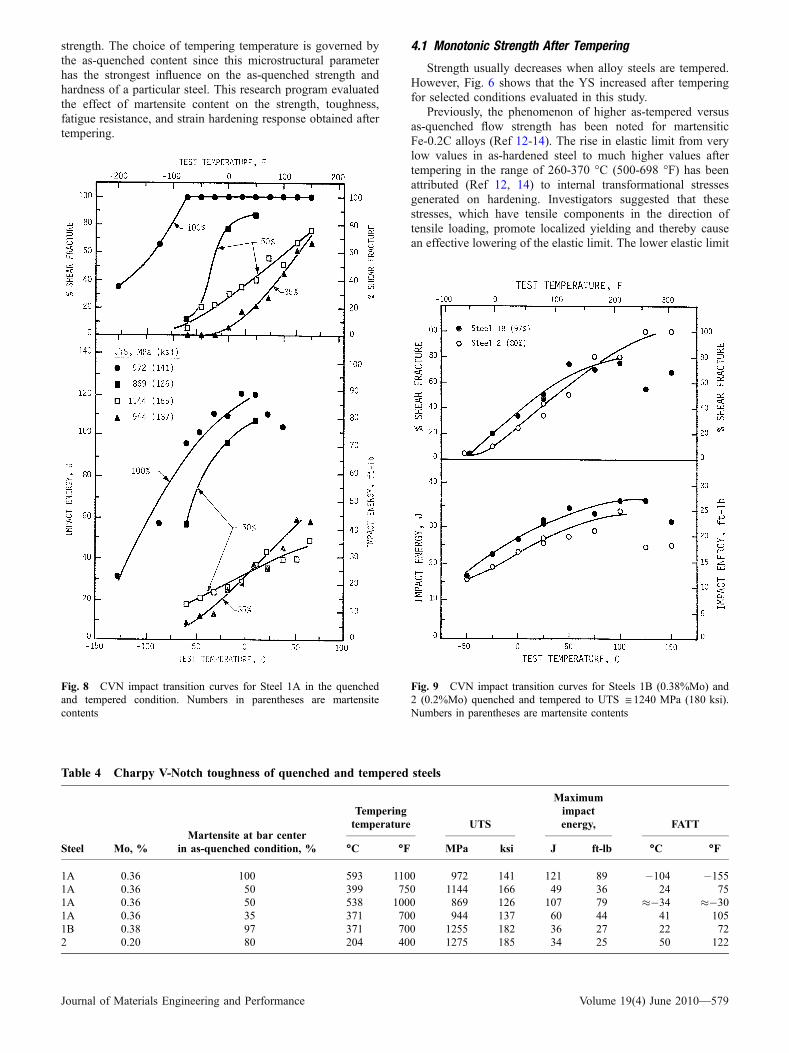
Figure 8 shows the CVN impact transition curve obtainedafter tempering for Steel 1A. Figure 9 shows the CVN resultsfor Steels 1B and 2. Each impact energy data point representsthe results of one test. Table 4 shows the fracture appearancetransition temperature (FATT) for each condition tested.
As the as-quenched martensite content in Steel 1A wasincreased from 35 to 100% at a constant UTS, the toughnessincreased substantially. The absorbed energies more thandoubled and the FATT decreased by 145 �C (260 �F). Whenthe toughness of the 50% martensite condition [UTS =1144 MPa (166 ksi)] was compared to that of the 35%martensite condition [UTS = 944 MPa (137 ksi)], little differ-ence in the impact energy curves was observed. However, the
Fig. 4 As-tempered microstructures of Steel 1A at bar centers.(a) 100% Martensite—tempered at 593 �C (1100 �F). (b) 50%Martensite—tempered at 399 �C (750 �F). (c) 35% martensite—tempered at 371 �C (700 �F)
Fig. 5 As-tempered microstructures of Steels 1B and 2 at bar cen-ters. (a) Steel 1B (0.38%Mo)—97% martensite, tempered at 371 �C(700 �F). (b) Steel 2 (0.2%Mo)—80% martensite, tempered at204 �C (400 �F)
Journal of Materials Engineering and Performance Volume 19(4) June 2010—577
FATT was 17 �C (30 �F) lower for the higher strength—50%martensite condition. Although the comparison is based onlimited data for the 50% martensite—869 MPa (126 ksi) tensilestrength condition, higher toughness was still obtained for the100% martensite condition exhibiting the higher 972 MPa(141 ksi) UTS.
Figure 9 and Table 4 show a relatively small increase intoughness when the martensite content was increased from 80to 97% by adding molybdenum. The FATT for the 97%martensite content was 28 �C (50 �F) higher at the 1240 MPa(180 ksi) UTS level.
3.5 Fatigue Properties and Strain Hardening Behavior
Figure 10(a) shows the experimental results (total strainamplitude versus reversals) of the strain-life fatigue testingobtained after tempering. Figures 10(b) and (c) show how thetotal strain amplitude was resolved into its plastic strain andstress (elastic strain) components versus reversals. Table 5shows the fatigue life constants obtained by linear regression.Table 6 shows the calculated lives at selected strain levels usingthese constants. All the fatigue life calculations were performedwith an elastic modulus (E) of approximately 200 GPa(30 million psi) that was obtained for the four test conditions.
Figure 10 and Table 6 show that microstructure, alloycontent, and monotonic strength did not significantly influencelow cycle fatigue life. However, higher UTS resulted insignificantly higher lives at total strain amplitudes less than±0.45%. Although martensite content did not affect the highcycle fatigue resistance at the 965 MPa (140 ksi) UTS level,Table 6 shows that the calculated fatigue life at the ±0.25%total strain amplitude increased as the martensite content wasraised by adding more molybdenum at the 1240 MPa (180 ksi)UTS level.
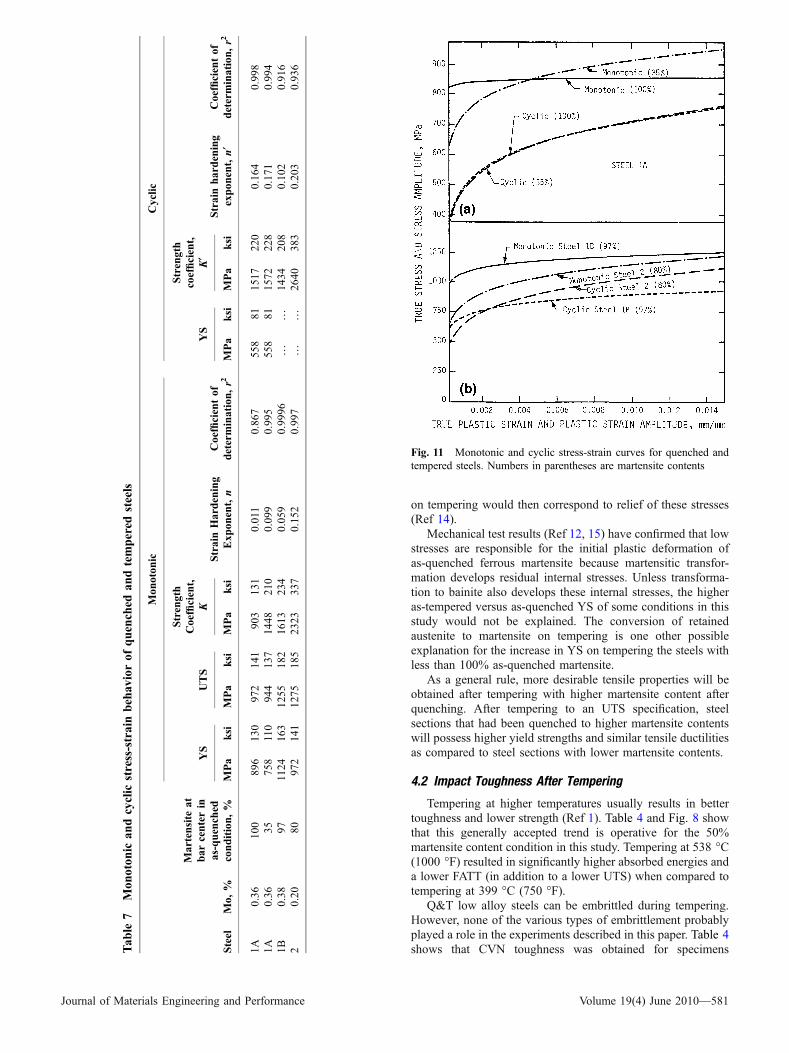
Table 7 shows the monotonic and cyclic strain hardeningconstants obtained for the Q&T steels. Figure 11 shows thestress-strain curves calculated using these constants.
4. Discussion
For most applications of alloy steels that are hardened byallotropic transformation, a tempering operation is performedafter quenching. The primary purpose of the tempering processis to increase impact toughness to the level necessary for thegiven application, usually at the expense of a slight reduction in
Table 3 Hardness and tensile properties after tempering
Steel Mo, %Martensite atbar center, %
Temperingtemperature Center hardness YS UTS
RA, % El, %�C �F HRC HV10 MPa ksi MPa ksi
1A 0.36 100 593 1100 28.4 292 896 130 972 141 60 181A 0.36 50 399 750 31.0 330 1007 146 1144 166 58 161A 0.36 50 538 1000 24.1 280 745 108 869 126 67 231A 0.36 35 371 700 30.2 340 758 110 944 137 60 161B 0.38 97 371 700 39.5 400 1124 163 1255 182 58 162 0.20 80 204 400 36.8 371 972 141 1275 185 43 12
Fig. 6 Yield strength vs. tempering temperature. Numbers in paren-theses are martensite contents Fig. 7 Ultimate tensile strength vs. tempering temperature. Num-
bers in parentheses are martensite contents
578—Volume 19(4) June 2010 Journal of Materials Engineering and Performance
strength. The choice of tempering temperature is governed bythe as-quenched content since this microstructural parameterhas the strongest influence on the as-quenched strength andhardness of a particular steel. This research program evaluatedthe effect of martensite content on the strength, toughness,fatigue resistance, and strain hardening response obtained aftertempering.
4.1 Monotonic Strength After Tempering
Strength usually decreases when alloy steels are tempered.However, Fig. 6 shows that the YS increased after temperingfor selected conditions evaluated in this study.
Previously, the phenomenon of higher as-tempered versusas-quenched flow strength has been noted for martensiticFe-0.2C alloys (Ref 12-14). The rise in elastic limit from verylow values in as-hardened steel to much higher values aftertempering in the range of 260-370 �C (500-698 �F) has beenattributed (Ref 12, 14) to internal transformational stressesgenerated on hardening. Investigators suggested that thesestresses, which have tensile components in the direction oftensile loading, promote localized yielding and thereby causean effective lowering of the elastic limit. The lower elastic limit
Fig. 8 CVN impact transition curves for Steel 1A in the quenchedand tempered condition. Numbers in parentheses are martensitecontents
Fig. 9 CVN impact transition curves for Steels 1B (0.38%Mo) and2 (0.2%Mo) quenched and tempered to UTS @ 1240 MPa (180 ksi).Numbers in parentheses are martensite contents
Table 4 Charpy V-Notch toughness of quenched and tempered steels
Steel Mo, %Martensite at bar center
in as-quenched condition, %
Temperingtemperature UTS
Maximumimpactenergy, FATT
�C �F MPa ksi J ft-lb �C �F
1A 0.36 100 593 1100 972 141 121 89 �104 �1551A 0.36 50 399 750 1144 166 49 36 24 751A 0.36 50 538 1000 869 126 107 79 ��34 ��301A 0.36 35 371 700 944 137 60 44 41 1051B 0.38 97 371 700 1255 182 36 27 22 722 0.20 80 204 400 1275 185 34 25 50 122
Journal of Materials Engineering and Performance Volume 19(4) June 2010—579

Fig. 10 Fatigue results for quenched and tempered steels. Numbers in parentheses are martensite contents
Table 5 Fatigue life regression constants for quenched and tempered steels
Steel Mo, %
Martensite at barcenter in as-quenched
condition, %
Fatigue strength Fatigue ductility (a)
UTSCoefficient,
rf¢Exponent,
bCoefficient of
determination, r2Coefficient,
ef¢Exponent,
cCoefficient
of determination, r2MPa ksi MPa ksi
1A 0.36 100 972 141 1089 158 �0.065 0.921 3.029 �0.797 0.9691A 0.36 35 944 137 1165 169 �0.074 0.931 0.872 �0.652 0.9311B 0.38 97 1255 182 1386 201 �0.067 0.932 0.491 �0.604 0.9572 0.20 80 1275 185 2096 304 �0.110 0.937 0.303 �0.536 0.981
(a) Includes only those specimens which had a Dep/2> 0.01%
Table 6 Calculated fatigue life for quenched and tempered steels at various levels of cyclic strain
Steel Mo, %
Martensite at barcenter in as-quenched
condition, %
UTS Calculated fatigue life (Nf) at total strain amplitudes (DeT/2) of:
MPa ksi ±1.3% ±0.9% ±0.6% ±0.45% ±0.25%
1A 0.36 100 972 141 675 1,275 2,950 6,000 125,0001A 0.36 35 944 137 500 1,090 2,950 7,000 125,0001B 0.38 97 1255 182 395 1,000 3,600 12,500 1,715,0002 0.20 80 1275 185 426 1,190 4,550 14,500 380,000
580—Volume 19(4) June 2010 Journal of Materials Engineering and Performance
on tempering would then correspond to relief of these stresses(Ref 14).
Mechanical test results (Ref 12, 15) have confirmed that lowstresses are responsible for the initial plastic deformation ofas-quenched ferrous martensite because martensitic transfor-mation develops residual internal stresses. Unless transforma-tion to bainite also develops these internal stresses, the higheras-tempered versus as-quenched YS of some conditions in thisstudy would not be explained. The conversion of retainedaustenite to martensite on tempering is one other possibleexplanation for the increase in YS on tempering the steels withless than 100% as-quenched martensite.
As a general rule, more desirable tensile properties will beobtained after tempering with higher martensite content afterquenching. After tempering to an UTS specification, steelsections that had been quenched to higher martensite contentswill possess higher yield strengths and similar tensile ductilitiesas compared to steel sections with lower martensite contents.
4.2 Impact Toughness After Tempering
Tempering at higher temperatures usually results in bettertoughness and lower strength (Ref 1). Table 4 and Fig. 8 showthat this generally accepted trend is operative for the 50%martensite content condition in this study. Tempering at 538 �C(1000 �F) resulted in significantly higher absorbed energies anda lower FATT (in addition to a lower UTS) when compared totempering at 399 �C (750 �F).
Q&T low alloy steels can be embrittled during tempering.However, none of the various types of embrittlement probablyplayed a role in the experiments described in this paper. Table 4shows that CVN toughness was obtained for specimensT
able
7Mon
oton
ican
dcyclic
stress-strainbehaviorof
quenched
andtempered
steels
Steel
Mo,
%
Martensite
atbar
centerin
as-quenched
condition,%
Mon
oton
icCyclic
YS
UTS
Strength
Coefficient,
KStrainHardening
Exp
onent,n
Coefficientof
determination,r2
YS
Strength
coefficient,
K¢
Strainhardening
expon
ent,n
¢Coefficientof
determination,r2
MPa
ksi
MPa
ksi
MPa
ksi
MPa
ksi
MPa
ksi
1A0.36
100
896
130
972
141
903
131
0.011
0.86
755
881
1517
220
0.16
40.99
81A
0.36
3575
8110
944
137
1448
210
0.09
90.99
555
881
1572
228
0.17
10.99
41B
0.38
971124
163
1255
182
1613
234
0.05
90.99
96…
…14
3420
80.10
20.91
62
0.20
8097
214
112
7518
523
2333
70.15
20.99
7…
…26
4038
30.20
30.93
6
Fig. 11 Monotonic and cyclic stress-strain curves for quenched andtempered steels. Numbers in parentheses are martensite contents
Journal of Materials Engineering and Performance Volume 19(4) June 2010—581
tempered at temperatures beyond the extremes of the temper-ature ranges where susceptibility to ‘‘tempered martensiteembrittlement’’ (TME) or ‘‘temper embrittlement’’ (TE) report-edly occur. TME and TE occur after service or temperingexposure between 204 and 371 �C (400 and 700 �F) (Ref 13,16). The aluminum contents of the three experimental steels(Table 1) are in the range stated to be helpful (Ref 16) forincreasing resistance to TME. The 0.2% carbon content, shorttempering time (2 h), thin sections [maximum of 25 mm (1 in.)diameter], and the 0.2-0.38%Mo content used in this study areall contrary to trends stated (Ref 13, 16) to enhance TEsusceptibility. ‘‘Blue brittleness’’ is not indicated since nosignificant losses in tensile ductility were obtained.
Figure 8 demonstrates that better strength-toughness com-binations can be achieved with higher martensite contents at allstrength levels. When compared at a UTS of approximately965 MPa (140 ksi), a change in martensite content of 35-100%resulted in substantial decrease in fracture appearance transitiontemperature, FATT. If the 100% martensite content [UTS =972 MPa (141 ksi)] is compared to the 50% martensite contentat both its strength levels [UTS = 869 and 1144 MPa (126 and165 ksi)], the fully martensitic structure resulted in highertoughness. If the toughness of the 35% martensite conditionis compared to that of the two 50% martensite strengthconditions, the higher martensite content resulted in alower FATT at both higher and equivalent levels of UTSand YS.
A comparison of the results obtained for the 97% martensitecondition with those obtained for the 50% martensite conditionat the same FATT illustrates that at equivalent toughness, higheryield and tensile strengths can be obtained with a highermartensite content. At a UTS near 1240 MPa (180 ksi), achange in martensite content from 80 to 97% resulted in arelatively small decrease in the FATT. However, when thisimprovement in toughness is considered in conjunction with the152 MPa (22 ksi) higher YS of the 97% versus 80% martensiteconditions, the improvement in toughness obtained withthe higher martensite and molybdenum contents is moreimpressive.
The low toughness in steels having mixed microstructurescan be correlated with the non-martensitic constituents. Incontinuous-cool, slack quench heat treatments, such as thoseperformed for all but the fully martensitic condition in thisstudy, a number of different constituents can nucleate atdifferent temperatures on cooling. Figures 2(b, c) and 3(a, b)show that the microstructures of all these slack-quenched steelsexhibit upper bainite. This upper bainite is believed to beresponsible for lower toughness, i.e., the more upper bainite,the higher the impact transition temperature.
This observation is consistent with the results of earlierexperiments performed on 4340 steel (Ref 1, 17). Isothermalheat treatments which produced an upper bainite microstructureresulted in low YS, low tensile ductility, and poor impacttoughness (Ref 1). In contrast, earlier results also indicated thataustempering (isothermal formation) to lower bainite resultedin equivalent or slightly superior mechanical properties ascompared to fully martensitic microstructures (Ref 2, 17).Therefore, the conclusions reached in this study must pertainonly to mixed microstructures containing upper bainite pro-duced by continuous cooling heat treatments. In any event,austempering (isothermal transformation to lower bainite) oflarge sections manufactured from low or medium carbon alloysteels must be controlled carefully because it may not be
possible to quench fast enough to prevent the formation ofsignificant amounts of upper bainite.
Toughness losses are occasionally associated with higheralloying additions. For example, chromium raises the ductile-to-brittle transition temperature slightly (Ref 1) and canaggravate tendencies toward TE (Ref 1, 16). However, additionof elements such as chromium, nickel, and molybdenumcontrol toughness more through their effects on microstructure(Ref 1). Increasing alloy content to enhance hardenability andensure fully martensitic as-quenched microstructures allows theselection of higher tempering temperatures, thus resulting inimproved toughness.
4.3 Fatigue Life After Tempering
Although low cycle fatigue resistance was unaffected byvariations in as-quenched martensite content, Fig. 10 andTable 6 show that actual and predicted fatigue life in the highcycle regime (>104 cycles) increased with higher martensitecontents for the high UTS level [1240 MPa (180 ksi)]. Thisresult agrees earlier observations (Ref 4) of decreased fatiguelimits with decreased martensite content in 0.4%C steels.
4.4 Strain Hardening Behavior After Tempering
Figure 11(a) shows that the fully martensitic conditionexhibited virtually no monotonic work hardening. This issimilar to the result obtained for a fully martensitic Fe-0.2Calloy after tempering at 400 �C (752 �F) (Ref 12). Themicrostructure was probably responsible for the large differ-ences in as-tempered work hardening behavior obtained in thisstudy 35 and 100% martensite contents. The bainitic ferriteshown in Fig. 4(c), which was present in the as-quenchedcondition as shown in Fig. 2(c), might have work hardenedsignificantly when compared to the lath packets shownin Fig. 4(a), obtained after tempering the fully martensiticcondition.
Packet size affects the strength of as-quenched martensites ina manner similar to the effect of ferrite grain size on the strengthof ferritic steels, but martensite steels that work hardensignificantly after quenching no longer do so after tempering(Ref 12). Figures 11(a, b) show a similar (flat) trend inas-tempered monotonic work hardening behavior for the 97%and 100% martensite contents. In addition, the 97% martensitecondition (Steel 1B) work hardened more than the fullymartensitic condition (Steel 1A). Since Fig. 3 and 5 show thatthe 35 and 80% martensite specimens contained bainitic ferrite,the pronounced work hardening (see Fig. 11a, b) obtained forthese two conditions could be associated with bainitic ferrite too.
Figure 11 shows that all four conditions exhibited cyclicsoftening, i.e., the cyclic stress amplitude was lower than themonotonic true stress for any plastic strain up to 1.5%. Thisobservation is consistent with the behavior associated withQ&T steels as a class of materials (Ref 5).
Unlike the differences in monotonic work hardeningbehavior for the 35 and 100% martensite conditions discussedabove, Fig. 11(a) shows that the two conditions had identicalcyclic stress-strain curves. Although the monotonic offset YSwas higher for the 100% martensite content, Table 6 shows thatthe 35% martensite content possessed an identical cyclic YS.No cyclic YS was determined for the 80 and 97% martensiteconditions because ISTs were not performed. However, Fig. 11shows that higher cyclic flow stresses were obtained at alllevels of applied plastic strain between 0.2 and 1.5% for the
582—Volume 19(4) June 2010 Journal of Materials Engineering and Performance

two conditions possessing the higher UTS of 80 and 97%martensite. Therefore, the trends in cyclic YS and UTS weresimilar and not a function of martensite content.
5. Conclusions
High toughness and strength-toughness combinations aftertempering were achieved with steels having high as-quenchedmartensite contents. A range of different as-quenched martens-ite contents (35, 50, and 100%) was established in a 0.23C-0.81Mn-0.51Ni-0.51Cr-0.36Mo steel by varying section sizeand quenching media.
After tempering to the same UTS, the fully martensiticcondition exhibited a significantly higher YS, higher impactenergies, and lower FATT than the 35% martensite condition.Toughness was directly related to martensite content based oncomparisons of the 35, 50, and 100% martensite contents at alllevels of as-tempered ultimate tensile strengths.
Martensite contents were also varied by quenching two0.21C-0.82Mn-0.55Ni-0.50Cr steels with differing molybde-num contents (0.2 and 0.38%) in the same section size. The0.38%Mo steel with 97% martensite exhibited a higher YS andhigher toughness than the 0.2%Mo steel with 80% martensite,after tempering to the same UTS.
The low cycle fatigue life of the Q&T steels was not afunction of as-quenched martensite content. All combinationsof steels/heat treatments exhibited cyclic softening, and thecyclic YS was independent of martensite content. The cyclicflow strength, however, was higher for the conditions exhib-iting higher tensile strengths, but again, independent of thepercent martensite present.
At one of the two tensile strength levels evaluated, thepredicted high cycle fatigue life increased with martensitecontent. Increasing the molybdenum content from 0.2 to 0.38%increased the amount of martensite in the microstructure andresulted in higher predicted high cycle fatigue life.
Appendix
Relevant Fatigue and Strain Hardening Equationsand Symbols
The total strain amplitude ðDeT=2Þ was the controlledvariable in the fatigue tests. The total strain amplitude wasequated to the sum of its elastic (Dee/2) and plastic ðDep=2Þcomponents, i.e.,
ðDeT=2Þ ¼ Dee=2þ Dep=2 ðEq 1Þ
The elastic strain amplitude was calculated using Hooke�sLaw (E = Young�s or elastic modulus) and the saturation stressamplitude (Dr/2) obtained at half-life (0.5 Nf) as follows:
Dee=2 ¼ Dr=2E ðEq 2Þ
The plastic strain amplitude (Dep/2) was calculated bysubtraction, i.e.,
Dep=2 ¼ DeT=2� Dee=2 ¼ DeT=2� Dr=2E ðEq 3Þ
The saturation stress (Dr/2) and the plastic strain (Dep/2)amplitudes were related to the number of reversals (2Nf) by
Dr=2 ¼ r0f ð2Nf Þb ðEq 4Þ
and
Dep=2 ¼ e0f ð2Nf Þc ðEq 5Þ
where the four constants rf, b, e0f , and c are the fatiguestrength coefficient, fatigue strength exponent, fatigue ductil-ity coefficient, and the fatigue ductility exponent respectively,determined using linear regression. The above equations werecombined to obtain the overall total strain amplitude-lifeequation.
DeT=2 ¼ ðr0f=EÞð2Nf Þb þ e0f ð2Nf Þc ðEq 6Þ
The monotonic and cyclic stress-plastic strain behavior ofthe steels was characterized using the equation
r ¼ Kenp ðEq 7Þ
and
Dr=2 ¼ K 0ðDep=2Þn0
ðEq 8Þ
where K is the monotonic strength coefficient, n is the mono-tonic strain hardening exponent, r is the true tensile stress, epis the true plastic tensile strain, K¢ is the cyclic strength coef-ficient, and n¢ is the cyclic strain hardening exponent. Thefour constants (K, n, K¢, and n¢) were determined using linearregression. (The above Eqs 4, 5, 7, and 8 in the form ofy = AxB were transformed to log y = log A + B log x for thepurposes of obtaining the linear regression constants A andB.) A material is considered as cyclically softening when thecyclic stress amplitude is lower than the monotonic truestress, i.e., Dr/2< r, for a given plastic strain; cyclic hard-ening is the opposite situation.
References
1. G.J. Roe and B.L. Bramfitt, Notch Toughness of Steels, ASMHandbook: Properties and Selection: Irons, Steels, and High-Perfor-mance Alloys, 10th ed., Vol. 1, ASM International, Materials Park, OH,1990, p 748, which cites the original paper: R.F. Hehemann, V.J.Luhan, and A.R. Troiano, The Influence of Bainite on MechanicalProperties, Trans. ASM, 1957, 49, p 409–426
2. J.M. Tartaglia, K.A. Lazzari, G.P. Hui, and K.L. Hayrynen, AComparison of Mechanical Properties and Hydrogen EmbrittlementResistance of Austempered versus Quenched & Tempered 4340 Steel,Metall. Mater. Trans., 2008, 39A(3), p 559–576
3. R. W. Landgraf, Fatigue Resistance and Microstructure of FerrousAlloys, ASM Handbook: Fatigue and Fracture, 10th ed., Vol. 19, ASMInternational, Materials Park, OH, 1996, p 608
4. F. Borik, R.D. Chapman, and W.E. Jominy, The Effect of Per CentTempered Martensite on Endurance Limit, Trans. ASM, 1958, 50,p 242–254
5. R.W. Landgraf, Control of Fatigue Resistance Through Microstructure,Fatigue and Microstructure, American Society for Metals, Metals Park,OH, 1979, p 439–466
6. N.S. Stoloff and D.J. Duquette, Microstructural Effects in the FatigueBehavior of Metals and Alloys, CRC Critic. Rev. Solid State Sci., 1974,4(4), p 615–687
7. J.M. Tartaglia and G.T. Eldis, Core Hardenability Calculations forCarburizing Steels, Metall. Trans., 1984, 15A(6), p 1173–1183
8. C.A. Siebert, D.V. Doane, and D.H. Breen, Metallurgical FactorsInfluencing Hardenability of Steel, The Hardenability of Steels,American Society for Metals, Metals Park, OH, 1977, p 100ff
9. D.T. Raske and J. Morrow, Manual on Low Cycle Fatigue Testing, STP465, American Society for Testing and Materials, Philadelphia, PA,1969, p 12
Journal of Materials Engineering and Performance Volume 19(4) June 2010—583
10. J.M. Hodge and M.A. Orehoski, Relationship Between Hardenabilityand Percentage of Martensite in Some Low Alloy Steels, Trans. AIME,1946, 167, p 627–638
11. G. Krauss, Martensitic Transformation, Structure and Properties inHardenable Steels, Hardenability Concepts with Applications to Steel,The Metallurgical Society of AIMS, Warrendale, PA, 1978, p 229–245
12. T. Swarr and G. Krauss, The Effect of Structure on the Deformation ofAs-Quenched and Tempered Martensite in an Fe-0.2 Pct C Alloy, Met.Trans. A, 1976, 7A, p 41–48
13. G. Krauss, Low Toughness and Embrittlement Phenomena in Steels,Chap 19, Steels: Processing, Structure and Performance, ASMInternational, Materials Park, OH, 2005, p 396-404
14. H. Muir, B.L. Averbach, and M. Cohen, The Elastic Limitand Yield Behavior of Hardened Steels, Trans. ASM, 1955, 47,p 380
15. C.L. Magee and H.W. Paxton, Experimental Support for ‘‘Hard’’Martensite, Trans. TMS-AIME, 1968, 242, p 1766–1767
16. J.R. Low, Jr., Embrittlement of Steels, ASM Metals Handbook:Properties and Selection: Irons and Steels, 9th ed., Vol. 1, AmericanSociety for Metals, Metals Park, OH, 1978, p 683–688,
17. Y. Tomita and K. Okabayashi, Improvement in Lower TemperatureMechanical Properties of 0.40 Pct C-Ni-Cr-Mo Ultrahigh StrengthSteel With the Second Phase Lower Bainite, Met. Trans. A, 1983, 14A,p 485–492
584—Volume 19(4) June 2010 Journal of Materials Engineering and Performance