The effects of invasive bush honeysuckle (Lonicera spp - · PDF file ·...
62
Courtney E. M c Cusker Grant #08-021W Response of avian communities to invasive bush honeysuckle (Lonicera spp.) Grant Agreement #08-021W Courtney E. M c Cusker University of Illinois 202 Shelford Vivarium 606 E. Healey St. (217) 377-6897 [email protected] Time Frame of Report: May 2006-February 2008 PROJECT OBJECTIVES The overall objective of this study is to assess the impact of invasive Lonicera spp. on avian communities. To reach this goal, I will address three key issues: 1) Comparison of bird communities at sites with invasive Lonicera spp. versus bird communities at sites with native flora in both the summer and winter. I will compare species richness and density of birds (individually and combined) between the two types of sites. 2) Comparison of summer versus winter bird communities within a site. I will determine whether bird species richness and density fluctuate with season and compare the changes in the communities over time for invaded and native sites. 3) The effects of colder temperatures on wintering bird communities. In addition to comparing invaded and native sites, I will further assess whether temperature has an effect on the differences or similarities of the communities in the two types of sites. Also, I will determine if there is a higher rate of removal for invasive Lonicera spp. fruits during colder periods and relate this to any changes in the density of birds. 1
Transcript of The effects of invasive bush honeysuckle (Lonicera spp - · PDF file ·...

Courtney E. McCuskerGrant #08-021W
Response of avian communities to invasive bush honeysuckle (Lonicera spp.)
Grant Agreement #08-021WCourtney E. McCuskerUniversity of Illinois
202 Shelford Vivarium606 E. Healey St.(217) 377-6897
[email protected] Frame of Report: May 2006-February 2008
PROJECT OBJECTIVES
The overall objective of this study is to assess the impact of invasive Lonicera spp. on avian
communities. To reach this goal, I will address three key issues:
1) Comparison of bird communities at sites with invasive Lonicera spp. versus bird
communities at sites with native flora in both the summer and winter. I will compare species
richness and density of birds (individually and combined) between the two types of sites.
2) Comparison of summer versus winter bird communities within a site. I will
determine whether bird species richness and density fluctuate with season and compare the
changes in the communities over time for invaded and native sites.
3) The effects of colder temperatures on wintering bird communities. In addition to
comparing invaded and native sites, I will further assess whether temperature has an effect on the
differences or similarities of the communities in the two types of sites. Also, I will determine if
there is a higher rate of removal for invasive Lonicera spp. fruits during colder periods and relate
this to any changes in the density of birds.
1

Courtney E. McCuskerGrant #08-021W
COMPLETED PROJECT DESCRIPTION
Invasive bush honeysuckle, Lonicera spp., is often considered undesirable, however it
can create a dense understory for nests in the summer and provide a source of food for birds in
winter. I investigated how avian communities respond to the presence of Lonicera spp. in the
summer and winter in east central Illinois. During the summer, species that nest in the
understory (e.g. northern cardinals, American robins, and gray catbirds) are more common in
sites with Lonicera spp. These differences appear to be due to the percent of total shrub cover
and Lonicera spp. cover. In contrast, eastern wood-pewees tend to avoid areas with Lonicera
spp. Total density of birds and species richness was similar between Lonicera spp. and native
shrub sites, but there was a difference in overall community structure. In the winter, local
abundances of frugivorous birds (e.g. northern cardinals and American robins) are greater in
Lonicera spp. areas. The total winter bird density was not different between sites, but did change
over years. The winter avian community and species richness was similar between sites. In
general, Lonicera spp. appears to be having a beneficial impact on several bird species in east
central Illinois. While honeysuckle removal has obvious benefits for native plant communities,
management strategies for Lonicera spp. often involve complete removal of an understory in
forested areas. This may prove to be detrimental for shrub nesting birds and frugivorous birds in
the winter if the loss of Lonicera spp. is not replaced with other native shrub species that can
provide nesting substrate and a winter food resource. In addition, Lonicera spp. may be
contributing to the range expansion of some frugivorous birds in the winter due to the increase in
food resources.
2

Courtney E. McCuskerGrant #08-021W
INTRODUCTION
Invasive species are a growing global problem that can cause detrimental effects on
native flora and fauna and often result in negative economic and environmental impacts
(Pimentel et al. 2000). One way to assess the impact of invasive species on native flora and
fauna is to compare community structure between areas with and without an invasive species.
Native species can respond either negatively or positively to invasions by showing changes in
density, species richness, diversity, survival, and fecundity. In theory, native species can
respond to invasive species in four different ways: no response (equivalency), negatively
(inhibition), positively (facilitation), or a combination of both positive and negative responses,
such as increased species richness but decreased fecundity (compensation) (Sax et al. 2005).
Many studies have focused on the negative impacts invasions have on the native biota through
increased competition, predation, pest infestation, diseases susceptibility and loss of biodiversity
(Rodriguez 2006). There is, however, the potential for invasions to lead to positive outcomes for
native biota through facilitation.
Facilitation is the interaction of two species that results in at least one of the species
experiencing an increase in local density, biomass or fitness. Native species may benefit from
the presence of an invasive species through several different mechanisms including, but not
limited to, habitat modification and/or trophic subsidy (Rodriguez 2006). Habitat modification,
or ecosystem engineering, is the physical modification and/or creation of habitats (Jones et al.
1997). Invasive species can create novel habitat structure and can lead to changes in abiotic
condition or provide refugia and/or substrata (Rodriguez 2006).
Trophic subsidy results in the enhanced availability of a food source either through an
3

Courtney E. McCuskerGrant #08-021W
increase in nutrients, prey or hosts. Invasive species may provide a trophic subsidy by
increasing the diversity of prey and providing a limiting resource to higher trophic levels. As the
invading species becomes more abundant it is more likely that native species will use it as a food
source (Rodriguez 2006). Both trophic subsidy and habitat modification can have impacts on the
native flora and fauna of the area, including impacts on the avian community.
Many studies have focused on the response of avian communities to invasive non-native
plants. Responses can greatly vary, however they are often negative, leading to a decreased
density and/or richness of birds. For example, the grass Phragmites australis has been rapidly
expanding into Connecticut wetlands where the number of bird species in Phragmites dominated
marshes has diminished mostly due to the tall, thick, monoculture stands it creates through
habitat modification (Benoit and Askins 1999). In Victoria, Australia native eucalypt forests
have higher species richness and abundance than exotic pine plantations (Friend 1982) and South
African native forests have higher species richness and abundance of birds compared to exotic
pine plantations and non-native Prosopis woodlands (Armstrong and van Hensbergen 1994;
Dean et al. 2002). Ferdinands et al. (2005) found that birds prefer native wetland habitats over
areas invaded by para grass (Urochloa mutica).
Responses to invasive species may not necessarily lead to a decline in density or richness
of birds, but may result in a change in the avian community structure. Despite the occurrence of
invasive eucalypt trees in woodlots in California, avian species richness and patterns of diversity
are similar when compared to native woodlots, however species composition differs markedly
between the two sites (Sax 2002). Invasive saltcedar (Tamarix chinensis) and native cottonwood
(Populus fremontii var. wixlizeni) also support similar bird species richnesses but with different
4

Courtney E. McCuskerGrant #08-021W
species compositions (Ellis 1995).
Responses of avian communities fall mainly into the inhibition or equivalancy categories.
Overall, very few studies have shown facilitative affects of invasive species on native bird
species. In Malaysia, it was found that some groups of birds readily used an exotic tree
plantation (Albizia falcatoria) due to the increased infestation of pest insects in the plantation,
which provided an abundant food resource for insectivorous birds. However in this system,
some avian groups were poorly represented due to lack of fruits and nest holes (Mitra and
Sheldon 1993). While not a true facilitative response, the insectivorous birds did respond
positively to the indirect food source the plantation provided. Another example of facilitation
has occurred in Flathead Lake, MT, where introduced kokanee salmon (Oncorhynchus nerka)
has lead to an increase in bald eagles (Haliaeetus leucocephalus) and recent declines in the
salmon may lead to increased mortality of eagles due to the decrease in their other historic food
resources (Spencer et al. 1991).
These two examples represent rare positive responses of native species to invasive
species. However, some other invasive species may provide resources that lead to similar
outcomes. This thesis investigates the potential positive impacts that invasive non-native
Lonicera spp. (bush honeysuckles, hereafter referred to as Lonicera spp.) may play on avian
communities. Lonicera spp. may positively affect birds in two ways; via habitat modification,
through increase in understory density, and trophic subsidy, through provision of fruits in the late
fall and winter when food sources are limited. During the breeding season, Lonicera spp. may
provide ideal nesting substrate for shrub nesting birds due to its dense branch architecture and
increased understory structure. During the winter, Lonicera spp. retain fruits into the winter
5

Courtney E. McCuskerGrant #08-021W
months and may provide a limited food resource for overwintering birds.
Lonicera spp. were introduced from Eurasia during the mid-1700s and 1800s as
ornamental shrubs (Wyman 1949; Dirr 1975; Luken and Thieret 1996). Habitat disturbance,
creating more open sunlit habitats, is key to the invasion of these species and therefore they did
not begin spreading across the eastern United States and into Ontario, Canada until the
mid-1900s when more disturbance was occurring across the landscape (Pringle 1973; Nyboer
1992; Luken and Thieret 1996). Many different species of Lonicera spp. were introduced to the
United States during this time, and in Illinois (the location of this study) there are now four
primary invasive bush honeysuckle species, Lonicera maackii, L. tatarica, L. x bella and L.
morrowii. Lonicera maackii is the most common and abundant in east central Illinois, L.
tatarica and L. x bella are less common and L. morrowii is rare (J. Ellis, per comm). These
species are all upright, multistemmed, deciduous shrubs that leaf out early in the spring and
retain leaves late into the fall (Wyman 1949; Dirr 1975; Trisel and Gorchov 1994, Luken and
Thieret 1996). The bright red fruits of invasive Lonicera spp. develop in the fall, are persistent
into the winter and are primarily consumed and dispersed by birds (Ingold and Craycraft 1983;
Luken and Thieret 1996; Drummond 2005; Bartuszevige and Gorchov 2006).
Ecological effects of invasive Lonicera spp. have been well documented and include
diminished native plant richness, abundance, density, fecundity and survival in areas with
invasive Lonicera spp. (Woods 1993; Gould and Gorchov 2000; Collier et al. 2002; Gorchov and
Trisel 2003; Miller and Gorchov 2004). These effects may be due to shading or allelopathic
compounds produced by invasive Lonicera spp., both of which can inhibit germination and
growth of other plants (Nyboer 1992; Dorning and Cipollini 2006; Cipollini et al. 2008). The
6

Courtney E. McCuskerGrant #08-021W
presence of Lonicera spp. can cause structural changes in the invaded habitats by creating a
dense understory not historically found in these areas, which can ultimately lead to indirect
effects on native fauna. Structural changes in vegetation brought about by L. maackii were
shown to benefit the snake population while harming frog and turtle populations, resulting in an
overall decrease in reptile and amphibian diversity and evenness (McEvoy and Durtsche 2004).
Birds nesting in invasive Lonicera spp. also suffer indirectly from structural changes in
habitats. Several species of birds have been found nesting in Lonicera spp., including the wood
thrush (unless otherwise noted, all scientific names of birds are in Table 4 or 8), gray catbirds,
American robins and northern cardinals (Whelan and Dilger 1992; Hoover and Brittingham
1998; Schmidt and Whelan 1999; Borgmann and Rodewald 2004) . American robins and
northern cardinals that nested in Lonicera spp. showed higher depredation and greater daily
chick mortality rates compared to individuals that nested in native plants (Schmidt and Whelan
1999; Borgmann and Rodewald 2004). Invasive Lonicera spp. may provide a branch
architecture that is appealing to birds as nest substrate, but also may allow increased predator
movement (Whelan and Dilger 1992; Schmidt and Whelan 1999). In addition, nests in invasive
Lonicera spp. tend to have a lower nest height and are initiated earlier in the spring due to
Lonicera's earlier leaf flush, both of which may contribute to increases in predation (Schmidt and
Whelan 1999; Borgmann and Rodewald 2004). Despite the negative effects birds may be
experiencing while nesting in Lonicera spp., the bushes do provide ideal branch architecture for
nests (Whelan and Dilger 1992) and may result in increasing number of birds choosing invaded
areas leading to an overall increase in density of birds.
Lonicera spp. may also have a positive effect on the wintering bird community. Lonicera
7

Courtney E. McCuskerGrant #08-021W
spp. fruits are persistent into the late winter and can provide an extra food source for
overwintering birds (Ingold and Craycraft 1983; Luken and Thieret 1996; Drummond 2005;
Bartuszevige and Gorchov 2006). Generally it is thought that fall migrating birds (as well as
other wildlife) are the primary consumers of fruits, but wintering birds may also consume fruits
if they are persistent into the winter (McCarty et al. 2002). Fruit resources are important for
overwintering birds when other resources (e.g. arthropods) are absent (Kwit et al. 2004). Other
invasive species have been shown to provide these limited resources. Birds use invasive
European privet (unless otherwise noted, all scientific names of plants are in Table 2) as a food
supplement during the winter (Lochmiller 1978) and northern mockingbirds feed on invasive
multi-flora rose hips during winter months (Stiles 1982).
The consumption of invasive Lonicera spp. fruits during the winter is no exception. The
red fruits of Lonicera spp. are readily consumed by birds (Bergtold 1930; McRae 1980; Ingold
and Craycraft 1983; White and Stiles 1992; Drummond 2005; Bartuszevige and Gorchov 2006).
American robins are the primary consumers of L. maackii , but cedar waxwings, European
starlings, hermit thrushes and northern mockingbirds are also major consumers of the fruits as
well as twelve other species (Bartuszevige and Gorchov 2006). Even northern bobwhites
(Colinus viginianus) consume L. tatarica in February in Georgia (McRae 1980). Birds are not
the only frugivores eating invasive Lonicera spp. fruits. In central New York deer feces were
found to contain honeysuckle remnants (L. tatarica, L. morrowii and L. x bella) (Vellend 2002)
and in Ohio, small mammals use L. maackii as a food source during the early winter months
(Williams et al. 1992).
While birds readily use invasive Lonicera spp. as a winter food source, it has been
8

Courtney E. McCuskerGrant #08-021W
suggested that it and other winter fruit resources are poor quality foods. There are four patterns
of fruit presentation throughout the year and Lonicera spp. fruits fall into the 'fall low-quality
fruit' category. Fall low-quality fruits contain low lipid levels and are characterized by their
presentation at the beginning or the peak of fall bird migration and are persistence on the plant
well into winter (Stiles 1980). Invasive Lonicera spp. fruits are low-quality fruits because of
their low protein and lipid content, making these fruits a poor energy source (Ingold and
Craycraft 1983; White and Stiles 1992; Drummond 2005). While it has been shown that birds
may actually prefer L. tatarica over other species (Drummond 2005), it is believed that
consumption of higher quality foods (arthropods or other fruits) occurs first and that these low-
quality fruits will be eaten last (Stiles1980; White and Stiles 1992). This may be one reason why
Lonicera spp. fruits are retained into winter. While they are available to migrating birds during
the fall, migrants choose other high quality resources first and leave the Lonicera spp. fruits.
Frugivorous birds will track food resources which can lead to increases in density where
resources are abundant (Rey 1995; Moegenburg and Levey 2003; Borgmann et al. 2004; Oliveira
et al. 2006; Hasui et al. 2007). The consumption of Lonicera spp. fruits may lead to a short term
increase in the density and abundance of frugivorous species in the winter and possibly long-
term changes in migration, survival and range (Ingold and Craycraft 1983; White and Stiles
1992; Luken and Thieret 1996; Drummond 2005; Bartuszevige and Gorchov 2006).
Invasive Lonicera spp. plays an important role in the structure of forested landscapes in
Illinois and surrounding areas. It can drastically change the composition and structure of
vegetation in an area. While this is detrimental to many animal and plant species, breeding and
overwintering birds may benefit if invasive Lonicera spp. provides a nesting substrate and a
9

Courtney E. McCuskerGrant #08-021W
limited food source. This study investigated the potential differences in the breeding avian
community and overwintering avian community between forested areas infested with Lonicera
spp. and forested areas that contain native shrubs.
METHODS
Study Sites
Many forested areas in Illinois have been invaded by Lonicera spp., creating a dense
monoculture understory in areas that historically have had a variety of shrubs in a more open
understory. This study was conducted at ten sites in the east central Illinois area in Piatt,
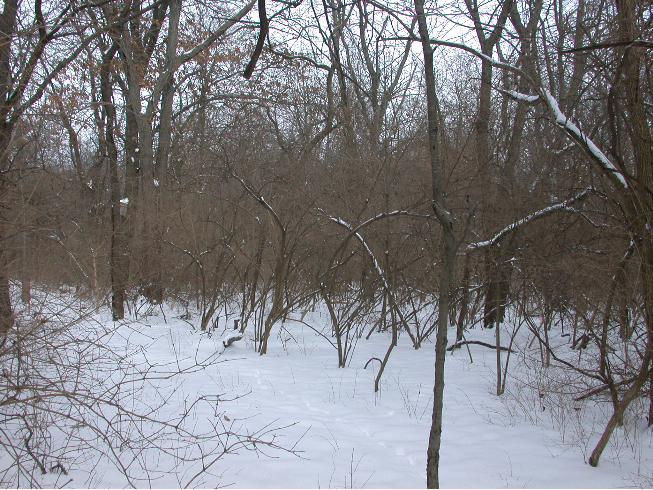
Champaign and Vermilion counties (see Table 1 for GPS locations and site names). Five sites
contained Lonicera spp. and five contained a native shrub/sapling layer (hereafter referred to as
native sites) (Figure 1). The native sites were chosen specifically to contain a native
shrub/sapling layer. A list of shrubs and saplings that were found in these areas are in Table 2.
In addition to the native shrubs, there were other invasive shrubs that were present in both types
of sites, these included European privet, autumn olive and multi-flora rose. Within each of these
sites I conducted unlimited radius point counts for assessing the avian community and vegetation
surveys.
Field Methods
Avian counts. I estimated the local density of birds in the summers of 2006 and 2007
(May-June) and winters of 2006-2007 and 2007-2008 (December-February) using the unlimited
point count method. The number of point counts within a site differed according to the size of
10
Courtney E. McCuskerGrant #08-021W
the site, ranging from two to six in each site. Each point count was at least 200 meters from
another point count and each was visited twice each summer and five times each winter. More
point counts were conducted during the winter due to the increased movement and variability of
bird populations. All counts lasted five minutes and were conducted between sunrise and 10am
in the summer and between 8am and 1pm in the winter. During the five minute period I
recorded and identified all birds heard and seen and estimated the distance to the bird. In
addition, after the five minute point count during the second winter, I played a screech owl call
on a FOXPRO XR6 game caller for one and a half minutes and record all birds that respond
during the call and up to 30 seconds after the call.
Vegetation Surveys. Surveys for vegetation were based on the BBIRD field protocol
(Martin et al. 1997) but were modified for relevance to this study. At each point count, four
randomly positioned 5 x 5 meter plots were sampled for vegetation. Each plot was a random
distance (up to 50 meters) from the point count. Direction of the plot from the point count was
random with one restriction, each point count had a plot in each of four quadrats, northeast
(0º-90º), southeast (91º-180º) southwest (181º-270º) and northwest (271º-360º). The chosen
random point indicated the southwest corner of the plot. Rope with knots at five meter
increments was used to mark off the plot. Within each plot all woody plants were identified and
counted. Using a diameter tape, woody plants with a diameter at breast height (dbh) of 7 cm or
greater were considered trees. Woody plants with dbh less than 7 cm were classified as shrub
and included tree saplings since they are a part of the understory. All individual shrub stems at
10 cm above ground were counted and identified to species. Lonicera maackii is not
reproductive less than one meter tall (Deering and Vankat 1999) therefore, only stems that were
11

Courtney E. McCuskerGrant #08-021W
greater than a meter tall were counted. All stems less than one meter tall were considered part of
the herb layer and were not individually measured. In addition, the percent cover of Lonicera
spp. and total shrub layer in the plot was visually estimated.
Canopy closure was measured using a densiometer (Lemmon 1956). For each plot a
densiometer reading was recorded from the center of the plot in each of the cardinal directions
and an average canopy closure of the four measurements was used. In order to estimate ground
cover, a 1 x 1 meter plot was constructed from wooden dowels. The plot was randomly placed
within the four quadrats of the 5 x 5 meter plot (designated by the cardinal directions) and a
percentage estimate to the nearest ten percent was recorded for amount of herb cover.
Analysis of Field Data
Habitat characteristics. To describe the difference in characteristics between the two
types of sites, univariate t-tests were calculated on the vegetation characteristics between
Lonicera spp. sites and native sites. Analyses were conducted on contiguous (the size of the
forest tract) and sampled (the size of the actual area sampled) areas of the sites, percentage of
total shrub cover, number of total shrub stems per hectare, percent of Lonicera spp. cover,
number of Lonicera spp. stems per hectare, number of trees per hectare, percent herb cover and
canopy closure. Species richness of shrubs was also calculated as average number of shrub
species present per quadrat. In addition, a Pearson's correlation table was completed for the
above variables in order to reduce redundancy in the data for further analysis; due to multiple
comparisons, significance values were calculated with Bonferroni-Dunn test.
Avian densities. To investigate the differences in bird abundance and community,
12

Courtney E. McCuskerGrant #08-021W
program DISTANCE 5.0 (Thomson et al. 2006) was used to estimate densities (birds per
hectare) of birds. DISTANCE models the decline in detectability with distance from the
observer of a species or group to generate an estimate of population density (Buckland et al.
2001). By calculating a detection probability, the program can take into account that an observer
is unlikely to see or hear all birds during a point count. Due to low sample size, individual
detection functions for each site were not available for computation, therefore all data was
pooled to estimate detection functions. DISTANCE computations are robust to pooling of data
across heterogeneity (Thomson et al. 2006). However, to incorporate some heterogeneity into
the estimates, DISTANCE allows the addition of covariates that may play a role in an observers
ability to detect a bird (Buckland et al. 2001, Buckland et al. 2004). I included, year, the average
percent total shrub cover per site and the presence/absence of Lonicera spp. as covariates that
may effect detection probabilities.
DISTANCE was used to estimate the density of total bird population, individual species,
family guilds, habitat use guilds (summer only) and diet guilds (winter only). Since DISTANCE
requires a minimum number of detections to obtain reliable estimates of density, estimates could
not be obtained for all individual species. In order to incorporate more species into the analysis,
species were classified into the above guilds based on The Birds of North America Online (Poole
2005). During the summer, I expect birds to be effected by the change in habitat due to Lonicera
spp., therefore species were classified into habitat use guilds. These guilds include: Upper-story-
species that nest and forage in the canopy, Mid-story- species that either nest or forage in both
the canopy and the shrub layers and Low-story- species that forage and nest low to the ground
and in shrubs. During the winter, I expect birds to respond to the novel food source Lonicera
13

Courtney E. McCuskerGrant #08-021W
spp. provides, so I chose to place species into diet guilds. These diet guilds were not strict diet
classifications due to the wide range of items birds will consume during the winter, therefore I
chose to place species into guilds based on whether or not they will consume fruits during the
winter, including the consumption of Lonicera spp. fruits. These categories included: Non-
frugivorous- species that never consume fruits, Facultative frugivorous- species that will eat
fruits if they were present, but not likely to seek them out and are a small proportion of their
winter diet, and Frugivorous- species that consume a substantial amount of fruit during the
winter. Akaike's Information Criterion (AIC) was used to chose between the models for the
individual species or guilds.
Once generated, the average density estimates were compared between Lonicera spp.
sites and native sites with repeated measure ANOVAs to address potential year*site effect. To
further investigate the role of Lonicera spp. on the avian community, density estimates of the
guilds (habitat use in the summer and diet in the winter) were also analyzed with robust
regression with M-estimators and relevant habitat variables (robust regression were computated
due to small sample size and the inclusion of outliers in the data). Since the guilds were
specifically chosen to address which birds might be affected by Lonicera spp., only these were
used in the regressions. Each robust regression included one of the following habitat variables:
contiguous area, sampled area, percent total shrub cover, percent Lonicera spp. cover, canopy
closure and shrub species richness. For each regression, Akaike Information Criterion values
were calculated for small sample size (AICc) and used to compare models. Models with ΔAICc
values less than two were considered competitive and were used to explain the data.
To obtain insight into the avian community structure, the individual species density
14

Courtney E. McCuskerGrant #08-021W
estimates and the Paridae family guild were used in a principle component analysis (PCA)
ordination. The Paridae family guild was included due to the similarity of the three species
included in it, tufted titmouse, Carolina and black-capped chickadees. Due to low sample size,
none of the other families could be calculated without one of the individual species that was
already included in the PCA and therefore no other families could be used. Based on the PCA, I
calculated factor scores for each site and used robust regressions with M-estimators to determine
whether Lonicera spp. cover and/or total shrub cover was driving the variation in the factor
scores. In addition, avian species richness (average number of species detected per point) were
compared between the two types of sites using univariate t-tests. Due to the lack of consistent
responses of birds to the screech owl recording in the second winter, the data was considered
unreliable and further analysis could not be completed on it.
RESULTS
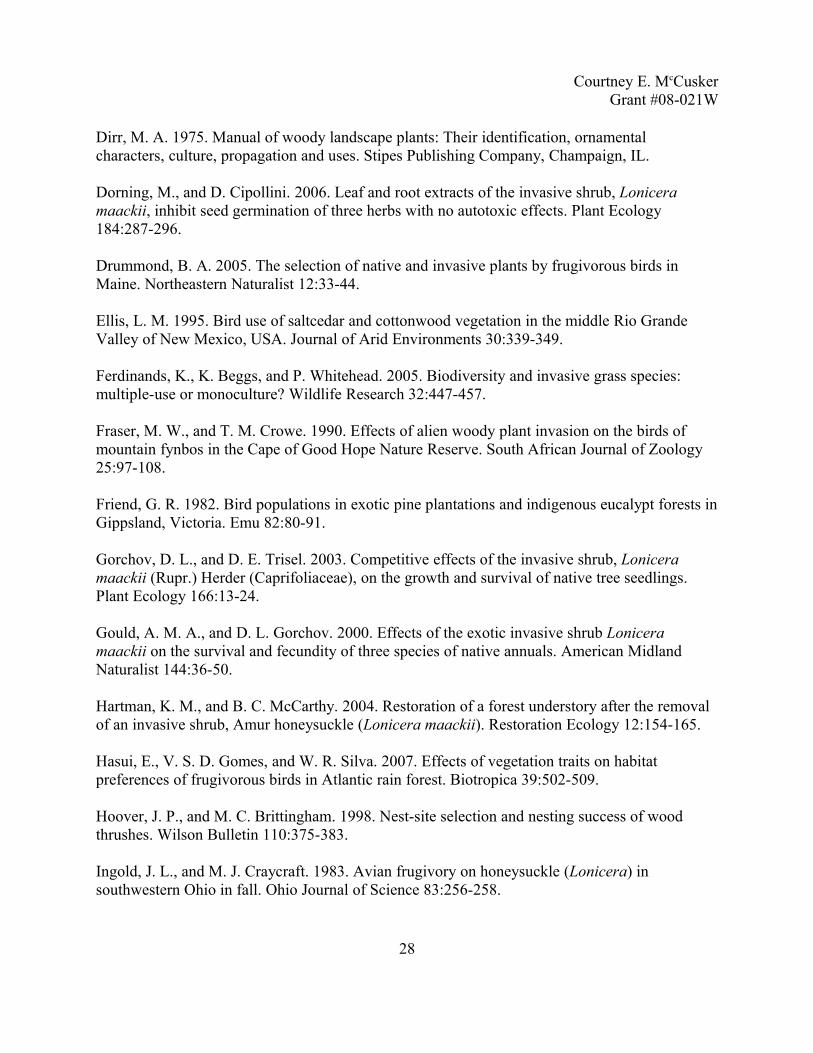
Vegetation surveys. Of the nine habitat characteristics that were measured at each site,
total shrub stems per hectare, percentage of total shrub cover, Lonicera spp. stems per hectare
and percent Lonicera spp. cover were different between the two types of sites. In both areas,
trees per hectare, canopy cover and age were not different between the sites (Table 3). As
expected, native sites had little or no Lonicera spp. present. The native sites had less total shrub
cover, which appears to be the main difference between the two types of sites. The generated
correlation matrix reveals that percent Lonicera spp. cover was negatively correlated with
percent of other shrub species (r = -0.872, p= 0.045) and was positively correlated to Lonicera
spp. stem density (r = 0.951, p= 0.001). Both of these variables were not used for further
15

Courtney E. McCuskerGrant #08-021W
analyses. While not significant, percent total shrub cover and total shrub stems per hectare were
correlated (r = 0.819, p= 0.169); and it was decided that only percent cover would be retained for
other analyses. In addition, percent total shrub cover and percent Lonicera spp. were loosely
correlated (r = 0.837, p= 0.113), but both were retained since Lonicera spp. is the focus of this
study.
Summer avian communities. Over the two summers, I conducted 152 point counts (80 in
Lonicera spp. sites and 72 in native sites) and recorded 68 species and 2076 individuals. A list
of the 68 birds species can be found in Table 4. Sixteen species, nine family groups, three
habitat use guilds and total bird density were analyzed with DISTANCE. Average density
estimates over the two summers in Lonicera spp. and native sites can be found in Table 5.
Differences between the density estimates were analyzed with repeated measures ANOVA
(Table 6). Four species (American robin, blue jay, gray catbird and northern cardinal) show
significant differences between Lonicera spp. and native sites. All four demonstrated increased
density in the Lonicera spp. sites over both years. In contrast, the density the eastern wood-
pewees was lower in Lonicera spp. sites. Two family groups, Mimidae and Turdidae, were more
dense in Lonicera spp. sites. Densities of the Paridae and Tyrannidae were lower in Lonicera
spp. sites. Densities of birds in the upper-story guild were similar in both sites over both years,
however birds in the mid-story guild were more dense in Lonicera spp. sites and members of the
lower-story guild showed a trend for increased densities in Lonicera spp. sites. Total bird
density was similar between the Lonicera spp. sites and native sites over both years. Several
species have differences in densities between the two years, however there were no strong site
and year interactions.
16
Courtney E. McCuskerGrant #08-021W
Robust regression with M-estimators of the habitat use guilds indicate that different
habitat variables are affecting the habitat guilds (Table 7). In 2006, the upper-story guild was
most effected by the size of the contiguous habitat, while in 2007, contiguous habitat and percent
of total shrub cover affected upper-story density estimates. The mid-story guild did not appear to
be driven by any of the habitat variables in 2006 and only contiguous area in 2007. The lower-
story guild appears to be most affected by percent total shrub cover and percent Lonicera spp. in
2006 and only percent total shrub cover in 2007.
The PCA for the summer species density estimates, including the Paridae family, indicate
that the summer avian communities are different between Lonicera spp. and native sites in both
years (Figure 2). Based on the Kaiser-Guttman criterion of eigenvalues >1 and the scree plot
criterion (McGarigal et al. 2000), the first five components were retained in 2006, explaining
89% of the data. In 2007, five components were also retained, explaining 86% of the data.
Component loadings >0.5 were considered important for the differences between the types of
sites. In both years, most of the component loadings >0.5 were in the first two components and
explained 55% of the data in 2006 and 49% in 2007. Regression of the first factor scores with
percent Lonicera spp. and percent total shrub cover in both years indicates that in 2006, total
shrub cover was predictive of the community of birds (R2=0.678, F1,8=16.817, p=0.003). In
2007, the first factor score was not as predictive, but percent cover of Lonicera spp. (R2=0.315,
F1,8=3.682, p=0.091) was a better predictor than percent total shrub cover (R2=0.091, F1,8=1.983,
p=0.197) . Mean species richness values were nearly identical for Lonicera spp. sites and native
sites over both years (Figure 3).
Winter avian communities. Over the two winters, I conducted 380 point counts (200 in
17

Courtney E. McCuskerGrant #08-021W
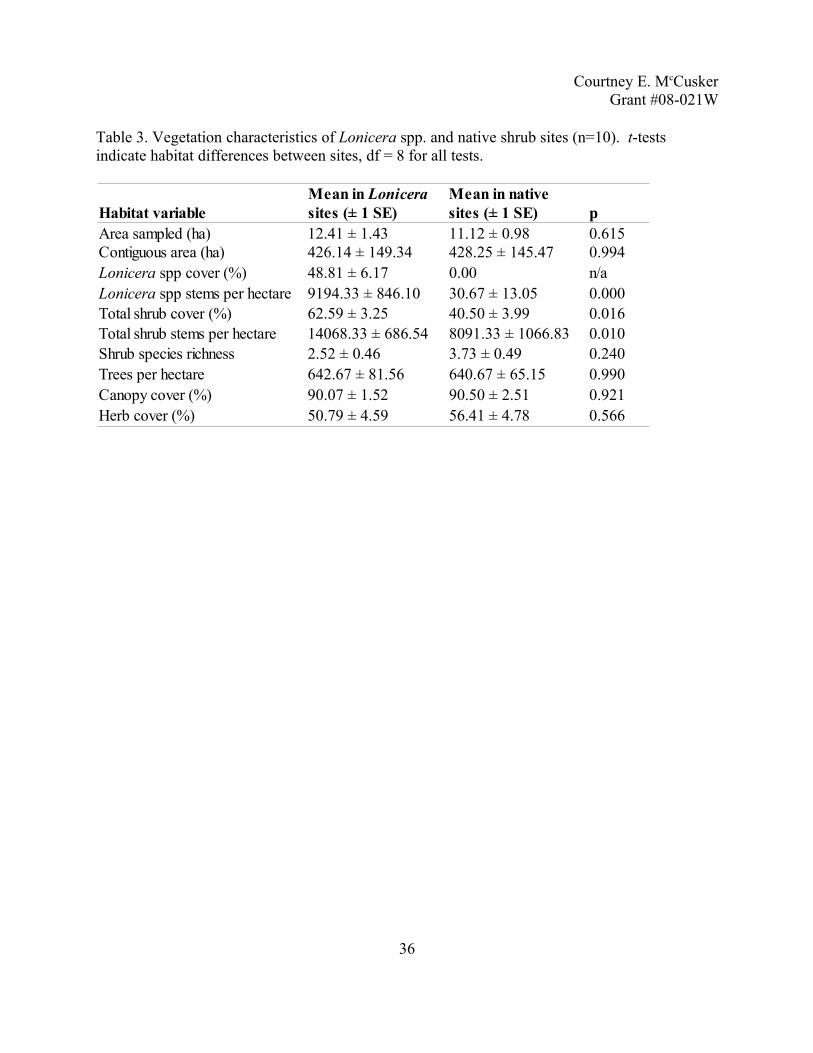
Lonicera spp. sites and 180 in native sites) and recorded 36 species and 2693 individuals. List of
species can be found in Table 8. Eight species, five families, three diet guilds and total bird
density were analyzed using Distance to obtain density estimates (Table 9). These densities
were used in repeated measures ANOVAs (Table 10). No species were significantly different
between the two types of sites, however four species (American goldfinch, American robin,
downy woodpecker and northern cardinal) showed strong trends toward increased in density in
Lonicera spp. sites. Of the family groups, Fringillidae only had a strong difference between the
two types of sites, while Emberzidae and Turdidae showed minor differences. All three families
have increased densities in Lonicera spp. sites. Of the three diet guilds, only the frugivorous
guild showed a marginal increase in Lonicera spp. sites. Densities of three species (blue jay,
Carolina wren and red-bellied woodpecker) were different between years, but only total bird
density showed an interaction between site and year. This interaction can be seen in Figure 4.
The diet guilds were used in robust regressions with M-estimators (Table 11). Results
from the regressions indicate that in 2006-2007 the density of the non-frugivorous guild and the
frugivorous guild are both affected by percent total shrub cover and percent Lonicera spp cover.
Both guilds were positively affected by both shrub cover estimates. The density of the
facultative frugivorous guild is affected positively by the contiguous area and negatively by the
sampled area. In 2007-2008, we saw less conclusive evidence for what habitat variable is
determining density of any of the three guilds.
The winter PCA, with individual species densities and the Paridae family, indicate that
there is no difference between the two communities of birds (Figure 5). Following the same
criteria from the summer PCAs, in 2006-2007, the first four components were retained and
18

Courtney E. McCuskerGrant #08-021W
explained 88% of the data, in 2007-2008 the first three components were retained and explained
84% of the data. However, similar to the summer PCAs, the first two components contained
most of the component loadings >0.5. These two factor loadings explained 53% of the variation
in 2006 and 64% of the variation in 2007. Comparing the first factor score to percent Lonicera
spp. cover and total shrub cover with robust regression with M-estimators does not indicate a
pattern that is related to the percent cover of Lonicera spp. (2006-2007: R2=0.000, F1,8=0.081,
p=0.783; 2007-2008: R2=0.000, F1,8=0.011, p=0.918) or total shrub cover (2006-2007: R2=0.089,
F1,8=0.917, p=0.366; 2007-2008: R2=0.152, F1,8=1.478, p=0.259). Over the two winters, mean
species richness values between sites were not different from each other (Figure 6).
DISCUSSION
Summer communities. Invasive Lonicera spp. is impacting the avian populations in east
central Illinois forests during the summer and winter. During the summer months, we saw no
difference in total bird density between Lonicera spp. sites and native shrub sites. However,
birds in the families Turdidae and Mimidae, particularly American robins and gray catbirds, as
well as northern cardinals were found at much higher densities in the Lonicera spp. areas. These
are all birds that commonly use shrubs as nesting substrate. Shrub density was increased in the
Lonicera spp. sites, indicating that these areas provide more nesting sites and substrate for these
species of birds. Previous studies have shown that these birds do indeed use Lonicera spp. as a
nesting substrate (Whelan and Dilger 1992; Schmidt and Whelan 1999; Borgmann and
Rodewald 2004). Lonicera spp. in this case is positively affecting these birds through
modification of the habitat, by increasing shrub density and creating more nesting sites. Even
19

Courtney E. McCuskerGrant #08-021W
though the native sites did provide a shrub layer, the density of shrub cover was much lower and
therefore fewer nest sites were available.
Despite this apparent benefit of invasive Lonicera spp., the use of Lonicera spp. for
nesting may not be beneficial in the long-term. Previous research has indicated that American
robin and northern cardinals nesting in Lonicera spp. experience higher daily predation rates and
daily chick mortality rates (Schmidt and Whelan 1999; Borgmann and Rodewald 2004). This
may be due to lower nest heights and/or earlier nest initiation in Lonicera spp., which may make
nests more susceptible to predation. Birds that nest in Lonicera spp. may be falling into an
ecological trap; nesting in Lonicera spp. may lead to a sink population that is responding to an
over exaggerated cue (shrub density) that in the long-term may be detrimental.
In addition to the increased densities in shrub nesting birds, densities of blue jays also
were higher in Lonicera spp. sites. While they do not nest in shrubs, blue jays are a common
nest predator in Illinois and they may be benefiting from the increase in shrub nesting birds that
are its prey (Schmidt and Whelan 1998; Schmidt and Whelan 2005), thereby indirectly
benefiting from the presence of Lonicera spp.
The habitat use guilds indicate that the mid-story and lower-story birds were at higher
density in Lonicera spp. sites. Both of these guilds include birds that use shrubs for either
nesting or foraging substrate. However, we find that only the lower-story guild appears to be
responding to the percent of total shrub cover and/or the percent of Lonicera spp. cover while the
mid-story birds appear to be more responsive to the size of the sites. The American robin, gray
catbird and northern cardinal are all included in the lower-story guild and are attracted to areas
that have higher shrub density. Total shrub cover and Lonicera spp. cover are correlated
20

Courtney E. McCuskerGrant #08-021W
characteristics, so it is not surprising that both were included in model selection in the first
summer.
The upper-story guild of birds was most affected by the size of the site in both years, but
also negatively affected by the percent of total shrub the second year. This is not surprising as
two groups of upper-story birds appear to avoid Lonicera spp. areas. The Paridae and
Tryannidae families both show trends for decreases in density in Lonicera spp. sites. A
Tryannidae family member, the eastern wood-pewee, was rarely found in Lonicera spp. sites.
Studies involving the removal of understory shrubs have shown similar effects on eastern wood-
pewees; once the understory is removed the densities of these birds increased (Stauffer and Best
1980; Wilson et al. 1995; Rodewald and Smith 1998). Due to the nature of the eastern wood-
pewee's aerial foraging strategy, the dense Lonicera spp. understory may prohibit efficient
foraging (Rodewald and Smith 1998).
These differences in bird densities have led to a change in the summer avian community
structure. As we saw in the principal component analysis, the two groups of sites appear to
separate themselves based on the amount of total shrub cover and Lonicera spp. cover. This is
most likely due to the increase of lower-story birds and a decrease in a few upper-story birds in
Lonicera spp. sites leading to an overall change in the community. Species richness indicated
that the number of species seen in either site was similar, but the species observed are different at
the different types of site. Several other studies have shown similar trends, where some groups
of birds benefit from the invasive species and others are negatively affected (Friend 1982; Fraser
and Crowe 1990; Mitra and Sheldon 1993; Ellis 1995; Benoit and Askins 1999; Sax 2002). The
presence of Lonicera spp. leads to an increase in lower-story nesting birds, but not upper-story
21

Courtney E. McCuskerGrant #08-021W
birds in the summer.
Winter communities. During the winter of 2006-2007 we saw a large increase in the total
number of birds in the Lonicera spp. sites, as was predicted based on the winter food resources
provided by Lonicera spp, but we did not see this difference in the winter of 2007-2008.
However, bird densities were similar between native and Lonicera spp. sites in the winter of
2007-2008 due to the increased density of birds in the native sites. In the spring of 2007, east
central Illinois experienced a late hard freeze that appeared to have damaged some of the
Lonicera spp. bushes, leading to a visual decrease in the number of fruits that were produced by
the plants (C. McCusker, pers. obs.). There were, however, some Lonicera spp. fruit in all of the
Lonicera spp. sites, though in reduced abundance at some sites. In addition, whether or not
related to the freeze, multi-flora rose appeared to produce a larger number of rose hips during the
fall and winter of 2007-2008 than in the previous year. Multi-flora rose was found in all the sites
in this study and produced rose hips that were also available to birds during the winter months
and which, more importantly, are readily consumed by frugivorous birds (Schmid 1958; Morgan
and Gates 1982; Stiles 1982). Fruit from the multi-flora rose never appeared to be as abundant
as Lonicera spp. fruits, however rose did provide a source of food in the native sites that was less
abundant in the first winter and which may have ultimately led to an increase in birds in the
native areas during the second winter. We can see that something changed from the first year to
the second in the habitat characteristics that predict the diet classes. In the first year, the birds in
the frugivorous guild were being driven by the amount of Lonicera spp. cover and total shrub
cover, however in the second year there is no clear predictor of the distribution of the
frugivorous birds, or for that matter members of the other two diet guilds. Despite the
22

Courtney E. McCuskerGrant #08-021W
differences over years in total density of birds and bird guilds some species still maintained a
preference for the Lonicera spp. sites.
American goldfinches, American robins, downy woodpeckers and northern cardinals
were all more common in Lonicera spp. sites. These species will consume Lonicera spp. fruits
(Bergtold 1930; Ingold and Craycraft 1983; Bartuszevige and Gorchov 2006 ). None of the
individual species showed decreases in Lonicera spp. sites. The three family groups that were
more dense in Lonicera spp. sites, Emberzidae, Fringillidae and Turdidae, all include species that
readily consume fruits during the winter. Other studies have shown that members of the
Turdidae family, including the American robin, are primary consumers and dispersers of
Lonicera spp. fruits and may be contributing to the spread of the plant (Bergtold 1930; Ingold
and Craycraft 1983; Bartuszevige and Gorchov 2006).
Over the two winters several species were observed consuming Lonicera spp. fruits,
including northern cardinals, American robins, American goldfinches, cedar waxwings, purple
finches and house finches (C. McCusker pers. obs.). Cedar waxwings are another primary
consumer of Lonicera spp. fruits (Ingold and Craycraft 1983; Drummond 2005; Bartuszevige
and Gorchov 2006) and research has shown that their consumption of Lonicera spp. fruits often
leads to changes in the color of their rectrices from yellow to orange (Mulvihill et al. 1992;
Witmer 1996). Cedar waxwings are common in central Illinois in the winter and were expected
to be numerous in these areas, but in this study their sample size was unexpectedly low and
density estimates could not be obtained. However, observations of cedar waxwings only
occurred in Lonicera spp. sites and almost all were observed in Lonicera spp. bushes, indicating
a clear preference for sites with Lonicera spp.
23

Courtney E. McCuskerGrant #08-021W
Despite the fact that a few species show a preference for Lonicera spp. sites during the
winter, the overall community structure was not different between the two types of sites. This is
not unexpected, as birds during the winter are very mobile and may be only visiting a site for a
couple of days depending on the availability of appropriate resources. Those species that
favored Lonicera spp. sites may have found resources in the sites (like Lonicera spp. fruits) that
provoked them to stay and increase in density. Overall, the winter avian community does not
appear to be affected by the presence of Lonicera spp. A few species do show preferences for
the Lonicera spp. indicating a positive affect from the invasive plant, however, unlike during the
summer, no species or groups appear to be negatively affected by Lonicera spp.
The short-term effects of Lonicera spp. invasion may lead to an increase in density of
bird species in a localized area during the winter, however as this invasive food source becomes
persistent over time, long-term effects may lead to changes in migration patterns, range
expansion and survival of frugivorous birds (White and Stiles 1992). Several factors may
influence range expansion, one possibility is the provision of extra food sources, during the
winter. Due to the fact that food sources are most limited in the winter, if an extra food source is
provided for birds they may be able to use this resource to survive colder temperatures and thus
expand northward. Northern mockingbirds have been found to expand their range during the
winter with the provision of multi-flora rose hips (Stiles 1982) and invasive Lonicera spp. may
be providing a similar limited food source and facilitating range expansion of other
overwintering birds.
Implications for management. Due to the negative effects of Lonicera spp. on the native
plant community (Nyboer 1992; Woods 1993; Gould and Gorchov 2000; Collier et al. 2002;
24

Courtney E. McCuskerGrant #08-021W
Gorchov and Trisel 2003; Miller and Gorchov 2004; Dorning and Cipollini 2006; Cipollini et al.
2008), it is actively being removed, an action that may affect both summer and winter bird
communities. Forested areas invaded by Lonicera spp. often have little or no other native shrub
layer, leading to a complete loss of an understory when Lonicera spp. is removed. This can lead
to a loss of nesting substrate for birds during the summer and a loss of a limited food resource
during the winter. As this study indicates, some birds may be negatively affected by the removal
of Lonicera spp, such as American robins and northern cardinals, but some, like the eastern
wood-pewee, may benefit. While ultimately the removal of Lonicera spp. may prevent nesting
birds from falling into an ecological trap (Schmidt and Whelan 1999; Borgmann and Rodewald
2004), total loss of a shrub layer may discourage many birds from using an area. Land managers
removing invasive Lonicera spp. may need to consider replacement of Lonicera spp. with native
shrubs that can provide comparable nesting substrate and food resources. Lonicera spp. is a
difficult plant to eradicate and control methods may need to go beyond simple removal of the
species where it may take several years for a native shrub understory to establish (Luken et al.
1997; Hartman and McCarthy 2004; Runkle et al. 2007). Management strategies may have to
include planting of native shrubs that can supply nesting substrates and food resources as well as
establish a source for the spread of native shrub seeds.
SUMMARY
In summary, during the summer, shrub nesting birds preferred areas with Lonicera spp.
while the eastern wood-pewee avoided these areas. Total summer bird density was not different
between the two types of sites, however the community of birds changed between them. Species
25
Courtney E. McCuskerGrant #08-021W
richness was similar between the sites.
During the winter, frugivorous birds tended to prefer areas with Lonicera spp., however
they showed differences between the two years. Total winter bird density was also different over
years, in the first winter, density of birds was much higher in Lonicera spp. sites, while in the
second winter the two sites had similar densities of birds. No birds appeared to avoid Lonicera
spp. sites in the winter. The community of birds and species richness of birds was similar
between the two types of sites.
26

Courtney E. McCuskerGrant #08-021W
LITERATURE CITED
Armstrong, A. J., and H. J. van Hensbergen. 1994. Comparison of avifaunas in Pinus radiata habitats and indigenous riparian habitat at Jonkershoek, Stellenbosch. South African Journal of Wildlife Research 24:48-55.
Bartuszevige, A. M., and D. L. Gorchov. 2006. Avian seed dispersal of an invasive shrub. Biological Invasions 8:1013-1022.
Benoit, L. K., and R. A. Askins. 1999. Impact of the spread of Phragmites on the distribution of birds in Connecticut tidal marshes. Wetlands 19:194-208.
Bergtold, W. H. 1930. Intoxicated robins. Auk 47:571.
Borgmann, K. L., S. F. Pearson, D. J. Levey, and C. H. Greenberg. 2004. Wintering yellow-rumped warblers (Dendroica coronata) track manipulated abundance of Myrica cerifera fruits. Auk 121:74-87.
Borgmann, K. L., and A. D. Rodewald. 2004. Nest predation in an urbanizing landscape: The role of exotic shrubs. Ecological Applications 14:1757-1765.
Buckland, S. T., D. R. Anderson, K. P. Burnham, J. L. Laake, D. L. Borchers, and L. Thomas 2001. Introduction to distance sampling: Estimating abundance of biological populations. Oxford University Press Inc., New York.
Buckland, S. T., D. R. Anderson, K. P. Burnham, J. L. Laake, D. L. Borchers, and L. Thomas 2004. Advanced distance sampling: Estimating abundance of biological populations. Oxford University Press Inc., New York.
Cipollini, D., R. Stevenson, S. Enright, A. Eyles, and P. Bonello. 2008. Phenolic metabolites in leaves of the invasive shrub, Lonicera maackii, and their potential phytotoxic and anti-herbivore effects. Journal of Chemical Ecology 34:144-152.
Collier, M. H., J. L. Vankat, and M. R. Hughes. 2002. Diminished plant richness and abundance below Lonicera maackii, an invasive shrub. American Midland Naturalist 147:60-71.
Dean, W. R. J., M. D. Anderson, S. J. Milton, and T. A. Anderson. 2002. Avian assemblages in native Acacia and alien Prosopis drainage line woodland in the Kalahari, South Africa. Journal of Arid Environments 51:1-19.
Deering, R. H., and J. L. Vankat. 1999. Forest colonization and developmental growth of the invasive shrub Lonicera maackii. American Midland Naturalist 141:43-50.
27
Courtney E. McCuskerGrant #08-021W
Dirr, M. A. 1975. Manual of woody landscape plants: Their identification, ornamental characters, culture, propagation and uses. Stipes Publishing Company, Champaign, IL.
Dorning, M., and D. Cipollini. 2006. Leaf and root extracts of the invasive shrub, Lonicera maackii, inhibit seed germination of three herbs with no autotoxic effects. Plant Ecology 184:287-296.
Drummond, B. A. 2005. The selection of native and invasive plants by frugivorous birds in Maine. Northeastern Naturalist 12:33-44.
Ellis, L. M. 1995. Bird use of saltcedar and cottonwood vegetation in the middle Rio Grande Valley of New Mexico, USA. Journal of Arid Environments 30:339-349.
Ferdinands, K., K. Beggs, and P. Whitehead. 2005. Biodiversity and invasive grass species: multiple-use or monoculture? Wildlife Research 32:447-457.
Fraser, M. W., and T. M. Crowe. 1990. Effects of alien woody plant invasion on the birds of mountain fynbos in the Cape of Good Hope Nature Reserve. South African Journal of Zoology 25:97-108.
Friend, G. R. 1982. Bird populations in exotic pine plantations and indigenous eucalypt forests in Gippsland, Victoria. Emu 82:80-91.
Gorchov, D. L., and D. E. Trisel. 2003. Competitive effects of the invasive shrub, Lonicera maackii (Rupr.) Herder (Caprifoliaceae), on the growth and survival of native tree seedlings. Plant Ecology 166:13-24.
Gould, A. M. A., and D. L. Gorchov. 2000. Effects of the exotic invasive shrub Lonicera maackii on the survival and fecundity of three species of native annuals. American Midland Naturalist 144:36-50.
Hartman, K. M., and B. C. McCarthy. 2004. Restoration of a forest understory after the removal of an invasive shrub, Amur honeysuckle (Lonicera maackii). Restoration Ecology 12:154-165.
Hasui, E., V. S. D. Gomes, and W. R. Silva. 2007. Effects of vegetation traits on habitat preferences of frugivorous birds in Atlantic rain forest. Biotropica 39:502-509.
Hoover, J. P., and M. C. Brittingham. 1998. Nest-site selection and nesting success of wood thrushes. Wilson Bulletin 110:375-383.
Ingold, J. L., and M. J. Craycraft. 1983. Avian frugivory on honeysuckle (Lonicera) in southwestern Ohio in fall. Ohio Journal of Science 83:256-258.
28

Courtney E. McCuskerGrant #08-021W
Jones, C. G., J. H. Lawton, and M. Shachak. 1997. Positive and negative effects of organisms as physical ecosystem engineers. Ecology 78:1946-1957.
Kwit, C., D. J. Levey, C. H. Greenberg, S. F. Pearson, J. P. McCarty, and S. Sargent. 2004. Cold temperature increases winter fruit removal rate of a bird-dispersed shrub. Oecologia 139:30-34.
Lemmon, P. E. 1956. A spherical densiometer for estimating forest overstory density. Forest Science 2:314-320.
Lochmiller, R. L. 1978. Privet as a potential winter food supplement for songbirds. Bird-banding 49:279-280.
Luken, J. O., L. M. Kuddes, and T. C. Tholemeier. 1997. Response of understory species to gap formation and soil disturbance in Lonicera maackii thickets. Restoration Ecology 5:229-235.
Luken, J. O., and J. W. Thieret. 1996. Amur honeysuckle, its fall from grace. Bioscience 46:18-24.
Martin, T. E., C. R. Paine, C. J. Conway, W. M. Hochachka, P. Allen, and W. Jenkins. 1997. BBIRD field protocol. Montana Cooperative Wildlife Research Unit, University of Montana, Missoula, Montana, USA.
McCarty, J. P., D. J. Levey, C. H. Greenberg, and S. Sargent. 2002. Spatial and temporal variation in fruit use by wildlife in a forested landscape. Forest Ecology and Management 164:277-291.
McEvoy, N. L., and R. D. Durtsche. 2004. Effect of the invasive shrub Lonicera maackii (Caprifoliaceae; Amur honeysuckle) on autumn herpetofauna biodiversity. Journal of the Kentucky Academy of Science 65:27-32.
McGarigal, K., S. Cushman, and S. Stafford 2000. Multivariate statistics for wildlife and ecology research. Springer, New York.
McRae, W. A. 1980. Unusual bobwhite foods on abandoned piedmont farmlands. Georgia Journal of Science 38:49-54.
Miller, K. E., and D. L. Gorchov. 2004. The invasive shrub, Lonicera maackii, reduces growth and fecundity of perennial forest herbs. Oecologia 139:359-375.
Mitra, S. S., and F. H. Sheldon. 1993. Use of an exotic tree plantation by Bornean lowland forest birds. Auk 110:529-540.
29

Courtney E. McCuskerGrant #08-021W
Moegenburg, S. M., and D. J. Levey. 2003. Do frugivores respond to fruit harvest? An experimental study of short-term responses. Ecology 84:2600-2612.
Morgan, K. A., and J. E. Gates. 1982. Bird population patterns in forest edge and strip vegetation at Remington Farms, Maryland. Journal of Wildlife Management 46:933-944.
Mulvihill, R. S., K. C. Parkes, R. C. Leberman, and D. S. Wood. 1992. Evidence supporting a dietary basis for orange-tipped rectrices in the cedar waxwing. Journal of Field Ornithology 63:212-216.
Nyboer, R. 1992. Vegetation management guideline: Bush honeysuckles - Tatarian, Morrow's, Belle, and Amur Honeysuckle (Lonicera tatarica L., L. morrowii Gray, L. x bella Zabel, and L. maackii [Rupr.] Maxim.). Natural Areas Journal 12:218-219.
Oliveira, P., D. Menezes, M. Jones, and M. Nogales. 2006. The influence of fruit abundance on the use of forest and cultivated field habitats by the endemic Madeira laurel pigeon Columba trocaz: Implications for conservation. Biological Conservation 130:538-548.
Pimentel, D., L. Lach, R. Zuniga, and D. Morrison. 2002. Environmental and economic costs of nonindigenous species in the United States. BioScience 50:53-65.
Poole, A. E. 2005. The Birds of North America Online: http://bna.birds.cornell.edu/BNA/. Cornell Laboratory of Ornithology, Ithaca, NY.
Pringle, J. S. 1973. Lonicera maackii Caprifoliaceae adventive in Ontario. Canadian Field-Naturalist 87:54-55.
Rey, P. J. 1995. Spatiotemporal variation in fruit and frugivorous bird abundance in olive orchards. Ecology 76:1625-1635.
Rodewald, P. G., and K. G. Smith. 1998. Short-term effects of understory and overstory management on breeding birds in Arkansas oak-hickory forests. Journal of Wildlife Management 62:1411-1417.
Rodriguez, L. F. 2006. Can invasive species facilitate native species? Evidence of how, when, and why these impacts occur. Biological Invasions 8:927-939.
Runkle, J. R., A. DiSalvo, Y. Graham-Gibson, and M. Dorning. 2007. Vegetation release eight years after removal of Lonicera maackii in west-central Ohio. Ohio Journal of Science 107:125-129.
Sax, D. F. 2002. Equal diversity in disparate species assemblages: a comparison of native and exotic woodlands in California. Global Ecology and Biogeography 11:49-57.
30

Courtney E. McCuskerGrant #08-021W
Sax, D. F., B. P. Kinlan, and K. F. Smith. 2005. A conceptual framework for comparing species assemblages in native and exotic habitats. Oikos 108:457-464.
Schmid, F. C. 1958. Cedar waxwings and fox sparrows feed on multiflora rose. Wilson Bulletin 70:194-195.
Schmidt, K. A., and C. J. Whelan. 1998. Predator-mediated interactions between and within guilds of nesting songbirds: Experimental and observational evidence. American Naturalist 152:393-402.
Schmidt, K. A., and C. J. Whelan. 1999. Effects of exotic Lonicera and Rhamnus on songbird nest predation. Conservation Biology 13:1502-1506.
Schmidt, K. A., and C. J. Whelan. 2005. Quantifying male wood thrush nest-attendance and its relationship to nest success. Condor 107:138-144.
Spencer, C. N., B. R. McClelland, and J. A. Stanford. 1991. Shrimp stocking, salmon collapse, and eagle displacement. Bioscience 41:14-21.
Stauffer, D. F., and L. B. Best. 1980. Habitat selection by birds of riparian communities: Evaluating effects of habitat alterations. Journal of Wildlife Management 44:1-15.
Stiles, E. W. 1980. Patterns of fruit presentation and seed dispersal in bird-disseminated woody plants in the eastern deciduous forest. American Naturalist 116:670-688.
Stiles, E. W. 1982. Expansions of mockingbird and multiflora rose in the northeastern United States and Canada. American Birds 36:358-364.
Thomas, L., J. L. Laake, S. Strindberg, F. F. C. Marques, S. T. Buckland, D. L. Borchers, D. R. Anderson, K. P. Burnham, S. L. Hedley, J. H. Pollard, J. R. B. Bishop, and T. A. Marques. 2006. Distance 5.0. Release Beta 5, Research Unit for Wildlife Population Assessment, University of St. Andrews, UK.
Trisel, D. E., and D. L. Gorchov. 1994. Regional distribution, ecological impact and leaf phenology of the invasive shrub, Lonicera maackii. Bulletin of the Ecological Society of America 75:231-232.
Vellend, M. 2002. A pest and an invader: White-tailed deer (Odocoileus virginianus Zimm.) as a seed dispersal agent for honeysuckle shrubs (Lonicera L.). Natural Areas Journal 22:230-234.
Whelan, C. J., and M. L. Dilger. 1992. Invasive, exotic shrubs: A paradox for natural area managers? Natural Areas Journal 12:109-110.
31

Courtney E. McCuskerGrant #08-021W
White, D. W., and E. W. Stiles. 1992. Bird dispersal of fruits of species introduced into eastern North America. Canadian Journal of Botany 70:1689-1696.
Williams, C. E., J. J. Ralley, and D. H. Taylor. 1992. Consumption of seeds of the invasive Amur honeysuckle, Lonicera maackii (Rupr.) Maxim., by small mammals. Natural Areas Journal 12:86-89.
Wilson, C. W., R. E. Masters, and G. A. Bukenhofer. 1995. Breeding bird response to pine grassland community restoration for red-cockaded woodpeckers. Journal of Wildlife Management 59:56-67.
Witmer, M. C. 1996. Consequences of an alien shrub on the plumage coloration and ecology of cedar waxwings. Auk 113:735-743.
Woods, K. D. 1993. Effects of invasion by Lonicera tatarica L on herbs and tree seedlings in 4 New England forests. American Midland Naturalist 130:62-74.
Wyman, D. 1949. Shrubs and vines for American gardens. MacMillan Company, New York.
32

Courtney E. McCuskerGrant #08-021W
TABLES
Table 1. Locations of the ten sites used in this study.
33
Site name Site Latitude Longitude Section Township Range Township NamePhilips Tract 1 40.129224015 -88.151451889 2 19N R9E 3PM UrbanaTaylor (private property) 2 39.982803063 -88.657124480 29 18N R5E 3PM Willow BranchKickapoo State Park 3 40.158968372 -87.746124342 32 20N R12W 2PM OakwoodHomer Lake Forest Preserve 4 40.065357853 -87.981903171 31 19N R14W 2PM South HomerNanney Research Area 5 39.886419475 -88.178725932 34 17N R9E 3PM CrittendenRutan Research Area 6 40.073234746 -87.908506449 26 19N R14W 2PM VanceAllerton Park 7 40.001201844 -88.634305710 21 18N R5E 3PM Willow BranchMiddle Fork Woods Nature Preserve 8 40.142647885 -87.744746190 5 19N R12W 2PM OakwoodVermilion River Observatory-A 9 40.065283002 -87.557355920 36 19N R11W 2PM DanvilleVermilion River Observatory-B 10 40.068148775 -87.561609400 36 19N R11W 2PM Danville

Courtney E. McCuskerGrant #08-021W
Table 2. Shrubs and tree saplings (dbh < 7cm) recorded in the ten sites. X indicates a species was found in at least one plot.
34
Native sitesScientific name Common name 1 2 3 4 5 6 7 8 9 10Acer negundo Boxelder XAcer saccharum Sugar maple X X X XAesculus glabra Ohio buckeye X XAilanthus altisima Tree of heaven XCarya cordiformes Bitternut hickory XCarya glabra Pignut hickory X XCarya ovalis Red hickory XCarya ovata Shagbark hickory X XCeltis occidentalis Common hackberry X X X XCercis canadensis Eastern redbud XCornus drummondi Roughleaf dogwood X X X X X XCornus florida Flowering dogwood XCrataegus crus-galli Cockspur hawthorn XCrataegus mollis Downy hawthorn X XCrataegus pruinosa Waxyfruit hawthorn X X
Hawthorn sp. X X XDiospyros virginiana Common persimmon XElaeagnus umbellata Autumn olive X X X X X X XFraxinus americana White ash X X X X X XFraxinus pennsylvanica Green ash X X XGleditsia triacanthos Honeylocust X X XLigustrum vulgare European privet XLindera benzoin Northern spicebush X X
Lonicera spp sites
Crataegus sp.

Courtney E. McCuskerGrant #08-021W
Table 2. Con't
35
Native sitesScientific name Common name 1 2 3 4 5 6 7 8 9 10Liriodendron tulipifera Tuliptree X
Bush honeysuckles X X X X X X X XMorus alba White mulberry X X XOstrya virginiana Hophornbeam XPrunus serotina Black cherry X X X X X X X XPtelea trifoliata Common hoptree XQuercus imbricaria Shingle oak X X XQuercus macrocarpa Bur oak X XQuercus muehlenbergii Chinkapin oak XQuercus sp. Oak sp. XQuercus velutina Black oak XRibes missouriense Missouri gooseberry X X X X X XRosa multiflora Multi-flora rose X X X X X X X X X XSassafras albidum Sassafras X XStaphylea trifolia American bladdernut X XSymphoricarpos orbiculatus Coralberry XTilia americana American basswood XToxicodendron radicans Easter poison ivy X XUlmus americana American elm X X X X XUlmus rubra Slippery elm X X XViburnum prunafolium Blackhaw X X X XZanthoxylum americanum Common pricklyash X X
Lonicera spp sites
Lonicera spp.
Courtney E. McCuskerGrant #08-021W
Table 3. Vegetation characteristics of Lonicera spp. and native shrub sites (n=10). t-tests indicate habitat differences between sites, df = 8 for all tests.
36
Habitat variable pArea sampled (ha) 12.41 ± 1.43 11.12 ± 0.98 0.615Contiguous area (ha) 426.14 ± 149.34 428.25 ± 145.47 0.994
48.81 ± 6.17 0.00 n/a9194.33 ± 846.10 30.67 ± 13.05 0.000
Total shrub cover (%) 62.59 ± 3.25 40.50 ± 3.99 0.016Total shrub stems per hectare 14068.33 ± 686.54 8091.33 ± 1066.83 0.010Shrub species richness 2.52 ± 0.46 3.73 ± 0.49 0.240Trees per hectare 642.67 ± 81.56 640.67 ± 65.15 0.990Canopy cover (%) 90.07 ± 1.52 90.50 ± 2.51 0.921Herb cover (%) 50.79 ± 4.59 56.41 ± 4.78 0.566
Mean in Lonicerasites (± 1 SE)
Mean in nativesites (± 1 SE)
Lonicera spp cover (%)Lonicera spp stems per hectare

Courtney E. McCuskerGrant #08-021W
Table 4. Summer bird species recorded in the ten sites. X indicates species occurring in at least one point count in either 2006 or 2007. XX indicates species present in at least one point count in both years.
37
Native sitesFamily Scientific name Common name 1 2 3 4 5 6 7 8 9 10Accipitridae Accipiter cooperii Cooper's hawk XX
Buteo jamaicensis Red-tailed hawk X
Bombycillidae Bombycilla cedrorum Cedar waxwing X X X XX X XX X
Cardinalidae Cardinalis cardinalis Northern cardinal XX XX XX XX XX XX XX XX XX XXPasserina cyanea Indigo bunting XX XX XX XX XX XX XX XX XX XXPheucticus ludovicianus Rose-breasted grosbeak XX
Columbidae Zenaida macroura Mourning dove XX XX X XX XX XX X X XX
Corvidae Corvus brachyrhynchos American crow X XX X X X X X XCyanocitta cristata Blue jay XX XX X XX XX XX X X X X
Cuculidae Coccyzux americanus Yellow-billed cuckoo XX XX XX XX XX X X
Emberizidae Melospiza melodia Song sparrow XX XX X X XPipilo erythrophthalmus Eastern towhee XX XX X XX XX XX XX X XX XXSpizella passerina Chipping sparrow X XX XX XSpizella pusilla Field sparrow XX XX X XX XX XX XX
Fringillidae Carduelis tristis American goldfinch XX X XX X X X XX X XX
Icteridae Agelaius phoeniceus Red-winged blackbird XX X XXIcterus galbula Baltimore oriole X X XX X XIcterus spurius Orchard oriole XMolothrus ater Brown-headed cowbird XX XX XX XX XX XX XX XX XX XXQuiscalus quiscula Common grackle XX X XSturnella magna Eastern meadowlark XX
Lonicera spp sites

Courtney E. McCuskerGrant #08-021W
Table 4. Con't
38
Native sitesFamily Scientific name Common name 1 2 3 4 5 6 7 8 9 10Mimidae Dumetella carolinensis Gray catbird XX XX XX XX XX X X X X
Mimus polyglottos Northern mockingbird XToxostoma rufum Brown thrasher XX X X X X XX XX
Paridae Baeolophus bicolor Tufted titmouse XX XX XX XX XX XX X XPoecile carolinensis Carolina chickadee X X X XX X XX XX XX X
Parulidae Dendroica dominica Yellow-throated warbler XDendroica magnolia Magnolia warbler XDendroica petechia Yellow warbler XGeothlypis trichas Common yellowthroat XX XX X X XX XX X X XX XXIcteria virens Yellow-breasted chat XOporornis formosus Kentucky warbler X X X XOporornis philadelphia Mourning warbler XParula americana Northern parula X X X X XSeiurus aurocapilla Ovenbird X X XSeiurus motacilla Louisiana waterthrush XSetophaga ruticilla American redstart XX X XVermivora peregrina Tennessee warbler X XWilsonia canadensis Canada warbler X
Picidae Colaptes auratus Northern flicker X X X X XDryocopus pileatus Pileated woodpecker XMelanerpes carolinus Red-bellied woodpecker XX XX XX X XX XX XX XX X XXMelanerpes erythrocephalus Red-headed woodpecker X XPicoides pubescens Downy woodpecker XX X XX X XX X XPicoides villosus Hairy woodpecker X
Lonicera spp sites

Courtney E. McCuskerGrant #08-021W
Table 4. Con't
39
Native sitesFamily Scientific name Common name 1 2 3 4 5 6 7 8 9 10Sittidae Sitta carolinensis White-breasted nuthatch X XX X XX XX X XX XX XX
Strigidae Strix varia Barred owl X
Sylviidae Polioptila caerulea Blue-gray gnatcatcher X XX X X XX XX
Thraupidae Piranga olivacea Scarlet tanager X
Trochilidae Archilochus colubris Ruby-throated hummingbird X X X XX
Troglodytidae Thryothorus ludovicianus Carolina wren XX XX XX X XX X XX XXTroglodytes aedon House wren XX XX XX XX XX XX XX XX
Turdidae Catharus minimus Gray-cheeked thrush XCatharus ustulatus Swainson's thrush XHylocichla mustelina Wood thrush XX XX XX XX XX X XX X XSialia sialis Eastern bluebird X XTurdus migratorius American robin XX XX XX XX XX XX XX XX X
Tyrannidae Contopus virens Eastern wood-pewee X XX XX XX XX XX XX XX XX XXEmpidonax alnorum Alder flycatcher XEmpidonax flaviventris Yellow-bellied flycatcher X XEmpidonax minimus Least flycatcher XEmpidonax virescens Acadian flycatcher XX X X XX XX XMyiarchus crinitus Great-crested flycatcher X XX X X XX XX XX XX XX XXSayornis phoebe Eastern phoebe X
Vireonidae Vireo flavifrons Yellow-throated vireo X XVireo gilvus Warbling vireo XVireo griseus White-eyed vireo X XX XXVireo olivaceus Red-eyed vireo XX X XX X X XX XX XX X X
Lonicera spp sites

Courtney E. McCuskerGrant #08-021W
Table 5. Mean density of birds (birds/hectare) in Lonicera spp. and native sites in the summers of 2006 and 2007.
40
2006 2007
Species or guildAmerican robin 2.63 ± 0.65 0.75 ± 0.29 2.48 ± 1.49 0.38 ± 0.17Blue jay 1.56 ± 0.51 0.10 ± 0.07 1.83 ± 0.45 1.10 ± 0.34Brown-headed cowbird 2.39 ± 0.32 3.23 ± 0.65 3.05 ± 0.84 1.58 ± 0.31Carolina wren 0.30 ± 0.10 0.15 ± 0.09 0.41 ± 0.11 0.15 ± 0.07Common yellowthroat 0.48 ± 0.08 0.26 ± 0.12 0.23 ± 0.11 0.20 ± 0.09Eastern wood-pewee 0.23 ± 0.09 0.81 ± 0.22 0.43 ± 0.11 0.82 ± 0.17Eastern towhee 0.80 ± 0.26 1.73 ± 0.48 0.89 ± 0.21 1.29 ± 0.27Gray catbird 3.47 ± 0.82 0.40 ± 0.28 4.00 ± 1.10 0.88 ± 0.60Great-crested flycatcher 0.43 ± 0.15 0.47 ± 0.14 0.33 ± 0.14 0.48 ± 0.12House wren 1.02 ± 0.36 0.63 ± 0.30 1.94 ± 0.59 0.86 ± 0.42Indigo bunting 2.74 ± 0.41 2.23 ± 0.44 2.53 ± 0.44 2.98 ± 0.38Northern cardinal 2.58 ± 0.35 1.49 ± 0.35 4.15 ± 0.48 2.97 ± 0.55Red-bellied woodpecker 0.24 ± 0.07 0.22 ± 0.06 0.29 ± 0.08 0.58 ± 0.09Red-eyed vireo 0.13 ± 0.10 0.56 ± 0.26 0.79 ± 0.19 1.56 ± 0.50White-breasted nuthatch 0.45 ± 0.14 0.35 ± 0.10 0.19 ± 0.09 0.38 ± 0.15Wood thrush 0.75 ± 0.23 0.23 ± 0.19 0.88 ± 0.30 0.49 ± 0.21
Emberzidae 1.09 ± 0.33 2.09 ± 0.54 1.65 ± 0.26 2.71 ± 0.75Icteridae 3.71 ± 0.36 3.26 ± 0.70 3.71 ± 0.36 3.26 ± 0.70Mimidae 2.10 ± 0.41 0.61 ± 0.23 2.55 ± 0.77 0.78 ± 0.44Paridae 1.61 ± 0.84 4.04 ± 1.25 2.14 ± 0.69 3.50 ± 0.72Picidae 0.99 ± 0.18 0.57 ± 0.17 0.87 ± 0.27 1.43 ± 0.26Troglodytidae 1.26 ± 0.31 0.80 ± 0.36 2.24 ± 0.49 0.95 ± 0.42Turdidae 3.04 ± 0.51 0.91 ± 0.27 3.13 ± 0.40 1.01 ± 0.24Tyrannidae 0.76 ± 0.19 1.54 ± 0.40 0.91 ± 0.22 1.66 ± 0.29Vireonidae 0.32 ± 0.17 1.10 ± 0.28 0.96 ± 0.23 2.09 ± 0.55
Upper-story 5.07 ± 1.46 6.82 ± 1.62 4.91 ± 0.71 8.20 ± 1.51Mid-story 5.03 ± 1.74 1.44 ± 0.66 3.75 ± 0.78 3.29 ± 0.85Lower-story 14.21 ± 1.33 9.53 ± 1.21 17.92 ± 1.75 12.47 ± 1.54.Total 26.12 ± 2.31 21.27 ± 2.11 29.51 ± 2.32 26.62 ± 1.57
Mean inLonicerasites (± 1 SE)
Mean in nativesites (± 1 SE)
Mean in Lonicerasites (± 1 SE)
Mean in nativesites (± 1 SE)

Courtney E. McCuskerGrant #08-021W
Table 6. Effects of site type and year on summer bird densities. Results are from a repeated measures ANOVA based on the presence and absence of Lonicera spp. df = 1 for all tests.
41
Site Year Site*year interactionSpecies or guild SS F p SS F p SS F pAmerican robin 19.84 13.11 0.007* 0.34 0.78 0.404 0.06 0.14 0.719Blue jay 5.92 9.31 0.016* 2.02 2.04 0.191 0.67 0.68 0.435Brown-headed cowbird 0.48 0.39 0.549 1.25 0.72 0.421 6.67 3.86 0.085Carolina wren 0.21 3.00 0.121 0.01 0.65 0.442 0.02 0.76 0.408Common yellowthroat 0.09 2.11 0.184 0.13 7.61 0.025* 0.05 2.76 0.135Eastern wood-pewee 1.16 5.04 0.055 0.06 0.44 0.526 0.04 0.32 0.588Eastern towhee 2.22 2.38 0.162 0.16 0.27 0.617 0.34 0.59 0.464Gray catbird 47.68 13.32 0.006* 1.27 0.40 0.545 0.00 0.00 0.975Great-crested flycatcher 0.04 0.47 0.515 0.01 0.15 0.711 0.01 0.22 0.648House wren 2.66 0.76 0.408 1.66 7.88 0.023* 0.60 2.84 0.130Indigo bunting 0.00 0.00 0.951 0.36 0.32 0.590 1.15 1.00 0.347Northern cardinal 6.46 6.43 0.035* 11.66 13.05 0.007* 0.01 0.01 0.918Red-bellied woodpecker 0.09 1.55 0.248 0.22 4.47 0.067 0.12 2.40 0.160Red-eyed vireo 1.79 1.13 0.318 3.44 19.68 0.002* 0.15 0.85 0.385White-breasted nuthatch 0.01 0.10 0.763 0.07 1.18 0.308 0.11 1.94 0.201Wood thrush 1.01 3.01 0.121 0.18 0.67 0.437 0.02 0.08 0.786
Emberzidae 5.33 1.34 0.281 1.74 2.56 0.148 0.01 0.01 0.925Icteridae 7.78 2.13 0.183 3.10 1.80 0.216 3.10 1.80 0.216Mimidae 13.32 6.85 0.031* 0.47 0.62 0.452 0.10 0.13 0.725Paridae 17.79 3.95 0.082 0.00 0.00 0.995 1.44 0.40 0.545Picidae 0.03 0.04 0.843 0.69 2.87 0.129 1.22 5.06 0.055Troglodytidae 3.82 1.29 0.289 1.60 9.82 0.014* 0.85 5.20 0.052Turdidae 22.69 24.52 0.001* 0.05 0.07 0.805 0.00 0.00 0.988Tyrannidae 2.92 3.47 0.100 0.09 0.32 0.589 0.00 0.01 0.942Vireonidae 4.55 2.59 0.146 3.28 10.21 0.013* 0.15 0.47 0.512
Upper-story 31.85 1.03 0.339 1.86 0.28 0.613 2.98 0.44 0.524Mid-story 20.54 6.22 0.037* 0.40 0.07 0.798 12.28 2.14 0.182Lower-story 128.27 3.81 0.087 55.41 7.52 0.025* 0.74 0.10 0.759
Total 74.85 1.81 0.216 95.44 2.80 0.133 4.77 0.14 0.718

Courtney E. McCuskerGrant #08-021W
Table 7. AICc analysis of robust regressions with M-estimators on the summer habitat-use guilds and habitat characteristics. Results are in order of the model with the lowest AICc to the highest within each guild. Parameters (K) = 3 for all models.
42
Models Estimate AICc Likelihood Weight2006
Upper-storyContiguous area (ha) 0.01 0.60 31.24 0.00 1.00 0.84% Total shrub cover -0.19 0.34 35.88 4.64 0.10 0.08Canopy cover 0.33 0.26 37.23 5.99 0.05 0.04
-0.05 0.10 38.98 7.74 0.02 0.02Shrub species richness 0.08 0.00 39.96 8.72 0.01 0.01Sampled area (ha) 0.18 0.01 40.14 8.90 0.01 0.01
Mid-storySampled area (ha) -0.32 0.18 28.51 0.00 1.00 0.25% Total shrub cover 0.08 0.17 28.75 0.24 0.89 0.22
0.05 0.16 28.82 0.31 0.86 0.21Contiguous area (ha) 0.00 0.05 29.94 1.42 0.49 0.12Canopy cover -0.05 0.02 30.36 1.85 0.40 0.10Shrub species richness -0.14 0.00 30.59 2.08 0.35 0.09
Lower-story% Total shrub cover 0.24 0.55 31.45 0.00 1.00 0.50
0.12 0.53 31.72 0.27 0.87 0.43Contiguous area (ha) 0.00 0.22 36.67 5.22 0.07 0.04Shrub species richness -0.77 0.05 38.67 7.22 0.03 0.01Sampled area (ha) 0.14 0.02 38.95 7.50 0.02 0.01Canopy cover -0.02 0.00 39.15 7.70 0.02 0.01
2007Upper-story
% Total shrub cover -0.13 0.34 32.21 0.00 1.00 0.42Contiguous area (ha) 0.00 0.31 33.12 0.91 0.63 0.27
-0.04 0.14 35.10 2.88 0.24 0.10Canopy cover 0.12 0.05 35.72 3.50 0.17 0.07Sampled area (ha) 0.15 0.05 35.79 3.58 0.17 0.07Shrub species richness -0.18 0.04 35.94 3.73 0.15 0.07
R2 ΔAICc
% Lonicera spp cover
% Lonicera spp cover
% Lonicera spp cover
% Lonicera spp cover

Courtney E. McCuskerGrant #08-021W
Table 7. Con't
43
Models Estimate AICc Likelihood Weight2007 con'tMid-story
Contiguous area (ha) 0.00 0.66 9.95 0.00 1.00 0.94% Total shrub cover 0.07 0.31 16.58 6.63 0.04 0.03
0.02 0.11 19.17 9.22 0.01 0.01Canopy cover -0.05 0.03 19.95 10.00 0.01 0.01Sampled area (ha) 0.12 0.03 20.01 10.06 0.01 0.01Shrub species richness -0.16 0.02 20.10 10.15 0.01 0.01
Lower-story% Total shrub cover 0.23 0.54 35.57 0.00 1.00 0.65
0.12 0.42 37.70 2.13 0.34 0.23Contiguous area (ha) -0.01 0.27 39.94 4.37 0.11 0.07Shrub species richness -0.39 0.01 42.95 7.38 0.02 0.02Canopy cover -0.19 0.02 42.95 7.38 0.02 0.02Sampled area (ha) -0.33 0.02 43.12 7.56 0.02 0.01
R2 ΔAICc
% Lonicera spp cover
% Lonicera spp cover
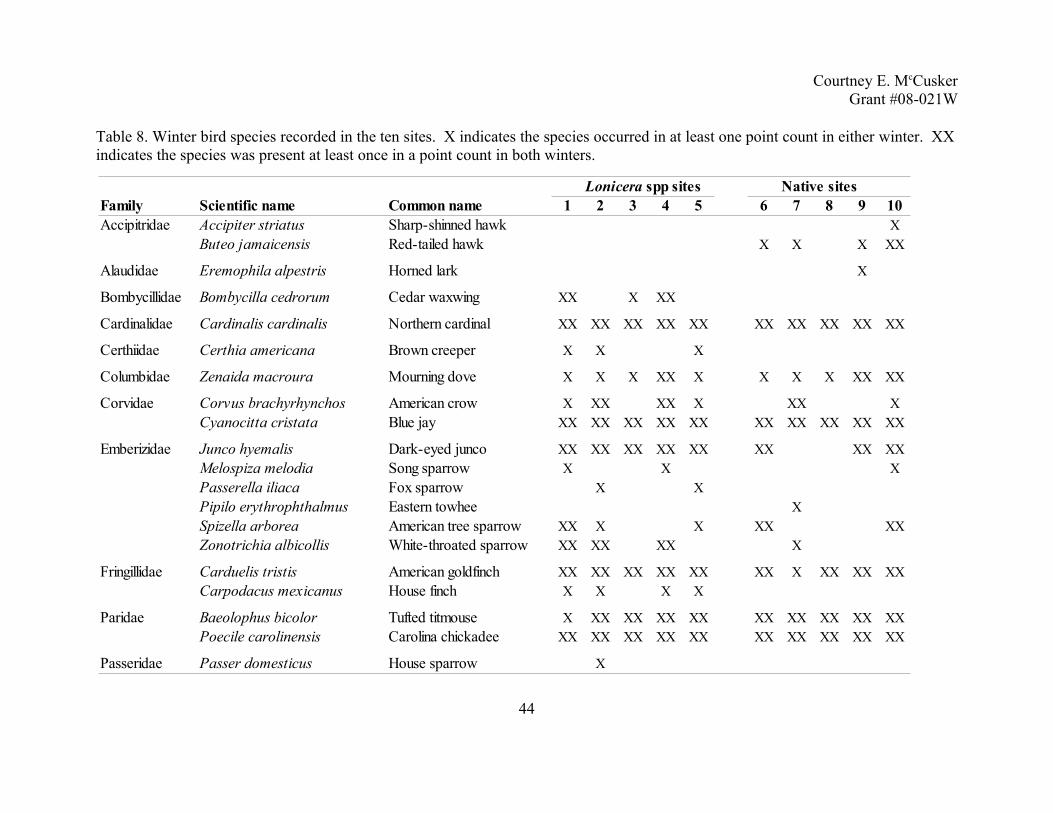
Courtney E. McCuskerGrant #08-021W
Table 8. Winter bird species recorded in the ten sites. X indicates the species occurred in at least one point count in either winter. XX indicates the species was present at least once in a point count in both winters.
44
Native sitesFamily Scientific name Common name 1 2 3 4 5 6 7 8 9 10Accipitridae Accipiter striatus Sharp-shinned hawk X
Buteo jamaicensis Red-tailed hawk X X X XX
Alaudidae Eremophila alpestris Horned lark X
Bombycillidae Bombycilla cedrorum Cedar waxwing XX X XX
Cardinalidae Cardinalis cardinalis Northern cardinal XX XX XX XX XX XX XX XX XX XX
Certhiidae Certhia americana Brown creeper X X X
Columbidae Zenaida macroura Mourning dove X X X XX X X X X XX XX
Corvidae Corvus brachyrhynchos American crow X XX XX X XX XCyanocitta cristata Blue jay XX XX XX XX XX XX XX XX XX XX
Emberizidae Junco hyemalis Dark-eyed junco XX XX XX XX XX XX XX XXMelospiza melodia Song sparrow X X XPasserella iliaca Fox sparrow X XPipilo erythrophthalmus Eastern towhee XSpizella arborea American tree sparrow XX X X XX XXZonotrichia albicollis White-throated sparrow XX XX XX X
Fringillidae Carduelis tristis American goldfinch XX XX XX XX XX XX X XX XX XXCarpodacus mexicanus House finch X X X X
Paridae Baeolophus bicolor Tufted titmouse X XX XX XX XX XX XX XX XX XXPoecile carolinensis Carolina chickadee XX XX XX XX XX XX XX XX XX XX
Passeridae Passer domesticus House sparrow X
Lonicera spp sites

Courtney E. McCuskerGrant #08-021W
Table 8. Con't
45
Native sitesFamily Scientific name Common name 1 2 3 4 5 6 7 8 9 10Picidae Colaptes auratus Northern flicker XX X XX X X
Dryocopus pileatus Pileated woodpecker X X XX X XXMelanerpes carolinus Red-bellied woodpecker XX XX XX XX XX XX XX XX XX XXMelanerpes erythrocephalus Red-headed woodpecker X XX
Picidae (con't) Picoides pubescens Downy woodpecker XX XX XX XX XX XX XX XX XX XXPicoides villosus Hairy woodpecker X X
Regulidae Regulus satrapa Golden-crowned kinglet X X X
Sittidae Sitta canadensis Red-breasted nuthatch XSitta carolinensis White-breasted nuthatch XX XX XX XX XX XX XX XX XX XX
Strigidae Bubo virginianus Great horned owl X X X
Sturnidae Sturnus vulgaris European starling X X
Troglodytidae Thryothorus ludovicianus Carolina wren XX XX X XX XX XX XX XX X X
Turdidae Catharus guttatus Hermit thrush X XHylocichla mustelina Wood thrush XSialia sialis Eastern bluebird X X X X XTurdus migratorius American robin XX XX X XX XX X XX X X
Lonicera spp sites

Courtney E. McCuskerGrant #08-021W
Table 9. Mean density of birds (birds/hectare) in Lonicera spp. and native sites in the winters of 2006-2007 and 2007-2008.
46
2006-2007 2007-2008
Species or guildAmerican goldfinch 1.20 ± 0.75 0.12 ± 0.08 0.49 ± 0.16 0.39 ± 0.25American robin 1.24 ± 0.99 0.21 ± 0.14 0.75 ± 0.46 0.03 ± 0.05Blue jay 0.43 ± 0.17 0.34 ± 0.16 0.76 ± 0.21 0.95 ± 0.23Carolina wren 0.13 ± 0.07 0.11 ± 0.07 0.11 ± 0.05 0.02 ± 0.02Downy woodpecker 1.14 ± 0.39 0.61 ± 0.28 0.96 ± 0.33 0.39 ± 0.16Northern cardinal 2.45 ± 0.57 1.17 ± 0.40 1.96 ± 0.47 1.42 ± 0.55Red-bellied woodpecker 0.34 ± 0.11 0.32 ± 0.11 0.53 ± 0.14 0.88 ± 0.20White-breasted nuthatch 0.54 ± 0.26 0.68 ± 0.18 0.70 ± 0.28 0.79 ± 0.27
Emberzidae 2.26 ± 0.93 0.80 ± 0.46 1.58 ± 0.65 0.75 ± 0.45Fringillidae 1.36 ± 0.85 0.14 ± 0.10 0.74 ± 0.24 0.44 ± 0.28Paridae 1.65 ± 0.50 1.24 ± 0.51 1.98 ± 0.51 2.01 ± 0.77Picidae 1.21 ± 0.35 0.81 ± 0.18 1.25 ± 0.27 1.77 ± 0.37Turdidae 3.08 ± 2.12 0.79 ± 0.45 1.55 ± 0.96 0.27 ± 0.33
Non-frugivorous 2.62 ± 0.74 1.85 ± 0.40 1.92 ± 0.51 2.81 ± 1.05Facultative frugivorous 3.05 ± 0.76 1.63 ± 0.39 2.75 ± 0.52 3.32 ± 0.68Frugivorous 5.96 ± 1.50 2.89 ± 0.68 5.40 ± 1.06 4.22 ± 1.02
Total 11.52 ± 2.04 6.41 ± 1.1 9.95 ± 1.58 10.45 ± 1.93
Mean inLonicerasites (± 1 SE)
Mean in nativesites (± 1 SE)
Mean in Lonicerasites (± 1 SE)
Mean in nativesites (± 1 SE)
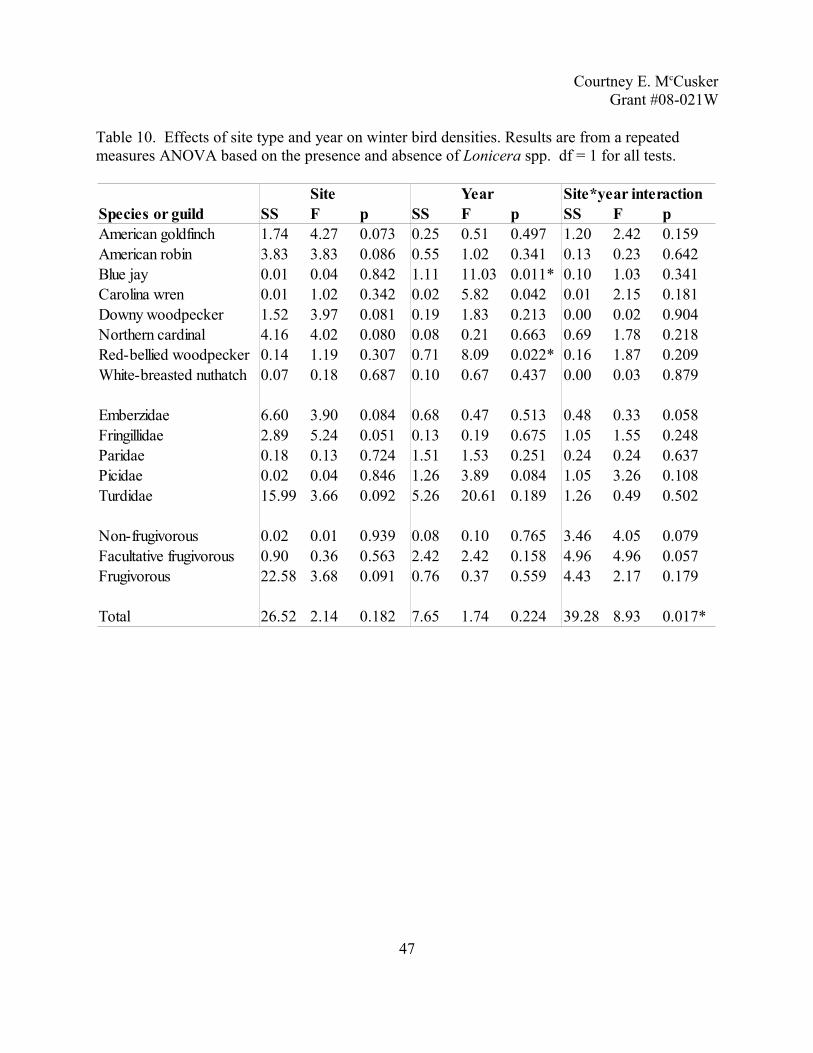
Courtney E. McCuskerGrant #08-021W
Table 10. Effects of site type and year on winter bird densities. Results are from a repeated measures ANOVA based on the presence and absence of Lonicera spp. df = 1 for all tests.
47
Site Year Site*year interactionSpecies or guild SS F p SS F p SS F pAmerican goldfinch 1.74 4.27 0.073 0.25 0.51 0.497 1.20 2.42 0.159American robin 3.83 3.83 0.086 0.55 1.02 0.341 0.13 0.23 0.642Blue jay 0.01 0.04 0.842 1.11 11.03 0.011* 0.10 1.03 0.341Carolina wren 0.01 1.02 0.342 0.02 5.82 0.042 0.01 2.15 0.181Downy woodpecker 1.52 3.97 0.081 0.19 1.83 0.213 0.00 0.02 0.904Northern cardinal 4.16 4.02 0.080 0.08 0.21 0.663 0.69 1.78 0.218Red-bellied woodpecker 0.14 1.19 0.307 0.71 8.09 0.022* 0.16 1.87 0.209White-breasted nuthatch 0.07 0.18 0.687 0.10 0.67 0.437 0.00 0.03 0.879
Emberzidae 6.60 3.90 0.084 0.68 0.47 0.513 0.48 0.33 0.058Fringillidae 2.89 5.24 0.051 0.13 0.19 0.675 1.05 1.55 0.248Paridae 0.18 0.13 0.724 1.51 1.53 0.251 0.24 0.24 0.637Picidae 0.02 0.04 0.846 1.26 3.89 0.084 1.05 3.26 0.108Turdidae 15.99 3.66 0.092 5.26 20.61 0.189 1.26 0.49 0.502
Non-frugivorous 0.02 0.01 0.939 0.08 0.10 0.765 3.46 4.05 0.079Facultative frugivorous 0.90 0.36 0.563 2.42 2.42 0.158 4.96 4.96 0.057Frugivorous 22.58 3.68 0.091 0.76 0.37 0.559 4.43 2.17 0.179
Total 26.52 2.14 0.182 7.65 1.74 0.224 39.28 8.93 0.017*

Courtney E. McCuskerGrant #08-021W
Table 11. AICc analysis of robust regressions with M-estimators on the winter diet guilds and habitat characteristics. Results are in order of the model with the lowest AICc to the highest. Parameters (K) = 3 for all models.
48
Models Estimate AICc Likelihood Weight2006-2007Frugivorous
% Total shrub cover 0.12 0.44 20.51 0.00 1.00 0.490.06 0.35 21.74 1.23 0.54 0.27
Canopy cover -0.17 0.18 23.85 3.34 0.19 0.09Contiguous area (ha) 0.00 0.14 24.40 3.89 0.14 0.07Shrub species richness -0.19 0.04 25.45 4.94 0.08 0.04Sampled area (ha) -0.09 0.01 25.86 5.35 0.07 0.03
Facultative frugivorousContiguous area (ha) 0.00 0.28 12.31 0.00 1.00 0.43Sampled area (ha) -0.09 0.13 14.27 1.96 0.37 0.16Shrub species richness 0.13 0.06 15.06 2.75 0.25 0.11
0.01 0.08 15.11 2.81 0.25 0.11% Total shrub cover 0.02 0.07 15.14 2.83 0.24 0.10Canopy cover 0.03 0.01 15.44 3.13 0.21 0.09
Non-frugivorous% Total shrub cover 0.05 0.32 8.95 0.00 1.00 0.50
0.02 0.19 10.87 1.92 0.38 0.19Canopy cover -0.02 0.01 12.61 3.65 0.16 0.08Shrub species richness -0.04 0.01 12.66 3.71 0.16 0.08Sampled area (ha) -0.01 0.01 12.70 3.75 0.15 0.08Contiguous area (ha) 0.00 0.00 12.76 3.81 0.15 0.07
2007-2008Frugivorous
Sampled area (ha) -0.26 0.34 20.91 0.00 1.00 0.33% Total shrub cover 0.08 0.32 20.99 0.08 0.96 0.32Canopy cover -0.15 0.19 22.67 1.76 0.42 0.14Contiguous area (ha) 0.00 0.09 23.84 2.93 0.23 0.08
0.02 0.10 23.90 2.99 0.22 0.07Shrub species richness 0.35 0.06 24.22 3.31 0.19 0.06
R2 ΔAICc
% Lonicera spp cover
% Lonicera spp cover
% Lonicera spp cover
% Lonicera spp cover
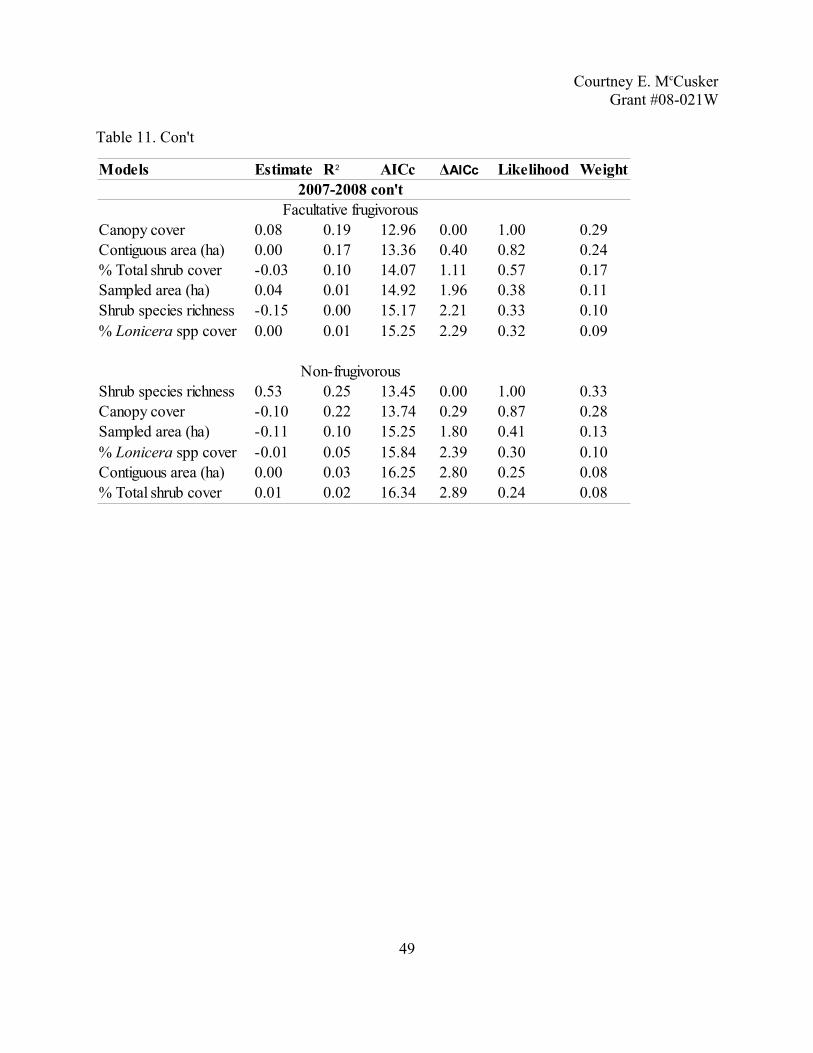
Courtney E. McCuskerGrant #08-021W
Table 11. Con't
49
Models Estimate AICc Likelihood Weight2007-2008 con't
Facultative frugivorousCanopy cover 0.08 0.19 12.96 0.00 1.00 0.29Contiguous area (ha) 0.00 0.17 13.36 0.40 0.82 0.24% Total shrub cover -0.03 0.10 14.07 1.11 0.57 0.17Sampled area (ha) 0.04 0.01 14.92 1.96 0.38 0.11Shrub species richness -0.15 0.00 15.17 2.21 0.33 0.10
0.00 0.01 15.25 2.29 0.32 0.09
Non-frugivorousShrub species richness 0.53 0.25 13.45 0.00 1.00 0.33Canopy cover -0.10 0.22 13.74 0.29 0.87 0.28Sampled area (ha) -0.11 0.10 15.25 1.80 0.41 0.13
-0.01 0.05 15.84 2.39 0.30 0.10Contiguous area (ha) 0.00 0.03 16.25 2.80 0.25 0.08% Total shrub cover 0.01 0.02 16.34 2.89 0.24 0.08
R2 ΔAICc
% Lonicera spp cover
% Lonicera spp cover
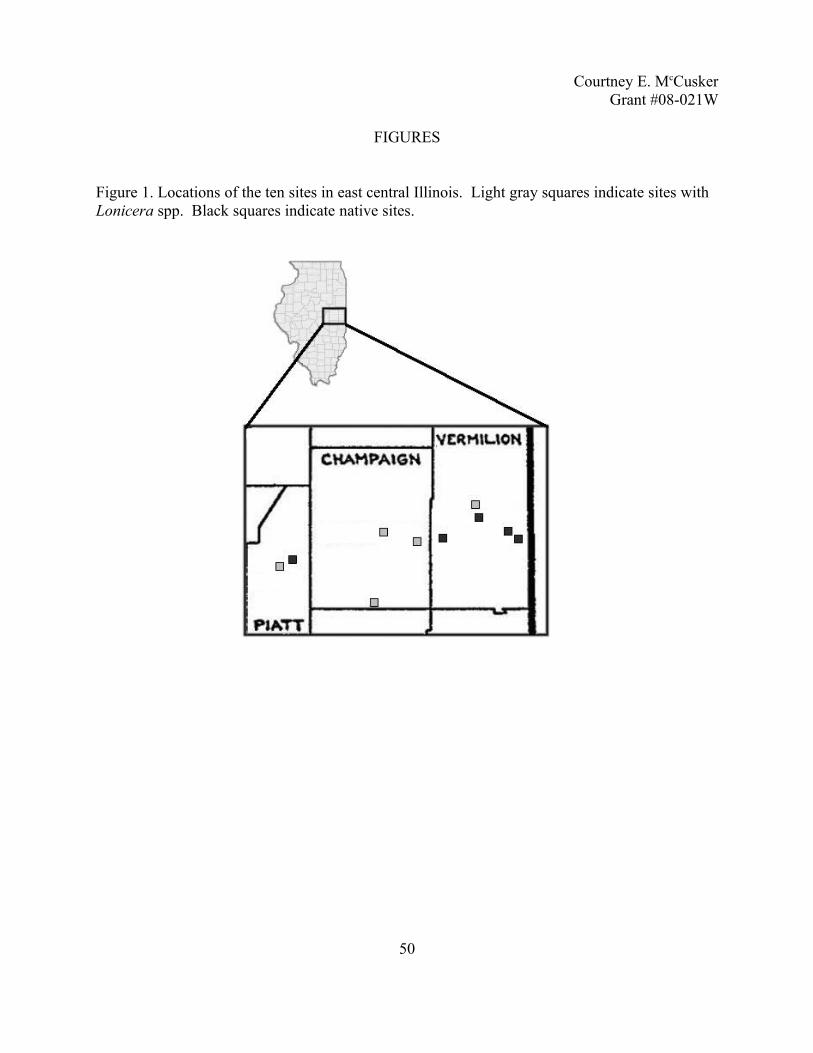
Courtney E. McCuskerGrant #08-021W
FIGURES
Figure 1. Locations of the ten sites in east central Illinois. Light gray squares indicate sites with Lonicera spp. Black squares indicate native sites.
50

Courtney E. McCuskerGrant #08-021W
Figure 2. Plot of the first and second factor scores for the summer principal component analysis in A) 2006 and B) 2007.
51
B
Factor Score 1
-2.5 -2.0 -1.5 -1.0 -0.5 0.0 0.5 1.0 1.5
Fact
or S
core
2
-1.5
-1.0
-0.5
0.0
0.5
1.0
1.5
2.0
A
Factor Score 1
-2.5 -2.0 -1.5 -1.0 -0.5 0.0 0.5 1.0 1.5
Fact
or S
core
2
-2.0
-1.5
-1.0
-0.5
0.0
0.5
1.0
1.5
NativeLonicera spp.

Courtney E. McCuskerGrant #08-021W
Figure 3. Species richness (average number of birds seen per point count) for the summers of 2006 and 2007.
Figure 4. Total winter bird density (birds per hectare) for 2006-2007 and 2007-2008
52
Year
2006 2007
Spe
cies
rich
ness
0
2
4
6
8
10
12
NativeLonicera spp.
Year
2006-2007 2007-2008
Bird
s pe
r hec
tare
0
2
4
6
8
10
12
14NativeLonicera spp.
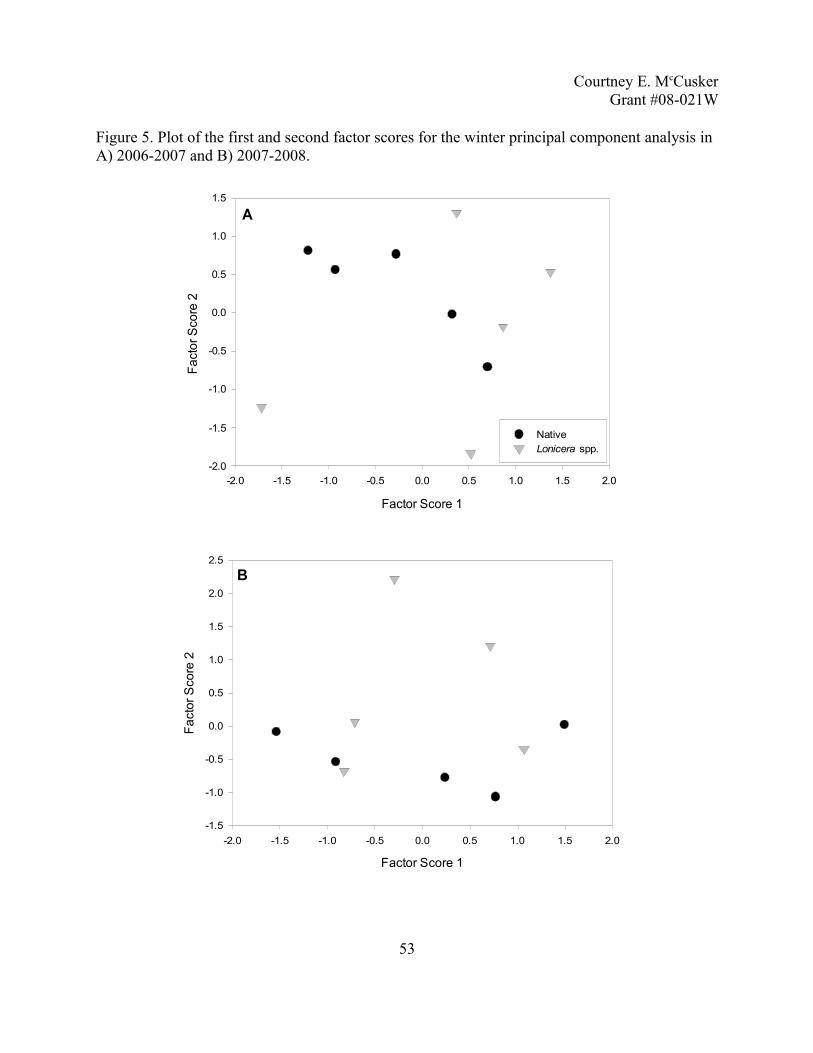
Courtney E. McCuskerGrant #08-021W
Figure 5. Plot of the first and second factor scores for the winter principal component analysis in A) 2006-2007 and B) 2007-2008.
53
A
Factor Score 1
-2.0 -1.5 -1.0 -0.5 0.0 0.5 1.0 1.5 2.0
Fact
or S
core
2
-2.0
-1.5
-1.0
-0.5
0.0
0.5
1.0
1.5
NativeLonicera spp.
B
Factor Score 1
-2.0 -1.5 -1.0 -0.5 0.0 0.5 1.0 1.5 2.0
Fact
or S
core
2
-1.5
-1.0
-0.5
0.0
0.5
1.0
1.5
2.0
2.5

Courtney E. McCuskerGrant #08-021W
Figure 6. Species richness (average number of birds seen per point count) for the winters of 2006-2007 and 2007-2008.
54
Year
2006 2007
Spe
cies
rich
ness
0
1
2
3
4
5NativeLonicera spp.

Courtney E. McCuskerGrant #08-021W
EXPENDITURES
FUNDS PROVIDED BY THIS GRANT:All Predator Calls (www.AllPredatorCalls.com)PO Box 911176, St. George, UT 84791Item: FOXPRO - XR6 16 Call Remote Controlled Digital Game Call
Quantity: 1Item: FOXPRO - XR6 NiMH Batteries and Charger
Quantity: 1Purchased: October 9, 2007Total: $429.57
Mileage ReimbursementLogged 1647 miles for travel to and from field sites from July 2007- March 2008Reimbursement rate of $0.445 per mileTotal: $732.92
Total reimbursement expenditures for this project: $1162.49
FUNDS PROVIDED BY OTHER SOURCES:Mileage Reimbursement provided by the Illinois Natural History Survey for work completed between January 2006 and June 2007Logged 2017 miles for travel to and from field sitesReimbursement rate of $0.445 per mileTotal: $897.57
55