The Effects of Interactive Latency on Exploratory Visual ... · The Effects of Interactive Latency...
10
The Effects of Interactive Latency on Exploratory Visual Analysis Zhicheng Liu and Jeffrey Heer Abstract—To support effective exploration, it is often stated that interactive visualizations should provide rapid response times. However, the effects of interactive latency on the process and outcomes of exploratory visual analysis have not been systematically studied. We present an experiment measuring user behavior and knowledge discovery with interactive visualizations under varying latency conditions. We observe that an additional delay of 500ms incurs significant costs, decreasing user activity and data set coverage. Analyzing verbal data from think-aloud protocols, we find that increased latency reduces the rate at which users make observations, draw generalizations and generate hypotheses. Moreover, we note interaction effects in which initial exposure to higher latencies leads to subsequently reduced performance in a low-latency setting. Overall, increased latency causes users to shift exploration strategy, in turn affecting performance. We discuss how these results can inform the design of interactive analysis tools. Index Terms—Interaction, latency, exploratory analysis, interactive visualization, scalability, user performance, verbal analysis 1 I NTRODUCTION One stated goal of interactive visualization is to enable data analysis at “rates resonant with the pace of human thought” [19, 20]. This goal entails two research directions: understanding the rate of cognitive activities in the context of visualization, and supporting these cognitive processes through appropriately designed and performant systems. Latency is a central issue underlying these research problems. Due to the time required for query processing, data transfer, and rendering, data-intensive visualization systems incur delay. It is generally held that low latency leads to improved usability and better user experience. Unsurprisingly, multiple research efforts focus on reducing query and rendering latency for large datasets, which may include billions or more data points. Latencies in state-of-the-art systems can range from 20 milliseconds up to multiple seconds for a unit task [2, 28, 29]. Despite the shared goal of minimizing latency, the effects of interac- tion delays on user behavior and knowledge discovery with visualiza- tions remain largely unevaluated. While previous research on the ef- fects of interactive latency in puzzle solving [4, 17, 35, 36] and search [8] has shown that user behavior changes in response to millisecond- scale differences in latency, studies in other domains such as computer games report no significant effects [23, 39]. It is unclear to what degree these findings apply to exploratory vi- sual analysis. Unlike problem-solving tasks or most computer games, exploratory visual analysis is open-ended and does not have a clear goal state. User interaction may be triggered by salient visual cues in the display, driven by a priori hypotheses, or carried out through exploratory browsing. The process is more spontaneous and is uncon- strained by factors such as game rules. How does latency affect user behavior and knowledge discovery in exploratory visual analysis? To answer this question, we conduct controlled experiments comparing two latency conditions, differing by 500ms per operation. We analyze data collected from both system logs and think-aloud protocols to test if (a) delay impacts interaction strategies and (b) lower latency leads to better analysis performance. Our work makes the following contributions. First, we present the design and the results of a controlled study confirming that a 500ms difference can have significant impacts on visual analysis. Specifi- cally, we find that (1) the additional delay results in reduced inter- action and reduced dataset coverage during analysis; (2) the rate at which users make observations, draw generalizations and generate hy- potheses (as determined using a think-aloud protocol) also declines • Zhicheng Liu is with Adobe Research. E-mail: [email protected]. • Jeffrey Heer is with the University of Washington. E-mail: [email protected]. Manuscript received 31 March 2014; accepted 1 August 2014; posted online 13 October 2014; mailed on 4 October 2014. For information on obtaining reprints of this article, please send e-mail to: [email protected]. due to the delay; and (3) initial exposure to delays can negatively im- pact overall performance even when the delay is removed in a later session. Second, we extend the insight-based evaluation methodology [37, 38] for comparative analysis of qualitative data regarding visu- alization use. We introduce a procedure for segmenting, coding and analyzing think-aloud protocols for visualization research. Our anal- ysis contributes coding categories that are potentially applicable for future protocol analysis. Finally, our results show that the same delay has varying influences on different interactive operations. We discuss some implications of these findings for system design. 2 RELATED WORK Our research draws on related work in scalable visualization systems, cognitive science and domain-specific investigations on the effects of interactive latency. We review relevant literature below. 2.1 Scalable Data Analysis Systems Building low latency analysis systems has been a focus for many re- search projects and commercial systems, spanning both back-end and front-end engineering efforts. Spark [44, 45] supports fast in-memory cluster computing through read-only distributed datasets for machine learning tasks and interactive ad-hoc queries. Nanocubes [28] con- tribute a method to store and query multi-dimensional aggregated data at multiple levels of resolution in memory for visualization. Profiler [26] builds in-memory data cubes for query processing. Tableau’s data engine [1] optimizes both in-memory stores and live connections to databases on disk. imMens [29] decomposes multi-dimensional data cubes into binned data tiles of reduced dimensionality and performs accelerated query processing and rendering on the GPU. In cases where long-running queries are unavoidable, sampling and online aggregation [22] are often used to improve user experience. BlinkDB [2] builds multi-dimensional, multi-resolution samples and dynamically estimates a query’s response time and error. With online aggregation [22], visualizations of estimated results are incrementally updated as a query progresses. Studies suggest that data analysts can interpret approximate results visualized as bar charts with error bars to make confident decisions [16]. 2.2 Time Scales of Human Cognition Decades of psychology research have produced evidence that differ- ent thought processes operate at varying speeds [25]. Newell [33] pro- vides a framework outlining proposed time scales of human cognition. Relevant to studies of human-computer interaction are the cognitive (100 milliseconds to 10 seconds) and rational (minutes to hours) time bands. Within the cognitive band, Newell identifies three types of time constants: deliberate act, operation, and unit task. Card et al. [11] make similar distinctions using a different terminology. Table 1 sum- marizes these scales, exemplary actions, and the time ranges during which these actions occur.
Transcript of The Effects of Interactive Latency on Exploratory Visual ... · The Effects of Interactive Latency...
The Effects of Interactive Latency on Exploratory Visual Analysis
Zhicheng Liu and Jeffrey Heer
Abstract—To support effective exploration, it is often stated that interactive visualizations should provide rapid response times.However, the effects of interactive latency on the process and outcomes of exploratory visual analysis have not been systematicallystudied. We present an experiment measuring user behavior and knowledge discovery with interactive visualizations under varyinglatency conditions. We observe that an additional delay of 500ms incurs significant costs, decreasing user activity and data setcoverage. Analyzing verbal data from think-aloud protocols, we find that increased latency reduces the rate at which users makeobservations, draw generalizations and generate hypotheses. Moreover, we note interaction effects in which initial exposure tohigher latencies leads to subsequently reduced performance in a low-latency setting. Overall, increased latency causes users to shiftexploration strategy, in turn affecting performance. We discuss how these results can inform the design of interactive analysis tools.
Index Terms—Interaction, latency, exploratory analysis, interactive visualization, scalability, user performance, verbal analysis
1 INTRODUCTION
One stated goal of interactive visualization is to enable data analysisat “rates resonant with the pace of human thought” [19, 20]. This goalentails two research directions: understanding the rate of cognitiveactivities in the context of visualization, and supporting these cognitiveprocesses through appropriately designed and performant systems.
Latency is a central issue underlying these research problems. Dueto the time required for query processing, data transfer, and rendering,data-intensive visualization systems incur delay. It is generally heldthat low latency leads to improved usability and better user experience.Unsurprisingly, multiple research efforts focus on reducing query andrendering latency for large datasets, which may include billions ormore data points. Latencies in state-of-the-art systems can range from20 milliseconds up to multiple seconds for a unit task [2, 28, 29].
Despite the shared goal of minimizing latency, the effects of interac-tion delays on user behavior and knowledge discovery with visualiza-tions remain largely unevaluated. While previous research on the ef-fects of interactive latency in puzzle solving [4, 17, 35, 36] and search[8] has shown that user behavior changes in response to millisecond-scale differences in latency, studies in other domains such as computergames report no significant effects [23, 39].
It is unclear to what degree these findings apply to exploratory vi-sual analysis. Unlike problem-solving tasks or most computer games,exploratory visual analysis is open-ended and does not have a cleargoal state. User interaction may be triggered by salient visual cuesin the display, driven by a priori hypotheses, or carried out throughexploratory browsing. The process is more spontaneous and is uncon-strained by factors such as game rules.
How does latency affect user behavior and knowledge discoveryin exploratory visual analysis? To answer this question, we conductcontrolled experiments comparing two latency conditions, differing by500ms per operation. We analyze data collected from both systemlogs and think-aloud protocols to test if (a) delay impacts interactionstrategies and (b) lower latency leads to better analysis performance.
Our work makes the following contributions. First, we present thedesign and the results of a controlled study confirming that a 500msdifference can have significant impacts on visual analysis. Specifi-cally, we find that (1) the additional delay results in reduced inter-action and reduced dataset coverage during analysis; (2) the rate atwhich users make observations, draw generalizations and generate hy-potheses (as determined using a think-aloud protocol) also declines
• Zhicheng Liu is with Adobe Research. E-mail: [email protected].• Jeffrey Heer is with the University of Washington. E-mail: [email protected].
Manuscript received 31 March 2014; accepted 1 August 2014; posted online13 October 2014; mailed on 4 October 2014.For information on obtaining reprints of this article, please sende-mail to: [email protected].
due to the delay; and (3) initial exposure to delays can negatively im-pact overall performance even when the delay is removed in a latersession. Second, we extend the insight-based evaluation methodology[37, 38] for comparative analysis of qualitative data regarding visu-alization use. We introduce a procedure for segmenting, coding andanalyzing think-aloud protocols for visualization research. Our anal-ysis contributes coding categories that are potentially applicable forfuture protocol analysis. Finally, our results show that the same delayhas varying influences on different interactive operations. We discusssome implications of these findings for system design.
2 RELATED WORK
Our research draws on related work in scalable visualization systems,cognitive science and domain-specific investigations on the effects ofinteractive latency. We review relevant literature below.
2.1 Scalable Data Analysis SystemsBuilding low latency analysis systems has been a focus for many re-search projects and commercial systems, spanning both back-end andfront-end engineering efforts. Spark [44, 45] supports fast in-memorycluster computing through read-only distributed datasets for machinelearning tasks and interactive ad-hoc queries. Nanocubes [28] con-tribute a method to store and query multi-dimensional aggregated dataat multiple levels of resolution in memory for visualization. Profiler[26] builds in-memory data cubes for query processing. Tableau’s dataengine [1] optimizes both in-memory stores and live connections todatabases on disk. imMens [29] decomposes multi-dimensional datacubes into binned data tiles of reduced dimensionality and performsaccelerated query processing and rendering on the GPU.
In cases where long-running queries are unavoidable, sampling andonline aggregation [22] are often used to improve user experience.BlinkDB [2] builds multi-dimensional, multi-resolution samples anddynamically estimates a query’s response time and error. With onlineaggregation [22], visualizations of estimated results are incrementallyupdated as a query progresses. Studies suggest that data analysts caninterpret approximate results visualized as bar charts with error bars tomake confident decisions [16].
2.2 Time Scales of Human CognitionDecades of psychology research have produced evidence that differ-ent thought processes operate at varying speeds [25]. Newell [33] pro-vides a framework outlining proposed time scales of human cognition.Relevant to studies of human-computer interaction are the cognitive(100 milliseconds to 10 seconds) and rational (minutes to hours) timebands. Within the cognitive band, Newell identifies three types of timeconstants: deliberate act, operation, and unit task. Card et al. [11]make similar distinctions using a different terminology. Table 1 sum-marizes these scales, exemplary actions, and the time ranges duringwhich these actions occur.

Newell’s Term Card et al.’s Term Examples Time Rangedeliberate act perceptual fusion recognizing a pattern, tracking animation ~100 millisecondscognitive operation unprepared response clicking a link, selecting an object ~1 secondunit task unit task editing a line of text, making a chess move ~10 seconds
Table 1. Time scales at which human actions take place
Based on these frameworks, Card et al. [10] provide a high-leveldiscussion of time constants in the context of information visualiza-tion. Fundamental task types in exploratory visual analysis include se-lect, navigate, coordinate and organize [20]. Brushing and linking, forinstance, coordinates multiple views such that selecting items in oneview causes highlighting of corresponding items in the other views.Card et al. [11] place brushing and linking in the “perceptual fusion”time band, suggesting immediate visual feedback within 100ms. Littlework elucidates the desired time scales for the other types of interac-tive techniques, however.
Ballard et al. [4] propose an adaptation of Newell’s frameworkbased on empirical observations. They argue that the ~100ms timescale for deliberate acts is an over-estimation, and adjust it to ~50ms.They strongly emphasize the time scale around ~300ms, termed the“embodiment level”. Exemplary human actions at this time scale in-clude eye saccades and body movements. By focusing on this level oftime constant, they explain how a minor change in interface can lead tosignificant changes in cognitive behavior. For example, when the costof acquiring a piece of information is increased from an eye movementto a head movement in a block-copying task, subjects change strategyand rely more on working memory [3].
These frameworks provide guidance for investigations of interac-tive dynamics in different domains, and anchor the interpretation ofexperimental results. In the next section, we review empirical findingson the effects of varying latencies in different domains.
2.3 Effects of Latency in Various DomainsResearch into the effects of latency typically focus on the perceptionof delay, impacts on the outcome of an activity, and changes in userbehavior. Michotte’s [31] studies report that longer delay weakens theperception of causality. People will interpret the consecutive motionsof two objects as causally related if the second object moves within70ms after contact; such impressions are lost when the delay exceeds160ms. For the perception of delay in task-oriented settings, studiesfind that users can detect latencies as low as 2.38 ms when draggingan object on direct touch interfaces [34].
Investigating the effect of varying latency between 1 and 50 ms ontouch interfaces, Jota et al. [24] find that user performance decreases aslatency increases. In particular, input latency significantly affects thelast stage of pointing tasks. Beigbeder et al. [7] also find that latencyas low as 100ms can significantly degrade shooting precision in thefirst-person shooting game “Unreal Tournament 2003”.
Not all studies find a negative correlation between latency and userperformance. Sheldon et al. [39] report that latency as high as sev-eral seconds does not significantly affect user performance in real timestrategy games such as Warcraft III. While perhaps surprising, this re-sult can be explained by the observation that tasks such as understand-ing game situation and conceiving strategy play a more important rolein affecting the outcome of a game. These tasks take place at a largertime scale, and so are less sensitive to typical network latencies.
Research in cognitive science finds that changes in interaction costcan change user behaviors during problem-solving. This change in be-havior in turn impacts the final outcome. O’Hara and Payne [35] showthat by changing the cost of moving a tile in an 8-puzzle game (shift-ing from pressing a key to typing a command), participants resort tomore mental planning and solve the puzzle in fewer moves. In a re-lated study, they impose a 4-second additional lockout delay in eachtile move. This change results in less manipulation of the tiles andmore search of an internally-represented problem space [36]. O’Haraand Payne’s experiments arguably involve conditions that span multi-ple time scales in Table 1.
Evidence from longitudinal studies of user search behavior revealsthat seemingly insignificant time differences for a unit task can im-pact user behavior, too. Brutlag [8] observes that a small difference of300ms in web search delay reduces the number of searches users per-form. Even after the latency is restored to previous levels, this reduc-tion in user activity persists for days. In contrast, players of Half-Life,a first person shooting game, do not appear to be affected when morethan 40% of them experience delays of over 225ms. Players toleratethe delays and keep returning to the games [23].
It is not clear if these findings can be simply extrapolated to a newdomain. Unlike problem solving or computer games, exploratory vi-sual analysis is open-ended and has no clearly formulated goal state.Conducting a targeted study for visual analysis is thus necessary andpresents new challenges in experiment design and data analysis.
3 EXPERIMENTAL METHOD
The goal of this research is to investigate whether differences in in-teractive latency influence behaviors and outcomes during exploratoryvisual analysis. To this end, we use a 2 (datasets) x 2 (latency con-ditions) experiment design. We induce two latency conditions in theimMens [29] system, differing by 500 milliseconds per operation. Thesubjects analyze two datasets and report their findings through a think-aloud protocol. We log user interaction and record verbal data for anal-ysis. In this section, we describe the system used in the study, datasetsand visualizations, participants, tasks, and study procedures.
3.1 Experimental System
We adapt the open-source imMens system [29] for our study. imMenscan interactively query and visualize more than millions of data pointsat higher frame rates than other existing systems. The low interactivelatency in imMens allows the creation of different latency conditionsby injecting precise delays into the interactive operations.
imMens aggregates data at multiple scales of binning resolution andvisualizes the aggregates as histograms, bar charts, line graphs, binnedscatterplots and geographic heatmaps. The system supports four maininteraction techniques for the binned plots: select, pan, zoom, andbrush & link. To ensure real-time interaction with the visualizations,imMens pre-computes data tiles, which are 3- or 4-dimensional pro-jections decomposed from the full data cube. When visualizations arecreated or viewports are modified via panning or zooming at the client,imMens loads relevant data tiles from the server and updates the visu-alizations. To reduce network latency, imMens pre-fetches data tilesfor application states reachable from the current state and caches thedata tiles at the client side. The browser-based client uses WebGL toperform parallel query processing and rendering on the GPU. Bench-marking tests show that imMens is able to sustain a performance of 50frames per second for interactive brushing & linking of 1 billion datapoints across 25 visualizations. Prior work by Liu et al. [29] describesthe design and implementation of imMens in greater detail.
We added two user interface controls to the imMens interface tosupport log scale transforms and color scale adjustment. Given a largenumber of data elements and a limited number of pixels for each vi-sualization, a brushing selection of a small number of data points canbe difficult to see, as the projected sums in linked views may be quitesmall. In response, we provided a checkbox for users to toggle be-tween linear and log scale for histograms and bar charts. In addition,an outlying density value in a two-dimensional plot can skew the colormapping. Users can use a range slider control to define the lower andupper bounds of color clamping within binned scatterplots and geo-graphic heatmaps.
3.2 Latency Conditions
We considered multiple choices when designing our latency condi-tions. One approach is to include multiple latencies in small incre-ments, which is useful for identifying time scale thresholds for eachinteractive operation. Assessing thresholds, however, is not the fo-cus of our study, and often requires conducting studies with highly-controlled, low-level tasks. We are more interested in understandingthe effects of latency on various dimensions of exploratory visual anal-ysis. Thus a more ecologically valid setting, in which users performopen-ended exploratory analysis, is appropriate. However, studyingecologically valid behavior imposes practical constraints. Exploratoryvisual analysis is a complex process, requiring careful analysis of bothquantitative interactive event log data and qualitative data concerninginsight discovery. We also anticipate that datasets with different se-mantics can lead to different user behaviors, so it is necessary to in-clude dataset and visualization configuration as a factor and repeat thelatency conditions in more than one analysis scenario. As a result, wedecided to use a 2 (datasets) x 2 (latency conditions) mixed design.
Table 2 summarizes the latency for the primary interactive opera-tions supported in imMens (brushing and linking, selecting, panningand zooming) in the two latency conditions. In the control condition,the latency is simply the time taken by imMens to fetch data tiles,perform aggregation (roll-up) queries and re-render the display. In thedelay condition, we injected an additional 500 milliseconds for each ofthese operations. We experimented with different delays in pilot stud-ies. Initially we chose to inject an additional delay of 1 second, basedon the representative latencies of related data-processing systems. Ourpilot subjects found the system unusable, especially for operations likebrushing and linking. We thus reduced the additional delay to 500ms.Since there is little prior work on the time scales of different interactiveoperations in visual analysis, we applied the same amount of delay forall four operations to see if the operations have varying sensitivity tothe same delay.
To ensure the usability of the system in the delay condition, we im-plemented throttling and debouncing in imMens. Throttling preventsrepeated firings of the same event. For example, mouse movementswithin the same bar only trigger a single brushing event. Debouncingmaintains a queue of events being fired, delays processing by 500ms,and drops unprocessed events when a new event of the same kind ar-rives. The injected delay per operation thus does not result in a grow-ing accumulation of unprocessed events, preventing cascading delaysand thus substantial usability problems.
Both log transform and color scale adjustment are client-side ren-dering operations that do not incur data processing latency. We chosenot to inject delays into these two operations to maintain ecologicalvalidity. It is also beneficial to include both low- and high-latencyoperations so that we can examine if subjects preferentially use low-latency operations in favor of higher-latency ones.
3.3 Datasets and Visualizations
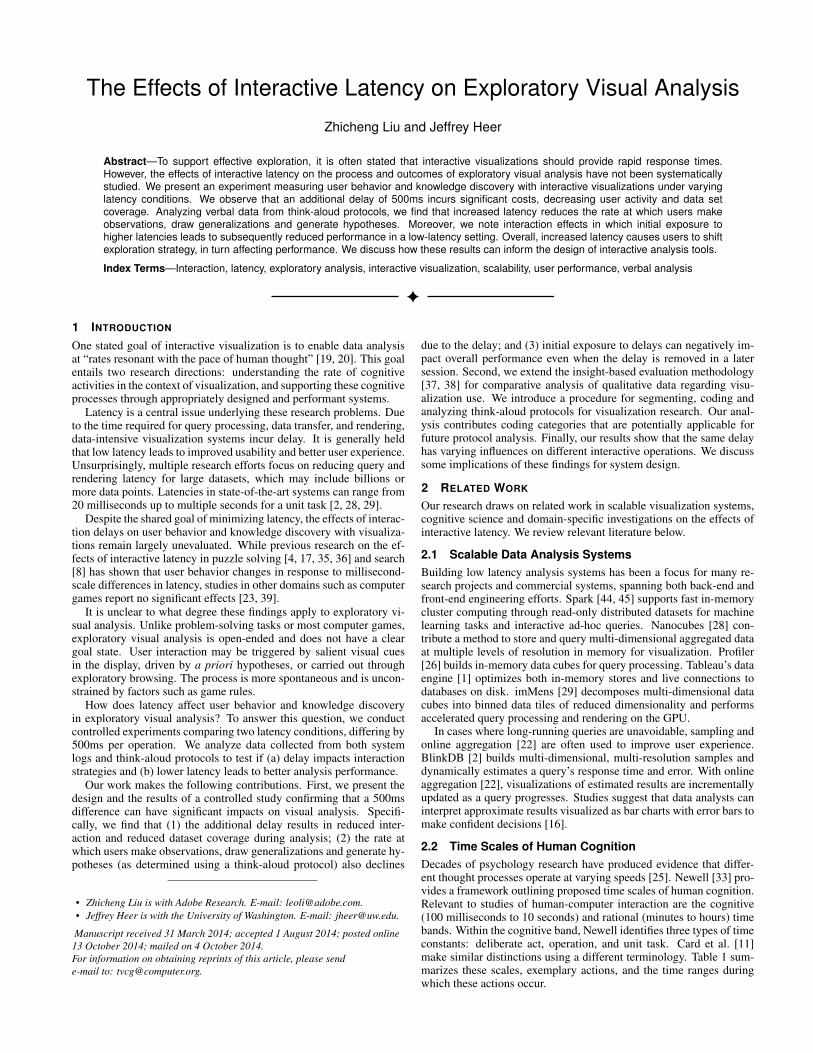
We use two publicly available datasets from different domains. Onecontains 4.5 million user check-ins on Brightkite [13], a location-based check-in service similar to Foursquare, over a period of twoyears. We visualize this dataset using five linked components (Figure1(a)): a multi-scale geographic heatmap showing the locations of thecheckins, three histograms showing the number of check-ins aggre-gated by month, day and hour, and a bar chart showing the numberof check-ins by the top 30 travelers whose check-ins span the greatestgeographic bounding box. The geographic heatmap has 8 zoom levels.
The other dataset consists of 140 million records about the on-timeperformance of domestic flights in the US from 1987 to 2008 [9]. Sub-jects explore this dataset using four linked visualizations (Figure 1(b)):a binned scatterplot showing departure delay against arrival delay, twobar charts showing the number of flights by carrier and year, and a his-togram showing the distribution of flights across months. The binnedscatterplot has 5 zoom levels.
(a) Five coordinated visualizations showing geographical and temporal dis-tribution of user checkins and top users.
(b) Four linked visualizations showing departure and arrival delays, carriers,yearly and monthly distribution of flights.
Fig. 1. Visualizations for the datasets used in the study.
Operation Control Condition Delay Conditionbrush & link 20 ms 520 ms
select 20 ms 520 mspan 100 ms 600 ms
zoom 1000 ms 1500 ms
Table 2. Average latencies for interactive operations, across conditions.
3.4 Study Procedure
We recruited 16 subjects from the San Francisco Bay Area. All par-ticipants had experience analyzing data using systems such as Excel,R and Tableau. We instructed the participants to perform two analysissessions, one dataset each. Every participant experienced both latencyconditions, but not all combinations of latency and dataset; the samedataset cannot be reused for different latency conditions due to learn-ing effects. For each subject, one dataset had the default latency andthe other dataset had the injected 500 millisecond delay. To controlfor order and learning effects, half of the subjects experienced delayin the first session and the other half experienced delay in the secondsession. The order of the dataset analyzed was also counterbalanced.
We first gave each subject a 15-minute tutorial on imMens for eachof the two analysis scenarios, teaching them how to interact with thevisualizations under the respective latency condition. Subjects thenspent approximately one hour exploring both datasets. They couldspend a maximum of 30 minutes on a single dataset, but could stoptheir analysis at any time if they felt nothing more could be found. Atthe end of each study, we conducted an exit interview. We did notinform the subjects about the injected delay in one of the two sessions.
We considered carefully the challenge of evaluating subjects’ per-formance when designing the study procedure. Compared with solv-ing a tightly-specified problem, visual analysis is open-ended andlacks clear-cut performance metrics. To this end, we were inspiredby the insight-based evaluation methodology proposed by Saraiya etal. [37, 38]. A fundamental premise of visualization research is that“the purpose of visualization is insight, not pictures” [10]. Insight-based evaluations collect qualitative data about the knowledge discov-
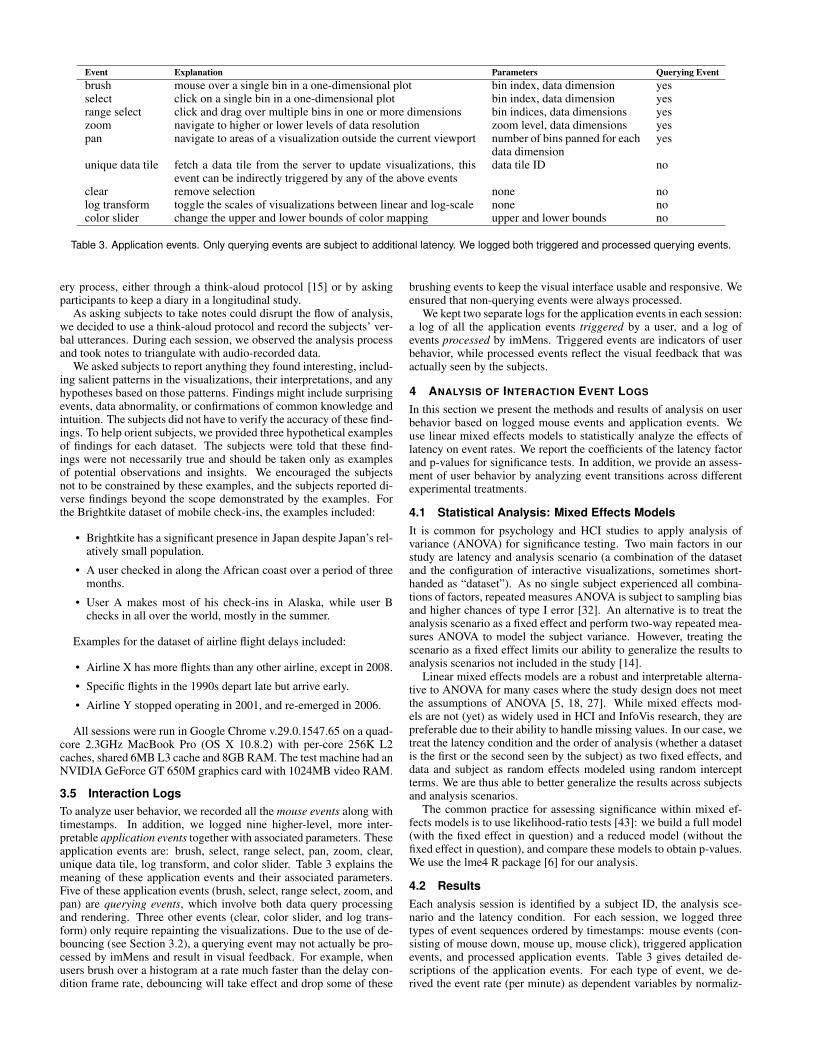
Event Explanation Parameters Querying Eventbrush mouse over a single bin in a one-dimensional plot bin index, data dimension yesselect click on a single bin in a one-dimensional plot bin index, data dimension yesrange select click and drag over multiple bins in one or more dimensions bin indices, data dimensions yeszoom navigate to higher or lower levels of data resolution zoom level, data dimensions yespan navigate to areas of a visualization outside the current viewport number of bins panned for each
data dimensionyes
unique data tile fetch a data tile from the server to update visualizations, thisevent can be indirectly triggered by any of the above events
data tile ID no
clear remove selection none nolog transform toggle the scales of visualizations between linear and log-scale none nocolor slider change the upper and lower bounds of color mapping upper and lower bounds no
Table 3. Application events. Only querying events are subject to additional latency. We logged both triggered and processed querying events.
ery process, either through a think-aloud protocol [15] or by askingparticipants to keep a diary in a longitudinal study.
As asking subjects to take notes could disrupt the flow of analysis,we decided to use a think-aloud protocol and record the subjects’ ver-bal utterances. During each session, we observed the analysis processand took notes to triangulate with audio-recorded data.
We asked subjects to report anything they found interesting, includ-ing salient patterns in the visualizations, their interpretations, and anyhypotheses based on those patterns. Findings might include surprisingevents, data abnormality, or confirmations of common knowledge andintuition. The subjects did not have to verify the accuracy of these find-ings. To help orient subjects, we provided three hypothetical examplesof findings for each dataset. The subjects were told that these find-ings were not necessarily true and should be taken only as examplesof potential observations and insights. We encouraged the subjectsnot to be constrained by these examples, and the subjects reported di-verse findings beyond the scope demonstrated by the examples. Forthe Brightkite dataset of mobile check-ins, the examples included:
• Brightkite has a significant presence in Japan despite Japan’s rel-atively small population.
• A user checked in along the African coast over a period of threemonths.
• User A makes most of his check-ins in Alaska, while user Bchecks in all over the world, mostly in the summer.
Examples for the dataset of airline flight delays included:
• Airline X has more flights than any other airline, except in 2008.
• Specific flights in the 1990s depart late but arrive early.
• Airline Y stopped operating in 2001, and re-emerged in 2006.
All sessions were run in Google Chrome v.29.0.1547.65 on a quad-core 2.3GHz MacBook Pro (OS X 10.8.2) with per-core 256K L2caches, shared 6MB L3 cache and 8GB RAM. The test machine had anNVIDIA GeForce GT 650M graphics card with 1024MB video RAM.
3.5 Interaction LogsTo analyze user behavior, we recorded all the mouse events along withtimestamps. In addition, we logged nine higher-level, more inter-pretable application events together with associated parameters. Theseapplication events are: brush, select, range select, pan, zoom, clear,unique data tile, log transform, and color slider. Table 3 explains themeaning of these application events and their associated parameters.Five of these application events (brush, select, range select, zoom, andpan) are querying events, which involve both data query processingand rendering. Three other events (clear, color slider, and log trans-form) only require repainting the visualizations. Due to the use of de-bouncing (see Section 3.2), a querying event may not actually be pro-cessed by imMens and result in visual feedback. For example, whenusers brush over a histogram at a rate much faster than the delay con-dition frame rate, debouncing will take effect and drop some of these
brushing events to keep the visual interface usable and responsive. Weensured that non-querying events were always processed.
We kept two separate logs for the application events in each session:a log of all the application events triggered by a user, and a log ofevents processed by imMens. Triggered events are indicators of userbehavior, while processed events reflect the visual feedback that wasactually seen by the subjects.
4 ANALYSIS OF INTERACTION EVENT LOGS
In this section we present the methods and results of analysis on userbehavior based on logged mouse events and application events. Weuse linear mixed effects models to statistically analyze the effects oflatency on event rates. We report the coefficients of the latency factorand p-values for significance tests. In addition, we provide an assess-ment of user behavior by analyzing event transitions across differentexperimental treatments.
4.1 Statistical Analysis: Mixed Effects ModelsIt is common for psychology and HCI studies to apply analysis ofvariance (ANOVA) for significance testing. Two main factors in ourstudy are latency and analysis scenario (a combination of the datasetand the configuration of interactive visualizations, sometimes short-handed as “dataset”). As no single subject experienced all combina-tions of factors, repeated measures ANOVA is subject to sampling biasand higher chances of type I error [32]. An alternative is to treat theanalysis scenario as a fixed effect and perform two-way repeated mea-sures ANOVA to model the subject variance. However, treating thescenario as a fixed effect limits our ability to generalize the results toanalysis scenarios not included in the study [14].
Linear mixed effects models are a robust and interpretable alterna-tive to ANOVA for many cases where the study design does not meetthe assumptions of ANOVA [5, 18, 27]. While mixed effects mod-els are not (yet) as widely used in HCI and InfoVis research, they arepreferable due to their ability to handle missing values. In our case, wetreat the latency condition and the order of analysis (whether a datasetis the first or the second seen by the subject) as two fixed effects, anddata and subject as random effects modeled using random interceptterms. We are thus able to better generalize the results across subjectsand analysis scenarios.
The common practice for assessing significance within mixed ef-fects models is to use likelihood-ratio tests [43]: we build a full model(with the fixed effect in question) and a reduced model (without thefixed effect in question), and compare these models to obtain p-values.We use the lme4 R package [6] for our analysis.
4.2 ResultsEach analysis session is identified by a subject ID, the analysis sce-nario and the latency condition. For each session, we logged threetypes of event sequences ordered by timestamps: mouse events (con-sisting of mouse down, mouse up, mouse click), triggered applicationevents, and processed application events. Table 3 gives detailed de-scriptions of the application events. For each type of event, we de-rived the event rate (per minute) as dependent variables by normaliz-
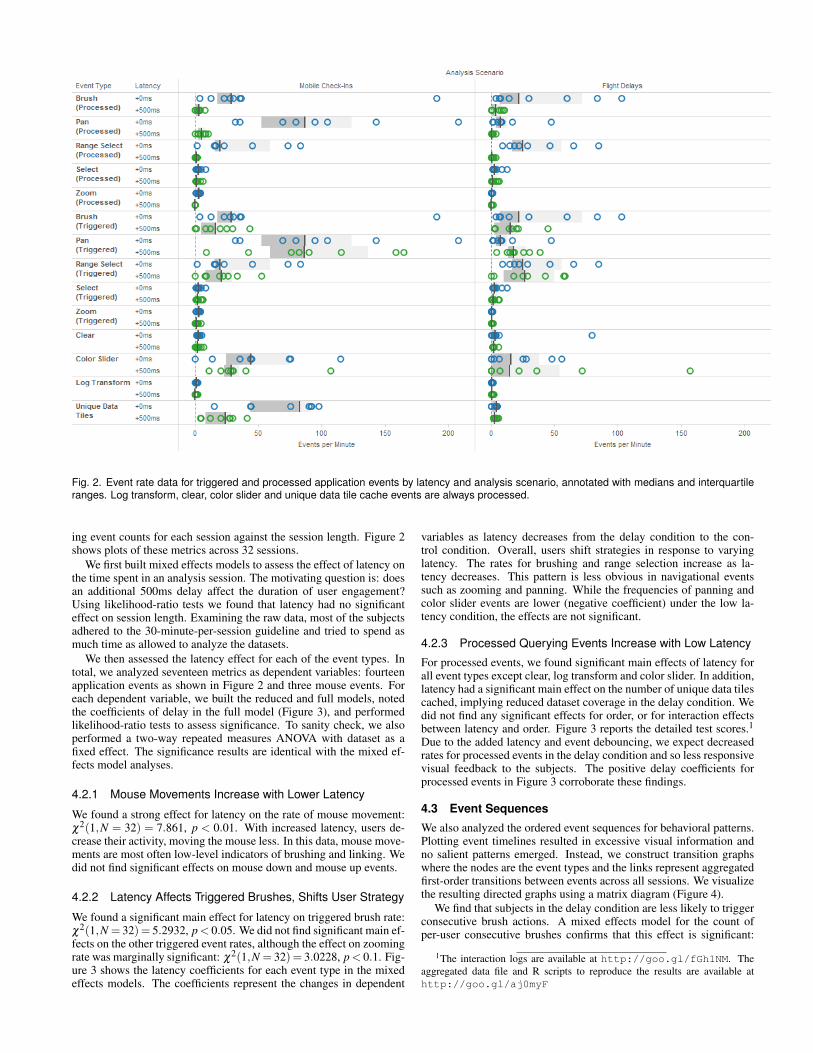
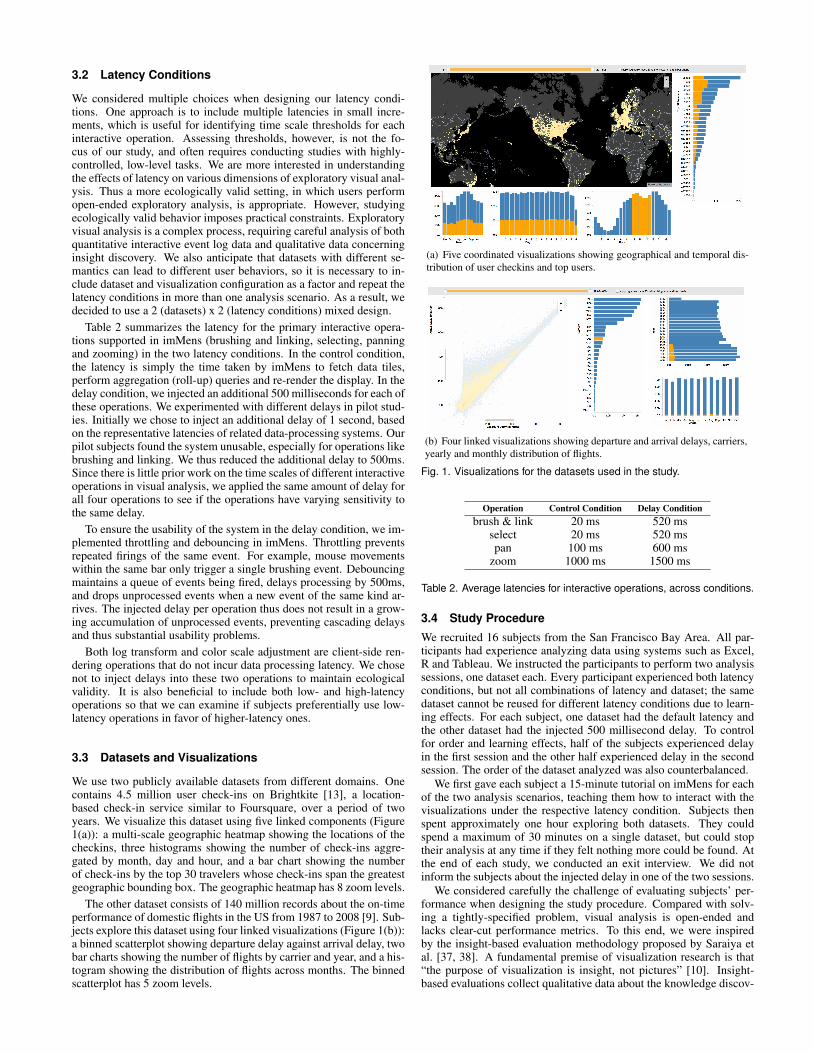
Fig. 2. Event rate data for triggered and processed application events by latency and analysis scenario, annotated with medians and interquartileranges. Log transform, clear, color slider and unique data tile cache events are always processed.
ing event counts for each session against the session length. Figure 2shows plots of these metrics across 32 sessions.
We first built mixed effects models to assess the effect of latency onthe time spent in an analysis session. The motivating question is: doesan additional 500ms delay affect the duration of user engagement?Using likelihood-ratio tests we found that latency had no significanteffect on session length. Examining the raw data, most of the subjectsadhered to the 30-minute-per-session guideline and tried to spend asmuch time as allowed to analyze the datasets.
We then assessed the latency effect for each of the event types. Intotal, we analyzed seventeen metrics as dependent variables: fourteenapplication events as shown in Figure 2 and three mouse events. Foreach dependent variable, we built the reduced and full models, notedthe coefficients of delay in the full model (Figure 3), and performedlikelihood-ratio tests to assess significance. To sanity check, we alsoperformed a two-way repeated measures ANOVA with dataset as afixed effect. The significance results are identical with the mixed ef-fects model analyses.
4.2.1 Mouse Movements Increase with Lower Latency
We found a strong effect for latency on the rate of mouse movement:χ2(1,N = 32) = 7.861, p < 0.01. With increased latency, users de-crease their activity, moving the mouse less. In this data, mouse move-ments are most often low-level indicators of brushing and linking. Wedid not find significant effects on mouse down and mouse up events.
4.2.2 Latency Affects Triggered Brushes, Shifts User Strategy
We found a significant main effect for latency on triggered brush rate:χ2(1,N = 32) = 5.2932, p< 0.05. We did not find significant main ef-fects on the other triggered event rates, although the effect on zoomingrate was marginally significant: χ2(1,N = 32) = 3.0228, p< 0.1. Fig-ure 3 shows the latency coefficients for each event type in the mixedeffects models. The coefficients represent the changes in dependent
variables as latency decreases from the delay condition to the con-trol condition. Overall, users shift strategies in response to varyinglatency. The rates for brushing and range selection increase as la-tency decreases. This pattern is less obvious in navigational eventssuch as zooming and panning. While the frequencies of panning andcolor slider events are lower (negative coefficient) under the low la-tency condition, the effects are not significant.
4.2.3 Processed Querying Events Increase with Low Latency
For processed events, we found significant main effects of latency forall event types except clear, log transform and color slider. In addition,latency had a significant main effect on the number of unique data tilescached, implying reduced dataset coverage in the delay condition. Wedid not find any significant effects for order, or for interaction effectsbetween latency and order. Figure 3 reports the detailed test scores.1Due to the added latency and event debouncing, we expect decreasedrates for processed events in the delay condition and so less responsivevisual feedback to the subjects. The positive delay coefficients forprocessed events in Figure 3 corroborate these findings.
4.3 Event Sequences
We also analyzed the ordered event sequences for behavioral patterns.Plotting event timelines resulted in excessive visual information andno salient patterns emerged. Instead, we construct transition graphswhere the nodes are the event types and the links represent aggregatedfirst-order transitions between events across all sessions. We visualizethe resulting directed graphs using a matrix diagram (Figure 4).
We find that subjects in the delay condition are less likely to triggerconsecutive brush actions. A mixed effects model for the count ofper-user consecutive brushes confirms that this effect is significant:
1The interaction logs are available at http://goo.gl/fGh1NM. Theaggregated data file and R scripts to reproduce the results are available athttp://goo.gl/aj0myF
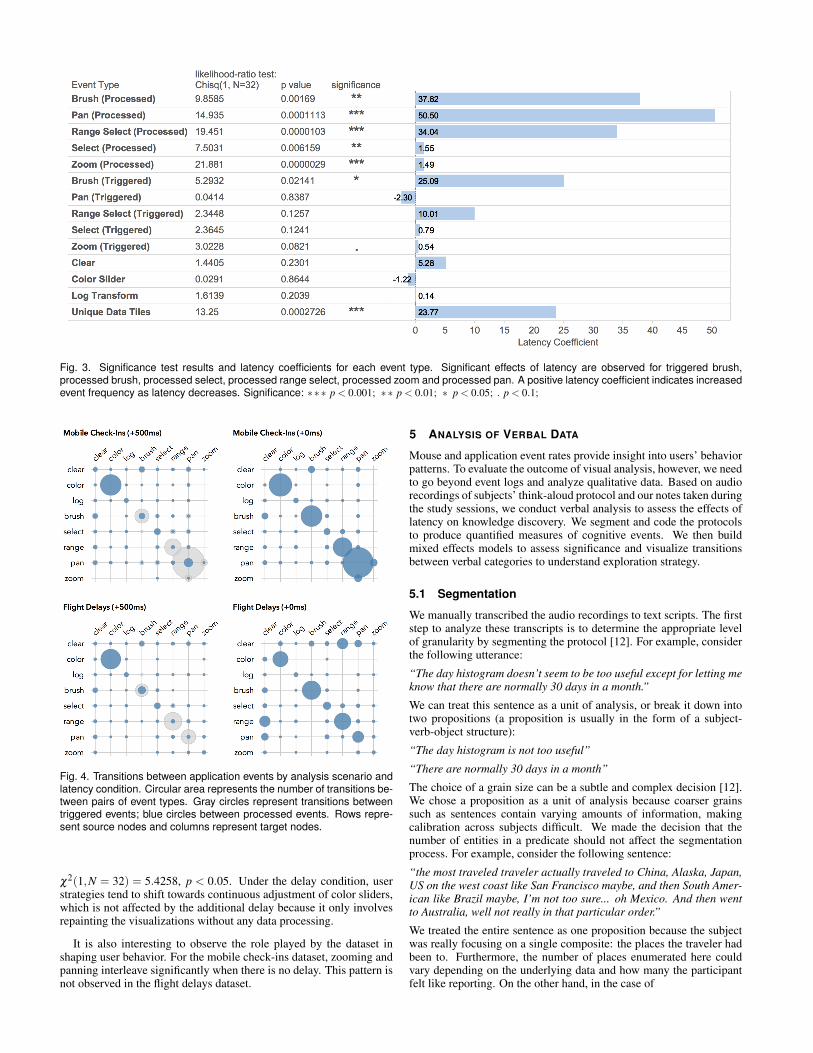
Fig. 3. Significance test results and latency coefficients for each event type. Significant effects of latency are observed for triggered brush,processed brush, processed select, processed range select, processed zoom and processed pan. A positive latency coefficient indicates increasedevent frequency as latency decreases. Significance: ∗∗∗ p < 0.001; ∗∗ p < 0.01; ∗ p < 0.05; . p < 0.1;
Fig. 4. Transitions between application events by analysis scenario andlatency condition. Circular area represents the number of transitions be-tween pairs of event types. Gray circles represent transitions betweentriggered events; blue circles between processed events. Rows repre-sent source nodes and columns represent target nodes.
χ2(1,N = 32) = 5.4258, p < 0.05. Under the delay condition, userstrategies tend to shift towards continuous adjustment of color sliders,which is not affected by the additional delay because it only involvesrepainting the visualizations without any data processing.
It is also interesting to observe the role played by the dataset inshaping user behavior. For the mobile check-ins dataset, zooming andpanning interleave significantly when there is no delay. This pattern isnot observed in the flight delays dataset.
5 ANALYSIS OF VERBAL DATA
Mouse and application event rates provide insight into users’ behaviorpatterns. To evaluate the outcome of visual analysis, however, we needto go beyond event logs and analyze qualitative data. Based on audiorecordings of subjects’ think-aloud protocol and our notes taken duringthe study sessions, we conduct verbal analysis to assess the effects oflatency on knowledge discovery. We segment and code the protocolsto produce quantified measures of cognitive events. We then buildmixed effects models to assess significance and visualize transitionsbetween verbal categories to understand exploration strategy.
5.1 Segmentation
We manually transcribed the audio recordings to text scripts. The firststep to analyze these transcripts is to determine the appropriate levelof granularity by segmenting the protocol [12]. For example, considerthe following utterance:
“The day histogram doesn’t seem to be too useful except for letting meknow that there are normally 30 days in a month.”
We can treat this sentence as a unit of analysis, or break it down intotwo propositions (a proposition is usually in the form of a subject-verb-object structure):
“The day histogram is not too useful”
“There are normally 30 days in a month”
The choice of a grain size can be a subtle and complex decision [12].We chose a proposition as a unit of analysis because coarser grainssuch as sentences contain varying amounts of information, makingcalibration across subjects difficult. We made the decision that thenumber of entities in a predicate should not affect the segmentationprocess. For example, consider the following sentence:
“the most traveled traveler actually traveled to China, Alaska, Japan,US on the west coast like San Francisco maybe, and then South Amer-ican like Brazil maybe, I’m not too sure... oh Mexico. And then wentto Australia, well not really in that particular order.”
We treated the entire sentence as one proposition because the subjectwas really focusing on a single composite: the places the traveler hadbeen to. Furthermore, the number of places enumerated here couldvary depending on the underlying data and how many the participantfelt like reporting. On the other hand, in the case of
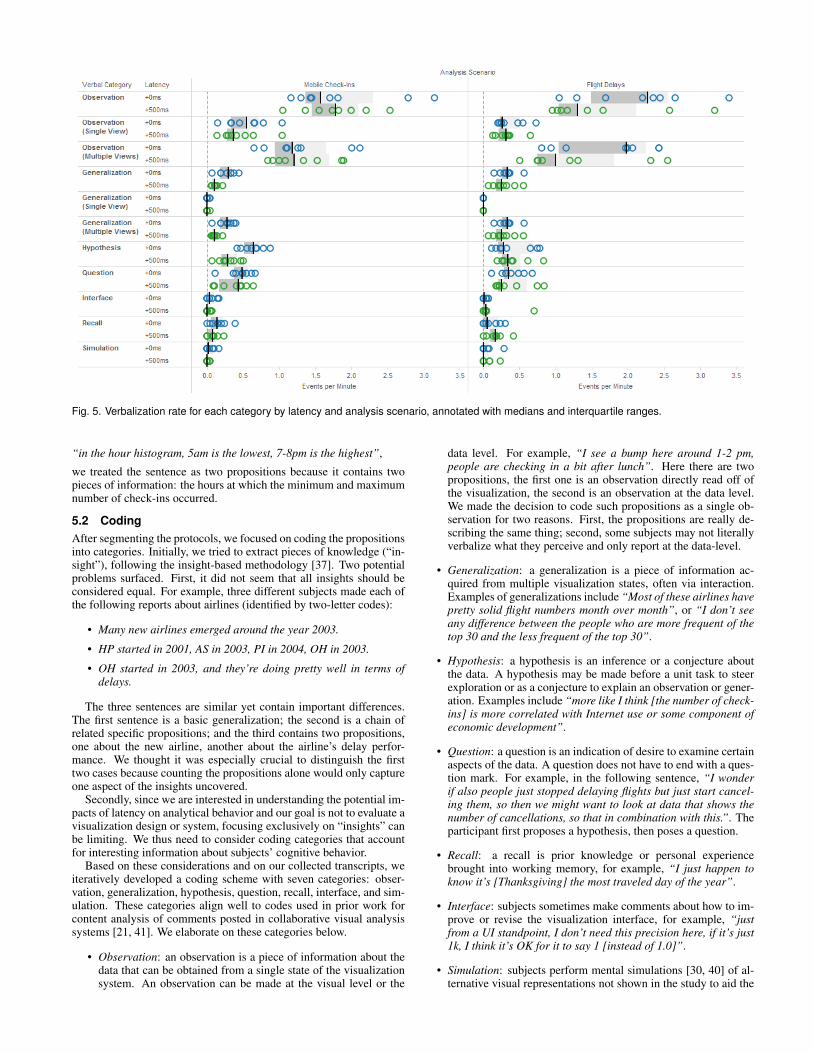
Fig. 5. Verbalization rate for each category by latency and analysis scenario, annotated with medians and interquartile ranges.
“in the hour histogram, 5am is the lowest, 7-8pm is the highest”,
we treated the sentence as two propositions because it contains twopieces of information: the hours at which the minimum and maximumnumber of check-ins occurred.
5.2 CodingAfter segmenting the protocols, we focused on coding the propositionsinto categories. Initially, we tried to extract pieces of knowledge (“in-sight”), following the insight-based methodology [37]. Two potentialproblems surfaced. First, it did not seem that all insights should beconsidered equal. For example, three different subjects made each ofthe following reports about airlines (identified by two-letter codes):
• Many new airlines emerged around the year 2003.
• HP started in 2001, AS in 2003, PI in 2004, OH in 2003.
• OH started in 2003, and they’re doing pretty well in terms ofdelays.
The three sentences are similar yet contain important differences.The first sentence is a basic generalization; the second is a chain ofrelated specific propositions; and the third contains two propositions,one about the new airline, another about the airline’s delay perfor-mance. We thought it was especially crucial to distinguish the firsttwo cases because counting the propositions alone would only captureone aspect of the insights uncovered.
Secondly, since we are interested in understanding the potential im-pacts of latency on analytical behavior and our goal is not to evaluate avisualization design or system, focusing exclusively on “insights” canbe limiting. We thus need to consider coding categories that accountfor interesting information about subjects’ cognitive behavior.
Based on these considerations and on our collected transcripts, weiteratively developed a coding scheme with seven categories: obser-vation, generalization, hypothesis, question, recall, interface, and sim-ulation. These categories align well to codes used in prior work forcontent analysis of comments posted in collaborative visual analysissystems [21, 41]. We elaborate on these categories below.
• Observation: an observation is a piece of information about thedata that can be obtained from a single state of the visualizationsystem. An observation can be made at the visual level or the
data level. For example, “I see a bump here around 1-2 pm,people are checking in a bit after lunch”. Here there are twopropositions, the first one is an observation directly read off ofthe visualization, the second is an observation at the data level.We made the decision to code such propositions as a single ob-servation for two reasons. First, the propositions are really de-scribing the same thing; second, some subjects may not literallyverbalize what they perceive and only report at the data-level.
• Generalization: a generalization is a piece of information ac-quired from multiple visualization states, often via interaction.Examples of generalizations include “Most of these airlines havepretty solid flight numbers month over month”, or “I don’t seeany difference between the people who are more frequent of thetop 30 and the less frequent of the top 30”.
• Hypothesis: a hypothesis is an inference or a conjecture aboutthe data. A hypothesis may be made before a unit task to steerexploration or as a conjecture to explain an observation or gener-ation. Examples include “more like I think [the number of check-ins] is more correlated with Internet use or some component ofeconomic development”.
• Question: a question is an indication of desire to examine certainaspects of the data. A question does not have to end with a ques-tion mark. For example, in the following sentence, “I wonderif also people just stopped delaying flights but just start cancel-ing them, so then we might want to look at data that shows thenumber of cancellations, so that in combination with this.”. Theparticipant first proposes a hypothesis, then poses a question.
• Recall: a recall is prior knowledge or personal experiencebrought into working memory, for example, “I just happen toknow it’s [Thanksgiving] the most traveled day of the year”.
• Interface: subjects sometimes make comments about how to im-prove or revise the visualization interface, for example, “justfrom a UI standpoint, I don’t need this precision here, if it’s just1k, I think it’s OK for it to say 1 [instead of 1.0]”.
• Simulation: subjects perform mental simulations [30, 40] of al-ternative visual representations not shown in the study to aid the
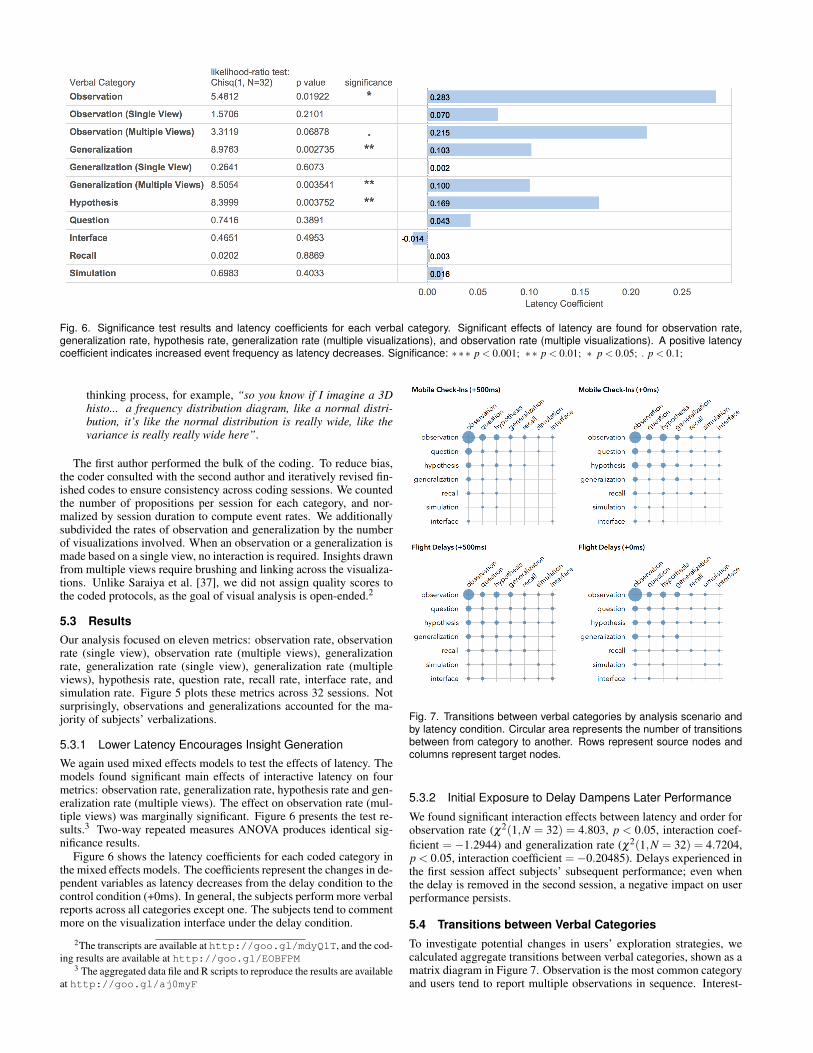
Fig. 6. Significance test results and latency coefficients for each verbal category. Significant effects of latency are found for observation rate,generalization rate, hypothesis rate, generalization rate (multiple visualizations), and observation rate (multiple visualizations). A positive latencycoefficient indicates increased event frequency as latency decreases. Significance: ∗∗∗ p < 0.001; ∗∗ p < 0.01; ∗ p < 0.05; . p < 0.1;
thinking process, for example, “so you know if I imagine a 3Dhisto... a frequency distribution diagram, like a normal distri-bution, it’s like the normal distribution is really wide, like thevariance is really really wide here”.
The first author performed the bulk of the coding. To reduce bias,the coder consulted with the second author and iteratively revised fin-ished codes to ensure consistency across coding sessions. We countedthe number of propositions per session for each category, and nor-malized by session duration to compute event rates. We additionallysubdivided the rates of observation and generalization by the numberof visualizations involved. When an observation or a generalization ismade based on a single view, no interaction is required. Insights drawnfrom multiple views require brushing and linking across the visualiza-tions. Unlike Saraiya et al. [37], we did not assign quality scores tothe coded protocols, as the goal of visual analysis is open-ended.2
5.3 ResultsOur analysis focused on eleven metrics: observation rate, observationrate (single view), observation rate (multiple views), generalizationrate, generalization rate (single view), generalization rate (multipleviews), hypothesis rate, question rate, recall rate, interface rate, andsimulation rate. Figure 5 plots these metrics across 32 sessions. Notsurprisingly, observations and generalizations accounted for the ma-jority of subjects’ verbalizations.
5.3.1 Lower Latency Encourages Insight Generation
We again used mixed effects models to test the effects of latency. Themodels found significant main effects of interactive latency on fourmetrics: observation rate, generalization rate, hypothesis rate and gen-eralization rate (multiple views). The effect on observation rate (mul-tiple views) was marginally significant. Figure 6 presents the test re-sults.3 Two-way repeated measures ANOVA produces identical sig-nificance results.
Figure 6 shows the latency coefficients for each coded category inthe mixed effects models. The coefficients represent the changes in de-pendent variables as latency decreases from the delay condition to thecontrol condition (+0ms). In general, the subjects perform more verbalreports across all categories except one. The subjects tend to commentmore on the visualization interface under the delay condition.
2The transcripts are available at http://goo.gl/mdyQ1T, and the cod-ing results are available at http://goo.gl/EOBFPM
3 The aggregated data file and R scripts to reproduce the results are availableat http://goo.gl/aj0myF
Fig. 7. Transitions between verbal categories by analysis scenario andby latency condition. Circular area represents the number of transitionsbetween from category to another. Rows represent source nodes andcolumns represent target nodes.
5.3.2 Initial Exposure to Delay Dampens Later Performance
We found significant interaction effects between latency and order forobservation rate (χ2(1,N = 32) = 4.803, p < 0.05, interaction coef-ficient = −1.2944) and generalization rate (χ2(1,N = 32) = 4.7204,p < 0.05, interaction coefficient =−0.20485). Delays experienced inthe first session affect subjects’ subsequent performance; even whenthe delay is removed in the second session, a negative impact on userperformance persists.
5.4 Transitions between Verbal Categories
To investigate potential changes in users’ exploration strategies, wecalculated aggregate transitions between verbal categories, shown as amatrix diagram in Figure 7. Observation is the most common categoryand users tend to report multiple observations in sequence. Interest-
ingly, the rate of transitions between observation and other data-relatedcategories (“generalization”, “hypothesis” and “question”) in both di-rections are significantly reduced in the delay condition (χ2(1,N =32) = 12.309, p < 0.001). This result indicates that not only do sub-jects perform knowledge discovery at a higher rate under low latencyconditions, their explorations are arguably more dynamic, engaging insensemaking loops of observing, generalizing and hypothesizing.
6 DISCUSSION
Our experimental results for both event logs and verbalizations providenew insights into the effects of latency on exploratory visual analysis.
6.1 Exploration StrategyOur analysis of interaction event logs provides evidence of users shift-ing strategies when the latency changes. We report significant effectsin which increased latency reduces mouse movement and triggeredbrush rates. On the other hand, the effects on zooming and panningrate are not significant.
We hypothesize that panning rate is not affected because the delayonly applies to the plotting of data, not the background map images.User thus could reposition the map interactively in a relatively unen-cumbered fasion. Zooming, on the other hand, may fall into a differentcognitive time scale, as discussed in Section 2.2. Users thus may havehigher tolerances for the delay. According to Card et al.’s definition,brushing is a “perceptual fusion” act: when brushing results in visualfeedback within 100ms or less, consecutive visual updates fuse intoone percept. Subjects’ verbal reports corroborate this finding: “this islike a nice movie here” (P6), “I think it’s obvious that once I have ananimated gif I can stare at it” (P4). The added delay likely impedesthis fusion effect. The injected delay also slows the system responsetime by a factor of 25 over the ~20 ms baseline. As a result, when itbecomes costly to perform brushing and range selection, users changetheir behavior to reduce short-term effort. In contrast, zooming maytake place at the “unprepared response” time scale; the relative in-crease in latency accounts for only half of the baseline.
A potential reason for decreased performance in the delay conditionis that the less responsive interface dampens user motivation. How-ever, latency had no significant effect on session length or questionrate, an indication that users had similar levels of interest in the dataunder both latency conditions. We hypothesize that the shift in ex-ploration strategy together with the effect of debouncing impacts userperformance. Since we found no significant effects on observationrate and generalization rate based on a single visualization view, thedifferences in performance can be attributed to observation and gen-eralization rates involving multiple views. Given that insights drawnfrom multiple visualizations depend heavily on brushing and selecting,user performance is adversely affected with the additional delay.
6.2 User Perception of DelayAt the end of each study, we asked subjects if they noticed anythingdifferent about the system between the two sessions. While many par-ticipants clearly observed the difference in latency, 6 out of 16 subjectsdid not report a noticeable difference in terms of system responsive-ness. Out of these six subjects, half experienced delay in the first ses-sion and half analyzed the mobile check-in dataset first. One subject(P9) even remarked:
“One thing that jumps out at me then is the fact that both of thesethings (datasets) were equivalently responsive, despite the scale of thesecond [dataset] is like .. you said, one versus a hundred? but yeah interms of responsiveness the two kind of feel the same.”
We informed subjects at the end of the study that we were investigatingpotential impacts of latency on user behavior. 15 out of 16 subjects didnot think the delay, whether perceptible or not, had any influence ontheir interactions. Our interpretation of such feedback is that the sub-jects did not deliberately choose different strategies. The affordancesand constraints of interactive interfaces, however, often influence cog-nitive behavior without the need for mindful planning and deliberation[42].
6.3 Implications for System Design
Our study confirms that an injected delay of half a second per oper-ation adversely affects user performance in exploratory data analysis.To conclude that high latency is bad, however, would be an over sim-plification. As the experiment results demonstrate, some operations,such as zooming, are less sensitive to delay than others. In optimizingsystem performance, we can take such observations into considera-tion. Traditionally, visualization system design often takes a modularapproach: the visualization pipeline is divided into stages with dedi-cated components for data management, scene graph construction andrendering. Optimization efforts have largely centered around each ofthese pieces separately. For example, a number of efforts are con-cerned with speeding up data processing with little consideration of thecorresponding user interface design. Our study suggests the value oftaking a user-centric approach to system optimization. Instead of uni-formly focusing on reducing latency for each of the processing stagesin the visualization pipeline, a potential optimization strategy is to ana-lyze the interaction space supported by the visual interface and balancecomputational resources between interactive operators. For example,more aggressive caching or prefetching methods may be employed foroperations sensitive to small variations in latency, such as brushingand linking.
7 FUTURE WORK AND CONCLUSION
In this research, we have found that interactive latency can play an im-portant role in shaping user behavior and impacts the outcomes of ex-ploratory visual analysis. Delays of 500ms incurred significant costs,decreasing user activity and data set coverage while reducing rates ofobservation, generalization and hypothesis. Moreover, initial exposureto higher latency interactions resulted in reduced rates of observationand generalization during subsequent analysis sessions in which fullsystem performance was restored.
In addition, our work demonstrates an operationalized procedurefor the analysis of verbal data collected through think-aloud protocols.We contribute coding categories that capture various types of verbalutterances. These categories can potentially be useful in future studiesof qualitative experiment data from exploratory data analysis.
One limitation of our study is that we only collected event logsand verbal data. Gaze data from an eye-tracker could be a valuableadjunct. Analyzing where the subjects were looking might provideadditional insights into their exploration strategy. For example, underhigher latency, subjects might plan more by scrutinizing visualizationscarefully and relying more on working memory. We leave such eye-tracking studies to future work.
Our study also presents evidence that the effects of interactive la-tency on exploratory visual analysis go beyond the simplistic assertionthat low latency uniformly improves usability and performance. Thesame amount of delay can exert varying degrees of influence on differ-ent interactive operators, in turn affecting higher-level cognitive strat-egy. An important task for future work is to investigate more precisetime scale thresholds for each of the major interaction techniques in vi-sualization. Another interesting study is to analyze user behavior withthe injected additional delays as a fixed percentage of the time scalethresholds identified for each operation. When designing interactiveanalysis systems, researchers should not only try to reduce latency, butalso be aware of differential effects for different interactive operations.When computational resources are constrained, careful decisions areneeded to determine an optimized allocation of resources.
Finally, the exploratory analysis tasks are completely open-endedin our study. Users thus may abandon an exploration path if the inter-action cost appears too high. It would be interesting to investigate userbehavior with more constrained tasks in follow-up experiments.
8 ACKNOWLEDGMENTS
We thank Stu Card for the insightful discussion on time scales in hu-man cognition and Andreas Paepcke for his help in participant recruit-ment. This research was supported by the Intel Science & TechnologyCenter (ISTC) for Big Data and DARPA XDATA.
REFERENCES
[1] Tableau software. http://www.tableausoftware.com.[2] S. Agarwal, B. Mozafari, A. Panda, H. Milner, S. Madden, and I. Sto-
ica. BlinkDB: Queries with bounded errors and bounded response timeson very large data. In Proc. ACM European Conference on ComputerSystems (EuroSys), pages 29–42, 2013.
[3] D. H. Ballard, M. M. Hayhoe, and J. B. Pelz. Memory representations innatural tasks. J. Cognitive Neuroscience, 7(1):66–80, Jan. 1995.
[4] D. H. Ballard, M. M. Hayhoe, P. K. Pook, and R. P. Rao. Deicticcodes for the embodiment of cognition. Behavioral and Brain Sciences,20(04):723–742, 1997.
[5] D. J. Barr, R. Levy, C. Scheepers, and H. J. Tily. Random effects structurefor confirmatory hypothesis testing: Keep it maximal. Journal of Memoryand Language, 68(3):255–278, Apr. 2013.
[6] D. Bates, M. Maechler, and B. Bolker. lme4: Linear mixed-effects mod-els using S4 classes. 2012.
[7] T. Beigbeder, R. Coughlan, C. Lusher, J. Plunkett, E. Agu, and M. Clay-pool. The effects of loss and latency on user performance in Unreal tour-nament 2003. In Proc. ACM SIGCOMM Workshop on Network and sys-tem support for games, pages 144–151, 2004.
[8] J. Brutlag. Speed matters for google web search. Google. June, 2009.[9] Bureau of Transportation Statistics. Airline on-time performance data,
2013. http://www.transtats.bts.gov /DL SelectFields.asp?Table ID=236.[10] S. K. Card, J. D. Mackinlay, and B. Shneiderman. Readings in Informa-
tion Visualization: Using Vision to Think. Morgan Kaufmann Publishers,San Francisco, CA, 1999.
[11] S. K. Card, T. P. Moran, and A. Newell. The Psychology of Human-Computer Interaction. Routledge, 1983.
[12] M. T. Chi. Quantifying qualitative analyses of verbal data: A practicalguide. The Journal of the Learning Sciences, 6(3):271–315, 1997.
[13] E. Cho, S. A. Myers, and J. Leskovec. Friendship and mobility: usermovement in location-based social networks. In Proc. ACM SIGKDDConference on Knowledge Discovery and Data Mining, pages 1082–1090, 2011.
[14] H. H. Clark. The language-as-fixed-effect fallacy: A critique of languagestatistics in psychological research. Journal of Verbal Learning and Ver-bal Behavior, 12(4):335–359, 1973.
[15] K. A. Ericsson and H. A. Simon. Protocol Analysis. MIT press, 1985.[16] D. Fisher, I. Popov, and S. Drucker. Trust me, I’m partially right: In-
cremental visualization lets analysts explore large datasets faster. InProc. ACM SIGCHI Conference on Human Factors in Computing Sys-tems (CHI), 2012.
[17] W. D. Gray and D. A. Boehm-Davis. Milliseconds matter: An introduc-tion to microstrategies and to their use in describing and predicting inter-active behavior. Journal of Experimental Psychology: Applied, 6(4):322,2000.
[18] S. Green, J. Heer, and C. D. Manning. The efficacy of human post-editing for language translation. In Proc. ACM SIGCHI Conference onHuman Factors in Computing Systems (CHI), CHI ’13, pages 439–448,New York, NY, USA, 2013.
[19] P. Hanrahan. Analytic database technologies for a new kind of user: thedata enthusiast. In Proc. ACM SIGMOD International Conference onManagement of Data, pages 577–578, 2012.
[20] J. Heer and B. Shneiderman. Interactive dynamics for visual analysis.ACM Queue, 10(2):30, 2012.
[21] J. Heer, F. B. Viegas, and M. Wattenberg. Voyagers and voyeurs: support-ing asynchronous collaborative information visualization. In Proc. ACMSIGCHI Conference on Human Factors in Computing Systems (CHI),pages 1029–1038, 2007.
[22] J. M. Hellerstein, P. J. Haas, and H. J. Wang. Online aggregation. ACMSIGMOD Record, 26(2):171–182, 1997.
[23] T. Henderson. Latency and user behaviour on a multiplayer game server.In Proc. Third International COST264 Workshop on Networked GroupCommunication, NGC ’01, page 113, London, UK, UK, 2001. Springer-Verlag.
[24] R. Jota, A. Ng, P. Dietz, and D. Wigdor. How fast is fast enough?: a studyof the effects of latency in direct-touch pointing tasks. In Proc. ACMSIGCHI Conference on Human Factors in Computing Systems (CHI),pages 2291–2300, 2013.
[25] D. Kahneman. Thinking, Fast and Slow. Farrar, Straus and Giroux, 2011.[26] S. Kandel, R. Parikh, A. Paepcke, J. M. Hellerstein, and J. Heer. Profiler:
Integrated statistical analysis and visualization for data quality assess-
ment. In Proc. Advanced Visual Interfaces (AVI), pages 547–554, 2012.[27] C. Krueger and L. Tian. A comparison of the general linear mixed model
and repeated measures ANOVA using a dataset with multiple missingdata points. Biological Research for Nursing, 6(2):151–157, Oct. 2004.PMID: 15388912.
[28] L. Lins, J. Klosowski, and C. Scheidegger. Nanocubes: Fast visualizationof large spatiotemporal datasets. IEEE Transactions on Visualization andComputer Graphics, 19(12), 2013.
[29] Z. Liu, B. Jiang, and J. Heer. imMens: real-time visual querying of bigdata. Computer Graphics Forum, 32(3pt4):421–430, 2013.
[30] Z. Liu and J. T. Stasko. Mental models, visual reasoning and interactionin information visualization: A top-down perspective. IEEE Transactionson Visualization and Computer Graphics, 16(6):999–1008, 2010.
[31] A. Michotte. The Perception of Causality. Basic Books, Oxford, England,1963.
[32] K. E. Muller and C. N. Barton. Approximate power for repeated-measures anova lacking sphericity. Journal of the American StatisticalAssociation, 84(406):549–555, 1989.
[33] A. Newell. Unified Theories of Cognition, volume 187. Harvard Univer-sity Press, 1994.
[34] A. Ng, J. Lepinski, D. Wigdor, S. Sanders, and P. Dietz. Designing forlow-latency direct-touch input. In Proc. ACM Symposium on User Inter-face Software and Technology (UIST), UIST ’12, pages 453–464, NewYork, NY, USA, 2012.
[35] K. P. O’Hara and S. J. Payne. The effects of operator implementation coston planfulness of problem solving and learning. Cognitive Psychology,35(1):34–70, 1998.
[36] K. P. O’Hara and S. J. Payne. Planning and the user interface: the effectsof lockout time and error recovery cost. International Journal of Human-Computer Studies, 50(1):41–59, Jan. 1999.
[37] P. Saraiya, C. North, and K. Duca. An insight-based methodology forevaluating bioinformatics visualizations. IEEE Transactions on Visual-ization and Computer Graphics, 11(4):443–456, Aug. 2005.
[38] P. Saraiya, C. North, V. Lam, and K. A. Duca. An insight-based longitu-dinal study of visual analytics. IEEE Transactions on Visualization andComputer Graphics, 12(6):1511–1522, 2006.
[39] N. Sheldon, E. Girard, S. Borg, M. Claypool, and E. Agu. The effect oflatency on user performance in warcraft III. In Proc. 2nd Workshop onNetwork and system support for games, page 314, 2003.
[40] J. G. Trafton, S. B. Trickett, and F. E. Mintz. Connecting internal and ex-ternal representations: Spatial transformations of scientific visualizations.Foundations of Science, 10(1):89–106, 2005.
[41] F. B. Viegas, M. Wattenberg, M. McKeon, F. Van Ham, and J. Kriss.Harry potter and the meat-filled freezer: A case study of spontaneoususage of visualization tools. In Proc. Hawaii International Conferenceon System Sciences (HICSS), pages 159–159. IEEE, 2008.
[42] T. D. Wilson. Strangers to Ourselves: Discovering the Adaptive Uncon-scious. Harvard University Press, June 2009.
[43] B. Winter. Linear models and linear mixed effects models in R withlinguistic applications. arXiv:1308.5499 [cs], Aug. 2013.
[44] M. Zaharia, M. Chowdhury, T. Das, A. Dave, J. Ma, M. McCauley, M. J.Franklin, S. Shenker, and I. Stoica. Resilient distributed datasets: Afault-tolerant abstraction for in-memory cluster computing. In Proce. 9thUSENIX Conference on Networked Systems Design and Implementation(NSDI), page 22, 2012.
[45] M. Zaharia, M. Chowdhury, M. J. Franklin, S. Shenker, and I. Stoica.Spark: cluster computing with working sets. In Proc. 2nd USENIX Con-ference on Hot Topics in Cloud Computing, page 1010, 2010.