The Effects of Hydrostatic Pressure on Early Endothelial ...
120
University of Kentucky University of Kentucky UKnowledge UKnowledge Theses and Dissertations--Biomedical Engineering Biomedical Engineering 2013 The Effects of Hydrostatic Pressure on Early Endothelial The Effects of Hydrostatic Pressure on Early Endothelial Tubulogenic Processes Tubulogenic Processes Ryan M. Underwood University of Kentucky, [email protected] Right click to open a feedback form in a new tab to let us know how this document benefits you. Right click to open a feedback form in a new tab to let us know how this document benefits you. Recommended Citation Recommended Citation Underwood, Ryan M., "The Effects of Hydrostatic Pressure on Early Endothelial Tubulogenic Processes" (2013). Theses and Dissertations--Biomedical Engineering. 7. https://uknowledge.uky.edu/cbme_etds/7 This Master's Thesis is brought to you for free and open access by the Biomedical Engineering at UKnowledge. It has been accepted for inclusion in Theses and Dissertations--Biomedical Engineering by an authorized administrator of UKnowledge. For more information, please contact [email protected].
Transcript of The Effects of Hydrostatic Pressure on Early Endothelial ...

University of Kentucky University of Kentucky
UKnowledge UKnowledge
Theses and Dissertations--Biomedical Engineering Biomedical Engineering
2013
The Effects of Hydrostatic Pressure on Early Endothelial The Effects of Hydrostatic Pressure on Early Endothelial
Tubulogenic Processes Tubulogenic Processes
Ryan M. Underwood University of Kentucky, [email protected]
Right click to open a feedback form in a new tab to let us know how this document benefits you. Right click to open a feedback form in a new tab to let us know how this document benefits you.
Recommended Citation Recommended Citation Underwood, Ryan M., "The Effects of Hydrostatic Pressure on Early Endothelial Tubulogenic Processes" (2013). Theses and Dissertations--Biomedical Engineering. 7. https://uknowledge.uky.edu/cbme_etds/7
This Master's Thesis is brought to you for free and open access by the Biomedical Engineering at UKnowledge. It has been accepted for inclusion in Theses and Dissertations--Biomedical Engineering by an authorized administrator of UKnowledge. For more information, please contact [email protected].

STUDENT AGREEMENT: STUDENT AGREEMENT:
I represent that my thesis or dissertation and abstract are my original work. Proper attribution
has been given to all outside sources. I understand that I am solely responsible for obtaining
any needed copyright permissions. I have obtained and attached hereto needed written
permission statements(s) from the owner(s) of each third-party copyrighted matter to be
included in my work, allowing electronic distribution (if such use is not permitted by the fair use
doctrine).
I hereby grant to The University of Kentucky and its agents the non-exclusive license to archive
and make accessible my work in whole or in part in all forms of media, now or hereafter known.
I agree that the document mentioned above may be made available immediately for worldwide
access unless a preapproved embargo applies.
I retain all other ownership rights to the copyright of my work. I also retain the right to use in
future works (such as articles or books) all or part of my work. I understand that I am free to
register the copyright to my work.
REVIEW, APPROVAL AND ACCEPTANCE REVIEW, APPROVAL AND ACCEPTANCE
The document mentioned above has been reviewed and accepted by the student’s advisor, on
behalf of the advisory committee, and by the Director of Graduate Studies (DGS), on behalf of
the program; we verify that this is the final, approved version of the student’s dissertation
including all changes required by the advisory committee. The undersigned agree to abide by
the statements above.
Ryan M. Underwood, Student
Dr. Hainsworth Y. Shin, Major Professor
Dr. Abhijit Patwardhan, Director of Graduate Studies

THE EFFECTS OF HYDROSTATIC PRESSURE ON EARLY ENDOTHELIAL TUBULOGENIC PROCESSES
____________________________
THESIS __________________________________
A thesis submitted in partial fulfillment of the requirements for the degree of Master of Science in Biomedical Engineering
in the College of Engineering at the University of Kentucky
By
Ryan M. Underwood
Director: Dr. Hainsworth Y. Shin, Professor of Biomedical Engineering
Lexington, Kentucky
2013
Copyright © Ryan Underwood 2013

ABSTRACT OF THESIS
THE EFFECTS OF HYDROSTATIC PRESSURE ON EARLY ENDOTHELIAL TUBULOGENIC PROCESSES
The effects of mechanical forces on endothelial cell function and behavior are well documented, but have not been fully characterized. Specifically, fluid pressure has been shown to elicit physical and chemical responses known to be involved in the initiation and progression of endothelial cell-mediated vascularization. Central to the process of vascularization is the formation of tube-like structures. This process—tubulogenesis—is essential to both the physiological and pathological growth of tissues. Given the known effects of pressure on endothelial cells and its ubiquitous presence in the vasculature, we investigated pressure as a magnitude-dependent parameter for the regulation of endothelial tubulogenic activity. To accomplish this, we exposed two- and three-dimensional bovine aortic endothelial cell (BAEC) cultures to static pressures of 0, 20, and 40 mmHg for 3 and 4 days. The most significant findings were: (1) cells in two-dimensional culture exposed to 20, but not 40, mmHg exhibited significantly (p < 0.05) increased expression of both VEGF-C and VEGFR-3, and (2) cells in three-dimensional culture exposed to 20, but not 40, mmHg exhibited significant (p > 0.05) increases in endothelial sprouting. These findings evince the utility of pressure as a selective modulator of tissue microvascularization in vitro and implicate pressure as factor in pathological tubulogenesis in vivo.
KEYWORDS: angiogenesis, lymphangiogenesis, pressure, mechanotransduction, tissue-engineering
_______________________________
_______________________________

THE EFFECTS OF HYDROSTATIC PRESSURE ON EARLY ENDOTHELIAL TUBULOGENIC PROCESSES
by
Ryan Underwood
Master of Science in Biomedical Engineering in the College of Engineering at the University of Kentucky
_________________________________________ Dr. Hainsworth Shin, Director of Thesis
_________________________________________ Dr. Abhijit Patwardhan, Director of Graduate Studies _________________________________________ Date

iii
Acknowledgements
I would like to acknowledge Dr. Hainsworth Shin for his consistent support, patience, and enthusiasm throughout the research discussed herein. I would also like to thank Dr. David Puleo (University of Kentucky) and Dr. Thomas Dziubla (University of Kentucky) for serving on my thesis committee and their thoughtful comments. Furthermore, I would like to thank Dr. Steven Lai-Fook (University of Kentucky) for his assistance with and providing equipment for the pressure system. I would like to thank Dr. Xiaoyan Zhang for her assistance with the flow cytometry experiments. I would also like to thank Xingjian Lei for completing extra experiment replicates where needed.

iv
Table of Contents
List of Figures viii
List of Tables xi
1. Introduction 1
1.1 Fundamentals of Tissue Engineering 2
1.2 The Vasculature: Structure and Hemodynamics 4
Blood Vessels 4
Endothelial Cells 5
Mechanoenvironment of Endothelial Cells 8
1.3 Tubulogenesis 9
Tubulogenesis In Vivo 9
Tubulogenesis In Vitro 12
Clinical Implications 14
1.4 Tubulogenic Growth Factor Signaling 14
Vascular Endothelial Growth Factors (VEGFs) 15
Fibroblast Growth Factors (FGFs) 18
FGF and VEGF Synergy in Angiogenesis and Lymphangiogenesis 19
1.5 Effects of Pressure on Endothelial Cells 20
2. Rationale 22

v
3. Materials and Methods 24
3.1 Cell Substrates 24
3.2 Cell Lines, Culture Conditions, and Passaging 25
3.3 Cell Storage 26
3.4 Cell Seeding 27
Two-Dimensional Substrates: Seeding in Multi-well Tissue Culture Plates 27
Three-Dimensional Substrates: Seeding on Cytodex3TM Microcarrier Beads 27
3.5 Pressure System 28
3.6 Proliferation Assay 32
Seeding and Pressure Exposure 32
Fixation, Labeling, and Quantification 33
3.7 Flow Cytometric Analysis of VEGFR-3 and VEGF-C Expression 34
Seeding and Pressure Exposure 34
Immunofluorescence Labeling of Cells 34
3.8 Three-Dimensional Collagen Gel Assays 35
Preparation of Endothelialized Beads 35
Collagen Gel Formulation 36
Gel Polymerization 37
Two-Layer Gel Polymerization 38
Single-Layer Gel Polymerization 39
3.9 Imaging 40
3.10 Migration/Invasion Assay Analysis 41
3.11 Tube Formation Assay Analysis 43

vi
3.12 Statistical Analysis 44
4. Results 45
4.1 BAEC Culture on Two-Dimensional Substrates 45
4.2 Crystal Violet Uptake by BAEC 46
4.3 BAEC Seeding on Cytodex3TM Microcarrier Beads 46
4.4 Generation of Sustained Hydrostatic Pressures 47
4.5 Increase of BAEC Cell Density by Stimulation with Basic Fibroblast Growth Factor 50
4.6 Effect of Sustained Hydrostatic Pressure on BAEC Population Growth 51
4.7 Effect of Sustained Hydrostatic Pressure on BAEC Morphology 54
4.8 Role of VEGFR-3 in the Mediation of Pressure-Induced Endothelial Proliferation 55
4.9 Effects of Pressure on VEGF-C and VEGFR-3 Expression 56
4.10 Effects of Pressures on BAEC Migration and Invasion of a Three-Dimensional Collagen Matrix 57
4.11 Effects of Local Growth Factor Concentrations on BAEC Tubulogenesis 60
4.12 Effects of a 20 mmHg Sustained Hydrostatic Pressure on BAEC Tubulogenesis 65
4.13 Effects of a 40 mmHg Sustained Hydrostatic Pressure on BAEC
Tubulogenesis 69
5. Discussion 74
5.1 Physiological Relevance of the Hydrostatic Pressures Used 74
5.2 Selection of Cell Type and Three-Dimensional Matrix Composition 75
5.3 Experimental Setup for Pressure Experiments 77
5.4 Confirmation of Cellular Responses of BAEC Grown in Two-Dimensional

vii
Culture to Sustained Hydrostatic Pressures 79
Pressure Upregulates Proliferation at 20 mmHg, but not 40 mmHg, after Three Days of Exposure 79
Pressure Induces Morphological Changes in Endothelial Cells 82
MAZ-51 Inhibitor Blocks Increased Proliferation in Response to Pressure 82
Increased VEGF-C and VEGFR-3 Expression to Sustained Pressure Exposure 85
5.5 Investigation of the Effects of Sustained Pressure on Endothelial Migration and Invasion 85
5.6 Investigation of the Effect of Sustained Pressures on Endothelial Tube Formation 90
5.7 Concluding Remarks 97
References 100
Vita 104

viii
List of Figures
Figure 1.2a – Progression of Sprouting Angiogenesis 10 Figure 3.5a – Three-Dimensional Model of Pressure Chambers 30 Figure 3.5b – Schematic Representation of the Pressure System 31 Figure 3.8b – 2-Layer Gel Polymerization 39 Figure 3.8c – Single-Layer Gel Polymerization 40 Figure 3.10a – InvasiQuant ImageJ Macro Code 42 Figure 4.1a – BAEC Cultured on Two-Dimensional Surface 45 Figure 4.2a – BAEC Stained with Crystal Violet 46 Figure 4.3a – BAEC Seeded on Cytodex3TM Microcarrier Bead 47 Figure 4.4a – Pressure Measurement Methods 48 Figure 4.4b – Pulsatile Pressure Measurement 49 Figure 4.5a – Effect of Exogenous FGF-2 on Cell Density 50 Figure 4.6a – Effects of 20 and 40 mmHg Pressures on Cell Density (72 hours) 51 Figure 4.6b – Comparison of Effects of 20 and 40 mmHg Pressures on Cell Density (72 hours) 53 Figure 4.7a – Morphological Effect of Pressure on Cells Grown on Two-Dimensional Tissue Culture Surfaces 54 Figure 4.8a – Pressure Response-Blocking Effect of MAZ51 55 Figure 4.9a – Pressure Up-regulation of VEGF-C and VEGFR-3 Expression 56 Figure 4.10a – Migration Assay Images Processed Using InvasiQuant ImageJ Macro 57 Figure 4.10b – Effect of Exogenous Growth Factors on Endothelial Migration After 72and 96 Hours 58 Figure 4.10c – Effect of 20 and 40 mmHg Hydrostatic Pressures on Endothelial
Migration After 72 and 96 Hours 59

ix
Figure 4.11a – Example Image of Tubulogenic Sprouting and Measurement 61 Figure 4.11b – Representative Images of Tubulogenic Sprouting under Control Pressure Under Various Growth Factor Conditions 61 Figure 4.11c – Effects of FGF-2, VEGF-A, and FGF-2+VEGF-A on BAEC Sprouting 63 Figure 4.11d – Effects of FGF-2, VEGF-A, and FGF-2+VEGF-A on BAEC Sprout Length 64 Figure 4.12a – Representative Images of the Effect of 20 mmHg on Tubulogenic Sprouting (72 Hours) 65 Figure 4.12b – Representative Images of the Effect of 20 mmHg on Tubulogenic Sprouting (96 Hours) 66 Figure 4.12c – Effect of 20 mmHg Hydrostatic Pressure on the Total Number of Sprouts Formed per Bead (72/96 Hours) 66 Figure 4.12d – Effect of 20 mmHg Hydrostatic Pressure on the Number of Sprouts per Bead of Length Greater than 75 µm (72/96 Hours) 67 Figure 4.12e – Effect of 20 mmHg Hydrostatic Pressure on the Number of Sprouts per Bead of Length Greater than 150 µm (72/96 Hours) 68 Figure 4.12f – Effect of 20 mmHg Hydrostatic Pressure on the Mean Sprout Length
per Bead (72/96 Hours) 69 Figure 4.13a – Representative Images of the Effect of 40 mmHg on Tubulogenic Sprouting (72 Hours) 70 Figure 4.13b – Representative Images of the Effect of 40 mmHg on Tubulogenic Sprouting (96 Hours) 71 Figure 4.13c – Effect of 40 mmHg Hydrostatic Pressure on the Total Number of Sprouts Formed per Bead (72/96 Hours) 71 Figure 4.13d – Effect of 40 mmHg Hydrostatic Pressure on the Number of Sprouts per Bead of Length Greater than 75 µm (72/96 Hours) 72 Figure 4.13e –Effect of 40 mmHg Hydrostatic Pressure on the Number of Sprouts per Bead of Length Greater than 150 µm (72/96 Hours) 73 Figure 4.13f – Effect of 20 mmHg Hydrostatic Pressure on the Mean Sprout Length
per Bead (72/96 Hours) 73

x
Figure 5.1a – Local Blood Pressure Levels Throughout the Circulatory System 74 Figure 5.5a – Representative Images of Migration Assay Image Processing 86 Figure 5.6a – Growth Factor Signaling Pathway Diagram and Pressure Effect 94

xi
List of Tables
Table 1.4a – Table of Known Pro-Tubulogenic Effects of VEGF-A 16 Table 1.4b – Table of Known Pro-Tubulogenic Effects of VEGF-C 17 Table 1.4c – Table of Known Pro-Tubulogenic Effects of FGF-2 18 Table 3.8a – Collagen Gel Formulation 36 Table 5.6a – Summary of Significant (p > 0.05) Differences between Pressure and Control Cultures 93

1
1. Introduction
Vascularization and blood flow are critical elements of any viable, living tissue
whether the tissue is grown in vitro or in vivo. Blood vessels are the first organ developed
during embryogenesis and eventually becomes the largest organ in the human body [1].
The most important function of the vascular system is the delivery of oxygen and
nutrients to and the removal of waste products from peripheral tissues [2]. Mammalian
cells require a constant supply of oxygen and blood-borne nutrients for survival [3]. The
most predominant limiting factor in the clinical application of tissue engineering is the
inability to generate microvasculature de novo [3]. Tissue constructs greater than one to
two millimeters thick require a capillary network for the maintenance and function of
cells within them [3]. Below this threshold thickness, cells receive oxygen by simple
diffusion. In tissues thicker than one to two millimeters, the lack of a capillary network
connected to the host tissue limits the generation of synthetic tissue constructs to
thicknesses that are generally too thin for clinical applications [3]. Except for cartilage,
tissues in the body can overcome insufficient perfusion by constructing capillary
networks that provide conduits for convective transport of nutrients, dissolved gases, and
waste products to and from tissues [3]. Inducing and controlling this process in tissue-
engineered constructs presents a unique challenge in mass transport that must be
overcome in order to produce clinically viable tissues beyond the one-to-two millimeter
thickness limitation, such as large tissue masses and whole organs [3]. In addition to the
challenges it presents in the tissue engineering context, abnormal or insufficient vessel
growth plays a major role in human health and the pathogenesis of many congenital (e.g.

2
vascular malformations, DiGeorge syndrome) and non-congenital disorders (e.g.,
atherosclerosis, cancer, macular degeneration, Compartment Syndrome) [1].
1.1. Fundamentals of Tissue Engineering
Tissue engineering is a multidisciplinary field in which significant advances in
biochemistry, cell biology, genetics, biomedical engineering and materials science have
made possible the use of synthetic or naturally derived, engineered biomaterials to
replace damaged or defective tissues, such as bone, skin, and even organs [4].
Tissue engineering involves the culture of mammalian cells (e.g., skin, muscle,
cartilage, bone, endothelial, and stem cells) on a large scale in order to create new tissues
and functional organs [4]. A typical tissue engineering application may consist of a
biological or synthetic “scaffold” that when implanted in the body—as a temporary
structure—provides a template that allows the body’s own cells to grow and form new
tissues while the scaffold is gradually absorbed [4]. Currently, there are three approaches
to optimize nutrient transport in these scaffolds: (1) stimulating rapid vessel growth in
avascular implants with angiogenic factors; (2) seeding biodegradable polymer scaffolds,
which provide bulk, with endothelial cells and angiogenic factors; and (3) pre-
vascularizing the artificial tissue before implantation [5]. Each of these approaches has
exhibited promising results, but only the third approach—pre-vascularization with the
expectation that the new microvessel network will rapidly integrate with the host
microcirculation—eliminates the need for vascularization in situ post-implantation [5].
Implanting pre-vascularized tissues is, thus, anticipated to ensure uninterrupted fluid
transport and long-term survival of cells at the center of the tissue [5].

3
Initiation of the self-assembly of blood vessels when pre-vascularizing tissues is a
complex endeavor. Schechner et al. (2000) have shown that endothelial cells will form
“cords”—non-luminal cell-cell structural connections—in fibronectin gels in vitro that
will integrate with the host’s vascular system after implantation in vivo [6]. Nehls and
Drenkhan (1995) showed that endothelial cells grown on microcarrier beads embedded in
collagen will form “capillary-like” structures when co-cultured with supporting cell types
that express pro-angiogenic growth factors [7]. Dietrich and Lelkes (2005) showed that
endothelial cells are also capable of forming the same “capillary-like” structures when
co-cultured with angiogenesis-supporting cell types in collagen matrices [8]. However,
thick tissues will require fully formed capillaries containing lumens and these structures
do not, or rarely do, form and cannot be sustained in collagen matrices [5]. Thus, the
formation of fully functioning, sustainable microvasculature will require a matrix
composed of a multi-component extracellular matrix containing cells types that support
angiogenesis.
To this point, tissue engineering applications have been severely limited to
constructs that are two millimeters in thickness or less due to the difficulty in generating
native vascular networks in tissue-engineered constructs [5]. Current tissue-engineered
constructs are predominantly avascular, with the delivery of nutrients and removal of
waste occurring by diffusion [9]. Because the diffusion distance of oxygen is 100-200
microns, avascular tissues grown in vitro are limited to this thickness range [3].
Mammalian cells must be located within the oxygen diffusion range (100-200 microns)
of a blood vessel in vivo so as to satisfy their nutritional needs for proper functioning [3].
Growing larger, more complex structures in vitro will require a vascular network that

4
supports cellular viability and function with vessels furnishing overlapping regions of
tissues with the essential gas and nutrient supply [3].
The limitations imposed by the inability of current strategies to successfully
prevascularize tissue-engineered constructs must be overcome as the current organ
transplant waitlist stands at over 100,000 patients [9]. Currently, approximately 2,000
patients die per year while waiting on a donor organ transplants, as current capacity only
allows roughly 50% of patients to receive the vital organ transplants they need to survive
[9]. In vitro grown organs, though a distant goal, is nonetheless one significant way that
deaths from donor organ shortages can be eliminated. Furthermore, tissue-engineered
replacement organs can avoid many of the problems that patients face upon receiving
donor tissues. By using a patient’s own cells to cultivate tissues to replace those that are
damaged and diseased, the risk of rejection is significantly attenuated and the need for
immunosuppressive drugs may be eliminated [4]. These combined effects reduce both the
cost of medical treatment as well as patient mortality rates. The ultimate goal is totally
replacing the need for donor organs with tissue-engineered organs, but technical obstacles
must first be overcome [4]. All in all, it is estimated that tissue-engineering solutions
potentially could address diseases and disorders accounting for about half of the nation’s
total healthcare costs [4].
1.2 The Vasculature: Structure and Hemodynamics
Blood Vessels
Blood vessel is a term that encompasses, generally, every type of blood-carrying
conduit within an organism. Their primary function is the efficient transport of blood to

5
downstream tisues so as to promote the exchange of oxygen and nutrients for carbon
dioxide and cellular waste within the tissues that they infiltrate [2, 10]. Blood vessels
typically extend throughout an organism in a branched network wherein large, thick-
walled vessels empty into incrementally smaller, thinner-walled vessels ultimately
culminating in capillaries which are comprised of only a single layer of endothelial cells
wrapped with a monolayer of perivascular cells [2, 10]. In humans, the morphology of
the circulatory network consists of a branching of arteries into smaller arterioles from
which a dense network of capillaries branch. The capillaries then coalesce into venules
and then larger veins responsible for returning blood back to the heart [10].
In the larger vessels, the endothelial monolayer is supported by two thick outer
layers of connective tissue capable of sustaining the large, pulsatile pressures
characteristic of the macrocirculation. The outermost layer, the tunica adventitia, is a
zone of connective tissue composed of collagenous and elastic fibers that enable a
vessel’s elasticity [2]. The layer in between the outermost and innermost layers, onto
which the endothelial cells attach, is the tunica media, which is composed of alternating
layers of elastic fibers and smooth muscle cells (SMCs) [2].
Endothelial Cells
The average adult human body contains approximately 1×10¹³ endothelial cells
[11] Endothelial cells comprise the non-thrombogenic cellular monolayer that lines the
interior surface of all blood and lymphatic vessels [2]. The endothelium is versatile and
multifunctional and has many synthetic and metabolic roles, including the regulation of
thrombosis and thrombolysis, platelet adherence, modulation of vascular tone and blood
flow, and regulation of immune and inflammatory responses by controlling leukocyte and

6
platelet interactions with the vessel wall [11]. These functions are modulated by
endothelial cells themselves in response to the continually changing chemical
environment as well as the forces generated by the circulation of blood (or lymph in the
lymphatic system) [2, 12].
Endothelial cells all derive from the same endothelial progenitor cell, but they
may terminally differentiate into different phenotypes. For example, endothelial cells can
differentiate into either arterial or venous endothelial cells during embryonic
development and display remarkable phenotypic plasticity depending on their location in
the body [1, 11]. Reportedly, it is possible that there might be as many different
endothelial cell types as there are organs in the body [1,11]. For example, it has been
shown that the expression and activity of Angiopoietin-1 (Ang-1) and vascular
endothelial growth factor-A (VEGF-A), two potent angiogenic factors, vary greatly in
different tissues depending on their vascularity [1, 11]. As another example of the
phenotypic diversity of endothelial cells, the ability of Ang-1 to promote endothelial cell
proliferation and survival is also organ- or tissue-specific [1, 13]. Notably, it has been
shown that Ang-1 stimulates angiogenesis in the skin, but exerts the opposite effect in the
heart where it suppresses vascular growth [13]. Such a difference is likely due to the fact
that blood vessel remodeling and reconstruction is much more prevalent in epidermal
tissues than cardiac tissues. The realization of such location-specific endothelial
phenotypes provides opportunities for specialized angiogenic and vasculogenic therapies
[1].
In addition to providing mechanical strength, the endothelial monolayer serves as
a permeability barrier between the blood circulating in the vascular system and the

7
surrounding extravascular tissues [1]. The intercellular junctions between cells enable the
mechanical strength and selective permeability properties of the endothelial cell
monolayer. In quiescent vessels, the presence of adherens and tight junctions determine
the mechanical strength and barrier properties of the endothelium [1]. Moreover,
intercellular junctions not only create the structural barrier between the blood and the
tissues, but also transmit signals critical for endothelial cell survival and intercellular
signaling [1]. These junctions also dissolve during vessel spouting to allow individual
cells to migrate, but are then reestablished during vessel construction [1]. Generally,
VEGF signaling results in a “loosening” of these intercellular junctions and Ang-1
signaling results in “tightening” of these junctions [1].
Endothelial cells also engage in both autocrine and paracrine cell signaling with
the smooth muscle cells to regulate vascular tone during blood flow control [11]. They
also communicate through inflammatory mediators with the circulating white blood cells
and platelets to modulate the immune response and the blood coagulation cascade [11].
But one of the most vital roles of endothelial cells is neovascularization and vascular
remodeling. Endothelial cells are largely responsible for the initiation of angiogenic and
lymphangiogenic processes. Despite the fact that endothelial cells are elongated, thin, and
fragile cells, they are able to construct conduits capable of withstanding the mechanical
forces generated as the heart drives blood throughout the vascular network [11]. And
though the formation of large blood and lymphatic vessels also requires the actions of
other cell types such as pericytes, fibroblasts, and smooth muscle cells (SMCs), the
formation of the smallest blood vessels, capillaries, is mediated by endothelial cells [2,
11].

8
Mechanoenvironment of Endothelial Cells
Endothelial cells exist as a thin monolayer on a deformable substrate and are in
contact with a dynamic, incompressible, flowing fluid [12]. External forces applied to
endothelial cells are caused by the hydrodynamic and hydrostatic forces applied by blood
and lymph and extrinsic stresses and strains caused by muscle contraction or vessel
compliance [2]. These physiological conditions result in the exposure of endothelial cells
to three predominant external mechanical forces: hydrodynamic pressure, fluid shear
stress, and tensile stress [2, 14].
The effect of hemodynamic stresses—those resulting from the flow of blood or
lymph—in modulating both normal and pathological endothelial functions is supported
by ample evidence [2]. Studies of the effects of mechanical forces on vascular
remodeling have been focused primarily on shear stress and substrate strain. Shear stress
(i.e., wall shear stress) results from the frictional drag imparted on endothelial cells as
blood flows over the monolayer surface [2]. Substrate strain (also, substrate tension or
substrate stretch) is the circumferential stretch of the vessel wall, to which the endothelial
monolayer is attached, caused by the pressure gradient between the blood vessel lumen
and the vessel exterior [2]. Both shear stress and substrate strain have been the subject of
both in vitro and in vivo studies. In vivo studies have demonstrated that each of the
aforementioned mechanical stimuli promotes different types of angiogenesis [2].
Substrate tension initiates or upregulates sprouting angiogenesis and shear stress initiates
or upregulates intussusceptive angiogenesis [2]. The discovery of different angiogenic
responses to different mechanical stimuli could indicate that these mechanical signals are
transduced through different biochemical pathways [2]. Such a possibility lends credence

9
to proposition that the endothelial response to hydrostatic pressure, in isolation from the
other hemodynamic forces, could involve a unique intracellular mechanotransduction
pathway.
1.3. Tubulogenesis
Tubulogenesis In Vivo
Tubulogenesis encompasses the process by which endothelial tubes are formed
and stabilized with the eventual development into a microvascular network. The three
types of tubulogenic processes mediated by endothelium include: angiogenesis,
lymphangiogenesis, and vasculogenesis. Angiogenesis, generally, is the vascular process
by which new blood vessels are formed from preexisting blood vessels [2].
Lymphangiogenesis is a process analogous to angiogenesis, but describes the process as
it occurs for lymphatic vessels [15]. Vasculogenesis is defined as the process by which
endothelial precursor cells called angioblasts differentiate into endothelial cells and form
a primitive vascular network de novo [16]. Angiogenesis and vasculogenesis were
initially considered discrete and independent events; however, it is now recognized that
neovascularization is a more complex process that may involve both types of vessel
formation within a single microenvironment [17].
With respect to angiogenesis (and lymphangiogenesis), there are two sub-types of
vessel formation: sprouting angiogenesis and intussusceptive angiogenesis [2, 18]. The
process of

10
sprouting tubulogenesis is shown in Figure 1.2a. In both angiogenesis and
lymphangiogenesis, endothelial cells are predominantly responsible for the initiation and
progression of tube formation [2, 18]. The type of angiogenesis of interest in this study is
sprouting angiogenesis, a process that consists of five sequential steps:
(1) dissolution of the basement membrane and detachment of pericytes at the site
of branching;
(2) migration of endothelial cells toward the extracellular space and formation of
a multicellular sprout;
(3) proliferation of endothelial cells (“trunk cells”) behind a leading cell (“tip
cell”);
(4) morphological differentiation and formation of a lumen in the endothelial
sprout;
Figure 1.2a – Progression of sprouting angiogenesis. (A) Endothelial cell (EC) is stimulated by pro-angiogenic growth factors, (B) EC (“tip cell”) degrades local extracellular matrix (ECM) elongates and migrates into the surrounding tissue space, (C) Other ECs (“trunk cells”) follow the “tip cell” in invasion of the ECM, (D) ECs form multi-cellular sprout and begin forming a luminal structure, and (E) ECs for a patent lumen, recruit supporting cell types, and anastomose with other capillary structures.

11
(5) recruitment of supporting cell types (e.g., pericytes, fibroblasts, smooth
muscle cells) and formation of the basement membrane around the new vessel
[2, 18].
Steps 1 – 4 constitute what could be defined as “early tubulogenic activity” [2, 18, 19].
These early tubulogenic activities are followed by the arrest of proliferation and vessel
stabilization with the formation of a basement membrane around the new tube and the
recruitment of pericytes [2, 18]. The stabilization phase is essential to vessel
development, as early-stage endothelial tubes will rapidly undergo apoptosis and
regression without stabilization. [2, 18].
The role that the extracellular matrix (ECM) plays in both the direction of vessel
growth and the preservation of new vessels cannot be understated. The ECM regulates
the formation of new vessel sprouts and, when vascular cells migrate to form new
sprouts, this matrix network is proteolytically broken down and its composition altered.
[1]. Prior to vessel stabilization, the provisional extracellular matrix composed of
fibronectin, fibrin, and other components provides a support scaffold, guiding endothelial
cells to their targets [1]. Vessel stabilization is greatly enabled by supporting interstitial
cells types (e.g., pericytes, fibroblasts, SMCs) and extracellular matrix (ECM) proteins
[1]. The ECM provides the necessary contacts between endothelial cells and the
surrounding tissue that prevent vessels from collapsing [1, 2]. Quiescent, stable vessels
are encased by a basement membrane comprised of Type IV collagen, laminin, and other
proteins [1, 2]. Surrounding this membrane is an interstitial matrix of Type I collagen and
elastin, which provides viscoelasticity and strength to the vessel wall [2].

12
Tubulogenesis in Vitro
Tubulogenesis was first observed in vitro by Judah Folkman and Christian
Haudenschild in 1980 [20]. Folkman, known as the “Father of Angiogenesis”, and
Haudenschild demonstrated that microvascular endothelial cells were capable of forming
capillary-like structures in vitro in the absence of blood flow and supporting cell types [2,
16]. To date, several different types of in vitro tubulogenic assays have proven capable of
generating capillary-like structures from the culture of endothelial cells alone. The types
of in vitro tubulogenesis assays that have been developed can be divided into two
categories: two-dimensional (2-D) and three-dimensional (3-D).
Two-dimensional in vitro tubulogenesis assays are those in which endothelial
cells are seeded onto the surfaces of hydrogels (e.g., collagen, fibrin, Matrigel) or plastic
culture-treated dishes on which they form sprouts or capillary-like structures within the
two-dimensional plane of the culture surface [2]. However, to ensure that the cells form
an interconnected network of tubes or endothelial cords instead of a confluent monolayer
on 2-D culture surfaces, endothelial cells must be sparsely seeded on the surface and the
underlying substrate must consist of select basement membrane proteins—mainly
laminin and type IV collagen [2]. Earlier studies have shown that endothelial cells grown
on the surface of a collagen gel form a monolayer on the surface and, absent treatment
with angiogenic activity-inducing chemicals (e.g., phorbol esters), do not invade the
underlying matrix [21]. Thus, 2-D assays are not the best model of the essential early
tubulogenic processes in the absence of artificial stimulation.
Though 2-D assays have been widely used, they present two issues that raise
concerns about their accuracy as models of angiogenesis. First, sprouting occurs from

13
individual cells or cell aggregates and not from an endothelial monolayer, as is the case in
vivo. Second, the endothelial tubes or sprouts are in contact with fluid on the outside and
any existing lumens contain extracellular matrix material on the inside—the inverse of
what occurs in vivo [21]. Two-dimensional assays, on the other hand, have several
benefits such as the ability to easily and quickly culture, image, and quantify tube
formation [21]. Although 2-D angiogenesis models have greatly contributed to the
understanding of the role of the extracellular matrix in vascular and lymphatic
morphogenesis, these models do not encompass all of the steps of physiological
tubulogenesis [16, 18].
Three-dimensional models of tubulogenesis consist of those assays in which
individual endothelial cells, endothelial cell aggregates, or endothelial cell-coated
microcarrier beads are embedded in a gelatinous matrix [2]. These models provide the
best portrayal of endothelial cell migration and ECM invasion as it occurs in sprouting
angiogenesis in vivo [2]. The assay that employs the use of endothelial cell-coated
microcarrier beads, initially developed by Nehls and Drenkhahn in 1995 [7], has become
one of the most widely used three-dimensional models. Nehls and Drenkhahn (1995)
recognized that 2-D angiogenesis assays did not accurately reproduce in situ conditions.
They also recognized that, though 3-D angiogenesis assays consisting of animal aortic
segments embedded in hydrogels could produce capillary-like structures, it had not been
shown that these structures were predominantly composed of endothelial cells. [7]. Thus,
the need to investigate endothelial tubulogenic activity in isolation from other cell types,
and to do so in an efficient and accurate manner, prompted the development of the
embedded endothelial cell-coated microcarrier bead assay. By using this assay, Nehls and

14
Drenkhahn were able to show that intercellular adhesion, in addition to proliferation and
migration, represented an essential step in the tubulogenic process [7].
Clinical Implications
Physiologically accurate in vitro models of tubulogenesis have immense clinical
value. They allow for (1) clinical testing of pro- or anti-tubulogenic drug therapies; (2)
modeling of pathological conditions such as intimal hyperplasia and intimal injury caused
by surgical intervention (e.g., angioplasty); (3) studying of the discrete process of
endothelial cell differentiation, migration, lumen formation, and vascular inoculation; and
(4) elucidating the molecular and mechanosensitive mechanisms associated with
tubulogenesis [18]. Much research has gone into the design of in vitro assays that more
accurately reflect in vivo tubulogenic activity and, indeed, this still remains an important
goal for the future [16].
1.4. Tubulogenic Growth Factor Signaling
Tubulogenesis is controlled by the balance between pro- and anti-tubulogenic
factors [22]. The presence of greater levels of growth-promoting factors rather than
growth-inhibiting factors “flips” the physiological “switch” and induces a tubulogenic
endothelial phenotype [22]. The most potent, well-known, and well-characterized
tubulogenic growth factors come from the vascular endothelial growth factor (VEGF)
and fibroblast growth factor (FGF) growth factor families [2, 22]. In the presence of these
growth factors, endothelial cells engage in proliferation, extracellular proteolytic activity,
invasion of the extracellular matrix, and formation of capillary-like tubular structures
[22]. In addition to their general involvement in endothelial tubulogenesis, members of
15
the VEGF and FGF families have been implicated in the transduction of mechanical
signals (mechanotransduction), which is the subject of the study herein.
Vascular Endothelial Growth Factors (VEGFs)
Vascular endothelial growth factors (VEGFs) are mitogenic proteins derived from
the vascular and lymphatic circulatory systems [23]. Growth factors from the VEGF
family are unique to vascular and lymphatic endothelial cells in that they do not have any
appreciable growth-promoting effect on other cell types [23]. The VEGF family includes
five structurally similar growth factors: VEGF-A, VEGF-B, VEGF-C, VEGF-D, and
placental growth factor (PlGF) [24]. These molecules differentially interact with and bind
to a corresponding family of cell surface receptors VEGFR-1, VEGFR-2, and VEGFR-3
[24]. The two VEGF-related growth factor ligands pertinent to the present study are
VEGF-A and VEGF-C.
VEGF-A is a potent mitogenic growth factor that is specific to vascular
endothelial cells and is involved in both the physiological and pathological growth of
blood vessels [23]. The potency of VEGF-A as an angiogenic factor and its importance in
vascular development was demonstrated by two studies showing that a genetic mutation
resulting in the loss of a single VEGF-A allele results in early lethality in mouse embryos
[25, 26]. VEGF-A has also been implicated in pathological angiogenesis associated with
tumor growth and retinal ischemia [23]. The vital role that VEGF-A plays in
angiogenesis is shown in Table 1.4a.

16
Table 1.4a - Table of Known Pro-Tubulogenic Effects of VEGF-A on Endothelial Cells
Name Function
VEGF-A
Stimulates tubulogenesis in vitro and in vivo [2]
Increases endothelial cell permeability [2, 24]
Promotes endothelial cell survival (inhibits apoptosis) [24]
Stimulates endothelial cell proliferation [22, 24]
Enhances endothelial cell migration and invasion [2, 22]
Stimulates endothelial cell production of matrix proteases and protease inhibitors [2, 22]
Stimulates the activity and production of endothelial nitric oxide synthase (vasodilation) [2, 23]
The pro-tubulogenic effects of VEGF-A listed in Table 1.4a above are elicited
when it binds to its high-affinity receptor VEGFR-2, a transmembrane tyrosine kinase
[2]. Interestingly, cellular expression of VEGF-A and VEGFR-2 are both tied to local
tissue oxygen concentration [2]. Chronic hypoxia upregulates VEGF-A and VEGFR-2
expression in parallel [2]. VEGF-A binding to VEGFR-2 causes endothelial cell
proliferation, extracellular matrix invasion, and tube formation presumably to vascularize
and oxygenate the hypoxic tissue [2]. The VEGF-A/VEGFR-2 pathway is capable of
stimulating the entire angiogenic process, and thus, is a key mediator of tissue perfusion
and the physiologic response to tissue ischemia [2].
The other pro-tubulogenic VEGF-family ligand of interest to this study is VEGF-
C. VEGF-C has been primarily implicated in lymphangiogenesis, the formation of new
lymphatic vessels [27]. However, VEGF-C also plays a role in angiogenesis and the
formation of new blood vessels [24]. VEGF-C binds to both the VEGFR-2 and VEGFR-3
receptors [27]. The importance of VEGF-C has been demonstrated by studies

17
investigating its high-affinity receptor, VEGFR-3, and the effect of VEGF-C/VEGFR-3
binding on angiogenesis in vitro [28, 29]. The results of these studies have shown that
VEGF-C/VEGFR-3 signaling is essential for both physiological and pathological
angiogenesis [28]. The known effects of VEGF-C on endothelial tubulogenesis are listed
in Table 1.4b.
Table 2.4b - Table of Known Pro-Tubulogenic Effects of VEGF-C on Endothelial Cells
Name Function
VEGF-C
Stimulates tubulogenesis in vitro and in vivo [30] Stimulates endothelial cell proliferation [29, 31] Enhances endothelial cell migration and invasion [29, 30]
Stimulates production of matrix proteases [29, 30] Promotes endothelial cell survival (inhibits apoptosis) [29]
Much like VEGF-A, previous studies using Vegfr3-gene knockout mouse
embryos that were unable to express the high-affinity receptor to VEGF-C, VEGFR-3,
exhibited significant defects in both arterial and venous vascular development and
remodeling resulting in embryonic lethality [28]. Based on the essential role that VEGF-
C/VEGFR-3 signaling plays in lymphangiogenesis, it is anticipated that lymphatic
development and remodeling would also be substantially impaired by Vegfr3-gene
knockout [24]. Indeed, it has been demonstrated that suppression of VEGF-C levels in
tumor-bearing mice with neutralizing VEGF-C antibodies or a soluble form of VEGFR-3
elicited a predominantly anti-lymphangiogenic, rather than an anti-angiogenic, effect
[29].
Studies have also demonstrated the pro-angiogenic effect of VEGF-C/VEGFR-3
binding in vitro. Blocking VEGFR-2, the high-affinity receptor for VEGF-A and low-

18
affinity receptor for VEGF-C, while stimulating endothelial cells cultured on the surface
of three-dimensional collagen gels with VEGF-C, did not completely extinguish the in
vitro angiogenic response [29]. As shown in the study by Persaud et al. (2004), VEGF-C
was capable of eliciting an angiogenic response in vascular endothelial cells in the
absence of VEGF-A/VEGFR-2 and VEGF-C/VEGFR-2 binding, thus advocating for the
role of VEGF-C in angiogenesis [29]. These previous reports substantiate the essential
role that VEGF-C/VEGFR-3 signaling plays in both forms of tubulogenesis—
angiogenesis and lymphangiogenesis.
Fibroblast Growth Factors (FGFs)
The FGF ligand family was among the first discovered pro-angiogenic factors [2].
Though FGFs are similar to VEGFs in that they promote endothelial cell activity crucial
to in vivo angiogenesis and the formation of capillary-like structures in vitro, they are
unlike VEGFs in that they do not exclusively act on endothelial cells [2]. The effects of
FGF-2, also known as basic fibroblast growth factor (bFGF), on endothelial cells are
shown in Table 1.4c below.
Table 3.6c - Table of Known Pro-Tubulogenic Effects of FGF-2 on Endothelial Cells
The effects of FGF-family growth factors are elicited through binding to four
receptor tyrosine kinases: FGFR-1, FGFR-2, FGFR-3, and FGFR-4. FGF-2 binds to
Name Function
FGF-2
Stimulates tubulogenesis in vitro and in vivo [2, 22, 32] Stimulates endothelial cell proliferation [2, 14, 22] Enhances endothelial cell migration and invasion [2, 22]
Stimulates the production of matrix proteases in endothelial cells [2, 22]
Promotes endothelial cell survival (inhibits apoptosis) [33]

19
FGFR-1, which induces both proliferation and migration [34, 35]. Previous studies have
also shown that FGF-2/FGFR-1 binding, alone, is capable of eliciting angiogenic and
lymphangiogenic sprouting [34, 35]. FGF-2 also binds to FGFR-2 and induces several of
the essential early endothelial tubulogenic activities (e.g., migration, proliferation, matrix
protease production). [36]. Though redundant receptor-ligand specificity is characteristic
of the FGF/FGFR signaling pathways, blockade of either FGFR-1 or FGFR-2 inhibits
vascular development and results in death during early embryonic development [33, 36].
FGF and VEGF Synergy in Angiogenesis and Lymphangiogenesis
Though it has been shown that FGF-2, VEGF-A, and VEGF-C are each capable
of inducing tubulogenesis on their own, the combined tubulogenic effects of FGF-2 and
VEGF-A or FGF-2 and VEGF-C have shown to be greater than the sum of their
individual effects [35, 37]. Studies have shown both interdependency and synergism
between FGF-2 and either VEGF-A or VEGF-C. Mandriota and Pepper (1997) showed
that sequestration of FGF-2 prevented VEGF-A-induced angiogenesis in vitro [37].
Furthermore, it has been shown that VEGF-A and FGF-2 elicit a synergistic angiogenic
response both in vitro and in vivo, and it has been surmised that this results from FGF-2-
induced upregulation of VEGFR-2, the high-affinity VEGF-A receptor.
Cao et al. (2012) recently demonstrated that, although FGF-2 is capable of inducing
lymphatic endothelial cell proliferation and migration in vitro, FGF-2 stimulation in the
absence of VEGF-C/VEGFR-3 signaling was unable to induce lymphangiogenic
sprouting in vivo [35]. It must also be noted that VEGF-A/VEGFR-2 signaling is not
restricted to angiogenesis and VEGF-C/VEGFR-3 signaling is not restricted to

20
lymphangiogenesis. VEGF-A and VEGF-C have been shown to be involved in both
angiogenesis and lymphangiogenesis [29, 38].
1.5. Effects of Pressure on Endothelial Cells
Several previous studies have suggested that endothelial cell responses to
hydrostatic pressure are distinct from other hemodynamic forces to which endothelial
cells are exposed in vivo [39]. The known effects of pressure on endothelial cells, to this
point, have primarily implicated the FGF-2/FGFR-1/2 and VEGF-C/VEGFR-3 pathways.
Acevedo et al. (1994) demonstrated that sustained pressures induced the release of
nuclear and cytosolic stores of FGF-2 [14]. This release resulted in increased
proliferation and morphological restructuring of endothelial cells in two-dimensional
culture [14]. In a later study, Shin et al. (2004) demonstrated that cyclic pressure-induced
increases in endothelial cell proliferation were also mediated by FGF-2/FGFR-2 signaling
[40]. This later study, however, found that the endothelial response to the applied
pulsatile pressure was not FGF-2 dependent, but rather, somehow tied to FGFR-2
activity. The exact function of the FGF-2/FGFR-2 pathway in the transduction of
pressure is still unclear.
Pressure has also been shown to upregulate the expression of VEGF-C. Shin et al.
(2002) showed that VEGF-C gene transcription (Vegfc) was upregulated in endothelial
cells exposed to pressure [31]. This increase in VEGF-C transcription resulted in
increased VEGF-C expression and, concomitantly, increased endothelial cell proliferation
[31]. A similar study showed alterations of intercellular connectivity and modulation of
the endothelial barrier function in response to cyclic pressure exposure [39].

21
These previous studies and results involve endothelial functions and growth
factors that have been implicated in both angiogenesis and lymphangiogenesis. Thus,
early evidence suggests that pressure may have an effect on endothelial tubulogenesis and
such effect may be transduced through the mechanosensitive growth factor signaling
pathways related to FGF-2 and VEGF-C.

22
2. Rationale
To date, studies of the effects of mechanical forces on endothelial tubulogenesis
have been confined to those resulting from shear stress and substrate tension. The
literature has generally neglected to investigate the effects of hydrostatic pressure in
isolation on endothelial tubulogenesis in comparison to the effects of the other
hemodynamic mechanical forces, despite the fact that endothelial cells are constantly
exposed to varying levels of pressure under normal and pathological conditions. The
demonstrated relationship between hydrostatic pressure exposure and the expression,
upregulation, or release of certain pro-angiogenic and pro-lymphangiogenic growth
factors begs the question of whether hydrostatic pressure has an effect on endothelial
tubulogenic processes.
The present Master’s thesis-related research exposed bovine aortic endothelial
cells to sustained hydrostatic pressures known to stimulate the pro-tubulogenic activity of
endothelial cells. The goal was to substantiate the hypothesis that pressure is a
magnitude-dependent modulator of early endothelial tube formation processes. Along this
line, the objectives of the present study were to develop a method for subjecting
endothelial cells in three-dimensional culture to sustained hydrostatic pressures and
evaluate the in vitro tubulogenic responses of endothelial cells. For this purpose, a system
for subjecting endothelial cells in 2-D and 3-D cell cultures was developed and employed
to verify the effects of pressure on endothelial proliferation and morphology established
by previous studies and to assess the effects of pressure on the early endothelial
tubulogenic processes (e.g., migration, tube formation). Using this system, the present

23
study also aimed to elucidate a novel VEGFR-3-mediated pathway that links pressure
exposure encountered in the physiological mechanoenvironment of the endothelial cell to
capillary-like tube formation.
By using a combined biomedical engineering and experimental biological
approach, the present study addressed key issues regarding the angiogenic response of
vascular endothelial cells to sustained hydrostatic pressure and laid the groundwork for
future studies investigating the effects of various pressure regimes and growth factors on
endothelial tube formation. The knowledge gained from this study not only expounds
upon endothelial mechanical signal transduction and the effects of pressure on
endothelial cells, but also provides new information that could eventually lead to
improvements in the generation of pre-vascularized tissues in vitro and the treatment of
pressure-related pathological conditions.

24
3. Materials and Methods
3.1 Cell Substrates
The two-dimensional substrates used in the present study consisted of polystyrene
tissue culture substrates in the form of multi-well tissue culture plates. Prior to seeding,
tissue culture surfaces, on which cells were grown, were coated with sterile 0.2% gelatin
(Sigma-Aldrich) in aqueous solution and incubated for a minimum of fifteen minutes.
The gelatin solution was removed prior to cell seeding.
For three-dimensional cultures, commercially available Cytodex3TM microcarrier
beads (GE Healthcare®) were used. Cytodex3TM beads are spherical cross-linked
polystyrene beads with diameters ranging from 141-211 microns that have a layer of
denatured collagen chemically bonded to their surfaces. The beads were prepared for cell
culture by submerging them in Phosphate Buffered Solution (PBS) in a siliconized glass
bottle at a concentration of 100 g/mL in PBS. Cytodex3TM beads were allowed to remain
in PBS for three hours permitting them to swell and hydrate. To ensure proper saturation
of the beads, two drops of Tween 80 were added per 100 mL of PBS during this first
hydration rinse to overcome the effect of surface tension that would prevent the beads
from hydrating. After three hours in the initial PBS rinse, the supernatant was removed
and 50 mL of fresh PBS per gram of beads was added. The bead solution was then
sterilized by steam autoclave at 115°C and 15 psi for 15 minutes. After autoclaving, the
bead solution was stored at 4°C. Beads prepared in this fashion are stable for up to 1 year.

25
3.2 Cell Lines, Culture Conditions, and Passaging
Bovine aortic endothelial cells (BAEC) were generously provided by Dr. Shu
Chien and Dr. Jason Haga from the Department of Bioengineering at the University of
California – San Diego (La Jolla, CA) or were purchased from a commercial source
(Invitrogen®). BAEC were subcultured on the gelatin-coated polystyrene tissue culture
surfaces of either 25 cm2 (T-25) or 75 cm2 (T-75) vented cell culture flasks (BD
Falcon®) in Dulbecco’s Modified Eagle Medium (DMEM) (HyClone®) supplemented
with 10% v/v fetal bovine serum (FBS) (HyClone®), 1% v/v penicillin/streptomycin/L-
glutamine solution (HyClone®), and 5 U/mL heparan (Sigma®). Cells were maintained
under standard tissue culture incubator conditions—humidified, 37oC, 5% carbon
dioxide/95% air environment. During routine cell culture, the media was replaced every
2 to 3 days. Upon reaching confluence, BAEC cultures in T-25 or T-75 flasks were split
(1:2 or 1:3 ratio) into new flasks. To do so, cell monolayers were rinsed once with PBS
for 5 minutes. The PBS was then removed and 1 mL of 0.25% trypsin/1 mM EDTA
(Sigma®) was added to flasks, which were then incubated for 1 to 2 minutes. After gentle
agitation, cells would detach from the tissue culture surface of the flask and be suspended
in fresh complete media. To remove the tripsyn/EDTA solution, cells suspended in
complete media were centrifuged at 200G for 5 minutes at 25oC. After centrifugation, the
supernatant solution was aspirated and the resulting cell pellet was resuspended in
complete media and added to new T-25 or T-75 flasks. For every confluent population of
cells within a single flask, two to three flasks of passaged cells were generated. Cells
from passages 7 to 15 were used in all experiments in the present study.
26
3.3 Cell Storage
Confluent or near-confluent BAEC monolayers from T-75 cell culture flasks were
cryopreserved for later use following standard cell culture procedures. Briefly, after
rinsing BAEC monolayers in PBS for 5 minutes, cells were dissociated from tissue
culture flask surfaces by incubation with 1 mL of 0.25% trypsin/1 mM EDTA for 1 to 2
minutes followed by gentle agitation and subsequent resuspension in complete culture.
The resulting cell suspensions were then transferred to 15 mL centrifuge tubes (BD
Falcon®) and pelleted by centrifugation at 200G for 5 minutes at 25oC. The cell pellet
was then resuspended in 1.5 mL of freezing solution consisting of 10% dimethyl
sulfoxide (DMSO) (Sigma®) in FBS and transferred to 2-mL cryogenic vials (BD
Falcon), and stored at -80oC until needed or transferred to liquid-nitrogen cryogenic
storage.
As needed, frozen cell suspensions in cryogenic vials were rapidly thawed by
submersion in a 37oC water bath. Thawed cell solutions were then transferred to sterile
15-mL centrifuge tubes containing 5 mL of warm complete media, pelleted at 200G for 5
minutes at 25oC, resuspended in 5 mL of complete media. Cells suspended in complete
media, now with freezing solution removed, were transferred to a T-75 cell culture flask
containing 10 mL of complete media and cultured under standard cell culture conditions
(as detailed in Section 3.2).

27
3.4 Cell Seeding
Two-Dimensional Substrates: Seeding in Multi-Well Tissue Culture Plates
For proliferation assays and analyses of VEGF-C and VEGFR-3 expression, cells
were seeded in 10 cm2 petridishes or individual wells of 6-well, 12-well or 96-well tissue
culture polystyrene plates (BD Falcon®) that had been pre-coated with gelatin as
described previously. Confluent or near-confluent BAEC were lifted, centrifuged, and
resuspended in 10 mL of fresh media. The numbers of cells contained in two 10-µL
aliquots of this suspension were then counted using a hemacytometer to determine the
concentration of cells in a particular cell solution. Cell solutions were diluted with
complete media such that an average of 20-50 cells would be counted per grid-square of
the hemacytometer to ensure an accurate determination of concentration. After the
concentration of cells in solution was determined, aliquots of cell solution were added to
wells containing heparan-free complete media in order to obtain the desired number of
cells per unit surface area in each well depending on the seeding density designated for
each assay. For proliferation assays, cells were seeded at 5,000 cells/cm2. After 16-24
hours, BAEC attached to the cell culture surfaces of the multi-well plates and media was
replaced with fresh heparan-free media, with the addition of supplements (i.e., FGF-2,
VEGF-A, MAZ51, DMSO) as needed for each experiment.
Three-Dimensional Substrates: Seeding on Cytodex3TM Beads
Prior to cell seeding, the concentration of beads in a stock solution of Cytodex3TM
microcarrier beads in PBS was determined by counting and averaging the number of
beads in three 10-µL droplets. The volume of stock solution containing the desired
amount of beads was then determined and combined with 2 mL of warm serum-free

28
media. The tube was agitated briefly and then the beads were allowed to settle to the
bottom so the PBS in solution could be aspirated for rinsing with fresh buffer. The beads
were then rinsed one additional time in complete cell culture media.
To seed BAEC onto Cytodex3TM microcarrier beads, cells were first lifted,
pelleted, and resuspended in warm complete medium. The concentration of cells in
solution was determined with a hemacytometer as described previously. A volume of this
cell suspension was then added to the microbead solution to yield a ratio of 1×10⁶ cells
per 2,500 beads and incubated under standard cell culture conditions in an upright
position. During this incubation, the cell-microbead suspension underwent periodic (i.e.,
once every 20 minutes) gentle agitation for an initial 4-hour duration to ensure uniform
coverage of the bead surface with cells. After this initial 4-hour seeding period, the bead-
cell solution was then carefully transferred to a T-25 flask containing 3 mL of cell culture
media. The solution was then incubated for 24 hours in an upright position (vented cap
facing upward) to prevent coated beads from adhering to the tissue culture-treated surface
of the flask. After an overnight incubation, the beads were entirely covered in a confluent
or nearly confluent layer of BAEC. During this time, some of the coated beads would
become adhered to the inner surfaces of the flask. To address this, flask surfaces were
gently agitated and rinsed with complete media to disassociate the beads from the plastic
surfaces.
3.5 Pressure System
Cells grown on two-dimensional substrates and polymeric beads embedded in
three-dimensional collagen gels were exposed to pressures above atmospheric using a

29
custom-designed pressure system capable of exposing cells grown in tissue culture plates
to either static or pulsatile pressure stimuli. The system consisted of custom-fabricated
polycarbonate chambers that were designed and fabricated to accommodate a multi-well
cell culture plate or multiple chamber slides while minimizing the volume within the
chamber. The chamber volume was minimized so that the change in volume required to
generate a pressure pulse within the chamber would be minimized. As shown in the
Equation 3.5 below, as the volume of the chamber (Vchamber) governs the change in
volume (ΔV) required to produce a pressure pulse within the chamber defined by a
minimum (P0) and maximum (PE) pressure level.
This change in volume (ΔV) can be either the volume of gas needed to bring the chamber
pressure from 0 mmHg to the experimental pressure (i.e., 20 mmHg or 40 mmHg) or
represents the change in volume required to oscillate the chamber pressure between two
pressures (P0 and PE) for generating pulsatile pressures. Therefore, minimizing the
chamber volume allows for the use of less gas to generate sustained pressures and lower
stroke volumes to generate pulsatile pressures.
For pressure experiments, cell culture plates or dishes were placed between the
two interlocking halves (shown in Figure 3.5a) and sealed by tightening six fasteners (not
shown) that surround the perimeter of the chamber. Tightening the fasteners compresses
an O-ring that forms an airtight seal between the inner compartment and the outside
environment.

30
Three ports on the sides of the chamber allow for connections to the supply gas mixture,
instrumentation, a second chamber (in series or parallel), and relief valves.
The hydrodynamic pressure system is capable of exposing one plate to a
sustained, static pressure or pulsatile pressure regime while maintaining a second
downstream chamber at atmospheric pressure. For this configuration, a compressed gas
tank supplies a pressurized 5% carbon dioxide, 95% air mixture through a humidifier and
into a sealed polycarbonate chamber. The second downstream chamber (Chamber 2)
passively receives a 5% carbon dioxide, 95% air gas mixture from the pressurized
chamber; this gas is allowed to escape from the second chamber via a pressure port that is
open to the atmosphere.
Sustained pressures were controlled (in the range of 0 to 100 mmHg) within the
pressure chamber by controlling the depth of the pressure head tube in the column of
Figure 3.5a – Three-dimensional SolidWorks® model of the pressure chamber.

31
water (Ps in Figure 3.2b), which creates an upper limit on the pressure allowing for stable
sustained pressures for long periods of time. The inflow rate of gas into the pressure
chamber was controlled by adjusting the pressure regulator on the 5% carbon dioxide
supply tank while the outflow rate was adjusted by modulating the resistance to gas flow
between the pressure and control chambers using an adjustable valve. The resistance to
gas flow between the two polycarbonate chambers ensured the generation of a static
pressure level in the upstream chamber. The pressure in the control chamber (Chamber 2)
was maintained at atmospheric pressure (0 mmHg) by adjusting the flow rate into the
chamber from the pressurized chamber (Chamber 1) as well as the outflow from the
Figure 3.5b - Schematic representation of the pressure system designed for the present study. As diagrammed in the figure, the system consists of a pressurized chamber (Chamber 1) in series with the control chamber (Chamber 2), which is maintained at 0 mmHg while Chamber 1 is maintained at an elevated, sustained pressure. The pulsatile component (bellows, linear actuator, voltage source, function generator) were not used in the present study.

32
control chamber via a relief valve. The flow rate of gas from the 5% CO2/95% air tank
and the pressure head control were set so as to minimize the gas flow required to
maintain the desired pressures and CO2-content of each chamber. Each chamber was
connected to a pressure transducer interfaced with a multi-channel digital output that
allowed for continuous, real-time monitoring of the pressure in both chambers. A CO2
gas analyzer was connected downstream from the control chamber to continuously
monitor the gas mixture and ensure a 5% carbon dioxide content inside both chambers.
Both chambers were maintained at 37oC using a temperature-controlled incubator.
The pressure system was also set up with the capability to generate pulsatile
pressures with pulse pressures ranging from 0 to 20 mmHg and frequencies of 0 to 2 Hz.
Pulsatile pressures are generated using a bellows pump connected to a digitally controlled
linear actuator driven by a DC power supply and function generator. This setup allowed
for adjustment of the bellows displacement amplitude and frequency, which in turn
controlled the pulse pressure and frequency of the applied pressure regime in the
upstream polycarbonate chamber.
3.6 Proliferation Assay
Seeding and Pressure Exposure
Cells were enzymatically dissociated from culture surfaces and resuspended in
media containing 10% FBS and 1% Pen/Strep/L-glutamine solution and seeded at
densities of 5,000 cells/cm2 in the wells of 96-well plates.1 For these experiments, two
1 5,000 cells/cm2 was determined to be the cell density at which cells would not reach 100% confluence by the end of the 72-hour experiment duration. Permitting the cells the reach confluence before the end of the 72-hour period would prevent observation or detection of differences in cell densities between cultures maintained under different culture conditions (i.e., pressure or growth factor supplementation).

33
identically seeded plates of cells were generated: one for a control and one for a pressure
experiment. After an overnight incubation, the culture media in each of the wells
containing cells was gently aspirated and replaced with 200 microliters of fresh complete
media with or without 1 ng/mL FGF-2. Six wells were seeded per treatment per
independent experiment. This yielded six wells for each of four different treatments that
were prepared for control and pressure plates per independent experiment. Cell
preparations were either maintained under atmospheric pressure in the control chamber or
exposed to elevated hydrostatic pressures (20 or 40 mmHg) for 72 hours.
Fixation, Labeling, and Quantification of Cell Density
After experiments, the experimental cell preparations were immediately fixed
with 2% paraformaldehyde/0.5% glutaraldehyde for 2 hours. The fixative was then
removed and the cell monolayers were rinsed once with PBS. A Crystal Violet solution
(0.5% w/w Crystal Violet and 20% methanol in PBS; a nuclear stain) was then added to
each well and incubated for one hour at room temperature. The cell layers were then
rinsed five times with PBS for five minutes each to remove excess, unbound dye.
Finally, PBS at a volume of 100 µL was added to each well in preparation for quantifying
dye uptake. Crystal violet uptake by BAEC layers was then quantified using a
spectrophotometric microplate reader (Biotek® uQuant) at an absorbance wavelength of
570 nm. Experiments to assess the effects of pressure on BAEC proliferation were
repeated five separate times (N = 5) for each condition tested.

34
3.7 Flow Cytometric Analysis of VEGFR-3 and VEGF-C Expression
Seeding and Pressure Exposure
Cells were enzymatically dissociated from culture surfaces and resuspended in
media containing 10% FBS and 1% Pen/Strep/L-glutamine solution and seeded at 1/3
confluence in gelatin-coated, 10 cm2 tissue culture plates and allowed to culture for 24 –
48 hours. Prior to experiments, the culture media in each plate was replaced with fresh
complete media. These cell preparations were then either maintained under control (i.e.,
atmospheric) pressure conditions or exposed to the sustained hydrostatic pressures of
interest (either 20 or 40 mmHg) for 72 hours using the custom pressure system (see
section 3.5).
At the end of experiments, the cells were enzymatically released from substrates,
rinsed with ice-cold PBS and immediately fixed with 0.25% p-formaldehyde in 0.1 M
sodium phosphate.
Immunofluorescence Labeling of Cells
Fixed cells were washed 3 times in ice-cold PBS prior to labeling with
fluorescence antibodies to either VEGFR-3 or VEGF-C. For VEGFR-3 staining, cells
were labeled with mouse monoclonal antibodies to human VEGFR-3 (Millipore; cross-
reactivity with bovine antigen) in 1% bovine serum albumin (BSA; blocking buffer;
Sigma-Aldrich) at room temperature for 1 h. Cells bound with this antibody was
fluorescently-labeled with goat anti-mouse IgG secondary antibodies conjugated to
Alexa-Fluor®488 for 45 minutes.

35
Cellular VEGF-C on the fixed cells was labeled with goat anti-human VEGF-C
(Santa Cruz Biotechnologies; cross-reactivity with bovine antigen) in 1% BSA in PBS
supplemented with 0.1% saponin (a compound used to permeabilize the cells and allow
cytosolic staining of the antigen of interest). The cells were then rinsed three times and
stained with donkey anti-goat IgG conjugated to Alexa-Fluor® 488 in blocking buffer
with 0.1% saponin for 45 minutes.
After fluorescent labeling for VEGFR-3 or VEGF-C, cells were rinsed of excess
unbound antibodies in their respective blocking buffers and resuspended in 0.5% BSA.
Binding of fluorescent antibodies to cells was quantified with an LSR II flow cytometer
(Becton-Dickinson). For each sample, at least 10,000 cells were analyzed using
FACsDiva (Becton-Dickinson). Histograms of fluorescence intensity (reflecting the
numbers of antibodies bound to cells) were recorded for each sample and the mean
fluorescence intensity was determined as a measure of antigen expression levels.
3.8 Three-Dimensional Collagen Gel Assays
Tube formation and invasion assays were conducted in the following chronology:
preparation of cellularized beads, gel formulation, and gel polymerization. After these
steps, endothelial tubulogenic activity under pressure was examined.
Preparation of Endothelialized Beads
BAEC were seeded on Cytodex3TM microcarrier beads as described in Section 3.4
– Cell Seeding. Cellularized beads were removed from T-25 tissue culture flasks,
transferred to a 15-mL centrifuge tube, and allowed to settle to the bottom of the tube for
36
up to 10 min. At that time, the supernatant media was aspirated, and the beads were
rinsed once in 2 mL of heparin-free complete media.
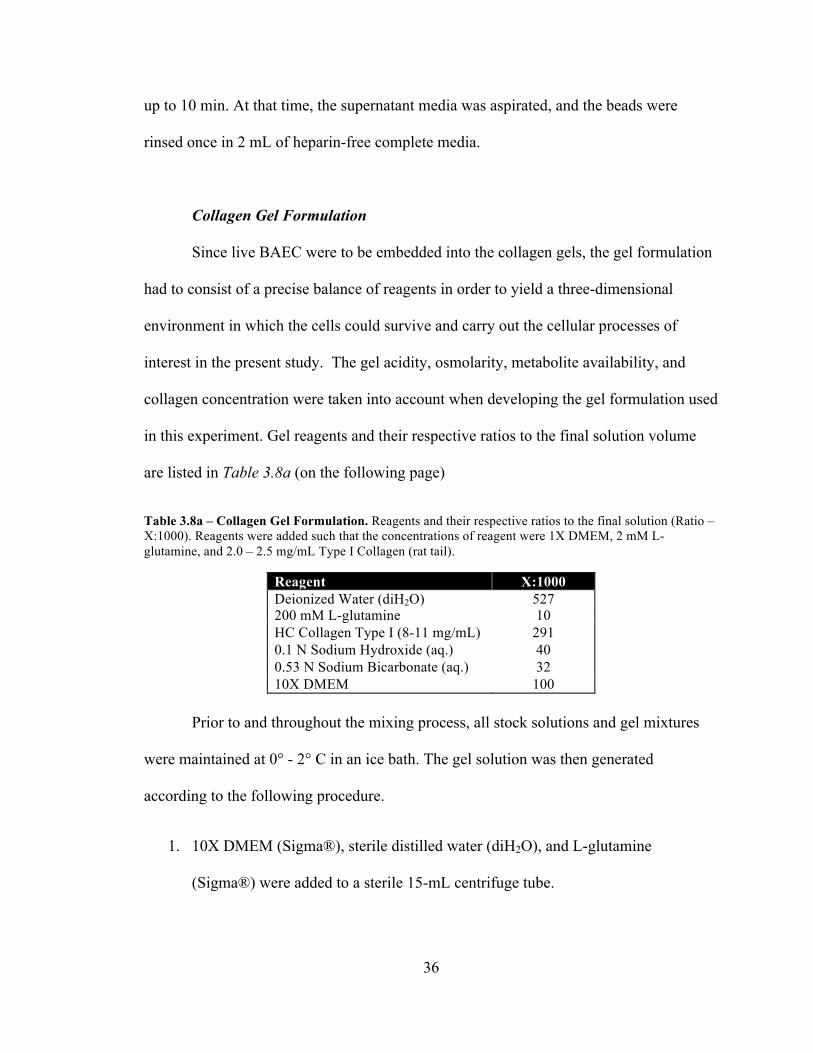
Collagen Gel Formulation
Since live BAEC were to be embedded into the collagen gels, the gel formulation
had to consist of a precise balance of reagents in order to yield a three-dimensional
environment in which the cells could survive and carry out the cellular processes of
interest in the present study. The gel acidity, osmolarity, metabolite availability, and
collagen concentration were taken into account when developing the gel formulation used
in this experiment. Gel reagents and their respective ratios to the final solution volume
are listed in Table 3.8a (on the following page)
Table 3.8a – Collagen Gel Formulation. Reagents and their respective ratios to the final solution (Ratio – X:1000). Reagents were added such that the concentrations of reagent were 1X DMEM, 2 mM L-glutamine, and 2.0 – 2.5 mg/mL Type I Collagen (rat tail).
Reagent X:1000 Deionized Water (diH2O) 527 200 mM L-glutamine 10 HC Collagen Type I (8-11 mg/mL) 291 0.1 N Sodium Hydroxide (aq.) 40 0.53 N Sodium Bicarbonate (aq.) 32 10X DMEM 100
Prior to and throughout the mixing process, all stock solutions and gel mixtures
were maintained at 0° - 2° C in an ice bath. The gel solution was then generated
according to the following procedure.
1. 10X DMEM (Sigma®), sterile distilled water (diH2O), and L-glutamine
(Sigma®) were added to a sterile 15-mL centrifuge tube.

37
2. Type I Collagen solution (8-11 mg/mL Type I collagen from rat tail tendon
dissolved in 0.02 N acetic acid) (BD Biosciences®) was then added to the
centrifuge tube and the solution was mixed thoroughly. Since the concentration of
collagen in the commercially-available stock collagen solution varied between 8
and 11 mg/mL, it was necessary to adjust the ratios of gel reagents to yield the
appropriate collagen concentration (2.0 – 2.5 mg/mL) and solution pH.
3. The 0.1 N sodium hydroxide solution and 0.53 N sodium bicarbonate solution
were then added to the tube and the solution was thoroughly mixed by pipet
aspiration and using a vortexer set at a low speed. The tube was then returned to
the ice bath.
4. A volume of the solution of endothelialized Cytodex3TM beads (containing
approximately 2,500 beads) in complete media (top layers) or an equivalent
volume of heparan-free complete media containing no beads (to generate a
bottom, acellular layer; see Gel Polymerization section below) was then added to
and thoroughly mixed with the gel solution. If cellularized beads were added to
the gel solution (top layers), the contents of the tube were mixed gently to
distribute the cells throughout the gel solution without shearing them off of the
bead surface.
Gel Polymerization
Gel polymerization was allowed to progress by raising the temperature and the pH
of the gel solution since the collagen will remain in a viscous liquid state when
maintained at 0-4°C (i.e., ice bath). The sodium hydroxide solution (0.1 N) and sodium
bicarbonate solution (0.53 N), the final two reagents added to the collagen gel solution,

38
were used to neutralize the acidity of the gel solution. When maintained in an ice bath,
the collagen gel solution would not polymerize. When the temperature of the solution
was elevated to 37°C, the gel rapidly polymerized. By controlling the duration, location,
and sequence of heat application, the polymerization of the gels within the tissue culture
plate wells was precisely timed to guide gelation. Two gel polymerization protocols were
used to yield two different gels. To ensure that the beads would not sink to the bottom of
gels prior to polymerization, an acellular (not containing cells or beads) layer of gel was
polymerized in each well and the gel solution containing BAEC-coated beads were
overlaid on top of this acellular layer. It was determined in the current study that if the
beads are allowed to sink to the bottom of the well, the cells will migrate off of the bead
and onto the bottom of the well (the tissue-culture treated surface) and form a monolayer.
The following procedures were, thus, designed to prevent this from happening.
Two-Layer Gel Polymerization
For the Migration Assay depicted in Figure 3.4a, an acellular gel solution (of the
exact same formulation as the top layer, but not containing BAEC-coated Cytodex©
beads) was added to the each well and allowed to completely polymerize by incubation at
37°C for ten to fifteen minutes. A top layer of gel containing cellularized beads was then
added to each well and polymerized by incubation at 37°C for another fifteen minutes.
After polymerization of the top layer, heparan-free complete media was added. Figure
3.8b on the following page displays the chronology of bi-layer gel polymerization.

39
As shown in Figure 3.8b, once the bottom gel layer was polymerized, it adhered
to the bottom of the well allowing the top layer gel to be overlaid on top. Once
polymerized, a “seam” was created between the two gel layers on which beads from the
top layer rested and on which endothelial cells migrated off the bead during our migration
assays.
Single-Layer Gel Polymerization
The gel polymerization sequence for the tube formation assay (shown in Figure
3.8c on the following page) creates a single, continuous gel layer within which the
BAEC-coated CytodexTM beads are suspended. A volume (0.250 mL) of acellular bottom
layer gel solution was added to each well of a 24-well plate. The plate was then placed on
a heating plate set to 37 deg. C and allowed to rest for one to two minutes. After addition
of the bead-containing top layer of gel, the well plate was returned to the heating plate.
The continuous application of heat to the bottom of the plate allowed the gel to
Figure 3.8b – 2-layer gel polymerization sequence. The top and bottom gel layers are added and allowed to polymerize independently by 10-15 minute incubation at 37 deg. C for each layer. The result is a non-continuous, dual-layer gel structure.

40
progressively polymerize from the bottom to the top of the gel. This progressive
polymerization from the bottom surface upward prevented beads from descending to the
bottom of the well and allowed the sequentially added gel layers to form a continuous
and homogenous gel layer. Figure 3.8c above shows how this process was carried out.
3.9 Imaging
High-resolution, bright field images of beads and their associated cells were
captured digitally using an Olympus (Model IX-70) inverted light microscope equipped
with a Hammamatsu camera, relief contrast, and a range of high-magnification (100X –
600X) objectives. Images of cell populations in three dimensional gel cultures were
captured after 72 hours and 96 hours in culture. For the migration assay, images were
captured at 100X magnification with the focal plane positioned at the interface between
the two get layers. For the tube formation assay, images were captured at 100X
Figure 3.8c – Single-layer gel polymerization sequence. The acellular bottom layer gel is added to each well and the plate is placed on a heating plate at 37 deg. C. The bottom layer is allowed to partially polymerize, then the bead-containing top layer is added. The plate is then returned to the heating plate, causing top and bottom layers to completely polymerize. The result is a continuous, single-layer gel structure.

41
magnification with the focal plane positioned at the mid-plane of the bead. If cells or
cellular structures formed out of the midplane of the bead (as was common in the tube
formation assay), additional images would be captured on different focal planes in order
to visualize these structures.
3.10 Migration/Invasion Assay Analysis
The migration and invasion assay images were analyzed using an image
processing macro developed for the NIH ImageJ software. The program applied a high
pass filter to gray-scale images of single beads with migrating cells to create a new black-
and-white image based on a threshold frequency below which all low-frequency image
components were converted to white and all high-frequency image components were
converted to black. This conversion was accomplished using the ImageJ macro code
shown in Figure 3.9a on the following page. After applying this procedure, the
“Migration Index” was determined.

42
Specifically, the Migration Index represented the ratio of the number of black
pixels to white pixels within the processed image. In the processed image, high contrast
elements (i.e., the outer edges or borders of cells) are filtered out and converted to black
pixels. Image elements not meeting the preset threshold contrast are converted to white
pixels. Accordingly, as the number and dispersion of cells increases the amount of cell
borders in each image increases. An increase in the amount and dispersion of the cell
borders in an image is represented by an increase in black pixels in the processed image.
Theoretically, the number of black pixels in an image is directly related to the number
and dispersion of cells in an image. An image containing a larger number and dispersion
of cells as compared with an image having a smaller number will necessarily have a
Figure 3.10a – InvasiQuant ImageJ macro code. When the macro is run, a gray-scale image is converted to a binary (black and white) image wherein high-contrast areas of the image (i.e., cell borders) are converted to black and low-contrast areas (i.e., background noise, bead interior, out-of-focus elements) are converted to white pixels. The macro returns a numeric value that corresponds to the ratio of black pixels to white pixels (“Migration Index”).

43
greater number of black pixels and, correspondingly, a higher “Migration Index”. A
migration index was determined for 5 beads from each well of an experimental treatment
and averaged as one independent measurement.
3.11 Tube Formation Assay Analysis
Images from the tube formation assay were analyzed by counting the number of
tubes per bead and measuring the length of each tube counted. Tube length measurements
were calibrated against features of known lengths at the same magnification as the tube
formation assay images. For this purpose, a hemacytometer grid was used to calibrate
length measurements.
A sprout or tube was classified as any multicellular projection, at least 50 µm in
length, originating from the bead surface and consisting of multiple contiguous cells.
Lengths of sprouts or tubes were measured from the bead surface to the tip of the sprout.
Occasionally tubes with bifurcations were observed and in such instances a measurement
of the length of the longest continuous cellular projection was made. An example the
image analysis performed for the tube formation assay is shown on the following page in
Figure 3.11a.
Sprouts (i.e., “tubes”), once counted and measured, were categorized such that the
number of tubes greater than or equal to 50 µm, 75 µm, or 150 µm could be compared
between treatment groups. The number of sprouts greater than 50 µm constitutes the total
number of sprouts, as cellular projections not greater than or equal to 50 µm in length
were not considered “sprouts”. The average sprout length per bead was also calculated
and used as a basis for comparison between treatment groups.

44
3.12 Statistical Analysis
Data were expressed as mean ± standard error. Activity of BAEC in the absence
or presence of growth factor stimulation or small molecule inhibition under control
(atmospheric) pressures was assessed using raw values to ascertain the baseline behavior.
The means of these experimental treatments were compared using a Student’s t-test with
p < 0.05 delineating significant differences. Bonferroni adjustments were used to correct
p-values when multiple comparisons were performed. Responses of BAEC to pressure
were normalized to those of matched controls (i.e., cells under control pressure, but
otherwise similar experimental conditions) and expressed as fold change to account for
any affects due to the influence of exogenous chemicals on baseline activity. Significant
fold changes were determined with a one-sample t-test. Fold-change values for control
samples was 1.0 with p < 0.05 denoting a significant difference from this threshold value.
Different pressure treatments were compared using Student’s t-test with Bonferroni’s
adjustment for multiple comparisons, again with p < 0.05 denoting a significant
difference.

45
4. Results
4.1. BAEC Culture on Two-Dimensional Substrates
Bovine aortic endothelial cells (BAEC) seeded sparsely (5,000 cells/cm2) and
cultured on two-dimensional tissue culture-treated polystyrene surfaces reached
confluence within 2 to 3 days and exhibited a typical “cobblestone” morphology [12, 14].
Figure 4.1a shows BAEC after a 24-hour overnight incubation (left) and BAEC after
three days in culture (right).
Figure 4.1a – BAEC shortly after 24 hour (left) and after 48 – 72 hour time periods in culture (right). Magnification 20X.
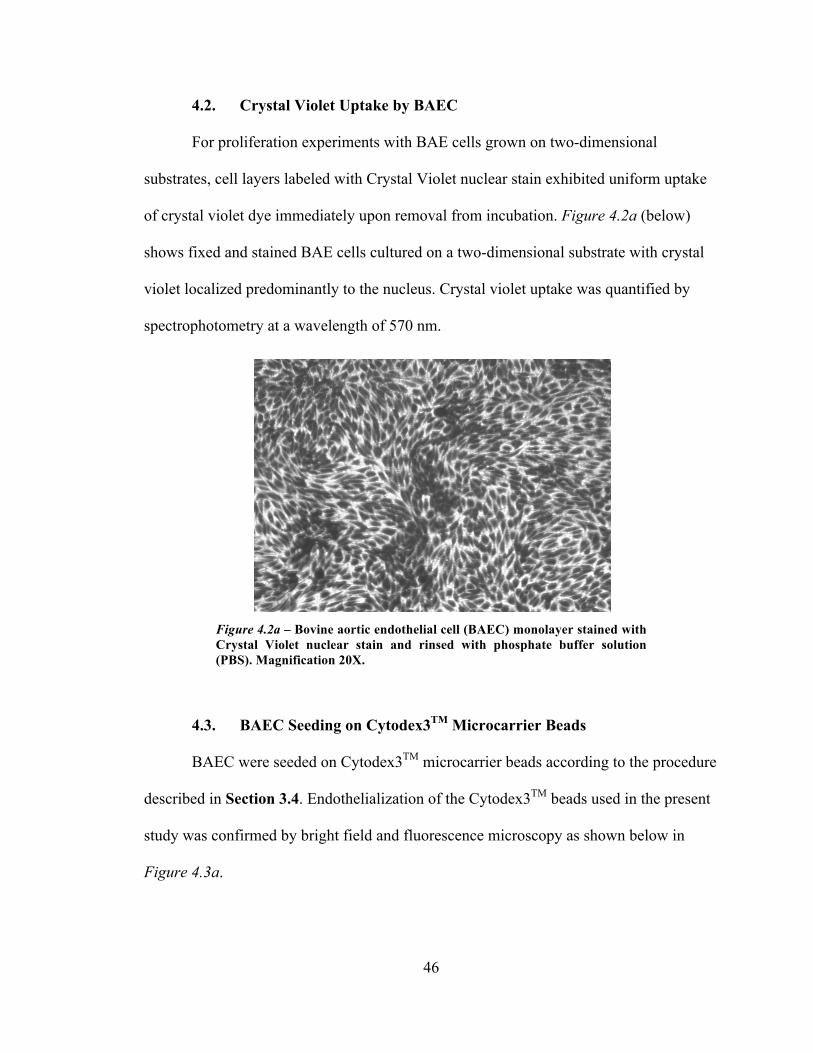
46
4.2. Crystal Violet Uptake by BAEC
For proliferation experiments with BAE cells grown on two-dimensional
substrates, cell layers labeled with Crystal Violet nuclear stain exhibited uniform uptake
of crystal violet dye immediately upon removal from incubation. Figure 4.2a (below)
shows fixed and stained BAE cells cultured on a two-dimensional substrate with crystal
violet localized predominantly to the nucleus. Crystal violet uptake was quantified by
spectrophotometry at a wavelength of 570 nm.
4.3. BAEC Seeding on Cytodex3TM Microcarrier Beads
BAEC were seeded on Cytodex3TM microcarrier beads according to the procedure
described in Section 3.4. Endothelialization of the Cytodex3TM beads used in the present
study was confirmed by bright field and fluorescence microscopy as shown below in
Figure 4.3a.
Figure 4.2a – Bovine aortic endothelial cell (BAEC) monolayer stained with Crystal Violet nuclear stain and rinsed with phosphate buffer solution (PBS). Magnification 20X.

47
The left panel of Figure 4.3a displays a representative bead whose outer surface
has bean coated with a layer of BAE cells. The bright-field image on the left is focused
on the top half of the bead and shows a near-confluent monolayer of cells on its surface.
The image in the right panel of Figure 3.4 shows a bead coated with BAEC labeled with
DAPI nuclear stain. In line with bright-field images, endothelialized beads exhibited
punctate staining of cell nuclei uniformly distributed along the bead surface.
4.4. Generation of Sustained Hydrostatic Pressures
Sustained hydrostatic pressures ranging from 0 to 120 mmHg were achieved for a
single pressurized chamber. Moreover, when two chambers were connected in parallel,
the system was also capable of achieving sustained hydrostatic pressures up to 40 mmHg.
The images in Figure 4.4a show two pressure transducer digital outputs (20 and 40
mmHg) and the corresponding readings of a mercury barometer connected
simultaneously to the same pressure chamber as the transducers.
Figure 4.3a - Cytodex3TM microcarrier bead coated in BAE cells under bright-field view (left) and bead with cells labeled with nuclear stain, DAPI, and viewed under ultraviolet illumination (right). Magnification 100X.

48
Though no cyclic pressure experiments were conducted as part of this study, the
properties of the cyclic pressure profiles that the system was capable of generating were
determined. The maximum pulse pressure of the system, with the components used in
this study, was 20 mmHg at a mean pressure of 40 mmHg at 1 Hz pulse frequency. At 1
Hz, it was determined that the system was capable of generating a sinusoidal pressure
profile with an upper limit pressure of 50 mmHg and a lower limit pressure of 30 mmHg.
At mean pressures below 40 mmHg, the system was capable of generating sinusoidal
pressure waves with frequencies between 0.5 and 2.5 Hz and pulse pressures up to 20
mmHg.
Shown in Figure 4.4b is an image of a pressure transducer strip chart readout of a
1 Hz sinusoidal pressure wave with a mean pressure of 40 mmHg and a pulse pressure of
20 mmHg.
Figure 4.4a – Pressure transducer digital readouts (left) of 20 and 40 mmHg with corresponding, simultaneous mercury barometer readings (right).

49
The pressure system proved to be capable of generating and sustaining pulsatile
pressures for several days with a maximum pressure of 50 mmHg, maximum pulse
pressure of 20 mmHg, and a maximum pulse frequency of 2 Hz.
Figure 4.4b – Pressure transducer strip chart readout depicting a 1 Hz sinusoidal pressure wave with a mean pressure of 40 mmHg and a pulse pressure of 20 mmHg, which alternates between high and low pressures of 50 mmHg and 30 mmHg, respectively.

50
4.5. Increase of BAEC Cell Density By Stimulation with Basic Fibroblast
Growth Factor
The present study confirmed that a submaximal dose of 2.5 ng/mL FGF-2
significantly enhanced the proliferation rates of BAE cells. Figure 4.5a displays the
average absorbance of light at 570 nm, which corresponds to cell density, of cultures
maintained in cell culture media with and without either 1 or 2.5 ng/mL FGF-2 for 72
hours. As shown in Figure 4.5a, BAEC cultured in DMEM containing 10% FBS and
supplemented with 2.5 ng/mL but not 1 ng/mL FGF-2 exhibited a significantly (p < 0.01)
increased level of crystal violet uptake compared to untreated cells.
Figure 4.5a – Endothelial cell growth is dependent on the presence of local concentrations of fibroblast growth factor-2 (FGF-2) within a certain range of concentrations. Crystal violet light absorption at 570 nm (measure of cell density) of two-dimensional BAEC cultures was measured for cultures maintained in media alone (white bar) or in the presence of 1 and 2.5 ng/mL FGF-2 (gray bar). Bars in the figure are mean absorbance units ± standard error; n=3 independent experiments compared to control levels using a paired t-test with Bonferroni’s correction (*p < 0.01; N = 3).

51
4.6. Effect of Sustained Hydrostatic Pressure on BAEC Population Growth
BAEC were seeded on two-dimensional substrates at a cell density of 5,000
cells/cm2 and exposed to sustained pressures of 20 mmHg or 40 mmHg for a period of 72
hours. The results of this experiment are shown in Figure 4.6a. After exposure to 20
mmHg sustained pressure for 72 hours, BAEC populations exhibited significant increases
Figure 4.6a – Endothelial cell proliferation is responsive to both local hydrostatic pressures and local levels of FGF-2 (labeled as bFGF) in the supernatant media. Cell density was determined by measuring crystal violet light absorbance at 570 nm of two-dimensional BAEC cultures. Comparisons were made between cultures maintained at 0 mmHg (white bars) and an experimental hydrostatic pressure (gray bars). The graphs above depict comparisons between (A) 0 mmHg (control) and 20 mmHg pressures, each in standard media (no growth factor supplement); (B) 0mmHg (control) and 20 mmHg pressures, each in media supplemented with 1 ng/mL FGF-2; (C) 0 mmHg (control) and 40 mmHg pressures, each in standard media; (D) 0 mmHg (control) and 40 mmHg, each in media supplemented with 1 ng/mL FGF-2. Crystal violet uptake of pressurized cell cultures was normalized to those of cell cultures maintained under atmospheric (control) pressure, but otherwise similar experimental (i.e., with or without FGF-2) conditions, and expressed as fold change. Bars in each panel are mean fold change ± standard error; n=5 independent experiments compared to control levels assigned a value of 1 (dashed line) using one-sample t-test (*p < 0.05).
B A
D C

52
(*p < 0.05) in cell density compared to cells maintained under control pressure (0 mmHg
above atmospheric), but otherwise similar experimental conditions. Figure 4.6a (on the
following page) displays two figures that show the effect of a 20 mmHg sustained
pressure on BAEC proliferation in media that does not contain FGF-2 (left) and media
that does contain FGF-2 (right) at a concentration 1 ng/mL. In both cases, cultures
exposed to a 20 mmHg pressure exhibited a statistically significant increase in cell
density with p-values of 0.018 and 0.049, respectively.
The same experiment was conducted with BAEC being exposed to a sustained
hydrostatic pressure of 40 mmHg for 72 hours; this experiment was also repeated four
times (N = 4). Figure 4.6a displays two figures that show the effect of a 40 mmHg
sustained pressure on BAEC proliferation in media that does not contain FGF-2 (Panel C)
and media that contains FGF-2 (Panel D) at a concentration 1 ng/mL. Pressurization
elicited significant increases in cell density of cultures maintained in media containing 1
ng/mL FGF-2 but not in cultures containing no FGF-2 with p-values of 0.042 and 0.077,
respectively.

53
The results presented in Figure 4.6b summarize the results shown in Figure 4.6a
(on the previous page) but displayed in a manner that allows for comparison of the
responses to 20 and 40 mmHg pressure and the effect of FGF-2 supplementation.
Comparing the response at 20 mmHg (Figure 4.6a, Panel A/B) and experiments
conducted at 40 mmHg (Figure 4.6a, Panel C/D) in Figure 4.6b reveals that a 20 mmHg
sustained hydrostatic pressure appears to have a more potent proliferative effect.
Figure 4.6b - Endothelial growth is a function of local hydrostatic pressure levels and extracellular levels of fibroblast growth factor-2 (FGF-2). Endothelial cell populations were maintained under atmospheric (control) pressure conditions as well as exposed to 20- and 40-mmHg hydrostatic pressures above atmospheric in the absence (white bars) and presence (gray bars) of 1 ng/mL FGF-2 for 3 days. Crystal violet uptake of pressurized cell cultures was normalized to those of cell cultures maintained under atmospheric (control) pressure, but otherwise similar experimental (i.e., with or without FGF-2) conditions, and expressed as fold change. Bars are mean fold change ± standard error; n=5 independent experiments compared to control levels assigned a value of 1 (dashed line) using one-sample t-test (#p < 0.05).

54
4.7. Effect of Sustained Hydrostatic Pressure on BAEC Morphology
Compared to cells maintained under control pressure conditions, BAEC cultures
exposed to 40 mmHg for 72 hours appeared to exhibit cell elongation. This effect was
also observed for BAEC populations exposed to 40 mmHg in culture media
supplemented with 5 ng/mL FGF-2 for 72 hours, as shown in Figure 4.7 below.
Figure 4.7a - Images of BAEC cultures after 72 hours of exposure to pressure in the absence of presence of FGF-2 (labeled as bFGF). The two images to the left show cultures exposed to 40 mmHg for 72 hours and the cells in both images appear to be elongated without any predominant orientation and tightly-packed whereas the images to the right (controls) show cells that are more rounded.

55
4.8. Role of VEGFR-3 in the Mediation of Pressure-Induced Endothelial
Proliferation
The involvement of VEGF-C-related signaling in the proliferative responses of
BAEC cultures to pressure stimulation was explored using MAZ51, a VEGFR-3
inhibitor. Under control (i.e., atmospheric pressure) conditions, BAEC cell density
decreased linearly as a function of increasing MAZ51 concentration (Figure 4.7a).
Figure 4.7a (Panel B) shows the effects of MAZ51 on BAEC population growth in
response to exposure to 20 mmHg sustained pressure. As shown in the figure, MAZ51 at
concentrations greater than 1 µM and up to 20 µm attenuated and eventually blocked the
proliferative responses of BAEC cultures subjected to 20mmHg for 72 hours.
4.9
Figure 4.8a - Pressure-sensitive endothelial proliferative responses depend on VEGFR-3 activity. (A) We defined the relationship between MAZ51 and baseline endothelial proliferation under atmospheric pressures using linear regression analyses. Points in (A) are cell densities (reflected by absorbance of crystal violet at 570 nm) – standard error. MAZ51 concentration dependence of cell densities was assessed by linear regression. (B) We also examined the influence of 0–20 µM MAZ51 on the growth response of BAEC to 20-mmHg-pressure exposure. Crystal violet uptake of pressurized cells was normalized to those of cells maintained under atmospheric (control) pressure, but otherwise similar experimental (i.e., MAZ51) conditions, and expressed as fold change. Bars in (B) are mean ± standard error; n = 5. #p < 0.05 compared to levels of matched control assigned a value of 1 (dashed line) using one-sample t-test.

56
4.9. Effects of Pressure on VEGF-C and VEGFR-3 Expression
To further explore a potential role of the VEGF-C/VEGFR-3 pathway, the
expression of VEGF-C and VEGFR-3 by BAEC exposed to either 20 or 40 mmHg
pressure were compared to those of cells maintained under control (atmospheric) pressure
conditions. As shown in Panel A and Panel B, increases in the number of cells expressing
VEGF-C and the number of cells expressing VEGFR-3, for one sample, were observed in
BAEC exposed to 20 mmHg for three days. Repeating this experiment four to six more
Figure 4.9a - Pressure upregulates cellular levels of VEGF-C and membrane expression of its high-affinity receptor, VEGFR-3 (Panel A/B). Histograms of fluorescence intensity for either VEGF-C (Panel A) or VEGFR-3 (Panel B), were plotted for unlabeled BAEC (no- stain, filled curve) and cells labeled only with the appropriate species-specific secondary antibodies, AlexaTM 488 conjugates (dotted line), as well as for control cells (thin black line) and cells exposed to 20 mmHg (thick black line) for 3 days and detected with antigen-specific primary antibodies. Mean fluorescence intensities reflecting bound antibodies for either VEGF- C (Panel C) or VEGFR-3 (Panel D) on BAEC exposed to either 20 or 40mmHg (20 or 40, respectively) were normalized to those of matched controls (dashed line) and expressed as fold change. Bars in Panel C and Panel D are mean ± standard error; n=4 to 6. #p<0.05 compared to control levels (dashed line) assigned a value of 1 (dashed line) using a one-sample t-test. *p<0.05 compared using Student’s t-test. (Shin et al., 2012).

57
times (n = 4 – 6) for both 20 mmHg and 40 mmHg revealed some significant (#p < 0.05)
differences as compared with control samples maintained at atmospheric (0 mmHg)
pressure. As shown in Figure 4.7b, exposure of BAEC to 20 mmHg, but not 40 mmHg,
sustained hydrostatic pressure for 72 hours significantly increased the expression of
VEGF-C, as compared to controls. Significant increases (#p < 0.05) in response to
pressure exposure were also observed in VEGFR-3 expression, the high-affinity VEGF-C
receptor. Specifically, the number of cells expressing VEGFR-3 significantly increased
after exposure to either a 20 or 40 mmHg sustained pressure for 3 days relative to time-
matched controls.
4.10. Effects of Pressure on BAEC Migration and Invasion of Three-
Dimensional Collagen Matrix
The effect of hydrostatic pressure on cell invasiveness, the characteristic
representative of cell migration and invasion into the extracellular matrix, of BAEC was
Figure 4.10a - Example of binary images filtered by the InvasiQuant macro written for the ImageJ software package. The image in Panel A (Migration Index = 9.371) displays a culture exhibiting less invasive activity than the image of the culture in Panel B (Migration Index = 14.256).
A B

58
investigated using a two-layer gel format (see Section 3.8 on Materials and Methods).
Figure 4.10a (on previous page) displays two representative images, each of a single
cellularized bead, embedded in a two-layer collagen gel, after 72 hours in culture. These
images were used to quantify Migration Indices (see Section 3.9 of Materials and
Methods). The Migration Index of the image on the left is 9.371 and the same quantity
for the image on the right is 14.256.
Figure 4.10b displays the Migration Indices for BAEC populations on
Cytodex3TM beads that had been cultured under atmospheric pressure for 72 hours in the
absence of the presence of either FGF-2 or VEGF-A. BAEC maintained in media
supplemented with 2.5 mg/mL FGF-2 exhibited a significant increase (p = 0.048) in
average Migration Index compared to untreated cells. In contrast, although BAEC
cultures stimulated with 2.5 mg/mL VEGF-A exhibited an overall average increase in
Migration Index over untreated cells, this effect did not result in a statistically significant
Figure 4.10b – Endothelial cell motility is affected by the local concentration of pro-angiogenic growth factors such as FGF-2 (labeled as bFGF) and VEGF-A. The migratory activity of BAEC were measured using the image processing technique and computation of the InvasiQuant ImageJ macro developed herein. All cultures were maintained at atmospheric (control) pressure conditions for 72-hour (left) and 96-hour (right) durations. The Average Migration Indices of cultures in media supplemented with FGF-2 and VEGF-A were normalized to and compared with cultures containing no added growth factor. The effect of each growth factor on migration was compared mathematically using paired Student’s t-test in conjunction with Bonferroni’s adjustment for multiple comparisons (*p < 0.05).

59
difference. Finally, after a 96-hour incubation period, BAEC populations cultured in the
presence of FGF-2 and VEGF-A exhibited significant increases (p = 0.025 and p = 0.022,
respectively) in their respective Average Migration Indices compared with paired
controls (no growth factor).
Figure 4.10c – Exposure to 20- and 40-mmHg hydrostatic pressures did not significantly enhance the invasive activity of BAEC. BAEC seeded on Cytodex3TM beads and suspended in bi-layer collagen gels for 72 and 96 hours were assessed for their ability to exhibit invasive activity (i.e., migration). The effect of pressure was compared across multiple pressures, experiment durations, and growth factor supplementation. Each experiment contained two growth factor treatment groups, 2.5 mg/mL FGF-2 (labeled as bFGF) and 2.5 mg/mL VEGF-A, and one untreated group (no growth factor). 3-D cultures were exposed to 20 mmHg for (A) 72 hours and (B) 96 hours and 40 mmHg for (C) 72 hours and (D) 96 hours. Bars in (A) and (B) represent comparisons within each growth factor group of mean fold-change in migration index ± standard error of cultures maintained at control (0 mmHg) pressure and 20 mmHg; n=3. #p > 0.05 using paired t-test. The same comparisons were performed for exposures to 40 mmHg in (C) and (D) (*p < 0.05, #p > 0.05).
A B
C D

60
In terms of pressure experiments, BAEC either exposed to a 20 mmHg or
maintained at control (atmospheric) pressure for 72 and 96 hours exhibited similar levels
of migration in between gel layers. As shown in Figure 4.10c, when exposed to 40
mmHg, BAEC migration indices were significantly (p<0.05) reduced only after 96 hours
in the absence of growth factors. Cells exposed to 40 mmHg in the presence of either 2.5
ng/mL FGF-2 or VEGF-A for either 72 or 96 hours displayed migration indices that were
similar to time-matched controls (i.e., cells maintained under atmospheric pressure
conditions in the absence of growth factor).
4.11. Effects of Local Growth Factor Concentrations on BAEC
Tubulogenesis
The results in this section describe the effects of elevated hydrostatic pressures
and local growth factor concentrations on BAEC tubulogenesis. The tube formation assay
was conducted using the single-layer gel configuration obtained by following the
protocol described in Section 3.8 of the Materials and Methods section. Images were
analyzed using the image processing method described in Section 3.10 –
Migration/Invasion Assay Analysis.
In these experiments, BAEC were seeded on Cytodex3TM microcarrier beads that
were embedded in a single-layer collagen gel and maintained in media containing either
FGF-2, VEGF-A, FGF-2 + VEGF-A, or no growth factors. During experiments, cells
were expected to initiate the process of tube formation by engaging in cellular activities
such as matrix degradation, migration, intercellular connection, and morphogenesis.
A visual example of how sprouts (or tubes) were measured, counted, and analyzed
is shown in Figure 4.8a. Tube formation was quantified by counting the number of tubes

61
per bead and measuring the length of all tubes emanating from a bead. The number of
tubes per bead was further categorized into the average number of tubes per bead of
length greater than 50, 75, and 150 micrometers.
To verify the effects of the growth factors with known pro-tubulogenic influences
used in this study, comparison of tubulogenic activity between groups maintained in
media containing no growth factors and media supplemented with FGF-2, VEGF-A, or
FGF-2 + VEGF-A. Figure 4.11b shows images of one bead from each of these growth
factor treatments.
Figure 4.11a – Visual example of the sprout/tube counting and measurement process. The figure contains two identical images of a bead embedded in a 3-D single-layer collagen gel. After incubation for 3-4 days, BAEC would form cellular processes (i.e., tubes or sprouts) emanating from the bead surface. These processes would be counted and their length measured linearly from the bead surface to the end of the process. Lines (yellow) that demonstrate how tubes were measured overlay the image on the right. Magnification 60X.
Figure 4.11b– Representative images of Cytodex3TM beads maintained in media containing no growth factor (Panel A), 2.5 ng/mL FGF-2 (Panel B), 2.5 ng/mL VEGF-A (Panel C), and 2.5 ng/mL of both FGF-2 and VEGF-A (Panel D). Bright field, magnification 60X.

62
The images in Figure 4.11b display representative BAEC bead cultures
maintained under atmospheric pressure condition in the absence (untreated controls) or
presence of either 2.5 ng/mL FGF-2, 2.5 ng/mL VEGF-A, or both FGF-2 and VEGF-A in
combination (2.5 ng/mL of each). Under all conditions tested, BAEC exhibited
tubulogenic activity consistent with the formation of sprouts. Comparisons were
performed for mean tube length per bead to determine whether the known pro-angiogenic
properties of FGF-2 and VEGF-A have a detectable effect on tube length after 72 and 96
hours. Figure 4.11c on the following page displays the average total number of tubes
above each length threshold (50, 75, 150 µm) formed within each growth factor treatment
group after 72 hours (left, Panels A/C/E) and 96 hours (right, Panels B/D/F) under
atmospheric pressure
As shown in Figure 4.11c, BAEC populations stimulated with either 2.5 ng/mL
VEGF-A or 2.5 ng/mL of VEGF-A plus 2.5 ng/ml FGF-2, but not 2.5 ng/mL FGF-2
alone, exhibited a significant increase (*p < 0.05) in the mean number of sprouts per bead
greater than 50 µm compared to untreated cells (no growth factor). After 96 hours of
culture, BAE cells under all growth factor conditions (Figure 4.9b; Panel A) exhibited
significantly increased numbers of tubes greater than 50 µm in length.
When examining the effects of growth factor concentrations on the formation of sprouts
greater than 75 µm, only bead cultures maintained under atmospheric pressure conditions
in VEGF-A for 96 hours failed to show a significant increase in the number of tubes.
Compared to untreated cells, BAEC bead populations stimulated with FGF-2, VEGF-A,
and FGF-2+VEGF-A) for 72 hours showed significant increases in the number of tubes
greater than 75 µm in length, relative to controls. Furthermore, stimulation with

63
Figure 4.11c – Graphs displaying a comparison of the number of tubes present of length greater than 0 µm (Panels A/B), 75 µm (Panels C/D), and 150 µm (Panels E/F) after maintenance in media containing no growth factor, 2.5 mg/mL FGF-2 (labeled as bFGF), 2.5 mg/mL VEGF-A (VEGF), 2.5 mg/mL of both FGF-2 and VEGF-A. Measurements were taken after both 72 hours (Panels A/C/E) and 96 hours (Panels B/D/F) of incubation under standard cell culture conditions. Bars in each graph represent the mean-fold change in the number of sprouts (i.e., tubes) counted greater than each threshold length (0, 75, or 150 µm) ± standard error of cultures maintained under each growth factor treatment; N=4. *p > 0.05 and #p > 0.05 using a paired Student’s t-test with Bonferroni adjustment.

64
VEGF-A and FGF-2 for 96 hours also induced significant increases the in the formation
of tubes greater than 75 µm in length.
As shown in Figure 4.11c on the previous page, Panels E and F, BAEC
stimulated with either FGF-2, VEGF-A, or both FGF-2 and VEGF-A for 72 hours
exhibited significant increases (*p < 0.05) in the formation of sprouts per bead that were
greater than 150 µm in length compared to untreated controls (no growth factor).
Interestingly, the number of sprouts greater than 150 µm in length that were formed by
BAEC bead cultures treated with either FGF-2, VEGF-A, or FGF-2 + VEGF-A for 96
hours were similar to those of untreated cells.
Collectively, these results confirmed the utility of the Cytodex3TM bead cultures
tested in the present study to detect changes in the tubulogenic activity of BAEC.
Figure 4.11d – Graphs displaying a comparison of the mean tube (i.e., sprout) length per bead between growth factor treatment groups after 72 hours (Panel A) and 96 hours (Panel B) of incubation. Bars in each graph above represents the fold change in mean tube length per bead ± standard error of cultures maintained under each growth factor treatment; N=4. *p > 0.05 using a paired Student’s t-test with Bonferroni adjustment.

65
4.12. Effects of a 20 mmHg Sustained Hydrostatic Pressure on BAEC
Tubulogenesis
The results in this section describe the effects of exposure to 20 mmHg
hydrostatic pressure levels in the absence and presence of the pro-tubulogenic growth
factors FGF-2 and VEGF-A on BAEC tubulogenesis. Figure 4.12a and Figure 4.12b
display representative images of beads with BAEC either maintained under control
conditions or exposed to 20 mmHg hydrostatic pressures in the absence or presence of
either FGF-2, VEGF-A or both FGF-2 + VEGF-A for 72 and 96 hours, respectively. As
shown in the figures, endothelial sprouts or tubes formed under all media treatments and
pressure conditions.
Figure 4.12a - Representative images of BAEC on Cytodex3TM beads suspended in collagen gels and maintained under atmospheric (control) or 20 mmHg pressure conditions for 3 days. One representative image is provided for each growth factor treatment at either the control (0 mmHg) or 20 mmHg pressure condition. Images were acquired under 60X magnification.

66
To examine the role of pressure on endothelial tubulogenic activity, mean tube
length as well as the numbers of sprouts formed by bead cultures that were greater than
50, 75, and 150 µm in length were quantified and compared between treatments.
Comparisons were made between control and pressure treatments for each growth factor
tested (no growth factor, 2.5 ng/mL FGF-2, 2.5 ng/mL VEGF-A, and 2.5 ng/mL FGF-
2+VEGF-A). In doing so, the effect of pressure on endothelial tubulogenesis under each
set of conditions was examined.
When examining the numbers of sprouts formed by BAEC cultures, apparent
differences were observed between those formed by either cells maintained under control
conditions or exposed to pressure. Specifically, exposure to
Figure 4.12c – Graphs displaying the comparison of the mean number of tubes (i.e., sprouts) greater than 0 µm between control (0 mmHg) and 20 mmHg pressure-exposed cultures within each treatment group after 72 hours (Panel A) and 96 hours (Panel B) of incubation. Bars in each graph above represent the mean-fold change in the number of tubes greater than 0 µm per bead ± standard error of cultures maintained under each treatment; N=4. Comparisons were made using a paired Student’s t-test (*p > 0.05, #p > 0.05).
A B
Figure 4.12b - Representative images of BAEC on Cytodex3TM beads suspended in collagen gels and maintained under atmospheric (control) or 20 mmHg pressure conditions for 4 days. One representative image is provided for each growth factor treatment at either the control (0 mmHg) or 20 mmHg pressure condition. Images were acquired under 60X magnification.

67
20 mmHg sustained hydrostatic pressure stimulated significant increases in the number of
tubes greater than 0 µm (total number of tubes/sprouts) under the “no growth factor” and
FGF-2 treatment groups after 72 hours of incubation. (Figure 4.12c, Panel A) All
significant differences in tube formation between cells exposed to pressure or maintained
under control conditions disappeared after 96 hours of incubation (Figure 4.12c, Panel
B).
Exposure to 20 mmHg sustained hydrostatic pressure for 72 hour also elicited
significant increases in the number of tubes greater than 75 µm under the “no growth
factor” (No GF) and FGF-2 treatment groups (Figure 4.12d). However, after 96 hours of
exposure, pressurization produced no effect on the formation of sprouts greater than 75
µm for all conditions tested in the present study (Figure 4.12d).
A B
Figure 4.12d – Graphs displaying the comparison of the mean number of tubes (i.e., sprouts) greater than 75 µm between control (0 mmHg) and 20 mmHg pressure-exposed cultures within each treatment group after 72 hours (Panel A) and 96 hours (Panel B) of incubation. Bars in each graph above represent the mean-fold change in the number of tubes greater than 75 µm per bead ± standard error of cultures maintained under each treatment; N=4. Comparisons were made using a paired Student’s t-test (*p < 0.05).

68
As shown in Figure 4.12e, exposure to 20 mmHg pressure for 72 hours had no
significant effect on the formation of sprouts greater than 150 µm in length compared to
cells maintained under control pressure conditions. After 96 hours, significant (p < 0.05)
reductions in the number of tubes greater than 150 µm in length were observed for BAE
bead cultures in the absence or presence of VEGF-A (Figure 4.12e). There were no
significant differences observed when cells were either exposed to pressure or maintained
under control conditions in the presence of either the FGF-2 or FGF2 + VEGF-A group
(see Figure 4.12e).
Figure 4.12f shows the results obtained when measuring mean sprout (or tube)
length per bead. Only BAEC cultures stimulated with FGF-2 + VEGF-A exhibited a
significant change (p = 0.019) in mean tube length (Figure 4.12d, Panel A). After 96
hours, significant (p < 0.05) changes in mean tube length were observed between cells
either exposed to pressure or maintained under control condition in the presence of FGF-
2 and VEGF-A (see Figure 4.12d, Panel B).
Figure 4.12e – Graphs displaying the comparison of the mean number of tubes (i.e., sprouts) greater than 150 µm between control (0 mmHg) and 20 mmHg pressure-exposed cultures within each treatment group after 72 hours (Panel A) and 96 hours (Panel B) of incubation. Bars in each graph above represent the mean-fold change in the number of tubes greater than 150 µm per bead ± standard error of cultures maintained under each treatment; N=4. Comparisons were made using a paired Student’s t-test (*p > 0.05).
A B

69
Thus, it appeared that pressure had a modest effect on the mean length of sprouts
formed by BAE bead cultures in both the absence and presence of growth factors.
4.13. Effects of a 40 mmHg Sustained Hydrostatic Pressure on BAEC
Tubulogenesis
The results in this section display the effects of exposure to 40 mmHg hydrostatic
pressure levels in the absence and presence of the pro-tubulogenic growth factors FGF-2
and VEGF-A on BAEC tubulogenesis. Figure 4.11e and Figure 4.11f display
representative images of beads with BAE cells either maintained under control conditions
or exposed to 40 mmHg hydrostatic pressures in the absence or presence of either FGF-2,
VEGF-A or both FGF-2 + VEGF-A for 72 and 96 hours, respectively.
Figure 4.12f - Graphs displaying the comparison of mean tube (i.e., sprout) length between control (0 mmHg) and 20 mmHg pressure-exposed cultures within each treatment group after 72 hours (Panel A) and 96 hours (Panel B) of incubation. Bars in each graph above represent the mean-fold change in the mean tube length per bead ± standard error of cultures maintained under each treatment; N=4. Comparisons were made using a paired Student’s t-test (*p > 0.05).
A B

70
As shown in Figure 4.13a and Figure 4.13b (following page), sprout formation
was observed under every media and pressure condition tested, both after 72 and 96
hours in culture. The figures that follow in the next page display the results of the tube
formation assay using a 40 mmHg pressure.
Figure 4.13a - Representative images of BAEC on Cytodex3TM beads suspended in collagen gels and maintained under atmospheric (control) or 40 mmHg pressure conditions for 3 days. One representative image is provided for each growth factor treatment at either the control (0 mmHg) or 40 mmHg pressure condition. Images were acquired under 100X magnification. No significant differences were observed after 3-day exposure to 40 mmHg.

71
Figure 4.13c - Graphs displaying the comparison of the mean number of tubes (i.e., sprouts) greater than 50 µm between control (0 mmHg) and 40 mmHg pressure-exposed cultures within each treatment group after 72 hours (Panel A) and 96 hours (Panel B) of incubation. Bars in each graph above represent the mean-fold change in the number of tubes greater than 50 µm per bead ± standard error of cultures maintained under each treatment; N=4. Comparisons were made using a paired Student’s t-test (*p > 0.05).
B A
Figure 4.13b - Representative images of BAEC on CytodexTM beads suspended in collagen gels and maintained under atmospheric (control) or 40 mmHg pressure conditions for 4 days. One representative image is provided for each growth factor treatment at either the control (0 mmHg) or 40 mmHg pressure condition. Images were acquired under 100X magnification. The only significant difference between cultures maintained under control pressure and cultures exposed to 40 mmHg for 96 hours was the total number of sprouts (greater than 50 µm) in cultures maintained in media containing 2.5 ng/mL FGF-2 + 2.5 ng/mL VEGF-A (Panel D/H).

72
Figure 4.13c (previous page) displays the results when cultures were exposed to a
40 mmHg sustained hydrostatic pressure and the total number of tubes was counted. In
this case, only BAEC bead cultures exposed to pressure in the presence of FGF-2 for 72
hours or FGF-2 + VEGF-A for 96 hours exhibited significant increases in total sprout
numbers. When only counting tubes or sprouts greater than 75 µm in length, there was no
statistically significant effect of pressure on sprout formation for all growth factor
conditions.
Similarly, no significant differences in the number of tubes greater than 150 µm
were elicited by subjecting cultures to a 40 mmHg sustained hydrostatic pressure (Figure
4.13e).
A B
Figure 4.13d - Graphs displaying the comparison of the mean number of tubes (i.e., sprouts) greater than 75 µm between control (0 mmHg) and 40 mmHg pressure-exposed cultures within each treatment group after 72 hours (Panel A) and 96 hours (Panel B) of incubation. Bars in each graph above represent the mean-fold change in the number of tubes greater than 75 µm per bead ± standard error of cultures maintained under each treatment; N=4. Comparisons were made using a paired Student’s t-test (*p > 0.05).

73
Combined, these results provided evidence that exposure to BAEC tubulogenic
activity is relatively insensitive to a 40 mmHg pressure stimulus. Figure 4.13f on the
following page shows the results when mean tube lengths per bead were compared within
growth factor treatment groups. No significant differences in mean tube length were
detected for bead cultures either maintained under control conditions or exposed to 40
mmHg pressure for 72 or 96 hours for all media conditions tested.
Figure 4.13e - Graphs displaying the comparison of the mean number of tubes (i.e., sprouts) greater than 150 µm between control (0 mmHg) and 40 mmHg pressure-exposed cultures within each treatment group after 72 hours (Panel A) and 96 hours (Panel B) of incubation. Bars in each graph above represent the mean-fold change in the number of tubes greater than 150 µm per bead ± standard error of cultures maintained under each treatment; N=4. Comparisons were made using a paired Student’s t-test (*p > 0.05).
B A
Figure 4.13f - Graphs displaying the comparison of mean tube (i.e., sprout) length between control (0 mmHg) and 40 mmHg pressure-exposed cultures within each treatment group after 72 hours (Panel A) and 96 hours (Panel B) of incubation. Bars in each graph above represent the mean-fold change in the mean tube length per bead ± standard error of cultures maintained under each treatment; N=4. Comparisons were made using a paired Student’s t-test (*p > 0.05).
B A

74
5. Discussion
The research presented in this thesis is the first in vitro investigation of the
hypothesis that sustained hydrostatic pressure exposure is a magnitude-dependent
modulator of early endothelial sprout formation. The foundations of this study were the
known effects of pressure on endothelial cell proliferation and morphology suggestive of
a pro-tubulogenic phenotype. Based on the established links between pressure and 2-D
cultures of endothelial cells, this study elucidates the effects of pressure on endothelial
cells in a 3-D environment.
5.1. Physiological Relevance of the Hydrostatic Pressures Used
Within the human body, endothelial cells may be exposed to sustained hydrostatic
blood pressures or pulsatile pressures that exhibit complex waveforms that vary in
Figure 5.1a – Blood pressure levels throughout the circulatory system. As shown in the figure, capillary blood pressure ranges from approximately 18 mmHg to 38 mmHg. (available at http://classes.midlandstech.edu/carterp/Courses/bio211/chap19/chap19.html)

75
amplitude and frequency depending on a particular cell’s location in the vascular tree.
The pressures used in this study, however, were consistent with the physiological
pressures to which microvascular endothelial cells are exposed.2 As shown in Figure 5.1a
on the previous page, capillary pressures vary between approximately 18 mmHg and 38
mmHg. Figure 5.1a also shows that the pulsatile component of circulatory blood pressure
found in the aorta and large arteries is largely eliminated by the time blood reaches the
capillaries.
The two pressures examined in this thesis were 20 mmHg and 40 mmHg
hydrostatic pressures—pressures similar to those that microvascular endothelial cells
would be exposed in vivo. The 40 mmHg is slightly above that which would be
encountered in the microcirculation under normal physiological conditions, however,
pressures at this level or greater may be present under pathological conditions such as in
the tumor interstitium, due to traumatic soft tissue injury, and during intraocular
hypertension. These pressures are also similar to pressures used in previous studies3 [12,
14], which allowed for comparison of results to verify the experimental setup used in this
study.
5.2. Selection of Cell Type and Three-Dimensional Matrix Composition The cell type selected for the experiments conducted herein was the bovine aortic
endothelial cell (BAEC). This cell type was selected as it is a well-characterized, stable
2 Capillary endothelial cells are exposed to pressures in the range of 18 mmHg to 40 mmHg under normal conditions. By the time blood reaches the capillaries, however, all or nearly all pulsatility in pressure has ceased. (available at http://classes.midlandstech.edu/carterp/Courses/bio211/chap19/chap19.html) 3 Sumpio et al. (1994) used pressures 40-120 mmHg to investigate the effects of sustained hydrostatic pressures on endothelial cell proliferation and morphology. Acevedo et al. (1993) also explored endothelial cell responses to pressures of 1.1 and 7.4 mmHg. Both previous studies used pressures that are considered physiologically similar to the pressures studied in this section.

76
cell type that has been used in similar experiments in previous studies [8, 12, 29, 41]. The
study by Sumpio et al. (1994) showed up-regulation of BAEC proliferation in response to
sustained hydrostatic pressures, with possible implication of FGF-2 as the growth factor
that transduced this effect [12]. The implication of FGF-2 as a modulating factor for
endothelial cell proliferation is also supported by the study by Acevedo et al. (1993),
which identified the pressure-induced release of FGF-2 by bovine pulmonary artery
endothelial cells from intracellular stores with a concomitant increase in cell proliferative
proliferation rates [14]. Both the individual and combined effects of FGF-2 and sustained
hydrostatic pressures were examined in this study and are discussed further in Section
5.4.
BAEC were also selected for their efficacy in 3-D microcarrier cultures. Though
2-D assays are effective for studying certain tubulogenesis-related cellular activities in
isolation, such as proliferation or migration, they do not mimic the in vivo 3-D
configuration associated with tube formation [7, 8]. BAEC have proven to be particularly
useful for such studies. For 3-D studies employing microcarrier bead endothelial cell
cultures, complete bead coverage is essential to create an accurate model of in vivo
sprouting angiogenesis in a microcarrier-based in vitro angiogenesis assay [8]. This is
necessary to ensure that tubulogenic sprouting originates from confluent endothelial
monolayers, similar to that which occurs in the in vivo tissue environment [8].
As described in the study by Dietrich and Lelkes (2006), BAEC both consistently
exhibited high attachment rates to Cytodex3TM microcarrier beads and were the only cell
type, out of those tested (e.g., human aortic endothelial cells (HAEC), transformed
human microvascular endothelial cells (HMEC-1), human microvascular endothelial cells

77
(HMVEC)), to form a confluent monolayer on bead surfaces within two to four days [8].
Specifically, with constant agitation during cell seeding (dynamic seeding), it has been
shown that BAEC consistently form confluent monolayers on Cytodex3TM microcarrier
beads [8, 42]. As shown in Figure 4.3a in Section 4.3, the protocol used herein
consistently produced confluent BAEC monolayers on Cytodex3TM microcarrier beads.
Though the ability of BAEC to form monolayers on microcarrier beads is robust,
the usefulness of large-vessel endothelial cells in modeling angiogenesis has been
indeterminate [8]. However, BAEC, even though derived from the bovine aorta, have
been shown to form capillary-like structures in vitro [8]. BAEC tube formation can be
enabled by using the appropriate experimental setup, as demonstrated by several studies
[8, 29, 43]. The ability of BAEC to form capillary-like tubular structures is also
demonstrated by the present study as shown in Section 4.11.
The 3-D matrices for the migration and tube formation studies conducted herein
were comprised of Type I collagen hydrogels. Two extracellular matrix materials are
predominantly used in 3-D tubulogenic assays: collagen and fibrin. Collagen was selected
as the extracellular matrix of choice as cells embedded in this type of gel tend to exhibit a
phenotype typical of that found in vivo while cells maintained in fibrin tend to exhibit
cellular activity associated with tubulogenesis that is a technical artifact of their exposure
to fibrin [8]. Moreover, fibrin matrices intuitively model clotted tissues during wound
healing processes.
5.3. Experimental Setup for Pressure Experiments
The experimental setup used in the present study was adapted from those used in
previous studies by Shin et al. (2002) [31] and Acevedo et al. (1993) [14]. The pressure

78
system used in the present study was designed and calibrated to expose endothelial cells
grown in standard multi-well tissue culture plates in either two- or 3-D configurations
(described in Section 3.8) to hydrostatic pressures above atmospheric while maintaining
a parallel culture of cells under standard pressure (i.e., 0 mmHg above atmospheric), but
otherwise, similar experimental conditions. Whether cells were grown on a 2-D rigid
polystyrene substrate or on the surface of a Cytodex3TM bead embedded in collagen gel,
the cells were directly exposed to a pressure level of 20 mmHg or 40 mmHg pressure in
the absence of pressure-induced fluid flow. The only source of pressure variation was the
depth to which Cytodex3TM beads were submerged in the culture media, which was
minimal (between 1 – 2 mmHg).
The system was capable of maintaining cultures under pressure and standard cell
culture conditions for up to 6 days.4 In the experiments conducted herein, however,
pressurized and control cultures were maintained in humidified 37 degree C, 5%
CO2/95% air environments for up to 4 days. The pressurized and control chambers were
maintained in parallel with each chamber located in the same incubator and receiving the
same constant supply of humidified 5% CO2 gas mixture. The combination of the
resistance valve and relief valve described in Section 3.5 allowed the control chamber to
be maintained at atmospheric pressure (0 mmHg) while still receiving a constant supply
of 5% CO2/95% air gas mixture. The pressurized chambers were maintained at either 20
mmHg or 40 mmHg sustained hydrostatic pressures by using the variable resistance valve
on the 5% CO2 gas supply tank and the water column pressure head source to set the
pressure for each experiment.
4 The system is capable of maintaining cultures under pressure for longer periods of time, but 4 days was the longest that any experiment conducted as a part of this study was run.

79
The system employed for the research discussed herein is also capable of
generating pulsatile pressures within a certain limits of pulse pressure magnitude and
frequency. However, there is an upper limit to pulsatile pressure magnitudes to which cell
cultures are exposed. The limitation on the magnitude of the pulse pressure is due to the
maximum output force of the linear actuator that drives the bellows. If a more powerful
linear motor were implemented, the system would be able to generate greater pulse
pressures. The need for such measures will be addressed in the future when studies that
expose cells to pulsatile pressures are conducted.
In each study performed, BAEC maintained under either pressurized or control
conditions remained viable throughout the entirety of the study and exhibited normal
cellular functions such as proliferation and morphological changes. Based on these
observations, the experimental system and pressures used in this study neither killed nor
damaged the cells over the duration of the experiments performed.
5.4. Confirmation of Cellular Responses of BAEC Grown in Two-
Dimensional Culture to Sustained Hydrostatic Pressures
Pressure Upregulates Proliferation at 20 mmHg, but not 40 mmHg, After Three
Days of Exposure
BAEC were cultured on 2-D tissue culture-treated polystyrene surfaces in cell
culture flasks and multi-well cell culture plates. Microscopic imaging revealed that the
cells attached and proliferated in the same manner demonstrated by other studies [44].
Figure 4.1a in Section 4.1 – Culture of BAEC on Two-Dimensional Substrates shows
BAEC attached to the culture surface after seeding and overnight incubation (left image)

80
as well as after several days in culture (right image). The same process that yielded the
images in Figure 4.1a was used each time BAEC were cultured on 2-D surfaces with
similar results being observed.
Experiments were performed to verify the ability of the pressure exposure to elicit
a proliferative response by the BAEC tested in the present study. Acevedo et al. (1993)
showed that as little as 1 ng/mL exogenous basic fibroblast growth factor (FGF-2 or
bFGF) upregulates bovine pulmonary artery endothelial cell (BPAE) proliferation and
causes cytoskeletal reorganization [14, 40]. An experiment was performed as a part of
this study to determine if exogenous FGF-2 would produce the expected increase in cell
density when cells were grown under control conditions in the pressure system chambers.
As shown in Figure 4.6b, cells grown in media supplemented with 2.5, but not 1, ng/mL
FGF-2 also elicited a significant (p = 0.017) increase in cell density. The average fold-
change observed in cells grown in media containing 2.5 ng/mL exogenous FGF-2 was
approximately 2.0 times the density of controls. This is consistent with the results shown
in the study by Acevedo et al. (1993), which showed comparable increases in cell density5
[14]. It should, however, be noted that BAEC exposed to 1 ng/mL did not exhibit a
statistically significant increase in proliferation. This discrepancy between the results of
the present study and those of Acevedo et al. (1993) [14], however, may have been due to
cell type differences (bovine aortic versus pulmonary artery endothelium).
The present study also verified that the pressure system used to assess the
tubulogenic activity of BAEC was capable of eliciting a proliferative responses in these
cells which were similar to those reported by previous studies. Sumpio et al. (1994) 5 The experiment conducted in the study by Acevedo et al. (1993) showed an approximate fold-change of 1.8-2.0 times that of cells grown under control conditions (no FGF-2). It should be noted that their study employed bovine pulmonary endothelial cells (BPAEC) maintained in media containing 20% FBS.
81
showed that cells exposed to a 40 mmHg sustained pressure showed a significant increase
in cell number after 9 days in culture; cells exposed to an 80 mmHg sustained pressure
showed a significant increase in cell number after 7 days in culture; and cells exposed
120 mmHg showed a significant increase in cell number after 3 days [12].6 In another
similar experiment, Acevedo et al. (1993) showed significant increases in the cell
numbers of BPAE grown under both 5 cmH2O (1.1 mmHg) and 10 cmH2O (7.4 mmHg)
sustained hydrostatic pressures after 3, 5, and 7 days in culture. As shown in Figure 4.6b,
cells maintained under a 20 mmHg, but not 40 mmHg, sustained pressure for 3 days
showed a significant (p = 0.018 and p = 0.077, respectively) increase in cell density. The
same experiment was performed with the addition of 1 ng/mL FGF-2 to the supernatant
media for both control and pressurized cultures. With the addition of FGF-2, significant
increases in cell density were observed for both 20 mmHg and 40 mmHg sustained
pressures after 72 hours (p = 0.049 and p = 0.042, respectively). Interestingly, a pressure-
induced proliferative response to 40 mmHg sustained pressure was not observed in the
absence of FGF-2. In the study by Sumpio et al. (1994), exposure of BAEC to 40 mmHg
did not exhibit a significant increase in cell number until after 9 days in culture. In the
present study, cells were exposed to a 40 mmHg sustained pressure for only 3 days. Thus,
the effect of a 40 mmHg pressure may take longer than 3 days to become apparent. It is
clear, though, that exposure to 40 mmHg for 3 days does not appear to suppress the pro-
proliferative effect of FGF-2. As shown in Figure 4.6a in Section 4.6, cells exposed to 40
mmHg and maintained in media containing 1 ng/mL FGF-2 exhibited a significant (p =
0.042) increase in cell density as compared with controls maintained under atmospheric
6 The study by Sumpio et al. (1994) also showed that changes in cell number were not due to changes in pH or pCO2.

82
(0 mmHg) pressure. Thus pressure stimulation may serve to sensitize BAEC to FGF-2
stimulation. This is consistent with the report of Shin et al. (2002) proposing that
exposure to pressure facilitates FGF-2/FGFR-2 interactions [45].
Pressure Induces Morphological Changes in Endothelial Cells
It has been shown in several previous studies that exposure of endothelial cells to
sustained hydrostatic pressure results in morphological changes and cytoskeletal
reorganization [12, 14]. Sumpio et al. (1994) showed that endothelial cells exposed to
static pressures became “more elongated and ellipsoidal in shape, but their long axes
were randomly oriented” after exposure [12]. Acevedo et al. (1993) showed that pressure
exposure induced “morphological, proliferative, and bi-layering responses” in endothelial
cells, which consisted of a transformation from “a polygonal, ‘cobblestone’ arrangement
to an elongated, randomly oriented cell cluster morphology” [14]. Microscopy results of
the present study also indicate that cells exposed to pressure exhibit morphological
changes (i.e., cell elongation) similar to those observed in previous studies. In the
representative images in Figure 4.6c in Section 4.6, cells exposed to a 40 mmHg
sustained pressure for 3 days appeared to elongate in randomly oriented directions as
described in earlier studies. This response was also observed in BAEC cultures exposed
to 20 mmHg (data not shown), but it is interesting to note that, even though exposure to
40 mmHg for 72 hours did not elicit a significant increase in cell density, it did elicit
morphological changes.
MAZ-51 Inhibitor Blocks Increased Proliferation in Response to Pressure
It has been difficult to ascertain the role of VEGFR-3 expression in vascular
endothelial tubulogenic processes because its ligand, VEGF-C, also binds strongly to

83
VEGFR-2 [29]. However, BAEC have been shown to express both VEGFR-2 and
VEGFR-3. [29]. It has been shown that BAEC cultures uniformly express VEGFR-2, for
which autophosphorylation is induced by binding of the VEGF-A, VEGF-C, VEGF-D, or
VEGF-E ligands [29]. In contrast, studies have shown that expression of VEGFR-3 by
vascular endothelial cells (specifically BAEC) is not uniform, but rather, heterogeneous
[29]. Persaud et al. conducted a study similar to the one discussed herein in which BAEC
were grown in 3-D collagen gels and exposed to exogenous growth factors and inhibitors
[29]. They reported that BAEC gel invasion and tube formation could be induced using a
proteolytically-modified VEGF-C analog, which was established as a ligand for both
VEGFR-2 and VEGFR-3 (Joukov et al., 1997; Tille et al., 2003) [29, 46]. It was observed
that invasive and tubulogenic responses of BAEC could be completely inhibited by
antagonistic antibodies to VEGFR-2 when the inducing-agent was VEGF-A, which is not
a ligand for VEGFR-3 [29]. When the exogenous inducing-agent was the VEGF-C
analog, which binds to both VEGFR-2 and VEGFR-3, the response “could only be
inhibited by a maximum of 67% by antagonizing VEGFR-2 [29, 46]. Therefore, the
response must have been elicited through the VEGFR-3 pathway, indicating that some
BAEC expressed VEGFR-3. Persaud et al. (2004) also analyzed BAEC VEGFR-3
expression using fluorescence-activated cell sorting (FACS) to determine VEGFR-3
expression levels in BAEC populations and determined that VEGFR-3-positive and
VEGFR-2-negative BAEC subpopulations were approximately equal (i.e., VEGFR-3
expression will be observed in 50% of any given BAEC population) [29].
Having established that BAEC do express VEGFR-3, the present study
determined whether its ligand, VEGF-C, plays a role in transducing pressures. It has been

84
shown that exposure of human vascular endothelial cells to cyclic pressure result in
significant increases in proliferation that is mediated by VEGF-C [31]. In fact, Shin et al.
(2002) showed that the VEGF-C gene in human umbilical vein endothelial cells
(HUVEC) maintained under a 60/20 mmHg pulsatile pressure was the most highly
upregulated gene [31]. Notably, it was established that HUVEC proliferation was
upregulated in response to a 60/20 mmHg pulsatile pressure, but when HUVEC were
incubated with mouse monoclonal VEGF-C antibody, this response was completely
blocked [31]. Thus, VEGF-C appeared to serve as an autocrine signaling factor in the
proliferative responses of endothelial cells to pressure stimulation.
In the present study, BAEC were incubated with varying concentrations of MAZ-
51 and exposed to a 20 mmHg sustained hydrostatic pressure that had been shown to
stimulate a statistically significant increase in BAEC proliferation (See Section 4.6).
MAZ-51 is an indolinone, a class of molecules that have the ability to inhibit the activity
of receptor tyrosine kinases, that potently blocks ligand-induced autophosphorylation of
VEGFR-3 [47]. MAZ-51 also inhibits VEGFR-2 autophosphorylation, although less
strongly [47]. Based on these properties, MAZ51 was used to explore the possibility that
VEGFR-3 plays a role in the proliferative responses of endothelial cells to pressure.
As expected, exposure of BAEC to 20 mmHg sustained pressure produced a
statistically significant (N=5, p < 0.05) increase in cell density as compared with controls
(0 mmHg) in the absence of MAZ-51. Interestingly, exposure to 20 mmHg on average
enhanced BAEC densities in the presence of both 1 µM and 5 µM concentrations of
MAZ-51, although these effects were not statistically significant. However, pressure-
dependent increases in cell density was completely blocked at concentrations of 10 µM
85
MAZ-51 or greater. Notably, VEGFR-2 blockade requires concentrations MAZ51 greater
than 50 µM [47]. Thus, it would appear that VEGFR-3 is involved in the transduction of
the bovine aortic endothelial cell response to sustained hydrostatic pressure.
Increased VEGF-C and VEGFR-3 Expression in Response to Sustained
Pressure Exposure
To explore the possibility that pressure influences endothelial proliferation via the
autocrine actions of VEGF-C, the present study assessed VEGF-C and VEGFR-3
expression by BAEC in response to exposure to sustained pressure. As shown in Figure
4.7b in Section 4.7, a significant increase was observed in BAEC expression of VEGF-C
after exposure to 20 mmHg for 3 days. Exposure to both 20- and 40-mmHg sustained
pressures produced significant increases in VEGFR-3 membrane expression after 3 days
as compared with controls. These results further implicated VEGF-C and VEGFR-3 in
the transduction of endothelial responses to sustained hydrostatic pressures. Since VEGF-
C and VEGFR-3 have been implicated in vascular cell tubulogenesis [29, 30, 33, 38] and
because the proliferative responses of endothelial cells to pressure appears to signal
through the VEGF-C/VEGFR-3 pathway, it follows that pressure may stimulate
endothelial tubulogenic activity. Thus, the present study examined the effects of pressure
on two early tubulogenic processes: migration/matrix invasion and tube/sprout formation.
5.5. Investigation of the Effects of Sustained Pressure on Endothelial
Migration and Invasion
The bi-layer gel study described in Section 3.8 was employed to determine the
effect of sustained hydrostatic pressures on the migratory and invasive behavior of

86
endothelial cells. Migration and invasion are but two cellular activities comprising the
angiogenic cascade [22]. A scientific contribution of the present study was the
development of a two-layer gel assay to assess the effects of pressure on endothelial
migration in a 3-D format. Along this line, it was determined that endothelial cells grown
on Cytodex3TM tended to migrate from the bead into the surrounding gel within the plane
between two distinct gel layers co-planer with the mid-plane of the bead as shown in
Figure 5.4a.
Using this method, migratory and invasive activity of endothelial cells was
compared between various pressures and growth factor treatments. To confirm the utility
of this approach to assess endothelial migratory responses to pro-tubulogenic stimuli, the
effect of FGF-2 and VEGF-A on endothelial migration and invasion into the extracellular
space was assessed. Both of these molecules have been previously shown to enhance
endothelial migration [7, 22]. Using a novel two-layer configuration and analysis method
(see Section 3.8), the present study showed that both FGF-2 and VEGF-A induced
Figure 5.5a – Representative images of BAEC migrating from a CytodexTM bead in the bi-layer gel configuration. Shown are a phase-contrast image of a single bead with invading cells (Panel A) and the same image after processing using the InvasiQuant ImageJ macro. Cells migrated from the surface of the bead on the plane between the top and bottom gel layer, which is co-planar with the mid-plane of the bead. This allowed for all cellular activity to be captured on one microscopic focal plane and consistent image transformation using the InvasiQuant ImageJ macro. Images were captured at 100X magnification.
A B

87
significant increases (p < 0.05) in BAEC migration and invasion between the two
collagen gel layers. It should be noted that the effect of VEGF-A, however, was not
observed until after 96 hours in culture (see Figure 4.8b) suggesting that FGF-2 was a
more potent migratory stimulus. Nonetheless, these results collectively indicated the
utility of the two-layer gel assay developed in the present study to assess the effects of
pro-tubulogenic stimuli in modulating BAEC migration.
Interestingly, the only significant difference (p < 0.05) in migratory activity of
BAEC in response to pressure observed in the present study was a decrease in the
migration of cells maintained without growth factor supplementation under 40 mmHg for
96 hours. In other words, exposure to 20 or 40 mmHg sustained pressure for up to 96
hours did not enhance BAEC migration. It is possible that the image analysis method
used to quantify the migration of BAEC populations was not sensitive enough to detect
an effect of pressure on endothelial migration. A similar quantitative method has been
used in previous studies to quantify angiogenesis [48]. Boettcher et al. (2010) developed
a method for quantifying tube formation in mouse aortic ring experiments in which, after
image processing, capillary-like sprouts are displayed in black pixels, which represent the
area covered by invading cells that can be quantified easily by counting the number of
black pixels [48]. Gray-scale images were processed by applying a high-pass filter to
remove low frequency artifacts (e.g., structures out of focus or background
inhomogeneities) and preserve high frequency gradients (i.e., capillary-like structures),
then converting the image to a thresholded, binary-encoded image to allow for pixel-
counting [48]. The method used herein to analyze images of BAEC invasion was adapted
from this approach, as described in Section 3.11.

88
Since previous studies suggested that pressure sensitizes endothelial proliferative
responses to growth factor (e.g., FGF-2) stimulation, endothelial migration responses to
pressure were also examined in the presence of pro-tubulogenic growth factors. Though
FGF-2 (bFGF) and VEGF-A operate through independent pathways, both have been
implicated in the stimulation of endothelial migration [33]. FGF-2 and VEGF-A, in
isolation, enable similar cellular functions including migration and each factor is essential
for endothelial tubulogenesis. However, they likely affect tubulogenesis at different times
during the process [22]. In combination, FGF-2 and VEGF-A have a synergistic affect on
cell invasion and tube formation [22].
Previous studies have shown that FGF-2 is capable of inducing both cell
mitogenesis and cell mobility [34]. FGF-2 binding activates a dual transduction pathway,
with one pathway leading to a migratory phenotype and the other pathway leading to cell
proliferation [34]. FGF-2 has been implicated in chemotactic endothelial cell migration
[49]. Specifically, FGF-2 has been shown to drive endothelial invasion into collagen
matrices by upregulating the expression of the plasminogen activators and matrix
proteases necessary for dissolution of the basement membrane prior to migration and
sprouting [32].
VEGF-A (also referred to as VEGF) is the pro-angiogenic monomer that binds to
the VEGFR-1 and VEGFR-2 receptors. VEGF-A is a potent angiogenic agent that
regulates all of the keys steps of the angiogenic process, including endothelial cell
proliferation and migration [49]. Though VEGFR-1 is the high-affinity receptor for
VEGF-A, the migratory response of endothelial cells is regulated by the binding of
VEGF-A to VEGFR-2 [49].

89
It has also been reported that VEGF-C, which binds to both VEGFR-2 (low
affinity) and VEGFR-3 (high affinity) in BAEC, induces endothelial migration in
collagen matrices [29, 50]. Moreover, BAEC migration induced by exogenous VEGF-C
can be completely blocked by the inhibition of VEGFR-3 [29]. Interestingly, Persaud et
al. (2004) showed that BAEC migrated towards localized concentrations of a VEGF-C
analog; a response that was abrogated in a dose-dependent manner by addition of a
VEGFR-3 antagonistic antibody (mAb hF4-3C5) [29]. However, the study by Persaud et
al. (2004) also revealed that the migratory response to VEGF-C could not be completely
blocked by inhibition of binding to VEGFR-2, the low-affinity receptor for VEGF-C
[29]. As explained in the study, the most obvious explanation for the increased migratory
response of VEGFR-3-expressing BAEC is that the affinity of VEGF-C for VEGFR-3 is
about fivefold higher than for VEGFR-2. [29]. Thus, stimulation of VEGFR-3 by VEGF-
C is likely to be stronger and more sustained than that of VEGFR-2 [29]. Even though the
expression of VEGFR-3 in normal cultures of BAEC is approximately 50% [29], the
high-affinity binding of VEGF-C to VEGFR-3 is strongly indicative that the VEGF-
C/VEGFR-3 pathway plays a role in BAEC migration and tube formation.
In summary, the methods used herein to quantify migration and invasion were
able to detect increases in migration in response to FGF-2 and to VEGF-A under control
conditions. As shown in Figure 4.8b, after 72 hours, significantly increased (p > 0.05)
migration was observed in cultures exposed to 2.5 ng/mL FGF-2 as compared with
cultures maintained under complete media without added growth factors. After 96 hours
under atmospheric pressure (0 mmHg), significant increases in migration were observed
in both the FGF-supplemented and VEGF-supplemented cultures as compared with

90
controls without added growth factor. This provides some evidence that the migration
assay and method of analysis are capable of detecting expected changes in endothelial
migration. The same methods and analysis were also applied to determine whether 20 or
40 mmHg sustained pressures affect endothelial migration. The only significant
difference observed was a decrease in endothelial migration after 96-hour exposure to a
40 mmHg sustained pressure in the absence of added growth factors. Considering that a
40 mmHg sustained pressure was shown as having no significant effect on cellular levels
of VEGF-C, the mechanism through which a 40 mmHg sustained pressure suppresses
BAEC migration, if at all. It is likely that a more refined experiment and method of
analysis may be required to detect subtle changes in endothelial migration.
5.6. Investigation of the Effects of Sustained Pressures on Endothelial
Tube Formation
Tube formation experiments were performed according to the protocol in Section
3.8 through Section 3.12 in order to confirm the effects of known pro-tubulogenic growth
factors on tube formation and to determine the effect, if any, of physiologic sustained
pressures on tube formation. Many growth factors have been implicated in endothelial
tube formation, however, none more so than those of the FGF and VEGF families. FGF-2
is one of the more studied pro-angiogenic factors and has been shown to be a potent
mitogen and chemotactic factor capable of inducing endothelial cells to invade
extracellular matrices and form capillary-like structures in vitro [17, 32]. FGF-2 has been
shown to promote tubulogenesis by eliciting a variety of cellular activities such as cell
elongation, proliferation, migration, and protease production and release [14, 22, 29, 32,
33, 49]. FGF-2 release has also been shown to be involved in the responses of endothelial

91
cells to pressure [14]. Additionally, exposure of endothelial cells to exogenous FGF-2 has
been shown to induce autocrine expression of VEGF-A [29].
VEGF-A is also a potent mitogenic factor that is highly-specific to vascular and
lymphatic endothelial cells and plays a multifunctional role in both angiogenesis and
lymphangiogenesis [38, 51]. The role of VEGF-A in angiogenesis is central as it affects
and regulates all of the key steps of the angiogenic (and lymphangiogenic) process [49].
VEGF-A has been shown to induce cell proliferation in both vascular and lymphatic
endothelial cells [38, 49]. VEGF-A has also been implicated in the induction of cell
survival, cytoskeletal reorganization, migration, tube formation, and branching
morphogenesis [38, 49, 51]. Though VEGF-A is functionally essential for endothelial
tubulogenesis, its release or expression, however, has not been shown to be affected by
pressure exposure.
FGF-2 and VEGF-A were also used in combination in the tube formation
experiments as it has been shown that “VEGF-A and FGF-2 synergize in the induction of
endothelial cell invasion and tube formation in collagen gels [22]. It has been proposed
that VEGF-A may promote early tubulogenic activity whereas FGF-2 might be involved
in the later morphogenic and cellular remodeling activities [22]. Cavallaro et al. (2001)
hypothesized that FGF-2 “triggers” tubulogenesis when VEGF-A is already present in the
pericellular environment [22, 37]. Mandriota and Pepper (1997) showed that exogenous
FGF-2 upregulates membrane expression of VEGFR-2 in BAEC [37]. However, as
previously mentioned, basal levels of VEGFR-2 expression are not affected by blocking
FGF-2 [37]. Combined, these findings support the possibility that FGF-2 may influence

92
the activities of endothelial cells under pressure hydrostatic pressures independent of
VEGF-A.
Unlike for VEGF-A, VEGF-C expression has been shown to be upregulated by
exposure of endothelial cells to pressure stimulation. In fact, the present study showed for
the first time that exposure of BAEC to hydrostatic pressures selectively upregulated
expression of VEGF-C and its high-affinity receptor for VEGFR-3. VEGF-C has been
implicated in the stimulation of both angiogenesis and lymphangiogenesis through the
enhancement of endothelial cell proliferation, migration, and tube formation [29, 38].
Interestingly, VEGFR-3 is associated predominantly with lymphangiogenesis,
particularly in the developing embryo. Moreover, it has also been shown that both FGF-2
and VEGF-A plays an upstream role in VEGF-C expression by cultured vascular
endothelial cells [15]. These factors, taken together, support the notion that the pro-
tubulogenic effect of pressure on endothelial cells involves VEGF-C/VEGFR-3
interactions.

93
Table 5.6a – Summary of Significant (p < 0.05) Differences between Pressure and Control Cultures. Summary table of the significant differences in the various tube formation measures between pressure-exposed and control cultures within each growth factor treatment group. Differences in which the measured value of the pressure-exposed group was significantly greater than that of the control group are marked with a plus (+) symbol and those where the pressure-exposed group was significantly less than the control group with a minus (-) symbol. Significant differences were determined by paired Student’s t-test where p < 0.05 indicated a significant difference.
Summary of Significant Pressure/Control Differences
72 Hours 96 Hours
No GF FGF-2 VEGF FGF+ VEGF
No GF FGF-2 VEGF FGF+ VEGF
20 m
mH
g
Total (> 50
µm)
+ +
> 75 µm + +
> 150 µm - -
Mean Length - - -
40 m
mH
g
Total (> 50 µm) + +
> 75 µm
> 150 µm
Mean Length
As summarized in Table 5.6a, the number of sprouts greater than 50 µm (total)
and 75 µm increased after 72-hour exposure to 20 mmHg. Interestingly, exposure to a 20
mmHg sustained pressure for 72 hours increased VEGF-C expression (Figure 4.9),
VEGFR-3 expression (Figure 4.9), and proliferation (Figure 4.6a, Figure 4.6b) by
BAEC. Previous studies have shown that the endothelial responses to pressure may also
involve the upregulation of FGF-2 expression or release [14, 45], which may potentially
cause an increase in VEGFR-2 expression. It also possible that pressure-sensitive tube
formation involved the sensitivity of endothelial cells to FGF-2 stimulation. As shown in
Figure 4.10a and Figure 4.10b, significant increases were observed in both the untreated
and FGF-2 treatment groups after exposure to 20 mmHg for 72 hours as compared to

94
paired cultures maintained under control (0 mmHg) pressure but otherwise similar
growth factor conditions. Notably, the FGF-2 group exhibited, on average, a greater mean
fold-change in the number of tubes than the untreated group. This indicates that FGF-2
modulates the intensity of tubulogenic pressure response. The potential pathways by
which pressure may influence endothelial tube formation is summarized in Figure 5.6a
on the following page shows various pathways through which pressure transduction may
occur.
The mechanisms by which pressure elicits these effects on tubulogenic growth
factors and receptors are varied. Previous studies have shown that endothelial cells
synthesize intracellular FGF-2 under normal culture conditions [14]. These intracellular
stores, located in the nuclei and cytoplasm, were diminished by pressure exposure,
VEGFR-2 é VEGFR-3 é FGFR-2
VEGF-A
VEGF-C é FGF-2 é
PRESSURE
(proliferation, migration,
differentiation, cytoskeletal remodeling)
(proliferation, migration, tube
formation)
(proliferation, migration, tube
formation)
Figure 5.6a – The cumulative effects of pressure and growth factors on various other growth factors, growth factor receptors, and tubulogenic processes. Arrows indicate the effect that pressure has on the expression or release of each molecule. Up arrows next to growth factors or receptors indicate increases in that molecule. As shown, pressure causes increases (green) in FGF-2, VEGF-C, and VEGFR-3. Pressure also may, through the increases in FGF-2 expression or release (blue), increase VEGFR-2 expression. Dashed-line arrows indicate low-affinity interactions.

95
indicating cellular release of cytosolic FGF-2 stores in response to pressure [14].
Pressure-induced FGF-2 release increases the concentration of exogenous FGF-2, which
acts in an autocrine and/or paracrine manner and elicits the morphological, proliferative,
and tubulogenic effects associated with FGF-2/FGFR-1 binding. It has also been shown
that pressure causes increases in VEGF-C transcription [31]. Increased transcription may
also be the mechanism by which pressure increases membrane expression of VEGFR-3,
the high affinity VEGF-C receptor.
A significant increase in sprouting was also observed after exposure of BAEC to
40 mmHg in the presence of FGF-2 for 72 hours. This also supports the hypothesis that
FGF-2 “sensitizes” endothelial cells to pressure or is the “trigger” for tubulogenesis in
response to pressure-induced VEGF-C expression since exposure to 40 mmHg pressure
alone was not shown to induce increased proliferation (Figure 4.6a and Figure 4.6b).
FGF-2 is a known mitogenic growth factor and its release has been shown to be induced
by select pressure regimes [14]. Because increased proliferation was not observed in
response to 72-hour exposure to a 40 mmHg sustained pressure, it is likely that a 40
mmHg sustained pressure does not elicit an effective increase in FGF-2 expression or
signaling. This could explain why no significant difference in the total number of sprouts
was observed in the untreated group (“No GF”) after 72 hours of exposure to 40 mmHg,
but a significant increase was observed when cultures were supplemented with 2.5 ng/mL
of FGF-2.
Moreover, after 96 hours in culture, the combined effects of 40 mmHg pressure
exposure and FGF-2 stimulation disappeared. In this regard, it is possible that BAEC
cultures consumed the full doses of exogenous FGF-2 within the 96-hour duration of the

96
pressure experiments with the previously increased tubulogenic activity returning to basal
levels. Prior studies have reported that the local microenvironmental concentration of
growth factors and not the total dose is governs the resultant microvascular structure [17].
Therefore, it is possible that persistent increases in tubulogenic activity would be
expected if FGF-2 levels in culture media were constantly replenished. Interestingly,
Ozawa et al. (2003) reported that high initial doses of angiogenic factors, such as VEGF-
A, result in aberrant blood vessels and abnormal tube formation [52]. Thus, it is also
possible that low (optimal) levels of growth factors stimulate a persistent and normal
microvascular response as compared to high (abnormal) levels [17]. Therefore, pressure
may play a role in maintaining vascular development at a physiologic level.
It was also shown in the current study that BAEC stimulated with 2.5 ng/mL
VEGF-A exhibited significant decreases in the number of tubes greater than 150 µm in
length and a significant decrease in the mean tube length per bead after both 72- and 96-
hour exposure to a 20 mmHg sustained pressure (Figure 4.12e). Ozawa et al. (2003)
provided evidence that a threshold level of VEGF-A that supports physiologic levels of
angiogenesis exists, and that exposure to levels of this growth factor in excess of this
threshold concentration results in aberrant tube formation and are likely to result in
capillary-like vessels displaying morphological and functional abnormalities [52]. As
mentioned previously, it has been shown in this study that a 20 mmHg sustained pressure
elicits significant increases in VEGF-C expression, which, in addition to promoting
tubulogenic activity, has been shown to increase membrane expression of VEGFR-2 (the
high-affinity receptor for VEGF-A) (Figure 4.9). Notably, a 72-hour exposure to 20
mmHg was also shown to increase membrane expression of the high-affinity VEGF-C

97
receptor, VEGFR-3. Taken together, these findings support the hypothesis that pressure,
in combination with exogenous VEGF-A supplementation, may have caused a supra-
physiologic expression level of vascular endothelial growth factor activity. This could
explain why cultures supplemented with VEGF-A were unable to support sustained tube
growth for 72 or 96 hours, which is in agreement with the results reported by Ozawa et
al. (2003) [52].
5.7 Concluding Remarks
The results of the present study, combined with data from prior studies, suggest
that hydrostatic pressure may play a role in endothelial tubulogenesis in vivo and be used
as a modulating factor for neovascularization of tissues grown in vitro. This study
suggests that the pressure modulation is actuated through a coupling of the FGF-2/FGFR-
2 and VEGF- C/VEGFR-3 pathways.
Both FGF-2 and VEGF-C play significant roles in tubulogenesis in both vascular
and lymphatic networks. It has been shown in this study as well as previous studies that
exogenous FGF-2 and VEGF-family growth factors, specifically VEGF-A and VEGF-C,
synergistically enhance in vitro BAEC tubulogenesis [37, 38, 53]. The present study
presents evidence, consistent with previous studies [37], that FGF-2 signaling is a
precursor to VEGF-C-mediated tubulogenesis. This finding is consistent with reports [37]
that FGF-2 “triggers” the endothelial response to VEGF-family growth factors. Thus,
pressure may be an effective modulator of vascular and lymphatic growth for its reported
ability to upregulate the local activity levels of both FGF-2 and VEGF-C [2, 14, 19, 31,
45]. Thus, it is possible that FGF-2 “sensitizes” endothelial cells to pressure.

98
The current study also examined the effects of pressure on endothelial
tubulogenesis defined in terms of a discrete set of endothelial activities: proliferation,
migration into the extracellular matrix, and the assembly of capillary-like sprouts/tube. In
this regard, BAEC seeded on polymeric microcarrier beads and embedded in collagenous
matrices were capable of forming sprouts and doing so under a variety of conditions.
Specifically, linear, multicellular sprout-like structures extended from the Cytodex3TM
bead surfaces. It should be noted that the present study did not investigate whether
endothelial sprouts formed lumens in vitro. However, previous studies [54] have shown
that endothelial sprouts typically do not form lumens after two to three days in culture
and require other cell types such as pericytes or fibroblasts. Future studies should thus
incorporate the use of other cell types to investigate lumen formation in a more
physiological setting.
Despite this limitation, the observed robust tubulogenic response of BAEC to the
20 mmHg pressure stimulus was consistent with the magnitude-dependent effects of
hydrostatic pressure on cell proliferation as well as on VEGF-C and VEGFR-3
expression reported in this and previous studies [31]. Also, the observations that FGF-2
promoted a detectable pressure-sensitive increase in endothelial sprouting under 40
mmHg is consistent with the effect of FGF-2 in the 40 mmHg cell proliferation
experiments [12].
Taken together, this study focused on elucidating the effects of hydrostatic
pressure on endothelial tube formation in the context of the potential use of this
mechanical stimulus as an approach to modulate microvascular formation in synthetic or
in vitro-grown tissue constructs. Given the known effects of fluid flow and substrate

99
strain on endothelial cells [2], it is important to point out that the hydrostatic pressure
regimes used in these experiments were applied in the absence of fluid flow to the
incompressible supernatant layer. BAEC responses also occurred in the absence of
substrate strain, since the ability of the applied pressure to deform the porous, fully
hydrated collagen gel matrix to significant levels is unlikely. Based on these, the present
study suggests a role for pressure in early endothelial tubulogenic activity of bovine
endothelial cells. Future work, however, is needed to validate human endothelial cells
respond to pressure in a similar way, considering that the end application is the
engineering of replacement human tissues.
In summary, the salient finding of the present Master’s dissertation-related
research is that early endothelial tubulogenic activity exhibits pressure sensitivity. It
remains to be determined whether pressure-sensitive sprouting leads to the eventual
establishment of lumen-containing tubular networks. However, our results provide new
evidence substantiating pressure as a tubulogenic stimulus. The findings in this study
have implications in a variety of areas. First, these findings add to those of previous
studies in elucidating the pressure transduction mechanism of endothelial cells. Second, it
has implications in pathological conditions where supraphysiologic pressures may cause
erratic and abnormal vascular formation (e.g., glaucoma, cancer, and wound healing).
And finally, this study advocates for the use of pressure to modulate neovascularization
of tissues and synthetic tissue constructs in vitro so as to promote their ability to integrate
and survive in vivo.

100
References 1. Carmielet, P., Angiogenesis in health and disease, Nature Medicine 9(6):653-660
(2003). 2. Shiu, Yang-Ting, et al., The Role of Mechanical Forces in Angiogenesis, Critical
Reviews in Biomedical Engineering 33(5), 431-450 (2005). 3. Ikada, Yoshita (2006), Tissue Engineering: Fundamentals and Principles, Oxford,
UK: Elsevier, Ltd. 4. ATP Focused Program: Tissue Engineering, National Institute of Standards and
Technology, http://www.atp.nist.gov/focus/tissue.htm (visited on December 10, 2012) 5. Griffith et al., “Diffusion Limits of an in Vitro Thick Prevascularized Tissue,” Tissue
Engineering, 11, 257-265 (2005). 6. Schechner, J.S., A.K. Nath, L. Zheng, M.S. Kluger, C.C.W. Hughes, M.R. Sierra-
Honigmann, M.I. Lorber, G. Tellides, M. Kashgarian, A.L.M. Bothwell, J.S. Pober, In vivo formation of complex microvessels lined by human endothelial cells in an immunodeficient mouse, Proc. Natl. Acad. Sci. 97(16):9191-9196 (2000).
7. Nehls, V. and D. Drenckhahn, “A microcarrier-based cocultivation system for the investigation of factors and cells involved in three-dimensional fibrin matrices in vitro,” Histochem Cell Biol 104(6), 459-466 (1995).
8. Dietrich, F. and P. Lelkes, “Fine-tuning of a three-dimensional microcarrier-based angiogenesis assay for the analysis of endothelial-mesenchymal cell co-cultures in fibrin and collagen gels,” Angiogenesis 9, 111-125 (2006).
9. The Organ Transplant Procurement Network, http://optn.transplant.hrsa.gov (visited on December 10, 2012).
10. Lokmik, Z. and G. Mitchell, Engineering the Microcirculation, Tissue Engineering 14(1):87-103 (2008).
11. Sumpio et al., Cells in focus: endothelial cell, Int’l. J. Biochem. and Cell Bio. 34:1508-1512 (2002).
12. Sumpio, B.E., M.D. Widmann, J. Ricotta, M.A. Awolesi, M. Watase, Increased Ambient Pressure Stimulates Proliferation and Morphological Changes in Cultured Endothelial Cells, J. Cell. Phys. 158:133-139 (1994).
13. Stoeltzing, Oliver et al., Angiopoietin-1 Inhibits Vascular Permeability, Angiogenesis, and Growth of Hepatic Colon Cancer Tumors, Cancer Res. 63:3370-3377 (2003).
14. Acevedo A.D., S.S. Bowser, M.E. Gerritsen, R. Bizios, Morphological and Proliferative Responses of Endothelial Cells to Hydrostatic Pressure: Role of Fibroblast Growth Factor, J Cell Phys. 153:603-614 (1993).
15. Skobe, M. and M. Detmar, Structure, Function, and Molecular Control of the Skin Lymphatic System, Skin Lymphatic System 5(1):14-19 (2000).
16. Vailhe, B., D. Vittet, J.J. Feige, In Vitro Models of Vasculogenesis and Angiogenesis, Laboratory Investigation 81(4):439-452 (2001).
17. Uriel, Shiri, Brey, Eric M., & Greisler, Howard P., Sustained low levels of fibroblast growth factor-1 promote persistent microvascular network formation, The American Journal of Surgery 192, 604-609 (2006).
18. Ucuzian, A.A., H.P. Greisler, In Vitro Models of Angiogenesis, World J. Surg. 31:654-663 (2007).

101
19. Shin, H.Y., R.M. Underwood, M.W. Fannon, Fluid Pressure Is a Magnitude-Dependent Modulator of Early Endothelial Activity: Implications Related to a Potential Tissue Engineering Control Parameter, Tissue Engineering Part A 18(23-24):2590-2600 (2012).
20. Folkman, J. and C. Haudenschild, Angiogenesis in vitro, Nature 288 (5791):551-556 (1980).
21. Montesano, R., M.S. Pepper, L. Orci, Angiogenesis In Vitro: Morphogenetic and Invasive Properties of Endothelial Cells, Physiology 5:75-79 (1990).
22. Cavallaro U., M. Tenan, V. Castelli, A. Perilli, N. Maggiano, E.G. Van Meir, R. Montesano, M.R. Soria, M.S. Pepper. Response of Bovine Endothelial Cells to FGF-2 and VEGF is Dependent on Their Site of Origin: Relevance to the Regulation of Angiogensis, J. Cell Biochem. 82:619-633 (2001).
23. Ferrara, N., Role of vascular endothelial growth factor in the regulation of angiogenesis, Kidney Int’l 56:794-814 (1999).
24. Cao, R., A. Eriksson, H. Kubo, K. Alitalo, Y. Cao, J. Thyberg, Comparative Evaluation of FGF-2-, VEGF-A-, and VEGF-C-Induced Angiogenesis, Lymphangiogenesis, Vascular Fenestrations, and Permeability, Circ. Res. 94:664-670 (2004).
25. Ferrara, N., K. Carver-Moore, H. Chen, M. Dowd, L. Lu, K.S. O’Shea, L. Powell-Braxton, K.J. Hillan, M.W. Moore, Heterozygous embryonic lethality induced by targeted inactivation of the VEGF gene, Nature 380:439-442 (1996).
26. Carmeliet, P., V. Ferreira, G. Breier, S. Pollefeyt, L. Kieckens, M. Gertenstein, M. Fahrig, A. Vandenhoeck, K. Harpal, C. Eberhardt, C DeClerco, J. Pawling, L. Moons, D. Collen, W. Risau, A. Nagy, Abnormal blood vessel development and lethality in embryos lacking a single VEGF allele, Nature 380:435-439 (1996).
27. Goldman, J., J.M. Rutkowski, J.D. Shields, M.C. Pasquier, Y. Cui, H.G. Schmokel, S. Willey, D.J. Hicklin, B. Pytowski, M.A. Swartz, Cooperative and redundant roles of VEGFR-2 and VEGFR-3 signaling in adult lymphangiogenesis, The FASEB Journal 21:1003-1012 (2007).
28. Tammela, T., G. Zarkada, E. Wallgard, A. Murtoma, S. Suchting, M. Wirzenius, M. Waltari, M. Hellstro, T. Schomber, R. Peltonen, C. Freitas, A. Duarte, H. Isoniemi, P. Laakkonen, G. Christofori, S. Y. Herttuala, M. Shibuya, B. Pytowski, A. Eichmann, C. Betsholtz, K. Alitalo, Blocking VEGFR-3 suppresses angiogenic sprouting and vascular network formation, Nature 454:656-663 (2008).
29. Persaud, K., J.C. Tille, M. Liu, Z. Zhu, X. Jiminez, D. Pereira, H.Q. Miao, L. Brennan, L. Witte, M.S. Pepper, B. Pytowski. Involvement of the VEGF receptor 3 in tubular morphogenesis demonstrated with a human anti-human VEGFR-3 monoclonal antibody that antagonizes receptor activation by VEGF-C, J. Cell Sci. 117:2745-2756 (2004).
30. Bauer, S.M., R.J. Bauer, Z.J. Liu, H. Chen, L. Goldstein, O.C. Velazquez, Vascular endothelial growth factor-C promotes vasculogenesis, angiogenesis, and collagen constriction in three-dimensional collagen gels, J. Vascular Surg. 41(4):699-706 (2005).
31. Shin, H.Y., VEGF-C mediates cyclic pressure-induced endothelial cell proliferation, Physiol. Genomics 11:245-251 (2002).

102
32. Montesano, R., J.D. Vassalli, A. Baird, R. Guillemin, L. Orci, Basic fibroblast growth factor induces angiogenesis in vitro, Proc. Natl. Acad. Sci. 83:7297-7301 (1986).
33. Cross, M.J. and L. Claesson-Welsh, FGF and VEGF function in angiogenesis: Signaling pathways, biological responses and therapeutic inhibition, Trends in Pharmacological Sci. 2(4):201-207 (2001).
34. Boilly, B., A.S. Vercoutter-Edouart, H. Hondermarck, V. Nurcombe, X. Le Bourhis, FGF signals for cell proliferation and migration through different pathways, Cytokine & Growth Factor Reviews 11:295-302 (2000).
35. Cao, R., J. Hong, N. Feng, Y. Zhang, X. Yang, P. Andersson, Y. Sun, K. Tritsaris, A.J. Hansen, S. Dissing, and Y. Cao, Collaborative interplay between FGF-2 and VEGF-C promotes lymphangiogenesis and metastasis, Proc. Nat’l Acad. Sci. 109(39):15894-15899 (2012).
36. Slavin, J., Fibroblast Growth Factors: At the Heart of Angiogenesis, Cell Bio. Int’l 19(5):431-444 (1995).
37. Mandriota, S.J. and M.S. Pepper, Vascular endothelial growth factor-induced in vitro angiogenesis and plasminogen activator expression are dependent on endogenous basic fibroblast growth factor, J. Cell Sci. 110:2293-2303 (1997).
38. Nagy, J.A., E. Vasile, D. Feng, C. Sundberg, L.F. Brown, M.J. Detmar, J.A. Lawitts, L. Benjamin, X. Tan, E.J. Manseau, A.M. Dvorak, H.F. Dvorak, Vascular Permeability Factor/Vascular Endothelial Growth Factor Induces Lymphangiogenesis as well as Angiogenesis, J. Exp. Med. 196(11):1497-1506 (2002).
39. Shin, H.Y., R. Bizios, M.E. Gerritsen, Cyclic Pressure Modulates Endothelial Barrier Function, Endothelium 10:179-187 (2003).
40. Shin, H.Y., E.A. Schwartz, R. Bizios, M.E. Gerritsen, Receptor-Mediated Basic Fibroblast Growth Factor Signaling Regulates Cyclic Pressure-Induced Human Endothelial Proliferation, Endothelium 11:285-291 (2004).
41. Ohashi, T., Y. Sugaya, N. Sakamoto, M. Sato, Hydrostatic pressure influences morphology and expression of VE-cadherin of vascular endothelial cells, J. Biomechanics 40:2399-2405 (2007).
42. Nakatsu, M. and C.W. Hughes, An Optimized Three-‐‑Dimensional In Vitro Model for the Analysis of Angiogenesis, Methods in Enzymology 443:65-82 (2008). The dynamic seeding protocol used herein to seed BAEC on Cytodex3TM microcarrier beads was modeled after that used in Nakatsu and Hughes (2008).
43. Maeshima, K., A. Maeshima, Y. Hayashi, S. Kishi, I. Kojima, Crucial Role of Activin A in Tubulogenesis of Endothelial Cells Induced by Vascular Endothelial Growth Factor, Endocrinology 145(8):3739-3745 (2004).
44. Lincoln II, D.W., R.G. Whitney, J.R. Smith, In Vitro Proliferation and Lifespan of Bovine Aorta Endothelial Cells: Response to Conditioned Media, J. Cell. Sci. 56:281-292 (1982).
45. Shin, H.Y., M.E. Gerritsen, R. Bizios, Regulation of Endothelial Cell Proliferation and Apoptosis by Cyclic Pressure, Annals of Biomedical Eng. 30:297-304 (2002).
46. Tille, J.C., X. Wang, K.E. Lipson, G. McMahon, N. Ferrara, Z. Zhu, D.J. Hicklin, J.P. Sleeman, U. Eriksson, K. Alitalo, M.S. Pepper, Vascular endothelial growth factor (VEGF) receptor-2 signaling mediates VEGF-CΔNΔC and VEGF-A induced angiogenesis in vitro, Exp. Cell Res. 285(2):286-298 (2003).

103
47. Kirkin, V., W. Thiele, P. Baumann, R. Mazitzscheck, K. Rohde, G. Fellbrich, H. Weich, J. Waltenberger, A. Giannis, J. Sleeman. MAZ-51, an Indolinone that Inhibits Endothelial Cell and Tumor Cell Growth In Vitro, Suppresses Tumor Growth In Vivo, Int. J. Cancer 112:986-993 (2004).
48. Boettcher, M., T. Gloe, C. de Wit. Semiautomatic Quantification of Angiogenesis, J. Surg. Res. 162(1):132-139 (2010).
49. Lamalice, L., F. Le Boeuf, J. Huot, Endothelial Cell Migration During Angiogenesis, Circ. Res. 100:782-794 (2007).
50. Joukov, V., K. Pajusola, A. Kapainen, D. Chilov, I. Lahtinen, E. Kukk, O. Saksela, N. Kalkkinen, K. Alitalo. A novel vascular endothelial growth factor, VEGF-C, is a ligand for the Flt4 (VEGFR-2) receptor tyrosine kinases, The EMBO Journal 14(2):290-298 (1996).
51. Yang., S., X. Xin, C. Zlot, G. Ingle, G. Fuh, B. Li, B. Moffat, A. B. de Vos, M. Gerritsen, Vascular Endothelial Cell Growth Factor Driven Endothelial Cell Growth Factor Receptor-2, a Kinase Insert Domain-Containing Receptor, Arterioscler. Thomb. Vasc. Biol. 21:1934-1940 (2001).
52. Ozawa, C.R., A. Banfi, N.L. Glazer, et al., Microenvironmental VEGF concentration, not total dose, determines a threshold between normal and aberrant angiogenesis, J. Clin Inv. 15:516-527 (2003).
53. Ferrara, N., Role of vascular endothelial growth factor in the regulation of angiogenesis, Kidney Int’l. 56:794-814 (1999).
54. Montesano, R., L. Orci, P. Vassalli, In Vitro Rapid Organization of Endothelial Cells into Capillary-like Networks is Promoted by Collagen Matrices, J. Cell. Bio. 97:1648-1652 (1983).
Copyright © Ryan Underwood 2013

104
Vita
RYAN MATTHEW UNDERWOOD Education
B.S. Mechanical Engineering, Miami University, Oxford, Ohio 2008 B.S. Engineering Management, Miami University, Oxford, Ohio 2008
Work Experience
Law Clerk, Office of Risk Management, University of Kentucky Aug. 2012 – Dec. 2012 Chandler Medical Center, Lexington, KY Summer Associate, Mannion & Gray, LPA, Fort Wright, KY May 2012 – Aug. 2012
Law Clerk, Office of Entrepreneurship and Economic Development, May 2011 – Aug. 2011 University of Kentucky, Lexington, KY Research Assistant, Cellular Mechanobiology Laboratory, Center forMay 2008 – Aug. 2010 Biomedical Engineering, University of Kentucky, Lexington, KY Research Assistant, Alternative Fuels Laboratory, Dept. of Mech. Sep. 2007 – Mar. 2008 and Mfg. Engineering, Miami University, Oxford, OH Research and Development Co-Op, Ethicon Endo-Surgery, May 2007 – Sep. 2007 Johnson & Johnson, Cincinnati, OH Engineering Intern, Ariel Corporation, Mount Vernon, OH May 2006 – Aug. 2006 Engineering Intern, Milgard Manufacturing, Aurora, IL May 2005 – Aug. 2005
Research Experience
Research Assistantship, Vascular Biology and Tissue Engineering, 2008-2010 Center for Biomedical Engineering, University of Kentucky, Lexington, KY Undergraduate Research Assistantship, Alternative Fuels Development and 2006-2008 Testing, Dept. of Mechanical and Manufacturing Engineering, Miami University, Oxford, OH

105
Publications H.Y. Shin, R.M. Underwood, M.W. Fannon. Fluid Pressure is a Magnitude-Dependent Modulator of Early Endothelial Tubulogenic Activity: Implications Related to a Potential Tissue Engineering Control Parameter. Tissue Engineering, Part A (2012) doi:10.1089/ten.tea.2011.0588 (in press)
Presentations
R.M. Underwood, H.Y. Shin, “Effects of Hydrostatic Pressure on Endothelial Tubulogenic Processes.” Poster Session, Experimental Biology 2010, Anaheim, CA (Apr. 2010) R.M. Underwood, H.Y. Shin, “The Effect of Sustained Hydrostatic Pressures on Endothelial Tubulogenesis.” Invited Seminar, University of Kentucky Center for Biomedical Engineering, Lexington, KY (Mar. 2010) R.M. Underwood, H.Y. Shin, “The Effect of Hydrostatic Pressure on Endothelial Angiogenesis and Lymphangiogenesis.” Poster Session, Gill Heart Institute Cardiovascular Research Conference, Lexington, KY (Oct. 2009) J.T. Van Kuren, R.M. Underwood, “An Alternative Fuels Testing Laboratory.” Invited Presentation, ASME Dayton Engineering Sciences Symposium, Dayton, OH (Oct. 2007) J.T. Van Kuren, R.M. Underwood, M. Mukai, M. Capalbo, R. Haas, J. Orbon, J. Sweeney, “Alternative Fuels Testing and Development.” Invited Presentation, AIAA Joint Propulsion Conference, Cincinnati, OH (Feb. 2007)
Teaching Experience
Undergraduate Teaching Assistant, Fluid Mechanics, Dept. of Mechanical and 2006-2007 Manufacturing Engineering, Miami University, Oxford, OH
Awards
Miami University Undergraduate Research Award, Grant-in-Aid 2007 Johnson Controls Robotics Scholarship, Recipient 2003
Professional Memberships & Affiliations
Kentucky Law Journal – Senior Editor (2012-2013), Staff Editor (2011-2012) Phi Alpha Delta Law Fraternity, International – President (Clay Chapter, 2011-2012), Member University of Kentucky Health Law Society – Board Member

106
University of Kentucky Student Health Advisory Committee (SHAC) – Member
American Bar Association (ABA) – Student Member American Intellectual Property Law Association – Student Member Biomedical Engineering Society (BMES) – Vice President (University of Kentucky, 2009-2010), Member Federation of American Societies for Experimental Biology (FASEB) – Member American Society for Mechanical Engineers (ASME) – Member American Institute of Aeronautics and Astronautics (AIAA) – Member