The Effects of For-Profit Hospitals on the Quantity and Quality of Care Provided
63
The Effects of For-Profit Hospitals on the Quantity and Quality of Care Provided Leland Brewster Advisor: Tara Watson Special Thanks To: Professors Lara Shore-Sheppard and Ken Kuttner 1
Transcript of The Effects of For-Profit Hospitals on the Quantity and Quality of Care Provided

The Effects of For-Profit Hospitals on the Quantity and Quality of Care Provided
Leland Brewster
Advisor: Tara Watson
Special Thanks To: Professors Lara Shore-Sheppard and Ken Kuttner
1

CONTENTS
Contents
1 Introduction and Background 5
1.1 The Intersection of Medicare and For-Profit Hospitals . . . . . . . . . . . . . . . 5
1.2 A Theory of Hospital Behavior . . . . . . . . . . . . . . . . . . . . . . . . . . . . 10
1.3 Distortionary Behaviors of For-Profit Hospitals . . . . . . . . . . . . . . . . . . . 15
1.3.1 The Spillover Effects of For-Profit Hospitals . . . . . . . . . . . . . . . . . 18
1.4 A Brief Review of Existing Literature . . . . . . . . . . . . . . . . . . . . . . . . 21
2 Empirical Strategy 26
3 Data 29
4 Results and Discussion 38
4.1 Drivers of For-Profit Hospital Location Decisions . . . . . . . . . . . . . . . . . . 38
4.2 The Relationship Between For-Profit Hospital Ownership and Medicare Expendi-
tures . . . . . . . . . . . . . . . . . . . . . . . . . . . . . . . . . . . . . . . . . . . 40
4.3 The Relationship Between For-Profit Hospital Ownership and Mortality Rates . 44
4.4 Concluding Thoughts . . . . . . . . . . . . . . . . . . . . . . . . . . . . . . . . . 47
5 Figures and Tables 50
References 59
2

LIST OF TABLES
List of Figures
1 Healthcare Expenditures as a Percentage of United States GDP (CBO) . . . . . 6
2 Projected Growth in Medicare Expenditures as a Percentage of United States
GDP (CBO) . . . . . . . . . . . . . . . . . . . . . . . . . . . . . . . . . . . . . . 7
3 Largest and Smallest Total Medicare Reimbursements Per Enrollee in 2007 . . . 8
4 HRR Distribution Across the United States (The Dartmouth Atlas) . . . . . . . 30
5 Hospital Ownership Trends Between 1992 and 2007 . . . . . . . . . . . . . . . . . 34
6 Histogram of Average For-Profit Bed Ownership Levels Across all 306 HRRs . . 35
7 Histogram of the Change in Average For-Profit Bed Ownership Levels Across all
306 HRRs . . . . . . . . . . . . . . . . . . . . . . . . . . . . . . . . . . . . . . . . 36
8 Histogram of the Natural Log of Average Per Enrollee Medicare Expenditures
Across all 306 HRRs . . . . . . . . . . . . . . . . . . . . . . . . . . . . . . . . . . 37
9 The Relationship Between For-Profit Hospital Ownership and Medicare Expendi-
tures, Weighted by the Medicare-Eligible Population . . . . . . . . . . . . . . . . 38
10 The Relationship Between the Change in Both For-Profit Hospital Ownership
and Medicare Expenditures Between 1992 and 2007, Weighted by the Medicare-
Eligible Population . . . . . . . . . . . . . . . . . . . . . . . . . . . . . . . . . . . 39
List of Tables
1 Hospital Ownership Transition Matrix . . . . . . . . . . . . . . . . . . . . . . . . 10
2 Summary Statistics for Key Variables . . . . . . . . . . . . . . . . . . . . . . . . 31
3 Relationship Between For-Profit Ownership and Control Variables . . . . . . . . 51
4 Relationship Between For-Profit Hospital Ownership and Medicare Expenditures 52
5 Heterogeneous Relationship Between For-Profit Hospital Ownership and Medicare
Expenditures . . . . . . . . . . . . . . . . . . . . . . . . . . . . . . . . . . . . . . 53
3

LIST OF TABLES
6 Relationship Between For-Profit Hospital Ownership and Race- and Gender-Specific
Mortality Rates . . . . . . . . . . . . . . . . . . . . . . . . . . . . . . . . . . . . . 54
7 Relationship Between For-Profit Hospital Ownership and Race- and Gender-Specific
Mortality Rates, cont. . . . . . . . . . . . . . . . . . . . . . . . . . . . . . . . . . 55
8 Relationship Between For-Profit Hospital Ownership and Race and Gender Inter-
action Mortality Rates . . . . . . . . . . . . . . . . . . . . . . . . . . . . . . . . . 56
9 Relationship Between For-Profit Hospital Ownership and Disease-Specific Mor-
tality Rates . . . . . . . . . . . . . . . . . . . . . . . . . . . . . . . . . . . . . . . 57
10 Relationship Between For-Profit Hospital Ownership and Race, Gender and Dis-
ease Interaction Mortality Rates . . . . . . . . . . . . . . . . . . . . . . . . . . . 58
4

1 INTRODUCTION AND BACKGROUND
1 Introduction and Background
1.1 The Intersection of Medicare and For-Profit Hospitals
Since its inception in 1965, the United States Medicare program has seen its costs
rise steadily every year (Figure 1). It is the nation’s largest health insurance
program, responsible for covering over 44 million citizens whose ranks will grow
substantially as the baby-boomers begin turning 65 this year. While in its early
years the program represented just 4% of the Federal budget, 40 years later Medi-
care now consumes over 15% of the budget, over $500 billion annually (Potetz
2008 & CMS). Without any reform, these costs are projected to rise dramatically
in the coming decades.
Importantly, however, these past and projected cost increases are not due
to the effects of an increased subscriber pool alone. Instead, as Figure 2 shows, the
majority of the future cost increases are due to excess cost growth independent of
the effects of an aging population. While some cost increases are to be expected as
incomes rise and technology improves, the annual national growth rate of Medicare
expenditures between 1995 and 2004 was 6.0%, substantially above the average
United States GDP growth rate of 3.25% for the same period (World Bank 2009
and State Health Facts). These numbers imply that Medicare will consume an
increasing fraction of the country’s resources and that this growth rate will be
unsustainable in the future.
There are a number of factors that drive Medicare expenses and that, more
specifically, will contribute to the “excess cost growth” in Figure 2 . Chief among
them are hospital-based health care expenditures. 2009 Medicare expenditure
5

1 INTRODUCTION AND BACKGROUND
Figure 1: Healthcare Expenditures as a Percentage of United States GDP (CBO)
data from the Centers for Medicare & Medicaid Services (CMS) show that, of
the $502bn spent on Medicare, $220bn of this cost was generated as a result of
hospital care. At approximately 44% of the total cost of Medicare, hospital care
is the single largest contributor to the program’s cost, with physician and clinical
services taking second at approximately 27% ($109bn) of Medicare expenditures.
Therefore, understanding what drives hospital expenditures is an important first
step in tackling the ballooning program costs.
While national Medicare expenditures are growing at an alarming rate, cer-
tain regional healthcare markets are evidently better able to control these rising
costs than others. As shown in Figure 3, there is substantial variation in aver-
age total per enrollee Medicare reimbursements across the 306 Hospital Referral
Regions (HRRs) of the United States. These HRRs are local hospital markets de-
fined as collections of Hospital Service Areas (HSAs)—groups of zip codes in which
residents receive a majority of their hospitalizations from hospitals contained in
those zip codes—where at least one hospital regularly performs major cardiovas-
6

1 INTRODUCTION AND BACKGROUND
Figure 2: Projected Growth in Medicare Expenditures as a Percentage of United States GDP(CBO)
cular procedures and neurosurgery (Dartmouth Atlas of Healthcare). Figure 3
shows the 10 HRRs with the lowest average per enrollee reimbursements and the
10 HRRs with the highest reimbursements, as well as the national average.
One potential cause for the variation in Medicare costs across HRRs, which
also links said variation to the excess cost growth pictured in Figure 2, is hospital
ownership and the resultant differences in product mix. Medicare reimbursements
vary only slightly for a given service, so the variation across HRRs seen in Figure
3 must be caused by differences in the types and quantities of services being
provided. These differences in product mix are observed across the three main
hospital ownership styles in the United States—for-profit ownership, not-for-profit
ownership, and government ownership—which, in turn, are further subdivided into
the more detailed categories utilized by the American Hospital Association. Not-
7

1 INTRODUCTION AND BACKGROUND
Figure 3: Largest and Smallest Total Medicare Reimbursements Per Enrollee in 2007
for-profit hospitals historically and currently dominate the sector. Between 1992
and 2007, for example, not-for-profit hospitals controlled, on average, 59.26% of all
hospital beds in the country. However, ownership of hospital beds in the United
States has been trending away from not-for-profit or government ownership and
towards increased for-profit ownership over the last fifty years. Between 1970
and 2005 approximately 7% of the roughly 5,000 not-for-profit hospitals in the
United States converted to for-profit ownership (Cutler & Horwitz, 1998). Not
only are hospitals changing ownership status, for-profit hospitals are growing in
size relative to not-for-profits. Whereas the average not-for-profit hospital used to
operate three times as many beds as the average for-profit hospital, as of 2000 this
gap has decreased to the extent that this same comparison shows not-for-profits
8

1 INTRODUCTION AND BACKGROUND
operating only 32% more beds than their for-profit competitors (David, 2003).
Indeed, the data for this paper from the American Hospital Association
show that, between 1992 and 2007, the number of government-owned and not-
for-profit hospitals has fallen while the number of for-profit hospitals has been
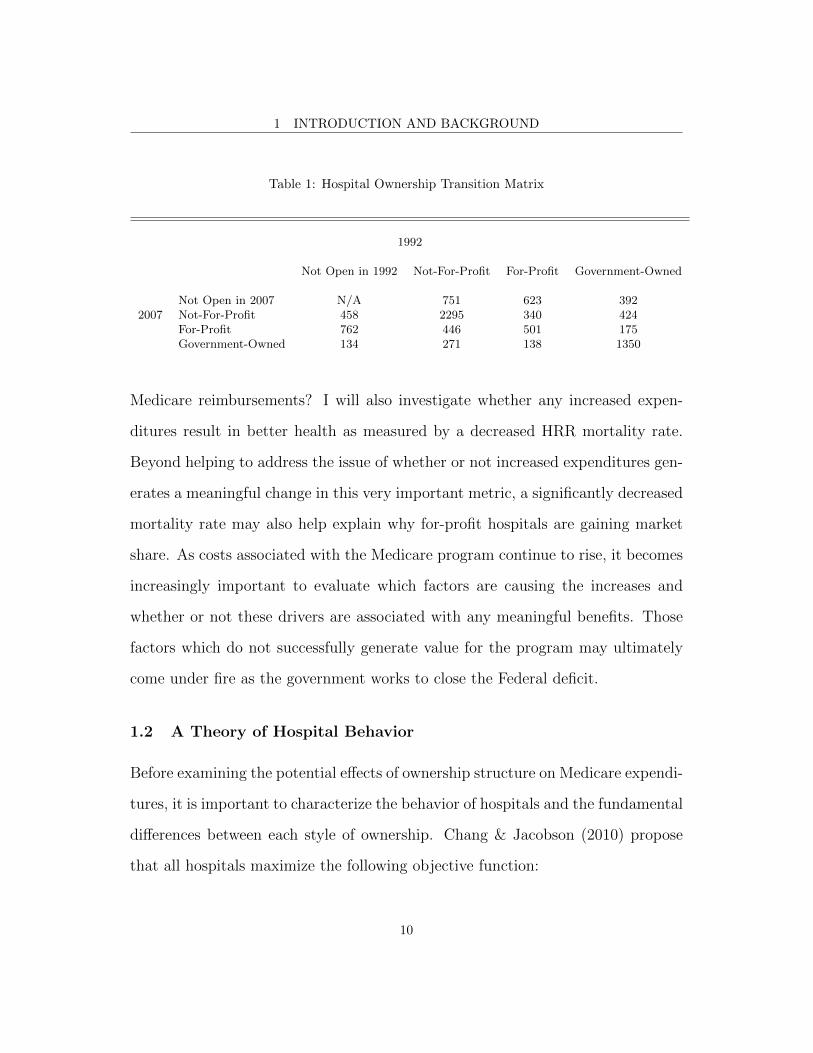
steadily rising. A transition matrix is shown below in Table 1. The data in the
table show that, between 1992 and 2007, there was a net increase in for-profit
hospitals—reflecting hospitals that either transitioned to this style of ownership
or opened as new hospitals—of 282. This net increase represents more than a
20% rise in this style of ownership when compared to 1992 levels. Over the same
period, 448 government-owned hospitals and 246 not-for-profit hospitals either
closed or changed ownership. Ignoring hospitals that either opened or closed,
and focusing only on ownership transitions between 1992 and 2007, 621 existing
hospitals changed their ownership style to become for-profit hospitals over this
time period while only 478 hospitals transitioned away from for-profit ownership—
a net transition towards for-profit ownership of 143 hospitals. Compared to the net
transition to not-for-profit ownership of just 47 hospitals and the 190 hospitals that
transitioned away from government ownership, it is clear that the vast majority
of hospital ownership transitions created for-profit institutions (AHA).
The substantial change in the ownership structure of hospitals, together
with rising Medicare reimbursements and the significance of hospital-based costs,
draw attention to the importance of investigating the potential negative effects
of profit-maximizing firms in the healthcare market. With the aid of panel data
regression analysis, I seek to answer the following question: do HRRs with higher
proportions of for-profit hospitals have significantly higher average per enrollee
9
1 INTRODUCTION AND BACKGROUND
Table 1: Hospital Ownership Transition Matrix
1992
Not Open in 1992 Not-For-Profit For-Profit Government-Owned
Not Open in 2007 N/A 751 623 3922007 Not-For-Profit 458 2295 340 424
For-Profit 762 446 501 175Government-Owned 134 271 138 1350
Medicare reimbursements? I will also investigate whether any increased expen-
ditures result in better health as measured by a decreased HRR mortality rate.
Beyond helping to address the issue of whether or not increased expenditures gen-
erates a meaningful change in this very important metric, a significantly decreased
mortality rate may also help explain why for-profit hospitals are gaining market
share. As costs associated with the Medicare program continue to rise, it becomes
increasingly important to evaluate which factors are causing the increases and
whether or not these drivers are associated with any meaningful benefits. Those
factors which do not successfully generate value for the program may ultimately
come under fire as the government works to close the Federal deficit.
1.2 A Theory of Hospital Behavior
Before examining the potential effects of ownership structure on Medicare expendi-
tures, it is important to characterize the behavior of hospitals and the fundamental
differences between each style of ownership. Chang & Jacobson (2010) propose
that all hospitals maximize the following objective function:
10

1 INTRODUCTION AND BACKGROUND
V = R + f(P, q, θ, u) (1)
where R is a given hospitals net revenue, P are non-distortionary perquisites, q
is the quantity of healthcare provided, θ is “anything that increases the cost of
production, such as non-contractable quality” or distortionary perquisites, and u
is the level of free care that the hospital provides. This function is maximized
subject to the break-even constraint:
π(q, θ) −R− P − u− F ≥ 0 (2)
π(q, θ) = pq − C(q, θ) =
q∫0
p− (c(x) + θ)dx (3)
where F is any fixed cost shock, p is price, and “c are continuous functions which
are weakly increasing and weakly convex in their arguments.” While all hospitals
maximize V subject to these constraints, for-profit, not-for-profit, and government-
owned hospitals choose different values of q, P , θ, and u. All hospitals must at
least break even.
The exact choices of each type of hospital depend largely on the behavior
model used to describe that ownership style. As expected, for-profit hospitals sim-
ply profit-maximize. However, the behavior of not-for-profit hospitals is not so well
defined. Chang & Jacobson put forth four existing theories of this behavior—that
not-for profit hospitals are “for-profits in disguise,” are prestige maximizers, are
“perquisite” maximizers, or are social welfare maximizers—and then empirically
test the set of hypotheses.
11

1 INTRODUCTION AND BACKGROUND
The “for-profits in disguise” hypothesis was first put forth by Weisbrod
(1988) and it describes how not-for-profit hospitals may, in fact, simply operate as
traditional profit-maximizing institutions despite their outward appearance as the
charitable organization implied by their ownership status. The exact reasoning
for this is unclear. One potential reason is the increasing ambiguity surrounding
the CBO’s requirements for not-for-profit hospital status (CBO 2006). Chang &
Jacobson explain that the formal requirements for not-for-profit status have be-
come less well-defined over time; thus it is easier for these hospitals to behave like
for-profit institutions while maintaining their original, protective, not-for-profit
status. They could also act as “for-profits in disguise” simply because of in-
adequate monitoring and enforcement of the CBO’s regulations. Regardless, as
Chang & Jacobson highlight, the literature that seeks to quantify this potential
behavioral difference is mixed. The implications of the “for-profits in disguise”
hypothesis suggest that not-for-profit hospitals might act as traditional profit-
maximizers such that, in response to a fixed cost shock, they would not change
their behavior. However, while there is evidence, discussed in more detail below,
that not-for-profit hospitals do in fact begin to behave like their for-profit competi-
tors under certain conditions, Chang & Jacobson conclude it is not plausible that
not-for-profit hospitals profit-maximize in the same way as traditional for-profit
hospitals.
A second model, described by Newhouse (1970), hypothesizes that not-
for-profit hospitals in fact maximize some weighted average of healthcare quality
and quantity, defined as “prestige,” such that they must at least break even. If
hospitals maximize prestige, they would balance any changes in the quantity of
12

1 INTRODUCTION AND BACKGROUND
care provided with a proportional change in its quality, or in the quantity of
altruistic care they provide. They do this with the intent of generating a maximal
amount of prestige given a set of resources. A hospital that behaved in this manner
would not simply profit-maximize, nor would it maximize purely altruistically,
instead the hospital would maximize some combination of the two. Horwitz &
Nichols (2009), whose findings and implications are discussed in greater detail
below, find evidence that not-for-profit hospitals may in fact output maximize in
this manner. In fact, this decision to provide higher quality care at the expense of
quantity, in order to maximize prestige, may be a key factor in the decision to take
on not-for-profit status, as suggested by both Newhouse (1970) and Lakdawalla &
Philipson (1998).
Similarly, not-for-profit hospitals may choose to maximize perquisites, which
appear as θ and P in Equations 1, 2, and 3. The important distinction between
these two types of perquisites is that θ represents perquisites which affect produc-
tion costs while P represents those perquisites which are non-distortionary. For
instance, a perquisite which increases the cost of production would be lavishly
decorated patient rooms since, all else held constant, a hospital with functional
but more basic rooms could provide the same care. Nice offices for doctors, how-
ever, should not directly impact the hospital’s cost of production per unit of q;
perquisites such as this are non-distortionary. Hospitals which perquisite maxi-
mize are less concerned with the precise quantity of care they provide and instead
maximize their income given a predetermined level of distortionary perquisites.
More generally, this theory, like prestige maximization, describes not-for-profit
hospital behavior as being somewhere in the middle of the spectrum between pure
13

1 INTRODUCTION AND BACKGROUND
profit maximization and pure altruism.
Finally, it is possible that not-for-profit hospitals simply maximize altruistic
behavior—the quantity of uncompensated care they provide, u. Given that like-
mindedly altruistic managers and employees have been shown to self-select into
not-for-profit institutions (Besley & Ghatak 2005), certain hospitals may exist
to provide a maximal amount of charity care. At least when compared to for-
profit hospitals, not-for-profit hospitals have been empirically shown to provide
relatively more charity care (Horwitz 2005 and Frank & Salkever 1991). However
government-owned hospitals provide the most charity care of the three ownership
styles.
Chang & Jacobson go on to empirically test these hypotheses by utilizing
the fixed cost shock generated as a result of California’s Seismic Retrofit Mandate.
They demonstrate that, as expected, for-profit hospitals do not alter their behav-
ior following a fixed cost shock. Not-for-profit hospitals, however, respond by
increasing the relative share of more profitable services, such as neonatal intensive
care days, obstetrics discharges, and MRI minutes. Of the four theories described
above, Chang & Jacobson’s results provide empirical evidence that not-for-profit
hospitals are not for-profits in disguise, nor are they purely altruistic. Instead,
not-for-profit hospitals seem to maximize their own balance of quality and quan-
tity. While they do change their behavior in response to the fixed cost shock, they
respond differently than their for-profit and government-owned competitors; it is
the fact that such a change in behavior exists which distinguishes not-for-profit
from for-profit hospitals. Chang & Jacobson find that not-for-profit hospital be-
havior is best modeled by either Newhouse’s (1970) prestige maximization theory
14

1 INTRODUCTION AND BACKGROUND
or their modification of that theory, perquisite maximization. They empirically
demonstrate that not-for-profit hospitals provide a unique combination of quantity
and quality of healthcare.
As a matter of application to this paper, I expect that the model of hospital
behavior put forth by Chang & Jacobson will result in different types and quan-
tities of care being provided by for-profit and not-for-profit hospitals. Because
for-profit hospitals consistently profit-maximize while not-for-profit hospitals are
more concerned with the quality of the care they provide, in addition to the quan-
tity, I expect that Medicare reimbursement levels will vary accordingly. I will use
the variation in these reimbursements caused by each type of hospital’s choice of
product mix to measure the effect of increased for-profit hospital ownership on
average per enrollee Medicare expenditures.
1.3 Distortionary Behaviors of For-Profit Hospitals
Given that for-profit hospitals maximize Equation 1 differently than not-for-profit
hospitals, the impacts of these decisions on hospital behavior are significant. The
profit-maximizing behavior of for-profit hospitals, which shifts incentives such that
they focus on profit above all else, can be harmful to patients and is a plausible
contributor to the variation in Medicare reimbursements seen in Figure 3. Picone,
Chou, & Sloan (2002) find that hospitals, upon conversion to for-profit ownership,
increase prices to boost profits while also increasing mortality rates—however, due
to the nature of the healthcare industry, both of these changes are hard for patients
to monitor.
One contributor to these price increases is upcoding. Carter, Newhouse, &
15

1 INTRODUCTION AND BACKGROUND
Relles (1990) find that hospitals have a strong incentive to report diagnoses in ways
that result in maximal payment from insurers or Medicare/Medicaid. For-profit
hospitals are especially susceptible to this incentive, the ultimate result of which
is increased Medicare reimbursements. Silverman & Skinner (2004) find that be-
tween 1989 and 1996 for-profit hospitals exhibited a 23 percentage point increase
in “the percentage of admissions for respiratory disease coded with the most ex-
pensive [diagnostic related group] DRG” while not-for-profit hospitals increased
this behavior by only 10 percentage points. DRGs control the amount of money
a hospital is reimbursed for a given procedure and it is to the hospitals advantage
to place patients in the most lucrative DRG as is possible. The 13 percentage
point difference in upcoding observed between ownership styles likely arises as a
result of for-profit hospitals’ ultimate goal of bottom line profit maximization. Be-
cause not-for-profits are less concerned with overall profit, as shown by Chang &
Jacobson, the incentive to upcode is not as great, though not completely removed.
Additionally, for-profit hospitals may cream skim more frequently than do
not-for-profit hospitals. Cream skimming, specifically “horizontal” cream skim-
ming, as defined by Levaggi & Montefiori (2003), is the practice by which hos-
pitals choose to provide treatment only for those ailments that are less severe
and simultaneously more lucrative. In addition to “horizontal” cream skimming,
there exists “vertical” cream skimming by which hospitals carefully choose pa-
tients within a single treatment group. These two sub-types are combined to give
what Levaggi & Montefiori define as “market cream skimming”—a more complete
definition that is most commonly used by other authors. Indeed, Berta et al.
(2010) find evidence that for-profit hospitals cream skim substantially more than
16

1 INTRODUCTION AND BACKGROUND
do not-for-profit hospitals. The finding that not-for-profit hospitals cream skim
less often is not surprising given that they perform more charity care; if their aim
is not to purely profit-maximize, they need not worry about selecting only the
most lucrative patients or treatment groups.
However, when grouped with upcoding and the methods of quantity se-
lection discussed by Chang & Jacobson, these side effects of for-profit hospital
ownership provide additional context which I can use in my analysis of their im-
pact of mortality rates. Specifically, I would expect each of these characteristics
of for-profit hospitals to have different impacts on mortality rates. Upcoding, for
example, should not have any direct impact on mortality; the patient is presum-
ably receiving the same care regardless of the hospital’s ability to charge Medicare
a higher fee for the same service. Cream skimming, however, may actually im-
pact mortality rates in a beneficial manner. By carefully selecting their patients,
hospitals should be better able to generate the desired outcomes. So, despite the
fact that cream skimming may reduce social welfare because some patients are
neglected, those patients which are actually treated may experience lower mortal-
ity rates. Finally, if hospitals set the overall quantity of care they provide, they
will, by extension, also choose their level of quality. As such, it is unclear whether
a change in quantity will have a beneficial or detrimental impact on mortality
rates. There is, however, a growing literature (Woolhandler & Himmelstein 2004,
Gawande 2009, and Teno 2010, etc.) that suggests for-profit hospitals are choos-
ing to provide additional quantities of care. The authors listed above found that,
often, this additional care is unnecessary care and, furthermore, has no clear ben-
eficial impact on mortality rates. They provide evidence that for-profit hospitals
17

1 INTRODUCTION AND BACKGROUND
use this care solely as a means by which they can increase reimbursements, and
as theory suggests, maximize profits.
1.3.1 The Spillover Effects of For-Profit Hospitals
Additionally, there is empirical evidence that the presence of for-profit hospitals
in the healthcare market alters the behavior of not-for-profit hospitals. Dug-
gan (2002) shows that when not-for-profit hospitals must compete with for-profit
providers they begin to mimic the behavior of the profit-maximizers. Due to
their ownership style, for-profit hospitals respond very aggressively to changes in
incentives such as California’s Disproportionate Share (DSH) program whose im-
plementation suddenly incentivized the treatment of additional Medicaid patients.
However, not-for-profit hospitals must also respond aggressively so as not to lose
a large share of their patients; not-for-profit hospitals may not be seeking to make
the same level of profits as private hospitals but they are still subject to the same
break-even constraint. In order to demonstrate this theoretical effect of an incen-
tive shift within the market, Duggan compares Los Angeles and San Francisco. Los
Angeles not-for-profit hospitals face heavy competition from for-profit providers,
while San Francisco not-for-profits do not. As the theory predicted, the Los An-
geles not-for-profit hospitals had to respond more dramatically to DSH than did
those in San Francisco in order to prevent the loss of patients.
Horwitz & Nichols (2009) also observe this spillover effect. They too find
that, in response to high concentrations of for-profit hospitals in a given area, not-
for-profits begin to behave more like their competitors; not-for-profit hospitals
in areas of higher for-profit market penetration offer relatively more profitable
18

1 INTRODUCTION AND BACKGROUND
care and less unprofitable care. Separately, Alexander & Lee (2006) suggest that
another means by which not-for-profit hospitals begin to mimic for-profit hospitals
is through a change in the mode of governance. They find that not-for-profit
hospitals run using a corporate governance model, similar to that of a for-profit
corporate institution, are able to achieve better operational efficiency (the ratio
of total expenses to statistical beds), a higher volume of admissions, and market
share. Indeed, as not-for-profit hospitals begin to adopt more of the characteristics
of their for-profit competitors they seem to also gain some of their efficiencies.
Cutler & Horwitz (1998) show that one of the main reasons hospitals convert
from not-for-profit to for-profit ownership is the anticipation of this increased
operational efficiency,1 in addition to the expectation of increased future profits.
Additionally, Frank et al. (2000) show that as hospital ownership trends
began shifting towards increased for-profit ownership, not-for-profit hospitals were
forced to implement revenue growth programs outside of their traditional missions.
While these hospitals used to exist almost exclusively on tax exemptions, govern-
ment subsidies, and private contributions, they are increasingly being forced to
add profit-making subsidiaries such as satellite clinics, urgent care centers, and
industrial medicine centers to boost their bottom lines. This is due, in part, to a
decrease in philanthropy which has forced not-for-profit hospitals to diversify their
revenue generation strategies (Sloan et al. 1990).2 Notably, however, these new
facilities and medical offerings, which venture outside of the historic core services
1Cutler & Horwitz (1998) explain that this increased efficiency could be the result of a number of factorsincluding: a greater ease of entry and exit into the market, superior management talent, or greater access toefficiency-producing accounting and data management software.
2This decrease in philanthropy may in fact be one of the reasons for which not-for-hospitals convert to for-profitownership, as suggested by Sloan et al. (1990).
19

1 INTRODUCTION AND BACKGROUND
of not-for-profit hospitals, potentially compromise their mission of offering afford-
able care to the medically needy. Given these results, it seems for-profit hospitals
may have both a direct impact on costs, but also a secondary impact through their
effects on not-for-profit hospitals.
One other documented effect of not-for-profit hospitals’ decision to behave
more like their for-profit counterparts is an increase in prices. Keeler et al. (1999)
find that prices increase due to competition, even in non-profit hospitals, and
even in areas with relatively less competition. This is at odds with traditional
supply and demand models but Rivers & Bae (1999) also find that greater levels
of competition do in fact raise prices. Indeed, Deneffe & Masson (2002) actually
find that not-for-profit hospitals exhibit profit-maximizing behavior. It is not
to the same extent as for-profit hospitals and it is not the only behavior they
maximize, but it is still significant in that it shows not-for-profits behave more
like for-profit hospitals than may have initially been expected.
Aside from ownership there are other potential explanations for the varia-
tion in the reimbursement rates seen in Figure 3. Given that Medicare reimburse-
ment rates differ only slightly, depending on the Geographic Adjustment Factor
(Centers for Medicaid and Medicare Services 2010), differences in per enrollee
reimbursements must stem from differences in the quantity and composition of
services provided. As discussed above, one such cause of this could be hospital
ownership, others could include the underlying health of the population or the de-
mand for care. These variables are hard to quantify but I will attempt to control
for them in order to best isolate the effect of ownership on the quantity of care
provided.
20

1 INTRODUCTION AND BACKGROUND
In addition to the supply and demand for care, a variety of cost-cutting
measures—such as salaried doctors, accountable care organizations, and efficiency
improving technology—can also help account for this variation in that they shift
incentives away from additional health care for the sake of additional health care
and instead emphasize the provision of appropriate treatment while minimizing
costs. When doctors are paid using a fee-for-service system, they are rewarded
for providing additional and perhaps unnecessary care. In addition to providing
evidence of this phenomenon, Glied & Zivin (1999) explain how alternative meth-
ods of payment such as capitation—whereby a provider is paid a fixed fee for each
patient that joins their service—which places the full cost of the patients’ care on
the provider, incentivize cost-reducing measures such as additional preventative
care. Moving away from fee-for-service and towards capitation pay or salaried
doctors, in tandem with increased doctor accountability, could help reduce the
incentive to order additional procedures strictly to increase the patient’s bill. To a
certain degree separate from hospital ownership, mechanisms such as these provide
alternative means by which Medicare expenditures may be controlled.
1.4 A Brief Review of Existing Literature
The relationship between for-profit hospital ownership and Medicare expenditures
has been examined previously. There are papers (Woolhandler 1997 and Chan
1997) that have argued a positive correlation between for-profit status and higher
overall costs but there are also those that argue the opposite: that for-profit hospi-
tals are more efficient (Manning 1997). However, of these three papers, only Chan
uses regression analysis to draw conclusions. Both Woolhandler and Manning rely
21

1 INTRODUCTION AND BACKGROUND
on observations and analysis of summary statistics to reach their findings. While
Chan uses a similar model to the one used here, a regression-based model that
does include fixed effects, his paper (like Woolhandler (1997) and Manning (1997))
is over a decade old. The large shifts in hospital ownership observed in the past
twenty years are not fully accounted for in these papers. The current paper, which
includes recent data and a high proportion of for-profit hospitals, updates Chan’s
analysis and adds an examination of mortality.
In an analysis similar to the one presented below, Silverman et al. (1999)
use data from 1989, 1992, and 1995 to empirically examine the relationship be-
tween hospital ownership and the average annual per-enrollee Medicare reimburse-
ment in hospital service areas (HSAs)—which are aggregated to form the HRRs
used in my analysis. One distinction between the Silverman et al. paper and
this paper is the way in which the regional hospital ownership is defined. While
Silverman et al. chooses to allow only three distinct possibilities, 100% for-profit,
100% non-profit, or mixed, a combination of the two, in my paper I look at pro-
portions of ownership that are unconstrained. Their paper does find significant
results; they find that those areas controlled by for-profit hospitals are likely to
have somewhere between 9.5% and 14% higher costs than regions controlled by
non-profit providers (Silverman et al. 1999). However, by looking at the propor-
tion of ownership in each region and regressing that on Medicare reimbursements,
I am able to estimate the effect of a higher proportion of for-profit ownership on
regional Medicare payments while also controlling for HRR fixed effects.
In addition to measuring the relationship between ownership status and
quantity of care provided, this paper seeks to determine whether or not for-profit
22

1 INTRODUCTION AND BACKGROUND
hospitals generate better health outcomes. It has been established that more
spending does not necessarily lead to improved patient health (Fisher et al. 2003).
In fact, Fisher et al. (2003) show that many high-expenditure regions within the
United States actually have worse outcomes than similar regions with lower Medi-
care expenditures. It is likely that we have reached the “flat of the curve” where
each additional dollar of healthcare spending generates only a marginal increase
in health outcomes. Because more spending does not ensure better outcomes, it is
important to establish what factors or incentives are driving this increase in care
provision if. As mentioned above, there is a growing literature (Woolhandler &
Himmelstein 2004, Gawande 2009, and Teno 2010, etc.) which demonstrates that
for-profit hospitals are providing more (unnecessary) care, are billing Medicare
more to do so, and are not generating demonstrable improvements in outcomes;
if this is indeed the case, they can be considered inferior to their not-for-profit
competitors.3
As discussed above, there are discrepancies in the findings of the few papers
that have examined the relationship between hospital ownership and Medicare
expenditures. There is also no consensus regarding the effect of ownership on the
quality of care provided. However, the evidence suggests that for-profit hospitals
almost certainly do not provide significantly better care, measured by short-term
mortality, than not-for-profit hospitals. Of the 31 studies Eggleston et al. (2006)
examine using meta-regressions, only one paper (Mukamel et al. 2001) finds that
for-profit hospitals have lower rates of adverse events with an effect size that is
3Given previous literature, I expect that some of the disparity between for-profit and not-for-profit Medicarereimbursements is likely the result of upcoding; however, I presume that the majority is caused by variance inthe quantity of care provided. Unfortunately, I have no means by which to separate upcoding from an increasein quantity of care provision.
23

1 INTRODUCTION AND BACKGROUND
significantly different from zero. Milcent (2005) also finds a four-point reduction
in mortality rates at fee-for-service for-profit hospitals when compared to hospitals
not operating under this reimbursement plan. However, her analysis is based on
the French hospital system, which operates differently than our system in the
United States. Other papers (Sloan et al. 1999 and Taylor et al. 1999) find
that for-profit hospitals have lower rates of adverse events but these rates are not
significantly different from zero and their papers do not examine the relationship
as explicitly as this paper does.
On the other hand, the majority of papers that examine the relationship be-
tween for-profit status and health outcomes find that for-profit hospitals generate
outcomes that are no better, or are even worse, than not-for-profit hospitals. Shen
(2002) finds that for-profit and government-owned hospitals have a 3-4% higher
rate of adverse outcomes than their not-for-profit counterparts, but her analysis
is limited by her inability to include all US hospitals and her use of data from
1985 through 1994. Similarly, Lien, Chou, & Liu (2008) find that patients who
are admitted to for-profit hospitals in Taiwan experience higher 1- or 12-month
mortality rates than those who are treated at not-for-profit institutions.
In the paper I consider a foundation for my own analysis, Sloan et al.
(2001) used Medicare claims data for patients who visited non-government owned
hospitals between 1982 and 1995 to estimate the impact of hospital ownership on
mortality. While they found slight increases in Medicare expenditures for patients
who visited for-profit hospitals, the variation was not very large. Interestingly, they
found no differences in outcomes based on the type of hospital that patients visited;
24

1 INTRODUCTION AND BACKGROUND
The paper’s use of instrumental variables4 to control for hospital preference makes
a for compelling argument, but it does not adequately control for the fact that
certain types of Medicare patients—for example richer, younger, better insured, or
healthier patients—may prefer for-profit hospitals. I avoid this issue by examining
the relationship at the HRR level instead of the patient or hospital level. Here too
I am able to use my more recent data, capturing the rise of for-profit hospitals, as
an important distinction.
My use of HRR level data also helps address a patient selection issue high-
lighted in Lien, Chou & Liu (2008): “...due to the complexity of the U.S. health
care market, it is not easy to disentangle the pure effect of hospital ownership from
other institutional settings such as segmentation of insurance status or payers and
payment types.” Instead of focusing on patient level actions by hospitals and their
outcomes, I am able to avoid issues that would arise from certain patients prefer-
ring for-profit hospitals, as discussed above. In general, my use of HRR level data
allows me to control for HRR fixed effects while minimizing the need to control
for patient-level preferences; each HRR functions as its own healthcare market by
construction. Finally, the implication that for-profit hospitals can cause not-for-
profit hospitals to behave more like profit-maximizers highlights the importance
of using HRR-level data so as to examine for-profit influence at the market level.
It also highlights the potential impact of for-profit hospitals on the healthcare
industry even in cases where market penetration is modest.
As mentioned above, this paper investigates whether regions where a higher
proportion of hospital beds are owned by for-profit organizations will have higher4“state nonprofit hospital market share in the year of admission, state government hospital market share in
the year of admission, market shares squared, and a cross product term of the two shares” (Sloan et al. (2001)).
25
2 EMPIRICAL STRATEGY
average per enrollee Medicare expenditures. Given their different incentives and
demonstrated behavior, it is reasonable to expect that such differences will man-
ifest themselves as disparities in Medicare reimbursements. Additionally, given
that I find increased Medicare reimbursements attributed to for-profit hospital
ownership, I examine whether these increased expenditures manifest themselves
as improved patient outcomes.
The paper proceeds as follows: in Section 2 I discuss my empirical strategy,
in Section 3 I describe the sources and manipulation of my data, and in Section 4
I present and discuss my results.
2 Empirical Strategy
In order to examine the relationship between for-profit hospital ownership and
Medicare expenditures, I will begin by looking at why for-profit hospitals locate
where they do. In order to do so, I run the following panel regression:
forprofitit = β0 + βjXit + σi + γt + εit (4)
Here, ‘forprofit’ measures the proportion of beds owned by for-profit hospitals in
any HRR, i and in a year, t. X is a matrix of control variables containing the
natural log of the Medicare eligible population, the proportion, ranging from 0 to
1, of residents who are white, black, Hispanic, male, native, have graduated high
school or college, and the natural log of the average household income. In order
to give importance to the largest of the HRRs, as there is a significant amount
of population size variation, this regression is run weighted by the natural log
26

2 EMPIRICAL STRATEGY
of the 65+ population of the region. Though I will eventually control for these
same HRR-level characteristics in future regressions, they still provide important
information as to what types of characteristics drive the location-choice of for-
profit hospitals.
In addition to the socioeconomic and demographic control variables listed
above, fixed effects are used in an effort to further reduce bias. γ, a set of year
fixed effects, is included in each of these panel regressions in order to account for
year-to-year variation in national reimbursement rates that could be correlated
with secular trends towards privatization. σ is a set of HRR fixed effects that, by
controlling for such unobservable time-invariant characteristics as general attitudes
towards spending or a particularly strong opinion of for-profit hospitals, help pro-
tect against potential endogeneity that would result from a correlation between
these unmeasured variables and either the dependent or independent variables.
Because HRR fixed effects control for variation across HRRs that does not change
over time, and leave just the within-HRR variation to identify the results, the
HRR fixed effects may weaken the statistical power of the analysis. Additionally,
the fixed effects make comparisons between HRRs difficult because they control
for across-HRR variation. However, I feel that the benefit of reduced exposure to
endogeneity outweighs these limitations.
Next, having examined which observable HRR characteristics drive for-
profit hospital penetration, I turn to the regression equations which are used to
answer my research questions. Here too the method of analysis is a series of panel
regressions which include the year and location fixed effects discussed above as
well as the socioeconomic and demographic control variables. To examine the
27

2 EMPIRICAL STRATEGY
ownership-expenditure relationship, the first section of analysis utilizes the follow-
ing regression equation:
ln(Medicare)it = β0 + β1forprofitit + βjXit + σi + γt + εit (5)
Here the for-profit variable has the same meaning as above, while the dependent
variable, ln(Medicare), represents HRR-level average per enrollee Medicare expen-
ditures. Both variables are defined for a given HRR, i, and any given year, t. The
matrix of socioeconomic and demographic control variables, X, the HRR fixed
effects, σ, and the year fixed effects, γ are the same as above. This regression
is also run, when indicated below, without these HRR fixed effects in order to
examine the variation across HRRs, which is removed upon their inclusion. The
equation also, when indicated below, contains the HRR’s Herfindahl-Hirschman
Index (HHI) in order to measure the level of competition within each HRR. The
HHI ranges from 0 to 1; a value closer to 1 implies that beds within that HRR are
concentrated in a smaller number of hospitals.
Finally, a similar regression equation is used to evaluate the relationship
between death rates and for-profit hospital ownership. Slight variations in the
following equation are used throughout:
deathrateit = β0 + β1forprofitit + βjXit + σi + γt + εit (6)
Here the ‘death rate’ variable is constructed as the number of deaths per 1000
people in a given HRR, i, and in a given year, t. The overall HRR death rate
is, when noted below, substituted for more gender-, race-, or cause-specific death
28
3 DATA
rates but its construction remains the same. These sub-population death rates are
used to examine the effect of increased for-profit penetration on groups of people
for whom the hospitals’ effect may be larger and potentially statistically signifi-
cant. The independent variables—for-profit ownership and the matrix of control
variables, X—are identical to those included in equations 4 and 5. Furthermore,
when noted below, equation 6 will be evaluated without the inclusion of HRR
fixed effects in order to observe the effects of across-HRR variation.
3 Data
The data for this project come from multiple sources. The data used to cal-
culate the average per enrollee Medicare expenditures in each HRR come from
the Dartmouth Atlas of Health Care. These data are part of a regional data set
based on a 100% sample of Medicare enrollees indicating annual Medicare costs.
The United States of America is broken down into 306 different Health Referral
Regions (HRRs) as defined by the Dartmouth researchers; a map of their distri-
bution is shown below in Figure 4. HRRs range in population from approximately
100,000 to nearly 10,000,000 while their Medicare-eligible population, defined as
residents between the ages of 65 and 99, ranges between 18,000 and nearly a mil-
lion. HRR-level Medicare data are collected annually and are accessible online
from 1992-2007.5 For each HRR the Dartmouth Atlas provides detailed informa-
tion about the average per-enrollee Medicare expenditures; this thesis makes use
of each HRR’s average combined Part A and Part B expenditures. For each year
5The data are available at: http://www.dartmouthatlas.org/tools/downloads.aspx
29

3 DATA
in the data expenditures are adjusted to 2010 Dollars using the Consumer Price
Index (CPI) and are incorporated into regression equations as the natural log of
their magnitude. Summary statistics for this variable and many of those discussed
below are shown in Table 2.
Figure 4: HRR Distribution Across the United States (The Dartmouth Atlas)
My second source is the American Hospital Association (AHA). I use the
AHA data—which provides detailed data at the hospital level about ownership,
beds, and location—to construct my key variable of interest: the proportion of
beds in any given HRR that are controlled by for-profit hospitals. The AHA pro-
vides detailed information on each of the over-6,000 hospitals in its database at
any given time, representing virtually all large hospitals, and the vast majority of
all hospitals in the United States. AHA hospitals fall into one of four categories:
general, special, rehabilitation and chronic disease, or psychiatric. Hospitals are
30

3 DATA
Table 2: Summary Statistics for Key Variables
VARIABLES Observations Mean Std. Dev. Minimum Maximum
For-Profit 4896 0.1312 0.1581 0 1Not-For-Profit 4896 0.5926 0.2548 0 1Government-Owned 4896 0.2761 0.2032 0 1
Death Rate 4896 50.45 4.51 33.12 63.61
HHI 4896 0.1616 0.1195 0.0129 0.8331Proportion Male 4896 0.4908 0.0083 0.4618 0.5251Proportion Female 4896 0.5092 0.0083 0.4749 0.5382Proportion 65+ 4896 0.1326 0.0299 0.0434 0.3107Proportion White 4896 0.8904 0.0983 0.2289 0.9977Proportion Black 4896 0.0715 0.0836 0 0.3549Proportion Hispanic 4896 0.0389 0.0814 0.0006 0.6705Proportion Native 4896 0.9273 0.0745 0.5479 0.9931Avg. Household Income 4896 $84496.85 $21811.86 $42486.77 $204109.30Proportion of HS Grads 4896 0.3097 0.0564 0.1543 0.4905Proportion of College Grads 4896 0.139 0.0389 0.0619 0.3069
also organized by ownership, in three separate categories: government-owned hos-
pitals, for-profit hospitals, and not-for-profit hospitals. Hospitals are matched to
HRRs based on their zip codes using a crosswalk provided by The Dartmouth At-
las.6 To account for the differences in hospital sizes, for-profit control is measured
as the fraction of beds operated by for-profit hospitals.7,8
Mortality data, used to examine the relationship between for-profit hospital
penetration and outcomes, come from the National Bureau of Economic Research
(NBER). The NBER’s Multiple Cause-of-Death Mortality Data provide detailed
6The Dartmouth Atlas provided a crosswalk from zip code to HRR match each hospital to its HRR. Missingor mismatched hospitals were largely due to the AHA inclusion of hospitals in the U.S. Virgin Islands and Guam,territories for which HRRs do not exist. Other missing values were corrected for by manually matching the zipcode to its assigned HRR.
7The total number of beds in a region was summed as were the number of beds controlled by each ownershiptype, then divided to yield a proportion of ownership for each category in each HRR.
8The HHI value is calculated by first determining the share of beds within a given HRR that each hospitalcontrols, then squaring and summing these values.
31

3 DATA
information on each death within the United States in a given year. Additionally,
because each death described in the NBER mortality data is associated with an
International Classification of Diseases (ICD) code, more detailed death counts are
measured using those deaths involving citizens 65 years of age or older who died
of one of nine diseases9—the top nine causes-of-death according to the Centers for
Disease Control (CDC 2010) whose corresponding ICD codes were valid options
in all years of the mortality data. As mentioned above, these death counts are
used in order to determine whether or not for-profit hospitals have a differential
effect on sub-populations and their corresponding death rates. In addition to
the disease-specific death counts, separate death counts were also measured for
race- and gender-specific sub-populations for the same reason.10 While hospitals
were identified at the zip code-level, the individual-level mortality data provided
geographic identifiers only at the county level. All death counts were converted to
death rates per 1000 citizens using county-level annual population data from the
U.S. Census Bureau. HRR death rates were imputed based on county-level death
rate data.11
Finally, data used to generate demographic and socioeconomic control vari-
ables come from the 1990 and 2000 United States Census as well as the 2005-2009
American Community Survey 5-Year estimates. In order to capture the socioeco-
nomic status and demographics of each HRR, several control variables are used.
9These diseases include: cancer, diabetes, heart disease, hypertension, cerebrovascular diseases, pneumoniaand influenza, chronic obstructive pulmonary disease, liver disease, or an accident.
10For regressions run using these race-specific sub-populations, HRRs are dropped in which the relevant popu-lation falls below 100 people in any year in the main dataset.
11HRRs are only defined as a collection of zip codes. Because the mortality data is only identified at thecounty level, the MABLE/Geocorr Geographic Correspondence Engine was used to match counties to zip codes.Where counties crossed zip code lines, the fraction of the county population in each zip code was used to weightthe assignment. The zip code-level mortality data was aggregated to the HRR level using the Dartmouth Atlascrosswalk.
32

3 DATA
These include: the Medicare-eligible population, race composition, average total
household income (adjusted to 2010 Dollars using the CPI), composition of edu-
cational attainment, the proportion of 65+ males, poverty status, and status as a
native citizen. All of these variables were collected from the 1990 and 2000 Census
as well as the 5-year 2005-2009 American Community Survey. These data are not
provided at the HRR level; instead it was aggregated from the zip code-level as
above. Values for the full sixteen years in the dataset are generated using linear
interpolation between the three points in time: 1990, 2000, and 2009.
Figure 5 shows the trends in annual average hospital ownership, by own-
ership type, as a percentage of total beds in a given HRR. Over all sixteen years
non-profit hospitals dominate the healthcare market with over 59.3% market share,
on average. For-profit hospitals, with a relatively meager 13.1% share of the beds
in any given region, are also less prevalent than the government-owned hospitals
which have an average market share of 27.6%. Figure 5 shows that the increase in
for-profit hospital ownership has come, largely, at the cost of government-owned
hospitals. Indeed, government hospital market share decreased by over 6% be-
tween 1992 and 2007 while both for-profit and not-for-profit market share has
risen. However, while not-for-profit-controlled hospital beds were in decline from
2002 to 2007, there were an increasing number of beds controlled by their for-profit
counterparts. In these five years alone for-profit market share increased by 1.4%
while the corresponding not-for-profit market share fell by 0.5%.
Figure 6 is a histogram of the sixteen-year average for-profit hospital bed
ownership levels in each of the 306 HRRs. Over 10% (36) of all HRRs have no beds
in for-profit hospitals in any of the sixteen years but otherwise there is a relatively
33

3 DATA
Figure 5: Hospital Ownership Trends Between 1992 and 2007
equal distribution of market penetration levels throughout the remaining HRRs.
The histogram also shows that there are some HRRs with extremely high for-profit
hospital market shares but that HRRs of this type are uncommon. Not a single
HRR has 100% of its beds controlled by for-profit hospitals for each of the sixteen
years. Also, as a matter of for-profit hospital distribution, the HRRs with these
more extreme values are spread across the country.
The change in for-profit ownership between 1992 and 2007 within each HRR
is shown below in Figure 7. The histogram is approximately normally distributed,
with the majority of HRRs experiencing little change in for-profit ownership levels
over time. Here too there are a handful of HRRs which exhibit more extreme
34

3 DATA
Figure 6: Histogram of Average For-Profit Bed Ownership Levels Across all 306 HRRs
changes but such HRRs are not isolated in any one area of the country.
Figure 8 shows the equivalent histogram generated using the natural log
of the HRR-average per enrollee Medicare expenditures. The histogram is ap-
proximately normally distributed around 8.88 ($7187), the sixteen-year average,
with only a handful of HRRs characterized by extremely high Medicare reimburse-
ments. As above, HRRs with more extreme expenditures are spread across the
country.
35

3 DATA
Figure 7: Histogram of the Change in Average For-Profit Bed Ownership Levels Across all 306HRRs
Figure 9 shows the relationship between average per enrollee Medicare ex-
penditures in a given HRR and the proportion of beds in that region that are
owned by for-profit hospitals. The size of the circles in the graph corresponds to
the Medicare-eligible population of that region. Larger circles signify more popu-
lous regions. The figure shows that most HRRs are clustered, as expected, around
the sixteen-year averages of both variables, 8.88 ($7187) for log Medicare expendi-
tures and 13.1% for ownership. The correlation between for-profit ownership and
Medicare expenditures is 0.33 and is illustrated in the figure by the linear trend
line.
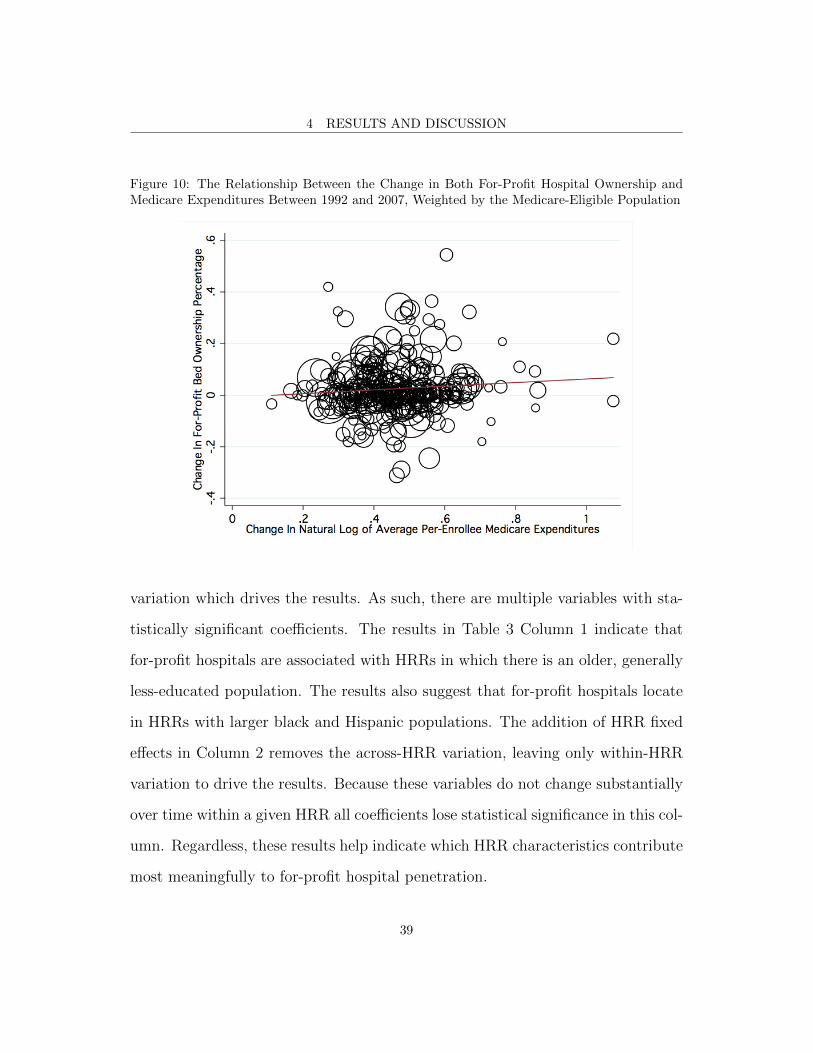
Figure 10 shows the change in average per enrollee Medicare expenditures
36

3 DATA
Figure 8: Histogram of the Natural Log of Average Per Enrollee Medicare Expenditures Acrossall 306 HRRs
and the proportion of beds owned by for-profit hospitals in each HRR between 1992
and 2007. The size of the circles in the graph corresponds to the Medicare-eligible
population of that region. Larger circles signify more populous regions. While the
average change in for-profit ownership is small, as seen in Figure 7, the average
increase in per enrollee Medicare expenditures is substantial: 0.466 ($1435). The
correlation between the change in for-profit ownership and the change in Medicare
expenditures is positive, with a value of 0.09; it is illustrated in the figure by the
linear trend line.
37

4 RESULTS AND DISCUSSION
Figure 9: The Relationship Between For-Profit Hospital Ownership and Medicare Expenditures,Weighted by the Medicare-Eligible Population
4 Results and Discussion
4.1 Drivers of For-Profit Hospital Location Decisions
Before examining the relationship between for-profit hospital ownership and per
enrollee Medicare reimbursements, I evaluate Equation 4 using the panel data
described above. The results of this first set of regressions are reported in Ta-
ble 3. The results show the relationship between each the socioeconomic and
demographic control variables and the key variable of interest, the proportion of
beds which are controlled by for-profit hospitals. Column 1 includes year fixed
effects but no HRR fixed effects; because of this, there is additional across-HRR
38
4 RESULTS AND DISCUSSION
Figure 10: The Relationship Between the Change in Both For-Profit Hospital Ownership andMedicare Expenditures Between 1992 and 2007, Weighted by the Medicare-Eligible Population
variation which drives the results. As such, there are multiple variables with sta-
tistically significant coefficients. The results in Table 3 Column 1 indicate that
for-profit hospitals are associated with HRRs in which there is an older, generally
less-educated population. The results also suggest that for-profit hospitals locate
in HRRs with larger black and Hispanic populations. The addition of HRR fixed
effects in Column 2 removes the across-HRR variation, leaving only within-HRR
variation to drive the results. Because these variables do not change substantially
over time within a given HRR all coefficients lose statistical significance in this col-
umn. Regardless, these results help indicate which HRR characteristics contribute
most meaningfully to for-profit hospital penetration.
39

4 RESULTS AND DISCUSSION
4.2 The Relationship Between For-Profit Hospital Ownership and Medi-
care Expenditures
Next I examine the effects of increased for-profit penetration on Medicare expendi-
tures. Table 4 shows the results of the main panel data regressions; all regressions
in this table are weighted by the natural log of the 65+ population in a given
HRR so as to reduce the effects of the small HRRs on the coefficients. Column 1
includes all 16 years of panel data as well as year fixed effects but does not include
any socioeconomic or demographic control variables. The coefficient on the key
variable, for-profit hospital ownership, is large and statistically significant. The
coefficient, with a magnitude of 0.339, implies that a doubling of for-profit pen-
etration would result in an associated 40.3% increase in the average per enrollee
Medicare reimbursements for that HRR.12 The 16-year national average for-profit
hospital market share is 13% and many HRRs have for-profit market shares which
are substantially higher, as seen in Figure 6. Thus, it is not unrealistic to expect
that any given HRR may experience such an increase in market share at some
point in the future.
Column 2 includes the same year fixed effects but adds socioeconomic and
demographic control variables; HRR fixed effects are still absent. Here too the co-
efficient on the key variable, for-profit hospital ownership, is large and statistically
significant. Interpreted in the same manner as above, it suggests that a dou-
bling of for-profit hospital ownership would increase average per enrollee Medicare
expenditures by 28.5%.
12This percentage increase is calculated by first adding the regression coefficient value to the natural log of16-year national average per enrollee Medicare expenditures (8.885). I then exponentiate the new value andcalculate the percentage change between the two values.
40

4 RESULTS AND DISCUSSION
The control variables in Table 4 Column 2 that are statistically significant
include: the proportion of the population that is male, the proportion of the
population that is black, the proportion of the population that is native to the
United States, the proportion of the 25+ population that has graduated from
college, and the natural log of the average household income in 2010 dollars. Nearly
all of these variables have coefficients with the predicted sign. A population that is
made up of more men than women should have lower average per-enrollee Medicare
reimbursements because, for instance, it has been established that women simply
visit the doctor more often than do men (Waldron 1976). The result observed
here is consistent with these findings. Additionally, it has been established that
populations with a higher proportion of black citizens are generally sicker (Randall
2011). This too is consistent with the positive coefficient seen in Table 4. The
literature also suggests that immigrants, on average, are healthier than native-
born citizens (Goldman, Smith & Sood 2006). This finding explains the negative
coefficient on the ‘proportion native’ variable.
Table 4 Column 2 also suggests that HRRs with more highly educated cit-
izens have lower Medicare reimbursements. The coefficient on the proportion of
the 25+ population that has a bachelor’s degree is strongly negative and highly
significant. The literature has shown that better educated individuals are gen-
erally healthier (Ross & Wu 1995) and it is plausible that they may be better
consumers (Michael 1975), more cost-sensitive even though Medicare is covering
their healthcare expenditures. In line with this hypothesis, Blustein et al. (1998)
find that patients of lower socioeconomic status experience more preventable hos-
pitalizations than do those patients of higher status. Finally, the coefficient on the
41

4 RESULTS AND DISCUSSION
average household income variable is positive and statistically significant, as an-
ticipated. Higher-income populations will likely demand more care than otherwise
similar but poorer communities but there is also some chance that the may rela-
tionship may hold in the opposite direction. Regardless, both of these variables’
coefficients switch sign and lose significance in later regressions which suggests
that their significance in Column 2 may be spurious.
Column 4 also leaves out control variables but adds HRR fixed effects.
These fixed effects eliminate across-HRR variation as a means by which to drive
results, and, as anticipated, greatly reduce the magnitude of the coefficient on the
key variable, for-profit hospital ownership. However, the regression takes its final
form in Column 5 which includes the year and HRR fixed effects as well as all main
control variables. Though now just slightly outside of statistical significance (with
a p-value of 0.081) this coefficient of 0.0681 is interpreted in the same manner as
those from Columns 1, 2, and 4 such that a 100% increase in the proportion of
for-profit hospital beds would yield a 7.05% increase in Medicare expenditures.
While this coefficient has the anticipated sign, many of the coefficients on the
control variables have unexpected signs or magnitudes, though many have fallen
out of significance. However, because these variables change very little over time
within a given HRR and because previous coefficients were based on across-HRR
variation, which is now removed due to the inclusion of HRR fixed effects, these
changes are not surprising.
Columns 3 and 6 include a measure of each HRRs Herfindahl–Hirschman
Index (HHI) as a control variable for the level of competition among hospitals.
The coefficient is not significant in either column which indicates that the effect of
42

4 RESULTS AND DISCUSSION
for-profit hospitals is not simply an addition of competition within the healthcare
market. Instead, for-profit hospitals are behaving in such a way that they generate
statistically significant increases in the average per enrollee Medicare expenditures.
Table 5 investigates whether the impact of for-profit penetration differs
across markets. Columns 1 and 2 compare the differential impact of for-profit
hospital penetration on Medicare expenditures when the HRRs large (above the
median 65+ population in 1992) or small. The results indicate that for-profit hos-
pital penetration has a larger impact on Medicare reimbursement totals in smaller
HRRs. The relationship between market size could be due to the fact that smaller
HRRs tend to have fewer hospitals and therefore have more market concentration.
However, comparing markets with high levels of market concentration in 1992
(above the median Herfindahl index) to those with low levels of market concentra-
tion, the coefficients are similar, as shown in Columns 3 and 4 of Table 5. Another
explanation for the bigger effects of for-profit penetration in small markets is that
these markets tend to have low initial levels of for-profit representation. As shown
in Columns 5 and 6 of Table 5, the apparent effect of increasing the fraction of beds
that are in for-profit hospitals is more pronounced in HRRs with few for-profits in
1992. The initial introduction of for-profit hospitals into a market may increase
competition and affect behavior of non-profit hospitals.
The results from Table 4 give evidence of the causal effect of for-profit
hospital ownership on Medicare reimbursements. Areas with a higher proportion
of for-profit hospitals have statistically significantly higher average per enrollee
Medicare reimbursements. This finding is in line, in terms of both magnitude
and direction, with that of Sloan et al. (2001) and Silverman et al. (1999), both
43

4 RESULTS AND DISCUSSION
of whom also find a similar causal relationship using much older data. Notably,
however, the results here address the lack of hospital fixed effects in Silverman’s
paper and the issues discussed earlier that arise from hospital-level analysis.
4.3 The Relationship Between For-Profit Hospital Ownership and Mor-
tality Rates
While for-profit hospitals are associated with significantly higher Medicare reim-
bursement totals for an HRR, these additional expenditures do not lead to lower
levels of mortality. Tables 6 and 7 show the results of the second main set of
panel-data regressions including all sixteen years of data. Each pair of columns
represents a new dependent variable, run with and without HRR fixed effects. The
results in this table show the relationship between any given HRR death rate and
the level of for-profit hospital ownership in that HRR. Here too all regressions are
weighted by the Medicare-eligible population in a given HRR, or the race-specific
population where appropriate, so as to reduce the undue impact of small HRRs
on the coefficients. Also, due to the small size of black and Hispanic populations
in many HRRs, analyses of these populations drop all HRRs that ever have the
relevant population drop below 100 people in any year in the main dataset.
In Tables 6 and 7, no coefficient on the for-profit variable is statistically
significant when the HRR fixed effects are included. The statistically significantly
negative coefficients on the for-profit ownership variable in columns 5, 7, 9, and
13 are the result of variations across HRRs because they are eliminated by the
inclusion of HRR fixed effects.13
13It is important to note that, given my data, I am only able to observe changes in mortality rate. Patienthealth and/or quality of life could change in ways not measured by mortality but I am not be able to measure
44

4 RESULTS AND DISCUSSION
Many of the signs and magnitudes of the coefficients on control variables
are in line with those found in Table 4. Much as HRRs with a higher proportion
of white or black residents were associated without higher Medicare expenditures,
these same HRRs are associated with higher death rates, overall and within these
specific populations. Additionally, HRRs with a higher proportion of Hispanic
residents, who are traditionally healthier, are associated with significantly lower
death rates. As for the impact of education on death rates, high school gradua-
tion does not have a statistically significant impact but college graduation has a
significantly negative impact on the overall death rate, the male death rate, and
the white death rate. This finding is in keeping with the results in Table 4; better-
educated individuals tend to be in better health and, thus, HRRs with a higher
proportion of college graduates should have lower Medicare reimbursements and
lower death rates.
It is important to note that the magnitude of the effect of for-profit hos-
pitals on expenditures (seen in Table 4 Column 5) is sufficiently large that, if the
additional expenditures were used effectively, they would generate improvements
in mortality rates large enough to observe given the standard errors in Table 6.
Cutler, McClellan & Newhouse (1998), they find that the cost of extending a
heart attack patient’s life by a year is approximately $6,000. The effect size seen
in Table 4 is just over $500 per enrollee, which, when brought to the 1,000-person
level of the death rate measures, is approximately $500,000. In order to be ob-
served in Table 6, this money must improve the mortality rate by 1.76 per 1,000
people.14 Given that the rate of heart attacks among Medicare patients is almost
these changes.141.76 is twice the standard error on the for-profit variable coefficient from Table 6 Column 2.
45

4 RESULTS AND DISCUSSION
certainly less than 7.4%,15 the cost to extend each of these patients’ lives would be
approximately $440,000. As such, if for-profit hospitals were using the increases
in Medicare expenditures that they generate to treat heart attack patients, they
should generate meaningful changes in the mortality rates. Table 6 clearly shows
that they do not use the increased expenditures to effect a statistically significant
change in mortality rates.
Table 8 shows the results of similar panel regressions, all including HRR
fixed effects, which show the effect of for-profit hospital ownership on a number
of race-gender-interacted death rates. While the full set of socioeconomic and
demographic control variables are included in these reactions, Table 8 shows only
the coefficient on the main variable. Regardless of the specific interaction, for-
profit hospital ownership never has a statistically significant effect on death rate.
Table 9 shows the results of additional panel regressions, including HRR
fixed effects that show the effect of for-profit hospital ownership on the top nine
causes-of-death according to the 2000 U.S. Census. The only disease that is sig-
nificantly affected by hospital ownership is liver disease. Even though the result is
small in magnitude, it implies that a doubling of the proportion of beds that are
owned by for-profit hospitals would generate a full standard deviation decrease in
the death rate from liver disease. However liver disease has an important behav-
ioral component and, because it is the only disease on which for-profits have a
statistically detectible impact, the result is likely spurious.
Table 10 shows the coefficient on the for-profit variable when regressed
15The incidence of heart attacks among the 85-94 population is 74 per 1,000 people; this is almost certainlylower for the Medicare population as a whole. As such, 7.4% provides an appropriate upper bound on the rate ofheart attacks within the Medicare population (American Heart Association 2010).
46

4 RESULTS AND DISCUSSION
against the gender-race-cause-of-death-specific death rate. Each regression in-
cludes the full set of control variables and HRR fixed effects. The only other
death rate (besides liver disease) on which for-profit ownership has a statistically
significant effect is cerebrovascular disease in men. The point estimate suggests
doubling for-profit ownership in an HRR would increase the death rate from cere-
brovascular disease in men by approximately one half of a standard deviation.
However, for-profit hospitals do not have any statistically significant effect on
other interacted death rates, and here too it is likely that the one significant result
is a statistical anomaly.
When analyzed as a whole, Tables 6 through 10 demonstrate that for-profit
hospitals do not have a statistically detectable impact on the overall death rate,
and there is not consistent evidence of an impact on race-, age-, or disease-specific
death rates. This finding generally agrees with the results of Eggleston et al.
(2006), whose meta-regression analysis shows that for-profit hospitals do not have
a statistically significant impact on death rates. Thus, despite the statistically
significantly higher Medicare expenditures associated with for-profit market pen-
etration, men and women 65 and older are not dying less frequently.
4.4 Concluding Thoughts
The findings discussed above provide further evidence that the United States has
reached the “flat of the curve,” discussed briefly in Section I. While increasing
healthcare expenditures when they are very low can dramatically improve out-
comes, returns to yet higher expenditures are substantially diminished—the curve
flattens. The increased Medicare expenditures shown to be the result of for-profit
47

4 RESULTS AND DISCUSSION
hospital ownership are likely generating such insignificant changes in the death
rate because the expenditures are on the “flat of the curve.” The lack of effect
on death rate may also be the result of the type of care of which for-profit hospi-
tals are providing more—specifically end-of-life care. A recent study by Teno et
al. (2010) showed that for-profit hospitals are more likely to give feeding tubes
patients with advanced dementia, even when these do not necessarily lengthen
the life of the patient; hospitals are, however, able to charge for their insertion.
Unfortunately, the literature suggests that behavior such as may be widespread
(Woolhandler & Himmelstein 2004 and Gawande 2009, etc.). Care such as this,
care that does not meaningfully impact clinical outcomes, drives up per-enrollee
Medicare expenditures and is in line with the incentives of for-profit hospitals.
The theory of hospital behavior put forth by Chang & Jacobson (2010) sug-
gests that for-profit and not-for-profit hospitals will provide different quantities of
care which would result in differences in the Medicare reimbursements generated
by these different types of hospitals. In line with this theory, the results presented
here suggest that the recent trend towards increased for-profit ownership of hospi-
tals will lead to higher Medicare expenditures at a time when the programs costs
are already ballooning out of control. It seems that for-profit hospitals are taking
advantage of the asymmetric information in the healthcare market; by upcod-
ing, cream-skimming, and providing more of the most profitable care, for-profit
hospitals are able to drive up Medicare reimbursement rates without generating
improvements in mortality rates. Healthcare for the sake of healthcare is detri-
mental to both the patient and the Medicare system. In a climate of intense
debate about health policy, these results highlight the importance of discussing
48

4 RESULTS AND DISCUSSION
the ownership structure of America’s hospitals. Not all hospitals are created equal.
49

5 FIGURES AND TABLES
5 Figures and Tables
50

5 FIGURES AND TABLES
Table 3: Relationship Between For-Profit Ownership and Control Variables
DEPENDENT VARIABLE: For-Profit Hospital Penetration
VARIABLES Year F.E. Year F.E.No HRR F.E. HRR F.E.
HHI -0.0946 -0.290***(0.104) (0.0703)
Ln(Pop 65+) 0.00322 0.00751(0.0141) (0.0383)
Prop. Male 3.399* 0.929(1.475) (1.737)
Prop. 65+ 1.649** -0.418(0.592) (0.971)
Prop. 65+ White 0.226ˆ 0.600(0.126) (0.371)
Prop. 65+ Black 0.613*** 0.382(0.168) (0.472)
Prop. 65+ Hisp. 0.723*** 0.609(0.168) (0.416)
Prop. Native 0.256 0.107(0.220) (0.323)
Prop. 25+ HS -0.993*** 0.0466(0.212) (0.354)
Prop. 25+ College -0.859* -0.315(0.424) (0.661)
Ln(Avg. Income) -0.00909 -0.00252(0.0738) (0.0804)
Constant -1.776 -0.856(1.297) (1.341)
Observations 4,896 4,896R-squared 0.255 0.917
Robust standard errors in parentheses.*** p<0.001, ** p<0.01, * p<0.05 p̂<0.1Notes: Each observation is an HRR-year.
51

5 FIGURES AND TABLES
Tab
le4:
Rel
atio
nsh
ipB
etw
een
For-
Pro
fit
Hosp
ital
Ow
ner
ship
an
dM
edic
are
Exp
end
itu
res
DE
PE
ND
EN
TV
AR
IAB
LE
:A
ver
age
Per
Enro
llee
Med
icare
Exp
endit
ure
s
VA
RIA
BL
ES
No
HR
RF
.E.
No
HR
RF
.E.
No
HR
RF
.E.
HR
RF
.E.
HR
RF
.E.
HR
RF
.E.
No
Contr
ols
Contr
ols
Contr
ols
+H
HI
No
Contr
ols
Contr
ols
Contr
ols
+H
HI
For-
Pro
fit
0.3
39***
0.2
51***
0.2
48***
0.0
825*
0.0
681ˆ
0.0
724
(0.0
604)
(0.0
474)
(0.0
458)
(0.0
405)
(0.0
389)
(0.0
393)
HH
I-0
.103ˆ
0.0
524
(0.0
619)
(0.0
640)
Ln(P
op
65+
)0.0
151ˆ
0.0
0332
0.1
19**
0.1
19**
(0.0
0829)
(0.0
114)
(0.0
380)
(0.0
379)
Pro
p.
Male
-4.4
65***
-4.5
54***
0.0
356
0.0
202
(1.0
51)
(1.0
37)
(1.7
91)
(1.7
80)
Pro
p.
65+
-0.5
20*
-0.4
60ˆ
-1.4
65*
-1.4
98*
(0.2
44)
(0.2
37)
(0.7
13)
(0.7
08)
Pro
p.
65+
Whit
e0.1
70
0.1
81ˆ
1.2
49**
1.2
36**
(0.1
14)
(0.1
08)
(0.3
79)
(0.3
81)
Pro
p.
65+
Bla
ck0.5
17***
0.5
21***
0.8
80
0.8
59
(0.1
50)
(0.1
46)
(0.5
35)
(0.5
33)
Pro
p.
65+
His
p.
0.1
76
0.1
79
0.4
24
0.4
23
(0.1
74)
(0.1
75)
(0.4
64)
(0.4
65)
Pro
p.
Nati
ve
-0.9
67***
-0.9
73***
0.7
30ˆ
0.7
33
(0.1
97)
(0.1
97)
(0.4
18)
(0.4
17)
Pro
p.
25+
HS
0.1
72
0.1
46
-0.2
44
-0.2
46
(0.2
10)
(0.2
07)
(0.4
48)
(0.4
49)
Pro
p.
25+
Colleg
e-1
.416***
-1.5
09***
1.2
38
1.2
69
(0.3
37)
(0.3
40)
(0.7
86)
(0.7
85)
Ln(A
vg.
Inco
me)
0.3
44***
0.3
71***
-0.2
17
-0.2
19
(0.0
675)
(0.0
697)
(0.1
56)
(0.1
56)
Const
ant
8.5
62***
7.6
83***
7.5
81***
8.6
40***
7.7
52***
7.7
90***
(0.0
131)
(1.0
52)
(1.0
50)
(0.0
111)
(2.0
29)
(2.0
21)
Obse
rvati
ons
4,8
96
4,8
96
4,8
96
4,8
96
4,8
96
4,8
96
R-s
quare
d0.4
27
0.6
99
0.7
00
0.9
23
0.9
26
0.9
26
Robust
standard
erro
rsin
pare
nth
eses
.***
p<
0.0
01,
**
p<
0.0
1,
*p<
0.0
5p̂<
0.1
Note
s:E
ach
obse
rvati
on
isan
HR
R-y
ear.
‘For-
pro
fit’
refe
rsto
the
num
ber
of
bed
sw
ithin
an
HR
Rco
ntr
olled
by
for-
pro
fit
hosp
itals
.
52

5 FIGURES AND TABLEST
able
5:H
eter
ogen
eou
sR
elat
ion
ship
Bet
wee
nF
or-
Pro
fit
Hosp
ital
Ow
ner
ship
an
dM
edic
are
Exp
end
itu
res
DE
PE
ND
EN
TV
AR
IAB
LE
:A
ver
age
Per
Enro
llee
Med
icare
Exp
endit
ure
s
VA
RIA
BL
ES
Big
HR
RSm
all
HR
RH
igh
HH
IL
owH
HI
Low
Init
ial
Hig
hIn
itia
lN
FP
NF
P
For-
Pro
fit
0.0
0652
0.1
16ˆ
0.0
564
0.0
722
0.1
10*
-0.0
314
(0.0
519)
(0.0
591)
(0.0
455)
(0.0
646)
(0.0
533)
(0.0
516)
Ln(P
op
65+
)0.1
51**
0.0
823
0.0
936ˆ
0.1
45*
0.1
88**
0.0
840
(0.0
558)
(0.0
538)
(0.0
495)
(0.0
625)
(0.0
605)
(0.0
478)
Pro
p.
Male
3.1
66
-2.1
09
-0.9
17
1.4
82
-0.9
22
0.0
707
(2.8
62)
(2.2
50)
(2.0
42)
(3.4
34)
(2.3
07)
(2.4
40)
Pro
p.
65+
-0.8
48
-2.5
23*
-0.8
15
-2.4
95ˆ
-2.4
77*
-1.0
41
(0.7
74)
(1.1
26)
(0.8
64)
(1.2
91)
(1.0
60)
(1.0
98)
Pro
p.
65+
Whit
e0.7
49ˆ
2.6
33**
1.7
33ˆ
0.9
07*
0.7
65
1.3
66*
(0.4
26)
(0.9
89)
(0.8
90)
(0.4
34)
(0.4
69)
(0.6
70)
Pro
p.
65+
Bla
ck1.0
35
2.2
06ˆ
0.8
77
1.1
46
0.6
83
0.2
91
(0.7
58)
(1.1
29)
(1.0
75)
(0.7
89)
(0.7
53)
(0.8
47)
Pro
p.
65+
His
p.
-0.0
786
1.5
12ˆ
1.1
33
-0.0
629
0.4
02
0.3
33
(0.3
90)
(0.8
64)
(0.9
21)
(0.3
78)
(0.5
44)
(0.7
27)
Pro
p.
Nati
ve
0.4
22
1.5
05ˆ
1.2
70ˆ
0.4
91
0.9
15ˆ
0.2
69
(0.5
38)
(0.8
72)
(0.7
24)
(0.5
59)
(0.5
52)
(0.6
72)
Pro
p.
25+
HS
-0.8
72
0.1
35
0.4
75
-1.1
22ˆ
0.4
46
-0.9
10
(0.8
20)
(0.5
35)
(0.6
02)
(0.6
75)
(0.6
97)
(0.5
46)
Pro
p.
25+
Colleg
e0.7
88
1.9
74ˆ
2.2
99*
0.4
22
0.5
87
1.6
13
(1.2
75)
(1.0
86)
(1.0
77)
(1.1
92)
(1.1
00)
(1.0
20)
Ln(A
vg.
Inco
me)
-0.2
56
-0.3
26ˆ
-0.4
88*
-0.1
43
-0.0
185
-0.5
52**
(0.2
99)
(0.1
85)
(0.1
87)
(0.1
83)
(0.1
38)
(0.1
67)
Const
ant
7.1
60ˆ
8.3
20***
10.1
1***
6.8
91**
5.4
00**
12.3
5***
(3.6
81)
(2.4
68)
(2.4
73)
(2.3
60)
(2.0
10)
(2.2
10)
Obse
rvati
ons
2,4
48
2,4
48
2,4
48
2,4
48
2,4
16
2,4
80
R-s
quare
d0.9
46
0.9
03
0.9
07
0.9
43
0.9
23
0.9
33
Robust
standard
erro
rsin
pare
nth
eses
.***
p<
0.0
01,
**
p<
0.0
1,
*p<
0.0
5p̂<
0.1
Note
s:E
ach
obse
rvati
on
isan
HR
R-y
ear.
‘For-
pro
fit’
refe
rsto
the
num
ber
of
bed
sw
ithin
an
HR
Rco
ntr
olled
by
for-
pro
fit
hosp
itals
.
53
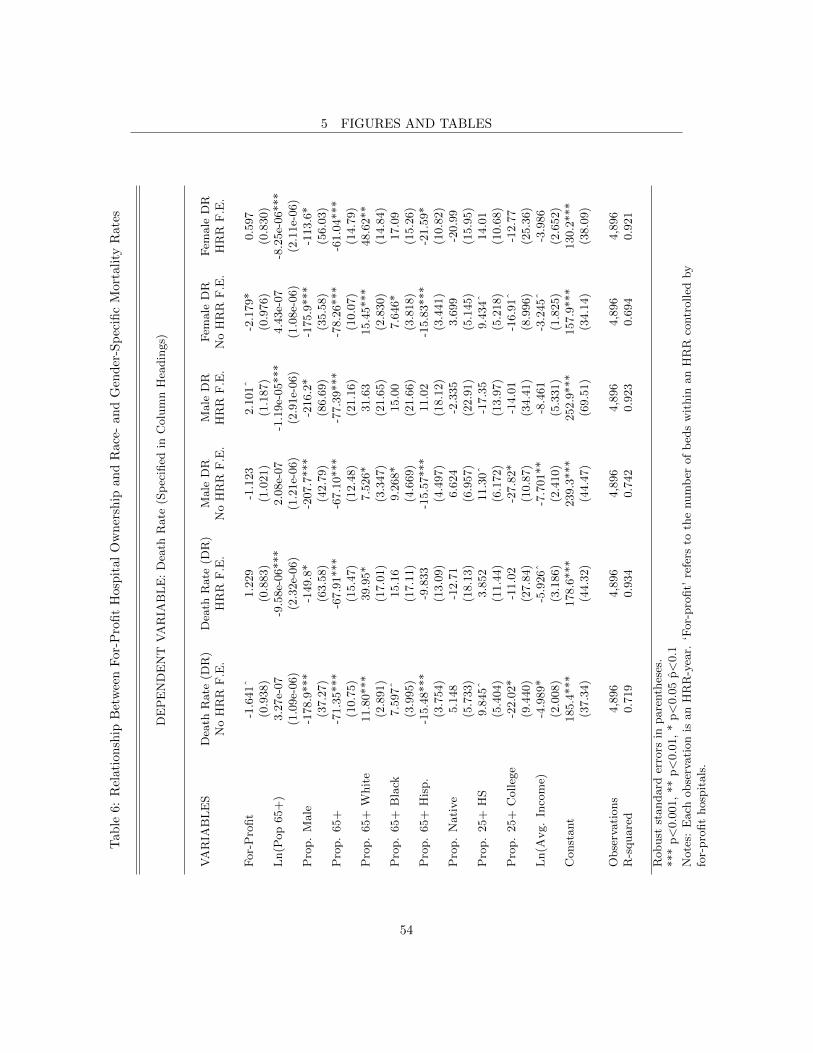
5 FIGURES AND TABLEST
able
6:R
elat
ion
ship
Bet
wee
nF
or-P
rofi
tH
osp
ital
Ow
ner
ship
an
dR
ace
-an
dG
end
er-S
pec
ific
Mort
ali
tyR
ate
s
DE
PE
ND
EN
TV
AR
IAB
LE
:D
eath
Rate
(Sp
ecifi
edin
Colu
mn
Hea
din
gs)
VA
RIA
BL
ES
Dea
thR
ate
(DR
)D
eath
Rate
(DR
)M
ale
DR
Male
DR
Fem
ale
DR
Fem
ale
DR
No
HR
RF
.E.
HR
RF
.E.
No
HR
RF
.E.
HR
RF
.E.
No
HR
RF
.E.
HR
RF
.E.
For-
Pro
fit
-1.6
41ˆ
1.2
29
-1.1
23
2.1
01ˆ
-2.1
79*
0.5
97
(0.9
38)
(0.8
83)
(1.0
21)
(1.1
87)
(0.9
76)
(0.8
30)
Ln(P
op
65+
)3.2
7e-
07
-9.5
8e-
06***
2.0
8e-
07
-1.1
9e-
05***
4.4
3e-
07
-8.2
5e-
06***
(1.0
9e-
06)
(2.3
2e-
06)
(1.2
1e-
06)
(2.9
1e-
06)
(1.0
8e-
06)
(2.1
1e-
06)
Pro
p.
Male
-178.9
***
-149.8
*-2
07.7
***
-216.2
*-1
75.9
***
-113.6
*(3
7.2
7)
(63.5
8)
(42.7
9)
(86.6
9)
(35.5
8)
(56.0
3)
Pro
p.
65+
-71.3
5***
-67.9
1***
-67.1
0***
-77.3
9***
-78.2
6***
-61.0
4***
(10.7
5)
(15.4
7)
(12.4
8)
(21.1
6)
(10.0
7)
(14.7
9)
Pro
p.
65+
Whit
e11.8
0***
39.9
5*
7.5
26*
31.6
315.4
5***
48.6
2**
(2.8
91)
(17.0
1)
(3.3
47)
(21.6
5)
(2.8
30)
(14.8
4)
Pro
p.
65+
Bla
ck7.5
97ˆ
15.1
69.2
68*
15.0
07.6
46*
17.0
9(3
.995)
(17.1
1)
(4.6
69)
(21.6
6)
(3.8
18)
(15.2
6)
Pro
p.
65+
His
p.
-15.4
8***
-9.8
33
-15.5
7***
11.0
2-1
5.8
3***
-21.5
9*
(3.7
54)
(13.0
9)
(4.4
97)
(18.1
2)
(3.4
41)
(10.8
2)
Pro
p.
Nati
ve
5.1
48
-12.7
16.6
24
-2.3
35
3.6
99
-20.9
9(5
.733)
(18.1
3)
(6.9
57)
(22.9
1)
(5.1
45)
(15.9
5)
Pro
p.
25+
HS
9.8
45ˆ
3.8
52
11.3
0ˆ
-17.3
59.4
34ˆ
14.0
1(5
.404)
(11.4
4)
(6.1
72)
(13.9
7)
(5.2
18)
(10.6
8)
Pro
p.
25+
Colleg
e-2
2.0
2*
-11.0
2-2
7.8
2*
-14.0
1-1
6.9
1ˆ
-12.7
7(9
.440)
(27.8
4)
(10.8
7)
(34.4
1)
(8.9
96)
(25.3
6)
Ln(A
vg.
Inco
me)
-4.9
89*
-5.9
26ˆ
-7.7
01**
-8.4
61
-3.2
45ˆ
-3.9
86
(2.0
08)
(3.1
86)
(2.4
10)
(5.3
31)
(1.8
25)
(2.6
52)
Const
ant
185.4
***
178.6
***
239.3
***
252.9
***
157.9
***
130.2
***
(37.3
4)
(44.3
2)
(44.4
7)
(69.5
1)
(34.1
4)
(38.0
9)
Obse
rvati
ons
4,8
96
4,8
96
4,8
96
4,8
96
4,8
96
4,8
96
R-s
quare
d0.7
19
0.9
34
0.7
42
0.9
23
0.6
94
0.9
21
Robust
standard
erro
rsin
pare
nth
eses
.***
p<
0.0
01,
**
p<
0.0
1,
*p<
0.0
5p̂<
0.1
Note
s:E
ach
obse
rvati
on
isan
HR
R-y
ear.
‘For-
pro
fit’
refe
rsto
the
num
ber
of
bed
sw
ithin
an
HR
Rco
ntr
olled
by
for-
pro
fit
hosp
itals
.
54

5 FIGURES AND TABLES
Tab
le7:
Rel
atio
nsh
ipB
etw
een
For
-Pro
fit
Hosp
ital
Ow
ner
ship
an
dR
ace
-an
dG
end
er-S
pec
ific
Mort
ali
tyR
ate
s,co
nt.
DE
PE
ND
EN
TV
AR
IAB
LE
:D
eath
Rate
(Sp
ecifi
edin
Colu
mn
Hea
din
gs)
Whit
eD
RW
hit
eD
RN
oth
ispanic
DR
Noth
ispanic
DR
Bla
ckD
RB
lack
DR
His
panic
DR
His
panic
DR
No
HR
RF
.E.
HR
RF
.E.
No
HR
RF
.E.
HR
RF
.E.
No
HR
RF
.E.
HR
RF
.E.
No
HR
RF
.E.
HR
RF
.E.
-2.7
56**
1.3
67
-1.9
25ˆ
5.3
29
1.3
60
6.3
80
-7.0
73**
-0.5
63
(0.9
82)
(0.9
65)
(1.0
63)
(4.2
89)
(2.6
97)
(4.8
70)
(2.2
99)
(2.3
30)
8.0
4e-
07
-1.0
3e-
05***
3.0
9e-
07
-1.0
7e-
05***
5.5
9e-
07
-9.2
3e-
06
1.4
3e-
06
-1.2
2e-
05
(1.2
5e-
06)
(2.4
7e-
06)
(1.3
3e-
06)
(2.5
4e-
06)
(3.1
9e-
06)
(5.9
7e-
06)
(1.5
1e-
06)
(7.9
9e-
06)
-229.7
***
-162.6
**
-141.9
**
44.2
7-8
0.5
9-3
50.3
ˆ128.8
*-4
39.4
***
(37.8
4)
(60.8
3)
(47.5
8)
(99.7
6)
(70.6
6)
(180.7
)(6
2.9
5)
(119.4
)-8
1.9
4***
-81.8
2***
-67.3
6***
-135.5
**
-96.8
8***
-189.1
ˆ-1
0.9
2-1
88.9
***
(10.3
1)
(15.8
2)
(12.1
0)
(44.5
2)
(23.4
6)
(108.5
)(1
6.7
9)
(41.3
5)
-8.6
49
11.3
614.6
8***
-54.2
2-7
.368
-12.3
5-1
5.9
0***
-8.1
39
(8.1
85)
(17.5
3)
(3.1
02)
(47.1
4)
(14.9
0)
(27.6
8)
(4.3
72)
(13.9
4)
-19.5
9*
-12.5
313.7
5**
-51.9
7-4
2.6
5**
-14.5
4-2
6.2
0**
32.2
2(7
.940)
(18.7
3)
(4.8
41)
(49.4
3)
(15.3
3)
(31.5
5)
(8.2
63)
(32.8
4)
-13.0
0**
-7.7
92
-6.3
15
-70.1
0ˆ
-17.5
3ˆ
-10.2
922.8
3***
-27.1
9(3
.944)
(14.8
7)
(5.1
08)
(40.0
9)
(9.4
68)
(22.5
3)
(4.8
47)
(16.3
7)
-0.6
07
-9.5
11
2.6
15
17.5
721.8
0ˆ
-23.2
812.5
5ˆ
-23.6
5(5
.601)
(16.1
1)
(8.2
20)
(15.3
0)
(11.2
4)
(29.1
2)
(6.8
01)
(15.4
6)
5.6
18
5.9
66
11.4
9ˆ
43.8
517.6
220.3
532.9
2**
104.2
**
(6.2
17)
(11.2
2)
(6.6
83)
(35.5
6)
(20.5
0)
(57.8
7)
(12.6
3)
(36.9
1)
-34.9
0***
-23.3
2-3
1.6
1**
-97.8
8ˆ
-5.5
29
-85.0
141.7
4**
65.9
6(9
.990)
(28.0
7)
(11.5
8)
(50.4
2)
(27.8
2)
(60.6
7)
(14.5
5)
(38.5
1)
-4.3
14*
-7.6
11*
-2.1
45
-5.8
70
-15.5
0***
10.9
4-1
3.5
3***
-21.8
1(1
.948)
(3.5
43)
(2.9
18)
(3.6
47)
(4.2
54)
(9.6
44)
(3.8
09)
(11.8
3)
233.1
***
229.8
***
134.0
*148.0
**
269.8
***
174.2
111.7
ˆ489.7
***
(38.0
6)
(47.0
5)
(55.0
1)
(55.6
9)
(58.3
1)
(108.2
)(5
9.9
5)
(134.4
)
4,8
96
4,8
96
4,8
96
4,8
96
4,2
72
4,2
72
4,2
08
4,2
08
0.5
72
0.9
09
0.4
23
0.6
84
0.2
18
0.4
18
0.2
79
0.5
04
55

5 FIGURES AND TABLES
Tab
le8:
Rel
atio
nsh
ipB
etw
een
For
-Pro
fit
Hosp
ital
Ow
ner
ship
an
dR
ace
an
dG
end
erIn
tera
ctio
nM
ort
ali
tyR
ate
s
DE
PE
ND
EN
TV
AR
IAB
LE
:D
eath
Rate
(Sp
ecifi
edin
Colu
mn
Hea
din
gs)
VA
RIA
BL
ES
Whit
eW
hit
eN
oth
ispanic
Noth
ispanic
Bla
ckB
lack
His
panic
His
panic
Male
DR
Fem
ale
DR
Male
DR
Fem
ale
DR
Male
DR
Fem
ale
DR
Male
DR
Fem
ale
DR
HR
RF
.E.
HR
RF
.E.
HR
RF
.E.
HR
RF
.E.
HR
RF
.E.
HR
RF
.E.
HR
RF
.E.
HR
RF
.E.
For-
Pro
fit
1.6
01
0.3
05
6.2
19
4.0
31
0.6
19
0.7
87ˆ
-0.2
78
0.5
67
(1.0
96)
(0.7
94)
(4.8
51)
(3.8
56)
(0.7
83)
(0.4
38)
(0.6
13)
(0.4
15)
Const
ant
161.4
***
70.5
1ˆ
185.3
*88.8
9ˆ
33.3
24.8
36
56.9
8***
-24.3
7(4
6.9
1)
(36.8
1)
(72.9
2)
(51.1
7)
(32.9
9)
(22.1
9)
(16.9
1)
(17.2
6)
Obse
rvati
ons
4,8
96
4,8
96
4,8
96
4,8
96
4,2
72
4,2
72
4,2
08
4,2
08
R-s
quare
d0.9
54
0.9
57
0.8
18
0.8
17
0.9
89
0.9
91
0.9
96
0.9
97
Robust
standard
erro
rsin
pare
nth
eses
.***
p<
0.0
01,
**
p<
0.0
1,
*p<
0.0
5p̂<
0.1
All
regre
ssio
ns
incl
ude
standard
contr
ol
vari
able
s,as
ab
ove.
Each
obse
rvati
on
isan
HR
R-y
ear.
‘For-
pro
fit’
refe
rsto
the
num
ber
of
bed
sw
ithin
an
HR
Rco
ntr
olled
by
for-
pro
fit
hosp
itals
.
56

5 FIGURES AND TABLES
Tab
le9:
Rel
atio
nsh
ipB
etw
een
For
-Pro
fit
Hosp
ital
Ow
ner
ship
an
dD
isea
se-S
pec
ific
Mort
ali
tyR
ate
s
DE
PE
ND
EN
TV
AR
IAB
LE
:D
eath
Rate
(Sp
ecifi
edin
Colu
mn
Hea
din
gs)
VA
RIA
BL
ES
Can
cer
Dia
bet
esH
eart
Hyp
erte
nsi
on
Cer
ebro
vasc
ula
rP
neu
mon
iaC
OP
DL
iver
Acc
iden
tD
isea
seD
isea
seIn
flu
enza
Dis
ease
For-
Pro
fit
0.1
88
-0.0
213
0.6
33
-0.0
448
0.2
59
-0.0
478
0.2
11
-0.2
38*
-0.0
443
(0.2
17)
(0.1
16)
(0.4
71)
(0.0
443)
(0.2
00)
(0.1
65)
(0.1
39)
(0.1
18)
(0.0
822)
Ln
(Pop
65+
)-9
.79e-
07*
-5.6
6e-
07*
-4.8
6e-
06***
-8.0
6e-
08
-8.7
6e-
07*
-4.7
9e-
07
-5.4
8e-
07*
1.7
0e-
08
-8.1
0e-
08
(4.9
0e-
07)
(2.7
1e-
07)
(1.0
1e-
06)
(1.3
5e-
07)
(4.3
8e-
07)
(3.7
4e-
07)
(2.1
3e-
07)
(1.8
7e-
07)
(1.9
3e-
07)
Pro
p.
Male
-10.8
5-5
.002
-113.1
**
-1.2
78
-11.2
52.2
70
5.8
01
-7.5
02ˆ
1.8
70
(14.1
2)
(5.9
13)
(38.7
5)
(2.5
32)
(9.5
71)
(9.4
44)
(6.1
89)
(4.2
26)
(3.4
27)
Pro
p.
65+
-11.8
2***
-9.0
37***
-12.8
0-1
.543ˆ
-0.6
66
0.9
53
-8.5
19***
-3.1
07
-0.8
23
(3.4
55)
(1.5
98)
(9.1
41)
(0.7
99)
(3.7
97)
(3.0
64)
(2.3
78)
(2.2
77)
(1.3
51)
Pro
p.
65+
Wh
ite
1.8
02
-3.7
81**
11.1
2-1
.683***
0.1
78
3.7
80
1.4
53
-1.3
70ˆ
2.1
65**
(3.1
21)
(1.2
45)
(7.2
36)
(0.3
71)
(1.9
79)
(2.3
65)
(1.2
57)
(0.8
27)
(0.6
73)
Pro
p.
65+
Bla
ck-9
.963**
-8.4
16***
4.8
72
-2.6
22***
8.2
86**
7.4
17**
-4.1
07*
-6.3
42***
0.6
37
(3.5
15)
(1.7
43)
(8.5
11)
(0.6
08)
(2.9
09)
(2.4
24)
(1.6
76)
(1.2
98)
(1.1
35)
Pro
p.
65+
His
p.
-5.9
15*
-0.4
67
9.0
06ˆ
-0.3
79
1.5
02
3.6
86ˆ
-5.4
08***
5.9
78***
0.1
56
(2.3
55)
(1.0
85)
(4.6
67)
(0.4
45)
(2.2
07)
(2.0
70)
(1.5
36)
(0.7
60)
(0.6
30)
Pro
p.
Nati
ve
5.8
10
3.7
48**
-21.3
1*
1.1
09*
0.7
03
-2.1
41
3.2
67**
-0.6
18
-0.4
17
(3.6
76)
(1.3
17)
(8.4
96)
(0.4
50)
(2.0
15)
(2.0
66)
(1.0
92)
(0.9
80)
(0.7
17)
Pro
p.
25+
HS
-2.8
85
0.0
915
-1.2
48
-0.4
51
5.5
72*
7.0
27***
3.4
64**
-3.8
15***
-3.0
02***
(2.6
27)
(1.3
09)
(5.6
24)
(0.5
22)
(2.4
04)
(2.0
60)
(1.3
36)
(1.0
01)
(0.7
75)
Pro
p.
25+
Colleg
e-1
.906
-5.2
88**
-15.9
9-3
.258***
9.0
03*
9.6
82*
-4.7
45ˆ
-4.3
45**
-1.9
41
(6.1
12)
(2.0
23)
(12.2
5)
(0.9
43)
(3.5
57)
(4.4
82)
(2.8
08)
(1.6
07)
(1.4
29)
Ln
(Avg.
Inco
me)
-1.2
80*
0.1
78
0.3
07
0.0
00236
-0.3
00
-0.5
99
-0.9
41
0.1
61
0.2
64
(0.6
06)
(0.2
76)
(2.1
80)
(0.1
14)
(0.6
46)
(0.3
99)
(0.5
80)
(0.3
08)
(0.2
53)
Con
stant
27.9
9**
4.4
32
86.5
7**
2.3
13
8.4
49
2.2
74
7.0
28
7.5
44ˆ
-2.9
13
(9.1
30)
(3.6
00)
(27.0
1)
(1.6
80)
(8.5
30)
(5.9
86)
(7.1
51)
(3.9
42)
(3.0
89)
Ob
serv
ati
on
s4,8
96
4,8
96
4,8
96
4,8
96
4,8
96
4,8
96
4,8
96
4,8
96
4,8
96
R-s
qu
are
d0.8
69
0.8
14
0.9
50
0.7
69
0.8
93
0.8
53
0.8
84
0.7
56
0.7
91
Rob
ust
stan
dard
erro
rsin
pare
nth
eses
.***
p<
0.0
01,
**
p<
0.0
1,
*p<
0.0
5p̂<
0.1
Each
ob
serv
ati
on
isan
HR
R-y
ear.
‘For-
pro
fit’
refe
rsto
the
nu
mb
erof
bed
sw
ith
inan
HR
Rco
ntr
olled
by
for-
pro
fit
hosp
itals
.
57

5 FIGURES AND TABLES
Tab
le10
:R
elat
ion
ship
Bet
wee
nF
or-P
rofi
tH
ospit
al
Ow
ner
ship
an
dR
ace
,G
end
eran
dD
isea
seIn
tera
ctio
nM
ort
ali
tyR
ate
s
DE
PE
ND
EN
TV
AR
IAB
LE
:D
eath
Rate
(Sp
ecifi
edin
Colu
mn
and
Row
Hea
din
gs)
Cance
rD
iab
etes
Hea
rtH
yp
erte
nsi
on
Cer
ebro
vasc
ula
rP
neu
monia
CO
PD
Liv
erA
ccid
ent
Dis
ease
Dis
ease
Influen
zaD
isea
se
Male
0.3
76
0.0
757
0.6
58
0.0
151
0.4
82*
-0.1
24
0.3
30ˆ
-0.2
91*
-0.0
981
(0.3
62)
(0.1
24)
(0.5
54)
(0.0
502)
(0.2
14)
(0.1
78)
(0.1
82)
(0.1
46)
(0.0
922)
Fem
ale
0.0
689
-0.0
832
0.6
28
-0.0
862ˆ
0.0
911
0.0
0869
0.1
25
-0.2
00ˆ
-0.0
0469
(0.1
97)
(0.1
23)
(0.4
72)
(0.0
494)
(0.2
18)
(0.1
70)
(0.1
54)
(0.1
02)
(0.0
935)
Whit
e0.1
70
-0.0
480
0.5
72
-0.0
585
0.3
42ˆ
-0.0
422
0.2
47
-0.2
30*
-0.0
102
(0.2
12)
(0.1
04)
(0.4
59)
(0.0
417)
(0.2
05)
(0.1
66)
(0.1
52)
(0.1
14)
(0.0
855)
Bla
ck1.0
47
0.6
92
1.7
81
-0.0
899
0.0
887
0.4
50
-0.2
54
-0.1
31
0.0
635
(1.4
39)
(0.6
53)
(1.9
65)
(0.3
57)
(1.1
53)
(1.2
62)
(0.4
90)
(0.2
69)
(0.3
26)
His
panic
0.5
10
-0.5
43
-0.4
32
0.2
01
0.0
0642
-0.3
50
0.3
33
-0.2
14
-0.0
102
(0.5
24)
(0.8
13)
(1.0
03)
(0.1
38)
(0.2
49)
(0.2
46)
(0.2
00)
(0.1
40)
(0.1
80)
Noth
ispanic
1.0
16
0.0
525
2.0
79
-0.0
416
0.6
52
0.1
62
0.4
77
-0.2
14ˆ
0.0
278
(0.8
87)
(0.1
51)
(1.6
02)
(0.0
451)
(0.4
18)
(0.2
54)
(0.3
05)
(0.1
15)
(0.1
17)
Robust
standard
erro
rsin
pare
nth
eses
.***
p<
0.0
01,
**
p<
0.0
1,
*p<
0.0
5p̂<
0.1
Note
s:E
ach
cell
repre
sents
the
coeffi
cien
ton
the
‘for-
pro
fit’
vari
able
.F
or-
pro
fit’
refe
rsto
the
num
ber
of
bed
sw
ithin
an
HR
Rco
ntr
olled
by
for-
pro
fit
hosp
itals
.A
llre
gre
ssio
ns
incl
ude
standard
contr
ol
vari
able
s,as
ab
ove,
as
wel
las
HR
Rand
yea
rfixed
effec
ts.
Each
obse
rvati
on
isan
HR
R-y
ear.
58

References
References
Alexander, J. A., & Shoou-Yih, D. L. (2006). Does governance matter? board configuration
and performance in not-for-profit hospitals. The Milbank Quarterly , 84 , 733-758.
Annual us gdp growth. (n.d.). The World Bank Data. Retrieved 11-4-2010, from
http://data.worldbank.org/indicator/NY.GDP.MKTP.KD.ZG/countries/US?display=graph
Average annual percent growth in medicare spending by state of residence. (n.d.).
State Health Facts - Henry J. Kaiser Family Foundation. Retrieved 12-1-09, from
http://www.statehealthfacts.org/comparemaptable.jsp?ind=622cat=6
Berta, P., Callea, G., Martini, G., & Vittadini, G. (2010). The effects of upcoding, cream skim-
ming and readmissions on the italian hospitals efficiency: A population-based investigation.
Economic Modelling , 27 , 812-821.
Besley, T., & Ghatak, M. (2005). Competition and incentives with motivated agents. American
Economic Review , 95 (3), 616-636.
Blustein, J., Hanson, K., & Shea, S. (1998). Preventable hospitalizations and socioeconomic
status. Health Affairs, 17 (2), 177-189.
Carter, G. M., Newhouse, J. P., & Relles, D. A. (1990). How much change in the case mix index
is drg creep? Journal of Health Economics, 9 (4), 411-428.
CDC. (2010). Deaths: Final data for 2007. National Vital Statistics Reports, 58 (19), 1-136.
Census 2000 basics. (2000). U.S. Census Bureau.
Chan, L., Koepsell, T., & Devo, R. (1997). The effect of medicare’s payment system for
rehabilitation hospitals on length of stay, charges, and total payments. New England
Journal of Medicine, 337 , 978-985.
Chang, T., & Jacobson, M. (2010). What do nonprofit hospitals maximize? evidence from
california’s seismic retrofit mandate. NBER Working Paper Series.
Cutler, D. M. (Ed.). (2000). The changing hospital industry comparing not-for-profit and for-
profit institutions. Chicago: University of Chicago Press.
59
References
Cutler, D. M., & Horwitz, J. R. (1998). Converting hospitals from not-for-profit to for-profit
status: Why and what effects? NBER Working Paper Series, 1-29.
Data by region - hrr distribution. (2011). The Dartmouth Atlas of Health Care. Available from
http://www.dartmouthatlas.org/data/region/
David, G. (2003). The convergence between for-profit and nonprofit hospitals in the united states.
Unpublished doctoral dissertation, University of Chicago.
Deneffe, D., & Masson, R. T. (2002). What do not-for-profit hospitals maximize? International
Journal of Industrial Organization, 20 , 461-492.
Duggan, M. (2002). Hospital market structure and the behavior of not-for-profit hospitals.
RAND Journal of Economics, 33 (3), 433-446.
Eggleston, K., Shen, Y.-C., Lau, J., Schmid, C. H., & Chan, J. (2006). Hospital ownership and
quality of care: What explains the different results? NBER Working Paper Series, 1-31.
Fisher, E. S., Wennberg, D. E., Stukel, T. A., Gottlieb, D. J., & Pinder, E. L. (2003). The
implications of regional variations in medicare spending. part 2: Health outcomes and
satisfaction with care. Annals of Internal Medicine, 138 (4), 288-322.
Frank, R. G., & Salkever, D. S. (1991). The supply of charity services by nonprofit hospitals:
Motives and market structure. RAND Journal of Economics, 22 (3), 430-445.
Frank, R. G., & Salkever, D. S. (2000). Market forces, diversification of activity, and the
mission of not-for-profit hospitals. In D. M. Cutler (Ed.), The changing hospital industry
comparing not-for-profit and for-profit institutions (p. 195-215). Chicago: University of
Chicago Press.
Garber, A. M. (Ed.). (2000). Frontiers in health policy research (Vol. 3). New York: MIT Press.
Gawande, A. (2009). The cost conundrum. The New Yorker .
Glied, S., & Zivin, J. G. (2002). How do doctors behave when some (but not all) of their patients
are in managed care? Journal of Health Economics, 21 (2), 337-353.
Goldman, D. P., Smith, J. P., & Sood, N. (2006, 1711). Immigrants and the cost of medical
care. Health Affairs, 25 (6), 1700.
60

References
Griffith, J. R. (1978). Measuring hospital performance. Chicago: Blue Cross Association.
Heart disease and stroke statistics – 2010 update. (2010). American Heart Association.
Horwitz, J. R. (2005). Making profits and providing care: Comparing nonprofit, for-profit, and
government hospitals. Health Affairs, 24 (3), 790-801.
Horwitz, J. R., & Nichols, A. (2009). Hospital ownership and medical services: Market mix,
spillover effects, and nonprofit objectives. Journal of Health Economics, 28 (5), 924-937.
Kessler, D. P., & Geppert, J. J. (2005). The effects of competition on variation in the quality
and cost of medicare. Journal of Economics and Management Strategy , 14 (3), 575-589.
Lakdawalla, D., & Philipson, T. (1998). Nonprofit production and competition. NBER Working
Paper Series.
Levaggi, R., & Montefiori, M. (2003). Horizontal and vertical cream skimming in the health
care market. DISEFIN Working Paper .
Lien, H.-M., Chou, S.-Y., & Liu, J.-T. (2008). Hospital ownership and perfomance: Evidence
from stroke and cardiac treatment in taiwan. Journal of Health Economics, 27 , 1208-1223.
The long-term outlook for healthcare spending. (n.d.). Con-
gressional Budget Office. Retrieved 12-3-10, from
http://www.cbo.gov/ftpdocs/87xx/doc8758/MainText.3.1.shtml1077063
Manning, D. (1997). Investing in the twenty-first century hospital. Health Affairs, 16 , 108-111.
Medicare information for providers, partners and health care professionals. (2010). Centers for
Medicare and Medicaid Services. U.S. Department of Health and Human Services. Available
from https://www.cms.gov/home/medicare.asp
Michael, R. T. (1975). Education and consumption. In F. T. Juster (Ed.), (p. 233-252).
Cambridge: National Bureau of Economic Research.
Milcent, C. (2005). Hospital ownership, reimbursement systems, and mortality rates. Health
Economics, 15 , 1151-1168.
Mukamel, D. B., Zwanziger, J., & Tomaszewski, K. J. (2001). Hmo penetration, competition,
and risk-adjusted hospital mortality. Health Services Research, 36 (6), 1019-1035.
61

References
Newhouse, J. P. (1970). Toward a theory of nonprofit institutions: An economic model of a
hospital. American Economic Review , 60 (1), 64-74.
Nonprofit hospitals and the provision of community benefits. (2006). Congressional Budget
Office.
Orszag, P. R. (2008). The long-term budget outlook and options for slowing the growth of health
care costs. Testimony to Congressional Committee on Finance.
Picone, G., Chou, S.-Y., & Sloan, F. (2002). Are for-profit hospital conversions harmful to
patients and to medicare? RAND Journal of Economics, 33 (3), 507-523.
Potetz, L. (2008). Financing medicare: An issue brief. Henry J. Kaiser Family Foundation.
Available from http://www.kff.org/medicare/upload/7731.pdf
Raw data. (1992-2007a). The Dartmouth Atlas of Health Care.
Raw data. (1992-2007b). The American Hospital Association.
Raw data - census 1990. (1990). U.S. Census Bureau.
Raw data - census 2000. (2000). U.S. Census Bureau.
Raw data - population estimates. (1992-2007). U.S. Census Bureau.
Raw data - united states 5-year american community survey. (2005-2009). U.S. Census Bureau.
Raw data - vital statistics nchs’ multiple cause of death data. (1992-2007). National Bureau of
Economic Research.
Registration requirements for hospitals. (2008). The American Hospital Association.
Rivers, P. A., & Bae, S. (1999). Hospital competition in major u.s. metropolitan areas: An
empirical evidence. Journal of Socio-Economics, 28 , 597-606.
Ross, C. E., & Wu, C. (1995). The links between education and health. American Sociological
Review , 60 (5), 719-745.
Shen, Y.-C. (2002). The effect of hospital ownership choice on patient outcomes after treatment
for acute myocardial infarction. Journal of Health Economics, 21 , 901-922.
Silverman, E., & Skinner, J. (2004). Medicare upcoding and hospital ownership. Journal of
Health Economics, 23 (2), 369-389.
62

References
Silverman, E., Skinner, J., & Fisher, E. S. (1999). The association between for-profit hospital
ownership and increased medicare spending. New England Journal of Medicine, 341 (6),
420-426.
Sloan, F., Hoerger, T. J., Morrisey, M. A., & Hassan, M. (1990). The demise of hospital
philanthropy. Economic Inquiry , 28 (4), 725-743.
Sloan, F., Picone, G., Taylor, D., & Chou, S.-Y. (1999). Does where you are admitted make a
difference? an analysis of medicare data. NBER Working Paper Series, 1-24.
Sloan, F., Picone, G., Taylor, D., & Chou, S.-Y. (2001). Hospital ownership and cost and quality
of care: Is there a dime’s worth of difference? Journal of Health Economics, 20 , 1-21.
Taylor, D., Whellan, D. J., & Sloan, F. (1990). Effects of admission to a teaching hospital on
the cost and quality of care for medicare beneficiaries. New England Journal of Medicine,
340 (4), 293-299.
Teno, J. M., Mitchell, S. L., Gozalo, P. L., Dosa, D., Hsu, A., Intrator, O., et al. (2010).
Hospital characteristics associated with feeding tube placement in nursing home residents
with advanced cognitive impairment. Journal of the American Medical Association, 303 (6),
544-550.
Total hospitals by ownership type. (n.d.). State Health Facts -
Henry J. Kaiser Family Foundation. Retrieved 12-1-09, from
http://statehealthfacts.org/comparetable.jsp?ind=395cat=8
Waldron, I. (1976). Why do women live longer than men. Social Science and Medicine, 10 ,
349-362.
Weisbrod, B. A. (1988). The nonprofit economy. Cambridge: Harvard University Press.
Woolhandler, S., & Himmelstein, D. (1997). Costs of care and administration at for-profit and
other hospitals in the united states. New England Journal of Medicine, 336 , 769-774.
Woolhandler, S., & Himmelstein, D. (2004). The high costs of for-profit care. Journal of the
Canadian Medical Association, 170 (12), 1814-1815.
63