The Effects of Contents and Apertures on the Structure of Electromagnetic Fields in Enclosed Spaces...
21
The Effects of Contents and Apertures on the Structure of Electromagnetic Fields in Enclosed Spaces A. C. Marvin, M.P. Robinson & J. F. Dawson. University of York R. Kebel. Airbus
-
date post
20-Dec-2015 -
Category
Documents
-
view
215 -
download
0
Transcript of The Effects of Contents and Apertures on the Structure of Electromagnetic Fields in Enclosed Spaces...
The Effects of Contents and Apertures on the Structure of Electromagnetic
Fields in Enclosed Spaces
A. C. Marvin, M.P. Robinson & J. F. Dawson.
University of York
R. Kebel. Airbus

Introduction
• Current practise is to prohibit the use of carry-on electronic devices with antennas and to restrict the use of other carry-on electronic devices in aircraft cabins when the doors are closed.
• Evidence of interference to aircraft systems is cited as the reason for these restrictions.

Operating Issues
• As the number and variety of such devices increases, passenger acceptance of the restrictions is likely to decrease
• Passengers would welcome the facility to continue their communications and IT activities in flight
• Appropriate cabin design could make a seamless transition from the departure lounge to the cabin

Electromagnetic Issues
• Many electromagnetic systems already operate in aircraft; as long as they are “designed in” there need be no problem.
• Can other carry-on electromagnetic systems be incorporated?
• What is the electromagnetic environment in the aircraft cabin?

Electromagnetic Field Properties
• The aircraft cabin is a conducting tube with apertures and contents.
• Comparable studies on missile bodies (GENEC) are tractable using full-wave or intermediate level models.
• The scale of a passenger cabin makes either of these approaches difficult and a statistical approach is required.
Preliminary Measurements
• Press reports have speculated that the interior of trains with multiple mobile phone users may contain “hot spots” that could cause exposure above current ICNIRP limits and, by implication, EMC problems.
• We have undertaken preliminary measurements in a simulated cabin environment.

The cabin environment!
The simulatedcabin is a Screened Room4.7m long witha cross-section of 2.37m by 3m.It holds nine passengers with business class spacing!

The cabin environment!
Windows are simulated by blocks of AN79 absorber.

A flying screened room!! (Shorts 330 G-BEEO)
Photo by Richard Hunt,UK

Frequency Response and Statistics of the Empty Cabin
9 9.02 9.04 9.06 9.08 9.1 9.12 9.14 9.16 9.18 9.2
x 108
-60
-55
-50
-45
-40
-35
-30
-25
-20
-15
-10
frequency (Hz)
S21
(dB
)
0 0.05 0.1 0.15 0.2 0.250
50
100
150
200
250
300
E (normalised)
n(E
)
Measured coupling between two roof mounted 50mm monopoles in the frequency range 900MHz to 920MHz

Frequency Response and Statistics with nine Passengers
9 9.02 9.04 9.06 9.08 9.1 9.12 9.14 9.16 9.18 9.2
x 108
-60
-55
-50
-45
-40
-35
-30
-25
-20
-15
-10
frequency (Hz)
S21
(dB
)
0.004 0.006 0.008 0.01 0.012 0.014 0.016 0.018 0.02 0.0220
20
40
60
80
100
120
140
160
180
200
E (normalised)
n(E
)
Nine passengers seated (green) and standing (red). Statistics are for seated passengers.

Simulated Results I
9 9.02 9.04 9.06 9.08 9.1 9.12 9.14 9.16 9.18 9.2
x 108
-55
-50
-45
-40
-35
-30
-25
-20
-15
frequency (Hz)
S21
(dB
)
Results of simulation of response of room, for various values of Q. Blue: Q=10000; green: Q=1000; red: Q=100.

Simulated Results II
• The simulation was done by combining the frequency responses of all modes with resonant frequencies in the range 880-940MHz, with random phase differences between the modes, and random coupling coefficients. Compare these curves with the measured responses of the room. I estimate that the empty room has a Q of about 10000. Putting in the ‘windows’ brings the Q down to about 1000. Filling the room with ‘passengers’ brings the Q down to about 100.

Simulated Results III
• We have also done some rough calculations of these Q-factors, using a paper by D Hill for the windows and resonant perturbation theory for the passengers. These give contributions of Q3=2400 for the windows, and Q2 of somewhere between 3.7 and 720 for the passengers, depending on their orientation. These figures are of the right order of magnitude compared to the measurements.
• The statistics are also similar to those of the measurements. The blue curve (Q=10000) has Rayleigh-like statistics, the red and green curves don’t.
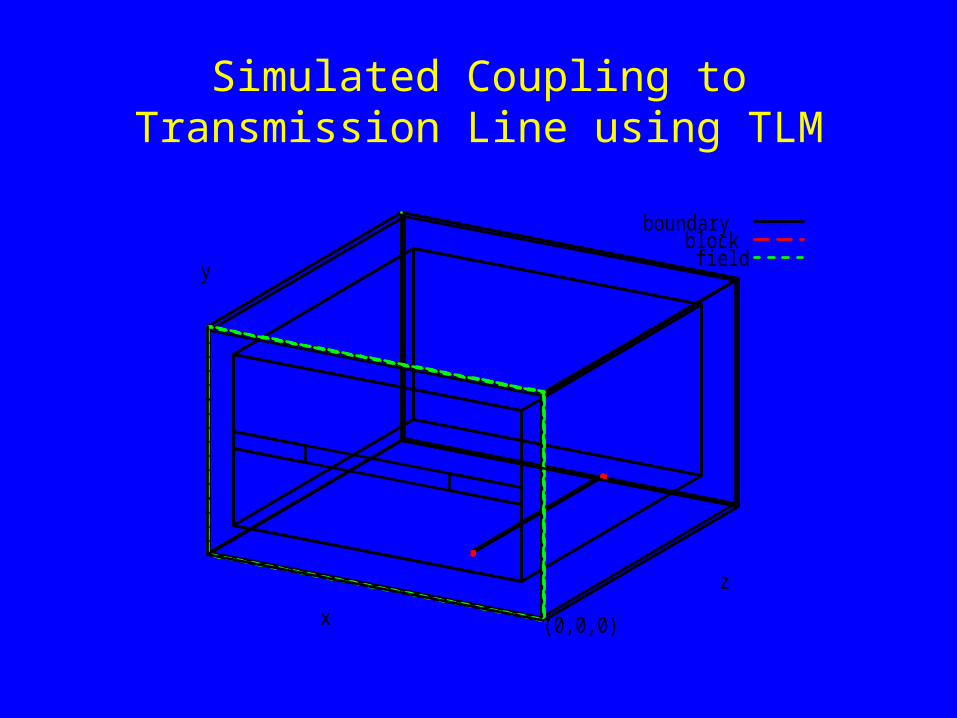
Simulated Coupling to Transmission Line using TLM
(0,0,0)
boundaryblockfield
xz
y

Equivalent Intermediate Level Circuit Model
)1(wgV
)2(wgV
)1(wgI
)2(wgI
+
+
_
_
)1()1( ,cZ
)2()2( ,cZ
W
)1(T
)2(T
nearV farV
0z dz lowzz highzz
377
FSI
sourceV
)1(loop
)2(loop
)(Nloop
+
+
+
+
_
_
_
_

Near end coupling
-160
-140
-120
-100
-80
-60
-40
-20
0 500 1000 1500 2000 2500 3000
Rece
ived
Pow
er (d
Bm)
Frequency (MHz)
Circuit ModelTLM

Statistics of near end coupling (1.25-3GHz)
0
200
400
600
800
1000
1200
1400
0 0.0005 0.001 0.0015 0.002 0.0025 0.003
Peak Voltage (V)
Circuit ModelTLM

Concluding Remarks I
• Empty cabin with no windows responses follow the expected highly resonant behaviour of an over-moded cavity with Rayleigh like statistics.
• The inclusion of representative apertures and passengers gives substantial damping of the resonant behaviour and completely alters the field statistics.

Concluding Remarks II
• The average coupling levels between antenna pairs is reduced in the presence of loss mechanisms.
• The assertion that vehicle bodies will act as resonant cavities resulting in “hot spots” for fields from multiple sources is cast into doubt.

Concluding Remarks III
• We have rather more to do in this study!