The Effects of Animation on Information Seeking...
30
Journal of the Association for Information Systems 1 Volume 1, Paper 1 March 2000 The Effects of Animation on Information Seeking Performance on the World Wide Web: Securing Attention or Interfering with Primary Tasks? Ping Zhang School of Information Studies Syracuse University Syracuse, NY 13244 U.S.A. [email protected] Abstract Although animation is commonly used in the web environment, scant scientific evidence can be found either on the effects of animation on viewer information seeking performance or on the implications for online advertising. This paper reports a limited study that provides such scientific evidence. Using research results from visual attention and perception literature to guide the discovery, the study confirms four hypotheses. (1) Animation as a secondary stimulus deteriorates viewer information seeking performance.
Transcript of The Effects of Animation on Information Seeking...

Journal of the Association for Information Systems 1
Volume 1, Paper 1March 2000
The Effects of Animation on InformationSeeking Performance on the World WideWeb: Securing Attention or Interfering
with Primary Tasks?
Ping ZhangSchool of Information Studies
Syracuse UniversitySyracuse, NY 13244
U.S.A.
Abstract
Although animation is commonly used in the web environment, scant
scientific evidence can be found either on the effects of animation on viewer
information seeking performance or on the implications for online advertising. This
paper reports a limited study that provides such scientific evidence. Using research
results from visual attention and perception literature to guide the discovery, the
study confirms four hypotheses.
(1) Animation as a secondary stimulus deteriorates viewer information seeking
performance.
Journal of the Association for Information Systems 2
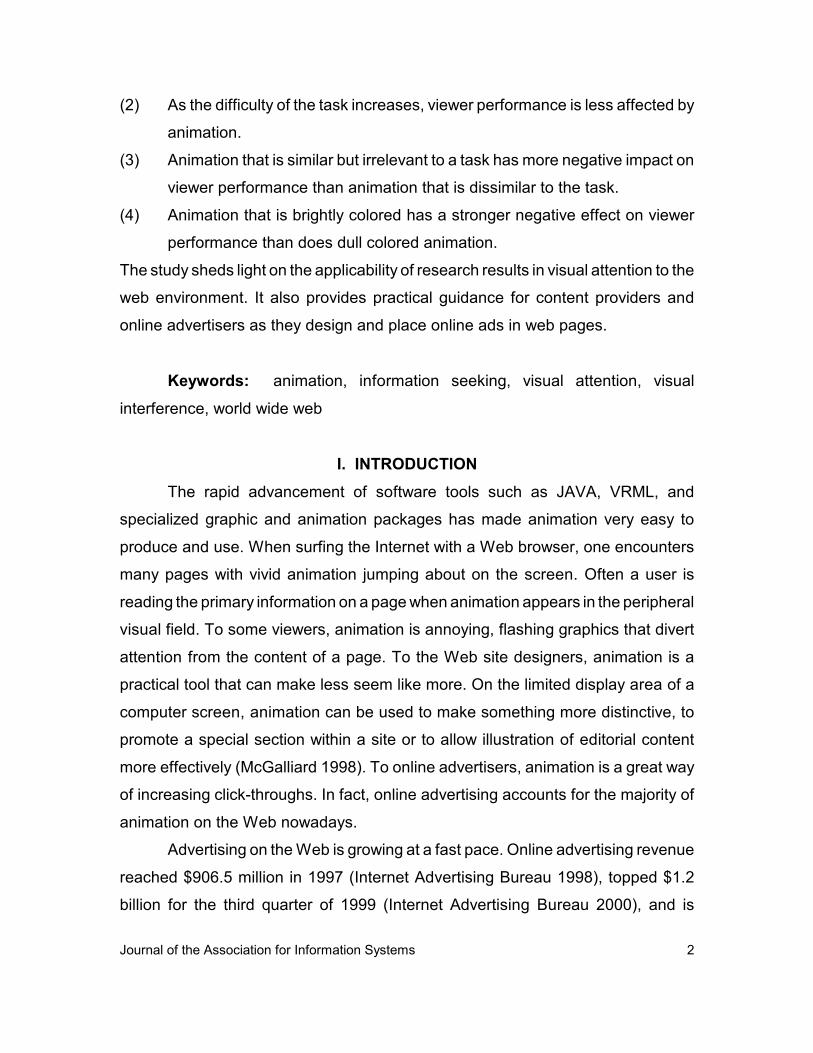
(2) As the difficulty of the task increases, viewer performance is less affected by
animation.
(3) Animation that is similar but irrelevant to a task has more negative impact on
viewer performance than animation that is dissimilar to the task.
(4) Animation that is brightly colored has a stronger negative effect on viewer
performance than does dull colored animation.
The study sheds light on the applicability of research results in visual attention to the
web environment. It also provides practical guidance for content providers and
online advertisers as they design and place online ads in web pages.
Keywords: animation, information seeking, visual attention, visual
interference, world wide web
I. INTRODUCTIONThe rapid advancement of software tools such as JAVA, VRML, and
specialized graphic and animation packages has made animation very easy to
produce and use. When surfing the Internet with a Web browser, one encounters
many pages with vivid animation jumping about on the screen. Often a user is
reading the primary information on a page when animation appears in the peripheral
visual field. To some viewers, animation is annoying, flashing graphics that divert
attention from the content of a page. To the Web site designers, animation is a
practical tool that can make less seem like more. On the limited display area of a
computer screen, animation can be used to make something more distinctive, to
promote a special section within a site or to allow illustration of editorial content
more effectively (McGalliard 1998). To online advertisers, animation is a great way
of increasing click-throughs. In fact, online advertising accounts for the majority of
animation on the Web nowadays.
Advertising on the Web is growing at a fast pace. Online advertising revenue
reached $906.5 million in 1997 (Internet Advertising Bureau 1998), topped $1.2
billion for the third quarter of 1999 (Internet Advertising Bureau 2000), and is

Journal of the Association for Information Systems 3
projected to soar to $7.7 billion in 2002 (Davidson 1998). During the same period,
total ad revenue for all other media—including print, TV, and radio—is projected to
grow just 7% annually (Davidson 1998). Research shows that static banners (a
posting on the computer screen akin to a print ad) do boost product awareness
(Wang 1997). However, it is believed that using animation rather than static banners
is a more effective way of online advertising, resulting in a 25% increase in click-
through rates (Hein 1997; McGalliard 1998). Despite the very fast growth of
animation for advertising, companies have learned valuable lessons along the way.
For example, AT&T, one of the four largest marketers, learned not to "pester"
consumers with intrusive Internet ads (USA Today 1998).
Being interrupted or having one's attention involuntarily shifted by animation
on a Web page is a typical experience for many Web users. “Many find AOL’s full-
screen 'pop-up' ads maddening” (Davidson 1998). Animation, when used to carry
information that is not essential to one's information seeking tasks, may create
visual interference that affects one’s information-seeking performance. Extraneous
animation that is present continuously or appears suddenly can act as a distraction,
making it difficult to concentrate on pertinent information. Thus, it disturbs and then
often annoys people as they search for useful information on the Web, lengthening
the time needed to obtain information correctly.
It is certainly not the content providers' intention to disturb or annoy their
viewers. Web-owners or content providers want to make money from advertising,
but they also care about the potential side effects of animation on their viewers’
information-seeking performance and attitude toward their Web sites. Given a
choice, content providers would prefer advertisements that minimally disturb
viewers' performance as they seek primary information on the Web pages.
Advertisers or marketers, on the other hand, want to draw viewer attention, so they
may want to design advertisements that have different characteristics than those the
content providers would choose. The ads that advertisers favor may require more
of the viewer’s attentional resources and thus have a higher chance of being
processed semantically. To achieve their goals, both content providers and

Journal of the Association for Information Systems 4
advertisers must understand the effects of animation in the Web environment.
Unfortunately, there is a paucity of Information Systems literature on the effects of
animation in the Web environment.
Research results from studies in visual attention and perception can provide
a plausible explanation for the disturbance phenomenon. Studies show that in
general, objects in our peripheral vision can capture our attention (Driver and Baylis
1989; Warden and Brown 1944). The meaning of a non-attended stimulus is
processed to a certain extent (Allport 1989; Duncan 1984; Treisman 1991).
Because attention has limited capacity, the available resource for attention on the
pertinent information is reduced, thus information processing performance, including
time and accuracy, deteriorates (Miller 1991; Treisman 1991).
It is, however, questionable whether we can apply visual-attention theories
or research results directly to information-seeking tasks in a computing environment
such as the Web. A primary reason for this is that the exposure time of stimuli in
traditional visual attention studies is much shorter (milliseconds) than that on the
Web (seconds or minutes), and one’s visual attention behavior may change during
this relatively long exposure time. The second reason is that the experimental
environment or setting in visual attention studies is different from that in a
computing environment, such as the Web. In visual attention studies, special types
of equipment are used to display stimuli and capture responses. To date, few
empirical studies report the effects of animation in a Web environment. The
applicability of visual attention studies needs to be tested by conducting
experiments in the Web environment.
This paper reports on a study investigating the effect of animation in the Web
environment. Animation refers to motion of any kind. In this study, animation is
limited to the kind that does not provide extra information for the user’s information-
seeking tasks. This type of animation is a non-primary stimulus, because it carries
non-primary information. A controlled experiment is used to evaluate the effect of
animation under different conditions. Data on subjects' perceived distraction and
attitude toward the use of animation in information-seeking tasks are collected.

Journal of the Association for Information Systems 5
The value of this study is twofold. First, it sheds light on the applicability of
visual attention and perception research results to the Web environment. Visual
attention theories have not been extensively applied to IS research and practice in
general and the Web environment in particular. Although the Web environment is
different from the context within which visual attention theories were developed, it
presents a unique opportunity to study the generalizability of research results in
human visual attention. This has implications for extensively applying those theories
to IS research and practice. Second, the study has practical value in providing Web
page designers with data that can replace speculation on the effects of animation,
as a non-primary information carrier, on user performance. As many more people
search for information on the Web, conduct business over the Internet, and
encounter animation more frequently as advertisers invest heavily in online
advertising, research that investigates the real effects of animation becomes
increasingly important.
The rest of the paper is organized as follows. In section II, some research
results on visual perception and attention are reviewed and the research
hypotheses are laid out. Section III describes the experimental design and section
IV, the results. In section V, limitations of the current study are discussed along with
the implications of the findings on Web user interface design from both content
provider and online advertiser perspectives. Section VI points out contributions of
the current study and poses future research questions.
II. LITERATURE REVIEW AND RESEARCH HYPOTHESESOur ability to attend to stimuli is limited, and the direction of attention
determines how well we perceive, remember, and act on information. Objects or
information that do not receive attention usually fall outside our awareness and,
hence, have little influence on performance (Proctor and van Zandt 1994, p. 187).
Perceptual attention is usually studied with two primary themes: selectivity
(conscious perception is always selective) and capacity limitations (our limited ability
to carry out various mental operations at the same time), although a variety of other

Journal of the Association for Information Systems 6
notions are also studied (Pashler 1998). Specifically, attention has been studied
from two perspectives in order to understand different aspects of attention:
selective and divided.
Selective attention is also known as “focused attention.” It is studied by
presenting people with two or more stimuli at the same time and instructing them
to process and respond to only one (Eysenck and Keane 1995, p. 96). Usually the
criterion of selection is a simple physical attribute such as location or color (Pashler
1998). Selective attention concerns our ability to focus on certain sources of
information and ignore others (Proctor and van Zandt 1994, p.187). Work on
selective attention can tell us how effectively people can select certain inputs rather
than others, and it enables us to investigate the nature of the selection process and
the fate of unattended stimuli (Eysenck and Keane 1995, p. 96). Divided attention
is also studied by presenting at least two stimulus inputs at the same time, but with
instructions that attention and a response must be given to all stimulus inputs
(Eysenck and Keane 1995, p. 96). In divided attention, the question asked of the
subject depends on the categorical identity of more than one of the stimuli (Pashler
1998, p. 29). Studies on divided attention provide useful information about our
processing limitations (ability to divide attention among multiple tasks), and tell us
something about attentional mechanisms and their capacity (Eysenck and Keane
1995, p. 96; Proctor and van Zandt 1994, p.187).
Pashler summarizes the discoveries in the visual attention literature.
Following is a list of conclusions that are relevant to this study.
(1) The to-be-ignored stimuli are analyzed to a semantic level, although
“the totality of the evidence does not favor the view that complete
analysis takes place on every occasion.”
(2) Capacity limits are evident when the task requires discriminating
targets defined by complex discriminations (e.g., reading a word).
(3) More specifically, the capacity limits in perceptual processing of
complex discriminations depend on the attended stimulus load and
hardly at all on the ignored stimuli.

Journal of the Association for Information Systems 7
In summary,
people can usually exercise control over what stimuliundergo extensive perceptual analysis, including, onoccasion, selecting multiple stimuli for analysis. Whenthis takes place, the stimuli that are selected competefor limited capacity. If the total load of stimulus pro-cessing does not exceed a certain threshold, parallelprocessing occurs without any detectable reduction inefficiency. Above this threshold, efficiency is reducedby the load of attended stimuli, and processing maysometimes operate sequentially, perhaps as a strategyto minimize loss of accuracy. (Pashler 1998, p. 226)
In this study, the subject's primary task is to search for some information (a
phrase, word, or term) from a document on a Web page and animation provides no
information for the primary task. This is not a clear-cut selective- or divided-attention
task, but rather like a hybrid divided- and selective-attention task (Pashler 1998). In
a real world situation, animation can have different properties such as size, speed,
location, and content design and color (for examples of animation size, location, and
possible cost to the advertisers, visit http://www.ecommercetimes.com/ad_info/). All
these factors can affect the impact of animation. The effect of the same animation
could also depend on the types of user tasks and different individuals. To make this
study feasible, we consider some factors as constants; namely size, speed, and
location. We treat three factors as independent variables; these are task difficulty
(simple and difficult), animation color (bright color such as red, green, light blue, and
orange, and dull colors such as gray, white, and black), and animation content
(task-similar and task-dissimilar). Individual differences are eliminated by
experimental design. We use research results from the literature to predict
animation effects, while keeping in mind the question of the applicability of these
results.
For information seeking tasks in the Web environment, both target stimulus
(information to be searched) and non-target stimuli are defined by "complex
discriminations" and must be identified by the subject before a decision (whether a
stimulus is a target) can be made. In this situation, capacity limits should be evident,

Journal of the Association for Information Systems 8
as summarized by Pashler. The amount of resources for processing the target
stimulus may be affected by the amount of resources used to "attend" to non-target
stimuli, either other words in the document or animation. Given that the number of
non-target words in a document is a constant, adding animation to the document
may add demand for resources and thus decrease the available amount of
resources for processing the target stimulus. Therefore, the subject's information-
seeking performance may be affected. It should be noted that we draw hypotheses
from visual attention studies of the characteristics of our human visual attention
mechanisms. However, the experimental settings for the Web environment are
different from those in the visual attention studies.
Hypothesis #1. Animation as a secondary stimulus deteriorates
subjects’ information-seeking performance.
As indicated in the summary of attention research results, increasing the
difficulty of processing the attended items eliminates effects of unattended stimuli
(Pashler 1998, p. 98). Lavie and Tsal, for example, discovered that a distracter has
less impact on a more difficult task (that is, a task with high perceptual load) than
on a simple or low load task (Lavie 1995; Lavie and Tsal 1994). In Lavie’s study,
after being exposed to a string of one to six letters for 50 ms, participants were
asked whether a target letter appeared in the string. The one- or two-letter condition
was called a simple task, the six-letter condition a difficult task. The argument is that
a difficult task required more cognitive effort by participants, thus their capacity was
utilized, leaving less room for processing irrelevant information (that is, the
distracter). We apply the findings to the Web-based tasks. In order to test this, we
divide tasks into simple and difficult ones. The corresponding hypothesis is:
Hypothesis #2. As the level of task difficulty increases, subjects’
performance will be less affected by animation.
The visual attention literature also indicates that the degree of interference
has to do with the physical or/and the semantic relation between the distraction and
the target (e.g., Mayor and Gonzalea-Marques 1994; Miller and Bauer 1981;
Treisman 1991). The more similar their physical features or semantic meanings, the

Journal of the Association for Information Systems 9
greater the interference. The basic argument is that visual items that are
perceptually grouped (because they are very similar) will tend to be selected
together and thus lengthen the time to detect the target or attended stimuli. In our
case, we compare animation that has physical features and/or content similar to a
user's tasks to another type of animation that has no similar physical
features/content to the tasks. The corresponding hypothesis is:
Hypothesis #3. Animation that is similar but irrelevant to a task has
more negative effect on performance than animation that is dissimilar
to the task.
Personal experience and anecdotal evidence indicate, however, that bright
color is an important attribute of annoying animation. We anticipate that bright
colored animation is more noticeable and thus more distracting than animation with
dull color.
Hypothesis #4. Animation that is brightly colored has a stronger
negative effect on subjects' performance than does dull colored
animation.
III. EXPERIMENTAL DESIGN The experiment used a within-subject full factorial design in order to reduce
error variability and increase statistical test power. Besides the three independent
variables (task difficulty, animation color, and animation content), baseline condi-
tions, where no animation was used, were also considered for tasks with two
different difficulty levels. The experiment consisted of 10 imposed settings, as
depicted in Table 1. Each subject did a total of 20 tasks, two for each setting. The
sequence of the 20 tasks was randomized for each subject in order to reduce the
potential order effect.

Journal of the Association for Information Systems 10
Table 1. Structure of the Study: Task Settings
Baseline(no animation)
Task-similaranimation
Task-dissimilaranimation
DullColor
BrightColor
DullColor
BrightColor
Simple task 1 2 3 4 5
Difficult task 6 7 8 9 10
Subjects worked with a table of strings where some of the strings were target
strings and were to be identified and counted. The table, which was designed as ten
rows by eight columns, was displayable on one page and big enough to eliminate
the one-glance-grabs-all effect (otherwise time spent on the task would not be
measurable). The task of identifying target strings (which could be words,
abbreviations, or phrases) from other strings is one of the typical information-
seeking tasks in the Web environment. It is frequently conducted when viewers use
either browsing or analytical information seeking strategies in the Web environment
(Marchionini 1995). In this study, we defined a string as a random combination of
one to four letters in order to eliminate any automatic processing of familiar target
strings. Automatic processing is considered nonselective processing or requiring no
attention (Pashler 1998). A target string appeared from one to five times in a table.
After some trials, we found that one letter strings were too easy to count, and any
string with more than four letters was extremely difficult to work with. We decided
that in this study, a target string with two letters was a simple task, and a target
string with four letters was a difficult one.
Each of the 20 tasks was associated with a pre-page and a task-page. A pre-
page showed the target string that subjects needed to look for. A click on the link
of the pre-page loaded the task-page. A task-page had a no-border table of strings
in the middle, a clickable answer section at the bottom, and possibly some
animation. The subject could select an answer and click the “Submit” button, which
led the subject to the next pre-page in the task sequence.

Journal of the Association for Information Systems 11
Figure 1. A Task-page with String Animation: Snapshot 1
Figure 2. A Task-page with String Animation: Snapshot 2

Journal of the Association for Information Systems 12
Animation could appear in a random location right outside the table (top,
bottom, and side). The content of animation included moving strings (similar to that
in the tasks) and moving images such as animals, objects, and people. Both types
of animation can be found frequently in real Web pages. String animation seemed
to fly into a subject's face from deep in the screen then receded; this cycle
continued for as long as the page was displayed. Figures 1 and 2 display two
snapshots of a task-page at different stages of string animation. The size for all
animations remained the same: 110 x 110 pixels. This arbitrary size is used in this
study because there is no fixed size of animation in real Web pages. Animation
appeared when a task began and stayed on until the end of the task. This task
setting, where subjects need to focus on target strings with animation appearing in
the peripheral fields, is very close to if not exactly what occurs in the real Web
environment.
Both pre-pages and task-pages disappeared from the screen within a certain
period; a pre-page stayed 10 seconds and a task-page 20 seconds. These pages
also allowed subjects to process faster if they wanted by providing a link to the next
page in the sequence. Interested readers or researchers may go to the study's URL
(http://cindy.syr.edu/animation/public) to experience and expand the study them-
selves.
The Web browser was Netscape Navigator Gold 3.01. The background color
of all Web pages was the default color. The foreground color was black; font size
for strings in the tables was HTML “h3” in non-capital case. The PCs in the
computer lab used for the experiment were the same model with same size and
resolution monitors.
The subjects were not randomly selected. They were 24 undergraduate
students majoring in Information Management and Technology. All had experience
using the Web and the browser. Owing to the limited number of computers
available, subjects were divided into two sessions. Each subject received a bonus
for a course s/he was taking (either substituting an assignment or receiving extra

Journal of the Association for Information Systems 13
credit). To encourage subjects to do their best during the experiment, we offered
prizes for best performance at three levels ($30, $10, and $5).
Subjects were instructed to count as accurately and as quickly as possible
how many times a target string appeared in the table. Once finished counting, they
were to click the corresponding answer and then click the Submit button. They were
reminded that “your performance is determined by the correctness of the answers
and the time you spend on the task-pages, and you have only a limited time to finish
each table.” They were also warned that “going back to a previous page will mess
up your log and waste your time. Your new answers will not be recorded, and the
total amount of time you spend will be increased automatically by 1,000 times.” At
the beginning of the experiment, subjects practiced with four randomly selected
tasks (with targets strings different from those used in the competition) to familiarize
themselves with the experiment. Following the practice, subjects performed 20
tasks. After finishing the tasks, subjects filled out a questionnaire of biographic data,
perceived interference, attitude toward animation used, search strategies, and
animation features noticed. When everyone was done, performance scores were
calculated, awards were given to subjects with best performance scores, and the
subjects were dismissed. The entire experimental session lasted less than 45
minutes. The average length per task was 15 seconds.
All tasks for all the subjects were located on a computer server and were
accessed through Netscape Navigator browsers through a campus local area
network. The computer server captured the time spent on and subjects' answers to
the tasks.
IV. EXPERIMENT RESULTS The accuracy of task execution and the amount of time spent on the task
determine the performance on the task. Because each task-page had a different
number of target strings, we used count accuracy to represent errors in a task
instead of number of miscounts. The accuracy score should consider that a subject
could over-count or under-count the number of targets on a task-page. It should

Journal of the Association for Information Systems 14
also have the property that the higher the score, the higher the accuracy. The
following formula, where accuracy is dependent on the difference between reported
count and correct count, is used to calculate the accuracy score: CA = (1 -
absolute(CorrectCount - ReportedCount)/CorrectCount).
Time (number of seconds) spent on a task starts when the task-page is
loaded and ends when the subject submits the answer to the task. The subjects
were told that they would be evaluated by a combination of time and accuracy,
which means that they might sacrifice one in order to achieve the other. In order to
have a unified performance score (p) for comparison, we used accuracy per unit
time as the performance score of a task. That is: p = accuracy/time*1000, while the
constant 1,000 is to eliminate the decimal places of the p scores.
The three factors in Table 1, presented earlier, are analyzed at two levels.
Level 1 considers a full 2 x 2 factorial repeated measure analysis of animation
conditions (baseline and animation) and task difficulty conditions (simple and
difficult). This helps us to test the first hypothesis, whether animation deteriorates
one’s performance, and the second hypothesis, animation’s effect on tasks at
different difficulty levels. Table 2 summarizes the ANOVA results.
Table 2. ANOVA Results for Animation by Task Difficulty
Performance F1,23
Animation 55.17 ****
Task difficulty .00
Animation by Task Difficulty 10.74 **
* p < .05 ** p < .01 *** p < .001 **** p < .0001

Journal of the Association for Information Systems 15
Table 3. ANOVA Results for Task Difficulty byAnimation Content by Color
Performance F1,23
Task difficulty 4.47 *
Content 0.64
Color 13.41 ***
Task by content 10.52 **
Task by color 0.48
Content by color 6.05*
Task by content by color 23.68 ****
* p < .05 ** p < .01 *** p < .001 **** p < .0001
Level 2 analysis is within animation conditions. That is, given that all the
tasks are done with animation present, we consider a 2 x 2 x 2 full factorial repeated
measure analysis on animation content (string and image), task difficulty (simple
and difficult), and animation color (dull and bright). This second level analysis helps
us to confirm hypotheses 3 and 4. Table 3 exhibits the ANOVA results of this level 2
analysis. The two tasks in each of the 10 experimental settings are averaged for the
analysis.
Next, we examine each of the four hypotheses in light of the experimental
results on performance.
Hypothesis #1. Animation as a secondary stimulus deteriorates
subjects' information-seeking performance.
This hypothesis is well supported by the data. As shown in Table 2,
animation has a main effect, severely decreasing performance from the baseline
condition. This is true no matter what the difficulty level of the task. Support for this
hypothesis is depicted by Figure 3, which displays the group mean performance
scores. Baseline tasks (no animation) have higher performance scores than tasks
with animation presence.

Journal of the Association for Information Systems 16
Animation Effects on Task Difficulty Level
40.0
50.0
60.0
70.0
animation condition
grou
p m
eans
of
perf
orm
ance
simple task 69.0 50.8
difficult task 64.3 55.4
baseline animation
Animation Effects on Task Difficulty Level
40.0
50.0
60.0
70.0
animation condition
grou
p m
eans
of
perf
orm
ance
simple task 69.0 50.8
difficult task 64.3 55.4
baseline animation
Hypothesis #2. As the level of task difficulty increases, subjects'
performance will be less affected by animation.
The level 1 ANOVA concerns the relationship between animation conditions
and task difficulty levels and can be used directly to test this hypothesis. Both
Table 2 and Figure 3 show a significant interaction effect (p < 0.01) between
animation and task difficulty level. That is, the degree of the animation's effect is
related to the task difficulty levels. Specifically, animation affects simple tasks more
than it does difficult tasks. Thus, as the level of task difficulty increases,
performance is less affected by animation. This supports the hypothesis.
Hypothesis #3. Animation that is similar but irrelevant to a task has
more negative effect on performance than animation that is dissimilar
to the task.
ANOVA results in Table 3 indicate that this hypothesis is true under certain
conditions. Table 3 shows a significant three-way interaction effect (p < 0.0001).
This three-way interaction effect can be better depicted by Figures 4 and 5.
Figure 3. Group Means of Animation Effects onSimple and Difficult Tasks

Journal of the Association for Information Systems 17
For simple tasks as in Figure 4, dull color string animation has more negative
effect than dull color image animation does; and bright color image animation has
more negative effect than bright color string animation. That is, the effect of string
animation that is similar but irrelevant to the tasks is associated with the color of the
animation for simple tasks.
For difficult tasks, as shown in Figure 5, string animation has more negative
effect than image animation. Color of the animation does not seem to matter.
Hypothesis #4. Animation that is brightly colored has a stronger
negative effect on subjects’ performance than does dull colored
animation.
Table 3 shows the significant main effect of color. The group mean for dull
color tasks is 57.2 (the average of 43.1, 65.4, 67.5, and 53, obtained from the data
tables in Figures 4 and 5), compared to the group mean of bright color of 48.9. This
shows that dull color animation affects tasks less than bright color animation. The
three-way interaction effect shown in Table 3 and Figures 4 and 5, however,
indicates that one needs to look at other conditions. For simple tasks as depicted
by Figure 4, dull color can be worse than bright color when animation is string,
seemingly refuting the hypothesis. For image animation, or for difficult tasks, the
hypothesis is supported.
Next, we discuss questionnaire responses and compare them to the
analyzed data that support the hypotheses. Table 4 summarizes the responses
from the subjects on (1) perceived effects of animation and animation features
(columns 2 through 6) and (2) the answers to “How strongly would you agree that
you would rather have no animation while performing this type of tasks” (the last
column).
When they were asked to describe the most distracting animation, six out of
24 subjects explicitly mentioned that animation was “not at all” or “not very”
distracting. For other subjects, colored animation was explicitly mentioned 14 times,
changing sized animation nine times, word or string animation 10 times, and image
animation twice. One subject indicated several animation features, stating “bright

Journal of the Association for Information Systems 18
Interaction Effects on Simple Tasks
40.0
50.0
60.0
70.0
animation type
grou
p m
eans
of
perfo
rman
ce
dull color 43.1 65.4
bright color 53.1 41.6
string animation image animation
Interaction Effects on Simple Tasks
40.0
50.0
60.0
70.0
animation type
grou
p m
eans
of
perfo
rman
ce
dull color 43.1 65.4
bright color 53.1 41.6
string animation image animation
Interaction Effects on Difficult Tasks
40.0
50.0
60.0
70.0
animation type
grou
p m
eans
of
perf
orm
ance
dull color 67.5 53.0
bright color 52.0 48.9
string animation image animation
Interaction Effects on Difficult Tasks
40.0
50.0
60.0
70.0
animation type
grou
p m
eans
of
perf
orm
ance
dull color 67.5 53.0
bright color 52.0 48.9
string animation image animation
Figure 4. Color by Relevance InteractionEffects on Simple Tasks
Figure 5. Color by Relevance InteractionEffects on Difficult Tasks

Journal of the Association for Information Systems 19
Table 4. Perceived Animation Effects and Attitude
SidAnimationnot at all or
not verydistracting
Tasks were distracted byanimation Preference for
absence ofanimationColored Changing
size String Image
s01 x 1s02 x x 7s03 x 4s04 x x 5s05 x x 7s06 x x x 6s07 x 7s08 7s09 x 6s10 x x x 7s14 x 5s15 x 6s17 x x x 7s18 x 7s19 x x x 7s25 x 6s26 x 7s27 x 4s28 7s31 x x 7s32 x x 7s35 x x 5s43 x x x 5s44 x x 5Total # 6 14 7 10 2% 25% 50% 29% 42% 8%
colored letters that change sizes,” which includes color, string, and changing size.
Two subjects (s08 and s28) did not make any explicit claim on the effects of
features but did state that animation distracted them from performing the tasks. It
could be that some subjects only mentioned the most “impressive” annoying
feature, even though other features were also distracting.

Journal of the Association for Information Systems 20
The perceived color effect, exhibited in Table 4, is consistent with the
performance data. String animation that is similar to tasks is another confirmed
distracting feature, with more people reporting it than image animation. It is,
however, difficult to pin down what the changing-size feature actually implies.
Among all the animations used in the study, only string animations change size (the
way string animation moves makes it look as if it changes its size; see Figures 1 and
2). That is, some subjects may use this phrase to describe the string animation (as
indicated by Table 4, some subjects reported either changing size or string, but not
both), or the true feature of animation that changes its size. This feature needs to
be studied in future research.
The attitude toward use of animation accompanying information-seeking
tasks is shown in column 7 of Table 4. When asked how strongly they agreed that
they would rather have no animation while performing this type of tasks, 50% of the
subjects answered “completely agree” (scale 7), 38% answered “strongly or
somewhat agree” (scales 6 and 5), 8% answered “neutral” (scale 4), and one
subject (4%) answered “completely disagree” (scale 1 by s01). Subject s01 further
explained that “if a person is looking at a page with a specific goal in mind, such as
the task I was given, then any distractions can be easily ignored.”
To test whether perceived effects are consistent with the performance data,
the data of the six subjects who said animation was not at all or not very distracting
were analyzed descriptively. Table 5 shows the results. Except s01 and s27, whose
performance was not changed much by animation, the performance data of the
other four subjects decreased substantially (more than 20% and up to 41%). Two
observations can be drawn from this analysis. First, it seems that perceived effects
may not necessarily be the true effects, as indicted by the four subjects whose
performance dropped when animation was introduced. Second, it could be that
animation has little or no effect on some people, such as s01 and s27. This raised
a question concerning the conditions under which animation does not interfere with
information-seeking tasks.

Journal of the Association for Information Systems 21
Table 5. Change in Performance of Those WhoPerceived No or Little Animation Effects
Baseline Animation Decrease %s01 57 55.3 -3%s03 66.3 50.8 -23%s14 61.6 43.6 -29%s15 66.7 39.5 -41%s27 73.4 71.6 -2%s35 61.6 40 -35%mean 64.4 50.1 -22%
V. DISCUSSIONThe primary goals of this study were to test the applicability of some visual
attention and perception research results to the question of whether animation is a
source of visual interference in the Web environment and to determine under what
conditions and to what extent animation affects information-seeking performance.
In order to achieve these goals, a controlled lab experiment was conducted and
many factors were eliminated from the study. For example, the speed of animation,
many potential locations of animation (for instance, animation inside the content
section, which is currently a strategy of some online advertisers), and the size of
animation are not considered in this study. Another unexamined factor is multiple
animation images on one page, which is typical in the real Web environment. These
animation features and other commonly used features can be studied in future
research investigations.
Cook and Campbell (1979) consider three factors concerning the external
validity of a study: people or samples, settings, and times. In this study, the
intended population was people who may use the Web. These include almost the
entire population on Earth with various racial, social, geographical, age, sex,
education, and personality groups. The subjects in this study were undergraduate
students majoring in Information Technology in a northeast U.S. university. This
non-random sample may not be a representative of the population. On the other

Journal of the Association for Information Systems 22
hand, the study was designed to eliminate individual differences by using within-
subject measures. From this perspective, the particular sample should not affect the
findings. Another benefit of using within-subject measures is the increase in
statistical power because of the reduced variability due to individual differences.
The setting of the study was a controlled campus lab with performance
incentives. This may not be a typical setting for Web users. Most often, however,
viewers need to find the correct information from a Web page, either in a computer
lab or at the convenience of a home computer, within a reasonable, if not the
shortest, time period. The performance incentives were intended to create pressure
similar to that of a Web user. In terms of the time factor of external validity, the
findings should not be biased by the particular day the study was conducted. During
the fast development of the Web, animation may be used differently on Web pages
over time. The effects of animation under the studied conditions, however, should
not change owing to a rather slow process of human evolution. Nevertheless, the
findings could be made more robust by further studies.
The implications of this study for Web user interface design and online
advertising are significant. A poll of 1,000 households conducted by Baruch College
and Harris Poll (Business Week 1997) indicates that the most common activity on
the Net is research (82% of users), followed by education (75%), news (68%), and
entertainment (61%). Another study (Chatterjee and Sambammurthy 1999) shows
that U.S. companies are using the Web to facilitate the entire range of primary
business activities—from product/service design and production to marketing, sales,
delivery, and after-sales customer service. From the perspective of either the user
information seeking or companies using the Web to realize both operational and
strategic benefits, content providers must understand the potential effects of
animation on users.
Specifically, in order to have minimum impact on viewers' information seeking
performance and attitude toward a page, content providers should consider the
following factors as suggested by this study: the target audience's typical task load,
use of animation in combination with task load, and color and semantic meaning of
Journal of the Association for Information Systems 23
animation. Specific strategies are: (1) raise the perceptual load, making information-
seeking tasks more challenging by involving viewers in the content of a Web page;
(2) use very little animation if tasks should not impose a high load; (3) avoid bright
colored animation; and (4) avoid animation that is semantically similar to the primary
tasks.
On the other hand, online advertising is very attractive to marketers, as
proven by the fast pace of revenue increase. There are many issues to study, both
theoretically and empirically, before one can advise online advertisers
comprehensively. For example, some suggest that advertisers should be
"negotiating for top of the page for online ads" (Hein 1997), while others discovered
that ads should be placed at a place on the page that viewers will reach after they
have gained a certain amount of the primary information (Scanlon 1998). One thing
seems certain at the moment: the decrease of a viewer's performance in the
presence of animation is due to the viewer's attention (perhaps even involuntary
attention) to the animation. In order to have viewers pay (more) attention to online
ads composed of animation, advertisers need to analyze the same factors that
content providers must analyze: task load, animation color, and animation content.
Thus, the strategies for advertisers are almost the opposite of those for content
providers: (1) target pages where audiences tend to have simple tasks, (2) use
bright color when possible, and (3) design animation that is semantically similar to
the tasks.
VI. CONCLUSIONWith the rapid evolution of the Internet and the World Wide Web, and as
more people use the Web for gathering information, conducting business, and
entertainment, studies on the effect of certain Web features such as animation
become timely and important. For a relatively new medium such as the Web,
empirical studies are as important as theoretical predictions and implications.
Research on applicability of existing theories or research results has theoretical as
well as practical value. This study tested the applicability of some visual-attention

Journal of the Association for Information Systems 24
and perception research results to the Web environment. The interference effect of
animation was predicted by these visual attention and perception studies. Thus, the
findings of this study are plausible. This implies that, despite some different
experimental conditions (such as short exposure time), the traditional visual
perception and attention studies might be applicable to the Web environment. After
all, human evolution changes our characteristics much more slowly than the
environment changes. Certain study results on human characteristics can be
applied over a relatively long period. This particular study suggests that designers
of any type of user interface should consider possible visual interference sources
that may affect an individual's information seeking performance.
This research provides a base for future investigations. One interesting
observation from the current study is the fact that some subjects can block the
distraction caused by animation (refer to Table 5 and comments from s01). Others
have also noticed this fact. For example, as Jakob Nielsen observed, “Users are
completely ignoring banner ads. Click rates are falling through the floor” (Machlis
1998). It is worth studying the conditions under which Web viewers can intentionally
block animation or static banners they identify as non-primary information.
Furthermore, even if viewers can indeed intentionally ignore animation and banners,
visual perception theories suggest that animation/banners are semantically pro-
cessed to some extent (Pashler 1998). It would be interesting to know the extent to
which viewers semantically process non-primary animation or banners. In other
words, perhaps viewers' intentionally ignoring animation/banners does not mean
they are not aware of the semantic content of the ignored features. If this notion
were confirmed, it would be good news to online advertisers who, among other
goals, want to raise brand awareness.
Another possibility is to study user satisfaction with a website that has online
advertising. The current experiment is meant to test information-seeking perfor-
mance. Although the study also touched on some of the user attitude issues, such
as perceived animation distraction and opinions on use of animation on Web pages,
it did not test user satisfaction with using a website that has online advertising. The

Journal of the Association for Information Systems 25
satisfaction question should be addressed in a less controlled field setting. This is
beyond the scope of the current study. Satisfaction is an important indicator of user
attitude toward using and continued use of a website. Rafaeli (1991) did a pilot
experiment on combining advertising messages with a software package perceived
to be useful by the subjects. His study shows that (1) user satisfaction with the
software seems unaffected by use of advertising messages; (2) recall of advertising
messages seems high; and (3) it seems well worth further investigating the effect
of software's communication bandwidth on advertising effectiveness. If his
conclusions can be applied to the Web environment, and if the usefulness of the
website is highly regarded by the user, advertising carried by the website might not
reduce user satisfaction levels, regardless of reduced performance. This would be
useful to advertisers as well as content providers. It thus calls for future investi-
gation.
VII. ACKNOWLEDGMENTSThe author is very grateful for the suggestions from colleagues Rolf Wigand,
Robert Heckman, Kevin Crowston, Steve Sawyer, and Gisela von Dran during the
preparation of the paper. The author thanks the four anonymous reviewers for
providing very constructive comments and suggestions. Special thanks go to the
editor, Dr. Phillip Ein-Dor, for his kind encouragement, patience, and very insightful
suggestions.

1Editor’s Note: The following reference list contains hyperlinks to World Wide Web pages.Readers with the ability to access the Web directly or are reading the paper on the Web can gaindirect access to these linked references. Readers are warned, however, that1. these links existed as of the date of publication but are not guaranteed to be working
thereafter.2. the contents of Web pages may change over time. Where version information is provided
in the References, different versions may not contain the information or the conclusionsreferenced.
3. the author(s) of the Web pages, not AIS, is (are) responsible for the accuracy of their content.4. the author(s) of this article, not AIS, is (are) responsible for the accuracy of the URL and
version information.
Journal of the Association for Information Systems 26
VIII. REFERENCES1
Allport, A. D. “Visual Attention,” in Foundations of Cognitive Science, M. I. Posner(ed.), Cambridge, MA: MIT Press, 1989, pp. 631-682.
Business Week. “A Census in Cyberspace: World Wide Web, 3 Years Old, Nowhas 40 Mil Users, Almost Enough to Attract Enough Advertising & Sponsorsto Support the Internet,” May 5, 1997.
Chatterjee, D., and Sambammurthy, V. “Business Implications of Web Technology:An Insight into Usage of the World Wide Web by U.S. Companies.” In EM -Electronic Commerce in the Americas and Local versus Global ElectronicCommerce, B. F. Schmid, D. Selz, S. Klein, and C. Steinfield (eds.),February 1999.
Cook, T., and Campbell, D. T. Quasi-Experimentation: Design and Analysis Issuesfor Field Settings, Boston: Houghton Mifflin Company, 1979.
Davidson, P. “On-line Ads Beginning to Click AOL's Sales Blossom in GrowingTrend,” USA Today, February 24, 1998.
Driver, J., and Baylis, G. “Movement and Visual Attention: The Spotlight MetaphorBreaks Down,” Journal of Experimental Psychology: Human Perception andPerformance (15:3), 1989, pp. 448-456.
Duncan, J. “Selective Attention and the Organization of Visual Information,” Journalof Experimental Psychology: General (113:4), 1984, pp. 501-517.
Eysenck, M., and Keane, M. Cognitive Psychology: A Student’s Handbook, 3rd
Edition, Philadelphia: Psychology Press, 1995.Hein, K. “Improve Your Online Marketing,” Incentive, November 1997.Internet Advertising Bureau. “Internet Advertising Sees Breakthrough Year in
1997,” April 6, 1998 (http://www.iab.net/).Internet Advertising Bureau. “Internet Advertising Bureau (IAB) Reports Online Ad
Revenue Tops $1.2 Billion for 3Q 1999,” January 18, 2000(http://www.iab.net).
Lavie, N. “Perceptual Load as a Necessary Condition for Selective Attention,”Journal of Experimental Psychology: Human Perception and Performance(21:3), 1995, pp. 451-468.

Journal of the Association for Information Systems 27
Lavie, N., and Tsal, Y. “Perceptual Load as a Major Determinant of the Locus ofSelection in Visual Attention,” Perception and Psychophysics (56), 1994, pp.183-197.
Machlis, S. “New Ads: 'Rich Concepts, Not Rich Media',” Computerworld (32:35),August 31, 1998.
Mayor, J., and Gonzalez-Marques, J. “Facilitation and Interference Effects in Wordand Picture Processing,” in Cognitive Approaches to Human Perception, S.Ballesteros (ed.), Homewood, IL: Lawrence Erlbaum Associates, 1994, pp.155-198.
Marchionini, G. Information Seeking in Electronic Environments, Cambridge, UK:Cambridge University Press, 1995.
McGalliard, K. “Animate Your Web Site Gif Graphics,” Editor and Publisher, May1998.
Miller, J. O. “The Flanker Compatibility Effect as a Function of Visual Angle,Attentional Focus, Visual Transients, and Perceptual Load: A Search forBoundary Conditions,” Perception and Psychophysics (49), 1991, pp. 270-288.
Miller, J. O., and Bauer, D. W. “Visual Similarity and Discrimination Demands,”Journal of Experimental Psychology: General (110), 1981, pp. 39-55.
Pashler, H. The Psychology of Attention, Cambridge, MA: MIT Press, 1998.Proctor, R., and van Zandt, T. Human Factors in Simple and Complex Systems,
Needham Heights, MA: Allyn & Bacon, 1994.Rafaeli, S. “Advertising to Finance Software: The Feasibility of Soapware,” in The
Economics of Information Systems and Technology, R. Veryard (ed.),London: Butterworths, 1990.
Scanlon, T. “Seductive Design for Web Sites,” Eye for Design, July/August 1998.Treisman, A. “Search, Similarity, and Integration of Features Between and Within
Dimensions,” Journal of Experimental Psychology: Human Perception andPerformance (17), 1991, pp. 652-676.
USA Today. “Internet Advertisers Learning as They Go,” August 17, 1998.Wang, N. “Researchers Find Banners Boost Product Awareness,” Web Week,
September 29, 1997.Warden, C. T., and Brown, H. C. “A Preliminary Investigation of Form and Motion
Acuity at Low Level of Illumination,” Journal of Experimental Psychology (34),1944, pp. 437-449.
IX. ABOUT THE AUTHORPing Zhang is an assistant professor at the School of Information Studies,
Syracuse University. She has published papers in the areas of information visuali-
zation, human information interaction and user interface studies, computer simula-
tion, and technology-assisted education. Her research has appeared in Decision

Journal of the Association for Information Systems 28
Support Systems, IEEE Computer Graphics and Applications, Simulation, Journal
of Education for MIS, and Journal of Research on Computing in Education. She
received the Best Paper award from the International Academy for Information
Management and the Excellence in Teaching award from the University of Texas
at Austin. Dr. Zhang has a Ph.D. in Information Systems from the University of
Texas at Austin and an M.Sc. and B.Sc. in Computer Science from Peking
University, Beijing, China.
Copyright © 2000, by the Association for Information Systems. Permission to make digital or hard copies of allor part of this work for personal or classroom use is granted without fee provided that copies are not made ordistributed for profit or commercial advantage and that copies bear this notice and full citation on the first page.Copyright for components of this work owned by others than the Association for Information Systems must behonored. Abstracting with credit is permitted. To copy otherwise, to republish, to post on servers, or toredistribute to lists requires prior specific permission and/or fee. Request permission to publish from: AISAdministrative Office, PO Box 2712 Atlanta, GA, 30301-2712 Attn: Reprints or via e-mail from [email protected].

EDITORPhillip Ein-Dor
Tel Aviv University
AIS SENIOR EDITORIAL BOARD
Henry C. Lucas. Jr.Editor-in-ChiefNew York University
Paul GrayEditor, CAISClaremont Graduate University
Phillip Ein-DorEditor, JAISTel-Aviv University
Edward A. StohrEditor-at-LargeNew York University
Blake IvesEditor, Electronic PublicationsLouisiana State University
Reagan RamsowerEditor, ISWorld NetBaylor University
JAIS ADVISORY BOARD
Izak BenbasatUniversity of BritishColumbia, Canada
Niels Bjørn-AndersenCopenhagen Business School,Denmark
Gerardine DeSanctisDuke University, USA
Robert GalliersUniversity of Warwick, UK
Sirkka JarvenpaaUniversity of Texas at Austin,USA
John L. KingUniversity of Michigan,USA
Edgar SibleyGeorge Mason University,USA
Ron WeberUniversity of Queensland,Australia
Vladimir ZwassFairleigh-DickinsonUniversity, USA

JAIS EDITORIAL BOARD
Paul AlparPhillipps University,Germany
Richard J. Boland Jr.Case Western ReserveUniversity, USA
Claudio CiborraUniversity of Bologna, Italy
Roger ClarkeAustralian NationalUniversity, Australia
Joyce ElamFlorida InternationalUniversity, USA
Henrique FreitasUniversidade Federal doRio Grande do Sul, Brazil
John HendersonBoston University, USA
Rudy HirschheimUniversity of Houston, USA
Sid HuffWestern Ontario University,Canada
Magid IgbariaTel-Aviv University, Israel
Mathias JarkeUniversity of Aachen,Germany
Rob KauffmanUniversity of Minnesota,USA
Julie KendallRutgers University, USA
Rob KlingUniversity of Indiana, USA
Claudia LoebbeckeUniversity of Cologne,Germany
Stuart MadnickMassachusetts Institute ofTechnology, USA
Ryutaro ManabeByunkyo University, Japan
Tridas MukhopadhyayCarnegie-Mellon University,USA
Mike NewmanUniversity of Manchester,UK
Ojelanki K. NgwenyamaVirginia CommonwealthUniversity, USA
Markku SaaksjarviHelsinki School ofEconomics and BusinessAdministration, Finland
Christina SohNanyang TechnologicalUniversity, Singapore
Kar Tan TamHong Kong University ofScience and Technology,Hong Kong
Alex TuzihlinNew York University, USA
Rick WatsonGeorgia State University,USA
Peter WeillMelbourne Business School,Australia
Leslie WillcocksOxford University, UK
ADMINISTRATIVE PERSONNEL
Eph McLeanAIS, Executive DirectorGeorgia State University
Colleen BauderSubscriptions ManagerGeorgia State University
Reagan RamsowerPublisher, JAISBaylor University