Kinetics of Oxidation of Ethylamine, Ethanolamine and Benzylamine by Chloramine-T
Clemson UniversityTigerPrints
All Dissertations Dissertations
8-2014
THE EFFECTS OF AMINE STRUCTURE,CHLORAMINE SPECIES AND OXIDATIONSTRATEGIES ON THE FORMATION OF N-NITROSODIMETHYLAMINEMERIC SELBESClemson University, [email protected]
Follow this and additional works at: https://tigerprints.clemson.edu/all_dissertations
Part of the Environmental Engineering Commons
This Dissertation is brought to you for free and open access by the Dissertations at TigerPrints. It has been accepted for inclusion in All Dissertations byan authorized administrator of TigerPrints. For more information, please contact [email protected].
Recommended CitationSELBES, MERIC, "THE EFFECTS OF AMINE STRUCTURE, CHLORAMINE SPECIES AND OXIDATION STRATEGIES ONTHE FORMATION OF N-NITROSODIMETHYLAMINE" (2014). All Dissertations. 1316.https://tigerprints.clemson.edu/all_dissertations/1316
THE EFFECTS OF AMINE STRUCTURE,
CHLORAMINE SPECIES AND OXIDATION STRATEGIES
ON THE FORMATION OF N-NITROSODIMETHYLAMINE
A Thesis
Presented to
the Graduate School of
Clemson University
In Partial Fulfillment
of the Requirements for the Degree
Doctor of Philosophy
Environmental Engineering and Earth Sciences
by
Meric Selbes
August 2014
Accepted by:
Tanju Karanfil Ph.D., P.E., BCEE
Cindy Lee Ph.D.
David L. Freedman Ph.D., BCEEM
David A. Ladner Ph.D.
ii
ABSTRACT
To comply with the increasingly stringent disinfection by-product (DBP)
regulations in the United States, many water treatment plants have been switching from
chlorination to chloramination in the last decade. Although chloramination reduces the
formation of regulated DBPs such as trihalomethanes and haloacetic acids, it causes the
formation of nitrosamines. Nitrosamines are a class of compounds that are probable
human carcinogens, mutagens and teratogens at concentrations as low as 0.2 ng/L. In
particular, N-nitrosodimethylamine (NDMA) is the most frequently detected nitrosamine
in distribution systems in the United States. Although, nitrosamines are currently not
regulated by the USEPA, they have been recently identified as a group of contaminants
highlighted for possible regulatory action.
Although several studies have investigated the formation mechanisms and
important precursors for nitrosamines (especially NDMA), there is still much more to
learn about their formation pathways. The main objective of this research was to
systematically examine nitrosamines formation from amines to gain insight into the
formation mechanisms of nitrosamines (especially NDMA) and examine the interactions
of these precursors with different oxidants. Specifically, the research focused on: (i) the
formation potential of nitrosamines from amino acids (AAs) under different disinfection
conditions, (ii) the roles of tertiary structure on the formation of NDMA during
chloramination, (iii) the importance of chloramine species in the NDMA formation, and
iii
(iv) the interaction of various precursors with different oxidants (chlorine, chlorine
dioxide and ozone) and their consequent effect on NDMA formation.
The research approach consists of three phases. First phase consisted of
identifying the important nitrosamine precursors and understanding the effect of
precursor structure on the conversion yield. Primary and tertiary amines were selected as
the target compounds and results are presented in Chapters V and VI. Then in the second
phase the roles of chloramine species in NDMA formation was examined as presented in
Chapter VII. Finally, controlling NDMA formation, practically as critical as
understanding the fundamentals of those reactions, was investigated using different
oxidants in Chapter VIII.
AAs were selected initially as nitrosamine precursors since they are rich in
nitrogen, reactive and shown to form of other classes of DBPs (trihalomethanes,
halonitromethanes, etc.). Nine AAs (alanine, aspartic acid, cysteine, glutamic acid,
glycine, lysine, histidine, proline and serine) were selected based on their structures (i.e.,
acidity vs. basic, polar vs. nonpolar, hydrophilic vs. hydrophobic), and tested under
different oxidation conditions for their formation of nitrosamines. NDMA yields of all
nine AAs during chloramination were below the minimum reporting levels. However,
during ozonation alone and ozonation followed by chloramination, the formation of
several nitrosamines (including N-nitrosopyrrolidine and N-nitroso-di-n-butylamine) at
very low molar conversion yields (<0.1%) was found. Although AAs are known to form
different nitrogenous DBPs (i.e., halonitromethanes, haloacetonitriles), they did not
appear to be an important contributor to nitrosamines formation.

iv
Due to very low conversion yields of nitrosamines, the research focus was
directed towards tertiary amines which are more reactive nitrosamine precursors. Since,
NDMA is the most frequently detected nitrosamine, potential NDMA precursors were
selected for further investigation. The effect of tertiary amine structure and the
influencing factors in NDMA formation were examined under chloramination conditions.
Dimethylamine (DMA) and 20 different tertiary aliphatic and aromatic amines were
carefully examined based on their functional groups attached to the basic DMA structure.
The results indicated a wide range (0.02% to 83.9%) of NDMA yields indicating the
importance of the structure of tertiary amines, and both stability and electron distribution
of the leaving group of tertiary amines on NDMA formation. DMA associated with
branched alkyl groups or benzyl like structures having only one carbon between the ring
and DMA structure consistently gave higher NDMA yields. Compounds with electron
withdrawing groups (EWG) reacted preferentially with monochloramine, whereas
compounds with electron donating groups (EDG) showed a tendency to react with
dichloramine to form NDMA. When the selected amines were present in natural organic
matter (NOM) solutions, NDMA formation increased for compounds with EWG while it
decreased for compounds with EDG. This impact was attributed to the competitions
between NOM and amines for chloramine species.
After the identification of high yielding NDMA precursors, it was essential to
understand the role of chloramine species in NDMA formation. The role of chloramine
species in NDMA formation rate was evaluated for five amines carefully selected based
on their chemical structures and exposed to varying levels of chloramine with different
v
ratios of mono/dichloramine. Amines (e.g., ranitidine) that prefer monochloramine
reacted relatively fast to form NDMA and reached the maximum yield within 24 hours.
On the other hand, the NDMA formation from amines (e.g., DMA) that prefer
dichloramine was relatively slow. These reactions were limited to the decomposition of
monochloramine to dichloramine. For dichloramine-sensitive amines, the presence of
NOM decreased the NDMA formation rate due to competition with dichloramine;
however, the NDMA formation rate increased in the presence of sulfate. In addition, pH
played an important role in both chloramine and amine speciation. On the other hand, for
ranitidine which is a monochloramine-sensitive amine, NOM, sulfate, and pH were less
critical. In selected natural waters, dichloramine was the dominant species responsible for
NDMA formation, while some NDMA formation by monochloramine was also observed.
In the last section, pre-oxidation was investigated as a control technique to
minimize NDMA formation. The interaction of NDMA precursors with different
oxidants (chlorine, chlorine dioxide and ozone) prior to chloramination was investigated
under typical conditions used in drinking water treatment plants. Fifteen model
precursors with NDMA molar yields ranging from approximately 0.1% to 90% were
examined. Pre-chlorination reduced NDMA formation from most precursors by 10% to
50% except quaternary amine polymers. Pre-oxidation with chlorine dioxide and ozone
achieved the same or higher deactivation of NDMA precursors (e.g., ranitidine) while
increasing NDMA formation for some other precursors (e.g., daminozid). The increases
with chlorine dioxide exposure were attributed to the release of oxidation products with a
DMA moiety, which may form more NDMA upon chloramination than the unoxidizied
vi
parent compound. On the other hand, chlorine dioxide was effective, if a precursor’s
NDMA yield were higher than DMA (i.e., without pre-oxidation). The ozone-triggered
increases could be related to direct NDMA formation from DMA which was released by
ozonation of amines with DMA moiety, amides or hydrazines. However, hydroxyl
radicals formed from the decomposition of ozone would be also involved in
decomposition of formed NDMA, reducing the overall NDMA levels at longer contact
times. pH conditions significantly influenced the effectiveness of deactivation of
precursors depending on the type of precursors and oxidants.
For practical applications, the key findings from this study are: (i) the structure of
precursor’s have a drastic effect on the NDMA formation yield. DMA moieties
associated with branched alkyls or benzyl like groups had very high NDMA formation
yields (>25%). Especially, strategies for controlling the discharge of those types of
contaminants would lead to decreases in NDMA precursor’s levels in source waters. (ii)
The precursor’s structure also influences the chloramine species (mono- vs. di-)
responsible for NDMA formation. The dominant chloramine species responsible for
NDMA formation was found as dichloramine in selected natural waters. The utilities may
opt to minimize the formation of dichloramine in their distribution systems (e.g.,
maintaining higher pH) to control NDMA formation. However, it should be noted that
some NDMA formation may still be observed due to monochloramine. (iii) Pre-oxidation
strategies can be an effective method for utilities to control NDMA formation as long as
the formation of regulated DBPs (trihalomethanes, haloacetic acids, chlorite and bromate)
are within the allowable limits. Chlorine has shown reduction in NDMA formation for
vii
most of the precursors (except polymers). On the other hand, chlorine dioxide and ozone
may lead to decreases or increases in NDMA formation depending on the characteristics
of the precursors. Preliminary testing is suggested for utilities for selecting the
appropriate oxidant type, to optimum dose and contact times for controlling NDMA
formation.
viii
DEDICATION
I would like to dedicate this thesis to my parents,
Hilmi & Fügen Selbes
my relatives and all friends for their continuous
love and support.
ix
ACKNOWLEDGMENTS
I would like to thank my advisor, Dr. Karanfil for all that he has taught me. This
work could not have been accomplished without his invaluable encouragement, support
and insightful instructions. I would also like to thank Dr. Cindy Lee, Dr. David A.
Ladner, and Dr. David L. Freedman for devoting time to serve in my research committee.
I would like to thank my parents, Hilmi and Fügen Selbes, my brother and sister-in-law,
Tunca and Sanem Selbes, and to my all other relatives, for all their love and support.
Many thanks to all my friends in the lab, especially the folks of Dr. Karanfil research
group.
I greatly appreciate the financial support for this research from the National
Science Foundation (CBET 1066567). I am also thankful to the drinking water and
wastewater utilities for their assistance in sampling events.
I would like to acknowledge Dr. Sule Kaplan Bekaroglu and Dr. Amer Kanan for
instructing me in the lab techniques, and Dr. Daekyun Kim, Dr. Nuray Ates, and Dr.
Junhong Shan for their vital insights regarding my study. I appreciate Anne Cummings
for trouble shooting GC-MS/MS. Without her help, I would not have been able to finish
all the nitrosamine analysis. Also, thanks to Dr. Ozge Yilmaz and Nicholas Ryan Moser
for their continuous support.
x
TABLE OF CONTENTS
Page
TITLE PAGE ....................................................................................................................... i
ABSTRACT ........................................................................................................................ ii
DEDICATION ................................................................................................................. viii
ACKNOWLEDGMENTS ................................................................................................. ix
TABLE OF CONTENTS .....................................................................................................x
LIST OF TABLES ........................................................................................................... xiii
LIST OF FIGURES ......................................................................................................... xiv
LIST OF ABBREVIATIONS .......................................................................................... xix
CHAPTER
I. INTRODUCTION ...................................................................................................1
II. LITERATURE REVIEW ........................................................................................7
Occurrence of Nitrosamines ....................................................................................7
Formation of Nitrosamines ....................................................................................10 Factors Affecting Nitrosamine Formation .............................................................17
Precursors of Nitrosamines ....................................................................................19 Removal of Nitrosamines and Their Precursors ....................................................24
III. OBJECTIVES, APPROACHES, AND EXPERIMENTAL DESIGN ..................28
Objectives ..............................................................................................................28
Approaches and Experimental Designs .................................................................29
IV. MATERIALS AND METHODS ...........................................................................34
Glassware, Reagent Water, & Chemical Reagents ................................................34 Model Precursors ...................................................................................................35 Natural Water Samples Collection and Preservation .............................................35
xi
Table of Contents (Continued)
Page
Formation Potential Tests ......................................................................................36 Chlorine and Chloramine Production ....................................................................37 Ozone Production...................................................................................................37
Chlorine Dioxide Production .................................................................................38 Analytical Methods ................................................................................................38
Oxidant Concentration Measurements ...................................................................40 Nitrosamine Measurements ...................................................................................41 Dissolved Organic Carbon and Dissolved Nitrogen Measurement .......................45 Ammonia Measurement .........................................................................................45
UV254 Absorbance ..................................................................................................45 pH ...........................................................................................................................46
Bromide, Nitrite, Nitrate and Sulfate Measurements.............................................46 Dissolved Organic Nitrogen Determination ..........................................................46
V. NITROSAMINES FORMATION FROM AMINOACIDS ..................................47
Introduction and Objective ....................................................................................47 Materials and Methods ...........................................................................................49
Results and Discussion ..........................................................................................53 Conclusions ............................................................................................................55
VI. THE ROLES OF TERTIARY AMINE STRUCTURE,
BACKGROUND ORGANIC MATTER AND CHLORAMINE
SPECIES ON NDMA FORMATION ...................................................................56
Introduction and Objective ....................................................................................56
Materials and Methods ...........................................................................................59 Results and Discussion ..........................................................................................64 Conclusions ............................................................................................................83
VII. THE ROLE OF CHLORAMINE SPECIES IN NDMA FORMATION ...............84
Introduction and Objective ....................................................................................84 Materials and Methods ...........................................................................................87 Results and Discussion ..........................................................................................91
Conclusions ..........................................................................................................117
xii
Table of Contents (Continued)
Page
VIII. THE EFFECT OF PRE-OXIDATION ON OVERALL NDMA
FORMATION, AND THE INFLUENCE OF PH ...............................................119
Introduction and Objective ..................................................................................119
Materials and Methods .........................................................................................122 Results and Discussion ........................................................................................129
Conclusions ..........................................................................................................148
IX. CONCLUSIONS AND RECOMMENDATIONS ..............................................150
Conclusions ..........................................................................................................150 Recommendations for Practical Applications ......................................................153
Recommendations for Future Research ...............................................................155
APPENDICES .................................................................................................................156
Appendix A ..........................................................................................................157 Appendix B ..........................................................................................................161
Appendix C ..........................................................................................................162 Appendix D ..........................................................................................................165
Appendix E ..........................................................................................................168 Appendix F...........................................................................................................170
REFERENCES ................................................................................................................174
xiii
LIST OF TABLES
Page
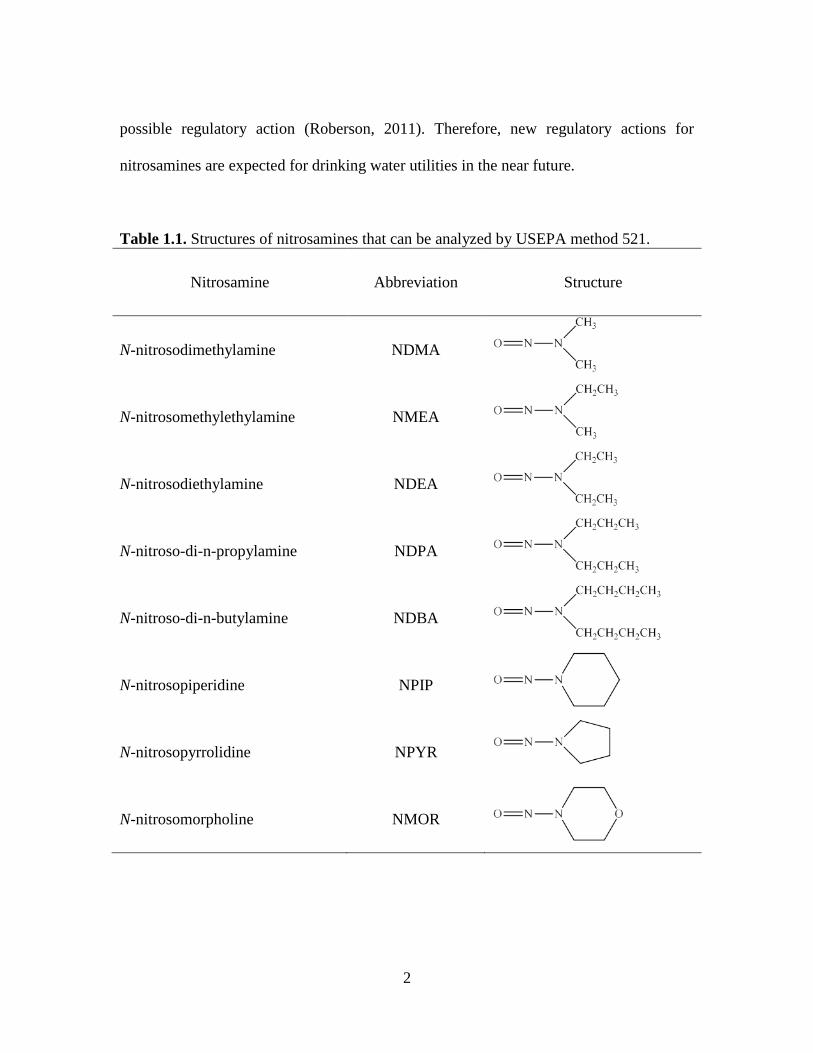
Table 1.1. Structures of nitrosamines that can be analyzed by USEPA method
521............................................................................................................................2
Table 4.1. Analytical methods and minimum reporting levels. ........................................39
Table 4.2. Detection information of nitrosamines on GC-MS/MS. ..................................43
Table 4.3. DLs and MRLs of nitrosamines established at 5 ppt in DDW. ........................44
Table 4.4. Spike recoveries of nitrosamines in high and low SUVA
background solutions. ............................................................................................44
Table 5.1. AAs selected for this study and their properties (Lide, 1991). .......................50
Table 5.2. Nitrosamine FPs of AAs tested in this study. ..................................................54
Table 6.1. Selected characteristics of solutions used for NOM experiments ....................61
Table 6.2. Molar yields of NDMA from selected compounds in this study and
in selected studies. .................................................................................................65
Table 6.3. Experimental conditions of used in this study and the literature. ....................66
Table 7.1. Selected water quality parameters of the natural water samples. .....................89
Table 7.2. NDMA formation (ng/L) over time from selected DWTP. ...........................112
Table 7.3. NDMA formation (ng/L) over time from selected watershed. ......................113
Table 8.1. Pre-oxidation contact times with Cl2, ClO2, and O3.......................................126
Table 8.2. Molar NDMA yields of selected precursors after pre-oxidation
under different pH conditions (Pre-oxidant T/TMax = 0.2). ..................................146
xiv
LIST OF FIGURES
Page
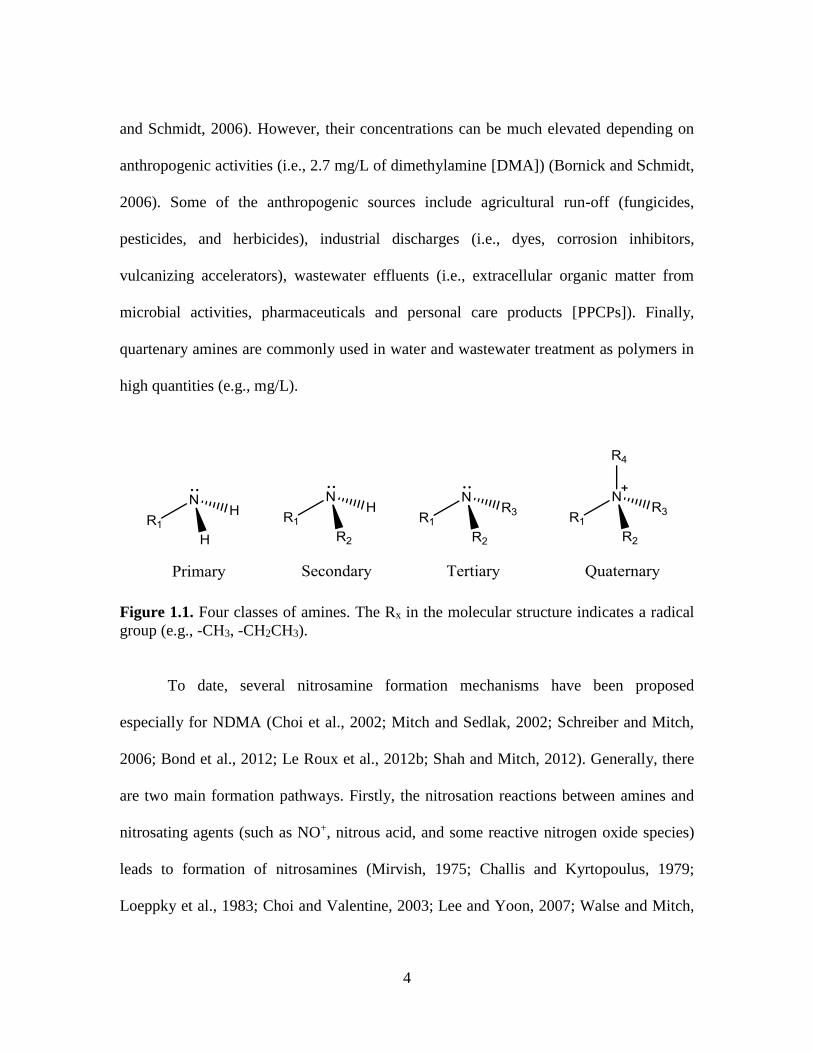
Figure 1.1. Four classes of amines. The Rx in the molecular structure
indicates a radical group (e.g., -CH3, -CH2CH3). .....................................................4
Figure 2.1. Initially proposed NDMA formation mechanism by Mitch et al.
(2003a). ..................................................................................................................10
Figure 2.2. Revised NDMA formation mechanism by Mitch et al. (2006). The
Rx in the molecular structure of a tertiary amine indicates the radical
group (e.g., -CH3, -CH2CH3). ................................................................................11
Figure 2.3. NDMA formation pathway from ranitidine during chloramination
(Le Roux et al., 2012b). .........................................................................................13
Figure 2.4. NDMA formation mechanism through nitrosation during
chlorination in the presence of nitrite (pH≈3.4) (Choi and Valentine,
2003). .....................................................................................................................14
Figure 2.5. NDMA formation (A) nitrosation during ozonation (pH≈3.4), and
(B) unknown pathway (pH>7). ..............................................................................15
Figure 2.6. NDMA formation from (A) UDMH, and (B) UDMH-like
functional groups during ozonation. ......................................................................16
Figure 2.7. NDMA formation from PolyDADMAC during ozonation (Padhye
et al., 2011a). ..........................................................................................................16
Figure 3.1. Experiments conducted for Objective 1. ........................................................29
Figure 3.2. Experiments conducted for Objective 2. ........................................................30
Figure 3.3. Experiments conducted for Objective 3. ........................................................32
Figure 3.4. Experiments conducted for Objective 4. ........................................................33
Figure 5.1. NPYR formation from proline. .......................................................................55
Figure 6.1. Molecular structures of selected amines .........................................................60
xv
List of Figures (Continued)
Page
Figure 6.2. The effect of chain length (attached to DMA moiety) on NDMA
formation. Error bars represent data range for duplicate samples. ........................67
Figure 6.3. The effect of branched groups (attached to DMA moiety) on
NDMA formation. Error bars represent data range for duplicate
samples. ..................................................................................................................68
Figure 6.4. NDMA formation from DMEA and TMA and their derivatives.
Error bars represent data range for duplicate samples. ..........................................69
Figure 6.5. The effect of distance of the benzene ring (attached to DMA
moiety) on NDMA formation. Error bars represent data range for
duplicate samples. ..................................................................................................71
Figure 6.6. The effect of heteroatom in the benzyl group (attached to DMA
moiety) on NDMA formation. Error bars represent data range for
duplicate samples. ..................................................................................................71
Figure 6.7. NDMA formation from DMAN and its derivatives. Error bars
represent data range for duplicate samples. ...........................................................72
Figure 6.8. NDMA FPs for DMA and tertiary amines in DDW, M-B TPH and
M-B HPO solutions. (A) Aliphatic amines with different chain lengths
and branches. (B) DMEA and its derivatives and TMA and its
derivative. Error bars represent data range for duplicate samples. ........................76
Figure 6.9. NDMA FPs for DMA and tertiary amines in DDW, M-B TPH and
M-B HPO solutions. (A) Aromatic amines for comparison of distance
of carbon ring and presence of heteroatom in carbon ring. (B) DMAN
and its derivatives. Error bars represent data range for duplicate
samples. ..................................................................................................................77
Figure 6.10. NDMA molar conversion of selected amines in DDW, M-B
Treated and M-B Raw background solutions. Error bars represent data
range for duplicate samples. ..................................................................................78
Figure 6.11. NDMA formations from selected compounds reacted with
monochloramine in the presence of excess ammonia and with mixture
of mono- and dichloramine under regular chloramination conditions.
Error bars represent data range for duplicate samples. ..........................................81
xvi
List of Figures (Continued)
Page
Figure 6.12. Schematic diagram depicting interaction of tertiary amine with
chloramine followed by end products such as carbocation and NDMA. ..............82
Figure 7.1. Molecular structures of selected amines. ........................................................87
Figure 7.2. NDMA formation from DMA tested under three chloramination
conditions: FP, SDS, and SDS in the presence of excess ammonia.
Error bars represent data range for duplicate samples. ..........................................92
Figure 7.3. NDMA formation from TMA tested under three chloramination
conditions: FP, SDS, and SDS in the presence of excess ammonia.
Error bars represent data range for duplicate samples. ..........................................94
Figure 7.4. NDMA formation from DMiPA tested under three chloramination
conditions: FP, SDS, and SDS in the presence of excess ammonia.
Error bars represent data range for duplicate samples. ..........................................94
Figure 7.5. NDMA formation from DMBzA tested under three
chloramination conditions: FP, SDS, and SDS in the presence of
excess ammonia. Error bars represent data range for duplicate samples. ..............95
Figure 7.6. NDMA formation from RNTD tested under three chloramination
conditions: FP, SDS, and SDS in the presence of excess ammonia.
Error bars represent data range for duplicate samples. ..........................................97
Figure 7.7. The effect of NOM in NDMA formation from RNTD under SDS
conditions. Background solutions for (A) were obtained by diluting
CH treated water to DOC levels of 1.0 and 2.5 mg C/L. Background
solutions for (B) were obtained by diluting CH raw water to DOC
levels of 1.0, 2.5, and 5.0 mg C/L. Error bars represent data range for
duplicate samples. ................................................................................................100
Figure 7.8. The effect of NOM in NDMA formation from DMiPA under SDS
conditions. Background solutions for (A) were obtained by diluting
CH treated water to DOC levels of 1.0 and 2.5 mg C/L. Background
solutions for (B) were obtained by diluting CH raw water to DOC
levels of 1.0, 2.5, and 5.0 mg C/L. Error bars represent data range for
duplicate samples. ................................................................................................103
xvii
List of Figures (Continued)
Page
Figure 7.9. The effect of pH in NDMA formation from (A) RNTD and (B)
DMiPA under SDS conditions. Error bars represent data range for
duplicate samples. ................................................................................................106
Figure 7.10. The effect of sulfate in NDMA formation from (A) RNTD and
(B) DMiPA under SDS conditions. Error bars represent data range for
duplicate samples. ................................................................................................109
Figure 7.11. NDMA formation from wastewater under different dilution
ratios. Error bars represent data range for duplicate samples. .............................114
Figure 7.12. The effect of sulfate in NDMA formation under SDS conditions
from downstream sample collected from the wastewater impacted
watershed. Error bars represent data range for duplicate samples. ......................116
Figure 7.13. The effect of pH in NDMA formation under SDS conditions
from downstream sample collected from the wastewater impacted
watershed. Error bars represent data range for duplicate samples. ......................116
Figure 8.1. Molecular structures of selected precursors. ................................................123
Figure 8.2. NDMA formation from (A) PolyDADMAC, (B) PolyAMINE,
and (C) PolyACRYL as a function of polymer dose. ..........................................125
Figure 8.3. Effect of 5 minute purging on selected amines and their
consequent NDMA FPs. Reported values are average of two
measurements (n=2). ............................................................................................126
Figure 8.4. NDMA formation from selected precursors upon pre-oxidation
with chlorine, followed by chloramine disinfection for different pre-
oxidation contact times. [Precursor]0 = 160 nM, [Cl2]0 = 3 mg/L, pHPre-
oxidation = 7.5 (2 mM phosphate buffer), pHFP = 7.5 (10 mM phosphate
buffer). Time = 0 min shows no pre-oxidation. Error bars represent
data range for duplicate samples. .........................................................................132
Figure 8.5. NDMA formation from selected polymers upon pre-oxidation
with (A) chlorine, (B) chlorine dioxide, and (C) ozone followed by
chloramine disinfection for different pre-oxidation contact times.
[PolyDADMAC]0 = 0.2 mg/L, [PolyAMINE]0 = 0.2 mg/L,
[PolyACRYL]0 = 1.0 mg/L. T/TMAX = 0 shows no pre-oxidation. Error
bars represent data range for duplicate samples. .................................................133
xviii
List of Figures (Continued)
Page
Figure 8.6. NDMA formation from selected precursors upon pre-oxidation
with chlorine dioxide followed by chloramine disinfection for different
pre-oxidation contact times. [Precursor]0 = 160 nM, [Cl2]0 = 3 mg/L,
pHPre-oxidation = 7.5 (2 mM phosphate buffer), pHFP = 7.5 (10 mM
phosphate buffer). Time = 0 min shows no pre-oxidation. Error bars
represent data range for duplicate samples. .........................................................135
Figure 8.7. NDMA formation from selected precursors upon pre-oxidation
with ozone followed by chloramine disinfection for different pre-
oxidation contact times. [Precursor]0 = 160 nM, [Cl2]0 = 3 mg/L, pHPre-
oxidation = 7.5 (2 mM phosphate buffer), pHFP = 7.5 (10 mM phosphate
buffer). Time = 0 min shows no pre-oxidation. Error bars represent
data range for duplicate samples. .........................................................................139
Figure 8.8. Effect of ozone versus hydroxyl radicals on NDMA
decomposition. [NDMA]0 = 200 ng/L, [O3]0 = 3 mg/L, [tBA] = 1 mM,
phosphate buffer of 10 mM at pH 7.5 or 9.5. Time = 0 min shows no
pre-oxidation. Error bars represent data range for duplicate samples. ................141
Figure 8.9. Reaction of tertiary amines with ozone and hydroxyl radicals. ...................142
xix
LIST OF ABBREVIATIONS
2-Cl-DMAN 2-Chloro-N,N-dimethyl-aniline
2-DMAP 2-Dimethyl-aminopyridine
4-DMAP 4-Dimehtyl-aminopyridine
AA Amino Acid
CCL3 Contaminant Candidate List 3
C-DBP Carbonaceous Disinfection By-Product
CH Charleston Drinking Water Treatment Plant Water Source
CI Chemical Ionization
Cl-DMA Chlorinated Dimethylamine
Cl-UDMH Chlorinated Unsymmetrical Dimethylhydrazine
CT Concentration × Time
DBP Disinfection By-Product
DCM Dichloromethane
DDW Distilled Deionized Water
DL Detection Limit
DMA Dimethylamine
DMAAcCN Dimethyl-aminoacetonitrile
DMAFuOH 5-Dimethylaminomethyl-furfurylalcohol
DMAN N,N-Dimethylaniline
xx
DMAPhOH 3-Dimethylamino-phenol
DMBA N,N-Dimethyl-butylamine
DMBzA N,N-Dimethyl-benzylamine
DMEA N,N-Dimethyl-ethylamine
DMEDA N,N-Dimethyl-ethyleneamine
DMEtOH 2-Dimethyl-aminoethanol
DMEtSH 2-Dimethyl-amoniethanethiol
DMiPA N,N-Dimethyl-isopropylamine
DMNZD Daminozid
DMPhA N,N-Dimethyl-phenetylamine
DMPMA N,N-Dimethyl-1-(1H-pyrrol-2-yl)methanamine
DMS N,N-Dimethylsulfamide
DMtBA N,N-Dimethyl-tert-butylamine
DMTMA N,N-Dimethylthiophene-2-methylamine
DN Dissolved Nitrogen
DOC Dissolved Organic Carbon
DON Dissolved Organic Nitrogen
DPD N,N-diethyl-p-phenylenediamine
DRN Diuron
DWTP Drinking Water Treatment Plant
EDG Electron-Donating Group
EWG Electron-Withdrawing Group
xxi
FAS Ferrous Ammonium Sulfate
FP Formation Potential
GAC Granular Activated Carbon
GC Gas Chromatogram
HAA Haloacetic Acids
HAN Haloacetonitriles
HPO Hydrophobic
LW Lake Water
MB Methylene Blue
M-B Myrtle Beach Drinking Water Treatment Plant Water Source
MIEX® Magnetic Ion Exchange Resin
MRL Minimum Reporting Level
MS Mass Spectrometer
NA Not Applicable
NDBA N-nitroso-di-n-butylamine
N-DBP Nitrogenous Disinfection By-Product
NDEA N-nitrosodiethylamine
NDMA N-nitrosodimethylamine
NDPA N-nitroso-di-n-propylamine
NDPhA N-nitrosodiphenylamine
NMEA N-nitrosomethylethylamine
NMOR N-nitrosomorpholine
xxii
NOM Natural Organic Matter
NPIP N-nitrosopiperidine
NPYR N-nitrosopyrrolidine
PAC Powdered Activated Carbon
PDS Primary Diluted Stock
PolyACRYL DMA-based polyacrylamide
PolyAMINE Poly(dimethylamine-co-epichlorohydrin), quartenized
PolyDADMAC Poly(diallyldimethylammonium chloride)
PPCP Pharmaceutical and Personal Care Product
RNTD Ranitidine
RW River Water
SDS Simulated Distribution System
SDWA Safe Drinking Water Act
SM Standard Method
SPE Solid Phase Extraction
SUVA254 Specific Ultraviolet light at 254 nanometer wavelength
tBA tert-butyl alcohol
THM Trihalomethanes
TMA Trimethylamine
TPH Transphilic
TW Tap Water
UCMR2 Unregulated Contaminant Monitoring Rule 2
xxiii
UDMH Unsymmetrical Dimethyl Hydrazine
USEPA United States Environmental Protection Agency
UV Ultraviolet light
UV254 Ultraviolet light at 254 nanometer wavelength
WWTP Wastewater Treatment Plant
1
CHAPTER ONE
1. INTRODUCTION
Chloramination is often used to replace chlorination in order to reduce the
formation of regulated disinfection by-products (DBPs) such as trihalomethanes (THMs)
and haloacetic acids (HAAs). Unfortunately, chloramination can lead to formation of
nitrosamines (Table 1.1), a class of compounds which are probable human carcinogens,
mutagens, and teratogens (USEPA, 1993). Although nitrosamines can pose important
health risks even at ng/L concentrations (USEPA, 1993), they have not been regulated by
the United States Environmental Protection Agency (USEPA). Nevertheless, five
nitrosamines such as N-nitrosodimethylamine (NDMA), N-nitrosopyrrolidine (NPYR),
N-nitrosodiethylamine (NDEA), N-nitrosomethylethylamine (NMEA), N-nitrosodi-n-
propylamine (NDPA), and N-nitrosodi-n-butylamine (NDBA) are covered by the
Unregulated Contaminant Monitoring Rule 2 (UCMR 2) (USEPA, 2006), and NDMA,
NDEA, NDPA, NPYR, and N-nitrosodiphenylamine (NDPhA) included in the
Contaminant Candidate List 3 (CCL 3) (USEPA, 2009). The Department of Health
Service in California and the Massachusetts Department of Environmental Protection has
implemented an action level of 10 ng/L (MassDEP, 2004; OEHHA, 2006), and the
Ontario Ministry of the Environment and Climate Change established a maximum
allowable concentration of 9 ng/L for NDMA (MOE, 2003). Recently, USEPA has
identified nitrosamines as one of three potential groups of contaminants highlighted for
2
possible regulatory action (Roberson, 2011). Therefore, new regulatory actions for
nitrosamines are expected for drinking water utilities in the near future.
Table 1.1. Structures of nitrosamines that can be analyzed by USEPA method 521.
Nitrosamine Abbreviation Structure
N-nitrosodimethylamine NDMA
N-nitrosomethylethylamine NMEA
N-nitrosodiethylamine NDEA
N-nitroso-di-n-propylamine NDPA
N-nitroso-di-n-butylamine NDBA
N-nitrosopiperidine NPIP
N-nitrosopyrrolidine NPYR
N-nitrosomorpholine NMOR

3
The analysis of nitrosamine data from samples collected under UCMR2 revealed
that NDMA was detected in United States drinking waters at concentrations > 2 ng/L in
10% of the samples surveyed, and 26% of systems detected NDMA in at least one sample
(Russell et al., 2012). However, other nitrosamines (e.g., NDEA, NDBA, NPYR, and
NMEA) were rarely detected at levels above their minimum reporting levels (MRLs) (2
ng/L). Systems with NDMA concentrations below the MRL used oxidants other than
chloramines as either a primary or a secondary disinfectant, and concentrations ranged
from 4 to 15 ng/L (the maximum NDMA concentration measured was 630 ng/L) (Russell
et al., 2012). Therefore, among nitrosamines, NDMA has drawn the most attention due to
its frequent detection in distribution systems that use chloramine as a disinfectant
(Russell et al., 2012).
It can be anticipated that nitrogenous organic compounds play a key role in the
formation of nitrosamines. Amines are a group of compounds present in natural, algae-
impacted and wastewater-impacted sources and rich in nitrogen content (Bornick and
Schmidt, 2006; Dotson and Westerhoff, 2009). These hydrophilic precursors persist
through conventional water treatment stages and are likely to be present prior to post-
oxidation. Amines are classified into four groups: primary, secondary, tertiary and
quaternary (Figure 1.1). Primary amines have been found in fresh waters in a wide
concentration range (5 to 2000 µg/L), in free amino acids (AAs), peptides, nucleic acids,
purines, pyrimidines, and proteins (Rice and Gomez-Taylor, 1986). Secondary and
tertiary amines are also found in water sources. Some of these are naturally occurring
amines and found at very low concentrations (i.e., 0.1 µg/L of dimethylamine) (Bornick
4
and Schmidt, 2006). However, their concentrations can be much elevated depending on
anthropogenic activities (i.e., 2.7 mg/L of dimethylamine [DMA]) (Bornick and Schmidt,
2006). Some of the anthropogenic sources include agricultural run-off (fungicides,
pesticides, and herbicides), industrial discharges (i.e., dyes, corrosion inhibitors,
vulcanizing accelerators), wastewater effluents (i.e., extracellular organic matter from
microbial activities, pharmaceuticals and personal care products [PPCPs]). Finally,
quartenary amines are commonly used in water and wastewater treatment as polymers in
high quantities (e.g., mg/L).
Figure 1.1. Four classes of amines. The Rx in the molecular structure indicates a radical
group (e.g., -CH3, -CH2CH3).
To date, several nitrosamine formation mechanisms have been proposed
especially for NDMA (Choi et al., 2002; Mitch and Sedlak, 2002; Schreiber and Mitch,
2006; Bond et al., 2012; Le Roux et al., 2012b; Shah and Mitch, 2012). Generally, there
are two main formation pathways. Firstly, the nitrosation reactions between amines and
nitrosating agents (such as NO+, nitrous acid, and some reactive nitrogen oxide species)
leads to formation of nitrosamines (Mirvish, 1975; Challis and Kyrtopoulus, 1979;
Loeppky et al., 1983; Choi and Valentine, 2003; Lee and Yoon, 2007; Walse and Mitch,
5
2008; Lv et al., 2009; Sun et al., 2011). The classic nitrosation mechanism usually
involves nitrite which participates in the formation of a nitrosating agent in acidic
solution or in the presence of hypochlorite (HOCl), carbonyl compounds, or sunlight. The
formation of nitrosamines during oxidation of amines mediated by ozone or potassium
permanganate are other nitrosation pathways, in which the nitrosating agent is generated
from the oxidation of amines (Andrzejewski and Nawrocki, 2007; Andrzejewski et al.,
2008; Yang et al., 2009; Padhye et al., 2011a). Secondly, an unsymmetrical
dimethylhydrazine (UDMH) mechanism was proposed to explain NDMA formation
during chloramination of DMA (Choi and Valentine, 2002; Mitch and Sedlak, 2002;
Schreiber and Mitch, 2005, 2006). In this proposed mechanism, a nucleophilic
substitution reaction between DMA and chloramine (NH2Cl or NHCl2) leads to formation
of an UDMH or chlorinated UDMH intermediate (Cl-UDMH), and the intermediate is
oxidized by dissolved oxygen to produce NDMA. However, further studies have shown
that chloramination of UDMH yielded much less NDMA (<0.1%) than DMAs yield (1-
3%) (Mitch et al., 2009). In addition, the presence of dichloramine has been shown to
enhance NDMA formation from DMA through the formation of a chlorinated UDMH
(Mitch et al., 2009). Regardless of the intermediates, some tertiary amines (such as
ranitidine and N,N-dimethylbenzylamine) have much higher NDMA yields (i.e., >60%)
as compared to DMA or UDMH (i.e., <3%) (Mitch et al., 2009; Kemper et al., 2010;
Shen and Andrews, 2011a,b; Le Roux et al., 2011, 2012b). To explain the high formation
yield of NDMA from ranitidine during chloramination, Le Roux et al. (2012b)
hypothesized that a methylfuran moiety of ranitidine undergoes decomposition to
6
generate a carbocation which they supported by identifying several intermediates using
an HPLC-MS technique. However, so far the formation mechanism of NDMA from
amines during chloramination has not been fully explained.
Although, several studies investigated the formation mechanisms and important
precursors for nitrosamines (especially NDMA), there is much more to learn about their
formation pathways. Questions on what kind of amines lead to nitrosamine formation,
what kind of relationship exists between the structure and reactivity of tertiary amines,
why some tertiary amines have rather high NDMA yields, and what is the interaction of
amines with different oxidants (including chloramine) have not been elucidated yet. The
main objective of this study was to gain insight to the potential precursors’ formation
mechanisms of nitrosamines, especially NDMA. Specifically, the research focused on: (i)
the formation potential of nitrosamines from AAs under different disinfection conditions,
(ii) the roles of tertiary structure on the formation of NDMA during chloramination, (iii)
the importance of chloramine species in the conversion reactions, and (iv) the interaction
of these precursors with different oxidants (chlorine, chlorine dioxide and ozone) and
their consequent effect on NDMA formation.
7
CHAPTER TWO
2. LITERATURE REVIEW
Occurrence of Nitrosamines
NDMA, a species of nitrosamines, is a semi-volatile organic chemical. It is highly
toxic and is an industrial by-product and a probable human carcinogen. NDMA is used as
an industrial solvent, an anti-oxidant, a rubber accelerator and an initiator or plasticizer
(ALS, 2012). In addition, the compound has been used in the production of rocket fuel, as
biocide for nematodes and an intermediate for 1,1-dimethylhydrazine to inhibit
nitrification of soils (ALS, 2012). NDMA is also present in a variety of foods: cured
meats, fried bacon, marine products, flour and grain products, dairy and cheese products,
and alcoholic beverages including beer and whiskey (Tricker and Preussmann, 1991).
The occurrence of NDMA in drinking water was initially identified in the 1980s
and 1990s in Ontario, Canada (Munoz and Sonntag, 2000). Possible sources of NDMA
were thought to be anthropogenic contaminants mentioned above and microbiological
transformation of those precursors or partial oxidation of hydrazines (Kim and Choi,
2002). For instance, NDMA has been detected at very high concentrations (3,000 ng/L)
in a ground water near rocket engine testing facilities in Sacramento, California, and also
downgradient of drinking water wells, especially in locations where wastewater effluent
was used for aquifer recharge (Mitch et al., 2003a,b, 2009).
8
A survey by the California Department of Health Services demonstrated that
NDMA occurrence was not limited to regions proximal to facilities that used rocket
engine sites or UDMH-based fuels (CDPH, 2013), but also found that NDMA formed as
a by-product of chlorine or chloramine disinfection of water and wastewater. Especially
in locations where chlorinated wastewater effluent was reused, NDMA was detected at
elevated concentrations (i.e., >100 ng/L) (Mitch et al., 2003a,b).
In 1996 the Safe Drinking Water Act (SDWA) amendment required that USEPA
provide a new list of unregulated contaminants once every five years to be monitored in
public water systems. Selected contaminants are known or anticipated to occur in public
water systems, which may require regulation under the SDWA. The list includes, among
others, pesticides, disinfection by-products, chemicals used in commerce, waterborne
pathogens, pharmaceuticals, and biological toxins. This monitoring provides a basis for
future regulatory actions to protect public health. Since 1999, three UCMR programs, in
coordination with the CCL, have been issued (USEPA, 2006). Nitrosamines have been
listed in CCL3 and monitored in UCMR2.
The analysis of nitrosamine data from samples collected under the UCMR2
revealed that NDMA was detected in United States drinking waters at concentrations > 2
ng/L in 10% of the samples surveyed, and 26% of systems detected NDMA in at least
one sample (Russell et al., 2012). However, other nitrosamines (e.g., NDEA, NDBA,
NPYR, and NMEA) were rarely detected at levels above their MRLs. NDMA was
primarily detected in systems using chloramines, and concentrations were higher in water
9
systems having long contact times with chloramines (ranging from 4 to 15 ng/L (the
maximum NDMA measured was 630 ng/L)) (Russell et al., 2012).
The same study also showed that systems using chloramine as disinfectant had
35% of the samples above the MRL of NDMA, compared to 3% that used chlorine. The
highest NDMA concentrations (i.e., > 50 ng/L) were observed in water systems located in
California, Florida, Minnesota, Oklahoma, and Texas; and these states reported the
highest percent of chloramines use (Russell et al., 2012).
In another recent survey investigating the occurrence of nitrosamines in 16
drinking water treatment plant samples, the maximum concentration of nitrosamines
(including NDMA) was detected in ozonated water (28.6 ng/L). In particular, NDMA
(range of: 10.1-11.5 ng/L), NMOR (range of: <MRL-9.2 ng/L), NPYR (range of: <MRL-
5.4 ng/L), NDPA (range of: <MRL-2.6 ng/L) and NPIP (range of: <MRL-1.3 ng/L) were
detected in ozonated water followed by post-chlorination (Asami et al., 2009; Kosaka et
al., 2009). Additionally, relatively high concentrations of NDMA (i.e., >10 ng/L) were
reported at some ozonation plants in the western part of Japan for which the source water
is the Yodo River (Oya et al., 2008; Kosaka et al., 2009).
10
Formation of Nitrosamines
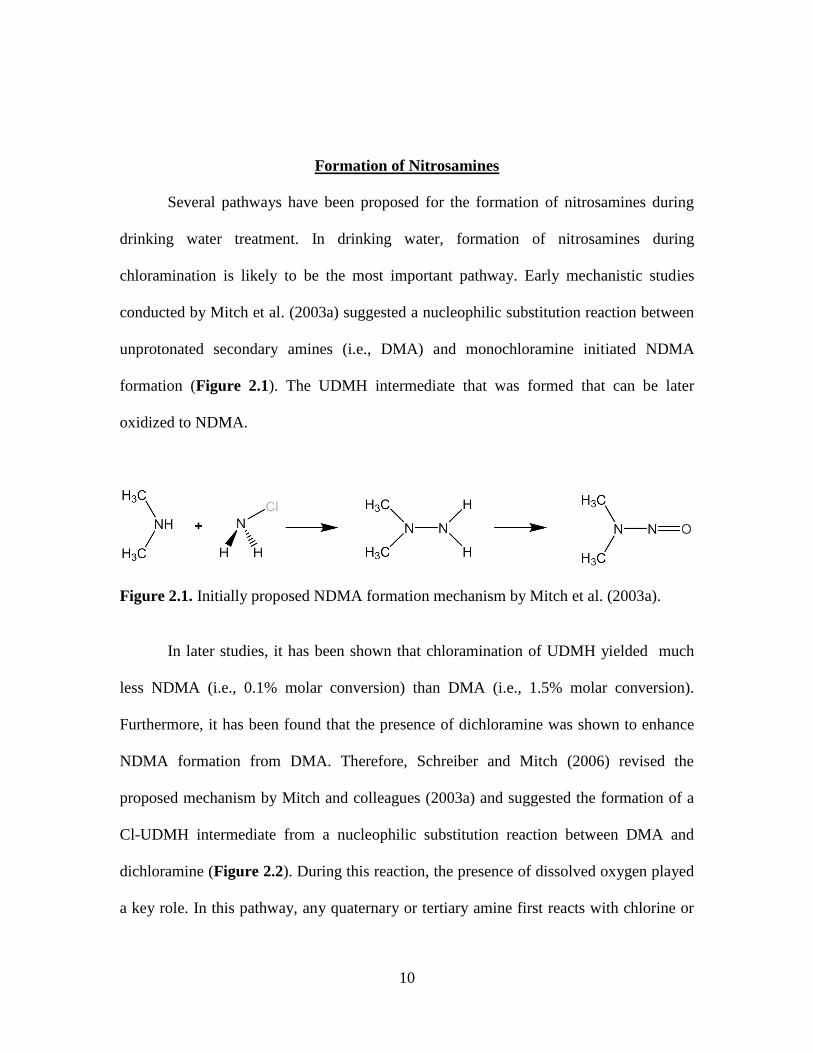
Several pathways have been proposed for the formation of nitrosamines during
drinking water treatment. In drinking water, formation of nitrosamines during
chloramination is likely to be the most important pathway. Early mechanistic studies
conducted by Mitch et al. (2003a) suggested a nucleophilic substitution reaction between
unprotonated secondary amines (i.e., DMA) and monochloramine initiated NDMA
formation (Figure 2.1). The UDMH intermediate that was formed that can be later
oxidized to NDMA.
Figure 2.1. Initially proposed NDMA formation mechanism by Mitch et al. (2003a).
In later studies, it has been shown that chloramination of UDMH yielded much
less NDMA (i.e., 0.1% molar conversion) than DMA (i.e., 1.5% molar conversion).
Furthermore, it has been found that the presence of dichloramine was shown to enhance
NDMA formation from DMA. Therefore, Schreiber and Mitch (2006) revised the
proposed mechanism by Mitch and colleagues (2003a) and suggested the formation of a
Cl-UDMH intermediate from a nucleophilic substitution reaction between DMA and
dichloramine (Figure 2.2). During this reaction, the presence of dissolved oxygen played
a key role. In this pathway, any quaternary or tertiary amine first reacts with chlorine or
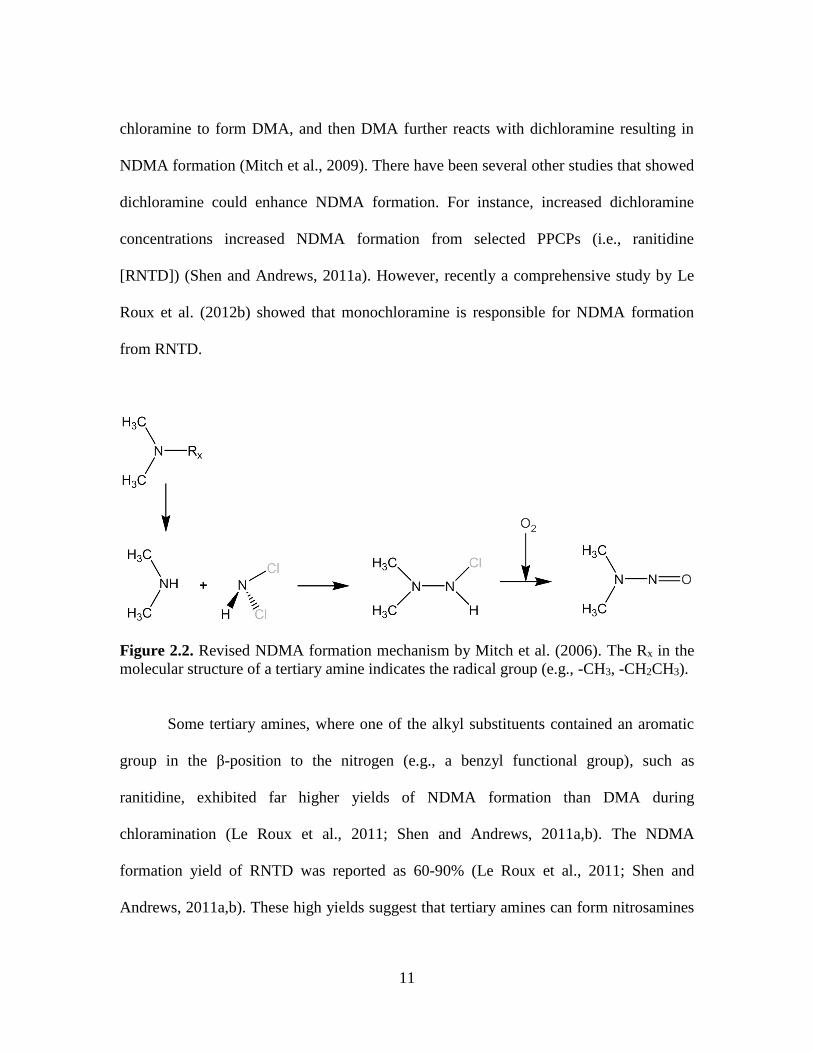
11
chloramine to form DMA, and then DMA further reacts with dichloramine resulting in
NDMA formation (Mitch et al., 2009). There have been several other studies that showed
dichloramine could enhance NDMA formation. For instance, increased dichloramine
concentrations increased NDMA formation from selected PPCPs (i.e., ranitidine
[RNTD]) (Shen and Andrews, 2011a). However, recently a comprehensive study by Le
Roux et al. (2012b) showed that monochloramine is responsible for NDMA formation
from RNTD.
Figure 2.2. Revised NDMA formation mechanism by Mitch et al. (2006). The Rx in the
molecular structure of a tertiary amine indicates the radical group (e.g., -CH3, -CH2CH3).
Some tertiary amines, where one of the alkyl substituents contained an aromatic
group in the β-position to the nitrogen (e.g., a benzyl functional group), such as
ranitidine, exhibited far higher yields of NDMA formation than DMA during
chloramination (Le Roux et al., 2011; Shen and Andrews, 2011a,b). The NDMA
formation yield of RNTD was reported as 60-90% (Le Roux et al., 2011; Shen and
Andrews, 2011a,b). These high yields suggest that tertiary amines can form nitrosamines
12
without proceeding through a secondary amine intermediate, although the specific
pathway is unclear.
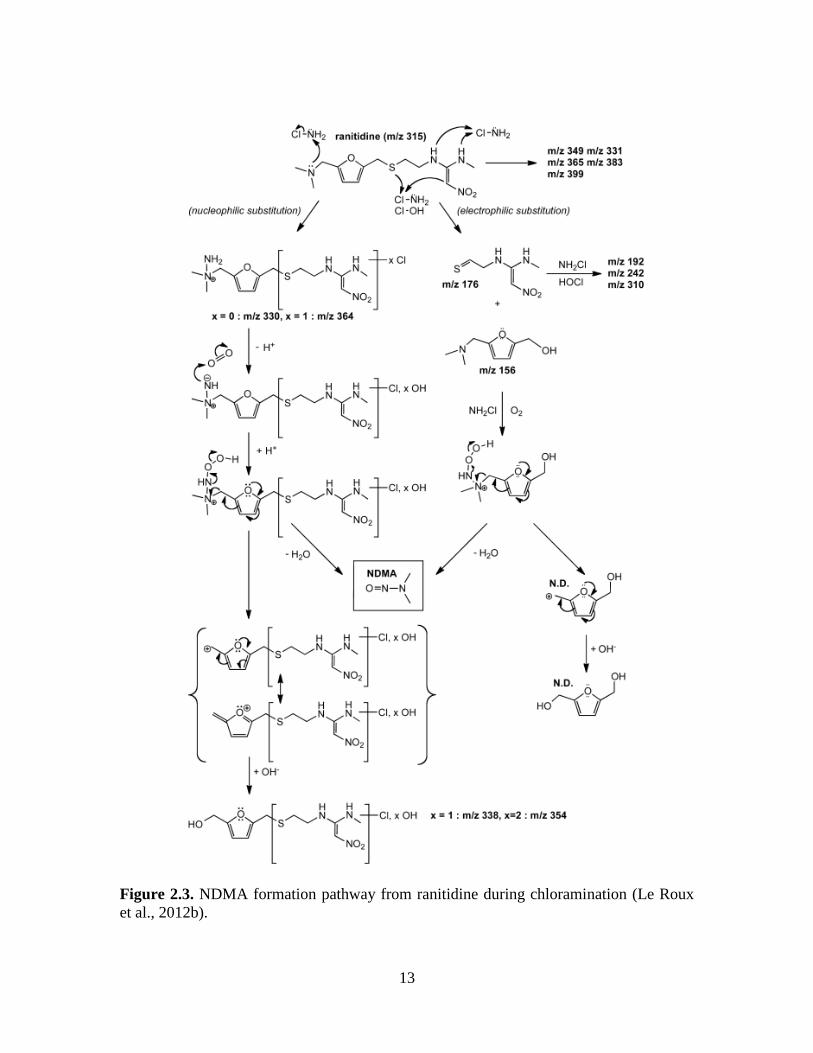
To explain the high formation yield of NDMA from ranitidine during
chloramination, Le Roux et al. (2012b) hypothesized that a methylfuran moiety of
ranitidine undergoes decomposition to generate a carbocation which has been supported
by identifying several intermediates using HPLC-MS technique (Figure 2.3). This
research provided new insight into the role of monochloramine species in the formation
of NDMA from ranitidne, and highlighted that the structure of the tertiary amines is
closely related with the reactivity of NDMA precursors and the preferred chloramine
species.
13
Figure 2.3. NDMA formation pathway from ranitidine during chloramination (Le Roux
et al., 2012b).
14
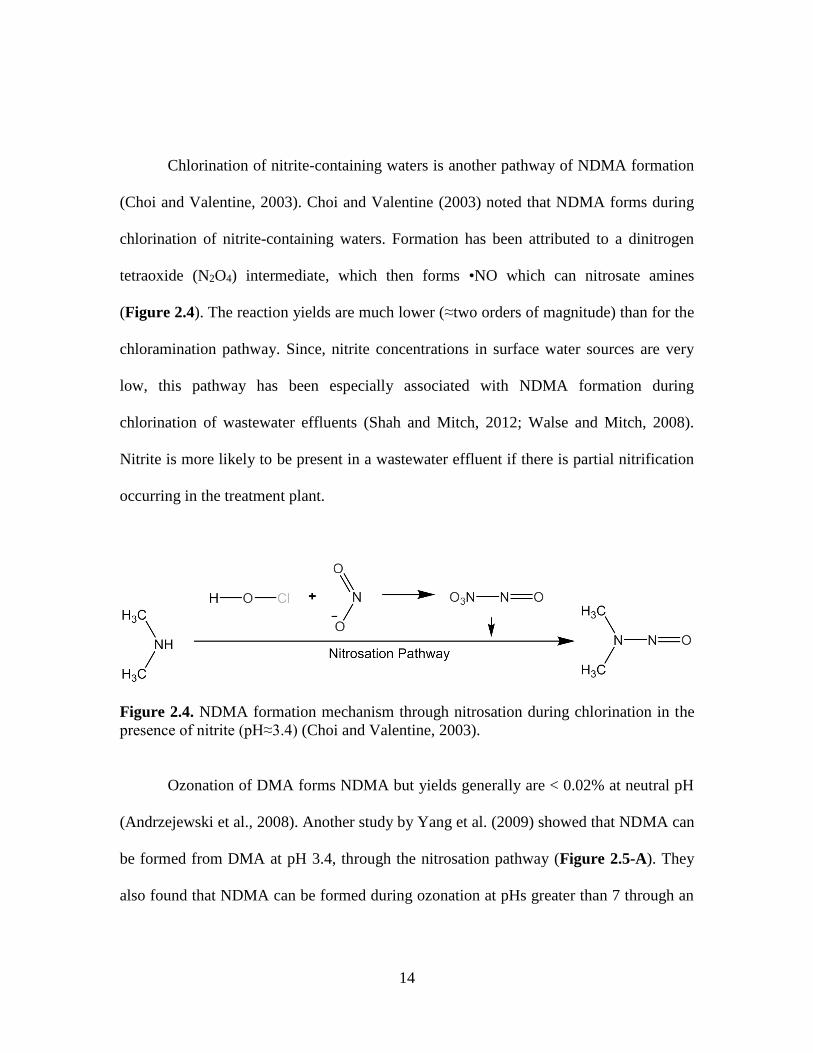
Chlorination of nitrite-containing waters is another pathway of NDMA formation
(Choi and Valentine, 2003). Choi and Valentine (2003) noted that NDMA forms during
chlorination of nitrite-containing waters. Formation has been attributed to a dinitrogen
tetraoxide (N2O4) intermediate, which then forms •NO which can nitrosate amines
(Figure 2.4). The reaction yields are much lower (≈two orders of magnitude) than for the
chloramination pathway. Since, nitrite concentrations in surface water sources are very
low, this pathway has been especially associated with NDMA formation during
chlorination of wastewater effluents (Shah and Mitch, 2012; Walse and Mitch, 2008).
Nitrite is more likely to be present in a wastewater effluent if there is partial nitrification
occurring in the treatment plant.
Figure 2.4. NDMA formation mechanism through nitrosation during chlorination in the
presence of nitrite (pH≈3.4) (Choi and Valentine, 2003).
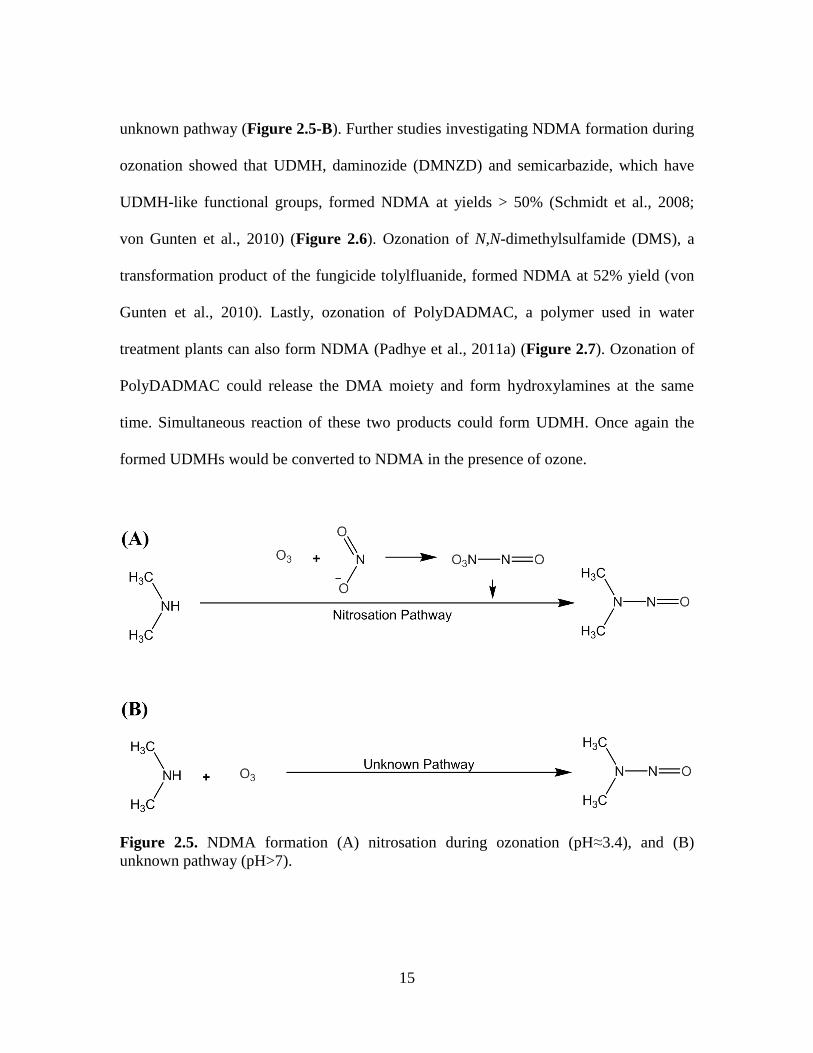
Ozonation of DMA forms NDMA but yields generally are < 0.02% at neutral pH
(Andrzejewski et al., 2008). Another study by Yang et al. (2009) showed that NDMA can
be formed from DMA at pH 3.4, through the nitrosation pathway (Figure 2.5-A). They
also found that NDMA can be formed during ozonation at pHs greater than 7 through an
15
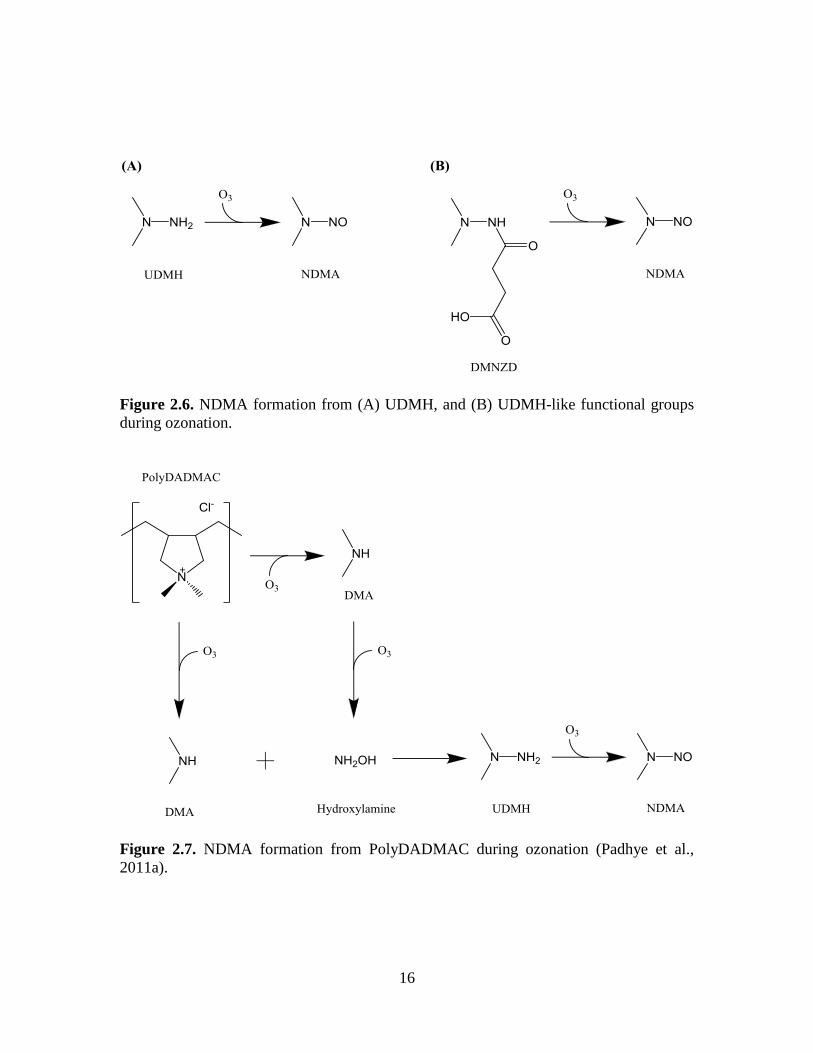
unknown pathway (Figure 2.5-B). Further studies investigating NDMA formation during
ozonation showed that UDMH, daminozide (DMNZD) and semicarbazide, which have
UDMH-like functional groups, formed NDMA at yields > 50% (Schmidt et al., 2008;
von Gunten et al., 2010) (Figure 2.6). Ozonation of N,N-dimethylsulfamide (DMS), a
transformation product of the fungicide tolylfluanide, formed NDMA at 52% yield (von
Gunten et al., 2010). Lastly, ozonation of PolyDADMAC, a polymer used in water
treatment plants can also form NDMA (Padhye et al., 2011a) (Figure 2.7). Ozonation of
PolyDADMAC could release the DMA moiety and form hydroxylamines at the same
time. Simultaneous reaction of these two products could form UDMH. Once again the
formed UDMHs would be converted to NDMA in the presence of ozone.
Figure 2.5. NDMA formation (A) nitrosation during ozonation (pH≈3.4), and (B)
unknown pathway (pH>7).
16
Figure 2.6. NDMA formation from (A) UDMH, and (B) UDMH-like functional groups
during ozonation.
Figure 2.7. NDMA formation from PolyDADMAC during ozonation (Padhye et al.,
2011a).
17
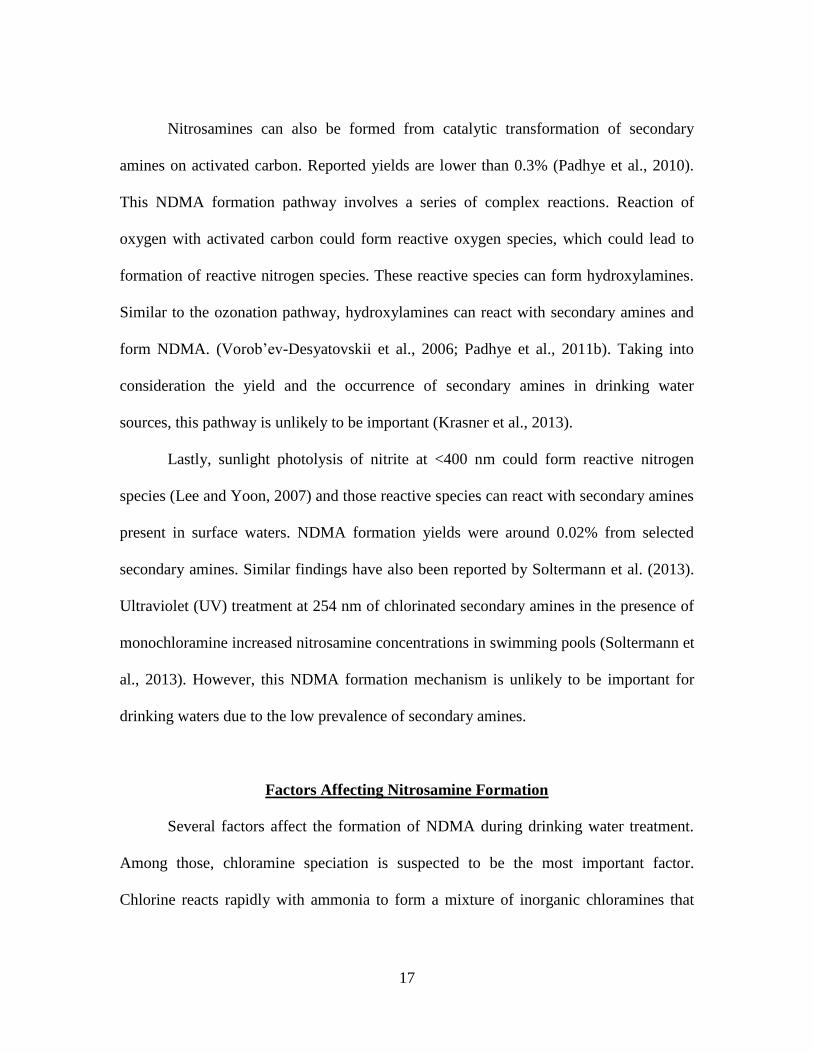
Nitrosamines can also be formed from catalytic transformation of secondary
amines on activated carbon. Reported yields are lower than 0.3% (Padhye et al., 2010).
This NDMA formation pathway involves a series of complex reactions. Reaction of
oxygen with activated carbon could form reactive oxygen species, which could lead to
formation of reactive nitrogen species. These reactive species can form hydroxylamines.
Similar to the ozonation pathway, hydroxylamines can react with secondary amines and
form NDMA. (Vorob’ev-Desyatovskii et al., 2006; Padhye et al., 2011b). Taking into
consideration the yield and the occurrence of secondary amines in drinking water
sources, this pathway is unlikely to be important (Krasner et al., 2013).
Lastly, sunlight photolysis of nitrite at <400 nm could form reactive nitrogen
species (Lee and Yoon, 2007) and those reactive species can react with secondary amines
present in surface waters. NDMA formation yields were around 0.02% from selected
secondary amines. Similar findings have also been reported by Soltermann et al. (2013).
Ultraviolet (UV) treatment at 254 nm of chlorinated secondary amines in the presence of
monochloramine increased nitrosamine concentrations in swimming pools (Soltermann et
al., 2013). However, this NDMA formation mechanism is unlikely to be important for
drinking waters due to the low prevalence of secondary amines.
Factors Affecting Nitrosamine Formation
Several factors affect the formation of NDMA during drinking water treatment.
Among those, chloramine speciation is suspected to be the most important factor.
Chlorine reacts rapidly with ammonia to form a mixture of inorganic chloramines that
18
may contain monochloramine, dichloramine, or trichloramine. Some additional
information about the chloramine chemistry can be found in the Appendix A.
The speciation of these compounds depend highly upon pH, chlorine to ammonia
ratio, temperature, and contact time. At pH higher than 8, and 5:1 Cl2:N ratio
monochloramine is the dominant species. On the other hand, dichloramine is favored as
the pH decreases (4 to 5) and/or the Cl2:N ratio increases (5:1 to 7.9:1) (Diehl et al.,
2000). Further a decrease in pH (pH<2), or an increase in the chlorine to nitrogen ratio
leads to formation of trichloramine. However, monochloramine generally is the dominant
form in drinking water disinfection with some trace concentrations of dichloramine.
As mentioned before, initial reports indicated a nucleophilic substitution reaction
between monochloramine and unprotonated secondary amines formed NDMA (Mitch
and Sedlak, 2002). Further research showed that dichloramine enhanced NDMA
formation from DMA, some PPCPs and in few wastewater-impacted waters (Mitch et al.,
2009; Farre et al., 2010). Meanwhile studies with RNTD (Le Roux et al., 2012b) showed
that monochloramine is responsible for NDMA formation from ranitidine. Overall, these
results suggest that NDMA formation may not always be limited to only one chloramine
species.
The effect of pH on NDMA formation in drinking water has been found to
increase with increasing pH levels (Mitch and Sedlak, 2002; Sacher et al., 2008;
Schreiber and Mitch, 2005, 2006; Valentine et al., 2005). For example, Schreiber and
Mitch (2006) found that DMAs yield was higher at pH 8–9, than at pH 6.9 that was
19
higher than 5.1 (Schreiber and Mitch, 2005). A similar trend was observed for natural
waters (Krasner et al., 2012b).
Experiments conducted in natural waters (Sacher et al., 2008) and wastewater
effluents (Hatt et al., 2013) showed an increase in NDMA formation with increasing
chloramine dose. Moreover, NDMA formation reactions during chloramination are much
slower than chlorines. A few days (i.e., 3 days) of contact time is needed to plateau
(Sacher et al., 2008). Also, UCMR2 data showed NDMA concentrations were usually
higher in longer detention distribution systems (Russell et al., 2012).
Lastly, the presence of bromide was shown to enhance NDMA formation.
However, to have a distinct effect on overall NDMA formation, bromide levels should be
higher than 500 µg/L (Shen and Andrews, 2011a; Shah et al., 2012; Le Roux et al.,
2012a).
Precursors of Nitrosamines
Although an organic nitrogen precursor is required for NDMA formation, there is
no strong correlation between dissolved organic nitrogen concentrations and NDMA
formation potentials in natural waters (Pehlivanoglu-Mantas and Sedlak, 2008; Dotson et
al., 2009; Aydin et al., 2012). DMA is the most studied model precursor of NDMA
(Andrzejewski et al., 2008; Choi and Valentine, 2003; Lv et al., 2009; Mitch and Sedlak,
2002; Mitch et al., 2003a,b) and is ubiquitous in natural waters. However, some studies
have shown that DMA concentrations present in surface waters (Gerecke and Sedlak,
2003; Lee et al., 2007a) or secondary municipal wastewaters (Mitch and Sedlak, 2004)
20
are inadequate to explain the amount of NDMA formation. Other than DMA, some other
NDMA precursors have been identified such as tertiary and quaternary amines with
DMA functional groups (Lee et al., 2007; Park et al., 2007; Kemper et al., 2010; Shen
and Andrews, 2011a,b), natural organic matter (NOM) and fractions of NOM (Gerecke
and Sedlak, 2003; Mitch and Sedlak, 2004; Chen and Valentine, 2007; Dotson et al.,
2007; Krasner et al., 2008a), polyelectrolytes and ion-exchange resins (Gough et al.,
1977; Kimoto et al., 1980; Najm and Trussell, 2001; Kohut and Andrews, 2003; Wilczak
et al., 2003; Mitch and Sedlak, 2004; Nawrocki and Andrzejewski, 2011), fungicides,
pesticides, and herbicides (Graham et al., 1995; Chen and Young, 2008; Schmidt and
Brauch, 2008), pharmaceuticals, cosmetics (Sacher et al., 2008; Shen and Andrews,
2011a,b), and wastewater effluent/impacted waters (Krasner et al., 2004; Sedlak et al.,
2005; Krasner et al., 2009; Krauss et al., 2009; Shah et al., 2012; Gan et al., 2013a,b).
Among these, wastewater-impacted waters are likely to have the highest NDMA
formation and thus thought to be the most significant source of NDMA precursors
(Schreiber and Mitch, 2006; Guo and Krasner, 2009; Krasner, 2009; Shah and Mitch,
2012). As expected, wastewaters contain a range of precursors. Specific precursors in
wastewater-impacted water supplies have not been characterized but are likely to include
tertiary amine-based pharmaceuticals, quaternary amine-based constituents of shampoos,
pharmaceuticals, and potentially pesticides, fungicides, herbicides, or insecticides.
Other than the wastewater influence, some chemicals and resins used in drinking
water treatment plants (DWTPs) are shown to increase NDMA formation. Cationic
polymers (e.g., polyAMINE and polyDADMAC) used as coagulant or dewatering aids in
21
drinking water treatment can degrade to DMAs and consequently increase NDMA
formation (Kohut and Andrews, 2003; Najm and Trussell, 2001; Wilczak et al., 2003).
PolyAMINEs have been shown to produce more NDMA than polyDADMAC around pH
8.0 during chloramination (Padhye et al., 2011a). Additionally, ozonation of
polyDADMAC yielded NDMA without sequential chloramination (Padhye et al., 2011a).
NDMA yield during ozonation from polyDADMAC was several times more than
polyACRYL and polyAMINE (Padhye et al., 2011a).
Similar to polymers, anion exchange units also have quaternary amine or tertiary
amine based resins in their structures. Anion exchange resins (trimethylamine [TMA],
dimethylethanolamine based) released NDMA likely due to shedding of manufacturing
impurities (Kemper et al., 2009). Furthermore, these resins can also shed the precursors
that can increase NDMA formation upon chloramination (Kemper et al., 2009; Nawrocki
and Andrzejewski, 2011). Higher levels of nitrosamine precursors were observed after
regeneration cycles (Singer and Flower, 2012). Similar findings have been reported for
magnetic ion exchange resin (MIEX®) by Gan et al. (2013a,b). Use of MIEX® to treat
wastewater effluents increased NDMA formation by at least 50% during chloramination.
This increase was reported to be much less (i.e., 5%) if the wastewater impact was
minimal (wastewater blended with a pristine water source, <10% by volume). Exposure
of these resins to oxidants (i.e., chlorine, chloramine) produced NDMA in the effluents
(Kimoto et al., 1980; Najm and Trussell, 2001; Kemper et al., 2009).
DMA moieties of PPCPs has been shown to form NDMA during chloramination
(Shen and Andrews, 2011a,b). In study conducted by Shen and Andrews (2011a), 20
22
PPCPs were investigated and NDMA molar yields higher than 1% were observed for
eight pharmaceuticals (i.e., RNTD, sumatripan, tetracycline, doxylamine,
chlorphenamine, nizatidine, diltiazem, and carbinoxamine). Although, these precursors
have the potential to form NDMA, their trace levels in the environment suggest (i.e.,
ng/L) that they may not account for the majority of the NDMA formation during the
disinfection process. Among the tested pharmaceuticals, RNTD, which draws the most
attention, showed the highest molar conversion (60-90%) to NDMA caused by the benzyl
functional group (Le Roux et al., 2011; Shen and Andrews, 2011a,b). These higher yields
suggest that these tertiary amines can form nitrosamines without proceeding through a
secondary amine intermediate, although the specific pathway is unclear.
Some herbicides, pesticides, insecticides and fungicides used in agricultural
applications are also shown to be NDMA precursors. These amides yielded much lower
molar NDMA conversions - probably caused by the carbonyl groups - than secondary,
tertiary and quaternary amines. However, ozonation of amides have been shown to form
NDMA without sequential chloramination. NDMA formation from amides are rapid (<1
h) and the molar yields could be more than 50% (Kosaka et al., 2009; Schmidt and
Brauch, 2008; Shen and Andrews, 2011a; von Gunten et al., 2010). Occurrence of trace
amounts of DMS, a degradation product of the fungicide tolylfluanide, in several German
drinking water treatment plants (Schmidt and Brauch, 2008) and similarly, anti-yellowing
agents near Tokyo, Japan, resulted in NDMA formations exceeding 10 ng/L after
ozonation (Kosaka et al., 2009).
23
Certain distribution system piping materials such as rubber seals and gaskets
leached NDMA and its precursors in oxidant-free water and formed more NDMA after
chloramination (Morran et al., 2011; Teefy et al., 2011). Increasing contact times (i.e.,
stagnation period) with these materials resulted in further increases in NDMA levels.
NDMA levels resulting from leaching pipe materials were within the range of 10-25 ng/L
(Morran et al., 2011).
Algal blooms can generate metabolites and increase DBP formation during those
periods. Algae have been identified as a source of carbonaceous DBP (C-DBP) precursor
(Hoehn et al., 1980) and nitrogenous-DBP (N-DBP) precursor (Bond et al., 2011, 2012).
NDMA formation has been reported from algae-derived and -impacted sources upon
chlorination or chloramination (Mitch et al., 2009; Zamyadi et al., 2010; Fang et al.,
2010; Li et al., 2012). Mitch et al. (2009) reported NDMA formation within the range of
12-261 ng/L from algae-impacted source waters (algae counts ranged from 300 to
22700/mL). Further studies with laboratory cultured algae (i.e., M. aeruginosa) solutions
had NDMA formation of 9 to 20 ng/mg C (Zamyadi et al., 2010; Fang et al., 2010; Li et
al., 2012). These findings indicate that algal activity can contribute to NDMA formation;
however, these values (i.e., 12-261 ng/L NDMA formation from algae-impacted sources)
are much lower than the yields observed for other NDMA precursors (i.e., wastewater).
Lastly, NOM and its fractions are also shown to form NDMA during
chloramination (Chen and Valentine, 2007; Dotson et al., 2007; Gerecke and Sedlak,
2003; Mitch and Sedlak, 2004). However, NDMA yields from NOM are much lower than
wastewater-impacted waters, polymers, ion-exchange resins and PPCPs.
24
Removal of Nitrosamines and Their Precursors
Nitrosamine can be removed by activated carbon adsorption or by UV photolysis.
Since nitrosamine formation kinetics are slow, nitrosamines continue to form within the
distribution system unless the precursors are removed. Therefore, this section focuses on
precursor removal.
Coagulation with alum or ferric chloride has limited removal efficiency for
nitrosamine precursors (i.e., <10%) (Krasner et al., 2008a; Sacher et al., 2008). Similar
results have been reported during the lime softening process (Mitch et al., 2009). It has
been shown that the majority of NDMA precursors are associated with low molecular
weight hydrophilic compounds, and these types of organics is poorly removed by
coagulation (Lee and Westerhoff, 2006; Xu et al., 2011). One study involving three
treatment plants found that polymers (i.e., PolyDADMAC) used during coagulation
process led to an increase in NDMA formation by 43-82% (Krasner et al., 2012b)
probably caused by the residual polymer in the effluent (Novak and Montgomery, 1975;
Novak and Langford, 1977). Therefore, reduction in polymer dosage can reduce, but not
eliminate NDMA formation. Unfortunately, almost all cationic polymers currently in use
will contribute to NDMA formation because they are amine-based, but using alternate
polymers can help with its management. NDMA yields from selected polymers are in the
decreasing order of: PolyAMINE (DMA-based) > PolyAMINE (TMA-based) ≥
PolyDADMAC > PolyACRYL (Park et al., 2007).
25
Powdered activated carbons (PAC) and to lesser extent granular activated carbons
(GAC) are commonly used in DWTPs in the United States to minimize taste- and odor-
causing compounds. They have been shown to be effective for removal of NOM and
consequently controlling the formation of C-DBPs. Initial experiments investigating
removal of NDMA precursors demonstrated NDMA formation potential (FP) reduction
of more than 73% in wastewater with 50 mg/L of PAC after seven days contact time
(Krasner et al., 2008b). Experiments in surface waters and wastewater-impacted sources
with the same contact time exposed to 5 mg/L of PAC showed 50% NDMA FP
reduction, and 90% or greater with 20 mg/L (Sacher et al., 2008). Recently, Hanigan et
al. (2012) reported 37% NDMA FP in a secondary wastewater effluent at 3 mg/L of PAC
dose and 4 h contact time. A dose of 75 mg/L of PAC had approximately 90% removal in
secondary wastewater-effluents (Hanigan et al., 2012). Similarly, studies with GACs
demonstrated 60-80% reduction in NDMA FP in surface waters (Hanigan et al., 2012).
Research has demonstrated that the use of pre-oxidation such as chlorine, ozone,
chlorine dioxide, permanganate, ferrate, hydrogen peroxide, UV and even sunlight can
affect NDMA formation subsequent to chloramination (Charrois and Hrudey, 2007; Chen
and Valentine, 2008; Lee et al., 2007a, 2008; Shah et al., 2012). Recent research by Shah
et al. (2012) evaluated the reduction in NDMA formation with pre-oxidants (chlorine,
ozone, chlorine dioxide, and low or medium pressure UV) applied at exposures relevant
to 99.9% removal of Giardia with post-chloramination conducted under conditions
relevant to drinking water distribution. Ozone was deemed to be the most effective pre-
oxidants by achieving 50% reduction in NDMA with exposures ≤0.4 mg×min/L.
26
Chlorine was able to achieve similar results at exposures around 70 mg×min/L. In a few
sources, it promoted NDMA formation at low exposures, but formation declined again at
higher exposures which was attributed to the presence of nitrite-causing nitrosation.
Chlorine dioxide and UV treatment were relatively ineffective over exposures relevant to
disinfection. In some cases, chlorine dioxide promoted NDMA across the range of
exposures.
There are only a few studies focusing on pre-oxidation of model compounds.
Some amides (Schmidt and Brauch, 2008; von Gunten et al., 2010), anti-yellowing agents
(Kosaka et al., 2009), and polymers (Padhye et al., 2011a) have been recognized to form
NDMA during ozonation without sequential chloramination. Occurrence of these
precursors in natural waters during ozonation actually led to the formation of NDMA
(Asami et al., 2009; von Gunten et al., 2010). In another study, Lee et al. (2007) has
shown that the use of ozone, and to a lesser extent, chlorine dioxide, has reduced NDMA
formation from seven tertiary amines; however, this was only achieved with substantially
high doses of oxidants compared to those used for drinking water treatment. Lastly, Shen
and Andrews (2013b) have used chlorine as a pre-oxidant to control NDMA formation
originating from selected pharmaceuticals. This pre-chlorination reduced NDMA
formation from RNTD, nizatidine, and tetracycline by 50%, with a relatively low
concentration×time (CT) (i.e., 10 mg×min/L). In the same study sumatripan conversely
almost doubled its NDMA formation, while other pharmaceuticals had no noticeable
change during pre-chlorination.
27
Biofiltration can partially remove NDMA precursors (Farre et al., 2011). Farre´ et
al. (2011) reported about 80% reduction in NDMA FP (250 to 50 ng/L) using pilot-scale
biologically active carbon columns at a wastewater reuse facility. However, some of this
removal may be due to adsorption of NDMA precursors to carbons. Furthermore, it has
been also shown to increase NDMA formation by transforming some precursors into
more potent forms (Krasner et al., 2012a). The presence of ammonia in the influent led to
higher concentrations of nitrite in the effluent. Thus, increasing nitrite concentrations at
the biofilters effluent can increase NDMA FP triggered by the nitrosation pathway
(Krasner et al., 2012a).
Riverbank filtration has been shown in Europe to remove nitrosamine precursors
via biodegradation and/or adsorption (Sacher et al., 2008). Recently, riverbank filtration
was shown to be effective at a site in the U.S. with approximately 64% reduction in
NDMA FP (Krasner et al., 2012c).
Since NDMA precursors are associated with low molecular weight compounds,
ultrafiltration displayed negligible reduction in NDMA FP (Pehlivanoglu-Mantas and
Sedlak, 2008). For selected nitrosamine precursors such as DMA, methylethylamine,
diethylamine, and dipropylamine, rejections of more than 98.5% have been reported
(Miyashita et al., 2009). Furthermore, reverse osmosis demonstrated complete removal at
selected wastewater treatment plants (WWTPs) in California (Mitch and Sedlak, 2004).
28
CHAPTER THREE
3. OBJECTIVES, APPROACHES, AND EXPERIMENTAL DESIGN
Objectives
Despite the significant efforts devoted to minimizing nitrosamine formation in
drinking water treatment, the formation of nitrosamines is poorly understood. In this
research, the main objective was to systematically examine nitrosamine formation from
amines to gain insight about the formation mechanisms of nitrosamines (especially
NDMA) and examine the interactions of these precursors with different oxidants. This is
especially important considering the potential health effects and future regulations of
nitrosamines in drinking water. Specifically, this research was carried out in the
following areas:
1. To examine the formation potential of nitrosamines from selected AAs under
different oxidation conditions.
2. To investigate the effect of tertiary amine structure and the influencing factors
in ultimate NDMA formation.
3. To determine the factors that influence NDMA formation as a function of
time.
4. To evaluate the reactivity of different oxidation techniques with NDMA
precursors and the effects on NDMA conversion.

29
Approaches and Experimental Designs
Objective 1: Examine the formation potential of nitrosamines from selected amino
acids under different oxidation conditions.
Approach: Nine AAs (alanine, aspartic acid, cysteine, glutamic acid, glycine,
lysine, histidine, proline and serine) were selected based on charge, polarity and
hydrophobicity. Ten mg/L of individual AA solutions were exposed to different
oxidation conditions (i.e., chloramination, and ozonation-chloramination) and
their FPs were examined for nitrosamines that can be analyzed by method USEPA
521 (Figure 3.1).
Figure 3.1. Experiments conducted for Objective 1.
Objective 2: Investigate (i) the effect of tertiary amine structure, (ii) the effect of
background NOM, and (iii) the roles of mono- vs. dichloramine species on NDMA
formation.
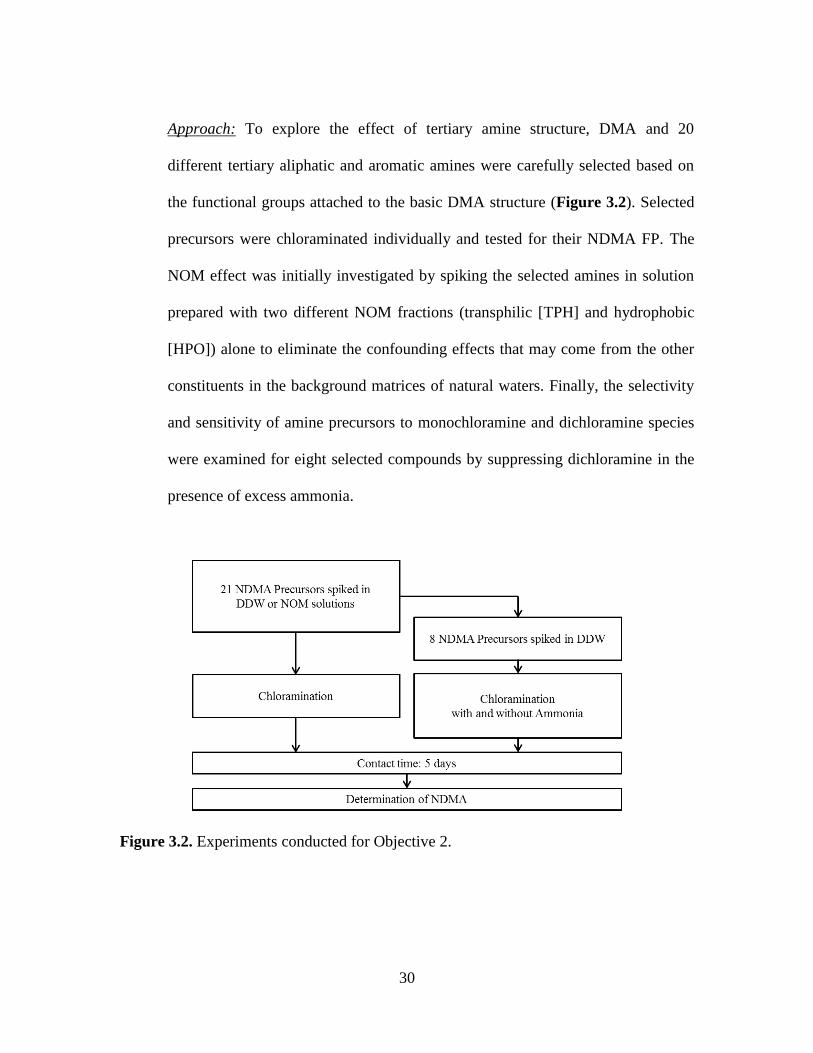
30
Approach: To explore the effect of tertiary amine structure, DMA and 20
different tertiary aliphatic and aromatic amines were carefully selected based on
the functional groups attached to the basic DMA structure (Figure 3.2). Selected
precursors were chloraminated individually and tested for their NDMA FP. The
NOM effect was initially investigated by spiking the selected amines in solution
prepared with two different NOM fractions (transphilic [TPH] and hydrophobic
[HPO]) alone to eliminate the confounding effects that may come from the other
constituents in the background matrices of natural waters. Finally, the selectivity
and sensitivity of amine precursors to monochloramine and dichloramine species
were examined for eight selected compounds by suppressing dichloramine in the
presence of excess ammonia.
Figure 3.2. Experiments conducted for Objective 2.
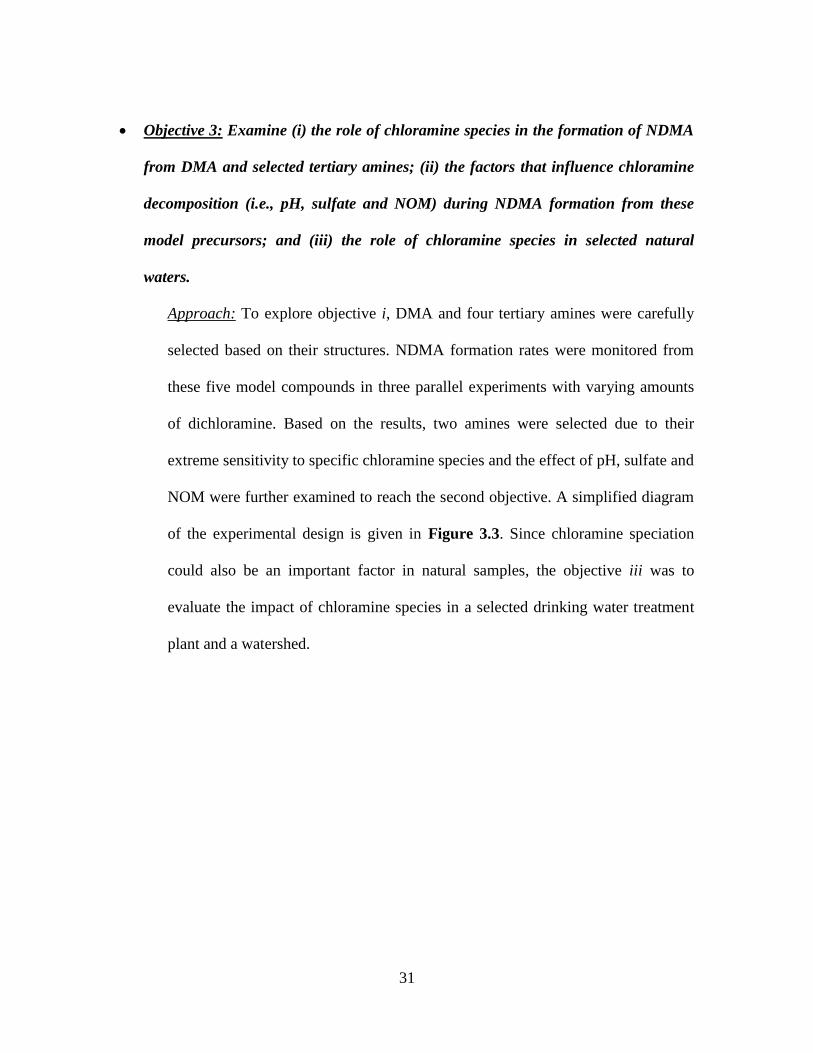
31
Objective 3: Examine (i) the role of chloramine species in the formation of NDMA
from DMA and selected tertiary amines; (ii) the factors that influence chloramine
decomposition (i.e., pH, sulfate and NOM) during NDMA formation from these
model precursors; and (iii) the role of chloramine species in selected natural
waters.
Approach: To explore objective i, DMA and four tertiary amines were carefully
selected based on their structures. NDMA formation rates were monitored from
these five model compounds in three parallel experiments with varying amounts
of dichloramine. Based on the results, two amines were selected due to their
extreme sensitivity to specific chloramine species and the effect of pH, sulfate and
NOM were further examined to reach the second objective. A simplified diagram
of the experimental design is given in Figure 3.3. Since chloramine speciation
could also be an important factor in natural samples, the objective iii was to
evaluate the impact of chloramine species in a selected drinking water treatment
plant and a watershed.
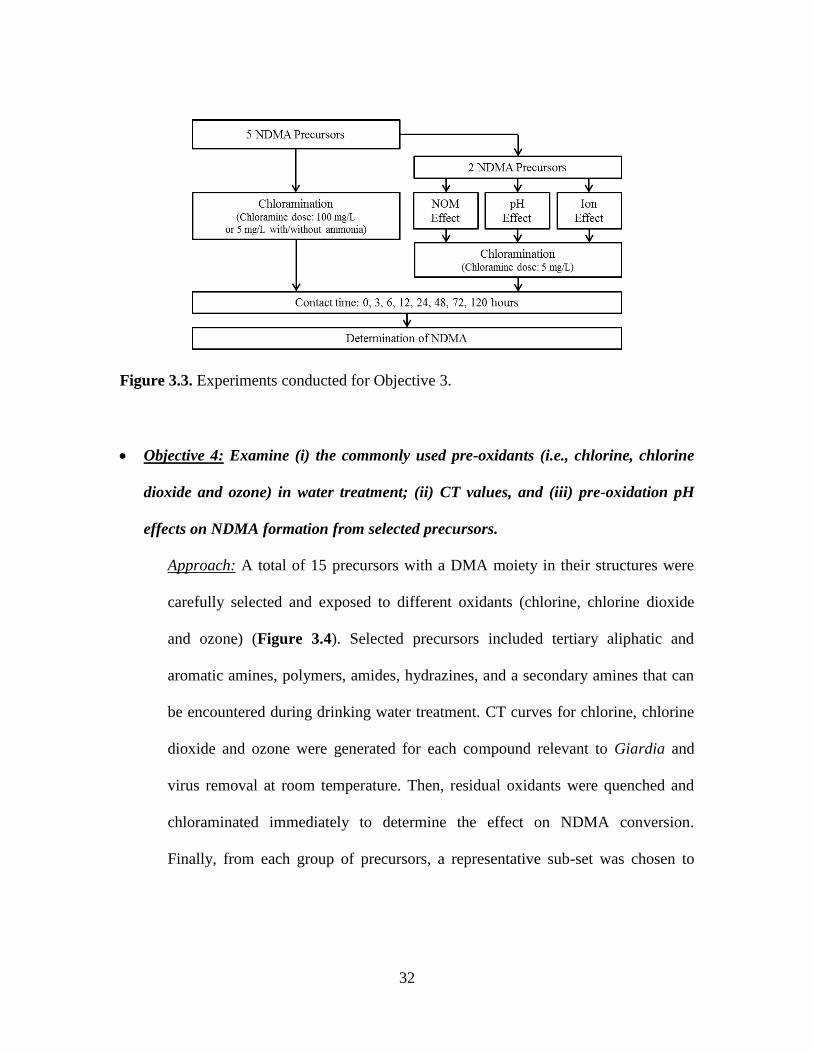
32
Figure 3.3. Experiments conducted for Objective 3.
Objective 4: Examine (i) the commonly used pre-oxidants (i.e., chlorine, chlorine
dioxide and ozone) in water treatment; (ii) CT values, and (iii) pre-oxidation pH
effects on NDMA formation from selected precursors.
Approach: A total of 15 precursors with a DMA moiety in their structures were
carefully selected and exposed to different oxidants (chlorine, chlorine dioxide
and ozone) (Figure 3.4). Selected precursors included tertiary aliphatic and
aromatic amines, polymers, amides, hydrazines, and a secondary amines that can
be encountered during drinking water treatment. CT curves for chlorine, chlorine
dioxide and ozone were generated for each compound relevant to Giardia and
virus removal at room temperature. Then, residual oxidants were quenched and
chloraminated immediately to determine the effect on NDMA conversion.
Finally, from each group of precursors, a representative sub-set was chosen to
33
further evaluate the effect of pre-oxidation pH ranging from 5.5 to 9.5. The pH
experiments were conducted for one fixed CT for each oxidant.
Figure 3.4. Experiments conducted for Objective 4.
The following chapter describes the details of the materials and methods used
throughout this research. Chapters five, six, seven and eight present results that address
objectives 1, 2, 3 and 4, respectively. Chapter nine provides a comprehensive set of
conclusions and recommendations.
34
CHAPTER FOUR
4. MATERIALS AND METHODS
In this chapter, an overall description of experimental materials and methods used
in this research will be provided. Since different samples and methods were involved in
different phases of the study, in each chapter there will be a short experimental materials
and methods section to list the precursors used and the experimental matrix conducted for
a particular chapter.
Glassware, Reagent Water, & Chemical Reagents
Glassware was scrupulously cleaned by tap water and a detergent, rinsed with
distilled water five times and finally five times with distilled deionized water (DDW).
The glassware was dried at a temperature of least 105 ºC inside an oven to avoid any
contamination and dust.
Reagent water used in the experiments was DDW produced by a Millipore water
purification system. The DDW was Type I water with a resistivity of 18 MΩ-cm.
All chemicals used were purchased from certified vendors. All chemicals, except
precursors, were American Chemical Society reagent grade. Solvents used in the
extraction were high purity. All stock solutions and buffers were prepared at the use time;
otherwise they were stored in amber borosilicate glass bottles at 4°C for up to a week.
35
Model Precursors
A range of nitrogenous precursors were selected for their nitrosamines formation.
All precursors were purchased from certified vendors (Sigma-Aldrich, TCI, Matrix
Scientific, and Santa Cruz Biotechnology) at purities ranging from 98.0% to 99.5% and
used without further purification. Furthermore, some precursors were purchased as a
solution (i.e., 20.0% to 45.0%). All amines were chosen based on their structure to
examine the effects of several parameters, such as chain length, acidity, polarity and
functional groups. A stock solution for each precursor was prepared in methanol or DDW
and stored in 65 mL or 1 L amber glass bottles at 4ºC until use. Since, different
precursors were used in each objective, the structures of precursors are given in each
section of results and discussion.
Natural Water Samples Collection and Preservation
Most of the model precursor’s DBP formations were investigated in DDW;
however, selected experiments were also conducted in the presence of background NOM.
To investigate the role of NOM in these reactions, 20 to 40 L of water samples were
collected from selected water sources or DWTPs (Myrtle Beach [M-B] and Charleston
[CH]) in South Carolina. If water was to be collected from a treatment plant, samples
were collected as raw (influent to the plant) and treated [after conventional treatment
processes (coagulation, flocculation, and sedimentation)]. Collected samples were
transported to the lab and immediately filtered using pre-washed 0.2 or 0.45 µm Supor®
membrane, and stored in a cold dark room at 4°C until experiments that were usually
36
performed within a week of collection. In selected experiments only isolated NOM
fractions were used which were available in the lab from previous studies.
Formation Potential Tests
FP tests, designed to determine DBP precursors in a water sample, were
conducted in the presence of an excess of disinfectant. Chloramines were used as the
primary oxidant to investigate the formation of nitrosamines; however, ozonation, and
ozonation followed by chloramination were also investigated in selected experiments.
FP tests for nitrosamine formation were performed using either 500 or 1000 mL
amber bottles. Each bottle received a stir bar and was initially filled halfway with DDW
or background solutions (i.e., natural waters, and NOM isolates). Model compounds were
spiked in the bottle and 50 mL of fresh monochloramine stock solution was added. The
remaining volume was filled with the same solutions leaving a headspace free bottle. The
initial chloramine dose in the bottles was 100 mg/L. The bottles were capped and stirred
on a stir plate for a couple of minutes and then stored at room temperature (21-23°C).
Nitrosamine extractions were performed after five days.
For the reactors involving ozonation-chloramination, a pre-calculated volume of
the test water was removed from each bottle, the volume removed being equal to the
volume of the ozone stock solution to be subsequently added for ozonation. The ozone
dose was variable for each objective. Ozone stock solution was directly added from a gas
wash bottle to the top of the solution while minimizing the transfer time to avoid
37
volatilization loss. Then, samples were mixed on a stir plate for 5 min before
chloramination.
Chlorine and Chloramine Production
The fresh chlorine stocks were prepared by diluting sodium hypochlorite (5-6%
available free chlorine) before the experiment each time. Chlorine stock solutions were
prepared to give a chlorine concentration of ≈2500 mg/L. A fresh monochloramine stock
solution was prepared by mixing sodium hypochlorite (5-6% available free chlorine) and
ammonium sulfate solutions at a Cl2:N mass ratio of 3.5:1 or 4.0:1 at pH 9. Chloramine
stock solutions were prepared to give a chlorine concentration of ≈1000 mg/L.
Ozone Production
For the experiments involving ozonation of water samples, ozonation was carried
out by adding ozone stock solution to the samples. A gas washing bottle (1 or 2 L)
containing DDW with minimal headspace was placed in an ice bath, and the solution was
ozonated with a GTC-1B Griffin ozone generator fed with ultra-high purity oxygen gas.
To minimize the fluctuation of ozone output of the ozonator, a glass damper was placed
between the ozonator and the gas washing bottle. In a typical ozone stock preparation,
approximately 30 min ozonation would saturate the solution, yielding 28-32 mg O3/L.
The ozonated samples were mixed on a stir plate for 5 min before chlorination or
chloramination.
38
Chlorine Dioxide Production
A fresh chlorine dioxide stock was prepared via the slow acidification of NaClO2
solution with H2SO4 (Jones et al., 2012). Chlorine dioxide stock solutions were prepared
to give a chlorine dioxide concentration of ≈1500 mg/L.
Analytical Methods
A summary of the parameters, analytical methods, instruments and MRL are
presented in Table 4.1. These methods were developed following either Standard
Methods (SMs) or USEPA Methods. All experiments were conducted for two
independent samples and the results presented in the tables and figures represent the
averages of the duplicates.
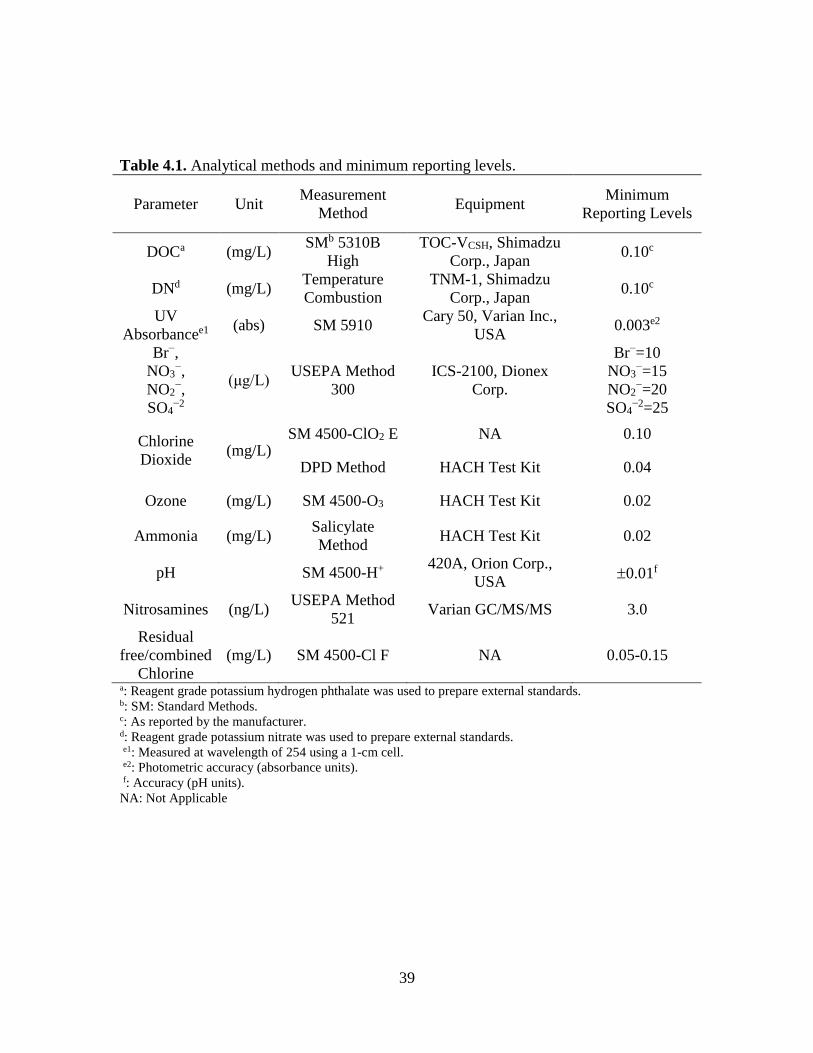
39
Table 4.1. Analytical methods and minimum reporting levels.
Parameter Unit Measurement
Method Equipment
Minimum
Reporting Levels
DOCa (mg/L) SMb 5310B
High
Temperature
Combustion
TOC-VCSH, Shimadzu
Corp., Japan 0.10c
DNd (mg/L) TNM-1, Shimadzu
Corp., Japan 0.10c
UV
Absorbancee1 (abs) SM 5910
Cary 50, Varian Inc.,
USA 0.003e2
Br−,
NO3−,
NO2−,
SO4−2
(μg/L) USEPA Method
300
ICS-2100, Dionex
Corp.
Br−=10
NO3−=15
NO2−=20
SO4−2=25
Chlorine
Dioxide (mg/L)
SM 4500-ClO2 E NA 0.10
DPD Method HACH Test Kit 0.04
Ozone (mg/L) SM 4500-O3 HACH Test Kit 0.02
Ammonia (mg/L) Salicylate
Method HACH Test Kit 0.02
pH SM 4500-H+ 420A, Orion Corp.,
USA 0.01f
Nitrosamines (ng/L) USEPA Method
521 Varian GC/MS/MS 3.0
Residual
free/combined
Chlorine
(mg/L) SM 4500-Cl F NA 0.05-0.15
a: Reagent grade potassium hydrogen phthalate was used to prepare external standards. b: SM: Standard Methods. c: As reported by the manufacturer. d: Reagent grade potassium nitrate was used to prepare external standards.
e1: Measured at wavelength of 254 using a 1-cm cell.
e2: Photometric accuracy (absorbance units).
f: Accuracy (pH units).
NA: Not Applicable
40
Oxidant Concentration Measurements
Free and combined chlorine concentrations were measured using an N,N-diethyl-
p-phenylenediamine (DPD) method (SM 4500-Cl F). Chlorine samples were diluted
based on their expected residual chlorine concentration to the range of 0 to 5 mg/L as Cl2.
The sample was then poured into a flask containing 5 mL of DPD indicator solution and
5 mL of phosphate buffer. After mixing, the sample was titrated using a ferrous
ammonium sulfate (FAS) solution to the end-point and titrant volumes were used to
calculate chlorine concentrations. The DPD indicator solution and FAS solution were
made according to SM 4500-Cl F.
The concentrations of the chlorine dioxide were measured with one of two
methods. Mainly, chlorine dioxide concentrations were measured using 4500-Cl F (DPD
Method) method with HACH kits. A few drops of glycine were added to a 10 mL sample,
and after few seconds, DPD reagent was added. Chlorine dioxide concentrations were
immediately measured with a HACH DR/820 colorimeter. SM 4500-ClO2 E was also
used to determine chlorine dioxide concentrations. One mL of phosphate buffer was
added to 200 mL samples and 1 g of potassium iodide was added as indicator. The
sample was titrated with a sodium thiosulfate until the end point and titrant volume was
recorded as “A”. To this solution, 20 mL of hydrochloric acid was added, titrated until
the end point and titrant volume was recorded as “B”. The pH of another 200 mL sample
was adjusted with phosphate buffer once again. This solution was purged for 5 minutes.
One gram of potassium iodide was added as indicator, titrated until the end point and
titrant volume was recorded as “C”. To this solution, 20 mL of hydrochloric acid was
41
added, titrated until the end point and titrant volume was recorded as “D”. A, B, C, and D
values were used to calculate Cl2, ClO2, and ClO2− concentrations. The necessary
solutions were prepared according to SM 4500-ClO2 E.
Ozone concentration was measured using the indigo method. Approximately 40
mL of sample was transferred in a plastic beaker and a HACH ozone reagent ampul
(Accuvac) containing indigo reagent was filled with the sample. The indigo reagent
immediately reacted with ozone and the blue color of indigo was bleached in proportion
to the amount of ozone present in the sample. Ozone in the sample was colorimetrically
measured with a HACH DR/820 colorimeter.
Nitrosamine Measurements
EPA 521 nitrosamine mix (2000 µg/mL of each component, 98.6-99.9%) in
methanol, nitrosamine calibration mix of N-nitrosodimethylamine-d6 (NDMA-d6, 98%)
as a surrogate and N-nitrosodi-n-propylamine-d14 (NDPA-d14, 99%) as an internal
standard (1000 µg/mL of each in dichloromethane [DCM]) were purchased from Sigma-
Aldrich and Restek, respectively. Nitrosamine mix (2000 µg/ml of mix) and nitrosamine
calibration mix (1000 µg/ml of NDMA-d6 and NDPA-d14) solutions served as the
master stock solutions. Primary diluted stock (PDS) of each stock (~500 µg/L) was
prepared by diluting them in DCM for further use in calibration curve or extractions.
NDMA and seven nitrosamine species (NPYR, NDEA, NMEA, NDPA, NDBA,
NPYR, and NMOR) were analyzed following USEPA Method 521. Calibration solutions
were prepared from a stock of mixed nitrosamines. Typical calibration curves were
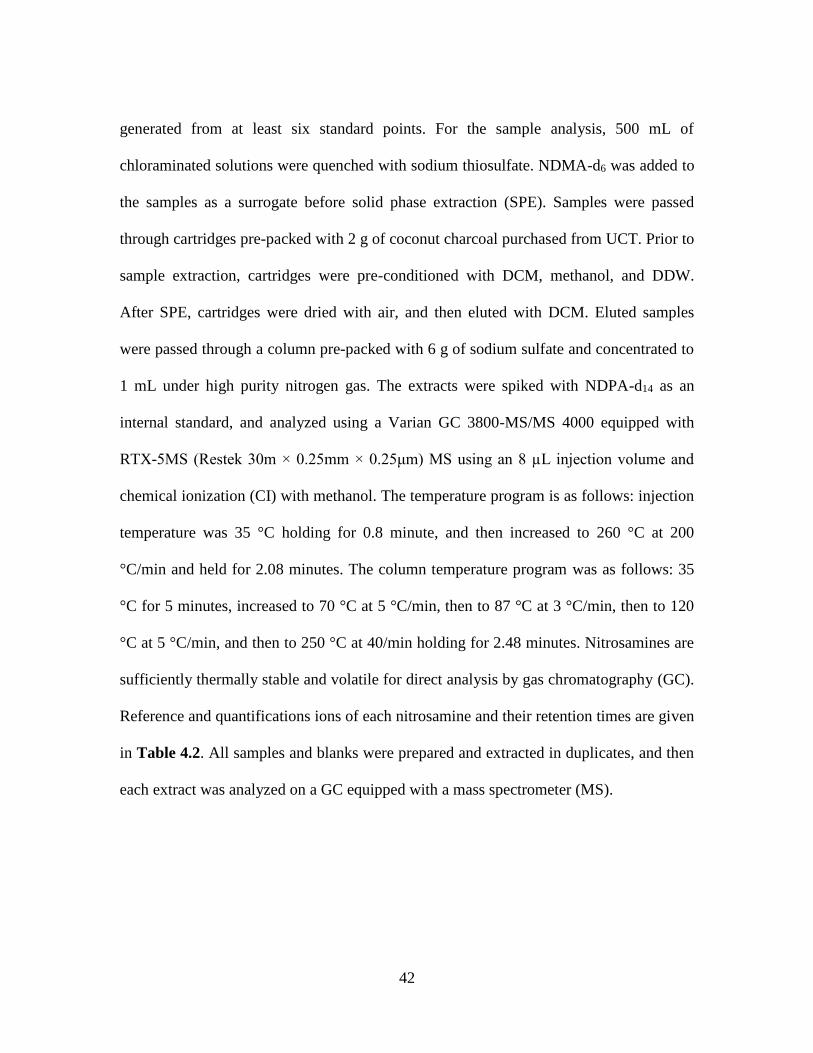
42
generated from at least six standard points. For the sample analysis, 500 mL of
chloraminated solutions were quenched with sodium thiosulfate. NDMA-d6 was added to
the samples as a surrogate before solid phase extraction (SPE). Samples were passed
through cartridges pre-packed with 2 g of coconut charcoal purchased from UCT. Prior to
sample extraction, cartridges were pre-conditioned with DCM, methanol, and DDW.
After SPE, cartridges were dried with air, and then eluted with DCM. Eluted samples
were passed through a column pre-packed with 6 g of sodium sulfate and concentrated to
1 mL under high purity nitrogen gas. The extracts were spiked with NDPA-d14 as an
internal standard, and analyzed using a Varian GC 3800-MS/MS 4000 equipped with
RTX-5MS (Restek 30m × 0.25mm × 0.25μm) MS using an 8 µL injection volume and
chemical ionization (CI) with methanol. The temperature program is as follows: injection
temperature was 35 °C holding for 0.8 minute, and then increased to 260 °C at 200
°C/min and held for 2.08 minutes. The column temperature program was as follows: 35
°C for 5 minutes, increased to 70 °C at 5 °C/min, then to 87 °C at 3 °C/min, then to 120
°C at 5 °C/min, and then to 250 °C at 40/min holding for 2.48 minutes. Nitrosamines are
sufficiently thermally stable and volatile for direct analysis by gas chromatography (GC).
Reference and quantifications ions of each nitrosamine and their retention times are given
in Table 4.2. All samples and blanks were prepared and extracted in duplicates, and then
each extract was analyzed on a GC equipped with a mass spectrometer (MS).
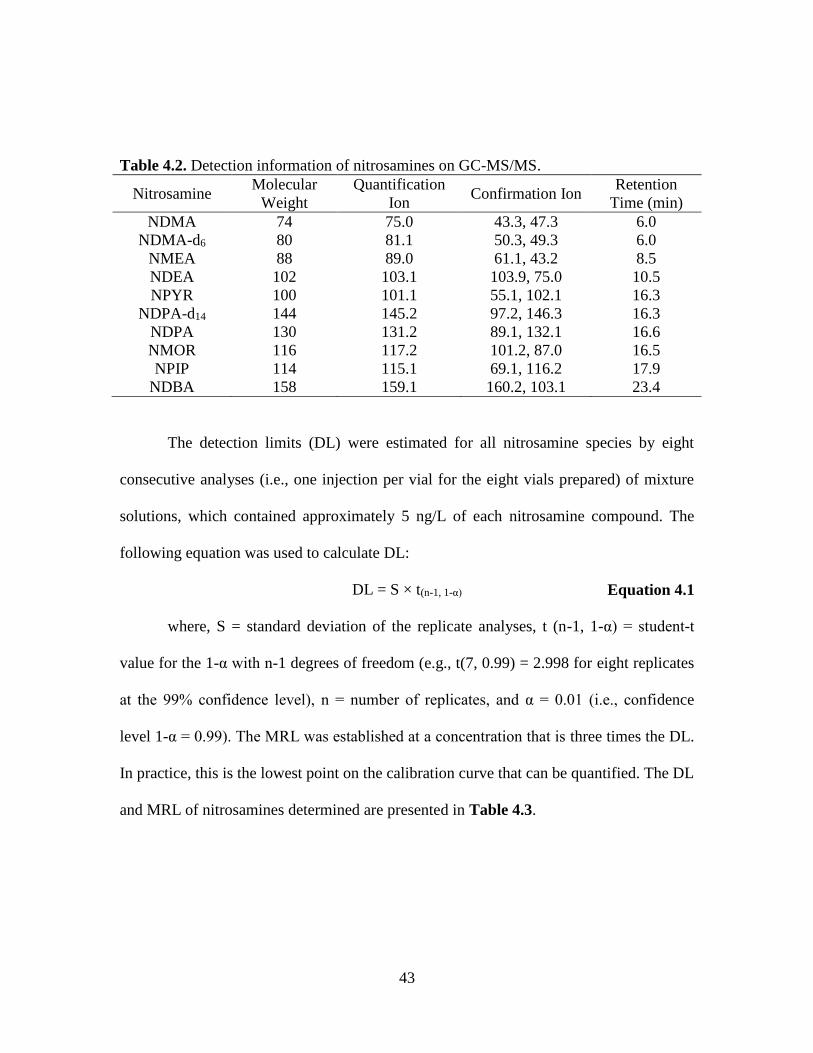
43
Table 4.2. Detection information of nitrosamines on GC-MS/MS.
Nitrosamine Molecular
Weight
Quantification
Ion Confirmation Ion
Retention
Time (min)
NDMA 74 75.0 43.3, 47.3 6.0
NDMA-d6 80 81.1 50.3, 49.3 6.0
NMEA 88 89.0 61.1, 43.2 8.5
NDEA 102 103.1 103.9, 75.0 10.5
NPYR 100 101.1 55.1, 102.1 16.3
NDPA-d14 144 145.2 97.2, 146.3 16.3
NDPA 130 131.2 89.1, 132.1 16.6
NMOR 116 117.2 101.2, 87.0 16.5
NPIP 114 115.1 69.1, 116.2 17.9
NDBA 158 159.1 160.2, 103.1 23.4
The detection limits (DL) were estimated for all nitrosamine species by eight
consecutive analyses (i.e., one injection per vial for the eight vials prepared) of mixture
solutions, which contained approximately 5 ng/L of each nitrosamine compound. The
following equation was used to calculate DL:
DL = S × t(n-1, 1-α) Equation 4.1
where, S = standard deviation of the replicate analyses, t (n-1, 1-α) = student-t
value for the 1-α with n-1 degrees of freedom (e.g., t(7, 0.99) = 2.998 for eight replicates
at the 99% confidence level), n = number of replicates, and α = 0.01 (i.e., confidence
level 1-α = 0.99). The MRL was established at a concentration that is three times the DL.
In practice, this is the lowest point on the calibration curve that can be quantified. The DL
and MRL of nitrosamines determined are presented in Table 4.3.
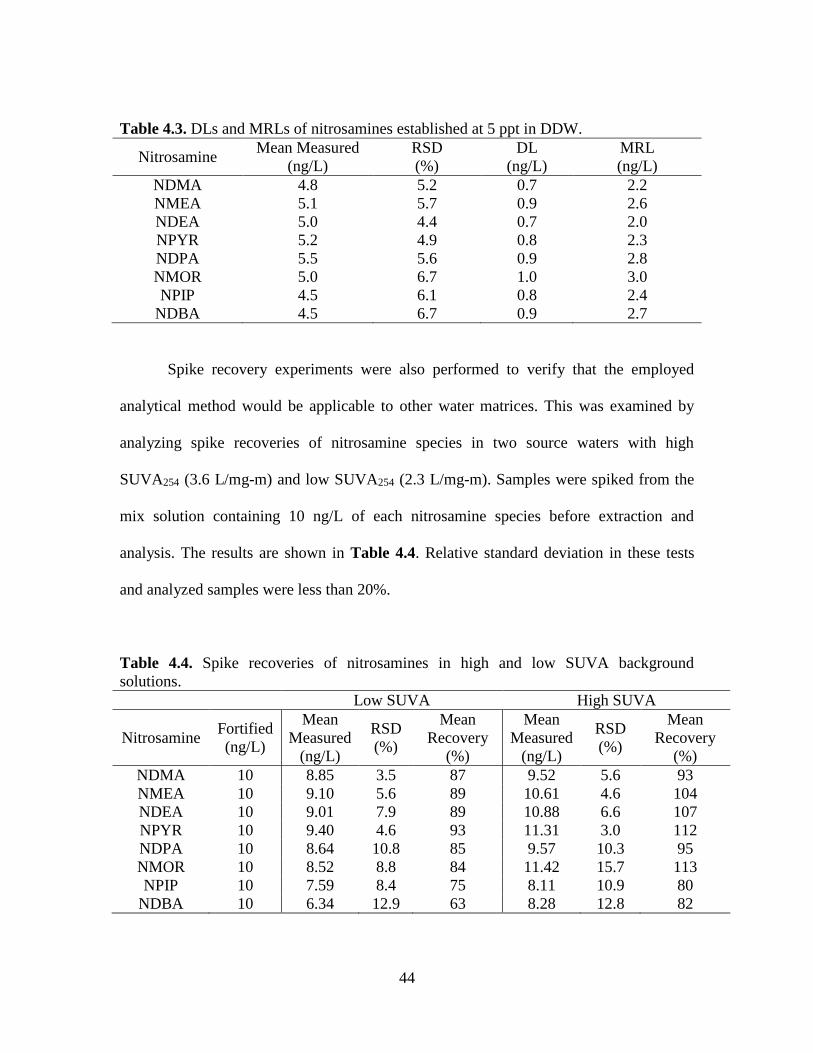
44
Table 4.3. DLs and MRLs of nitrosamines established at 5 ppt in DDW.
Nitrosamine Mean Measured
(ng/L)
RSD
(%)
DL
(ng/L)
MRL
(ng/L)
NDMA 4.8 5.2 0.7 2.2
NMEA 5.1 5.7 0.9 2.6
NDEA 5.0 4.4 0.7 2.0
NPYR 5.2 4.9 0.8 2.3
NDPA 5.5 5.6 0.9 2.8
NMOR 5.0 6.7 1.0 3.0
NPIP 4.5 6.1 0.8 2.4
NDBA 4.5 6.7 0.9 2.7
Spike recovery experiments were also performed to verify that the employed
analytical method would be applicable to other water matrices. This was examined by
analyzing spike recoveries of nitrosamine species in two source waters with high
SUVA254 (3.6 L/mg-m) and low SUVA254 (2.3 L/mg-m). Samples were spiked from the
mix solution containing 10 ng/L of each nitrosamine species before extraction and
analysis. The results are shown in Table 4.4. Relative standard deviation in these tests
and analyzed samples were less than 20%.
Table 4.4. Spike recoveries of nitrosamines in high and low SUVA background
solutions.
Low SUVA High SUVA
Nitrosamine Fortified
(ng/L)
Mean
Measured
(ng/L)
RSD
(%)
Mean
Recovery
(%)
Mean
Measured
(ng/L)
RSD
(%)
Mean
Recovery
(%)
NDMA 10 8.85 3.5 87 9.52 5.6 93
NMEA 10 9.10 5.6 89 10.61 4.6 104
NDEA 10 9.01 7.9 89 10.88 6.6 107
NPYR 10 9.40 4.6 93 11.31 3.0 112
NDPA 10 8.64 10.8 85 9.57 10.3 95
NMOR 10 8.52 8.8 84 11.42 15.7 113
NPIP 10 7.59 8.4 75 8.11 10.9 80
NDBA 10 6.34 12.9 63 8.28 12.8 82
45
Dissolved Organic Carbon and Dissolved Nitrogen Measurement
Dissolved organic carbon (DOC) and dissolved nitrogen (DN) were measured
using a Shimadzu TOC-VCHS or TOC-LCHS high temperature combustion analyzer
equipped with a TN module. TOC standards were prepared by diluting 1000 mg C/L
potassium hydrogen phthalate solution in the range of 0.2-15 mg C/L. TN standards were
prepared by diluting 1000 mg N/L potassium nitrate solution in the range of 0.2-5 mg
N/L. The MRLs for these measurements were determined to be 0.15 mg/L and 0.1 mg/L
for DOC and DN, respectively.
Ammonia Measurement
Ammonia concentrations were measured using salicylate method with HACH
kits. Salicylate reagent was added to a 10 mL sample, and after 3 min, cyanurate reagent
was added. After 15 min reaction, ammonia in the sample was colorimetrically measured
with a HACH DR/820 colorimeter.
UV254 Absorbance
UV absorbance at 254nm wavelength (UV254) was measured using a Cary 50 UV-
Vis spectrophotometer (Varian). Samples were placed in a 1 cm quartz cuvette and
measured at a wavelength of 254 nm. The spectrophotometer was zeroed by measuring
the absorbance of DDW after several rinses. The instrument was zeroed every ten
samples, and method performance was monitored using DOC standards made with
potassium hydrogen phthalate.
46
pH
The pH values for samples were measured using a SM 4500-H+ pH electrode with
a VWR Symphony pH meter (VWR). The pH meter and electrode were calibrated using
standard pH 2, 4, 7 and pH 10 buffer solutions before use.
Bromide, Nitrite, Nitrate and Sulfate Measurements
Bromide, nitrite, nitrate, and sulfate were measured using an ion chromatography
system. A Dionex ICS-2100 equipped with an AAES suppressor was used to determine
these anions present in natural samples used for background NOM experiments. The
mobile phase was 9 mM Na2CO3. A Dionex AS-HC9 column coupled with an AG-HC9
guard column was used to separate samples. The injection volume was 250 µL. A
calibration curve was obtained by a series of standard concentrations (at a low range of
10-1000 µg/L) using NaBr (> 99.9%, Sigma), NaNO2 (> 99.9%, Sigma), NaNO3 (>
99.9%, Sigma), and Na2SO4 (> 99.0%, EMD) and their corresponding MRLs were 10,
20, 15, and 25 µg/L, respectively.
Dissolved Organic Nitrogen Determination
In this study, dissolved organic nitrogen (DON) concentrations were determined
through subtraction as given in Equation 4.2.
DON = DN – NO3-N – NO2-N – NH4+ Equation 4.2
47
CHAPTER FIVE
5. NITROSAMINES FORMATION FROM AMINOACIDS
Introduction and Objective
Recent research has shown that emerging N-DBPs exhibit orders of magnitude
higher cyto- and geno-toxicity than any of the regulated C-DBPs (Plewa et al., 2008).
Therefore, it should not be surprising to see additional DBP regulations including N-
DBPs in the near future. Recent research has shown that nitrogen-rich organic materials
in natural waters play an important role in the formation of N-DBPs (Dotson et al, 2009;
Hu et al, 2010; Mitch et al, 2009). However, the important precursors and the formation
mechanisms of N-DPBs, especially NDMA, still remain largely unknown.
AAs have been found in fresh waters in a wide concentration range, 5 to 2000
µg/L, either in free or combined as peptides, nucleic acids, purines, pyrimidines, and
proteins (Rice and Taylor, 1986). Thurman (Thurman, 1985) reported that total AAs, sum
of the free and combined AAs, accounted for 2.6% of the dissolved organic carbon
(DOC) and 35% of the DON in some lakes. Hagedorn et al. (2000) observed in
catchment runoff that the total AAs accounted for 20% to greater than 75% of the DON.
Elevated amino acid levels were also found during the occurrence of algae blooms (Meon
and Kirchman, 2001; Sellner and Nealley, 1997). In addition, degradation of algal cells
during the die-off phase can be a major contributor of dissolved AAs in natural waters
(Thurman, 1985; Jørgensen 1987). In a recent survey of sixteen water treatment plants in
48
the United States, the average total AAs constituted 15% of DON in the source waters
(Dotson and Westerhoff, 2009). The principal AAs identified in natural waters included
glycine, glutamic acid, alanine, aspartic acid, leucine, proline and serine (Thurman, 1985;
Münster, 1999; Chinn and Barrett, 2000; Dotson et al, 2009).
The presence of AAs in raw and treated waters exerts high chlorine demand
(Trehy et al, 1986; Hureiki et al, 1994). The relative chlorine reactivity of AAs depends
on the side chain groups attached to the α-carbon. Studies conducted on the reactions of
AAs with chlorine have shown the formation of various classes of DBPs including
haloacetaldehydes, haloacetonitriles (HANs), cyanogen chloride, THMs and HAAs
(Hureiki et al, 1994; Na and Olson, 2006; Hong et al, 2009; Hu et al., 2010). As
compared to C-DBPs, there is much less information on the formation of N-DBPs from
amino acids, especially for nitrosamines. NDMA can form especially in drinking waters
and wastewater effluents under chloramination conditions (Sacher et al, 2008). NDMA
has been classified as a probable human carcinogen by USEPA (Richardson et al, 2007),
and can pose important health risk even at ng/L concentrations. As a result, the Ontario
Ministry of the Environment and Climate Change established a maximum allowable
concentration of 9 ng/L for NDMA, and the California Department of Health Service set
an interim action level of 10 ng/L. Though nitrosamines are not currently regulated at a
federal level in the United States, NDMA and four other nitrosamines (NDEA, NDPA,
NDPhA, and NPYR) are on the USEPA’s CCL3, and have been monitored under the
UCMR2 (USEPA, 2006, 2009).
49
Since AAs constitute an important fraction of the organic nitrogen pool in natural
waters, the objective of this study was to investigate the formation potential of
nitrosamines from AAs under different oxidation conditions. As reviewed in this section,
previous studies have mainly focused on the formation regulated C-DBPs (e.g., THM
and/or HAA) from AAs, while significantly less attention has been placed on the
nitrosamines.
Materials and Methods
Amino Acids
AAs can be classified into four categories depending upon their acidity and
polarity: acidic, basic, polar, and nonpolar. For this study, nine AAs (alanine, aspartic
acid, cysteine, glutamic acid, glycine, lysine, histidine, proline and serine) were selected
based on charge, polarity and hydropobicity. The physicochemical characteristics and
structures of the selected AAs are listed in Table 5.1.
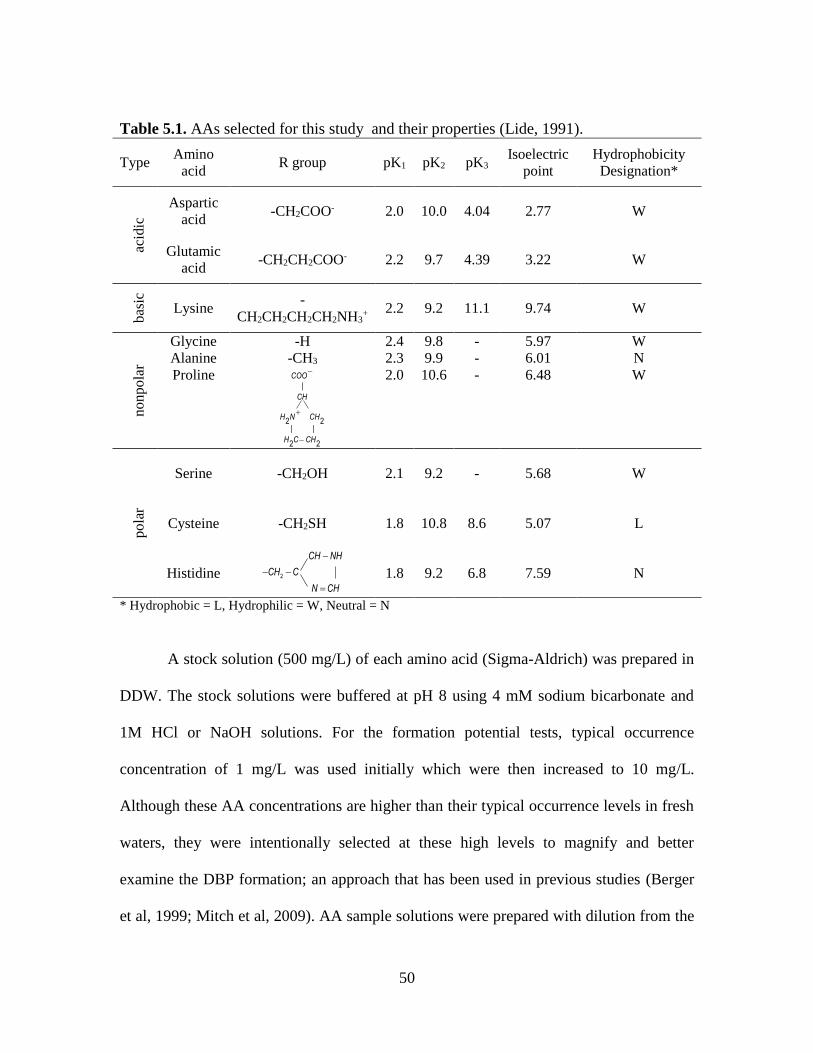
50
Table 5.1. AAs selected for this study and their properties (Lide, 1991).
Type Amino
acid R group pK1 pK2 pK3
Isoelectric
point
Hydrophobicity
Designation*
acid
ic
Aspartic
acid -CH2COO- 2.0 10.0 4.04 2.77 W
Glutamic
acid -CH2CH2COO- 2.2 9.7 4.39 3.22 W
bas
ic
Lysine -
CH2CH2CH2CH2NH3+
2.2 9.2 11.1 9.74 W
nonpola
r
Glycine
Alanine
Proline
-H
-CH3 COO
CH
|
2 2| |
2 2
H N CH
H C CH
2.4
2.3
2.0
9.8
9.9
10.6
-
-
-
5.97
6.01
6.48
W
N
W
pola
r
Serine -CH2OH 2.1 9.2 - 5.68 W
Cysteine -CH2SH 1.8 10.8 8.6 5.07 L
Histidine 2CH C
CH NH
N CH
1.8 9.2 6.8 7.59 N
* Hydrophobic = L, Hydrophilic = W, Neutral = N
A stock solution (500 mg/L) of each amino acid (Sigma-Aldrich) was prepared in
DDW. The stock solutions were buffered at pH 8 using 4 mM sodium bicarbonate and
1M HCl or NaOH solutions. For the formation potential tests, typical occurrence
concentration of 1 mg/L was used initially which were then increased to 10 mg/L.
Although these AA concentrations are higher than their typical occurrence levels in fresh
waters, they were intentionally selected at these high levels to magnify and better
examine the DBP formation; an approach that has been used in previous studies (Berger
et al, 1999; Mitch et al, 2009). AA sample solutions were prepared with dilution from the
51
main stock, and the concentrations were confirmed using a TOC analyzer (Shimadzu
Corp., USA).
Formation Potential Tests
The oxidation conditions that favor the formation of certain classes of DBPs were
used in the FP tests. Chloramination, ozonation and ozonation-chloramination were
applied for the nitrosamines FP tests. Each FP test was conducted in duplicates.
Monochloramine stock solution was prepared by mixing sodium hypochlorite (5-
6% available free chlorine) and ammonium sulfate solutions at a Cl2:N mass ratio of 4:1
(0.8:1 molar ratio) and pH 9. The dosage of chloramine was determined using the
formula approach developed by Krasner et al. (2009) (NH2Cl [mg/L] = 3 × DOC
[mg/L]). The concentrations of the free chlorine and monochloramine were measured
with SM 4500-Cl F (DPD Ferrous Titrimetric Method).
Ozonation was conducted by adding ozone stock solution to the samples. To
prepare the ozone stock solution, a 1 L gas washing bottle containing DDW with minimal
headspace was placed in an ice bath, and the solution was ozonated with an ozone
generator (Model GTC-1B, Griffin Technics Incorporated, NJ) fed with ultra-high purity
oxygen gas. In a typical ozone stock preparation, about 30 mg O3/L stock solution was
obtained within 30 min. Precalculated volumes of AA solutions were removed from the
125mL or 1L amber glass bottles used for the FP tests and replaced with the freshly
prepared ozone stock solution. Ozone concentration in the bottles at the beginning of the
experiments was approximately 4 mg/L that assured that ozone was not a limiting factor
during ozonation period. After ozone addition, the samples were mixed on a stir plate for
52
five minutes. The residual ozone concentrations were measured before chlorine or
chloramines addition to assure that there was ozone residual by the end of the ozonation
period. For chloramination samples without pre-ozonation, the same volume of solutions
was removed as for the ozonated samples and replaced with DDW to have the same
sample composition (e.g. for DOC, DON) as the pre-ozonated samples.
Experiments for nitrosamine FP test, were conducted in the 1L amber glass
bottles without headspace at room temperature (~22 oC) in the dark for five days.
Analytical Methods
N-nitrosamine samples were concentrated 500 times by SPE using 6-mL cartridge
prepacked with 2g of coconut charcoal (UCT). The extracts were analyzed with a Varian
GC-MS/MS 4000 under CI mode, using an RTX-5MS (Restek 30m × 0.25mm × 0.25μm)
column, for eight N-nitrosamines including NDMA, NDEA, NMEA, NMOR, NDPA,
NPYR, NPIP and NDBA. The MRL for each nitrosamine was 3 ng/L. DOC and DN were
measured using a Shimadzu TOC-VCHS high temperature combustion analyzer equipped
with a total nitrogen module (TNM-1). The MRLs for DOC and DN were 0.1 mg/L.
DON concentrations were equal to DN concentrations of AAs, since there was no
inorganic nitrogen in the stock solutions. All analytical methods and their minimum
reporting levels are given in Table 4.1.
53
Results and Discussion
Nitrosamines Formation from AAs
Initial nitrosamines FP test for three of the selected amino acids at 1 mg/L
concentration did not produce measurable nitrosamines. To further confirm the results, it
was decided to magnify the initial concentration of amino acids during the experiments
by increasing to 10 mg/L, and three different oxidation scenarios, monochloramination,
ozonation and ozonation-chloramination were tested for all nine AAs. Ozonation alone
was also examined because NDMA formation has recently been reported after ozonation
in laboratory studies (Andrzejewski et al, 2008; Yang et al, 2009) and in full scale
ozonation plants (Planas et al, 2008; Asami et al, 2009).
Despite increasing the amino acids concentrations to 10 mg/L, in most of the
cases, NDMA and NDBA FP concentrations were very low, such as 5 ng/L NDBA from
lysine after chloramination (Table 5.2). Mitch and co-workers reported non-detectable
nitrosamine (NDMA, NMEA and NDEA) formation from aspartic acid, proline and
histidine during chloramination (Mitch and Sedlak, 2002); and NDMA formation of
<2ng/L from glycine and tyrosine during chloramination (Mitch et al, 2006).
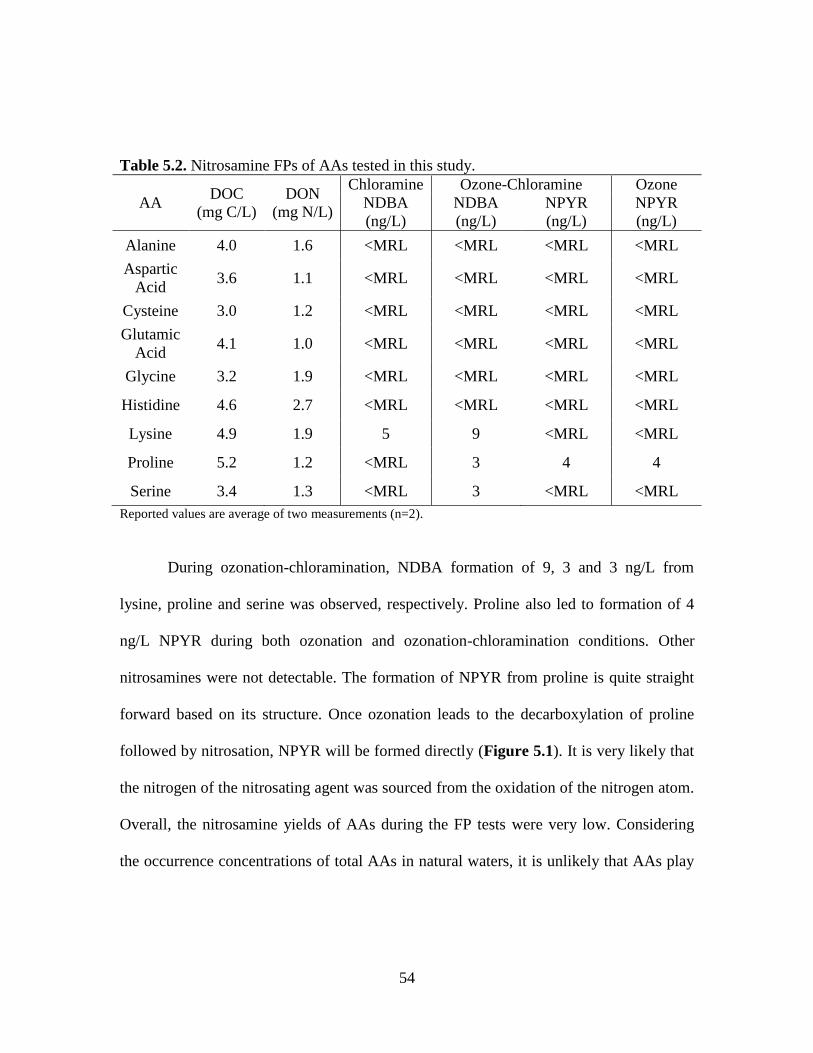
54
Table 5.2. Nitrosamine FPs of AAs tested in this study.
AA DOC
(mg C/L)
DON
(mg N/L)
Chloramine Ozone-Chloramine Ozone
NDBA
(ng/L)
NDBA
(ng/L)
NPYR
(ng/L)
NPYR
(ng/L)
Alanine 4.0 1.6 <MRL <MRL <MRL <MRL
Aspartic
Acid 3.6 1.1 <MRL <MRL <MRL <MRL
Cysteine 3.0 1.2 <MRL <MRL <MRL <MRL
Glutamic
Acid 4.1 1.0 <MRL <MRL <MRL <MRL
Glycine 3.2 1.9 <MRL <MRL <MRL <MRL
Histidine 4.6 2.7 <MRL <MRL <MRL <MRL
Lysine 4.9 1.9 5 9 <MRL <MRL
Proline 5.2 1.2 <MRL 3 4 4
Serine 3.4 1.3 <MRL 3 <MRL <MRL
Reported values are average of two measurements (n=2).
During ozonation-chloramination, NDBA formation of 9, 3 and 3 ng/L from
lysine, proline and serine was observed, respectively. Proline also led to formation of 4
ng/L NPYR during both ozonation and ozonation-chloramination conditions. Other
nitrosamines were not detectable. The formation of NPYR from proline is quite straight
forward based on its structure. Once ozonation leads to the decarboxylation of proline
followed by nitrosation, NPYR will be formed directly (Figure 5.1). It is very likely that
the nitrogen of the nitrosating agent was sourced from the oxidation of the nitrogen atom.
Overall, the nitrosamine yields of AAs during the FP tests were very low. Considering
the occurrence concentrations of total AAs in natural waters, it is unlikely that AAs play
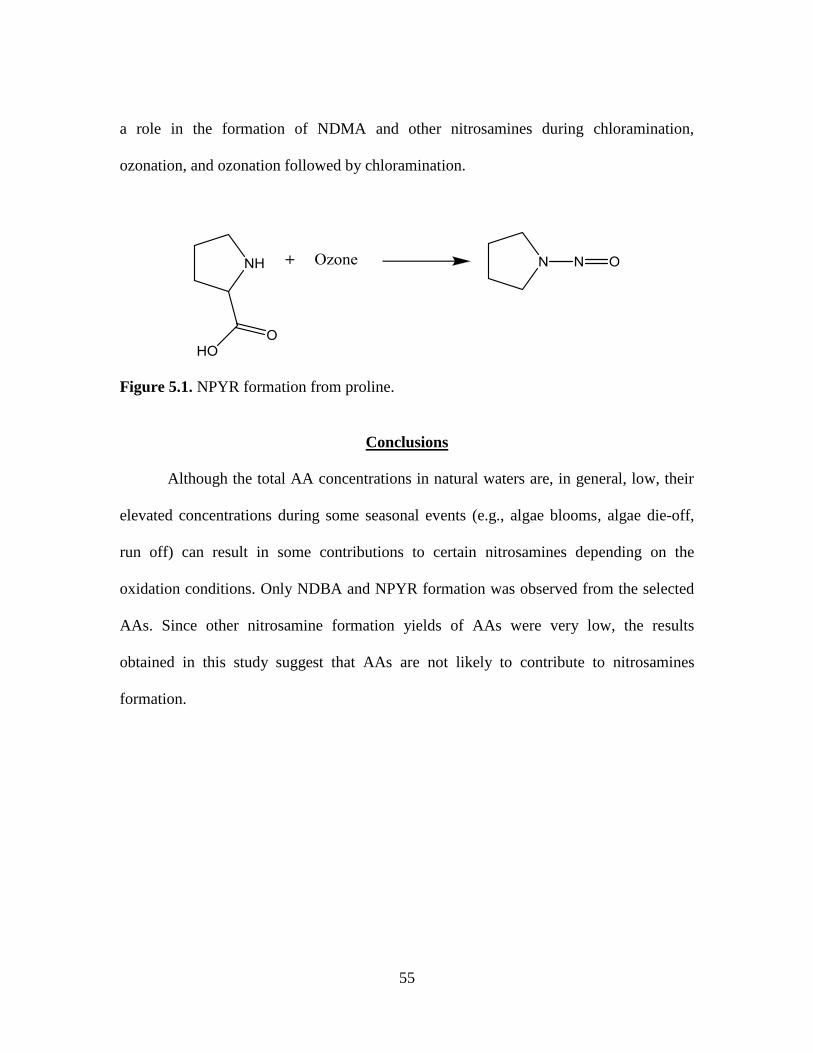
55
a role in the formation of NDMA and other nitrosamines during chloramination,
ozonation, and ozonation followed by chloramination.
Figure 5.1. NPYR formation from proline.
Conclusions
Although the total AA concentrations in natural waters are, in general, low, their
elevated concentrations during some seasonal events (e.g., algae blooms, algae die-off,
run off) can result in some contributions to certain nitrosamines depending on the
oxidation conditions. Only NDBA and NPYR formation was observed from the selected
AAs. Since other nitrosamine formation yields of AAs were very low, the results
obtained in this study suggest that AAs are not likely to contribute to nitrosamines
formation.
56
CHAPTER SIX
6. THE ROLES OF TERTIARY AMINE STRUCTURE, BACKGROUND ORGANIC
MATTER AND CHLORAMINE SPECIES ON NDMA FORMATION
Introduction and Objective
Nitrosamines are a group of compounds classified as probable human carcinogens
in water at concentrations as low as 0.2 ng/L associated with a 10–6 lifetime cancer risk
(USEPA, 1993). They form as DBPs in chloraminated and chlorinated drinking waters
and wastewaters (Choi and Valentine, 2002a,b; Choi et al., 2002; Mitch and Sedlak,
2002, 2004). NDMA is the most commonly detected and reported nitrosamine in drinking
water. Although there are currently no federal regulations for nitrosamines in drinking
water in the United States, the USEPA has recently identified nitrosamines as one of
three potential groups of contaminants highlighted for possible regulatory action in the
near future (Roberson, 2011).
Although an organic nitrogen precursor is required for NDMA formation, there is
no strong correlation between dissolved organic nitrogen concentrations and NDMA
formation potentials in natural waters (Pehlivanoglu-Mantas and Sedlak, 2008; Dotson et
al., 2009; Aydin et al., 2012). Research evaluating the NDMA formation potential of
several compounds has encompassed DMA (Mitch et al., 2003a,b), tertiary and
quaternary amines with DMA functional groups (Lee et al., 2007; Kemper et al., 2010;
Shen and Andrews, 2011a,b), NOM and fractions of NOM (Gerecke and Sedlak, 2003;
57
Mitch and Sedlak, 2004; Chen and Valentine, 2007; Dotson et al., 2007; Krasner et al.,
2008a), polyelectrolytes and ion-exchange resins (Gough et al., 1977; Kimoto et al.,
1980; Najm and Trussell, 2001; Kohut and Andrews, 2003; Wilczak et al., 2003; Mitch
and Sedlak, 2004; Nawrocki and Andrzejewski, 2011), fungicides, pesticides, and
herbicides (Graham et al., 1995; Chen and Young, 2008; Schmidt and Brauch, 2008),
pharmaceuticals, cosmetics (Sacher et al., 2008; Shen and Andrews, 2011a,b), and
wastewater effluent/impacted waters (Krasner et al., 2004; Sedlak et al., 2005; Krasner et
al., 2009; Krauss et al., 2009; Shah et al., 2012).
Different mechanisms have been proposed for NDMA formation with different
oxidants (e.g., chlorine, chloramines and ozone), as reviewed in detail elsewhere (Bond et
al., 2011; Shah and Mitch, 2012). For chloramination, NDMA formation was initially
attributed to a nucleophilic substitution reaction between monochloramine and
unprotonated secondary amines (e.g., DMA) to form UDMH intermediates (Mitch and
Sedlak, 2002; Choi and Valentine, 2002a,b). However, further studies have shown that
chloramination of UDMH yielded much less NDMA than DMA (Mitch et al., 2009).
Moreover, dichloramine has been shown to enhance NDMA formation from DMA
through the formation of a Cl-UDMH (Mitch et al., 2009). In the same study, Mitch and
colleagues proposed that NDMA formation from quaternary or tertiary amines includes
liberation of the DMA moiety via reaction of chlorine or monochloramine and released
the DMA group further reacts with dichloramine resulting in NDMA formation. After
testing of several compounds in recent years as listed above, there are some limitations to
explain the formation of NDMA from different precursors using only this pathway during
58
chloramination. For example, (i) the reported NDMA conversion rates from DMA were
at most 3.0% and usually 1-2% (Choi and Valentine, 2002a,b; Choi et al., 2002; Mitch
and Sedlak, 2002; Schreiber and Mitch, 2005, 2006; Lee et al., 2007a; Le Roux et al.,
2012a). However, some model compounds (e.g., RNTD, sumatripan) have resulted in
significantly higher NDMA yields (>>5%) than DMA (Mitch et al., 2009; Le Roux et al.,
2011a; Shen and Andrews, 2011a). (ii) Although the proposed pathway emphasizes the
significance of dichloramine in NDMA formation, higher NDMA concentrations were
observed at pH 8.8 than both pH 6.9 and 5.1 during chloramination of DMA (Schreiber
and Mitch, 2005) and a similar trend was observed for natural waters (Krasner et al.,
2012a). Monochloramine becomes more stable with increasing pH, and significantly less
dichloramine is produced. Le Roux et al. (2011a) reported a decrease in NDMA
formation from ranitidine when they switched from monochloramine to dichloramine
(i.e., yield decreased from 80.2 to 46.8%). Therefore, the major NDMA formation
pathway may not always be limited to dichloramine as the only chloramine species. (iii)
The formation of NDMA may also be influenced from the components in the background
water matrices (e.g., NOM, bromide, other ions) (Le Roux et al., 2011b; Shen and
Andrews, 2011a,b; Le Roux et al., 2012a; Luh and Marinas, 2012; Shah et al., 2012). (iv)
DMA concentrations detected in surface waters (Gerecke and Sedlak, 2003; Lee et al.,
2007a) or secondary municipal wastewaters (Mitch and Sedlak, 2004) did not explain the
observed levels of NDMA formation.
It is evident that there is still much more to learn about the formation of NDMA in
natural waters. For example, the structural characteristics of quaternary or tertiary amines
59
with a DMA group are of importance (Shah and Mitch, 2012). The main objectives of
this study were to systematically investigate (i) the effect of tertiary amine structure, (ii)
the effect of background NOM, and (iii) the roles of mono vs. dichloramine species on
the NDMA formation. To explore the effect of tertiary amine structure, DMA and 20
different tertiary aliphatic and aromatic amines were carefully selected based on their
functional groups attached to the basic DMA structure. The NOM effect was initially
investigated by spiking the selected amines in a solution prepared with one of two NOM
fractions individually to eliminate the confounding effects that may come from the other
constituents in the background matrices of natural waters. Experiments were also
conducted with Myrtle Beach, SC, raw and treated (i.e., after conventional clarification
processes) waters with negligible bromide concentrations. Finally, the selectivity and
sensitivity of amine precursors to monochloramine and dichloramine species were
examined for selected compounds.
Materials and Methods
Amines
DMA and 20 tertiary amines were tested for nitrosamine formation. Chemical
structures and abbreviations of selected amines are given in Figure 6.1. All compounds
were purchased from certified vendors (Sigma-Aldrich, TCI, Matrix Scientific, and Santa
Cruz Biotechnology) and used without further purification. Tertiary aliphatic amines
were chosen based on their chain length and functional groups attached to DMA
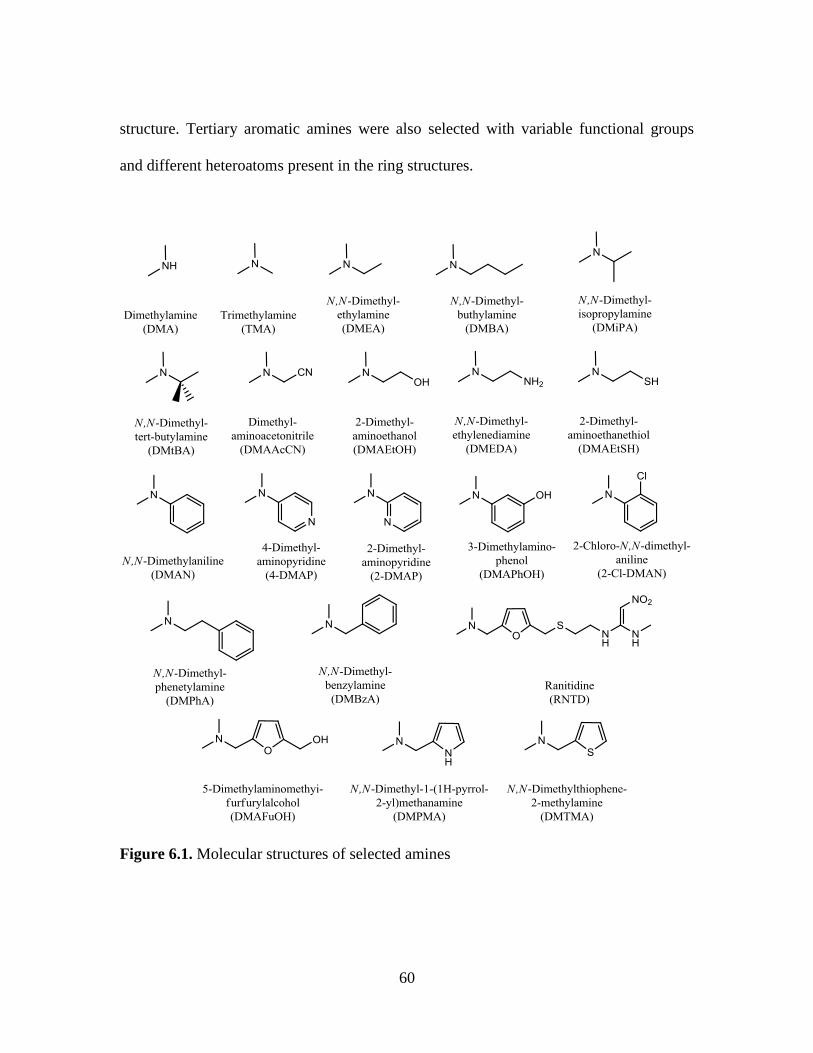
60
structure. Tertiary aromatic amines were also selected with variable functional groups
and different heteroatoms present in the ring structures.
Figure 6.1. Molecular structures of selected amines
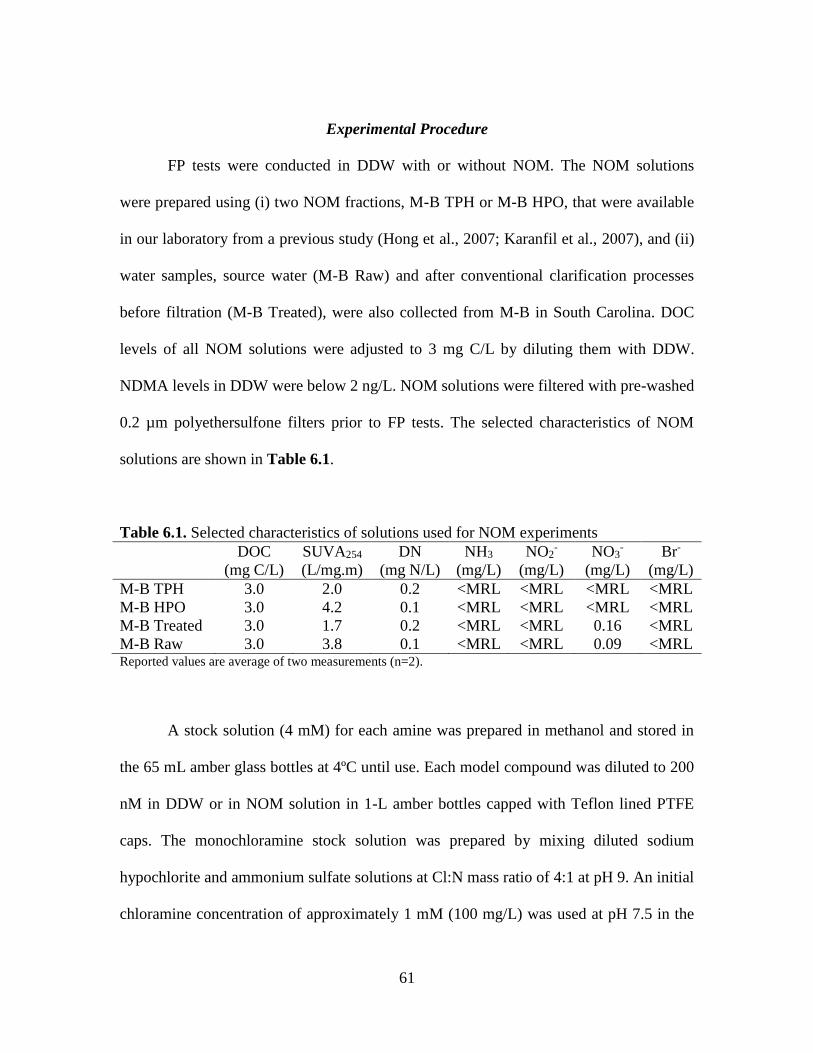
61
Experimental Procedure
FP tests were conducted in DDW with or without NOM. The NOM solutions
were prepared using (i) two NOM fractions, M-B TPH or M-B HPO, that were available
in our laboratory from a previous study (Hong et al., 2007; Karanfil et al., 2007), and (ii)
water samples, source water (M-B Raw) and after conventional clarification processes
before filtration (M-B Treated), were also collected from M-B in South Carolina. DOC
levels of all NOM solutions were adjusted to 3 mg C/L by diluting them with DDW.
NDMA levels in DDW were below 2 ng/L. NOM solutions were filtered with pre-washed
0.2 µm polyethersulfone filters prior to FP tests. The selected characteristics of NOM
solutions are shown in Table 6.1.
Table 6.1. Selected characteristics of solutions used for NOM experiments
DOC
(mg C/L)
SUVA254
(L/mg.m)
DN
(mg N/L)
NH3
(mg/L)
NO2-
(mg/L)
NO3-
(mg/L)
Br-
(mg/L)
M-B TPH 3.0 2.0 0.2 <MRL <MRL <MRL <MRL
M-B HPO 3.0 4.2 0.1 <MRL <MRL <MRL <MRL
M-B Treated 3.0 1.7 0.2 <MRL <MRL 0.16 <MRL
M-B Raw 3.0 3.8 0.1 <MRL <MRL 0.09 <MRL Reported values are average of two measurements (n=2).
A stock solution (4 mM) for each amine was prepared in methanol and stored in
the 65 mL amber glass bottles at 4ºC until use. Each model compound was diluted to 200
nM in DDW or in NOM solution in 1-L amber bottles capped with Teflon lined PTFE
caps. The monochloramine stock solution was prepared by mixing diluted sodium
hypochlorite and ammonium sulfate solutions at Cl:N mass ratio of 4:1 at pH 9. An initial
chloramine concentration of approximately 1 mM (100 mg/L) was used at pH 7.5 in the
62
presence of 10 mM phosphate buffer which was prepared by mixing sodium phosphate
monobasic and sodium phosphate dibasic. For the NOM experiments, a solution of TPH
or HPO was prepared by adding each fraction in DDW with buffer prior to the addition of
the target compound; and it was chloraminated under the same conditions used for the
DDW experiments. For the experiments with the M-B raw and treated waters, the target
amine (200 nM) was spiked directly in the waters.
The roles of monochloramine and dichloramine on NDMA formation were
assessed by conducting FP test using a lower dose of chloramine (5 mg/L as Cl2) with
and without ammonia in DDW. The presence of ammonia suppresses the decomposition
of monochloramine to dichloramine during FP tests (Hong et al., 2007). Some additional
information about the chloramine chemistry can be found in the Appendix A. Therefore,
two parallel FP tests were conducted: (i) Cl:N ratio of 4:1 without ammonia addition (i.e.,
having both mono- and dichloramine present with a maximum of 5% dichloramine
content), and (ii) Cl:N ratio of 4:1 in the presence of 100 mg/L ammonia (i.e., only
monochloramine in the bottles and the concentration of dichloramine was below its
detection limit of 0.05 mg/L). These experiments were conducted with an initial
monochloramine concentration of 5 mg/L as Cl2 to control chloramine speciation at pH
7.5 using 4 mM carbonate buffer. The initial chloramine concentrations (i.e., either 5 or
100 mg/L) were enough to provide excess amount of chloramine for all FP tests. All the
nitrosamine FP tests in this study were carried out in 1-L amber glass bottles without
headspace in the dark at 22ºC and for five days of contact time.
63
Analytical methods
NDMA was analyzed following USEPA method 521 (USEPA, 2004). Calibration
solutions were prepared from an NDMA stock. Typical calibration curves were generated
from at least six standard points and the minimum reporting level was 3 ng/L. For the
sample analysis, 500 mL of chloraminated amine solutions were taken and quenched with
100 mg of sodium thiosulfate. N-nitrosodimethylamine-d6 (NDMA-d6) was added to the
samples as a surrogate before SPE. Samples were passed through cartridges pre-packed
with 2 g of coconut charcoal. Prior to sample extraction, cartridges were preconditioned
with DCM, methanol, and DDW. After SPE, cartridges were dried with air, and then
eluted with dichloromethane. Eluted samples were passed through cartridges pre-packed
with 6 g of sodium sulfate and concentrated to 1 mL under high purity nitrogen gas. The
extracts were spiked with N-nitrosodi-n-propylamine-d14 (NDPA-d14) as an internal
standard, and analyzed using a Varian GC-MS/MS 4000 equipped with RTX-5MS
(Restek 30m × 0.25mm × 0.25μm) column and under the CI mode. Measured NDMA
concentrations were used to calculate percent molar yield for each amine using Equation
6.1 (Appendix B).
NDMA Yield (%)= ([NDMA] (nM)
[Amine]0 (nM)⁄ ) ×100 Equation 6.1
DOC and DN were determined using a Shimadzu TOC-VCSH instrument
equipped with a Total Nitrogen module (TNM-1). UV254 absorbance of NOM samples
was measured using a Varian Cary-50 spectrophotometer, and used to calculate SUVA254
values (Karanfil et al., 2002). Ammonia concentrations were measured with a HACH
spectrophotometer. Nitrite, nitrate, and bromide were measured using an ion
64
chromatograph (Dionex, ICS 2100). Concentrations of free chlorine, and mono- and
dichloramine as free chlorine were determined following SM 4500-Cl F
(APHA/AWWA/WEF, 2005). All analytical methods and their MRLs are given in Table
4.1. All samples and blanks were prepared and extracted in duplicates, and then each
extract was analyzed on GC-MS/MS as described in Chapter Four. Error bars in all the
graphs show the variability due to multiple extraction and analysis (n=4) under the same
conditions.
Results and Discussion
Effect of Amine Structure on NDMA Formation
Table 6.2 shows the NDMA yields observed from the chloramination of 21
selected amines (10 aliphatic and 11 aromatic) during the FP tests along with the yields
reported in the literature for the purpose of comparison. The yields obtained for DMA
and RNTD in this study agree well with those reported in the literature (Lee et al., 2007a;
Mitch et al., 2009; Shen and Andrews, 2011a,b; Le Roux et al., 2012a) despite some
differences in the experimental conditions of FP tests (e.g., contact time, buffer type, and
pH) (Table 6.3).
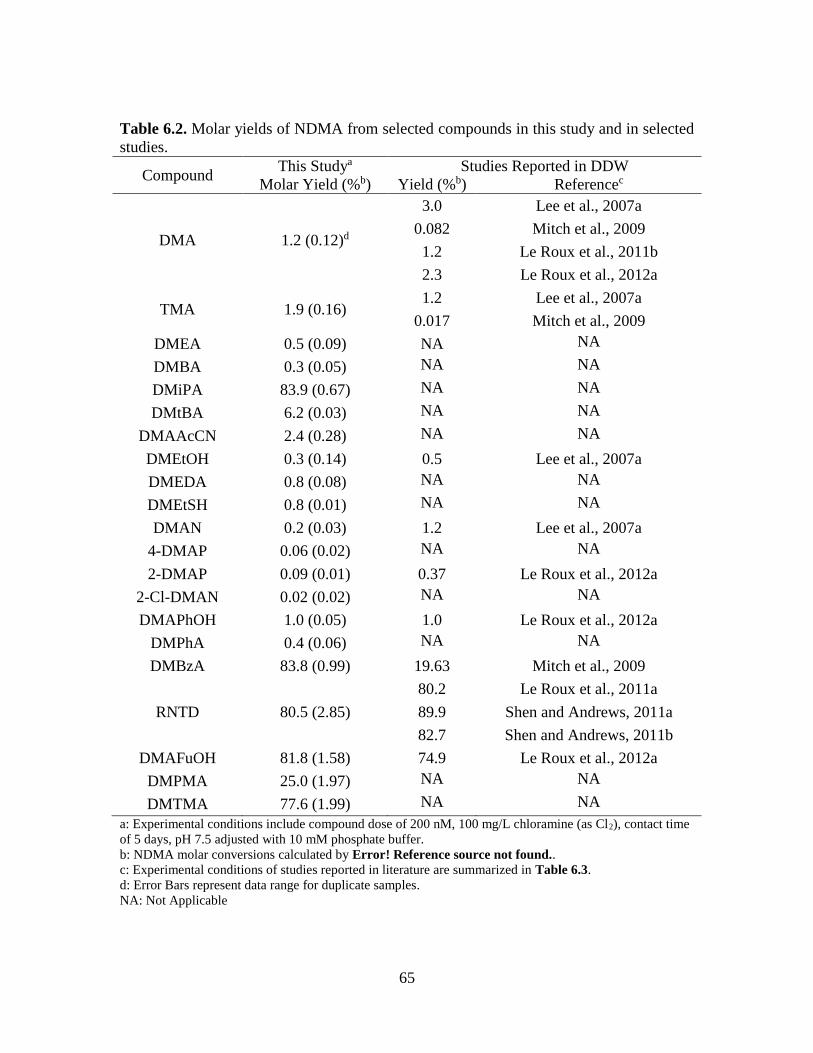
65
Table 6.2. Molar yields of NDMA from selected compounds in this study and in selected
studies.
Compound This Studya Studies Reported in DDW
Molar Yield (%b) Yield (%b) Referencec
DMA 1.2 (0.12)d
3.0 Lee et al., 2007a
0.082 Mitch et al., 2009
1.2 Le Roux et al., 2011b
2.3 Le Roux et al., 2012a
TMA 1.9 (0.16) 1.2 Lee et al., 2007a
0.017 Mitch et al., 2009
DMEA 0.5 (0.09) NA NA
DMBA 0.3 (0.05) NA NA
DMiPA 83.9 (0.67) NA NA
DMtBA 6.2 (0.03) NA NA
DMAAcCN 2.4 (0.28) NA NA
DMEtOH 0.3 (0.14) 0.5 Lee et al., 2007a
DMEDA 0.8 (0.08) NA NA
DMEtSH 0.8 (0.01) NA NA
DMAN 0.2 (0.03) 1.2 Lee et al., 2007a
4-DMAP 0.06 (0.02) NA NA
2-DMAP 0.09 (0.01) 0.37 Le Roux et al., 2012a
2-Cl-DMAN 0.02 (0.02) NA NA
DMAPhOH 1.0 (0.05) 1.0 Le Roux et al., 2012a
DMPhA 0.4 (0.06) NA NA
DMBzA 83.8 (0.99) 19.63 Mitch et al., 2009
RNTD 80.5 (2.85)
80.2 Le Roux et al., 2011a
89.9 Shen and Andrews, 2011a
82.7 Shen and Andrews, 2011b
DMAFuOH 81.8 (1.58) 74.9 Le Roux et al., 2012a
DMPMA 25.0 (1.97) NA NA
DMTMA 77.6 (1.99) NA NA
a: Experimental conditions include compound dose of 200 nM, 100 mg/L chloramine (as Cl2), contact time
of 5 days, pH 7.5 adjusted with 10 mM phosphate buffer.
b: NDMA molar conversions calculated by Error! Reference source not found..
c: Experimental conditions of studies reported in literature are summarized in Table 6.3.
d: Error Bars represent data range for duplicate samples.
NA: Not Applicable
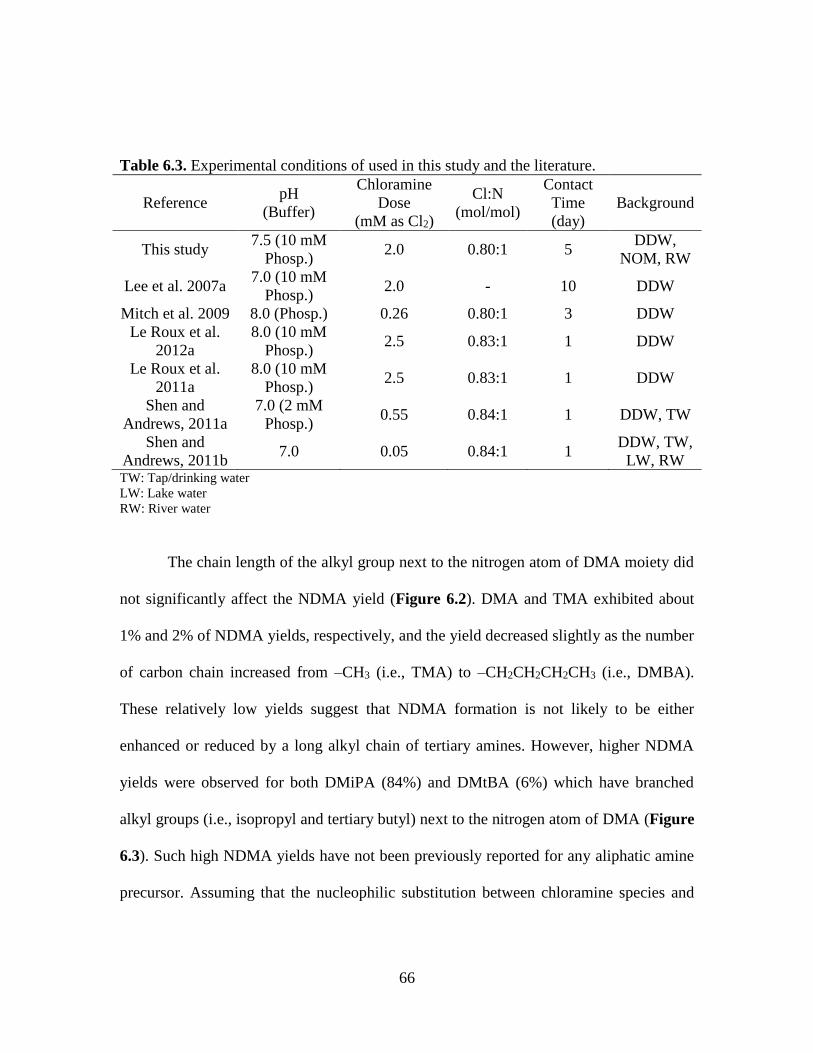
66
Table 6.3. Experimental conditions of used in this study and the literature.
Reference pH
(Buffer)
Chloramine
Dose
(mM as Cl2)
Cl:N
(mol/mol)
Contact
Time
(day)
Background
This study 7.5 (10 mM
Phosp.) 2.0 0.80:1 5
DDW,
NOM, RW
Lee et al. 2007a 7.0 (10 mM
Phosp.) 2.0 - 10 DDW
Mitch et al. 2009 8.0 (Phosp.) 0.26 0.80:1 3 DDW
Le Roux et al.
2012a
8.0 (10 mM
Phosp.) 2.5 0.83:1 1 DDW
Le Roux et al.
2011a
8.0 (10 mM
Phosp.) 2.5 0.83:1 1 DDW
Shen and
Andrews, 2011a
7.0 (2 mM
Phosp.) 0.55 0.84:1 1 DDW, TW
Shen and
Andrews, 2011b 7.0 0.05 0.84:1 1
DDW, TW,
LW, RW TW: Tap/drinking water
LW: Lake water
RW: River water
The chain length of the alkyl group next to the nitrogen atom of DMA moiety did
not significantly affect the NDMA yield (Figure 6.2). DMA and TMA exhibited about
1% and 2% of NDMA yields, respectively, and the yield decreased slightly as the number
of carbon chain increased from –CH3 (i.e., TMA) to –CH2CH2CH2CH3 (i.e., DMBA).
These relatively low yields suggest that NDMA formation is not likely to be either
enhanced or reduced by a long alkyl chain of tertiary amines. However, higher NDMA
yields were observed for both DMiPA (84%) and DMtBA (6%) which have branched
alkyl groups (i.e., isopropyl and tertiary butyl) next to the nitrogen atom of DMA (Figure
6.3). Such high NDMA yields have not been previously reported for any aliphatic amine
precursor. Assuming that the nucleophilic substitution between chloramine species and
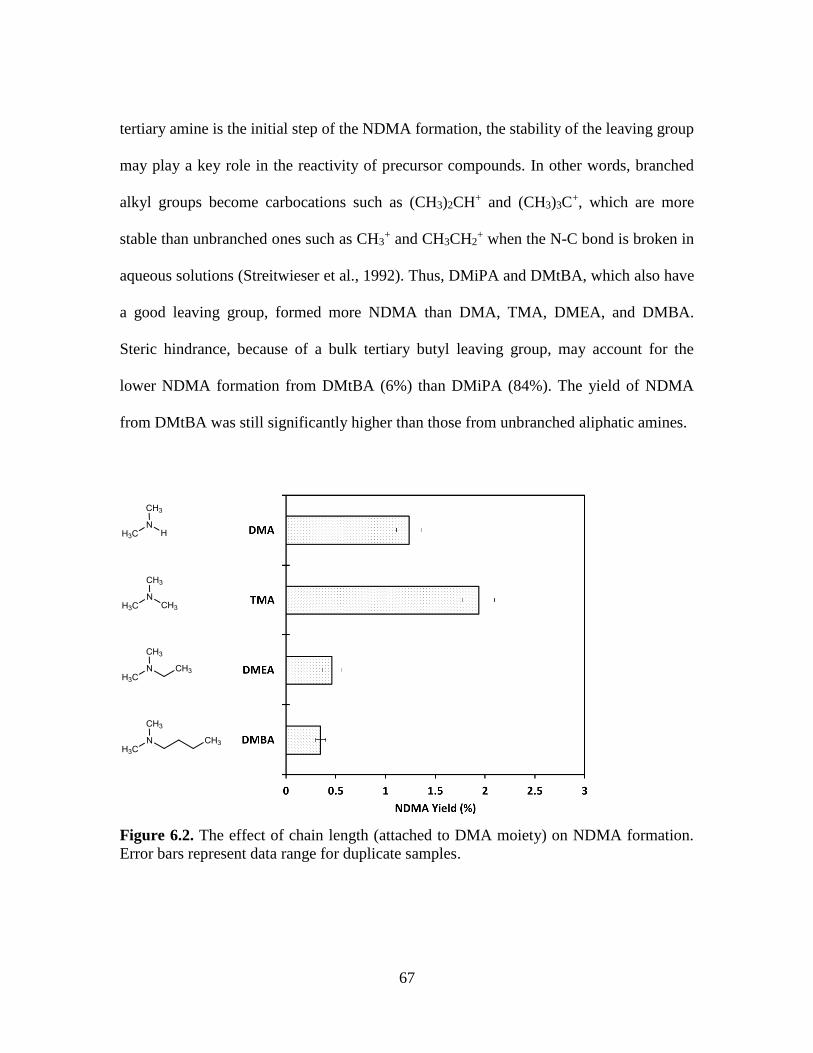
67
tertiary amine is the initial step of the NDMA formation, the stability of the leaving group
may play a key role in the reactivity of precursor compounds. In other words, branched
alkyl groups become carbocations such as (CH3)2CH+ and (CH3)3C+, which are more
stable than unbranched ones such as CH3+ and CH3CH2
+ when the N-C bond is broken in
aqueous solutions (Streitwieser et al., 1992). Thus, DMiPA and DMtBA, which also have
a good leaving group, formed more NDMA than DMA, TMA, DMEA, and DMBA.
Steric hindrance, because of a bulk tertiary butyl leaving group, may account for the
lower NDMA formation from DMtBA (6%) than DMiPA (84%). The yield of NDMA
from DMtBA was still significantly higher than those from unbranched aliphatic amines.
Figure 6.2. The effect of chain length (attached to DMA moiety) on NDMA formation.
Error bars represent data range for duplicate samples.
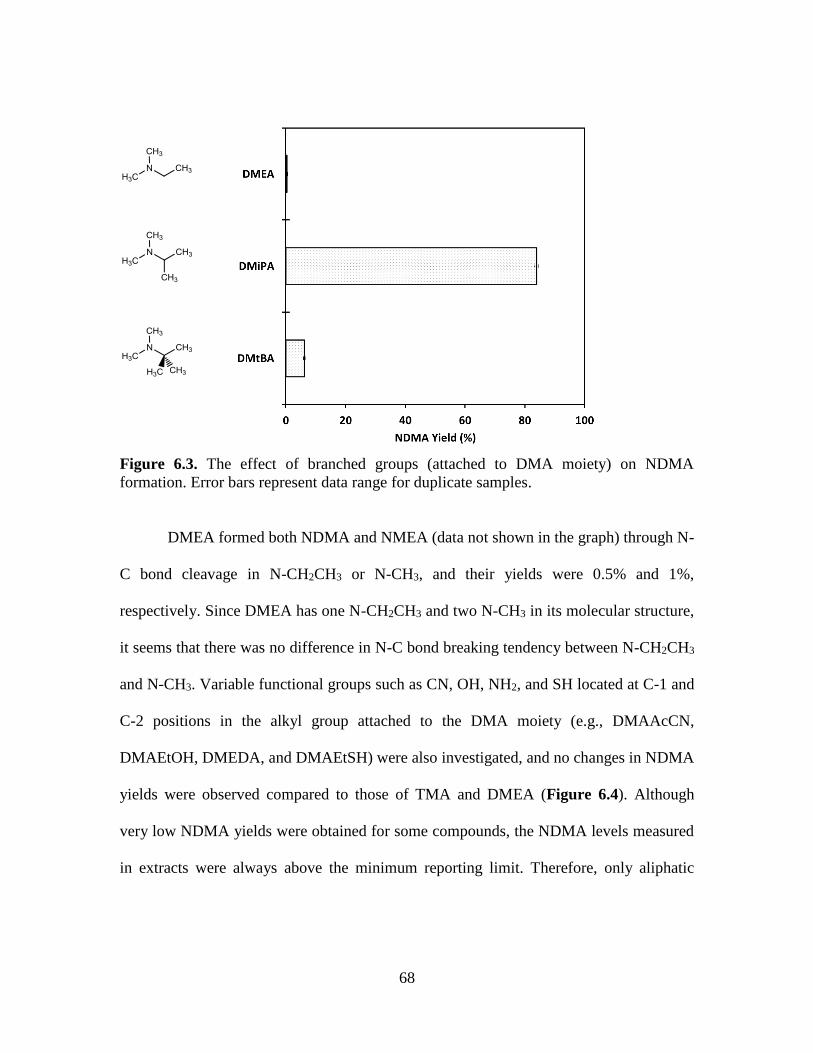
68
Figure 6.3. The effect of branched groups (attached to DMA moiety) on NDMA
formation. Error bars represent data range for duplicate samples.
DMEA formed both NDMA and NMEA (data not shown in the graph) through N-
C bond cleavage in N-CH2CH3 or N-CH3, and their yields were 0.5% and 1%,
respectively. Since DMEA has one N-CH2CH3 and two N-CH3 in its molecular structure,
it seems that there was no difference in N-C bond breaking tendency between N-CH2CH3
and N-CH3. Variable functional groups such as CN, OH, NH2, and SH located at C-1 and
C-2 positions in the alkyl group attached to the DMA moiety (e.g., DMAAcCN,
DMAEtOH, DMEDA, and DMAEtSH) were also investigated, and no changes in NDMA
yields were observed compared to those of TMA and DMEA (Figure 6.4). Although
very low NDMA yields were obtained for some compounds, the NDMA levels measured
in extracts were always above the minimum reporting limit. Therefore, only aliphatic
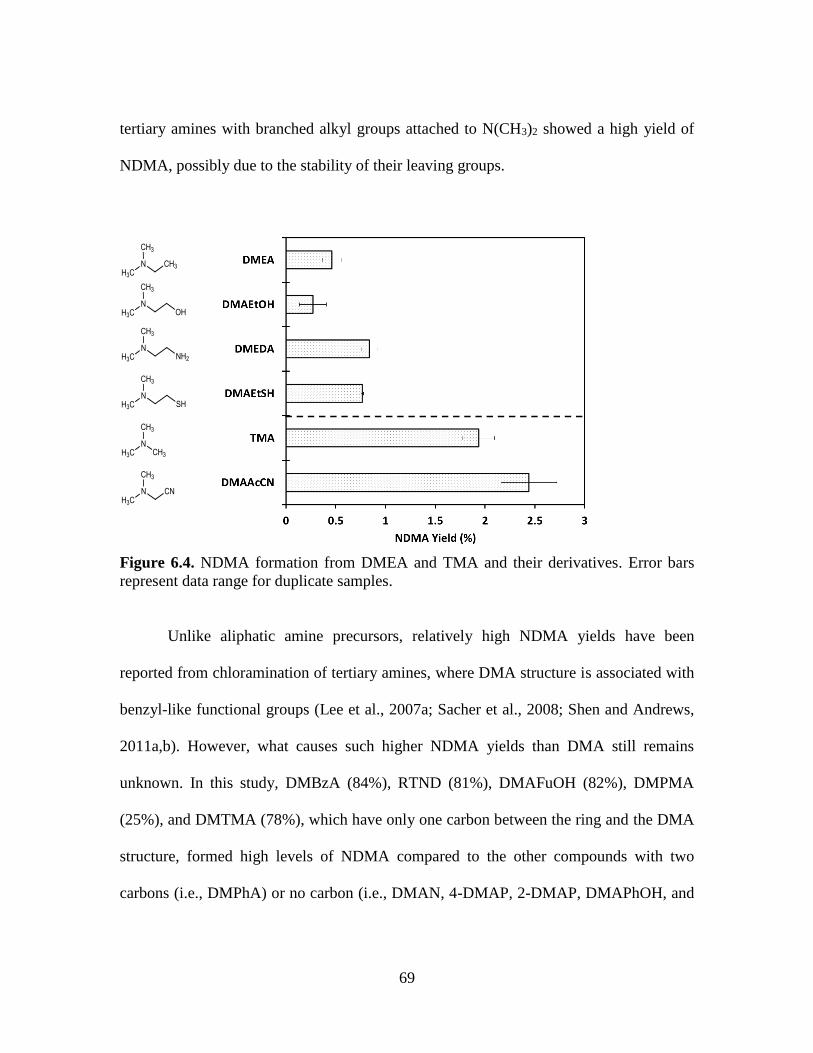
69
tertiary amines with branched alkyl groups attached to N(CH3)2 showed a high yield of
NDMA, possibly due to the stability of their leaving groups.
Figure 6.4. NDMA formation from DMEA and TMA and their derivatives. Error bars
represent data range for duplicate samples.
Unlike aliphatic amine precursors, relatively high NDMA yields have been
reported from chloramination of tertiary amines, where DMA structure is associated with
benzyl-like functional groups (Lee et al., 2007a; Sacher et al., 2008; Shen and Andrews,
2011a,b). However, what causes such higher NDMA yields than DMA still remains
unknown. In this study, DMBzA (84%), RTND (81%), DMAFuOH (82%), DMPMA
(25%), and DMTMA (78%), which have only one carbon between the ring and the DMA
structure, formed high levels of NDMA compared to the other compounds with two
carbons (i.e., DMPhA) or no carbon (i.e., DMAN, 4-DMAP, 2-DMAP, DMAPhOH, and
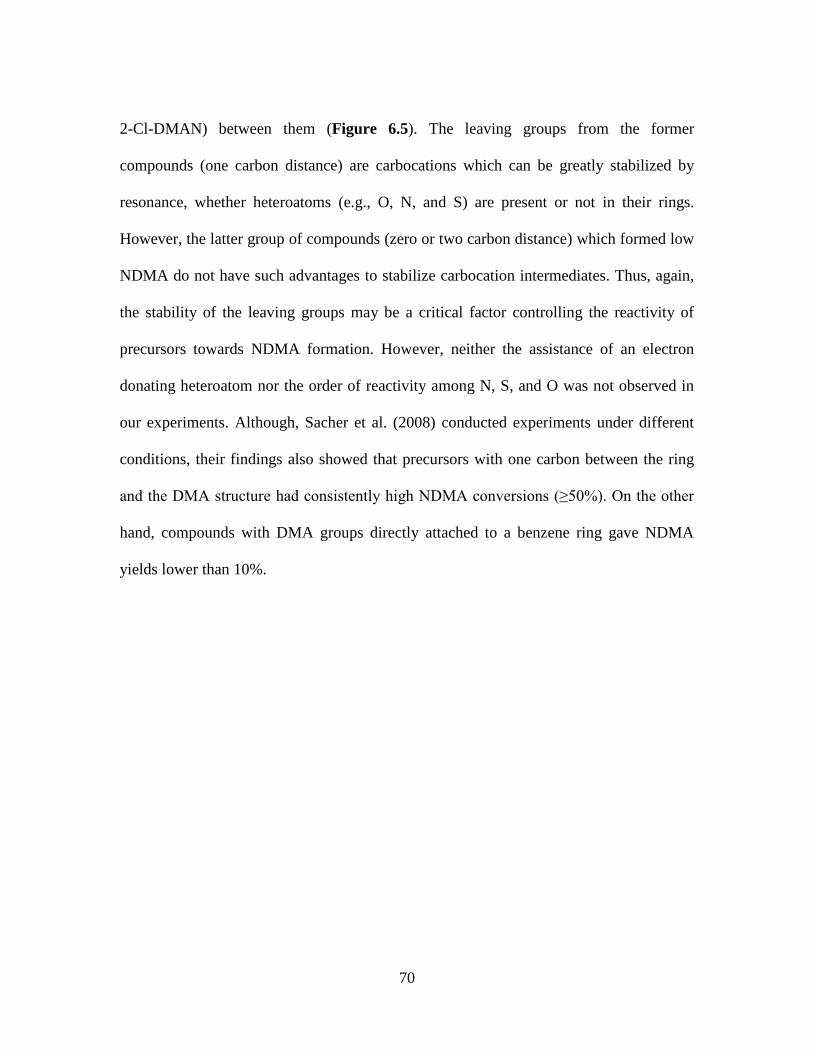
70
2-Cl-DMAN) between them (Figure 6.5). The leaving groups from the former
compounds (one carbon distance) are carbocations which can be greatly stabilized by
resonance, whether heteroatoms (e.g., O, N, and S) are present or not in their rings.
However, the latter group of compounds (zero or two carbon distance) which formed low
NDMA do not have such advantages to stabilize carbocation intermediates. Thus, again,
the stability of the leaving groups may be a critical factor controlling the reactivity of
precursors towards NDMA formation. However, neither the assistance of an electron
donating heteroatom nor the order of reactivity among N, S, and O was not observed in
our experiments. Although, Sacher et al. (2008) conducted experiments under different
conditions, their findings also showed that precursors with one carbon between the ring
and the DMA structure had consistently high NDMA conversions (≥50%). On the other
hand, compounds with DMA groups directly attached to a benzene ring gave NDMA
yields lower than 10%.
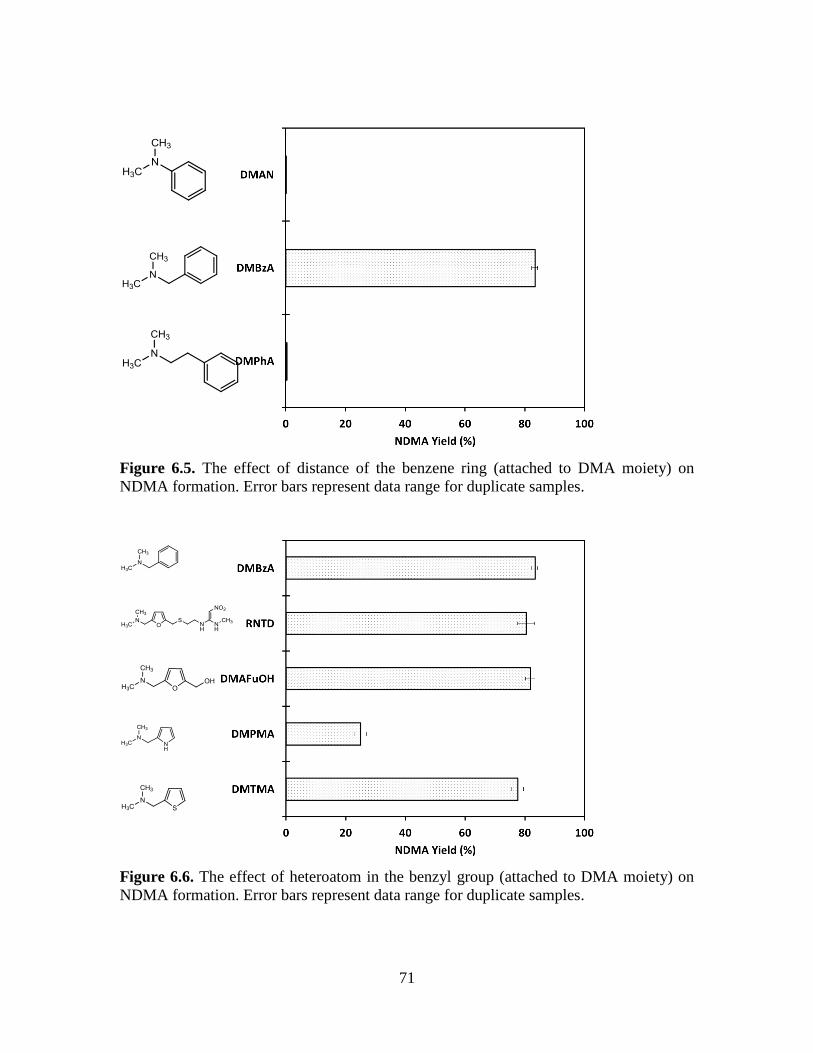
71
Figure 6.5. The effect of distance of the benzene ring (attached to DMA moiety) on
NDMA formation. Error bars represent data range for duplicate samples.
Figure 6.6. The effect of heteroatom in the benzyl group (attached to DMA moiety) on
NDMA formation. Error bars represent data range for duplicate samples.
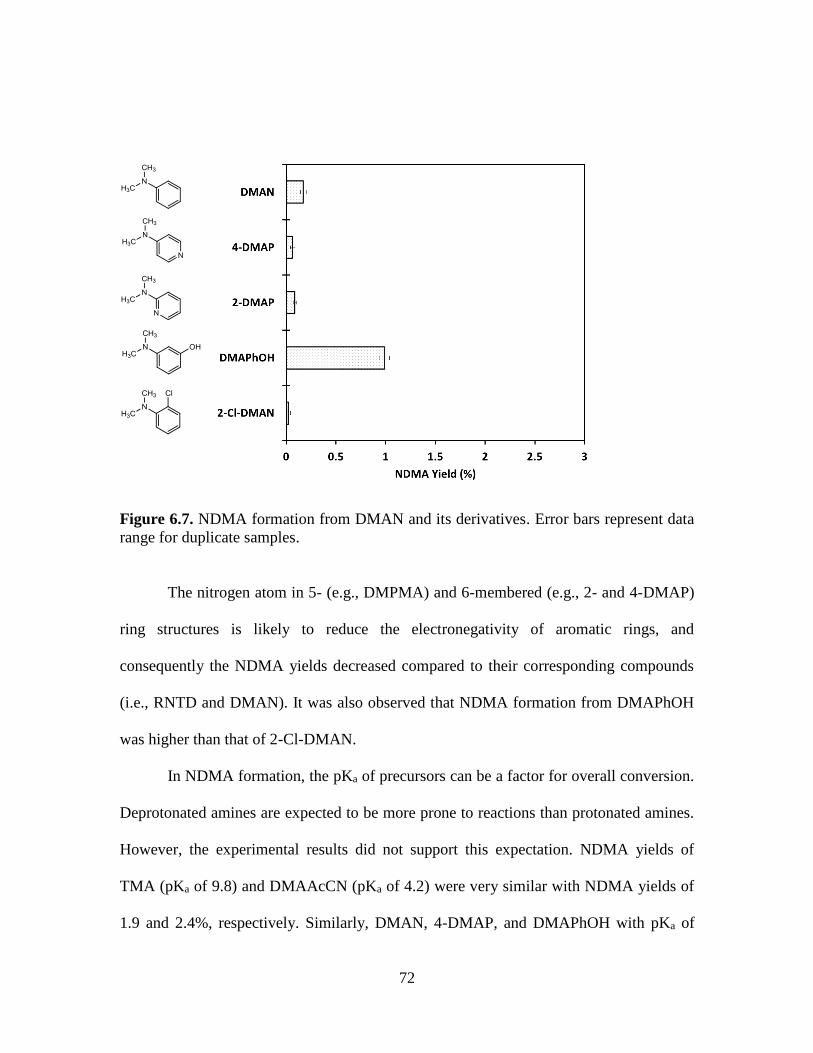
72
Figure 6.7. NDMA formation from DMAN and its derivatives. Error bars represent data
range for duplicate samples.
The nitrogen atom in 5- (e.g., DMPMA) and 6-membered (e.g., 2- and 4-DMAP)
ring structures is likely to reduce the electronegativity of aromatic rings, and
consequently the NDMA yields decreased compared to their corresponding compounds
(i.e., RNTD and DMAN). It was also observed that NDMA formation from DMAPhOH
was higher than that of 2-Cl-DMAN.
In NDMA formation, the pKa of precursors can be a factor for overall conversion.
Deprotonated amines are expected to be more prone to reactions than protonated amines.
However, the experimental results did not support this expectation. NDMA yields of
TMA (pKa of 9.8) and DMAAcCN (pKa of 4.2) were very similar with NDMA yields of
1.9 and 2.4%, respectively. Similarly, DMAN, 4-DMAP, and DMAPhOH with pKa of
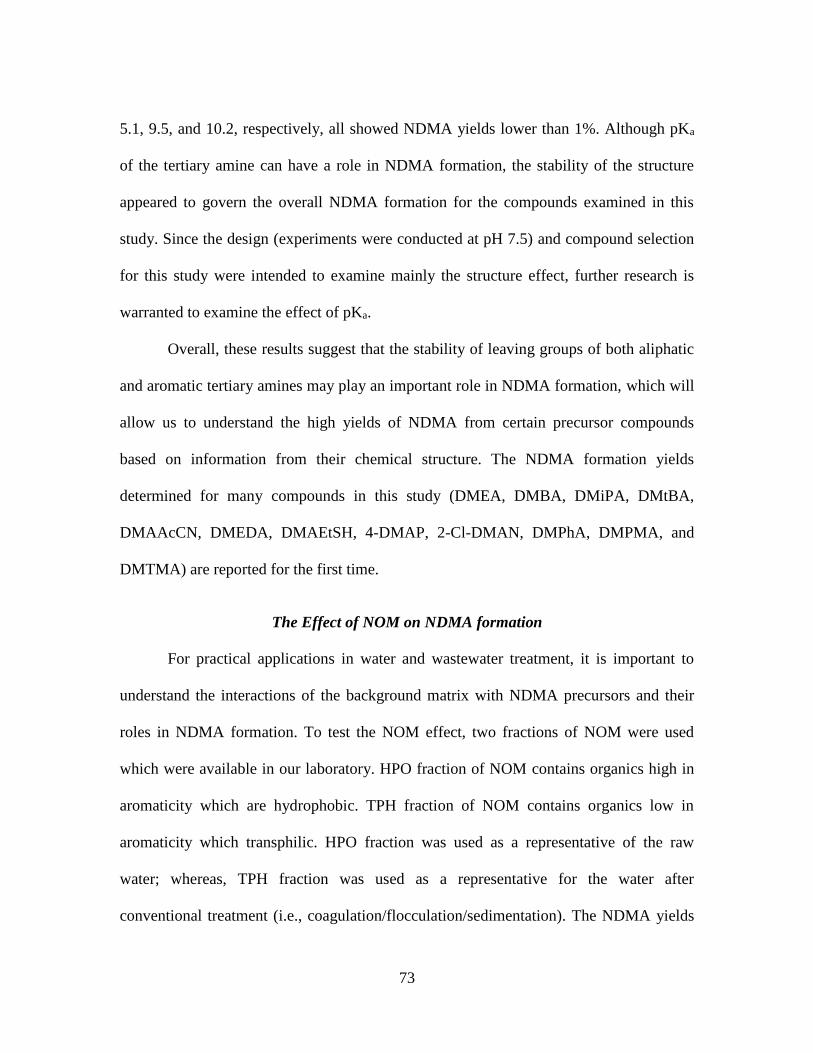
73
5.1, 9.5, and 10.2, respectively, all showed NDMA yields lower than 1%. Although pKa
of the tertiary amine can have a role in NDMA formation, the stability of the structure
appeared to govern the overall NDMA formation for the compounds examined in this
study. Since the design (experiments were conducted at pH 7.5) and compound selection
for this study were intended to examine mainly the structure effect, further research is
warranted to examine the effect of pKa.
Overall, these results suggest that the stability of leaving groups of both aliphatic
and aromatic tertiary amines may play an important role in NDMA formation, which will
allow us to understand the high yields of NDMA from certain precursor compounds
based on information from their chemical structure. The NDMA formation yields
determined for many compounds in this study (DMEA, DMBA, DMiPA, DMtBA,
DMAAcCN, DMEDA, DMAEtSH, 4-DMAP, 2-Cl-DMAN, DMPhA, DMPMA, and
DMTMA) are reported for the first time.
The Effect of NOM on NDMA formation
For practical applications in water and wastewater treatment, it is important to
understand the interactions of the background matrix with NDMA precursors and their
roles in NDMA formation. To test the NOM effect, two fractions of NOM were used
which were available in our laboratory. HPO fraction of NOM contains organics high in
aromaticity which are hydrophobic. TPH fraction of NOM contains organics low in
aromaticity which transphilic. HPO fraction was used as a representative of the raw
water; whereas, TPH fraction was used as a representative for the water after
conventional treatment (i.e., coagulation/flocculation/sedimentation). The NDMA yields
74
for selected precursors in TPH and HPO solutions are given in Figure 6.8 and Figure
6.9. NDMA formation in TPH (29 ng/L) was higher than in the HPO (7 ng/L) fraction
which was consistent with the literature (Chen and Valentine, 2007; Dotson et al., 2009).
These values were taken into account during calculation of NDMA yields of model
compounds in NOM solutions. NDMA conversion from DMA and selected aliphatic
tertiary amines showed a decrease in the presence of NOM. However, there was no
significant change in NDMA yields for DMEA, DMBA and DMAEtOH (Figure 6.8-A
and -B). The impact of NOM was higher in derivatives of DMEA and TMA (i.e.,
DMEDA, DMAEtSH, DMAAcCN) than other aliphatic compounds (Figure 6.8-B). In
most cases, the least NDMA formation was observed in the presence of the TPH fraction.
Unlike aliphatic compounds, NDMA formation from aromatic tertiary amines generally
increased in the presence of both NOM fractions with the exception of DMPMA,
DMTMA, and DMAPhOH (Figure 6.9-A and -B). Among aromatic tertiary amines that
showed an increase, NDMA formation was higher in the presence of HPO than TPH
fraction with the only exception of DMBzA which formed higher NDMA in TPH than in
HPO solution. Although DMAN and its derivatives had no significant difference between
the background of DDW and TPH solutions, NDMA yields from some of these
compounds in HPO solution increased up to five times. Only DMAPhOH among DMAN
derivatives showed lower NDMA yields in both NOM solutions than in DDW.
To date, the NOM effect on NDMA formation has not been systematically
investigated except for RNTD. Shen and Andrews (2011a) have reported that NDMA
yields from RNTD were 89.9% and 94.2% in DDW and tap water, respectively. These
75
results are consistent with the NDMA yields observed in this study, which were higher in
the presence of NOM (89.1% in TPH and 91.7% in HPO) than in DDW (80.5%) (Figure
6.9-A). In another study by Shen and Andrews (2011b), the presence of NOM decreased
formation of NDMA reaction rate within a 24 hour incubation period and the yield in
NOM was lower than in DDW. The decrease in the reaction rate and NDMA yields in
NOM background was attributed to a temporary reversible covalent bond formation
between aromatic amines and functional groups of NOM (such as, carbonyls and
quinones). Moreover, the researchers stated that NDMA conversion could still reach
maximum levels, if enough reaction time was provided.
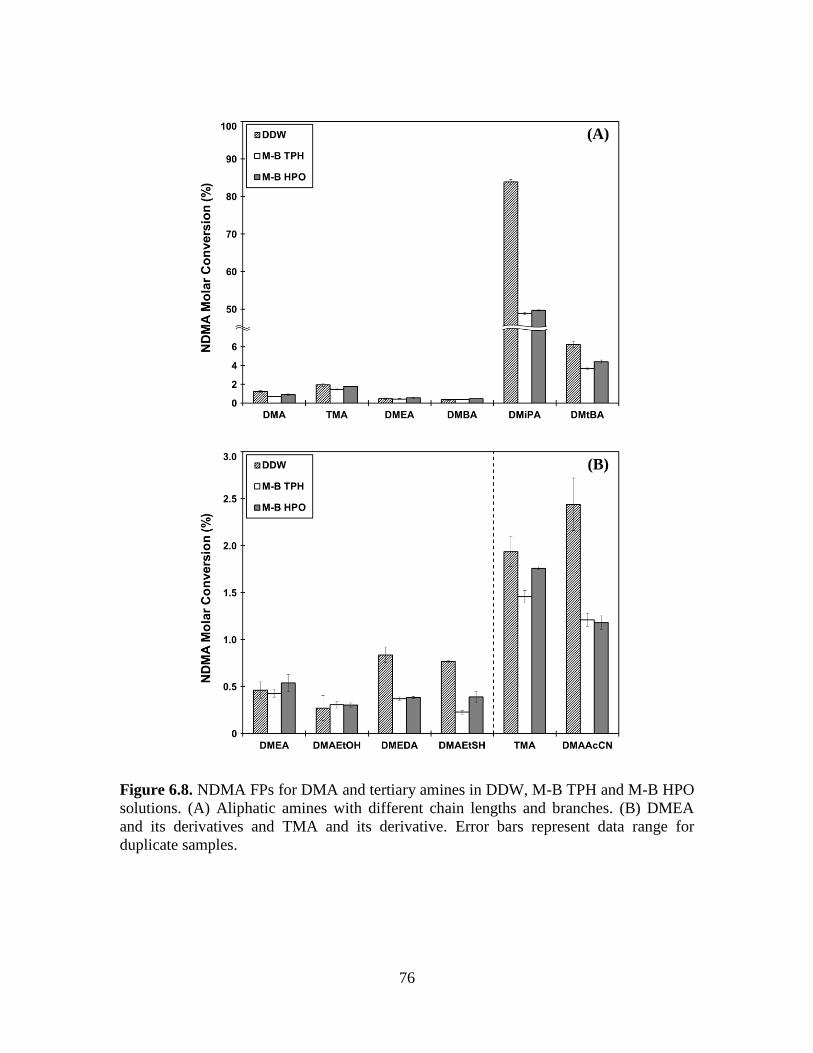
76
Figure 6.8. NDMA FPs for DMA and tertiary amines in DDW, M-B TPH and M-B HPO
solutions. (A) Aliphatic amines with different chain lengths and branches. (B) DMEA
and its derivatives and TMA and its derivative. Error bars represent data range for
duplicate samples.
(A)
(B)
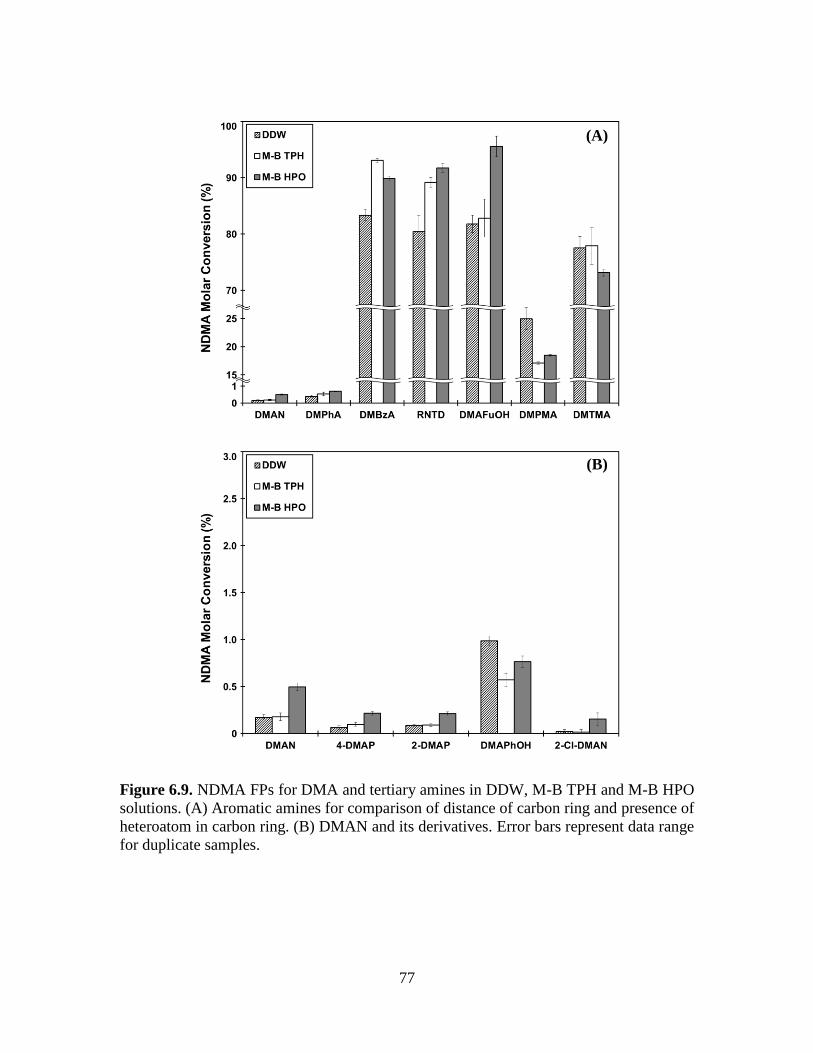
77
Figure 6.9. NDMA FPs for DMA and tertiary amines in DDW, M-B TPH and M-B HPO
solutions. (A) Aromatic amines for comparison of distance of carbon ring and presence of
heteroatom in carbon ring. (B) DMAN and its derivatives. Error bars represent data range
for duplicate samples.
(A)
(B)
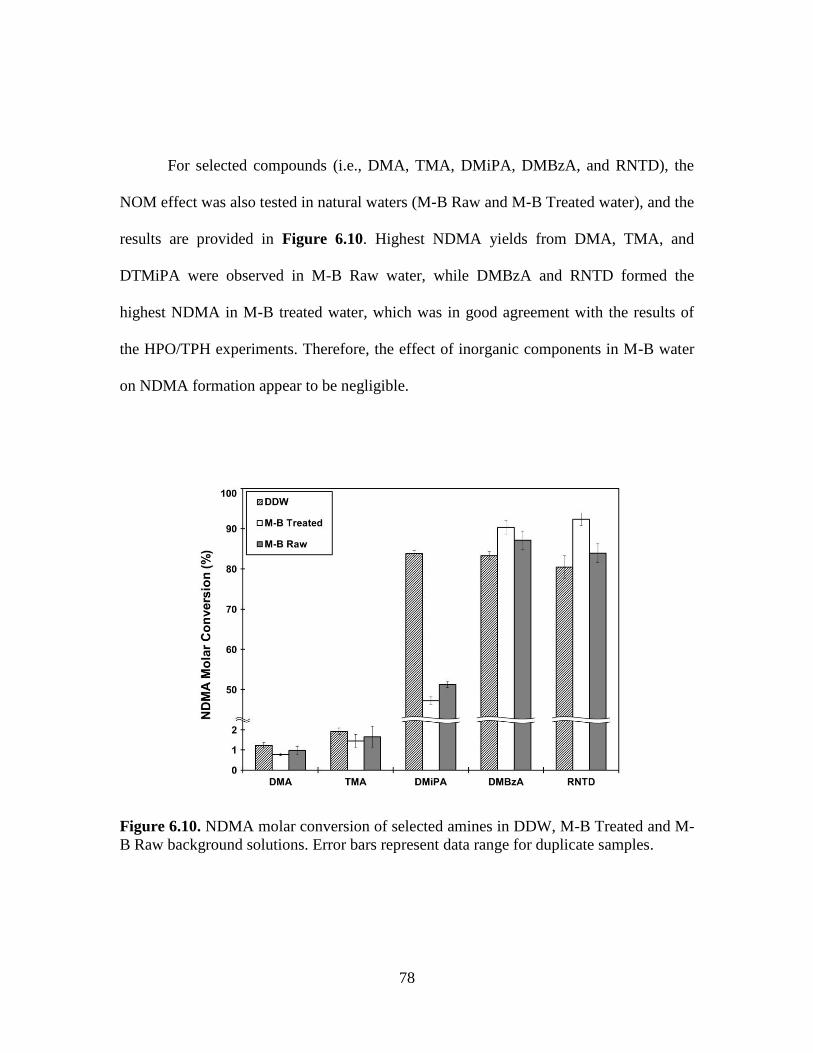
78
For selected compounds (i.e., DMA, TMA, DMiPA, DMBzA, and RNTD), the
NOM effect was also tested in natural waters (M-B Raw and M-B Treated water), and the
results are provided in Figure 6.10. Highest NDMA yields from DMA, TMA, and
DTMiPA were observed in M-B Raw water, while DMBzA and RNTD formed the
highest NDMA in M-B treated water, which was in good agreement with the results of
the HPO/TPH experiments. Therefore, the effect of inorganic components in M-B water
on NDMA formation appear to be negligible.
Figure 6.10. NDMA molar conversion of selected amines in DDW, M-B Treated and M-
B Raw background solutions. Error bars represent data range for duplicate samples.
79
RNTD and other aromatic compounds which have electron-withdrawing groups
(EWGs) such as methyl furan and benzyl exhibited higher NDMA yields in the presence
of NOM. On the contrary, DMPMA and aliphatic tertiary amine compounds with
electron-donating groups (EDGs) such as methyl pyrrole and alkyl formed less NDMA in
the presence of NOM. This is probably because of competition between precursors and
negatively charged NOM in the reaction matrixes for chloramine species. However, the
NOM effect was not obvious in the case of DMTMA which has a methyl thiophene (an
EWG). NDMA formation from DMTMA increased in TPH and decreased in HPO
solution. Therefore, the interactions between NDMA precursors and NOM need to be
considered as an important factor affecting NDMA formation in natural waters.
Both mono- and dichloramine have been shown to react with different compounds
(phenols, organophosphates, etc.) at different rates (Heasley et al., 2004; USEPA, 2008).
Therefore, different chloramine reactivity with different moieties can create competition
in the presence of amines. In our experiments, dichloramine was always detected (2-3
mg/L) due to decomposition of monochloramine at pH 7.5 in DDW control bottles. The
observation of lower dichloramine levels in TPH and HPO waters as compared to DDW
can be attributed to the reactions of dichloramine with NOM. Since the reaction of DMA
with dichloramine has been known as a major pathway to form NDMA (Schreiber and
Mitch, 2005, 2006; Mitch et al., 2009), a competition for dichloramine in the presence of
NOM could account for the differences observed in overall NDMA conversions.
80
The Effect of Chloramine Species on NDMA Formation
Although monochloramine is dominant at pH 7.5, trace level of dichloramine is
also present and NDMA formation may be affected by the reaction of dichloramine with
DMA. To further investigate the effect of chloramine species on the formation of
NDMA, an excess amount of ammonia was used to minimize the formation of
dichloramine according to Equation 6.2.
2 NH2Cl + H+ ↔ NHCl2 + NH4+ Equation 6.2
In the samples spiked with ammonia, dichloramine was not observed during five
days of contact time as shown in Figures C.1-C.3, thus NDMA formation in these
samples were mainly attributed to monochloramine. Eight tertiary amines (TMA,
DMiPA, DMtBA, DMBzA, RNTD, DMAFuOH, DMPMA, and DMTMA) were selected
and FP tests were conducted with and without ammonia addition. The effects of
chloramine speciation on NDMA conversion from these compounds are presented in
Figure 6.11. By addition of ammonia, the NDMA yield from DMA decreased from 1.7%
to 0.97% which indicates the importance of dichloramine but also involvement of
monochloramine in NDMA formation. The change in NDMA FP in the presence of
background ammonia was drastic for TMA, DMiPA and DMtBA as their yields
decreased from 0.43% to 0.03%, 61.2% to 5.8% and 1.84% to 0.07%, respectively,
indicating that dichloramine was more important species than monochloramine to form
NDMA. However, for DMBzA, DMAFuOH, and DMTMA which are aromatic tertiary
amines producing high yields (>90%) of NDMA, the effects of dichloramine on NDMA
yields were less than the aliphatic precursors. Therefore, DMBzA, DMAFuOH, and
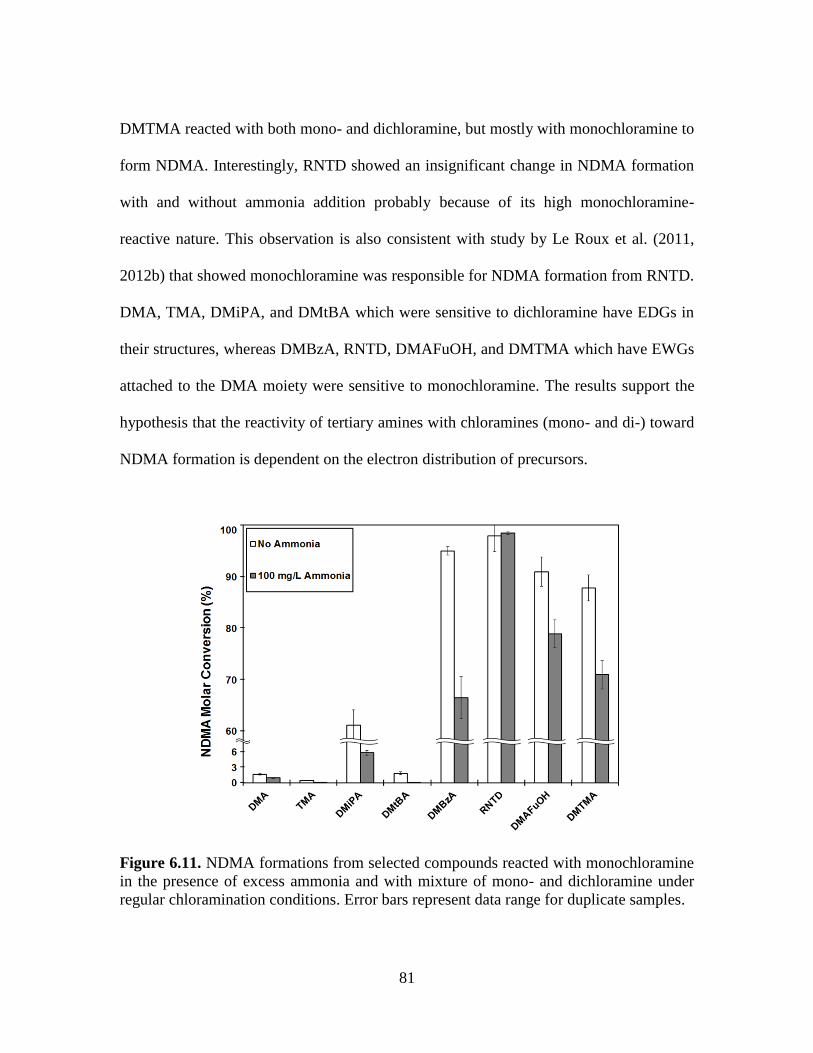
81
DMTMA reacted with both mono- and dichloramine, but mostly with monochloramine to
form NDMA. Interestingly, RNTD showed an insignificant change in NDMA formation
with and without ammonia addition probably because of its high monochloramine-
reactive nature. This observation is also consistent with study by Le Roux et al. (2011,
2012b) that showed monochloramine was responsible for NDMA formation from RNTD.
DMA, TMA, DMiPA, and DMtBA which were sensitive to dichloramine have EDGs in
their structures, whereas DMBzA, RNTD, DMAFuOH, and DMTMA which have EWGs
attached to the DMA moiety were sensitive to monochloramine. The results support the
hypothesis that the reactivity of tertiary amines with chloramines (mono- and di-) toward
NDMA formation is dependent on the electron distribution of precursors.
Figure 6.11. NDMA formations from selected compounds reacted with monochloramine
in the presence of excess ammonia and with mixture of mono- and dichloramine under
regular chloramination conditions. Error bars represent data range for duplicate samples.
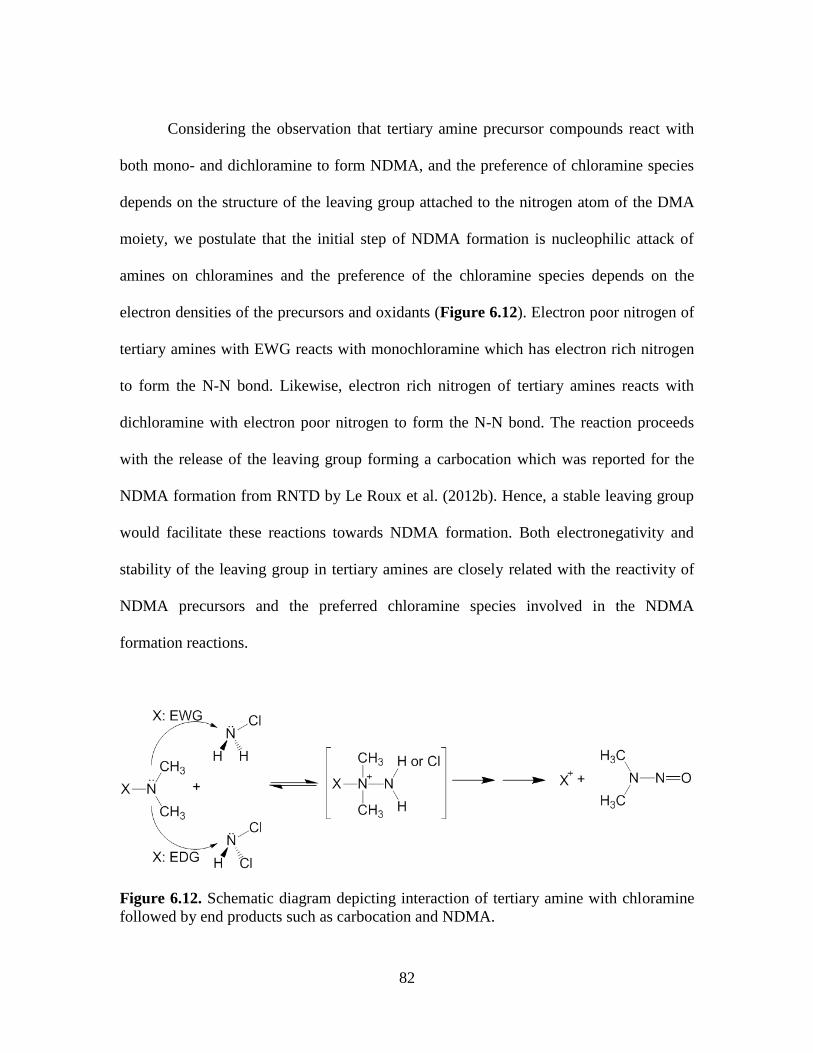
82
Considering the observation that tertiary amine precursor compounds react with
both mono- and dichloramine to form NDMA, and the preference of chloramine species
depends on the structure of the leaving group attached to the nitrogen atom of the DMA
moiety, we postulate that the initial step of NDMA formation is nucleophilic attack of
amines on chloramines and the preference of the chloramine species depends on the
electron densities of the precursors and oxidants (Figure 6.12). Electron poor nitrogen of
tertiary amines with EWG reacts with monochloramine which has electron rich nitrogen
to form the N-N bond. Likewise, electron rich nitrogen of tertiary amines reacts with
dichloramine with electron poor nitrogen to form the N-N bond. The reaction proceeds
with the release of the leaving group forming a carbocation which was reported for the
NDMA formation from RNTD by Le Roux et al. (2012b). Hence, a stable leaving group
would facilitate these reactions towards NDMA formation. Both electronegativity and
stability of the leaving group in tertiary amines are closely related with the reactivity of
NDMA precursors and the preferred chloramine species involved in the NDMA
formation reactions.
Figure 6.12. Schematic diagram depicting interaction of tertiary amine with chloramine
followed by end products such as carbocation and NDMA.
83
Conclusions
A fairly wide range (0.02% to 83.9%) of NDMA formation from 21 selected
amines indicated the importance of the structure of tertiary amines on NDMA formation.
The results showed that both stability and electron distribution of the leaving group of the
tertiary amines have an important role in NDMA formation. The DMA moiety associated
with branched alkyl groups or benzyl like structures, which have only one carbon
between the ring and DMA structure, consistently gave high yields of NDMA formation
(>25%). Compounds with EWG reacted preferentially with monochloramine, whereas
compounds with EDG showed a tendency to react with dichloramine to form NDMA.
These findings indicated that characteristics of tertiary amines would determine the
responsible chloramine species for NDMA formation. Tertiary amines can form NDMA
with or without degradation to DMA, and the overall yield depends on the stability of the
leaving group. When the amines were present along with NOM in solution, NDMA
formation increased for compounds with EWG while it decreased for compounds with
EDG. This impact was attributed to the competition between NOM and amines for
chloramine species.
84
CHAPTER SEVEN
7. THE ROLE OF CHLORAMINE SPECIES IN NDMA FORMATION
Introduction and Objective
Nitrosamines are considered as an emerging DBP in drinking water, as they are
classified as probable human carcinogens associated with a 10–6 lifetime cancer risk at
concentrations as low as 0.2 ng/L (USEPA, 1993). Nitrosamine formation is commonly
associated with water distribution systems that apply chloramine as the post-oxidant
(Choi and Valentine, 2002a,b; Choi et al., 2002; Mitch et al., 2003a,b; Russell et al.,
2012), and among the nitrosamines, NDMA has drawn the most attention due to its
frequent detection and elevated concentrations (Russell et al., 2012). Although there are
currently no federal regulations for nitrosamines in drinking water in the United States,
widespread detection of NDMA in drinking water distribution systems has prompted the
California Department of Health Services and the Massachusetts Department of
Environmental Protection to implement a maximum level of 10 ng/L for NDMA in
drinking water (MassDEP, 2004; OEHHA, 2006). Furthermore, USEPA has recently
identified nitrosamines as one of three potential groups of contaminants highlighted for
possible regulatory action in the near future (Roberson, 2011).
DMA has been the most commonly studied model precursor of NDMA (Mitch et
al., 2003a; Bond and Templeton, 2011) and frequently detected in natural waters.
However, several studies have shown that DMA concentrations in surface waters
85
(Gerecke and Sedlak, 2003; Lee et al., 2007a) or secondary municipal wastewaters
(Mitch and Sedlak, 2004) were inadequate to explain the observed levels of NDMA.
Rather than DMA, tertiary or quaternary amines with the DMA moiety (Lee et al., 2007a;
Kemper et al., 2010; Shen and Andrews, 2011a), NOM (Gerecke and Sedlak, 2003;
Mitch and Sedlak, 2004; Chen and Valentine, 2007; Dotson et al., 2007; Krasner et al.,
2008a), and anthropogenic organic materials have been shown to form NDMA. Potential
anthropogenic sources of NDMA precursors include polyelectrolytes and ion-exchange
resins (Gough et al., 1977; Kimoto et al., 1980; Najm and Trussell, 2001; Kohut and
Andrews, 2003; Wilczak et al., 2003; Mitch and Sedlak, 2004; Nawrocki and
Andrzejewski, 2011; Gan et al, 2013a,b), fungicides, pesticides, and herbicides (Graham
et al., 1995; Chen and Young, 2008; Schmidt and Brauch, 2008), pharmaceuticals,
personal care products, and cosmetics (Sacher et al., 2008; Shen and Andrews, 2011a),
and wastewater effluent impacted waters (Sedlak et al., 2005; Krauss et al., 2009; Shah et
al., 2012; Gan et al, 2013a,b).
Understanding formation kinetics is essential to develop strategies for controlling
NDMA and other nitrosamines in drinking water distribution systems. It has been
reported that NDMA formation in natural and wastewater impacted waters was relatively
slow, and further NDMA could continue to form in distribution systems as water age
increased (i.e., a plateau was reached after 150-200 hours of chloramine contact time)
(Barrett et al., 2003; Charrois and Hrudey, 2007, Sacher et al., 2008; Krasner et al., 2010;
Russell et al., 2012). Since various precursors with different reactivity are present in
source waters, it is not simple to explain what causes this slow NDMA formation. Only a
86
few studies, focusing on specific model compounds, have investigated the following
factors which may control the NDMA formation rate: (i) the effect of temperature and pH
on RNTD (Krasner et al., 2010); and (ii) the effect of NOM and pH on selected
pharmaceuticals including RNTD (Shen and Andrews, 2011b, 2013a). Although, these
factors had some influence on the NDMA formation rate, the NDMA formation reached
its maximum yield within a relatively short time (i.e., plateau reached after 24 hours with
RNTD). Thus, findings from selected model precursor compounds so far are insufficient
to explain the observed trends in natural water samples. Overall, data regarding the
NDMA formation rate both in real water samples, and from model compounds are largely
lacking.
The main objective of this study was to investigate: (i) the role of chloramine
species (i.e., mono- and dichloramine) in the formation of NDMA from DMA and
selected tertiary amine precursors; (ii) the factors that may influence dichloramine levels
(i.e., pH, sulfate and NOM); and (iii) the role of mono- and dichloramine during NDMA
formation in selected natural waters. Four tertiary amines were selected based on their
structures. NDMA formation rates (i.e., time to reach the plateau) were monitored from
selected model compounds in three parallel experiments with varying amounts of
dichloramine. Based on the results, two amines were selected due to their extreme
sensitivity to specific chloramine speciation and the effects of pH, sulfate and NOM were
further examined. Since chloramine speciation could also be an important factor in
natural samples; the impact of chloramine species was examined in water from a
watershed, and in water from a drinking water treatment plant.
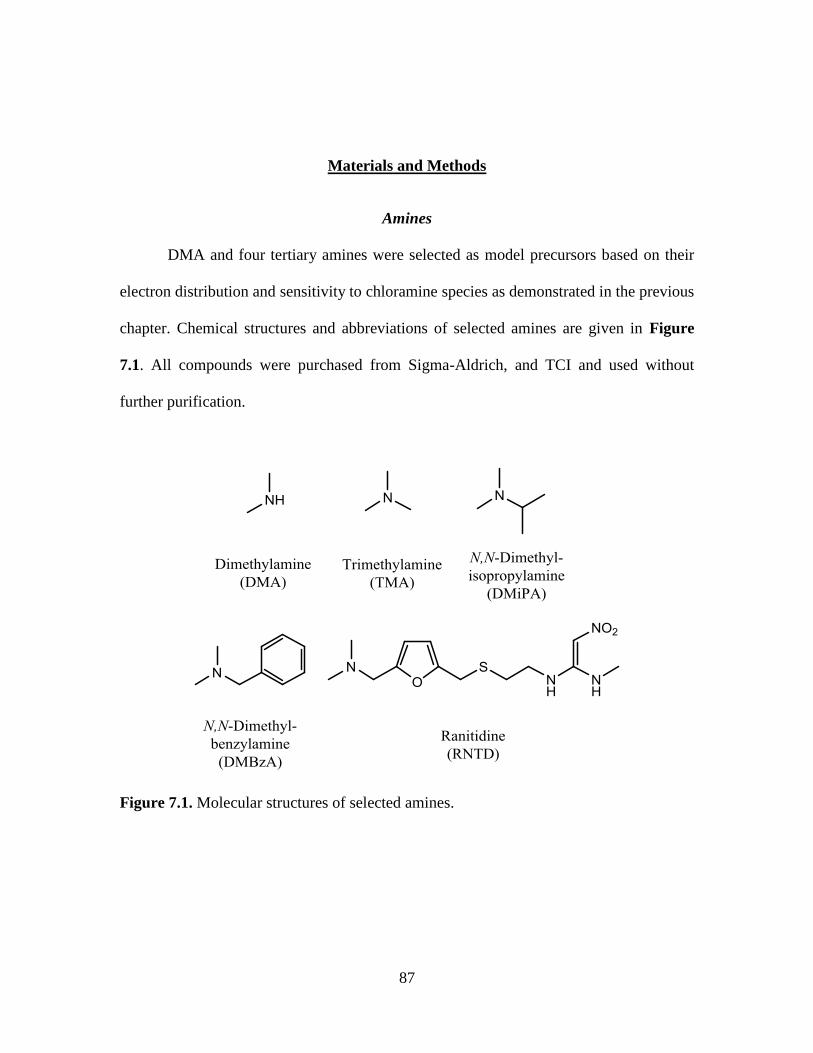
87
Materials and Methods
Amines
DMA and four tertiary amines were selected as model precursors based on their
electron distribution and sensitivity to chloramine species as demonstrated in the previous
chapter. Chemical structures and abbreviations of selected amines are given in Figure
7.1. All compounds were purchased from Sigma-Aldrich, and TCI and used without
further purification.
Figure 7.1. Molecular structures of selected amines.
88
Experimental Procedure
A stock solution (4 mM) for each amine was prepared in methanol and stored in a
65 mL amber glass bottle at 4ºC until use. Each model compound was diluted to 200 nM
in DDW. The role of chloramine species was investigated by conducting three parallel
experiments under the following conditions: (i) FP experiments with an initial chloramine
dose of 100 mg/L, (ii) simulated distribution system (SDS) experiments with an initial
dose of 3 mg/L chloramine, and (iii) SDS experiments with an initial dose of 3 mg/L in
the presence of 100 mg/L ammonia to suppress the formation of monochloramine to
dichloramine (Equation 6.2) (Some additional information about the chloramine
chemistry can be found in the Appendix A). In these experiments to keep the pH
constant at 7.5, 10 mM phosphate buffer was used in FP experiments and 4 mM
carbonate buffer was used in SDS experiments. The preformed chloramine stock solution
was prepared by mixing diluted sodium hypochlorite and ammonium sulfate solutions at
Cl:N mass ratio of 4:1 at pH 9 and spiked to the samples. After the injection of
chloramine solution into eight identical amber bottles, bottles were opened at 3, 6, 12, 24,
48, 72, and 120 hours to measure NDMA formation and residual chloramine.
The factors that may influence chloramine decomposition and speciation were
assessed under SDS conditions for two amines (DMiPA and RNTD). First, the effect of
NOM was investigated in background solutions that were prepared using raw water, and
treated water collected after coagulation/flocculation/sedimentation processes before
filtration from the Charleston (CH) DWTP in South Carolina. Water samples were
filtered immediately with pre-washed 0.2 µm polyethersulfone filters. DOC levels of all
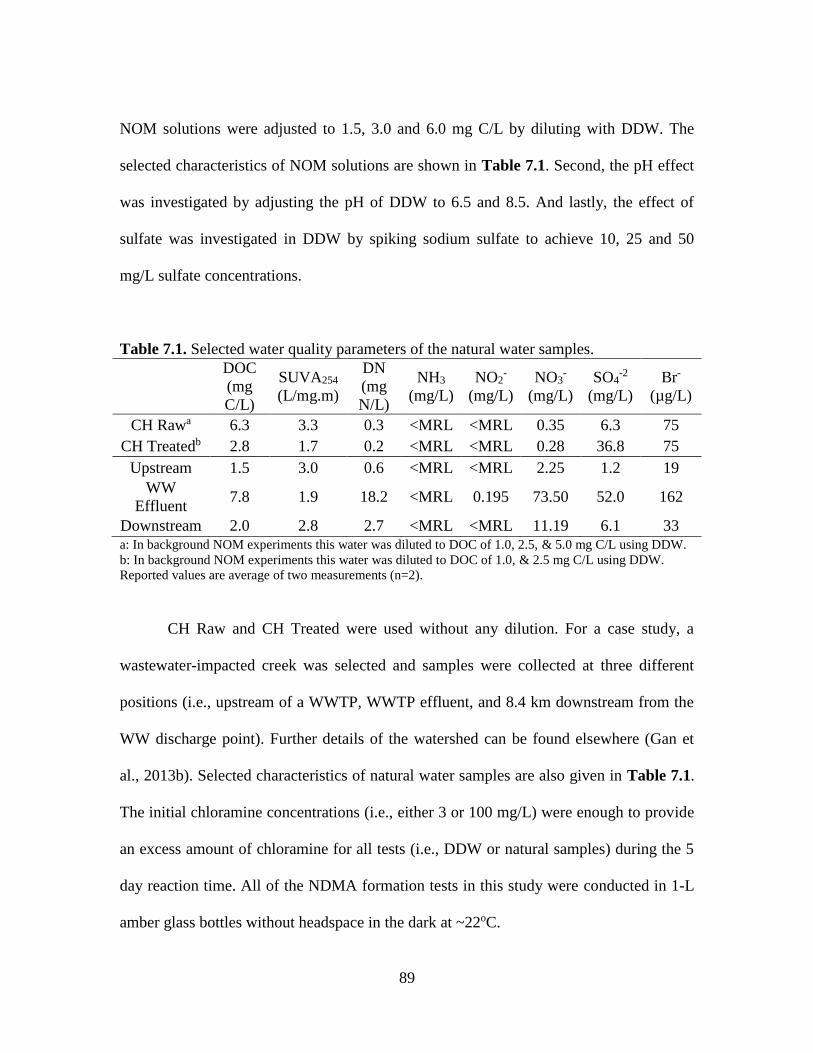
89
NOM solutions were adjusted to 1.5, 3.0 and 6.0 mg C/L by diluting with DDW. The
selected characteristics of NOM solutions are shown in Table 7.1. Second, the pH effect
was investigated by adjusting the pH of DDW to 6.5 and 8.5. And lastly, the effect of
sulfate was investigated in DDW by spiking sodium sulfate to achieve 10, 25 and 50
mg/L sulfate concentrations.
Table 7.1. Selected water quality parameters of the natural water samples.
DOC
(mg
C/L)
SUVA254
(L/mg.m)
DN
(mg
N/L)
NH3
(mg/L)
NO2-
(mg/L)
NO3-
(mg/L)
SO4-2
(mg/L)
Br-
(µg/L)
CH Rawa 6.3 3.3 0.3 <MRL <MRL 0.35 6.3 75
CH Treatedb 2.8 1.7 0.2 <MRL <MRL 0.28 36.8 75
Upstream 1.5 3.0 0.6 <MRL <MRL 2.25 1.2 19
WW
Effluent 7.8 1.9 18.2 <MRL 0.195 73.50 52.0 162
Downstream 2.0 2.8 2.7 <MRL <MRL 11.19 6.1 33 a: In background NOM experiments this water was diluted to DOC of 1.0, 2.5, & 5.0 mg C/L using DDW.
b: In background NOM experiments this water was diluted to DOC of 1.0, & 2.5 mg C/L using DDW.
Reported values are average of two measurements (n=2).
CH Raw and CH Treated were used without any dilution. For a case study, a
wastewater-impacted creek was selected and samples were collected at three different
positions (i.e., upstream of a WWTP, WWTP effluent, and 8.4 km downstream from the
WW discharge point). Further details of the watershed can be found elsewhere (Gan et
al., 2013b). Selected characteristics of natural water samples are also given in Table 7.1.
The initial chloramine concentrations (i.e., either 3 or 100 mg/L) were enough to provide
an excess amount of chloramine for all tests (i.e., DDW or natural samples) during the 5
day reaction time. All of the NDMA formation tests in this study were conducted in 1-L
amber glass bottles without headspace in the dark at ~22oC.
90
Analytical methods
NDMA was analyzed following USEPA method 521 (USEPA, 2004), consisting
of SPE using coconut charcoal followed by GC-MS/MS analysis. Analytical details can
be found in the previous section and a brief summary follows. For the sample analysis,
500 mL of chloraminated amine solutions were quenched with sodium thiosulfate and
NDMA-d6 was added as a surrogate before SPE. Samples were passed through coconut
charcoal cartridges preconditioned with DCM, methanol, and DDW. The cartridges were
dried with air, and then eluted with DCM. Eluents were passed through sodium sulfate
columns to remove residual moisture, then concentrated to 1 mL under a gentle stream of
high purity nitrogen gas. The extracts were spiked with NDPA-d14 as an internal
standard, and analyzed using a Varian GC-MS/MS 4000 under the CI mode. Percent
molar yield of each amine was calculated using Equation 6.1 (Appendix B).
DOC and DN were determined using a Shimadzu TOC-VCSH instrument equipped
with a Total Nitrogen module (TNM-1). UV254 absorbance of NOM samples was
measured using a Varian Cary-50 spectrophotometer, and used to calculate SUVA254
values. Ammonia concentrations were measured with a HACH spectrophotometer.
Nitrite, nitrate, bromide, and sulfate were measured using ion chromatography (Dionex,
ICS 2100). Concentrations of free chlorine, and mono- and dichloramine as free chlorine
were determined following SM 4500-Cl F (APHA/AWWA/WEF, 2005). All analytical
methods and their MRLs are given in Table 4.1. All samples and blanks were prepared,
extracted and analyzed in duplicates. Error bars in all the graphs show the variability due
to multiple analysis (n=2).
91
Results and Discussion
NDMA Conversion from Selected Model Compounds
Figures 7.2 through 7.6 shows the NDMA molar conversion from DMA and four
tertiary amines over reaction time under three different chloramination conditions: FP,
SDS, and SDS in the presence of excess ammonia. Residual chloramine concentrations
are given Appendix D. In FP tests, an excessive dose of chloramine (i.e., 100 mg/L) was
used to produce both monochloramine (~95%) and dichloramine (~5%) at a given pH and
each chloramine species was enough to form NDMA from selected amines. Thus, under
FP test conditions, the NDMA conversion rates from all model compounds were
relatively fast. The maximum NDMA formation was achieved within 24 hours of
chloramination and no additional formation was observed. The NDMA yields obtained at
120 hours from these precursors were in a good agreement with those reported by other
research groups (Lee et al., 2007a; Sacher et al., 2008; Mitch et al., 2009; Shen and
Andrews, 2011a,b; Le Roux et al., 2012b) despite some differences in experimental
conditions (Table 6.3).
For DMA, NDMA conversion yields under SDS conditions did not decrease
significantly compared to FP tests (Figure 7.2). However, overall NDMA yield after 120
hours of reaction time decreased from 1.1% in FP test to 0.8% under SDS conditions.
Even though the difference is trivial, this change could be caused by the limited
availability of the dichloramine. Further decreases in dichloramine concentration in the
presence of excess ammonia resulted in only 0.2% NDMA molar conversion after 120
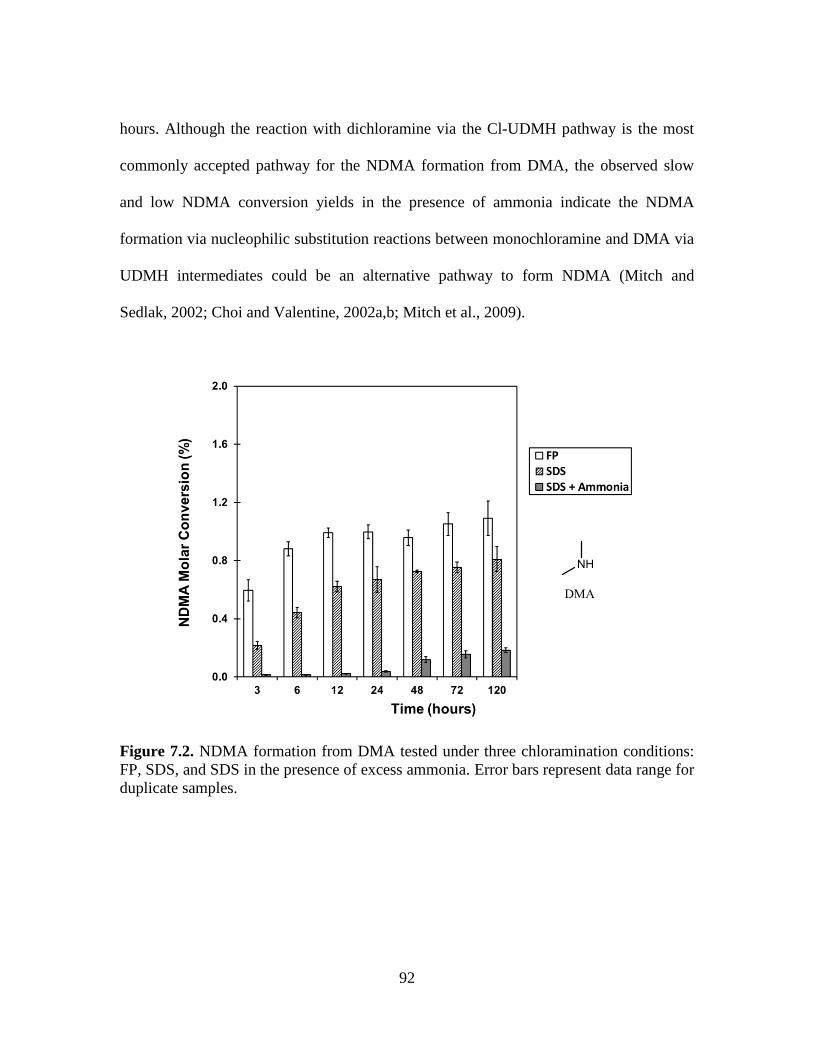
92
hours. Although the reaction with dichloramine via the Cl-UDMH pathway is the most
commonly accepted pathway for the NDMA formation from DMA, the observed slow
and low NDMA conversion yields in the presence of ammonia indicate the NDMA
formation via nucleophilic substitution reactions between monochloramine and DMA via
UDMH intermediates could be an alternative pathway to form NDMA (Mitch and
Sedlak, 2002; Choi and Valentine, 2002a,b; Mitch et al., 2009).
Figure 7.2. NDMA formation from DMA tested under three chloramination conditions:
FP, SDS, and SDS in the presence of excess ammonia. Error bars represent data range for
duplicate samples.
93
The NDMA formation rates from DMiPA and TMA both decreased significantly
under SDS chloramination conditions compared to FP tests (Figure 7.3 and 7.4). Methyl
or isopropyl functional group is likely to donate electrons to the nitrogen atom.
Therefore, the electron-rich nitrogen atoms in DMiPA and TMA tend to react with
dichloramine species where the electron density of nitrogen is reduced by two chlorine
atoms rather than monochloramine which has only one chlorine to withdraw electrons.
Consequently, NDMA formation from both amines is expected to be limited by the
availability of dichloramine species. Since dichloramine concentration was much lower
in the SDS test than FP, the transformation of monochloramine to dichloramine would be
a limiting factor for NDMA formation. Conversion of monochloramine to dichloramine
is a reversible reaction. However, the forward reaction from monochloramine to
dichlroamine can be suppressed by an excess amount of ammonia. In the presence of
excess ammonia under SDS conditions, the NDMA conversion yields from DMiPA and
TMA were 0.3 and 0.1% at 120 hours, respectively, indicating that dichloramine is the
dominant species in the NDMA formation from these two amines.
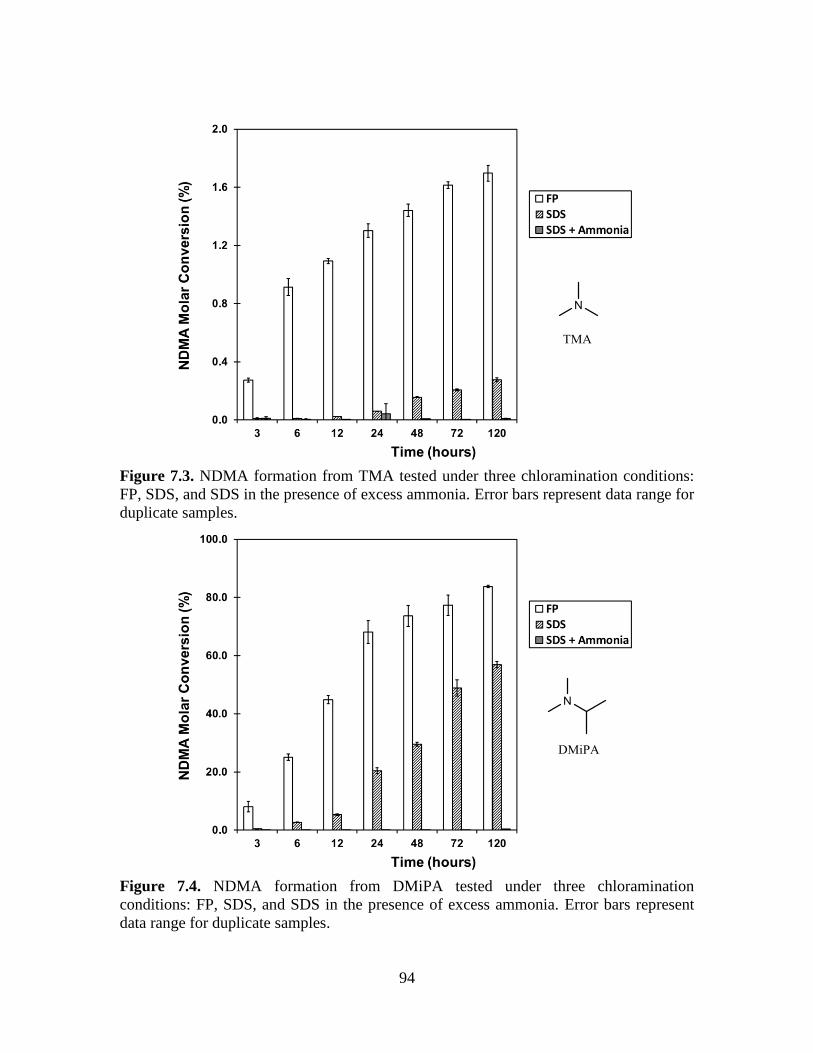
94
Figure 7.3. NDMA formation from TMA tested under three chloramination conditions:
FP, SDS, and SDS in the presence of excess ammonia. Error bars represent data range for
duplicate samples.
Figure 7.4. NDMA formation from DMiPA tested under three chloramination
conditions: FP, SDS, and SDS in the presence of excess ammonia. Error bars represent
data range for duplicate samples.
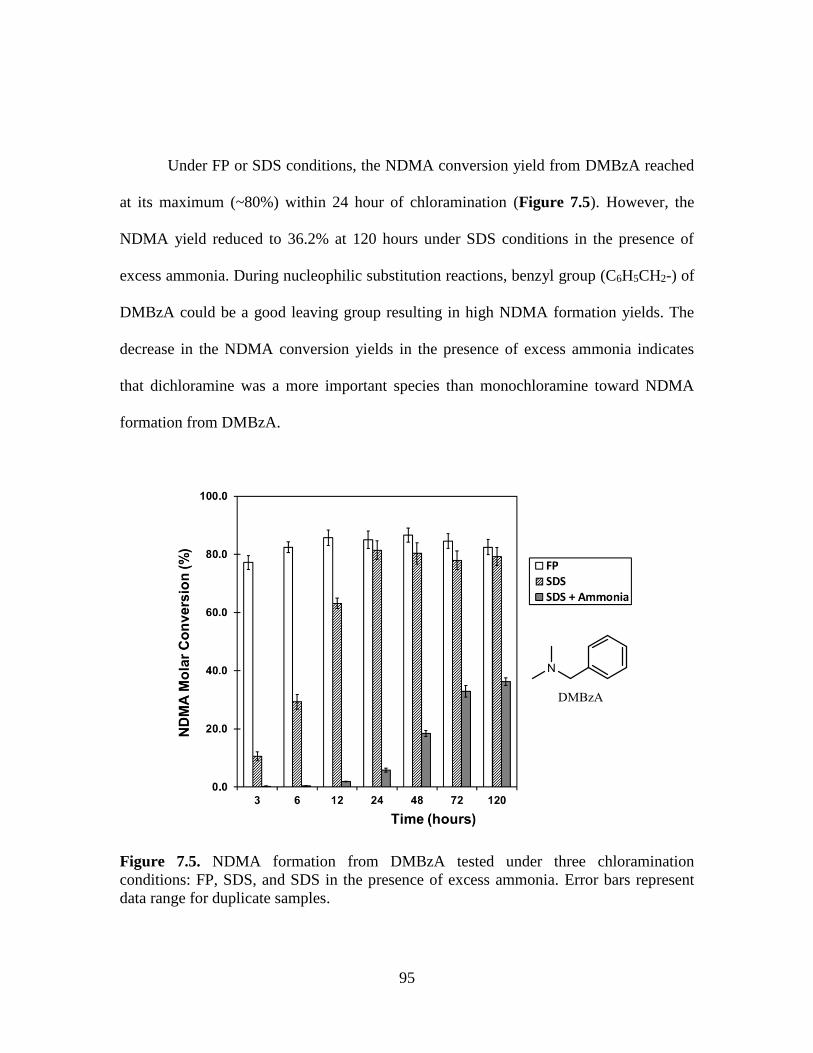
95
Under FP or SDS conditions, the NDMA conversion yield from DMBzA reached
at its maximum (~80%) within 24 hour of chloramination (Figure 7.5). However, the
NDMA yield reduced to 36.2% at 120 hours under SDS conditions in the presence of
excess ammonia. During nucleophilic substitution reactions, benzyl group (C6H5CH2-) of
DMBzA could be a good leaving group resulting in high NDMA formation yields. The
decrease in the NDMA conversion yields in the presence of excess ammonia indicates
that dichloramine was a more important species than monochloramine toward NDMA
formation from DMBzA.
Figure 7.5. NDMA formation from DMBzA tested under three chloramination
conditions: FP, SDS, and SDS in the presence of excess ammonia. Error bars represent
data range for duplicate samples.
96
The furan ring next to the DMA moiety of RNTD is also a good leaving group,
and thus RNTD is likely to react with monochloramine having electron-rich nitrogen
rather than dichloramine as indicated in the previous section. It has been reported that
RNTD formed NDMA via nucleophilic substitution by monochloramine (Le Roux et al.,
2012b). The NDMA conversion yield under both FP and SDS conditions reached its
maximum (~80%) within 24 hours and remained until 120 hours (Figure 7.6). Since
monochloramine is the dominant chloramine species under SDS conditions at the given
pH, there was no distinguished change observed in the NDMA conversion yields from
RNTD between FP and SDS conditions. Therefore, further changes in the NDMA
formation by suppression of dichloramine with excess ammonia were not expected and
overall yields under three different chloramination conditions were almost same.
However, the NDMA conversion yield within initial 24 hours of chloramination with
ammonia was only 62.9% and it took longer time to reach its maximum. The results
indicate that monochloramine, a dominant species, is more important to form NDMA
than dichloramine, but dichloramine may also make contribution to NDMA formation
from RNTD to some extent. This is consistent with findings from an ongoing project that
the activation energy of the reaction of monochloramine with RNTD is more favorable
than with dichloramine but dichloramine is still capable of reacting with RNTD to form
NDMA (Liu et al., 2014).

97
Figure 7.6. NDMA formation from RNTD tested under three chloramination conditions:
FP, SDS, and SDS in the presence of excess ammonia. Error bars represent data range for
duplicate samples.
Overall, the results suggest that the NDMA formation from the reaction of amine
compounds with chloramines is dependent on the electron distribution of the leaving
group of amines. Based on the structure, the theoretical electron densities of leaving
groups in the selected amines is expected to follow the order of
DMiPA>TMA>DMA>DMBzA>RNTD. This trend was also reflected in the sensitivity
to chloramine species, which will allow us to understand the NDMA conversion yields
from certain precursor compounds based on their chemical structure information.
98
Factors that Influence the NDMA Conversion over Time
NOM Effect: To investigate the NOM effect on the NDMA formation, water
samples collected from CH DWTP were used as background matrix. It is well known that
HPO is a major fraction of NOM in raw waters, while NOM in treated waters (i.e., after
coagulation/flocculation/sedimentation) contains mostly TPH and hydrophilic fractions
(Croue et al., 1993; Kim and Yu, 2005; Karanfil et al., 2007). Thus, selected amines
spiked in raw and treated waters could interact with NOM fractions (i.e., HPO and TPH)
toward NDMA formation. It is crucial to understand possible interactions of background
NOM with NDMA precursor compounds, because various characteristics of NOM may
play an important role in either enhancement or reduction of NDMA formation in natural
water systems. The NDMA molar conversion yields from RNTD and DMiPA over
reaction time at different DOC levels of CH raw and treated waters are given in Figure
7.7 and 7.8.
In the case of RNTD, it has been known that, monochloramine is the dominant
chloramine species responsible for NDMA formation (Le Roux et al, 2012b). At the
DOC levels of 1.0 and 2.5 mg C/L of CH treated water, there were no significant changes
in NDMA conversion yields indicating that TPH-dominated NOM did not compete with
RNTD for monochloramine (Figure 7.7-A). On the other hand, the NDMA conversion
yields from DMiPA were reduced drastically in the presence of TPH-dominated NOM
(Figure 7.7-B). The NDMA yields at 120 hours decreased from 56.9% in DDW to 32.0
and 9.1% in the presence of 1.0 and 2.5 mg C/L DOC, respectively. These decreases
99
resulted probably from the competition of NOM with DMiPA for dichloramine. Similar
NOM effects have been observed even under FP conditions (i.e., chloramine dose of 100
mg/L) in the previous section. NOM can facilitate monochloramine consumption
(Vikesland et al., 1998). Since the electron density on the nitrogen atom of dichloramine
is less than on the monochloramine’s nitrogen, dichloramine could be the preferential
species to react with negatively charged NOM. Thus, the interaction between
dichloramines and NOM could reduce available dichloramine to react with amines to
form NDMA.
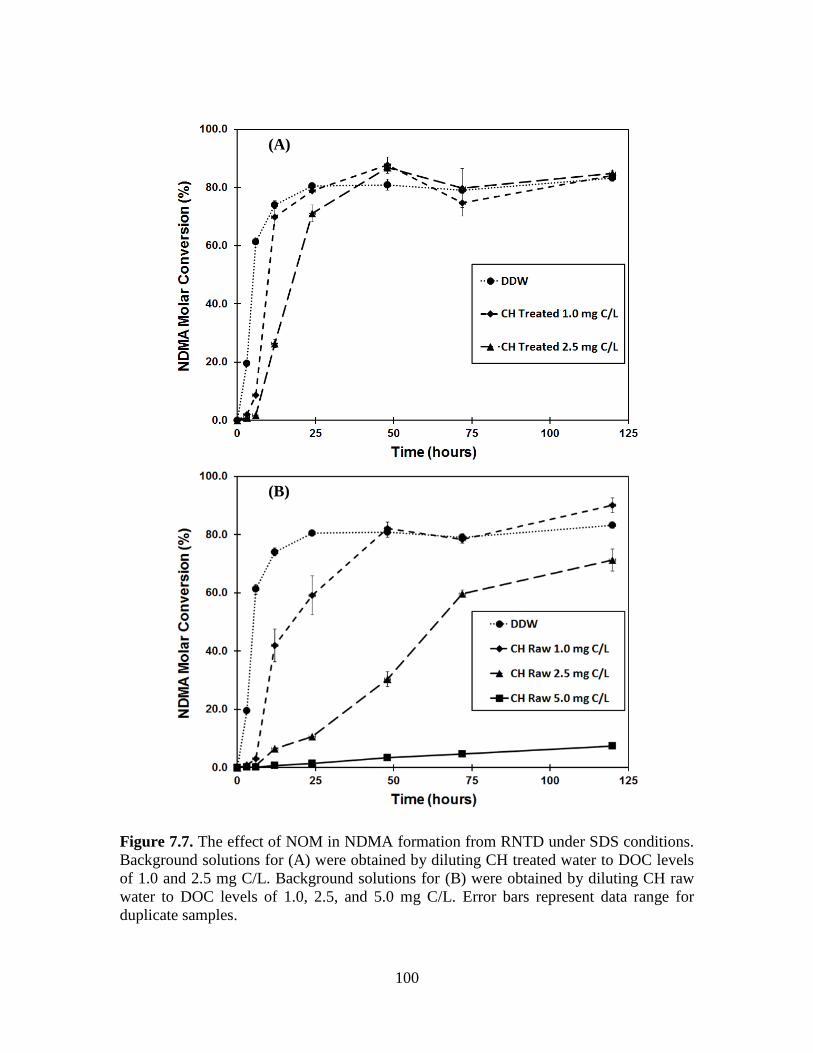
100
Figure 7.7. The effect of NOM in NDMA formation from RNTD under SDS conditions.
Background solutions for (A) were obtained by diluting CH treated water to DOC levels
of 1.0 and 2.5 mg C/L. Background solutions for (B) were obtained by diluting CH raw
water to DOC levels of 1.0, 2.5, and 5.0 mg C/L. Error bars represent data range for
duplicate samples.
(A)
(B)
101
When CH raw water containing HPO-dominated NOM was used as the
background matrix, the NDMA conversion yield from RNTD decreased as DOC levels
increased (Figure 7.8-A). The NDMA conversion yield from RNTD without NOM
reached the maximum (~85%) within 24 hours, while slightly slower conversion was
observed at 1.0 mg C/L of DOC. When the DOC concentration increased to 2.5 mg C/L,
the maximum yield (~71%) of NDMA did not reach the level (~85%) observed in DDW
after 120 hours of reaction time. At 5.0 mg C/L of DOC, however, the NDMA
conversion was significantly suppressed and its maximum was only 7.4% after 120 hours
of chloramination. The results show that the NDMA conversion yield from RNTD was
consistent and independent of NOM in treated water, but NOM in raw water caused
decreases in the NDMA conversion yield, indicating that NOM characteristics in natural
water may either increase or decrease the NDMA formation from a certain type of
precursor compound. CH raw water has a higher content of aromatic components than
CH treated water according to their SUVA254 values (3.3 and 1.7 L/mg.m, respectively).
Therefore, the concentration of aromatic compounds in natural water may influence the
NDMA formation during chloramination of amines. Shen and Andrews (2011b) reported
similar decreases in the NDMA formation rate when river water with 6.2 mg C/L of DOC
and 2.3 L/mg.m of SUVA254 was used. However, the changes of the NDMA conversion
rates in their study were not as drastic as the results in this study, which may be due to the
difference in the SUVA254 values of NOM. As for the importance of SUVA254 in the
NDMA formation, it has been found that aromatic amines can undergo reversible
102
covalent bonding with carbonyls and quinones which are present in NOM (Parris, 1980;
Thorn et al., 1996; Weber et al., 1996; Chen, 2007), and consequently their initial contact
with chloramine species can be hindered (Shen and Andrews, 2011b). Some additional
information about the quinone-tertiary amine chemistry can be found in the Appendix E.
The NDMA molar conversion of DMiPA (Figure 7.8-B) showed slightly higher
inhibition in the presence of CH raw water than CH treated water. The NDMA yields at
120 hours decreased from 56.9 % in DDW to 21.8, 3.7, and 0.3% in the presence of 1.0,
2.5, and 5.0 mg C/L DOC, respectively. These trends were very similar to the results in
CH treated, which is probably because of less interaction between DMiPA, an aliphatic
amine, and HPO fraction of the NOM than between RNTD, an aromatic amine, and HPO.
However, the NOM effects on the NDMA conversion and the interaction of NOM
fractions with both aliphatic and aromatic amines need to be further verified with various
precursors in different water matrices a to understand the NDMA formation mechanism
in natural water systems.
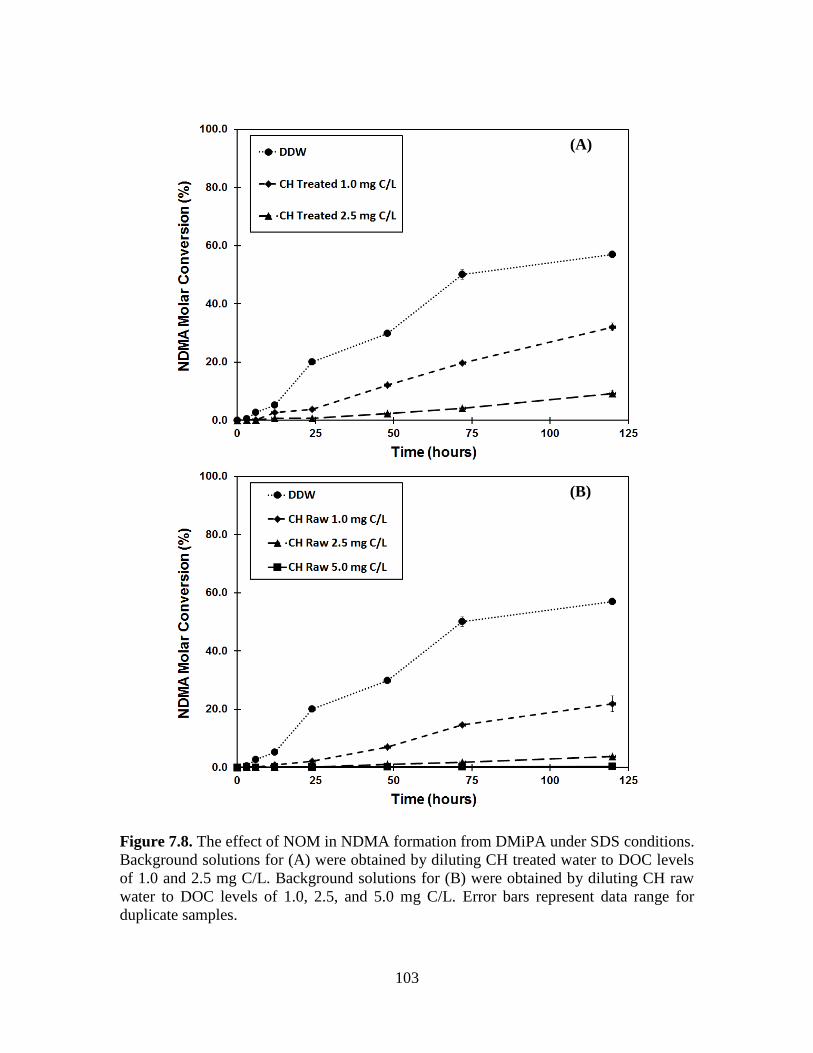
103
Figure 7.8. The effect of NOM in NDMA formation from DMiPA under SDS conditions.
Background solutions for (A) were obtained by diluting CH treated water to DOC levels
of 1.0 and 2.5 mg C/L. Background solutions for (B) were obtained by diluting CH raw
water to DOC levels of 1.0, 2.5, and 5.0 mg C/L. Error bars represent data range for
duplicate samples.
(A)
(B)
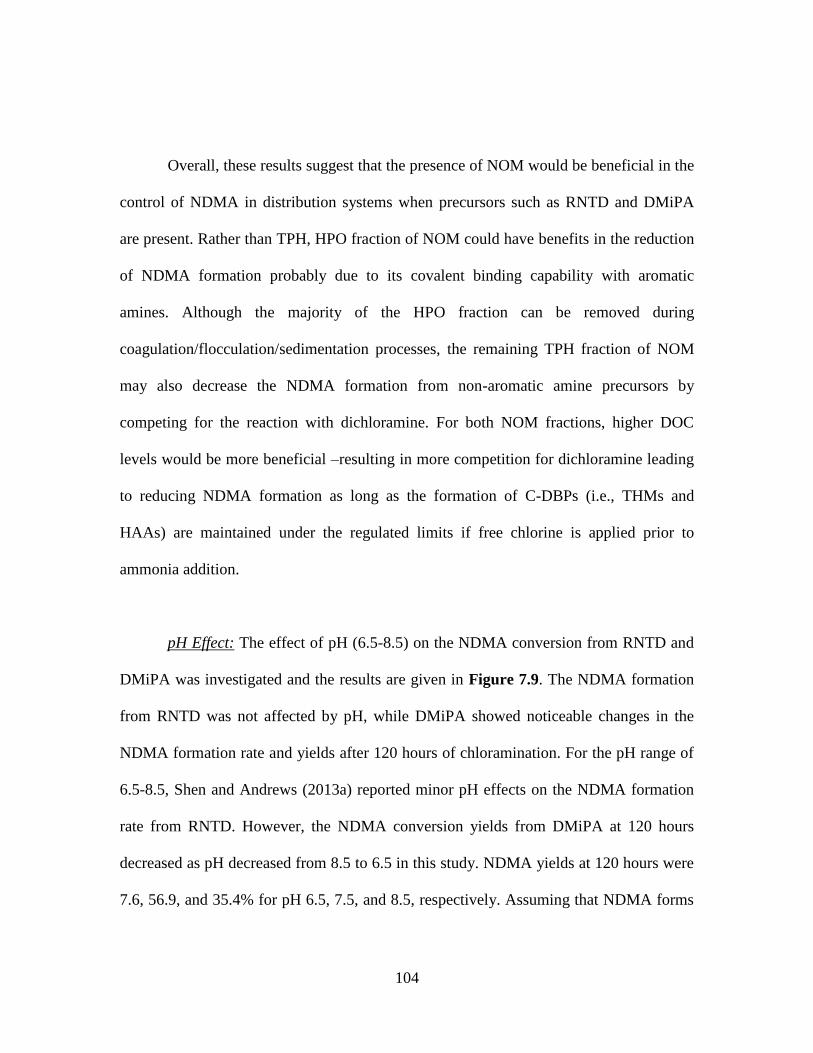
104
Overall, these results suggest that the presence of NOM would be beneficial in the
control of NDMA in distribution systems when precursors such as RNTD and DMiPA
are present. Rather than TPH, HPO fraction of NOM could have benefits in the reduction
of NDMA formation probably due to its covalent binding capability with aromatic
amines. Although the majority of the HPO fraction can be removed during
coagulation/flocculation/sedimentation processes, the remaining TPH fraction of NOM
may also decrease the NDMA formation from non-aromatic amine precursors by
competing for the reaction with dichloramine. For both NOM fractions, higher DOC
levels would be more beneficial –resulting in more competition for dichloramine leading
to reducing NDMA formation as long as the formation of C-DBPs (i.e., THMs and
HAAs) are maintained under the regulated limits if free chlorine is applied prior to
ammonia addition.
pH Effect: The effect of pH (6.5-8.5) on the NDMA conversion from RNTD and
DMiPA was investigated and the results are given in Figure 7.9. The NDMA formation
from RNTD was not affected by pH, while DMiPA showed noticeable changes in the
NDMA formation rate and yields after 120 hours of chloramination. For the pH range of
6.5-8.5, Shen and Andrews (2013a) reported minor pH effects on the NDMA formation
rate from RNTD. However, the NDMA conversion yields from DMiPA at 120 hours
decreased as pH decreased from 8.5 to 6.5 in this study. NDMA yields at 120 hours were
7.6, 56.9, and 35.4% for pH 6.5, 7.5, and 8.5, respectively. Assuming that NDMA forms
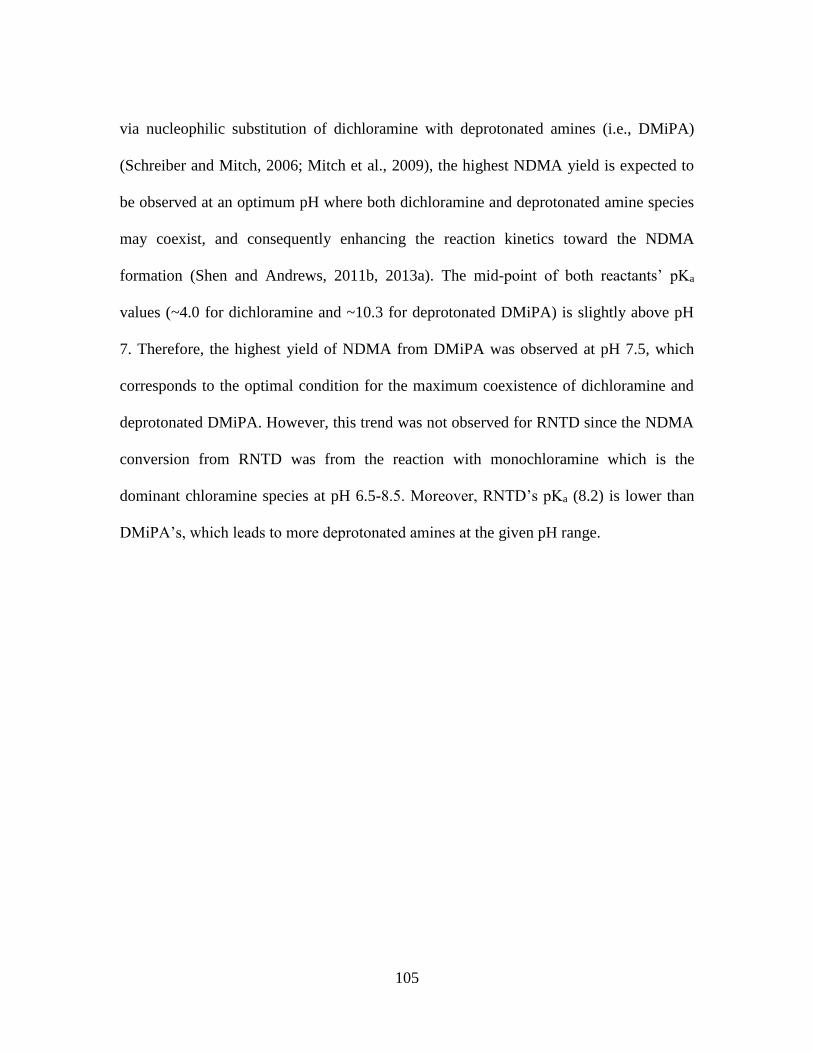
105
via nucleophilic substitution of dichloramine with deprotonated amines (i.e., DMiPA)
(Schreiber and Mitch, 2006; Mitch et al., 2009), the highest NDMA yield is expected to
be observed at an optimum pH where both dichloramine and deprotonated amine species
may coexist, and consequently enhancing the reaction kinetics toward the NDMA
formation (Shen and Andrews, 2011b, 2013a). The mid-point of both reactants’ pKa
values (~4.0 for dichloramine and ~10.3 for deprotonated DMiPA) is slightly above pH
7. Therefore, the highest yield of NDMA from DMiPA was observed at pH 7.5, which
corresponds to the optimal condition for the maximum coexistence of dichloramine and
deprotonated DMiPA. However, this trend was not observed for RNTD since the NDMA
conversion from RNTD was from the reaction with monochloramine which is the
dominant chloramine species at pH 6.5-8.5. Moreover, RNTD’s pKa (8.2) is lower than
DMiPA’s, which leads to more deprotonated amines at the given pH range.
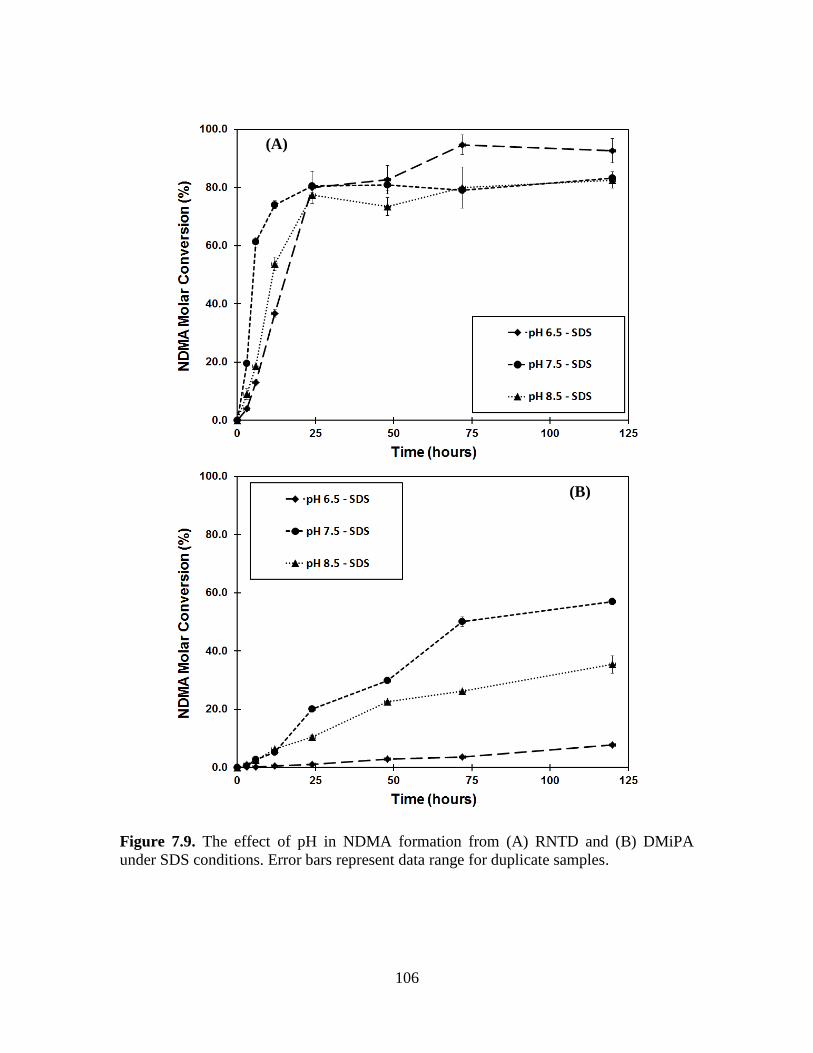
106
Figure 7.9. The effect of pH in NDMA formation from (A) RNTD and (B) DMiPA
under SDS conditions. Error bars represent data range for duplicate samples.
(A)
(B)
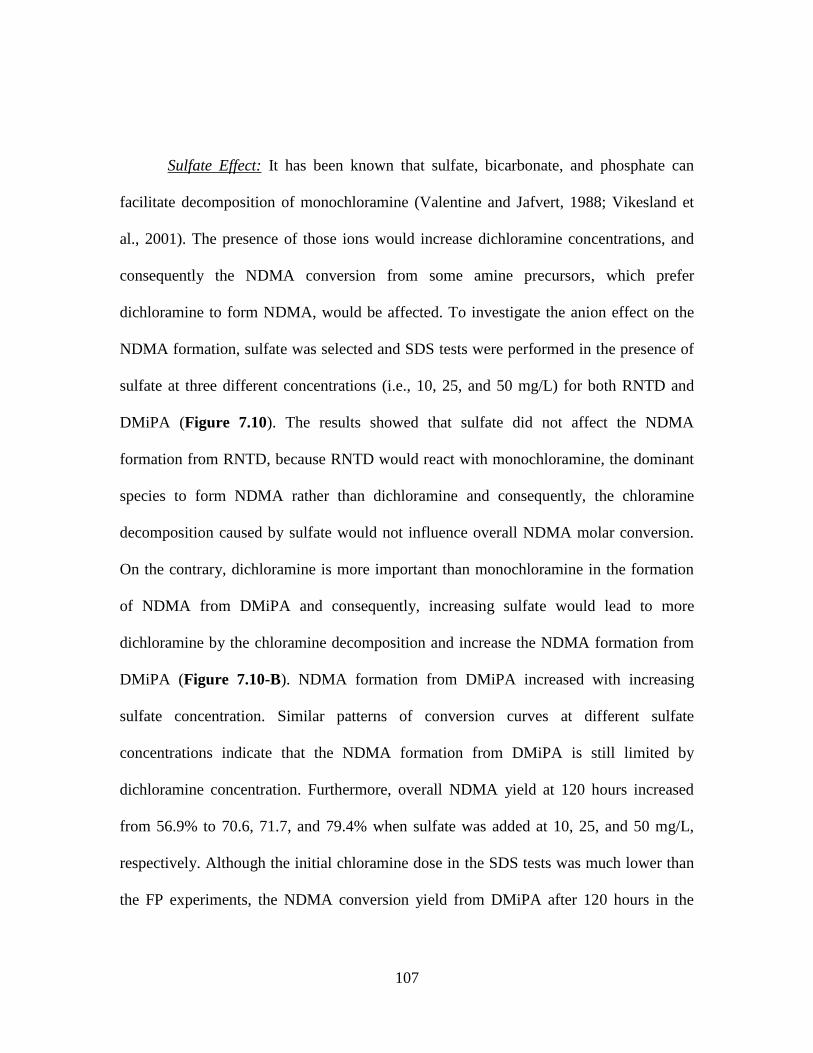
107
Sulfate Effect: It has been known that sulfate, bicarbonate, and phosphate can
facilitate decomposition of monochloramine (Valentine and Jafvert, 1988; Vikesland et
al., 2001). The presence of those ions would increase dichloramine concentrations, and
consequently the NDMA conversion from some amine precursors, which prefer
dichloramine to form NDMA, would be affected. To investigate the anion effect on the
NDMA formation, sulfate was selected and SDS tests were performed in the presence of
sulfate at three different concentrations (i.e., 10, 25, and 50 mg/L) for both RNTD and
DMiPA (Figure 7.10). The results showed that sulfate did not affect the NDMA
formation from RNTD, because RNTD would react with monochloramine, the dominant
species to form NDMA rather than dichloramine and consequently, the chloramine
decomposition caused by sulfate would not influence overall NDMA molar conversion.
On the contrary, dichloramine is more important than monochloramine in the formation
of NDMA from DMiPA and consequently, increasing sulfate would lead to more
dichloramine by the chloramine decomposition and increase the NDMA formation from
DMiPA (Figure 7.10-B). NDMA formation from DMiPA increased with increasing
sulfate concentration. Similar patterns of conversion curves at different sulfate
concentrations indicate that the NDMA formation from DMiPA is still limited by
dichloramine concentration. Furthermore, overall NDMA yield at 120 hours increased
from 56.9% to 70.6, 71.7, and 79.4% when sulfate was added at 10, 25, and 50 mg/L,
respectively. Although the initial chloramine dose in the SDS tests was much lower than
the FP experiments, the NDMA conversion yield from DMiPA after 120 hours in the
108
presence of 50 mg/L sulfate reached ~80% which is the maximum level observed from
the FP test. These results indicate that introducing sulfate during coagulation, or
phosphate during pH adjustment or bicarbonate during recarbonation may increase the
chloramine decomposition (Valentine and Jafvert, 1988; Vikesland et al., 2001) and the
NDMA formation may increase or decrease depending on precursors’ properties. Even
though no additional precursors are introduced during water treatment processes, the
NDMA formation may increase in distribution systems due to anion effects and long
detention times. Therefore, such processes must be optimized to reduce possible
chloramine decomposition in distribution systems.
109
Figure 7.10. The effect of sulfate in NDMA formation from (A) RNTD and (B) DMiPA
under SDS conditions. Error bars represent data range for duplicate samples.
(A)
(B)
110
Case Studies
CH Drinking Water Treatment Plant: As a case study, the NDMA formation rate
was examined with CH raw and treated water under three different chloramination
conditions (i.e., FP, SDS, and SDS in the presence of excess ammonia) and the results are
given in Table 7.2. In the FP experiment with both waters, the NDMA formation yield
reached its maximum within the initial 24 hours of chloramination. The NDMA
formation rate decreased gradually for the next 48 hours. And at last, the NDMA
formation reached the plateau after 72 hours of chloramination yielding 59 and 45 ng/L
of NDMA at 120 hours from CH raw and treated, respectively. The difference in NDMA
FP values of CH raw and CH treated waters corresponds to a ~24% reduction in NDMA
precursors. This was found consistent with the ongoing project for three DWTPs, where
coagulation/flocculation/sedimentation (without any polymer influence) resulted in 9-
23% reduction in NDMA FP (Uzun et al., 2012).
The NDMA formation in CH raw water under SDS conditions was below MRL.
However, NDMA formation was observed in CH treated water reaching up to 9 ng/L at
120 hours of chloramination. Since DOC of the raw water decreased from 6.3 mg C/L to
2.8 mg C/L after coagulation/flocculation/sedimentation, the competition between NOM
and amines for dichloramine decreased and consequently, dichloramine could be more
available for reactions with amines leading to higher NDMA formation. In addition, since
alum was used in this DWTP as the coagulant, sulfate concentration increased from 6.3 to
36.8 mg/L. This increase in the sulfate level could also contribute to dichloramine levels
111
leading to higher NDMA formation under SDS conditions. To confirm this alum effect
on the NDMA formation, CH raw water was spiked with 50 mg/L of sulfate and was
subjected to the SDS test. In the presence of sulfate, however, the NDMA formation was
still below MRL; indicating that introduction of sulfate in the coagulation process did not
affect the NDMA formation. This suggests that only DOC removal could be the reason
for the NDMA formation observed in CH treated water. The importance of DOC and the
NDMA formation curve over the reaction time under SDS conditions indicate that: (i) the
formation is limited by the transformation of monochloramine to dichloramine; and (ii)
NDMA can continue to form as long as there is residual chloramine present. In both
samples, the NDMA levels were below MRL under SDS conditions in the presence of
excess ammonia. Thus, precursors which are sensitive to monochloramine must have
been negligible in this water source. If a water source has negligible amounts of
precursors which are sensitive to monochloramine, the dichloramine would be the key
player for NDMA formation.
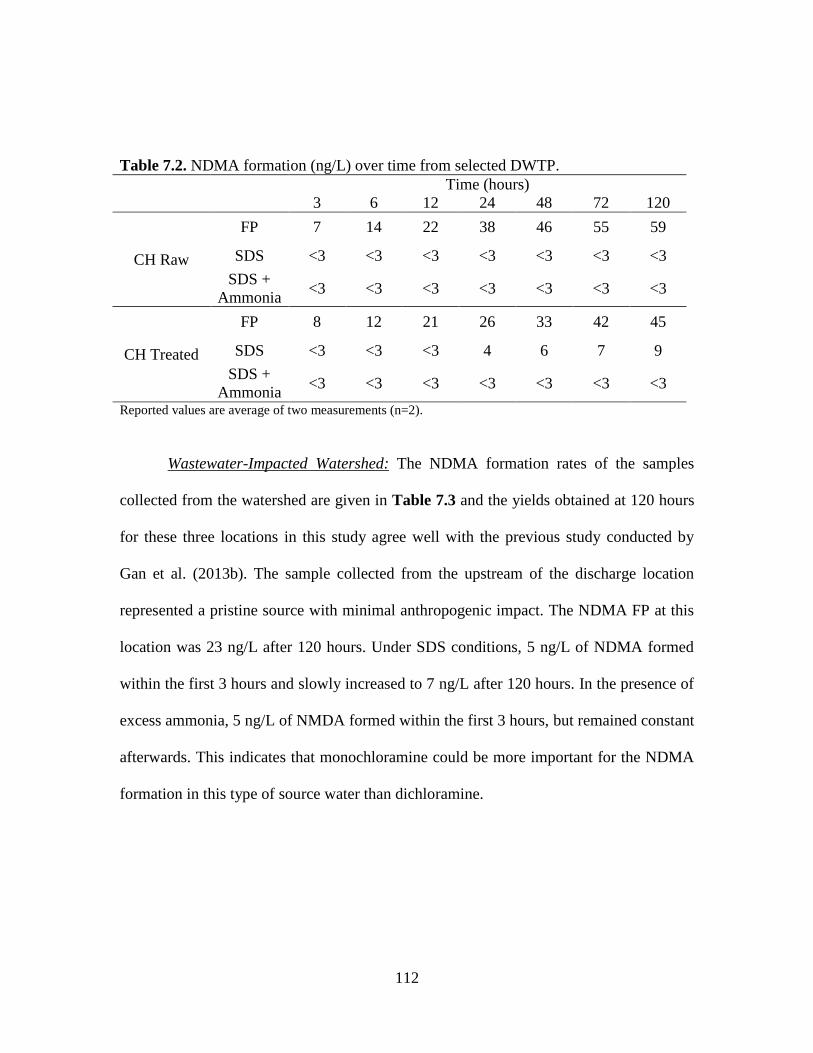
112
Table 7.2. NDMA formation (ng/L) over time from selected DWTP.
Time (hours)
3 6 12 24 48 72 120
CH Raw
FP 7 14 22 38 46 55 59
SDS <3 <3 <3 <3 <3 <3 <3
SDS +
Ammonia <3 <3 <3 <3 <3 <3 <3
CH Treated
FP 8 12 21 26 33 42 45
SDS <3 <3 <3 4 6 7 9
SDS +
Ammonia <3 <3 <3 <3 <3 <3 <3
Reported values are average of two measurements (n=2).
Wastewater-Impacted Watershed: The NDMA formation rates of the samples
collected from the watershed are given in Table 7.3 and the yields obtained at 120 hours
for these three locations in this study agree well with the previous study conducted by
Gan et al. (2013b). The sample collected from the upstream of the discharge location
represented a pristine source with minimal anthropogenic impact. The NDMA FP at this
location was 23 ng/L after 120 hours. Under SDS conditions, 5 ng/L of NDMA formed
within the first 3 hours and slowly increased to 7 ng/L after 120 hours. In the presence of
excess ammonia, 5 ng/L of NMDA formed within the first 3 hours, but remained constant
afterwards. This indicates that monochloramine could be more important for the NDMA
formation in this type of source water than dichloramine.
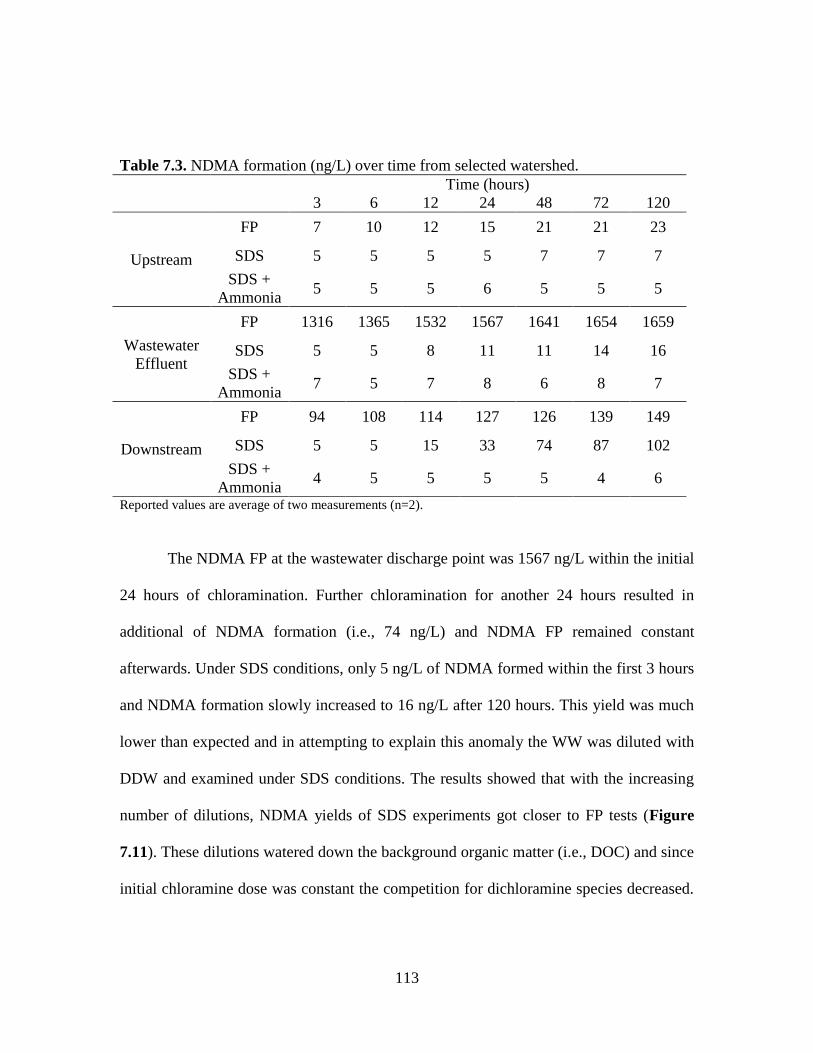
113
Table 7.3. NDMA formation (ng/L) over time from selected watershed.
Time (hours)
3 6 12 24 48 72 120
Upstream
FP 7 10 12 15 21 21 23
SDS 5 5 5 5 7 7 7
SDS +
Ammonia 5 5 5 6 5 5 5
Wastewater
Effluent
FP 1316 1365 1532 1567 1641 1654 1659
SDS 5 5 8 11 11 14 16
SDS +
Ammonia 7 5 7 8 6 8 7
Downstream
FP 94 108 114 127 126 139 149
SDS 5 5 15 33 74 87 102
SDS +
Ammonia 4 5 5 5 5 4 6
Reported values are average of two measurements (n=2).
The NDMA FP at the wastewater discharge point was 1567 ng/L within the initial
24 hours of chloramination. Further chloramination for another 24 hours resulted in
additional of NDMA formation (i.e., 74 ng/L) and NDMA FP remained constant
afterwards. Under SDS conditions, only 5 ng/L of NDMA formed within the first 3 hours
and NDMA formation slowly increased to 16 ng/L after 120 hours. This yield was much
lower than expected and in attempting to explain this anomaly the WW was diluted with
DDW and examined under SDS conditions. The results showed that with the increasing
number of dilutions, NDMA yields of SDS experiments got closer to FP tests (Figure
7.11). These dilutions watered down the background organic matter (i.e., DOC) and since
initial chloramine dose was constant the competition for dichloramine species decreased.
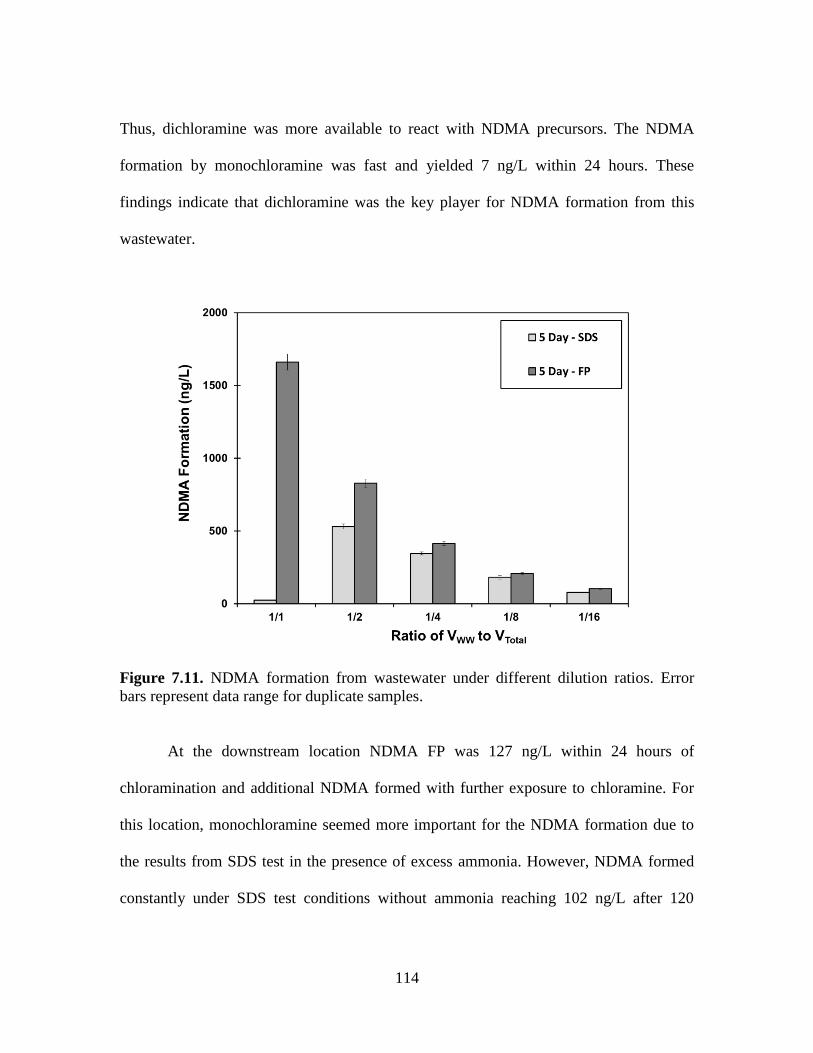
114
Thus, dichloramine was more available to react with NDMA precursors. The NDMA
formation by monochloramine was fast and yielded 7 ng/L within 24 hours. These
findings indicate that dichloramine was the key player for NDMA formation from this
wastewater.
Figure 7.11. NDMA formation from wastewater under different dilution ratios. Error
bars represent data range for duplicate samples.
At the downstream location NDMA FP was 127 ng/L within 24 hours of
chloramination and additional NDMA formed with further exposure to chloramine. For
this location, monochloramine seemed more important for the NDMA formation due to
the results from SDS test in the presence of excess ammonia. However, NDMA formed
constantly under SDS test conditions without ammonia reaching 102 ng/L after 120
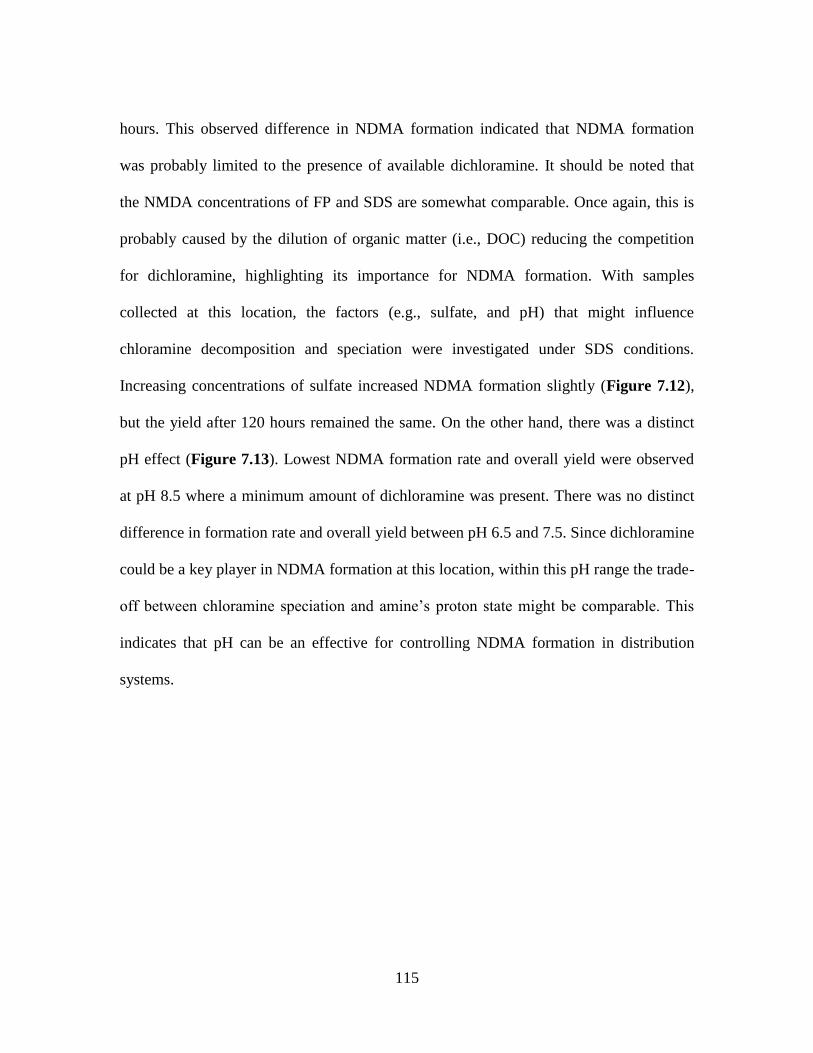
115
hours. This observed difference in NDMA formation indicated that NDMA formation
was probably limited to the presence of available dichloramine. It should be noted that
the NMDA concentrations of FP and SDS are somewhat comparable. Once again, this is
probably caused by the dilution of organic matter (i.e., DOC) reducing the competition
for dichloramine, highlighting its importance for NDMA formation. With samples
collected at this location, the factors (e.g., sulfate, and pH) that might influence
chloramine decomposition and speciation were investigated under SDS conditions.
Increasing concentrations of sulfate increased NDMA formation slightly (Figure 7.12),
but the yield after 120 hours remained the same. On the other hand, there was a distinct
pH effect (Figure 7.13). Lowest NDMA formation rate and overall yield were observed
at pH 8.5 where a minimum amount of dichloramine was present. There was no distinct
difference in formation rate and overall yield between pH 6.5 and 7.5. Since dichloramine
could be a key player in NDMA formation at this location, within this pH range the trade-
off between chloramine speciation and amine’s proton state might be comparable. This
indicates that pH can be an effective for controlling NDMA formation in distribution
systems.
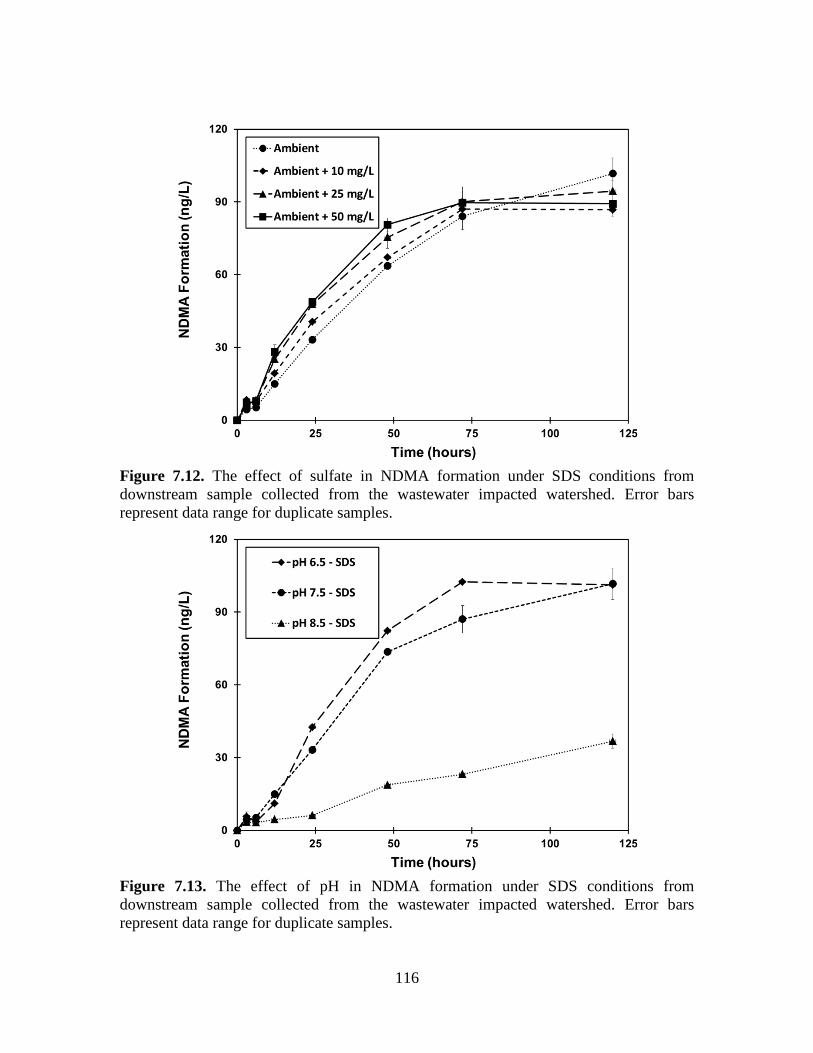
116
Figure 7.12. The effect of sulfate in NDMA formation under SDS conditions from
downstream sample collected from the wastewater impacted watershed. Error bars
represent data range for duplicate samples.
Figure 7.13. The effect of pH in NDMA formation under SDS conditions from
downstream sample collected from the wastewater impacted watershed. Error bars
represent data range for duplicate samples.
117
Conclusions
NDMA formation rate from DMA and four tertiary amines was determined under
three chloramination conditions (i.e., FP, SDS, and SDS in the presence of excess
ammonia). The results showed that the electron distribution of the tertiary amine
determines the reactive chloramine species. Compounds with EWG (i.e., RNTD) reacted
preferentially with monochloramine, whereas compounds with EDG (i.e., DMiPA)
reacted preferentially with dichloramine to form NDMA. Since monochloramine is the
abundant species at pH 7.5, NDMA formation rate from amines with EWGs were
relatively fast and reached a plateau approximately within 24 hours of chloramine
application in all three test conditions. On the other hand, the NDMA formation rate from
compounds with EDG was highly dependent on the dichloramine concentration. In the
NDMA FP tests, compounds with EDG also had a relatively fast reaction and reached a
plateau approximately within 24 hours of chloramination. However, the NDMA
formation rate from those was limited by the transformation of monochloramine to
dichloramine under SDS conditions and had a relatively low rate. Further suppression of
dichloramine - in the SDS tests by spiking excess ammonia - resulted in negligible
NDMA formation from these compounds.
The presence of NOM decreased the NDMA formation rate and overall
conversion due to competition for dichloramine and consequently, drastic decreases were
noticed for DMiPA. Only the HPO fraction of the NOM was found to decrease the
NDMA formation from RNTD which could be caused by its aromatic structure leading to
118
a binding with NOM. In NDMA formation, pH plays a key role as it influences both
chloramine speciation and protonation state of the amine. Thus, the more profound effect
was observed on the dichloramine sensitive DMiPA, whereas RNTD did not show a
distinct difference. Lastly, the presence of sulfate that can increase the chloramine
decomposition was found to increase NDMA formation from DMiPA, but had no effect
on RNTD.
Investigating two case studies showed that some NDMA can be formed by
monochloramine; however, dichloramine was observed to be the dominant species
responsible for NDMA formation in both systems. The NDMA formation was found to
be limited by the transformation of monochloramine to dichloramine, and thus relatively
slow NDMA formation rates were observed under SDS conditions. It is likely that the
presence of high levels of NOM could be beneficial to reduce the NDMA formation rate
due to competition for the dichloramine species. However, it should be noted that it is not
desirable to have high levels of NOM in the distribution system as it can lead several
issues (i.e., formation of THMs and HAAs during pre-chlorination, increased microbial
activity in the distribution system). While NOM may hinder NDMA formation, presence
of chloramine decomposing ions (i.e., sulfate, phosphate, bicarbonate) may work against
this effect. Also, since dichloramine is the key player for NDMA formation, pH can be an
effective tool to control NDMA formation as it influences both chloramine speciation and
protonation state of the amine.
119
CHAPTER EIGHT
8. THE EFFECT OF PRE-OXIDATION ON OVERALL NDMA FORMATION, AND
THE INFLUENCE OF PH
Introduction and Objective
Chloramination has become increasingly used among drinking water utilities in
the US to comply with DBP regulations, such as THMs and HAAs. Unfortunately,
chloramination can lead to the formation of nitrosamines (Choi and Valentine, 2002a,b;
Choi et al., 2002; Mitch et al., 2003a,b), which are probable carcinogens, mutagens, and
teratogens (USEPA, 1993). Among nitrosamines, NDMA has drawn the most attention
due to its frequent detection in drinking water systems and high lifetime cancer risk level
(USEPA, 1993). Although there are currently no federal regulations concerning
nitrosamines in drinking water in the United States, the USEPA has listed nitrosamines as
one of three potential groups of contaminants highlighted for possible regulation in the
near future (Roberson, 2011).
NDMA preferentially forms upon chloramination via a nucleophilic substitution
reaction between chloramine (mono- or di-) and amines (Schreiber and Mitch, 2006;
Mitch et al., 2009; Le Roux et al, 2012b). NDMA can also form during chlorination in
the presence of nitrite, especially under acidic conditions (Choi and Valentine, 2003) and
during ozonation (Andrzejewski et al., 2008; Oya et al., 2008; Schmidt and Brauch,
2008). The precursors that have been reported to form NDMA upon oxidation include,
but are not limited to, DMA, and tertiary and quaternary amines with a DMA moiety in
120
their molecular structures (Lee et al., 2007a; Kemper et al., 2010; Shen and Andrews,
2011a,b), such as fungicides, pesticides, herbicides (Graham et al., 1995; Chen and
Young, 2008; Schmidt and Brauch, 2008), pharmaceuticals, cosmetics (Sacher et al.,
2008; Shen and Andrews, 2011a), wastewater effluent organic matter (Sedlak et al.,
2005; Krauss et al., 2009; Shah et al., 2012; Gan et al, 2013a,b), and NOM (Gerecke and
Sedlak, 2003; Mitch and Sedlak, 2004; Chen and Valentine, 2007; Dotson et al., 2007;
Krasner et al., 2008a). NDMA formation was also found to increase in the presence of
polymers and ion-exchange resins (Kimoto et al., 1980; Najm and Trussell, 2001; Kohut
and Andrews, 2003; Wilczak et al., 2003; Mitch and Sedlak, 2004; Nawrocki and
Andrzejewski, 2011; Gan et al, 2013a,b).
The use of pre-oxidants for either transforming or eliminating NDMA precursors
prior to chloramination can be a viable strategy for water utilities to control the NDMA
levels. Chlorine is the most commonly applied pre-oxidant in water treatment; however,
due to the formation of regulated C-DBPs from chlorine (i.e., THMs and HAAs), the use
of chlorine dioxide and ozone to control simultaneously both regulated C-DBPs and
nitrosamines has received attention within the last decade (Shah et al., 2012).
Previous studies with chlorine, chlorine dioxide, and ozone have provided some
promising results to reduce NDMA formation, despite some observations that the same
pre-oxidants enhanced NDMA formation in some cases (Charrois and Hrudrey, 2007;
Lee et al., 2007a; Chen and Valentine, 2008; Krasner et al, 2012a; Shah et al., 2012; Shen
and Andrews, 2013b). In general, the research indicated that ozone and chlorine are
effective oxidants for controlling NDMA precursors, likely due to their high reaction rate
121
constants with amines, especially in their deprotonated forms (von Gunten, 2003; Ternes
and Joss, 2006; Lee and von Gunten, 2010; Krasner et al., 2012a). For example, ozone
reduced NDMA formation by over 50% within a very short contact time (i.e., CT ≤0.5
mg×min/L) (Lee et al., 2007a; Chen and Valentine, 2008; Shah et al., 2012), and only in
a few cases did ozonation actually lead to the formation of NDMA (Asami et al., 2009;
von Gunten et al., 2010). Chlorine was also able to achieve the same level of deactivation
as ozone at longer contact times (i.e., CT ~50 mg×min/L), while increases in NDMA
formation occurred at low exposure levels (i.e., CT ≤25 mg×min/L) in a few wastewater-
impacted sources, due to the nitrosation pathway facilitated by the presence of nitrite
(Chen and Valentine, 2008; Shah et al., 2012). Although chlorine dioxide has the
potential to control NDMA formation (Lee et al., 2007a), it may increase the overall
NDMA formation like ozone (Shah et al., 2012).
The effects of pre-oxidant on the reactivity of a few types of NDMA precursors
have been investigated in a few studies: (i) some amides (Schmidt and Brauch, 2008; von
Gunten et al., 2010), anti-yellowing agents (Kosaka et al., 2009), and polymers (Padhye
et al., 2011a) were recognized to form NDMA during ozonation without chloramination;
(ii) the use of ozone and chlorine dioxide reduced NDMA formation from seven tertiary
amines; however, it is noted that substantially high doses of oxidants compared to typical
doses for drinking water treatment were used (Lee et al., 2007a); and (iii) pre-
chlorination reduced NDMA formation from RNTD, nizatidine, and tetracycline by 50%,
at a relatively low contact time (i.e., CT ~10 mg×min/L) (Shen and Andrews, 2013b).
122
The main objective of this study was to systematically investigate the impact of
commonly-applied pre-oxidants on the formation of NDMA during chloramination from
a suite of carefully selected NDMA precursor to: (i) investigate the effects of pre-
oxidants on NDMA formation (either by increasing, decreasing, or remaining constant);
(ii) determine the optimum CT values to minimize the NDMA formation from each
precursor, and (iii) examine the effect of pH. Fifteen precursors with a DMA moiety in
their structures, such as secondary amine, tertiary aliphatic and aromatic amines,
polymers, amides, and hydrazines, were selected. The CT curves for the effect of pre-
oxidation with chlorine, chlorine dioxide and ozone were obtained for each compound
and an overall comparison was made. A representative compound was chosen from each
group of precursors to further evaluate to the effect of pre-oxidation pH.
Materials and Methods
NDMA Precursors
Selected amines, amides, and polymers were tested for NDMA formation to cover
a wide range of precursors which might be encountered during drinking water treatment.
Chemical structures and abbreviations of these compounds are given in Figure 8.1. All
compounds were purchased from Sigma-Aldrich, SP2, and TCI, and used without further
purification.
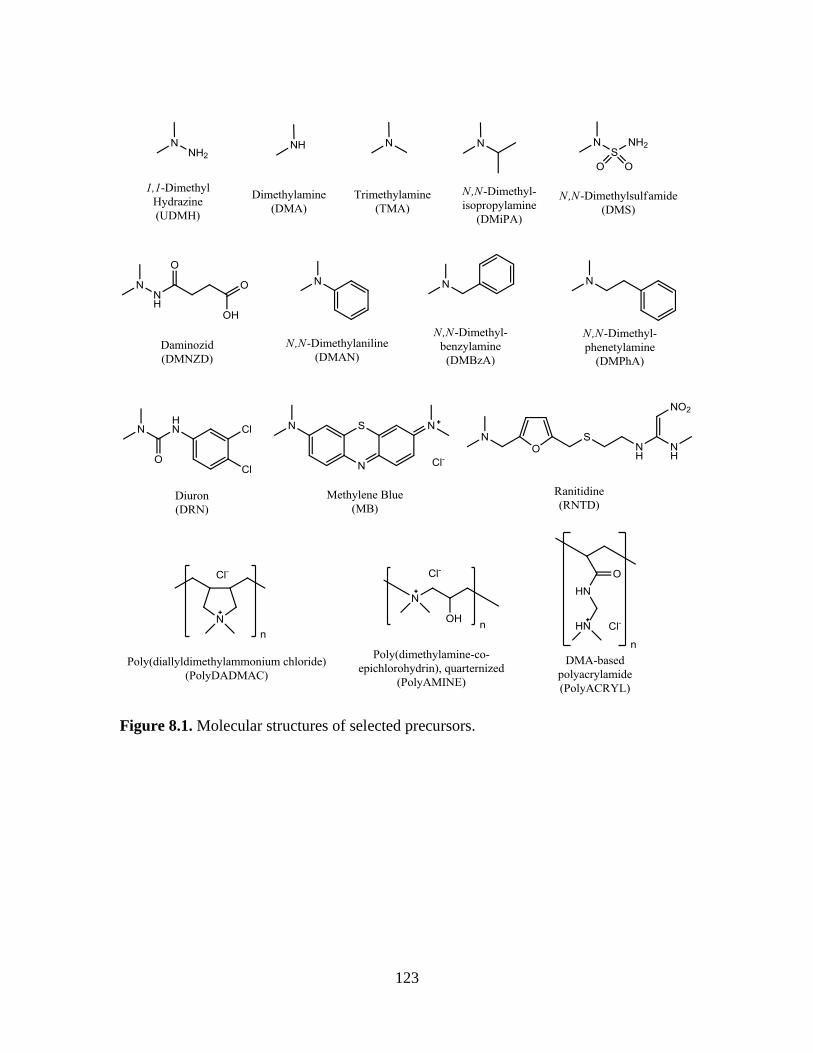
123
Figure 8.1. Molecular structures of selected precursors.
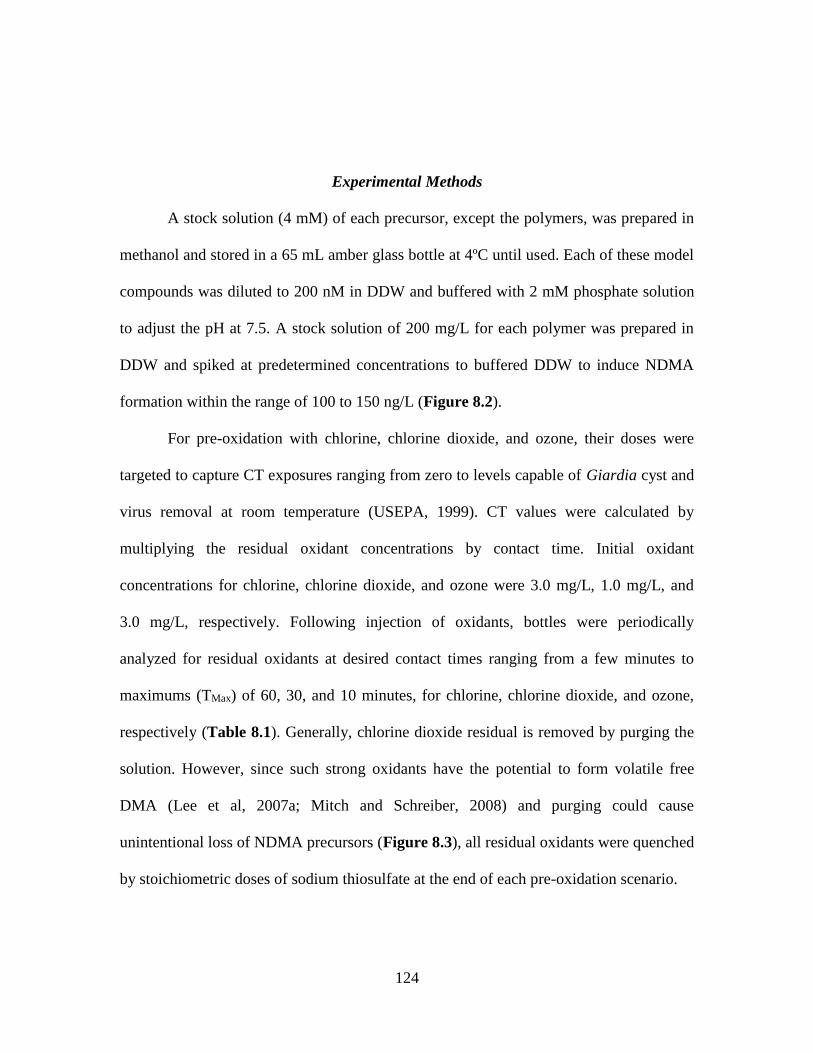
124
Experimental Methods
A stock solution (4 mM) of each precursor, except the polymers, was prepared in
methanol and stored in a 65 mL amber glass bottle at 4ºC until used. Each of these model
compounds was diluted to 200 nM in DDW and buffered with 2 mM phosphate solution
to adjust the pH at 7.5. A stock solution of 200 mg/L for each polymer was prepared in
DDW and spiked at predetermined concentrations to buffered DDW to induce NDMA
formation within the range of 100 to 150 ng/L (Figure 8.2).
For pre-oxidation with chlorine, chlorine dioxide, and ozone, their doses were
targeted to capture CT exposures ranging from zero to levels capable of Giardia cyst and
virus removal at room temperature (USEPA, 1999). CT values were calculated by
multiplying the residual oxidant concentrations by contact time. Initial oxidant
concentrations for chlorine, chlorine dioxide, and ozone were 3.0 mg/L, 1.0 mg/L, and
3.0 mg/L, respectively. Following injection of oxidants, bottles were periodically
analyzed for residual oxidants at desired contact times ranging from a few minutes to
maximums (TMax) of 60, 30, and 10 minutes, for chlorine, chlorine dioxide, and ozone,
respectively (Table 8.1). Generally, chlorine dioxide residual is removed by purging the
solution. However, since such strong oxidants have the potential to form volatile free
DMA (Lee et al, 2007a; Mitch and Schreiber, 2008) and purging could cause
unintentional loss of NDMA precursors (Figure 8.3), all residual oxidants were quenched
by stoichiometric doses of sodium thiosulfate at the end of each pre-oxidation scenario.
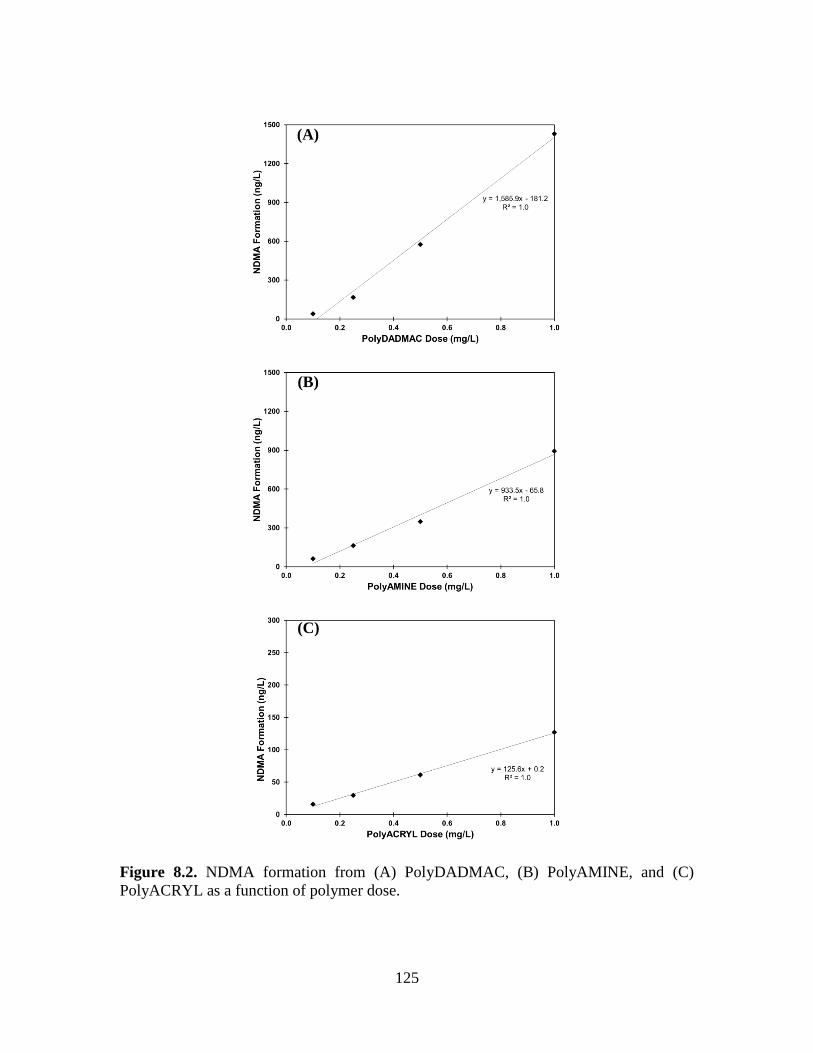
125
Figure 8.2. NDMA formation from (A) PolyDADMAC, (B) PolyAMINE, and (C)
PolyACRYL as a function of polymer dose.
(A)
(B)
(C)
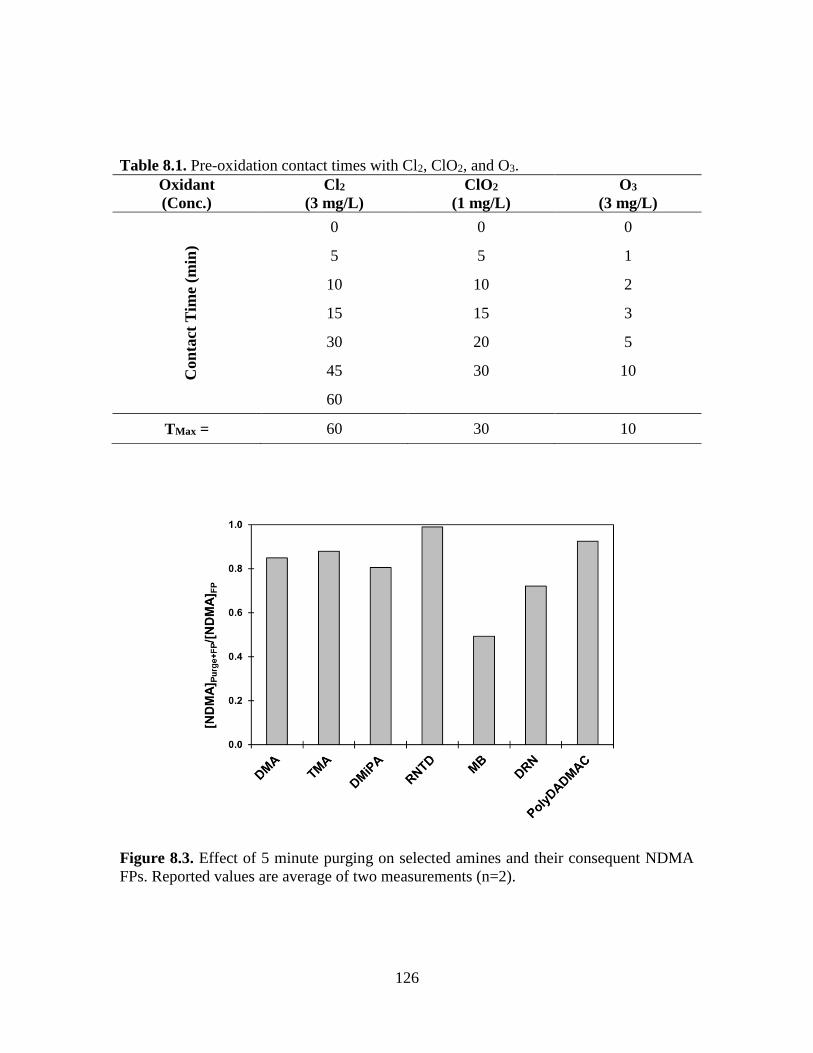
126
Table 8.1. Pre-oxidation contact times with Cl2, ClO2, and O3.
Oxidant
(Conc.)
Cl2
(3 mg/L)
ClO2
(1 mg/L)
O3
(3 mg/L) C
on
tact
Tim
e (m
in)
0 0 0
5 5 1
10 10 2
15 15 3
30 20 5
45 30 10
60
TMax = 60 30 10
Figure 8.3. Effect of 5 minute purging on selected amines and their consequent NDMA
FPs. Reported values are average of two measurements (n=2).
127
To investigate the effect of pre-oxidation pH, precursor solutions diluted in DDW
were buffered with 2 mM phosphate solution to adjust the pH at 5.5, 6.5, 7.5, 8.0, 8.5, 9.0
and 9.5. Chlorine, chlorine dioxide, and ozone were injected at the same concentrations
used to obtain the CT curves. At T/TMax of 0.2 for each oxidation scenario (i.e., 12 min
for chlorine, 6 min for chlorine dioxide, and 2 min for ozone) oxidation of precursors
were quenched with stoichiometric doses of sodium thiosulfate.
Chloramine FP tests were conducted immediately after pre-oxidation experiments
(quenched with stoichiometric doses of sodium thiosulfate) spiked with chloramine and a
phosphate buffer. Residual concentrations of the pre-oxidants can be found in Figures
F.1 through F.3. Chloramine stock solution was prepared by mixing diluted sodium
hypochlorite and ammonium sulfate solutions at Cl:N mass ratio of 4:1 at pH 9. An initial
chloramine concentration of 100 mg/L as Cl2 was used at pH 7.5 in the presence of the 10
mM phosphate buffer, prepared by mixing sodium phosphate mono- and dibasic. NDMA
FP tests were carried out in 1-L amber glass bottles without headspace, in the dark at 21-
23oC, for 5 days of contact time. Typical chloramine concentrations can be found Figure
F.4.
Analytical methods
NDMA was analyzed following USEPA method 521 (USEPA, 2004), consisting
of SPE using coconut charcoal followed by GC-MS/MS analysis. Analytical details can
be found in the previous sections and a brief summary is as follows. For the sample
analysis, 500 mL of chloraminated amine solutions were quenched with sodium
thiosulfate and NDMA-d6 was added as a surrogate before SPE. Samples were passed
128
through coconut charcoal cartridges which were preconditioned with DCM, methanol,
and DDW. The cartridges were dried with air, and then eluted with DCM. Eluents were
passed through sodium sulfate columns to remove residual moisture, and then
concentrated to 1 mL under a gentle stream of high purity nitrogen gas. The extracts were
spiked with NDPA-d14 as an internal standard, and analyzed using a Varian GC-MS/MS
4000 under the CI mode. Percent molar yield of each precursor was calculated, except
polymers, using Equation 6.1 (Appendix B)Error! Reference source not found..
Ozone gas, generated by a GTC-1B Griffin ozone generator fed by ultra-high
purity oxygen, was purged into DDW cooled to 4ºC to produce ozone stock solutions.
Throughout the experiments, the ozone concentrations of stock solutions and samples
were measured with the HACH spectrophotometer. Chlorine dioxide stock solutions were
prepared via the slow acidification of NaClO2 solution with H2SO4 (Jones et al., 2012).
Residual chlorine dioxide concentrations were monitored by the SM 4500-ClO2 E
method (APHA/AWWA/WEF, 2005), as well as by the HACH spectrophotometer.
Concentrations of free chlorine, and mono- and dichloramine reported as free chlorine,
were determined following SM 4500-Cl F (APHA/AWWA/WEF, 2005). All analytical
methods and their MRLs are given in Table 4.1. All samples and blanks were prepared,
extracted and analyzed in duplicates. Error bars in all the graphs show the variability in
duplicate analysis (n=2).
129
Results and Discussion
Pre-oxidation with Chlorine
The NDMA molar conversions from selected precursors during pre-chlorination
are shown in Figure 8.4. The NDMA formation from DMA decreased from 1.6% to
1.1% within 5 minutes (i.e., CT of 15 mg×min/L) of contact time with chlorine. It has
been known that DMA has high reactivity with chlorine (kapp at pH 7 ≈ 104 M-1 s-1),
rapidly forming chlorinated DMA (Cl-DMA) (Deborde and von Gunten, 2008; Lee and
von Gunten, 2010; Solterman et al., 2013). However, increased chlorine contact time
(i.e., CT of 180 mg×min/L) did not lead to further decreases in the NDMA formation
from DMA. Therefore, formed Cl-DMA could remain in the solution and still form
NDMA during sequential chloramination. It is noted that NDMA levels yielded from Cl-
DMA were approximately two thirds of DMA yields. Assuming that NDMA formation is
initiated by nucleophilic substitution (Schreiber and Mitch, 2006; Le Roux et al., 2012b),
the electron density on the nitrogen atom of precursors would significantly influence the
overall NDMA yield. Forming a bond between chlorine and nitrogen of DMA would
decrease the electron density on the nitrogen atom. As a result, during sequential
chloramination the nucleophilic substitution to form NDMA would be less favorable.
This phenomenon will also explain the results from chlorination of tertiary amines,
leading to the formation of partial positive charge on the nitrogen atom of amine (Abia et
al., 1998; Deborde and von Gunten, 2008). Pre-chlorination of TMA, DMiPA, DMBzA,
RNTD, and DMAN led to reduction in NDMA molar conversions as expected by
changes in charge density. Their NDMA yields decreased from 1.8, 74.2, 78.4, 87.6, and
130
0.3% to 1.2, 38.1, 30.0, 37.4, and 0.1%, respectively, within the CT of 180 mg×min/L.
For DMAN, similar results were observed: reduction of NDMA formation was achieved
within 5 minutes (15 mg×min/L) and further contact time (i.e. 180 mg×min/L) did not
show any changes in the NDMA formation. On the other hand, gradual decreases in the
NDMA formation from TMA, DMiPA, DMBzA and RNTD were observed as CT values
increased. Relatively sharp decreases were observed especially within the initial 15
minutes of contract time (i.e., CT of 0 to 45 mg×min/L). A similar trend was reported by
Shen and Andrews (2013b) during pre-chlorination of RNTD in DDW. For MB and
DMPhA, relatively constant NDMA yields were observed during pre-oxidation with
chlorine regardless of changing CT values indicating that chlorine does not deactivate
effectively such precursors.
During pre-chlorination, the NDMA formation from hydrazine (UDMH), and
amide (DMNZD) decreased from 0.30 and 0.14% to 0.12 and 0.03%, respectively.
Decreases in the NDMA formation form UDMH happened within the initial 5 minutes
(i.e., CT of 15 mg×min/L) of pre-chlorination, and no further decreases were observed
for the rest of contact times (5 to 60 minutes). For DMNZD, relatively gradual decreases
in NDMA formation were observed, which are similar to tertiary amines such as TMA,
DMiPA, DMBzA, and RNTD. On the other hand, pre-chlorination showed almost no
effect on the NDMA formation from DRN or led to a slight increase in NDMA formation
from DMS. It is likely that neighboring carbonyl or sulfonyl groups can withdraw
electrons and decrease the electron density of the nitrogen atom, thus nucleophilic
substitution by chlorine may become less favorable. For quaternary amine polymers such
131
as PolyDADMAC, PolyAMINE, and PolyACRYL, pre-chlorination showed almost no
effect on overall NDMA formation (Figure 8.5-A). This is probably because nucleophilic
substitution could be hindered by the positive charge on the nitrogen atoms of polymers
(Krasner et al., 2013). Therefore, the reaction of chlorine with quaternary amines would
be limited, and consequently the NDMA formation from polymers with such structures is
expected to remain constant during pre-chlorination.
Pre-chlorination’s efficiency for NDMA control on a wide array of precursors has
not been reported in the literature before. These findings are important to identify the
interactions between chlorine and precursor’s structure and the consequence on NDMA
yield during sequential chloramination. Overall NDMA formation from selected
polymers and compounds with either carbonyl or sulfonyl groups remained constant. For
other precursors NDMA formation decreased to approximately half of the initial yield
([NDMA FP]CT-0/[NDMA FP]CT-180) during pre-chlorination. Similar decreases have been
reported in the pre-chlorination of natural waters (Chen and Valentine, 2008; Shah et al.,
2012), where NDMA formation reduced by half at CT of 50 mg×min/L (Shah et al.,
2012). In a few cases in the literature, increases in NDMA formation were reported in the
presence of nitrite (Shah et al., 2012) through chlorine-triggered nitrosation pathway
(Shah and Mitch, 2012). However, the effect of ions (i.e., nitrite) was not within the
scope of this study, and was not further investigated.
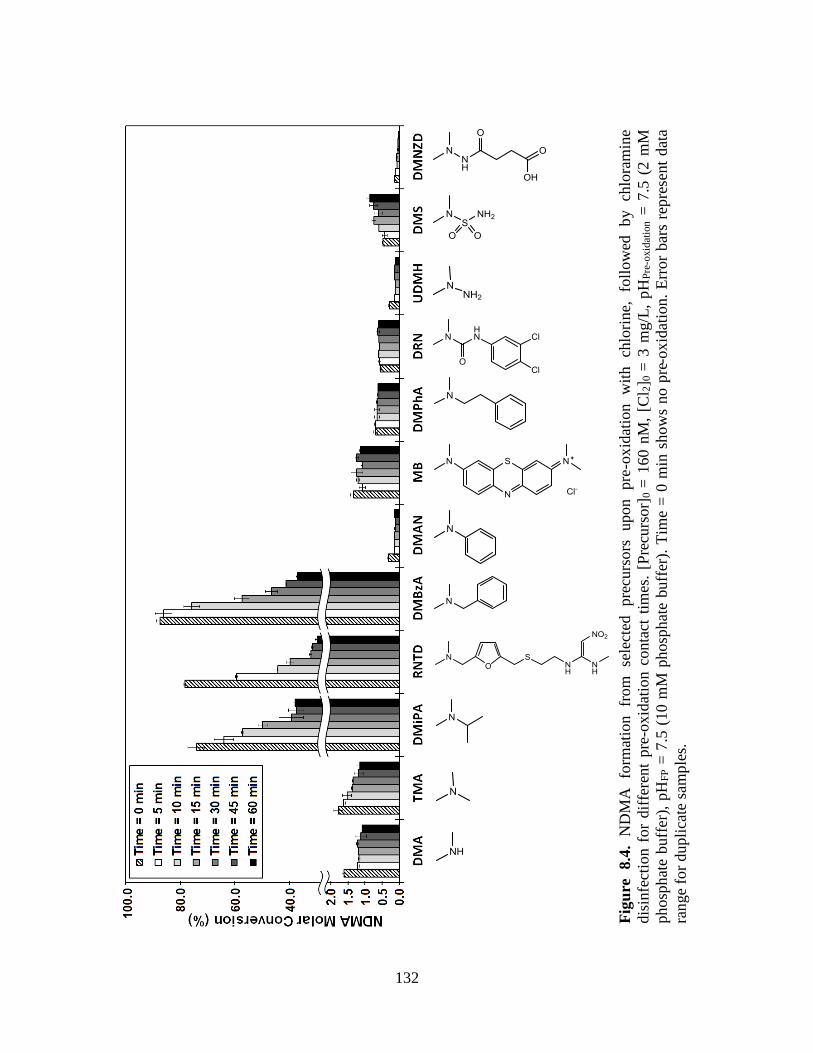
132
Fig
ure
8.4
. N
DM
A
form
atio
n
from
se
lect
ed
pre
curs
ors
upon
pre
-ox
idat
ion
wit
h
chlo
rine,
fo
llow
ed
by
chlo
ram
ine
dis
infe
ctio
n f
or
dif
fere
nt
pre
-ox
idat
ion
conta
ct t
imes
. [P
recu
rsor]
0 =
160 n
M,
[Cl 2
] 0 =
3 m
g/L
, p
HP
re-o
xid
atio
n =
7.5
(2 m
M
phosp
hat
e buff
er),
pH
FP =
7.5
(10
mM
ph
osp
hat
e bu
ffer
). T
ime
= 0
min
sho
ws
no
pre
-ox
idat
ion.
Err
or
bar
s re
pre
sent
dat
a
ran
ge
for
dupli
cate
sam
ple
s.
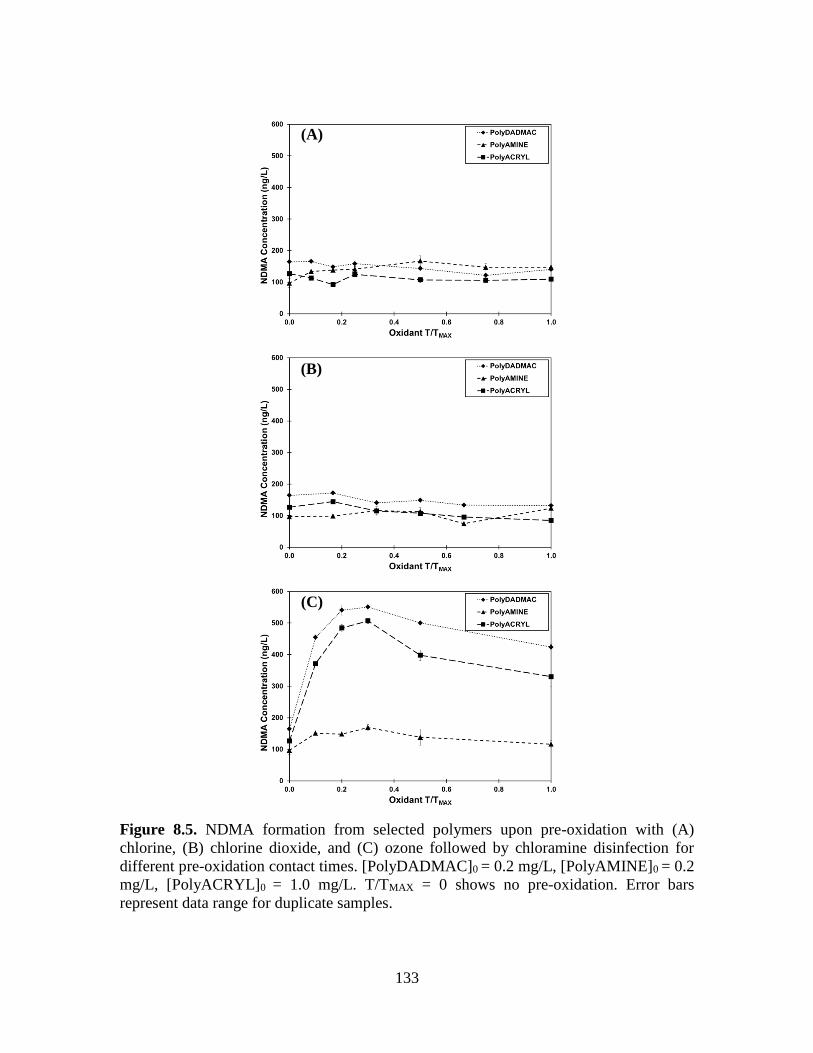
133
Figure 8.5. NDMA formation from selected polymers upon pre-oxidation with (A)
chlorine, (B) chlorine dioxide, and (C) ozone followed by chloramine disinfection for
different pre-oxidation contact times. [PolyDADMAC]0 = 0.2 mg/L, [PolyAMINE]0 = 0.2
mg/L, [PolyACRYL]0 = 1.0 mg/L. T/TMAX = 0 shows no pre-oxidation. Error bars
represent data range for duplicate samples.
(A)
(C)
(B)
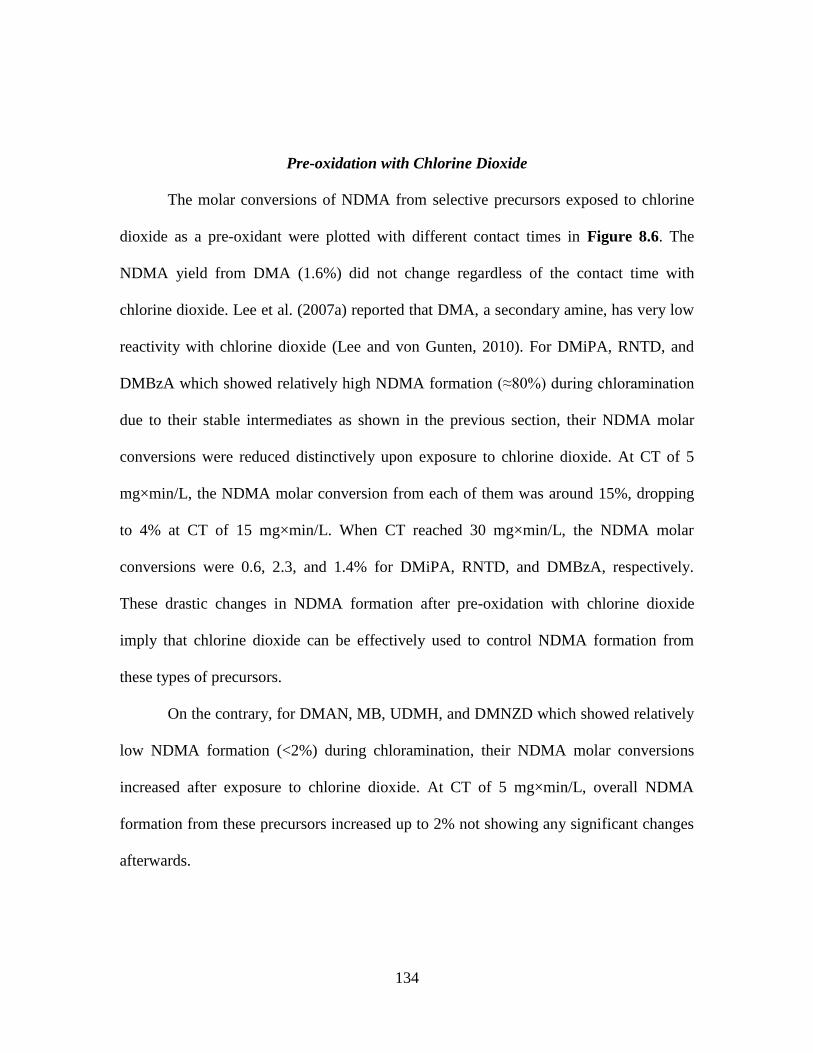
134
Pre-oxidation with Chlorine Dioxide
The molar conversions of NDMA from selective precursors exposed to chlorine
dioxide as a pre-oxidant were plotted with different contact times in Figure 8.6. The
NDMA yield from DMA (1.6%) did not change regardless of the contact time with
chlorine dioxide. Lee et al. (2007a) reported that DMA, a secondary amine, has very low
reactivity with chlorine dioxide (Lee and von Gunten, 2010). For DMiPA, RNTD, and
DMBzA which showed relatively high NDMA formation (≈80%) during chloramination
due to their stable intermediates as shown in the previous section, their NDMA molar
conversions were reduced distinctively upon exposure to chlorine dioxide. At CT of 5
mg×min/L, the NDMA molar conversion from each of them was around 15%, dropping
to 4% at CT of 15 mg×min/L. When CT reached 30 mg×min/L, the NDMA molar
conversions were 0.6, 2.3, and 1.4% for DMiPA, RNTD, and DMBzA, respectively.
These drastic changes in NDMA formation after pre-oxidation with chlorine dioxide
imply that chlorine dioxide can be effectively used to control NDMA formation from
these types of precursors.
On the contrary, for DMAN, MB, UDMH, and DMNZD which showed relatively
low NDMA formation (<2%) during chloramination, their NDMA molar conversions
increased after exposure to chlorine dioxide. At CT of 5 mg×min/L, overall NDMA
formation from these precursors increased up to 2% not showing any significant changes
afterwards.
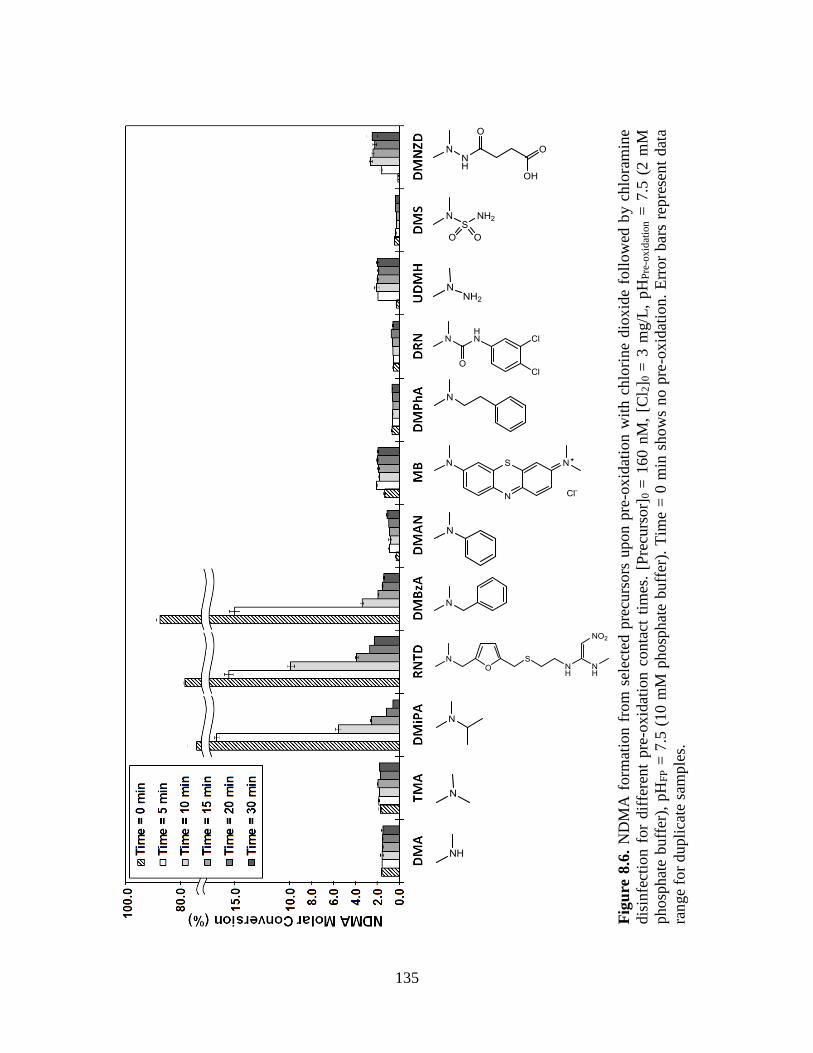
135
Fig
ure
8.6
. N
DM
A f
orm
atio
n f
rom
sel
ecte
d p
recu
rsors
upon p
re-o
xid
atio
n w
ith
chlo
rine
dio
xid
e fo
llow
ed b
y c
hlo
ram
ine
dis
infe
ctio
n f
or
dif
fere
nt
pre
-ox
idat
ion
conta
ct t
imes
. [P
recu
rsor]
0 =
160 n
M,
[Cl 2
] 0 =
3 m
g/L
, p
HP
re-o
xid
atio
n =
7.5
(2 m
M
ph
osp
hat
e buff
er),
pH
FP =
7.5
(10
mM
phosp
hat
e buff
er).
Tim
e =
0 m
in s
how
s no p
re-o
xid
atio
n.
Err
or
bar
s re
pre
sen
t d
ata
ran
ge
for
dupli
cate
sam
ple
s.
136
However, TMA, DMPhA, DRN, and DMS did not show any noticeable change in
NDMA conversions after pre-oxidation with chlorine dioxide. Likewise, all of the
selected polymers (i.e., PolyDADMAC, PolyAMINE, and PolyACRYL) remained
relatively constant in their NDMA formation after pre-oxidation with chlorine dioxide
(Figure 8.5-B). As an electron acceptor, chlorine dioxide reacts mainly through an
electron transfer reaction. Thus, it is likely that reactions with chlorine dioxide would be
less favorable due to electron deficient nitrogen atom of quaternary amine polymers.
Unlike pre-chlorination, pre-oxidation effects of chlorine dioxide on overall
NDMA formation depended highly on precursors. The NDMA formation from high
NDMA yielding compounds such as DMiPA, RNTD, and DMBzA drastically decreased
upon contact with chlorine dioxide. On the other hand, low NDMA yielding compounds
such as DMAN, MB, UDMH, and DMNZD showed increases in NDMA formation after
pre-oxidation with chlorine dioxide. Interestingly, although these two trends seem
contradictory, the NDMA conversion yields from the selective precursors which were
oxidized with chlorine dioxide reached 1.5-2.0% at CT of 30 mg×min/L. Such conversion
rates are very close to that of DMA which was constant for various contact times with
chlorine dioxide. This pattern has not been previously reported in the literature for model
compounds upon exposure to chlorine dioxide.
137
Lee et al. (2007a) reported that oxidation of tertiary amines with chlorine dioxide
could release DMA or products with DMA moiety, but chlorine dioxide would not react
further with such oxidation products with DMA moieties. According to their findings,
oxidized amines with DMA moiety released by pre-oxidation with chlorine dioxide may
further react with chloramine to produce NDMA. Therefore, both high and low NDMA
yielding precursors could be decomposed to either DMA or oxidation products with
DMA moiety by chlorine dioxide, and their final NDMA conversion rates become similar
to that of DMA. Shah et al. (2012) have reported that the NDMA formation after pre-
oxidation with chlorine dioxide decreased or increased and the results depended on
different types of precursors present in different water sources. However, based on the
findings from our study, it is more likely that different deactivation efficiencies of
precursors may be attributed to one single major product, namely DMA, during pre-
oxidation with chlorine dioxide. Consequently, the application of chlorine dioxide as a
pre-oxidant to control NDMA formation could be effective in source waters containing
high NDMA yielding precursors (i.e., >5%). The application would be redundant for
source waters containing DMA or lower NDMA yielding precursors than DMA (i.e.,
<1%) as major precursors.
138
Pre-oxidation with Ozone
The molar conversions of NDMA from selective precursors exposed to ozone as a
pre-oxidant were plotted with different contact times in Figure 8.7. When DMA was pre-
oxidized with ozone, overall NDMA formation from DMA increased. This is consistent
with the findings reported by Andrzejewski et al. (2008) and Yang et al. (2009). In the
latter study, it was revealed that ozonation by itself can form NDMA from DMA through
a nitrosation pathway at pH 3.4. They also noted that NDMA formation also occurred at
pH 7.0 or greater via an unknown pathway (Yang et al., 2009). In our study, however, the
highest NDMA formation (molar conversion of 2.3%) from DMA occurred within 1-2
min of contact time with ozone, while further contact led to overall decreases (molar
conversion of 1.8%).
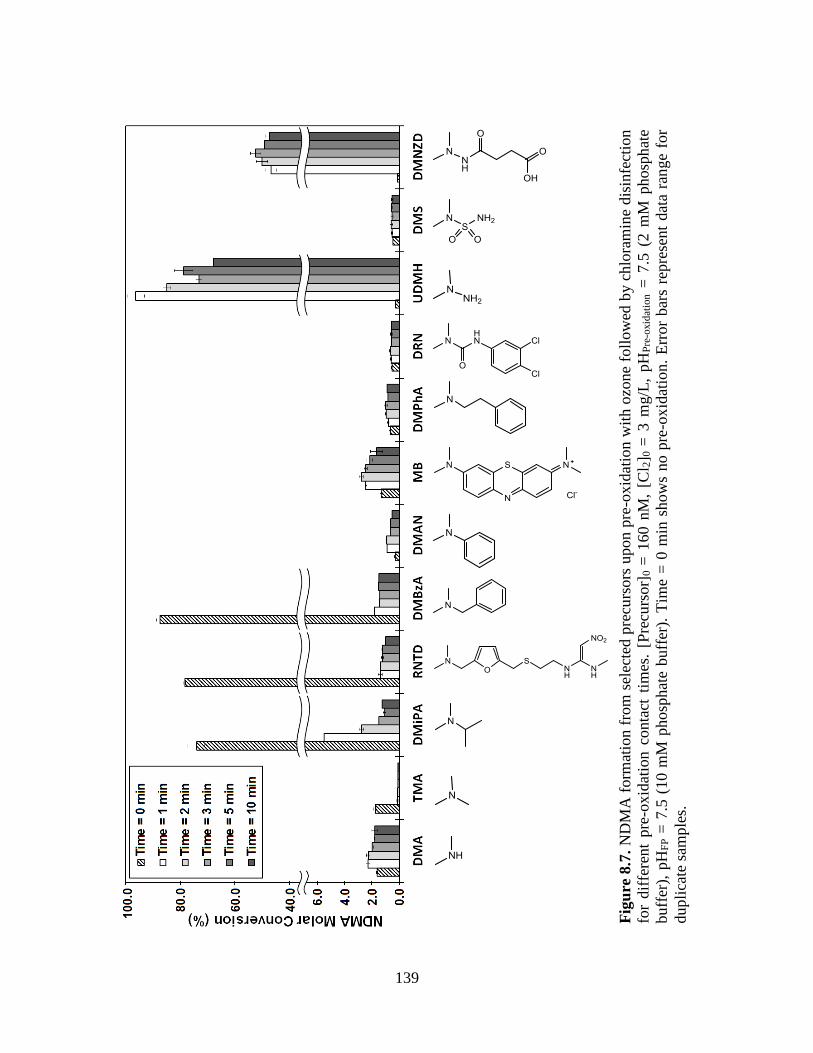
139
Fig
ure
8.7
. N
DM
A f
orm
atio
n f
rom
sel
ecte
d p
recu
rsors
upon p
re-o
xid
atio
n w
ith o
zone
foll
ow
ed b
y c
hlo
ram
ine
dis
infe
ctio
n
for
dif
fere
nt
pre
-ox
idat
ion
conta
ct t
imes
. [P
recu
rsor]
0 =
160 n
M,
[Cl 2
] 0 =
3 m
g/L
, p
HP
re-o
xid
atio
n =
7.5
(2 m
M p
hosp
hat
e
buff
er),
pH
FP =
7.5
(10 m
M p
hosp
hat
e buff
er).
Tim
e =
0 m
in s
how
s no p
re-o
xid
atio
n.
Err
or
bar
s re
pre
sent
dat
a ra
nge
for
dupli
cate
sam
ple
s.
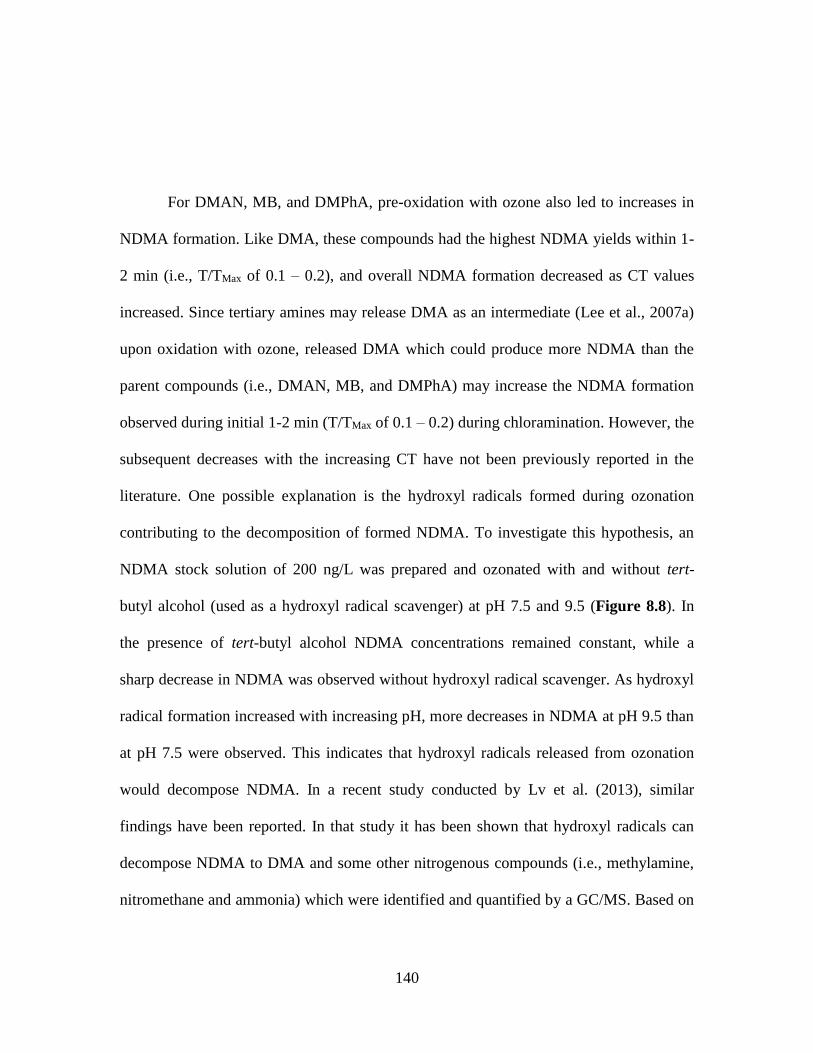
140
For DMAN, MB, and DMPhA, pre-oxidation with ozone also led to increases in
NDMA formation. Like DMA, these compounds had the highest NDMA yields within 1-
2 min (i.e., T/TMax of 0.1 – 0.2), and overall NDMA formation decreased as CT values
increased. Since tertiary amines may release DMA as an intermediate (Lee et al., 2007a)
upon oxidation with ozone, released DMA which could produce more NDMA than the
parent compounds (i.e., DMAN, MB, and DMPhA) may increase the NDMA formation
observed during initial 1-2 min (T/TMax of 0.1 – 0.2) during chloramination. However, the
subsequent decreases with the increasing CT have not been previously reported in the
literature. One possible explanation is the hydroxyl radicals formed during ozonation
contributing to the decomposition of formed NDMA. To investigate this hypothesis, an
NDMA stock solution of 200 ng/L was prepared and ozonated with and without tert-
butyl alcohol (used as a hydroxyl radical scavenger) at pH 7.5 and 9.5 (Figure 8.8). In
the presence of tert-butyl alcohol NDMA concentrations remained constant, while a
sharp decrease in NDMA was observed without hydroxyl radical scavenger. As hydroxyl
radical formation increased with increasing pH, more decreases in NDMA at pH 9.5 than
at pH 7.5 were observed. This indicates that hydroxyl radicals released from ozonation
would decompose NDMA. In a recent study conducted by Lv et al. (2013), similar
findings have been reported. In that study it has been shown that hydroxyl radicals can
decompose NDMA to DMA and some other nitrogenous compounds (i.e., methylamine,
nitromethane and ammonia) which were identified and quantified by a GC/MS. Based on
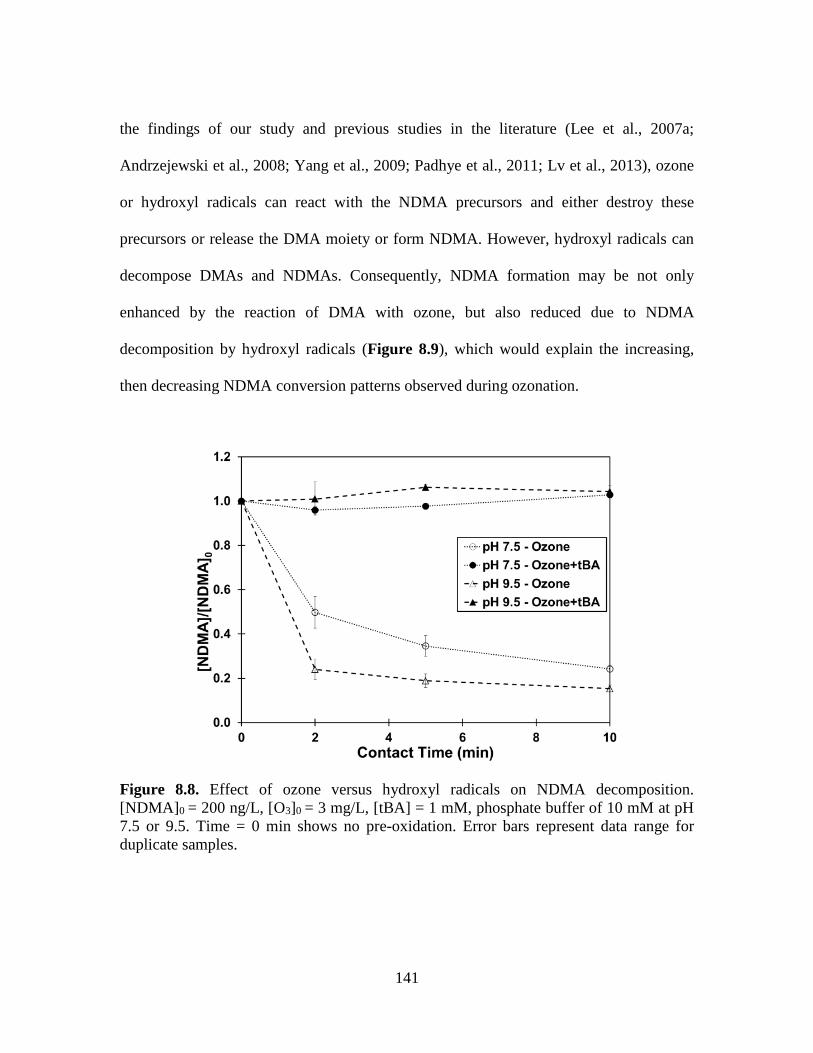
141
the findings of our study and previous studies in the literature (Lee et al., 2007a;
Andrzejewski et al., 2008; Yang et al., 2009; Padhye et al., 2011; Lv et al., 2013), ozone
or hydroxyl radicals can react with the NDMA precursors and either destroy these
precursors or release the DMA moiety or form NDMA. However, hydroxyl radicals can
decompose DMAs and NDMAs. Consequently, NDMA formation may be not only
enhanced by the reaction of DMA with ozone, but also reduced due to NDMA
decomposition by hydroxyl radicals (Figure 8.9), which would explain the increasing,
then decreasing NDMA conversion patterns observed during ozonation.
Figure 8.8. Effect of ozone versus hydroxyl radicals on NDMA decomposition.
[NDMA]0 = 200 ng/L, [O3]0 = 3 mg/L, [tBA] = 1 mM, phosphate buffer of 10 mM at pH
7.5 or 9.5. Time = 0 min shows no pre-oxidation. Error bars represent data range for
duplicate samples.
142
Figure 8.9. Reaction of tertiary amines with ozone and hydroxyl radicals.
For TMA, pre-oxidation with ozone was able to reduce NDMA formation
significantly (from 1.8% to 0.2% for 1 min contact time), which is in good agreement
with the findings of Lee et al. (2007a). Ozonation was also effective to control NDMA
formation from high NDMA yielding compounds such as DMiPA, RNTD, and DMBzA.
Only 3 minutes of contact with ozone (i.e., CT ≈7.2 mg×min/L) reduced NDMA
formation from these compounds to approximately 2%.
For selected polymers, pre-ozonation led to increases in NDMA formations
(Figure 8.5-C). For 3 minutes of exposure to ozone, NDMA formation from
PolyDADMAC and PolyACRYL increased from 164 and 127 ng/L to 551 ng/L and 507
ng/L, respectively. These changes were less drastic for PolyAMINE; NDMA formation
increased from 97 to 169 ng/L after pre-oxidation with ozone. Under chloramination
without any pre-oxidation, the NDMA formation from these polymers was very low
(≈0.2%), due to hindrance of the nucleophilic substitution by positive charge on the
143
nitrogen atom (Krasner et al., 2013). It has been known that DMA could be released from
PolyDADMAC by ozonation (Padhye et al., 2011a) with an approximate yield of 1.5-
2.0%. Therefore, sequential chloramination may enhance NDMA formation from
PolyDADMAC. Without chloramination, NDMA can also be formed from
PolyDADMAC (Padhye et al., 2011a) through the simultaneous formation and reaction
of released hydroxylamine and DMA. The NDMA formation from the other two
polymers could be explained in the same way, since similar trends in data were observed
for PolyAMINE and PolyACRYL. Hydroxyl radicals formed by the decomposition of
ozone may be the reason for decreases in NDMA levels after 3 minutes of contact time
for these polymers.
Compared to other precursors, amides and hydrazines (i.e., DMNZD and UDMH)
yielded significant amounts of NDMA when pre-oxidized with ozone. At approximately
3 mg×min/L of CT, NDMA yields jumped from 0.3 to 96.4% and 0.1 to 46.9% for
UDMH and DMNZD, respectively. In another set of experiments where ozone was
applied without subsequent chloramination, comparable NDMA was formed from these
compounds, which is consistent with the study conducted by Schmidt and Brauch (2008).
This suggests that only ozone accounted for the NDMA formation from these
compounds. Like the compounds described above, the NDMA formation from these
precursors also decreased with increasing contact time. Once again this can be attributed
to ozone decomposition and formation of hydroxyl radicals, which can destroy NDMA
after its initial formation.
144
On the other hand, DRN and DMS did not show any change in NDMA formation
in spite of pre-ozonation. DRN remained relatively constant regardless of contact time.
The NDMA formation from DMS under pre-ozonation was different from previous
studies conducted by von Gunten et al. (2010). But the presence of bromide was shown to
be an essential factor to form NDMA from DMS in their study. To verify bromide effect
on NDMA formation from DMS, a pre-ozonation experiment was conducted with 200
µg/L of background bromide, and the subsequent NDMA yield was found to be 56.7%
(±2.3). This result was consistent with the findings of Schmidt and Brauch (2008) and
von Gunten et al. (2010). However, since the effect of ions (i.e., bromide) was not within
the scope of this study, further investigation was not made.
Effect of pH on Pre-oxidation
In water treatment process, the pH of water is subject to change after each stage.
Since reactions between amines and oxidants have been observed to be pH dependent
(von Gunten et al., 2010), the overall NDMA formation from amine precursors could be
largely influenced by oxidation pH, which was not previously studied. Different pH
conditions during pre-oxidation were investigated with selected precursors to cover
typical conditions of different stages for the water treatment process: (i) non-adjusted raw
water pH, (ii) pH after the coagulation/flocculation process (pH ≈6.5), and (iii) pH after
softening with lime/soda ash (pH ≈9.0). The NDMA FP results from the selected
precursors after pre-oxidation at different pH conditions are given in Table 8.2.
For chlorination, NDMA FPs of DMA and TMA showed slight decreases with
increasing pre-oxidation pH. Increasing pH has been known to facilitate reaction kinetics
145
and achieve higher precursor deactivation (Lee and von Gunten, 2010). Pre-chlorination
of DMiPA which is a high NDMA yielding precursor resulted in at least 10% reduction
of NDMA conversion at pH 5.5-9.5. As pre-oxidation pH increased from 5.5 to 8.5,
NDMA FP from DMiPA decreased from 74.7% to 54.4%. However, NDMA formation
increased again to 67% at pH 9.0. The lowest NDMA FP was observed at pH 8.5, which
is close to the mid-point (8.9) of the two reactants’ pKa (7.5 for chlorine and 10.3 for
DMiPA). HOCl reacts with deprotonated amines; the mid-point of pKa of the two
reactants will represent an optimum pH for the oxidation since both species may coexist
at the highest concentrations, and thus enhance the reaction kinetics. Another high
NDMA yielding precursor, RNTD was deactivated more by chlorine at lower pre-
oxidation pH. Unlike DMiPA, RNTD has two pKa values: 8.2 for the DMA moiety and
2.7 for the diaminonitroethene group. At low pH, chlorine would attack the
diaminonitroethene group rather than the DMA moiety of RNTD, which would lessen the
stability of the leaving group, which would make NDMA formation unfavorable
(previous chapter). In the case of DMNZD, increasing pre-chlorination pH slightly
increased NDMA formation. Lastly, NDMA FP of PolyDADMAC remained relatively
constant at varying pH values due to hindrance caused by the positive charge on the
nitrogen atom (Krasner et al., 2013).
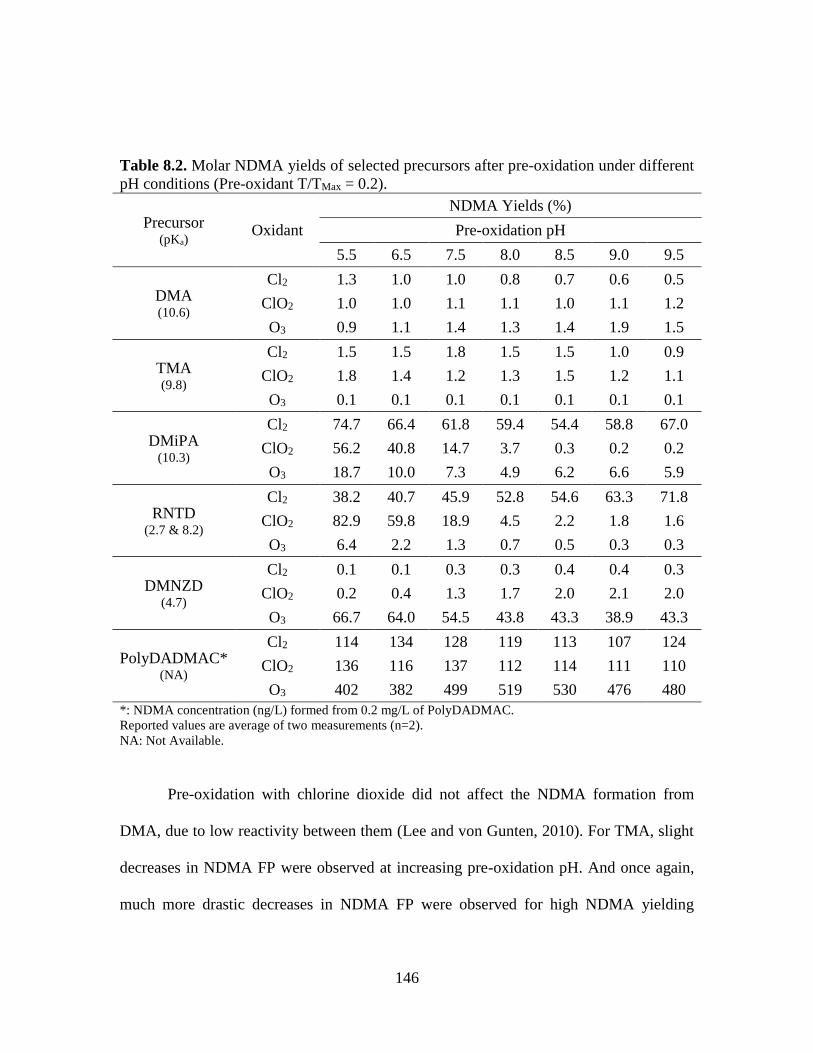
146
Table 8.2. Molar NDMA yields of selected precursors after pre-oxidation under different
pH conditions (Pre-oxidant T/TMax = 0.2).
Precursor (pKa)
Oxidant
NDMA Yields (%)
Pre-oxidation pH
5.5 6.5 7.5 8.0 8.5 9.0 9.5
DMA (10.6)
Cl2 1.3 1.0 1.0 0.8 0.7 0.6 0.5
ClO2 1.0 1.0 1.1 1.1 1.0 1.1 1.2
O3 0.9 1.1 1.4 1.3 1.4 1.9 1.5
TMA (9.8)
Cl2 1.5 1.5 1.8 1.5 1.5 1.0 0.9
ClO2 1.8 1.4 1.2 1.3 1.5 1.2 1.1
O3 0.1 0.1 0.1 0.1 0.1 0.1 0.1
DMiPA (10.3)
Cl2 74.7 66.4 61.8 59.4 54.4 58.8 67.0
ClO2 56.2 40.8 14.7 3.7 0.3 0.2 0.2
O3 18.7 10.0 7.3 4.9 6.2 6.6 5.9
RNTD (2.7 & 8.2)
Cl2 38.2 40.7 45.9 52.8 54.6 63.3 71.8
ClO2 82.9 59.8 18.9 4.5 2.2 1.8 1.6
O3 6.4 2.2 1.3 0.7 0.5 0.3 0.3
DMNZD (4.7)
Cl2 0.1 0.1 0.3 0.3 0.4 0.4 0.3
ClO2 0.2 0.4 1.3 1.7 2.0 2.1 2.0
O3 66.7 64.0 54.5 43.8 43.3 38.9 43.3
PolyDADMAC* (NA)
Cl2 114 134 128 119 113 107 124
ClO2 136 116 137 112 114 111 110
O3 402 382 499 519 530 476 480
*: NDMA concentration (ng/L) formed from 0.2 mg/L of PolyDADMAC.
Reported values are average of two measurements (n=2).
NA: Not Available.
Pre-oxidation with chlorine dioxide did not affect the NDMA formation from
DMA, due to low reactivity between them (Lee and von Gunten, 2010). For TMA, slight
decreases in NDMA FP were observed at increasing pre-oxidation pH. And once again,
much more drastic decreases in NDMA FP were observed for high NDMA yielding
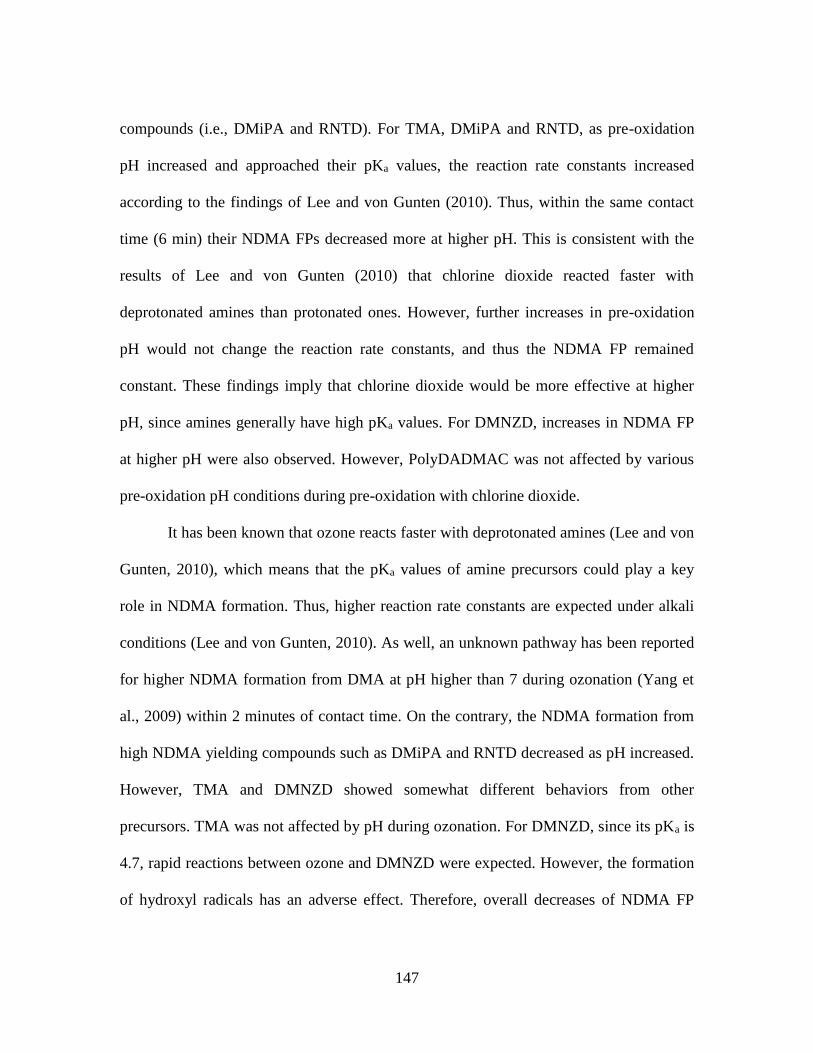
147
compounds (i.e., DMiPA and RNTD). For TMA, DMiPA and RNTD, as pre-oxidation
pH increased and approached their pKa values, the reaction rate constants increased
according to the findings of Lee and von Gunten (2010). Thus, within the same contact
time (6 min) their NDMA FPs decreased more at higher pH. This is consistent with the
results of Lee and von Gunten (2010) that chlorine dioxide reacted faster with
deprotonated amines than protonated ones. However, further increases in pre-oxidation
pH would not change the reaction rate constants, and thus the NDMA FP remained
constant. These findings imply that chlorine dioxide would be more effective at higher
pH, since amines generally have high pKa values. For DMNZD, increases in NDMA FP
at higher pH were also observed. However, PolyDADMAC was not affected by various
pre-oxidation pH conditions during pre-oxidation with chlorine dioxide.
It has been known that ozone reacts faster with deprotonated amines (Lee and von
Gunten, 2010), which means that the pKa values of amine precursors could play a key
role in NDMA formation. Thus, higher reaction rate constants are expected under alkali
conditions (Lee and von Gunten, 2010). As well, an unknown pathway has been reported
for higher NDMA formation from DMA at pH higher than 7 during ozonation (Yang et
al., 2009) within 2 minutes of contact time. On the contrary, the NDMA formation from
high NDMA yielding compounds such as DMiPA and RNTD decreased as pH increased.
However, TMA and DMNZD showed somewhat different behaviors from other
precursors. TMA was not affected by pH during ozonation. For DMNZD, since its pKa is
4.7, rapid reactions between ozone and DMNZD were expected. However, the formation
of hydroxyl radicals has an adverse effect. Therefore, overall decreases of NDMA FP
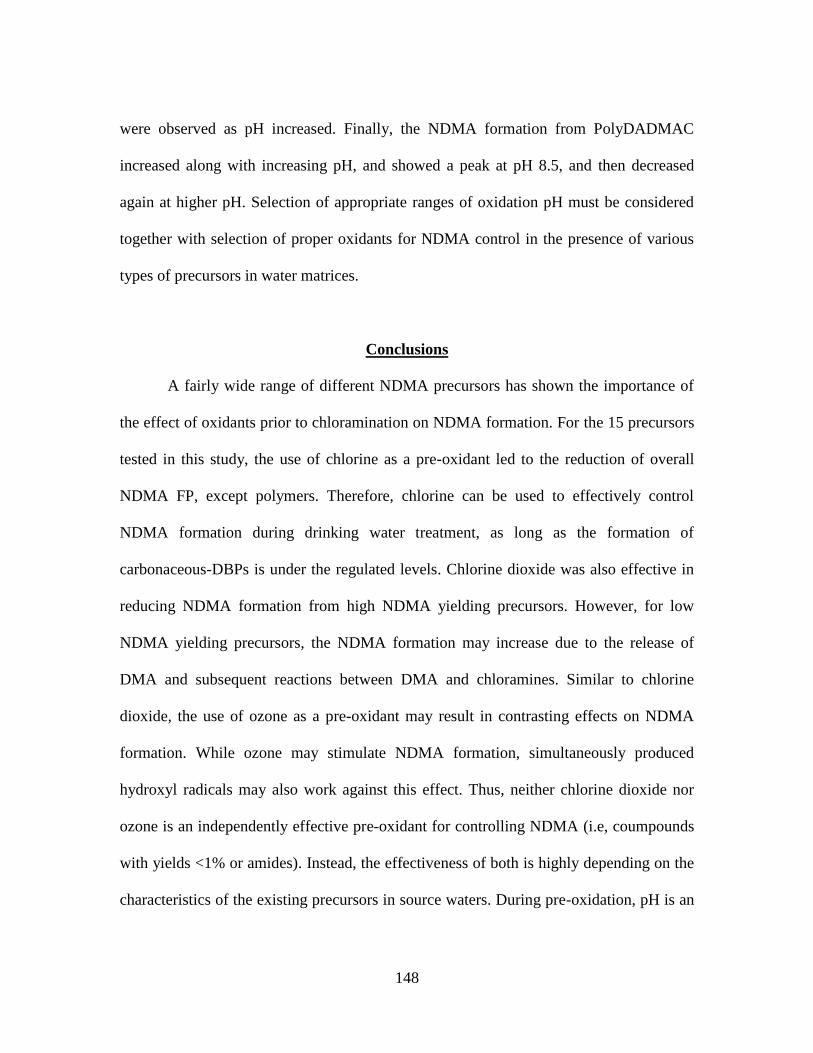
148
were observed as pH increased. Finally, the NDMA formation from PolyDADMAC
increased along with increasing pH, and showed a peak at pH 8.5, and then decreased
again at higher pH. Selection of appropriate ranges of oxidation pH must be considered
together with selection of proper oxidants for NDMA control in the presence of various
types of precursors in water matrices.
Conclusions
A fairly wide range of different NDMA precursors has shown the importance of
the effect of oxidants prior to chloramination on NDMA formation. For the 15 precursors
tested in this study, the use of chlorine as a pre-oxidant led to the reduction of overall
NDMA FP, except polymers. Therefore, chlorine can be used to effectively control
NDMA formation during drinking water treatment, as long as the formation of
carbonaceous-DBPs is under the regulated levels. Chlorine dioxide was also effective in
reducing NDMA formation from high NDMA yielding precursors. However, for low
NDMA yielding precursors, the NDMA formation may increase due to the release of
DMA and subsequent reactions between DMA and chloramines. Similar to chlorine
dioxide, the use of ozone as a pre-oxidant may result in contrasting effects on NDMA
formation. While ozone may stimulate NDMA formation, simultaneously produced
hydroxyl radicals may also work against this effect. Thus, neither chlorine dioxide nor
ozone is an independently effective pre-oxidant for controlling NDMA (i.e, coumpounds
with yields <1% or amides). Instead, the effectiveness of both is highly depending on the
characteristics of the existing precursors in source waters. During pre-oxidation, pH is an
149
important factor in deactivating NDMA precursors. Since deprotonated amines are more
susceptible to the reaction with oxidants, the pKa of both amines and oxidants are key
players. In this way, optimized pH conditions for pre-chlorination must be determined for
the best treatability. However, ozone and chlorine dioxide would reach and sustain their
maximum effectiveness at a pH above the amines’ pKa values.
150
CHAPTER NINE
9. CONCLUSIONS AND RECOMMENDATIONS
Conclusions
The important conclusions for each objective of this study are summarized below.
Objective 1: Examine the formation potential of nitrosamines from selected amino
acids under different oxidation conditions.
Even at 10 mg/L concentration, nitrosamine yields from all nine AAs during
chloramination, ozonation and ozonation-chloramination conditions were very
low (<10 ng/L) or below the minimum reporting levels.
Since nitrosamine formation yields of AAs were very low, AAs would not likely
to be a contributor to nitrosamines formation.
Objective 2: Investigate (i) the effect of tertiary amine structure, (ii) the effect of
background NOM, and (iii) the roles of mono- vs. dichloramine species on the NDMA
formation.
A fairly wide range (0.02% to 83.9%) of NDMA formation from the 21 selected
amines indicates the importance of the structure of tertiary amines on NDMA
formation.
The results showed that both stability and electron distribution of the leaving
group of tertiary amines have an important role in NDMA formation.
151
DMA associated with branched alkyl groups or benzyl like structures which have
only one carbon between the ring and DMA structure consistently gave higher
yields of NDMA formation.
Compounds with EWG reacted preferentially with monochloramine, whereas
compounds with EDG showed a tendency to react with dichloramine to form
NDMA.
When the amines were present along with NOM in solution, NDMA formation
increased for compounds with EWG while it decreased for compounds with EDG.
This impact was attributed to the competition between NOM and amines for
chloramine species.
Objective 3: Examine (i) the role of chloramine species in the formation of NDMA
from DMA and selected tertiary amines; (ii) the factors that influence chloramine
decomposition (i.e., pH, sulfate and NOM) during NDMA formation from these model
precursors; and (iii) the role of chloramine species in selected natural waters.
The results showed that electron distribution of the tertiary amine determines the
reactive chloramine species. Compounds with EWG (i.e., RNTD) reacted
preferentially with monochloramine, whereas compounds with EDG (i.e.,
DMiPA) showed a tendency to react with dichloramine to form NDMA.
NOM would be beneficial in the control of NDMA in distribution systems. The
presence of NOM decreased the NDMA formation from DMiPA (dichloramine
sensitive precursor) due to competition created for dichloramine species.
Furthermore, HPO fraction of NOM could also lead to some decreases in NDMA
152
formation probably due to its covalent binding capability with aromatic amines
(i.e., RNTD).
In NDMA formation, pH plays a key role as it influences both chloramine
speciation and protonation state of the amine. Highest NDMA yield is expected to
be observed at an optimum pH (mid-point of both reactants’ pKa) where both
dichloramine and deprotonated amine species may coexist.
The presence of chloramine decomposing components (sulfate, phosphate,
carbonate, etc.) can increase the fraction of dichloramines and consequently lead
to higher NDMA formation.
Investigating two case studies showed that dichloramine was observed to be the
dominant species responsible for NDMA formation in both systems. The NDMA
formation was found to be limited by the transformation of monochloramine to
dichloramine, and thus relatively slow NDMA formation rates were observed.
Objective 4: Examine (i) the commonly used pre-oxidants (i.e., chlorine, chlorine
dioxide and ozone) in water treatment; (ii) CT values, and (iii) pre-oxidation pH’s
effects on NDMA formation from selected precursors.
A fairly wide range of different NDMA precursors has shown the importance of
the effect of oxidants prior to chloramination on NDMA formation.
Among the tested precursors, the use of chlorine as a pre-oxidant led to a
reduction in overall NDMA FP, with the exception of polymers and tertiary
amines with carbonyl or sulfonyl groups.
153
The use of chlorine dioxide could also be effective in reducing NDMA formation
for source waters that contain precursors with high NDMA yields (>5%).
However, it can be detrimental, increasing NDMA formation if the precursor’s
yield is less than <1.0%, due to the release of the DMA moiety.
Similar to chlorine dioxide, the use of ozone as a pre-oxidant has a potential for
contrasting outcomes. While ozone may stimulate NDMA formation, the
simultaneously produced hydroxyl radicals would work against this effect.
Chlorine can be used as an effective strategy in controlling NDMA formation
during drinking water treatment, as long as C-DBP formation is within the
regulated levels. On the other hand, the effectiveness of chlorine dioxide and
ozone is determined by the characteristics of the existing precursors in source
waters.
During pre-oxidation, pH is an important factor in deactivating NDMA
precursors. Since deprotonated amines are more susceptible to the reaction with
oxidants, the pKa of both amines and oxidants are key players. In this way,
optimized pH conditions for pre-chlorination must be determined for the best
treatability.
Recommendations for Practical Applications
The structure of the NDMA precursor plays a critical role in NDMA formation.
Strategies for controlling the discharge of DMA moieties associated with
branched alkyls or benzyl like groups (i.e., pharmaceutical companies) would lead
154
to decreases in NDMA precursor’s levels. This would decrease the stress created
in downstream DWTPs.
The dichloramine was the important chloramine species responsible for NDMA
formation. The utilities can try to minimize the formation of dichloramine in their
distribution systems (e.g., higher pH conditions) to control NDMA formation.
However, it should be noted that there are some precursor that may form NDMA
with monochloramine. Formation potential tests conducted with and without
background ammonia, as performed in this study, can be used to determine mono
or dichloramine sensitivity of NDMA precursor in a source water.
Pre-oxidation strategies can be an effective tool for utilities to control NDMA
formation. Chlorine has shown reduction in NDMA formation for most of the
precursors (except polymers). This indicates that chlorine could be useful as a
pre-oxidant as long as C-DBP formation is within the regulated levels. On the
other hand, chlorine dioxide and ozone may lead to decreases or increases in
NDMA formation depending on the characteristics of the precursors. Preliminary
testing is suggested for utilities determining the best oxidant type, dose and
contact time for particular applications to control NDMA formation. Furthermore,
the pre-oxidation reactions were found to be highly dependent on the pH. To
maximize the removal of NDMA precursors within the same CT, bench-scale
testing is recommended to determine the optimum pH.

155
Recommendations for Future Research
Different types of amines can be tested for their NDMA formation to develop
correlations between NDMA yields and structural characteristics (i.e., linear free
energy relationship).
Density functional theory models can be developed to assess the reactivity of
NDMA precursors to minimize experimental testing.
Further research is needed to identify the intermediates that can be formed during
the formation of NDMA from different types of precursors (e.g., amines, amides,
hydrazines).
NOM was observed to have an important effect on NDMA formation. The
interactions of NOM with amines and also chloramines species can be
investigated to gain further insight.
Presence of ions (i.e., nitrite, bromide) is necessary to be investigated to evaluate
the impacts on both NDMA formation and their interactions with pre-oxidants.

156
APPENDICES
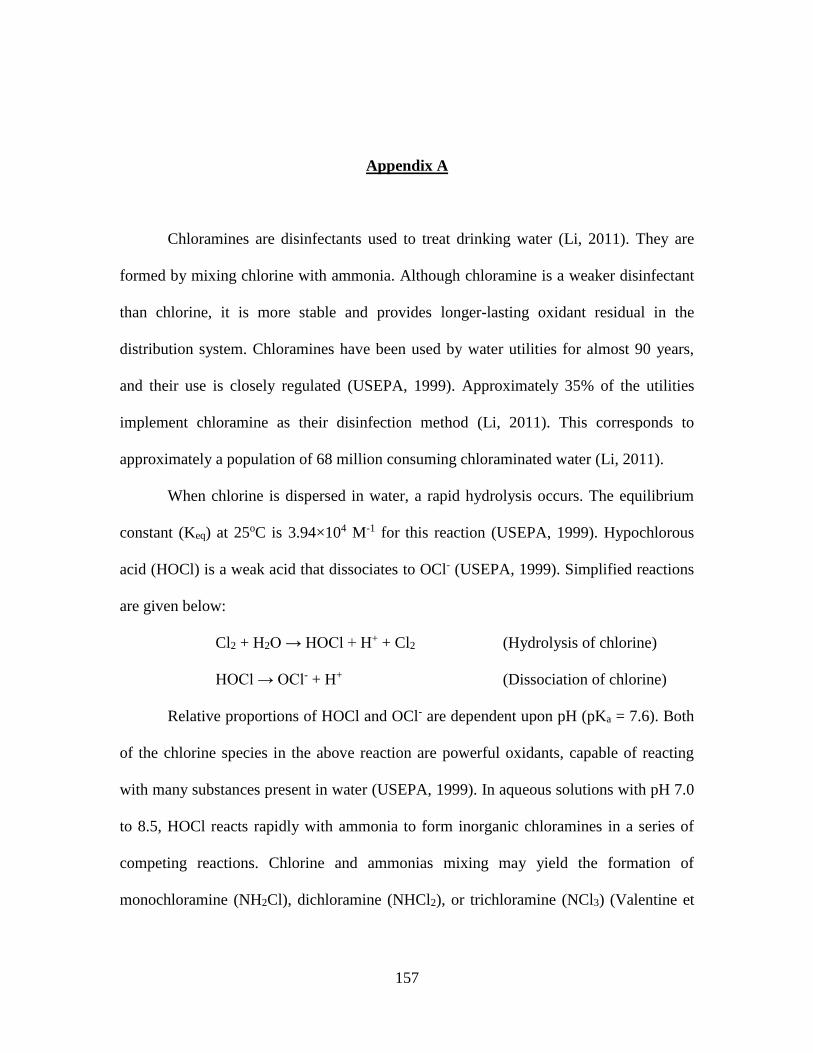
157
Appendix A
Chloramines are disinfectants used to treat drinking water (Li, 2011). They are
formed by mixing chlorine with ammonia. Although chloramine is a weaker disinfectant
than chlorine, it is more stable and provides longer-lasting oxidant residual in the
distribution system. Chloramines have been used by water utilities for almost 90 years,
and their use is closely regulated (USEPA, 1999). Approximately 35% of the utilities
implement chloramine as their disinfection method (Li, 2011). This corresponds to
approximately a population of 68 million consuming chloraminated water (Li, 2011).
When chlorine is dispersed in water, a rapid hydrolysis occurs. The equilibrium
constant (Keq) at 25oC is 3.94×10⁴ M-1 for this reaction (USEPA, 1999). Hypochlorous
acid (HOCl) is a weak acid that dissociates to OCl- (USEPA, 1999). Simplified reactions
are given below:
Cl2 + H2O → HOCl + H+ + Cl2 (Hydrolysis of chlorine)
HOCl → OCl- + H+ (Dissociation of chlorine)
Relative proportions of HOCl and OCl- are dependent upon pH (pKa = 7.6). Both
of the chlorine species in the above reaction are powerful oxidants, capable of reacting
with many substances present in water (USEPA, 1999). In aqueous solutions with pH 7.0
to 8.5, HOCl reacts rapidly with ammonia to form inorganic chloramines in a series of
competing reactions. Chlorine and ammonias mixing may yield the formation of
monochloramine (NH2Cl), dichloramine (NHCl2), or trichloramine (NCl3) (Valentine et
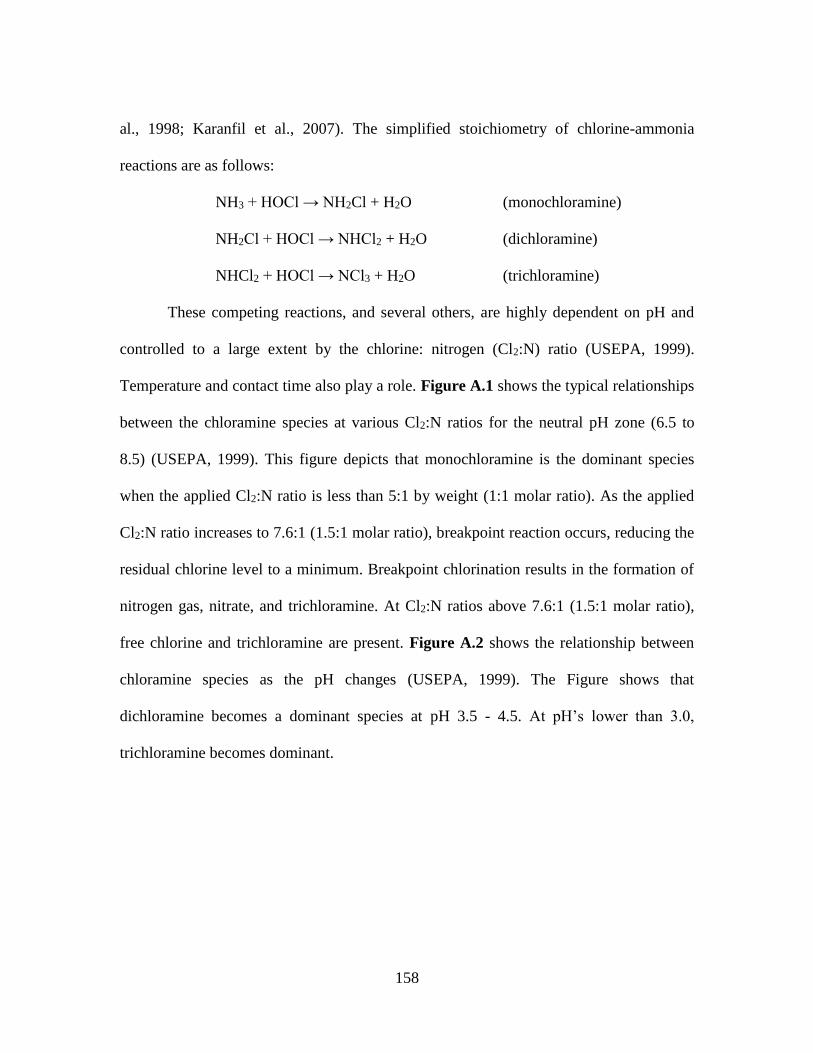
158
al., 1998; Karanfil et al., 2007). The simplified stoichiometry of chlorine-ammonia
reactions are as follows:
NH3 + HOCl → NH2Cl + H2O (monochloramine)
NH2Cl + HOCl → NHCl2 + H2O (dichloramine)
NHCl2 + HOCl → NCl3 + H2O (trichloramine)
These competing reactions, and several others, are highly dependent on pH and
controlled to a large extent by the chlorine: nitrogen (Cl2:N) ratio (USEPA, 1999).
Temperature and contact time also play a role. Figure A.1 shows the typical relationships
between the chloramine species at various Cl2:N ratios for the neutral pH zone (6.5 to
8.5) (USEPA, 1999). This figure depicts that monochloramine is the dominant species
when the applied Cl2:N ratio is less than 5:1 by weight (1:1 molar ratio). As the applied
Cl2:N ratio increases to 7.6:1 (1.5:1 molar ratio), breakpoint reaction occurs, reducing the
residual chlorine level to a minimum. Breakpoint chlorination results in the formation of
nitrogen gas, nitrate, and trichloramine. At Cl2:N ratios above 7.6:1 (1.5:1 molar ratio),
free chlorine and trichloramine are present. Figure A.2 shows the relationship between
chloramine species as the pH changes (USEPA, 1999). The Figure shows that
dichloramine becomes a dominant species at pH 3.5 - 4.5. At pH’s lower than 3.0,
trichloramine becomes dominant.
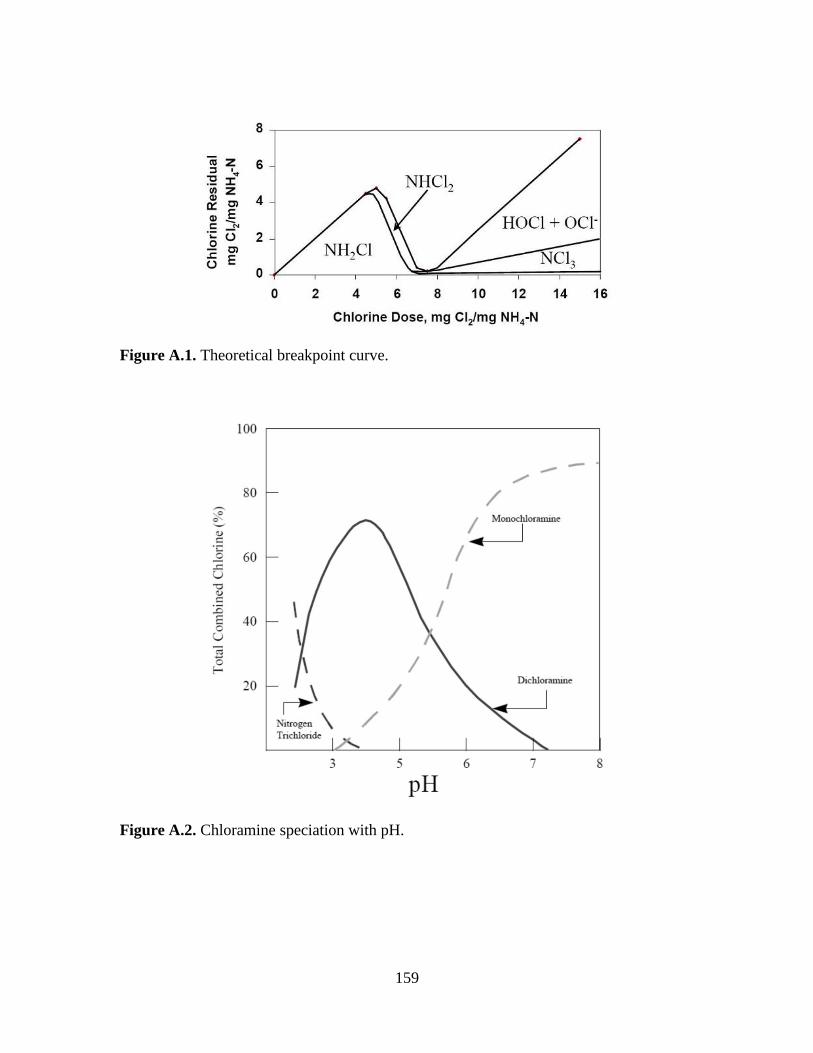
159
Figure A.1. Theoretical breakpoint curve.
Figure A.2. Chloramine speciation with pH.
160
To avoid breakpoint reactions, utilities need to maintain a Cl2:N ratio between 3
and 5 by weight. Therefore, a Cl2:N ratio of 4 is typically accepted as optimal for
chloramination.
While chloramines are considered as less-reactive, they are inherently unstable
due to auto-decomposition (Vikesland et al., 2001). At a constant Cl2:N ratio, there are
several factors that can contribute to auto-decomposition of chloramines which includes
NOM, carbonate, sulfate, phosphate, nitrite, bromide, and acetic acid (Vikesland et al.,
2001; Karanfil et al., 2007). Furthermore, all of these reactions are dependent on pH
(Valentine et al., 1998).
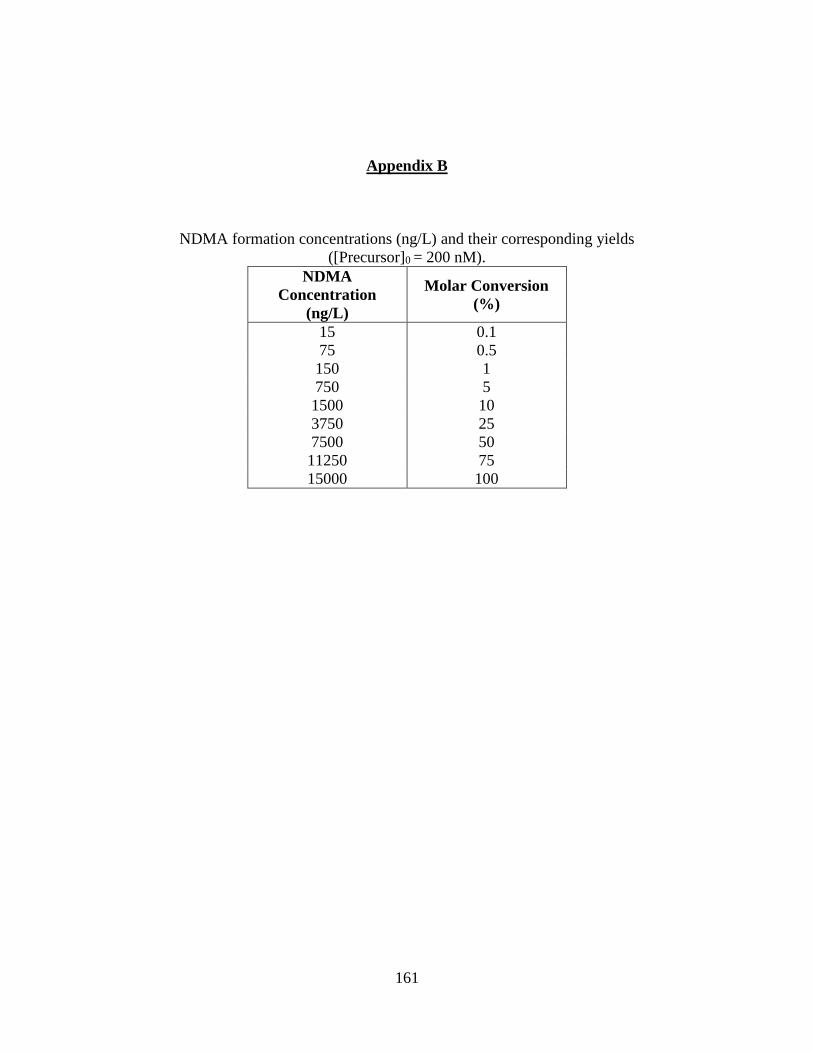
161
Appendix B
NDMA formation concentrations (ng/L) and their corresponding yields
([Precursor]0 = 200 nM).
NDMA
Concentration
(ng/L)
Molar Conversion
(%)
15 0.1
75 0.5
150 1
750 5
1500 10
3750 25
7500 50
11250 75
15000 100
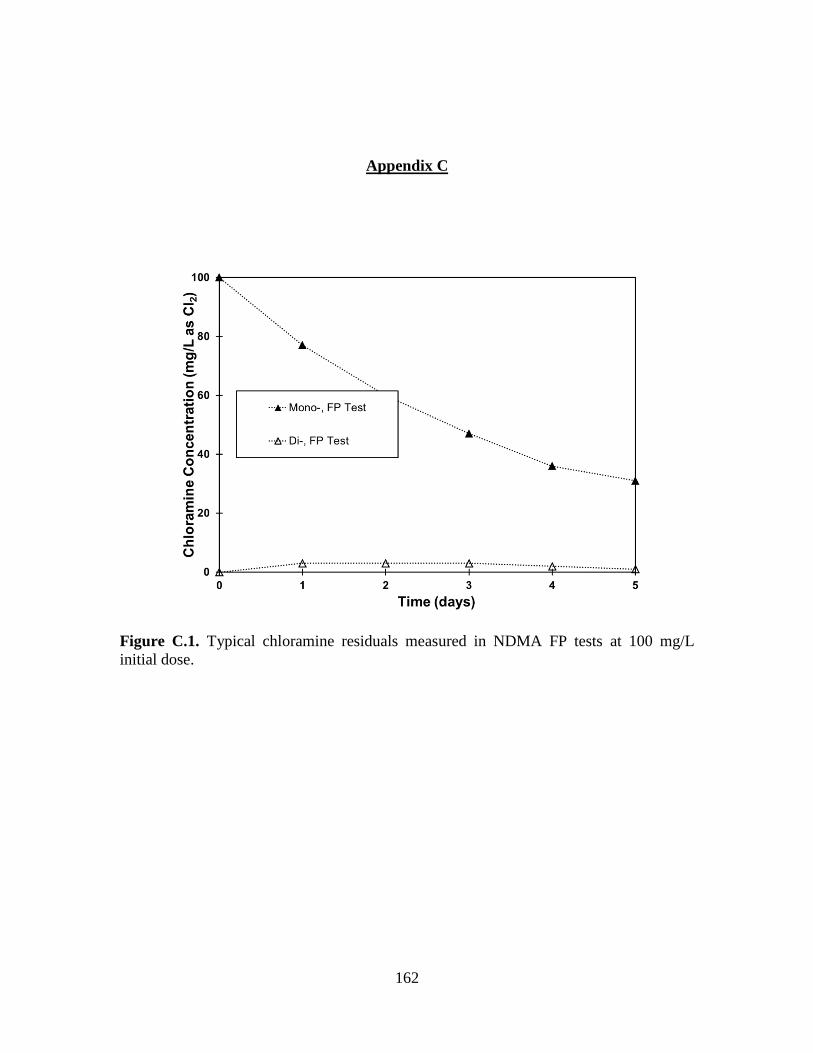
162
Appendix C
Figure C.1. Typical chloramine residuals measured in NDMA FP tests at 100 mg/L
initial dose.
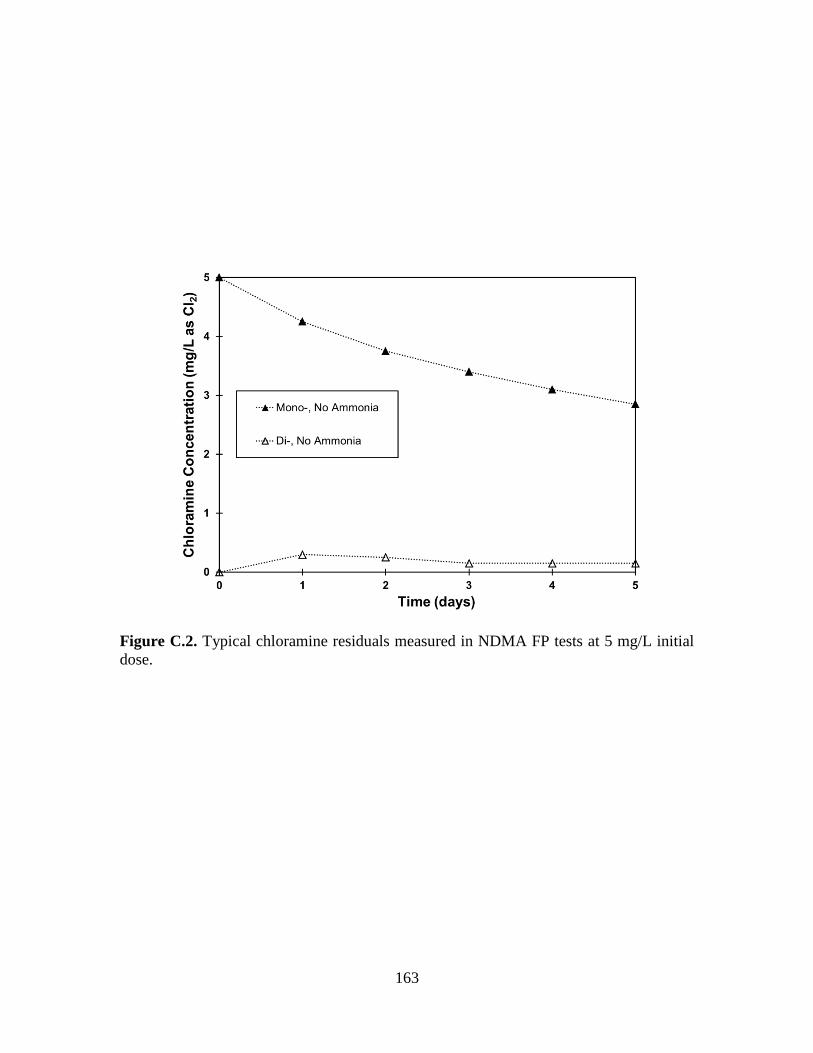
163
Figure C.2. Typical chloramine residuals measured in NDMA FP tests at 5 mg/L initial
dose.
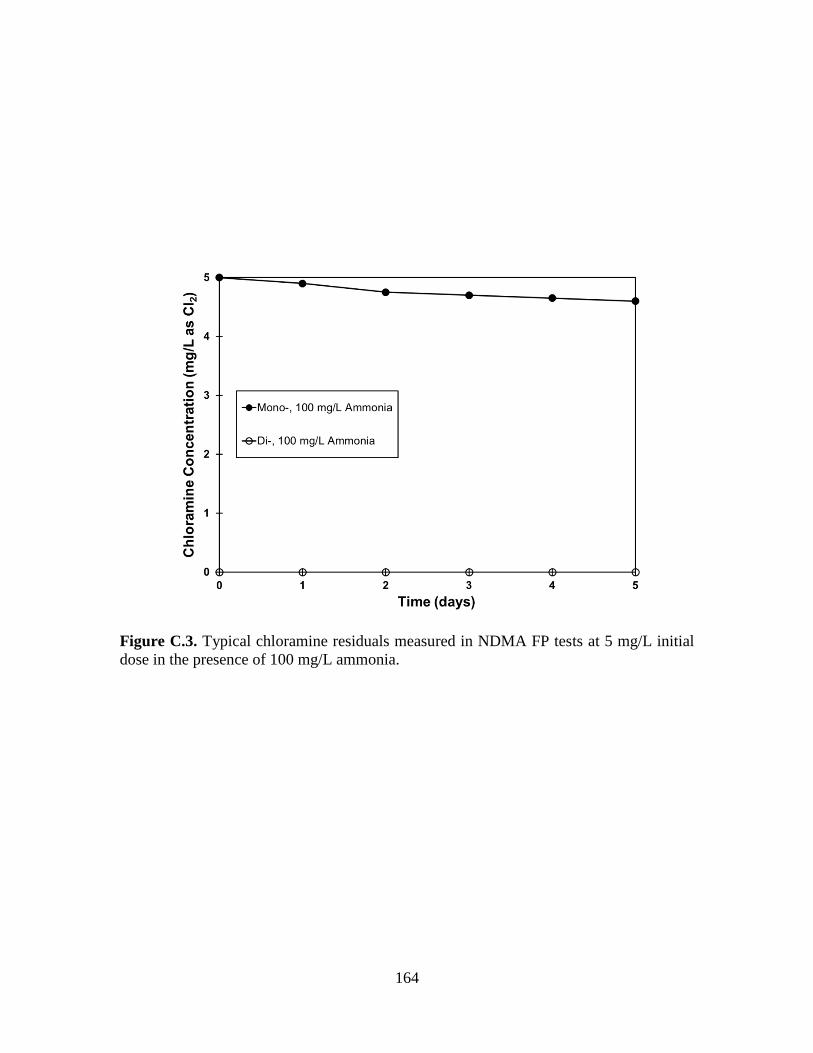
164
Figure C.3. Typical chloramine residuals measured in NDMA FP tests at 5 mg/L initial
dose in the presence of 100 mg/L ammonia.
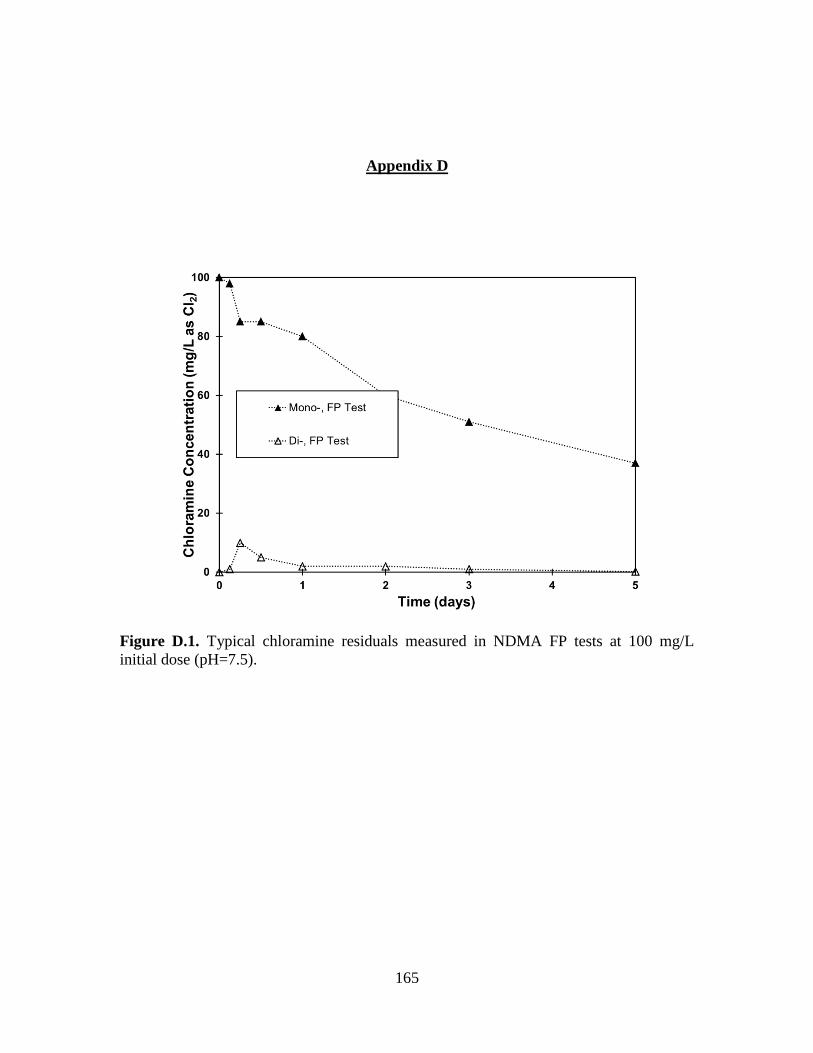
165
Appendix D
Figure D.1. Typical chloramine residuals measured in NDMA FP tests at 100 mg/L
initial dose (pH=7.5).
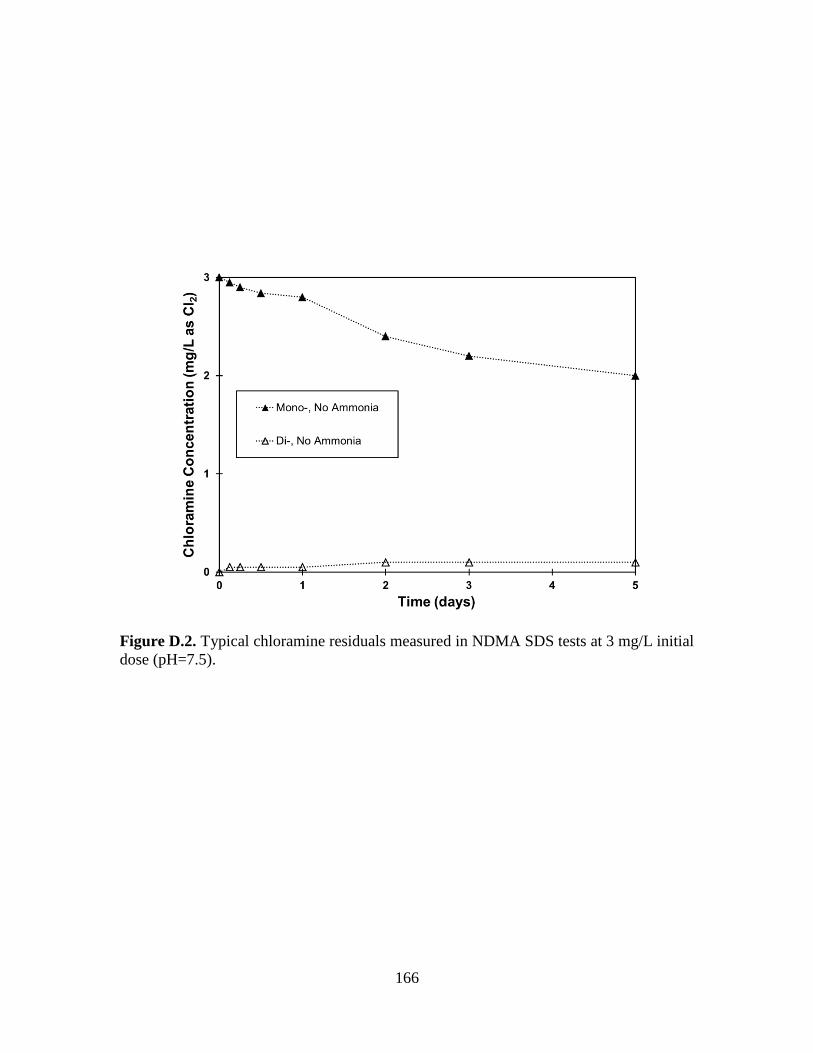
166
Figure D.2. Typical chloramine residuals measured in NDMA SDS tests at 3 mg/L initial
dose (pH=7.5).
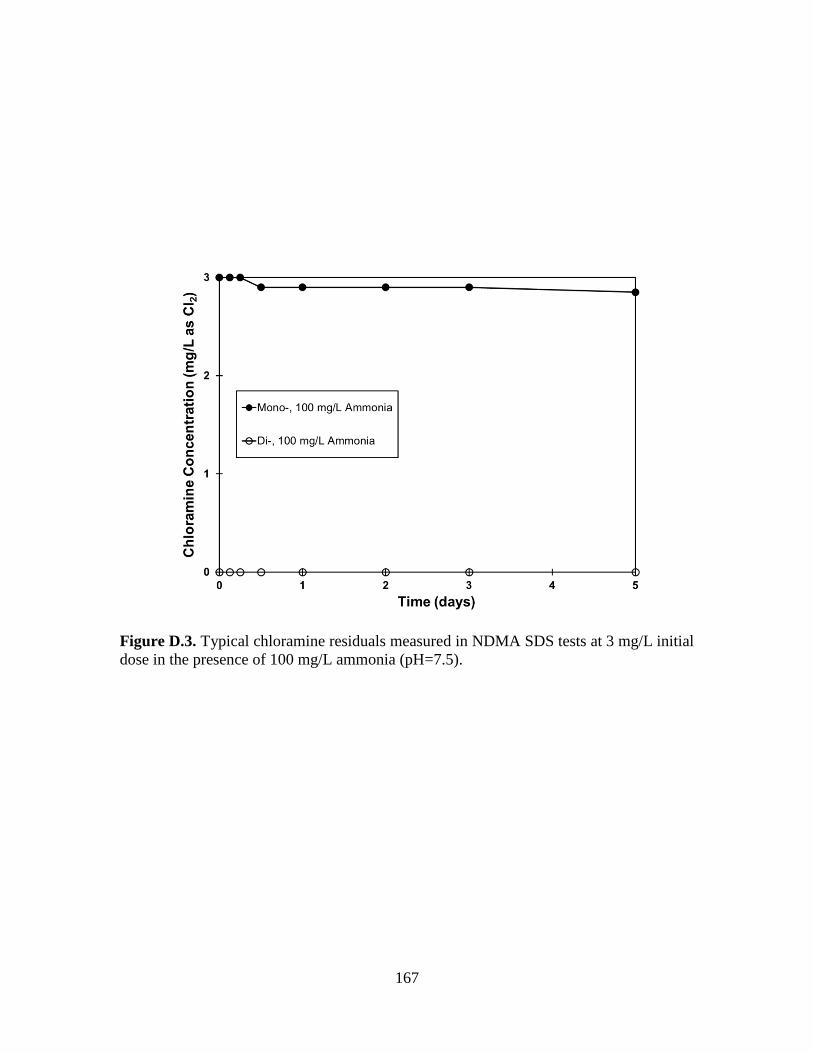
167
Figure D.3. Typical chloramine residuals measured in NDMA SDS tests at 3 mg/L initial
dose in the presence of 100 mg/L ammonia (pH=7.5).
168
Appendix E
Covalent binding of aromatic amines with the constituents of the NOM are
thought to be an important process in aquatic systems (Chen, 2007). Nucleophilic
addition of the amine to the carbonyl moieties and/or quinoid groups is proposed to be
responsible for the covalent binding (Chen, 2007). Quinones - which occur naturally in
many systems and constitute a significant portion of humic acids - have been frequently
used to mimic the carbonyl functional groups that may be present in humic acids (Chen,
2007).
Among the family of aromatic amines, aniline is the simplest compound and thus,
it has drawn significant research interest. Parris (1980) investigated the reactions of
several ring-substituted anilines with humate in aqueous solution and observed biphasic
binding. Initially, a rapid, reversible equilibrium (phase I) was established, and a slow
irreversible reaction (phase II) subsequently followed. The formation of imine linkage
with the humate carbonyls (1,2-nucleophilic addition) was postulated to be responsible
for the fast reaction (phase I) between aniline and quinones (Weber et al., 1996). The
slower irreversible reaction (phase II) was proposed to result from the 1,4-nucleophilic
addition (Weber et al., 1996). The possible pathways are given in Figure E.1.
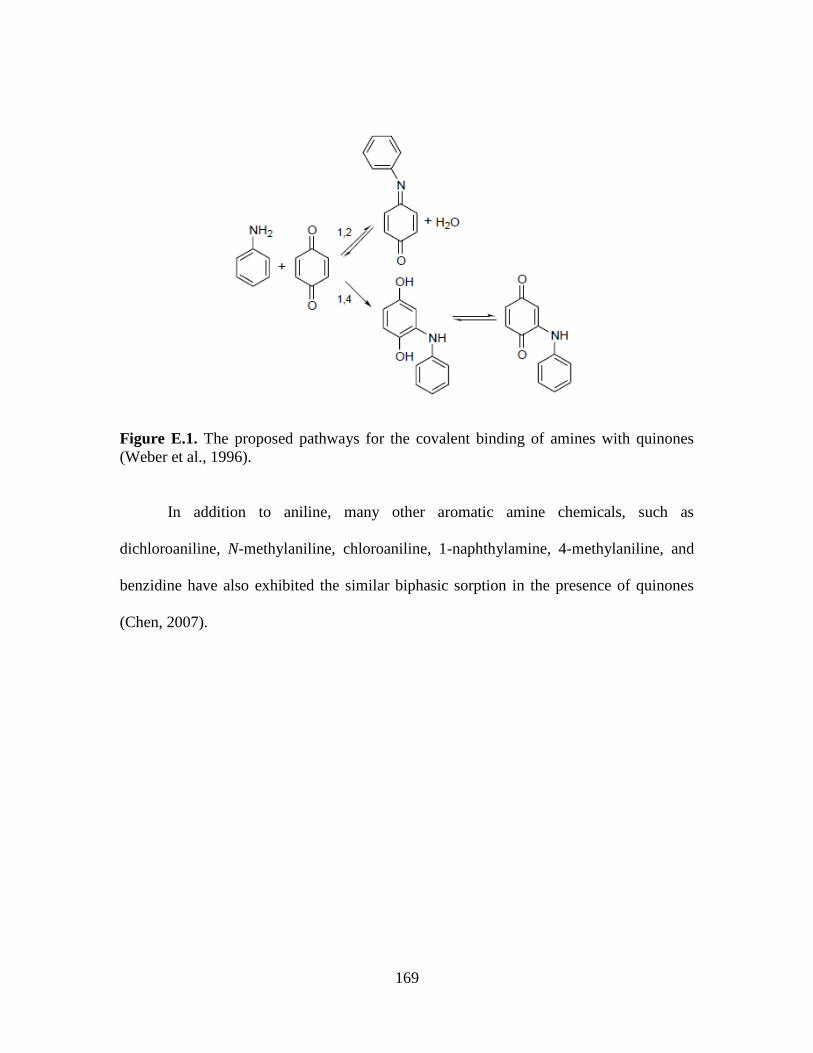
169
Figure E.1. The proposed pathways for the covalent binding of amines with quinones
(Weber et al., 1996).
In addition to aniline, many other aromatic amine chemicals, such as
dichloroaniline, N-methylaniline, chloroaniline, 1-naphthylamine, 4-methylaniline, and
benzidine have also exhibited the similar biphasic sorption in the presence of quinones
(Chen, 2007).
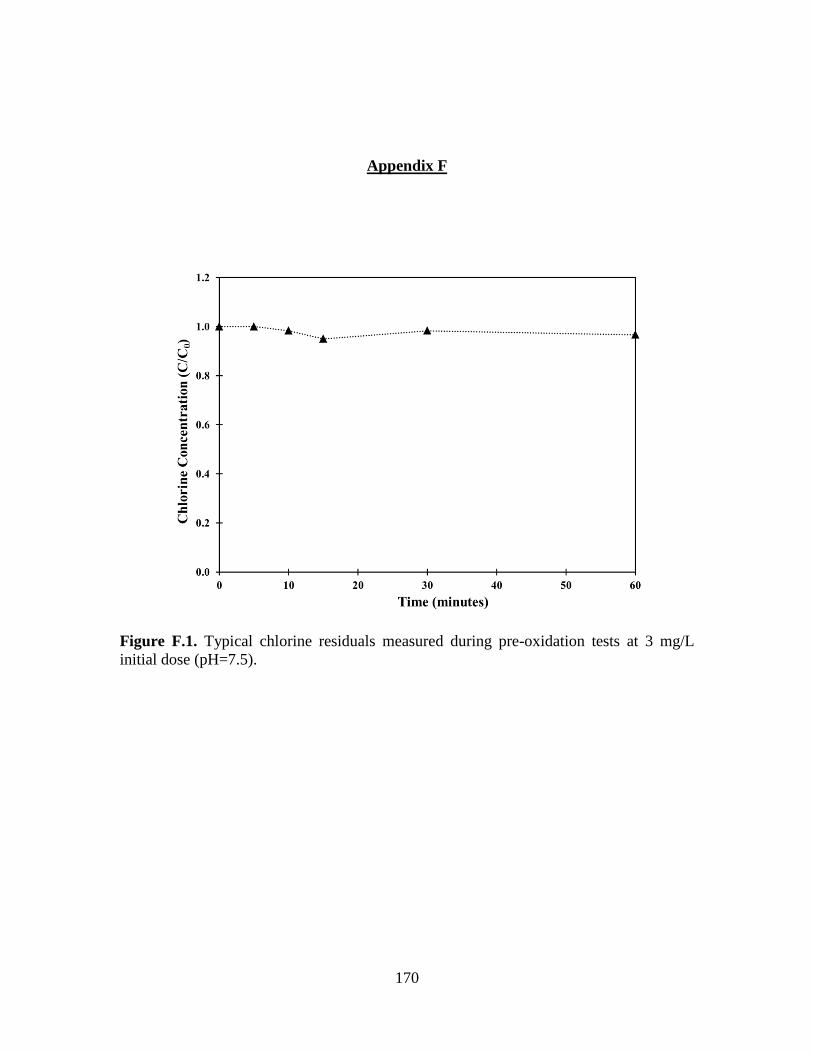
170
Appendix F
Figure F.1. Typical chlorine residuals measured during pre-oxidation tests at 3 mg/L
initial dose (pH=7.5).
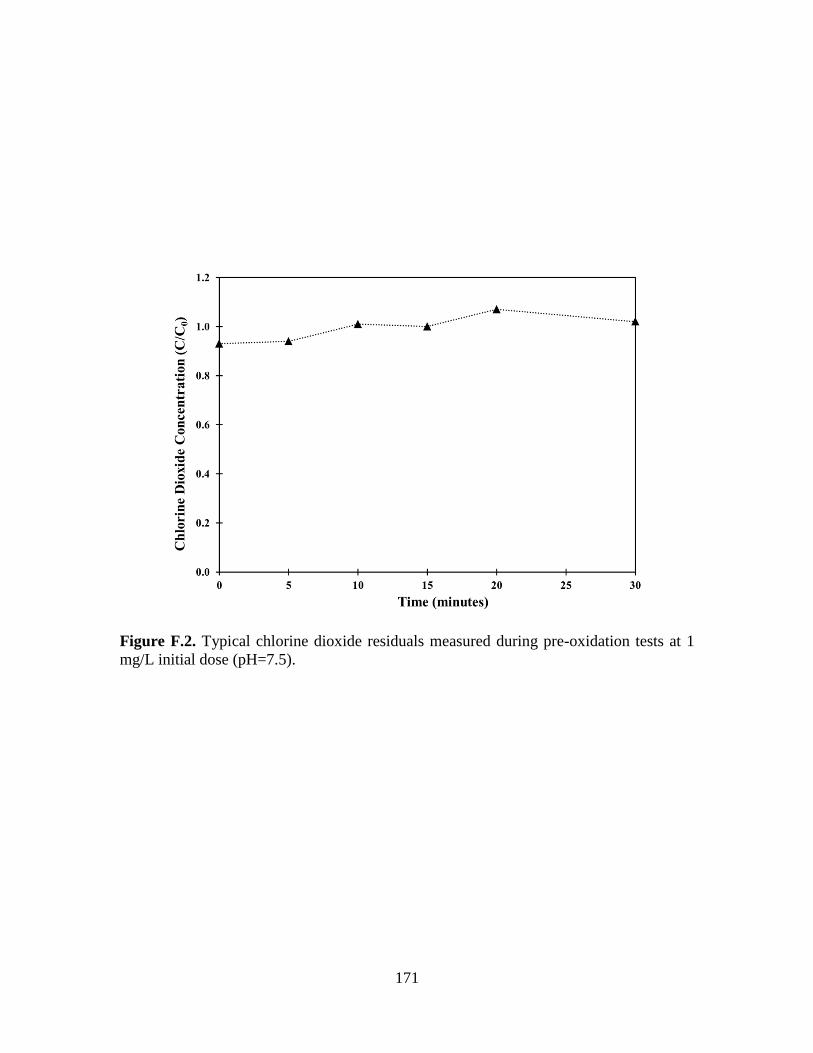
171
Figure F.2. Typical chlorine dioxide residuals measured during pre-oxidation tests at 1
mg/L initial dose (pH=7.5).
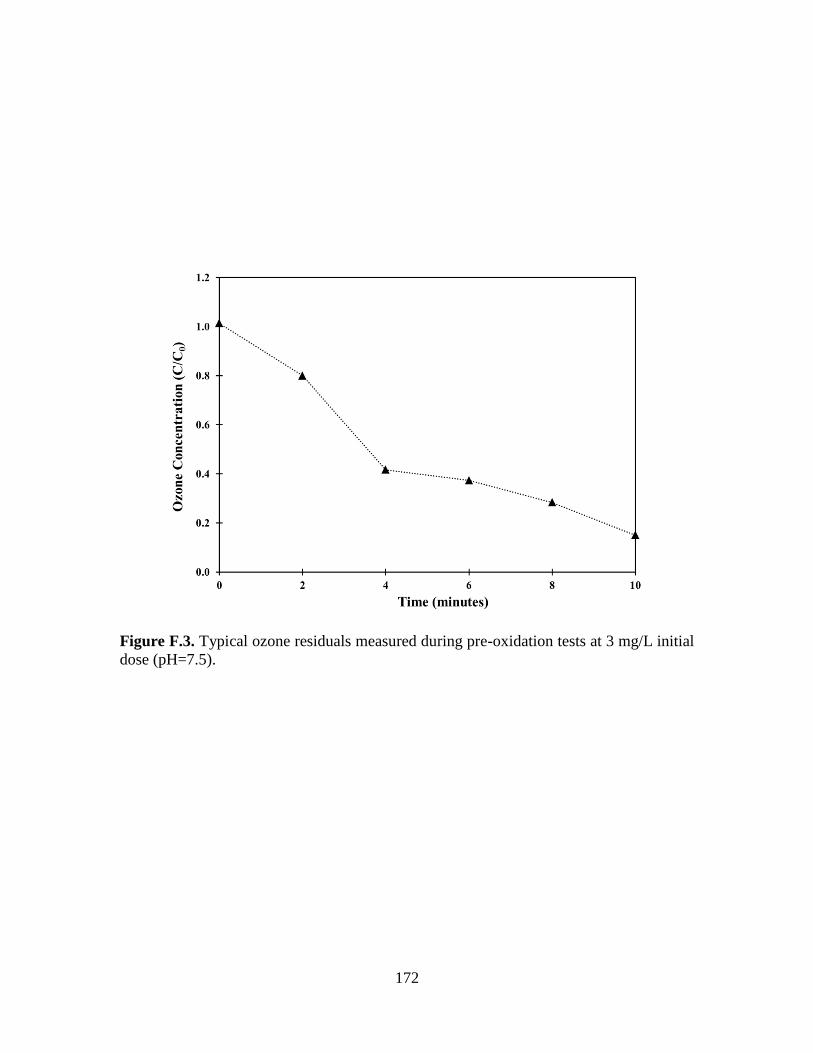
172
Figure F.3. Typical ozone residuals measured during pre-oxidation tests at 3 mg/L initial
dose (pH=7.5).
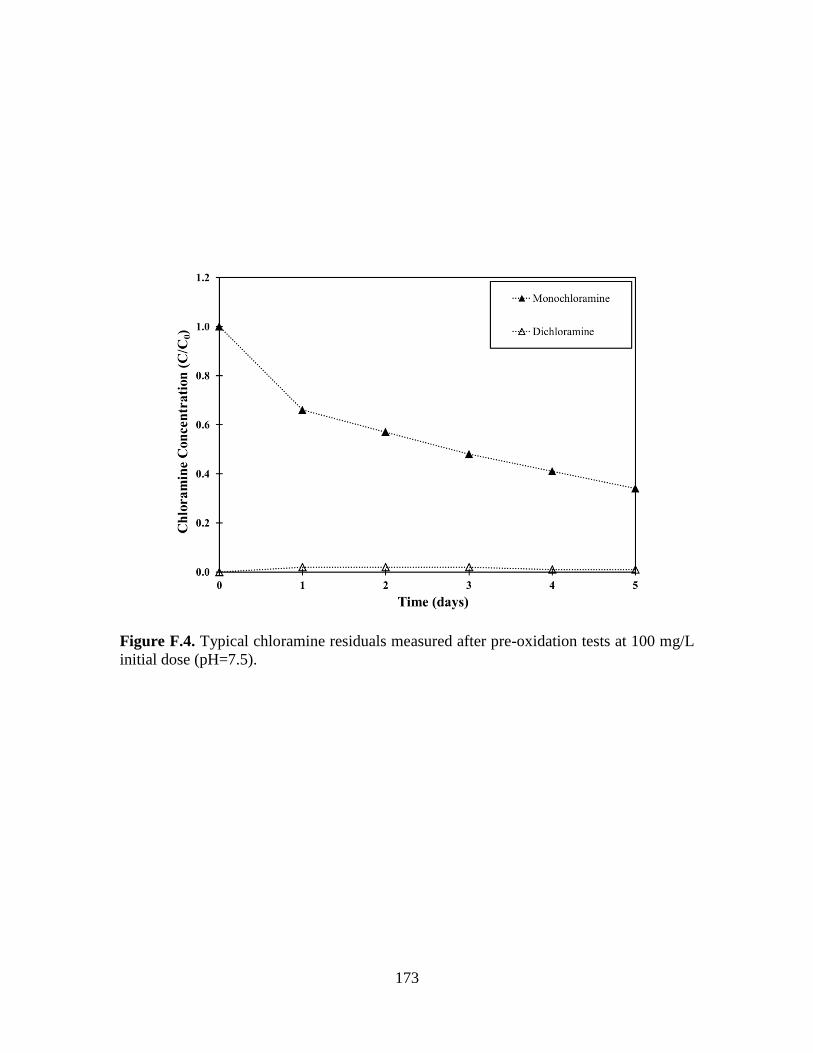
173
Figure F.4. Typical chloramine residuals measured after pre-oxidation tests at 100 mg/L
initial dose (pH=7.5).
174
REFERENCES
Abia, L., Armesto, X.L., Canle, L.M., Garcia, M.V., Santaballa, J.A., 1998. Oxidation of
aliphatic amines by aqueous chlorine. Tetrahedron, 54(3-4), 521–530.
ALS, 2012. Analysis of Extended Ultra-trace Nitrosamines in Drinking, Recycled &
Catchment Water. http://www.alsglobal.com/en/Our-Services/Life-
Sciences/Environmental/News/ALS-Australia-now-provides-testing-for-
Nitrosamine-compounds (accessed July 20, 2014).
Andrzejewski, P., Kasprzyk-Hordern, B., Nawrocki, J., 2008. N-nitrosodimethylamine
(NDMA) formation during ozonation of dimethylamine containing waters. Water
Research, 42(4-5), 863–870.
Andrzejewski, P., Nawrocki, J., 2007. N-Nitrosodimethylamine formation during
treatment with strong oxidants of dimethylamine-containing water. Water Science
and Technology, 56(12), 125-131.
APHA, AWWA, WEF, 2005. Standard Methods for the Examination of Water and
Wastewater, 21st ed.; Washington, DC.
Asami, M., Oya, M., Kosaka, K., 2009. A nationwide survey of NDMA in raw and
drinking water in Japan. Science of the Total Environment, 407(11), 3540-3545.
Aydin, E., Yaman, F.B., Genceli, E.A., Topuz, E., Erdim, E., Gurel, M., Ipek, M.,
Pehlivanoglu-Mantas, E., 2012. Occurrence of THM and NDMA precursors in a
175
watershed: Effect of seasons and anthropogenic pollution. Journal of Hazardous
Materials, 221– 222, 86–91.
Barrett, S., Hwang, C., Guo, Y., Andrews, S.A., Valentine, R., 2003. Occurrence of
NDMA in drinking water: A North American survey, 2001-2002. In: Proceedings
of the American Water Works Association’s Annual Conference, Anaheim, CA.
Berger, P., Leitner, N.K.V., Dore, M., Legube, B., 1999. Ozone and hydroxyl radicals
induced oxidation of glycine. Water Research, 33(2), 433-441.
Bond, T., Huang, J., Templeton, M.R., Graham, N., 2011. Occurrence and control of
nitrogenous disinfection by-products in drinking water-A review. Water Research,
45(15), 4341-4354.
Bond, T., Templeton, M.R., 2011. Nitrosamine formation from the oxidation of
secondary amines. Water Science and Technology, 11(3), 259-265.
Bond, T., Templeton, M.R., Graham, N., 2012. Precursors of nitrogenous disinfection by-
products in drinking water-A critical review and analysis. Journal of Hazardous
Materials, 235-236, 1-16.
Bornick, H., Schimdt, T.C., 2006. Chapter Eight “Amines” in Organic Pollutants in the
Water Cycle. Editors, Reemsta, T., and Jekel, M. Wiley-VCH.
CDPH (California Department of Public Health), 2013. Home Page: NDMA and Other
Nitrosamines–Drinking Water Issues.
http://www.cdph.ca.gov/certlic/drinkingwater/Pages/NDMA.aspx (accessed June
25, 2013).
176
Challis, B.C., Kyrtopoulos, S.A., 1979. The chemistry of nitroso-compounds. Part 11,
Nitrosation of amines by the two-phase interaction of amines in solution with
gaseous oxides of nitrogen. Journal of the Chemical Society, Perkin Transactions
1, 299-304.
Charrois, J.W.A., Hrudey, S.E., 2007. Breakpoint chlorination and free-chlorine contact
time: implications for drinking water N-nitrosodimethylamine concentrations.
Water Research, 41(3), 674-682.
Chen, S., 2007. Sorption and Desorption Behavior of Aromatic Amine in Solvent-
Sediment Systems. Ph.D. Thesis, Rensselaer Polytechnic Institute, Department of
Environmental Engineering. Troy, NY, USA.
Chen, W.H., Young, T.M., 2008. NDMA formation during chlorination and
chloramination of aqueous diuron solutions. Environmental Science and
Technology, 42(4), 1072-1077.
Chen, Z., Valentine, R.L., 2007. Formation of N-nitrosodimethylamine (NDMA) from
humic substances in natural water. Environmental Science and Technology,
41(17), 6059-6065.
Chen, Z., Valentine, R.L., 2008. The influence of the pre-oxidation of natural organic
matter on the formation of N-nitrosodimethylamine (NDMA). Environmental
Science and Technology, 42(14), 5062-5067.
Chinn, R., Barrett, S.E., 2000. Occurrence of amino acids in two drinking water sources.
Editors, S.E. Barrett, S.W. Krasner, and G.L. Amy. Natural organic matter and
177
disinfection by-products: Characterization and control in drinking water,
American Chemical Society, Washington, D.C.
Choi, J., Duirk, S.E., Valentine, R.L., 2002. Mechanistic studies of N-
nitrosodimethylamine (NDMA) formation in chlorinated drinking water. Journal
of Environmental Monitoring, 4(2), 249-252.
Choi, J., Valentine, R.L., 2002a. A kinetic model of N-nitrosodimethylamine (NDMA)
formation during water chlorination/chloramination. Water Science and
Technology, 46(3), 65-71.
Choi, J., Valentine, R.L., 2002b. Formation of N-nitrosodimethylamine (NDMA) from
reaction of monochloramine: a new disinfection by-product. Water Research,
36(4), 817-824.
Choi, J., Valentine, R. L., 2003. N-nitrosodimethylamine formation by free-chlorine-
enhanced nitrosation of dimethylamine. Environmental Science and Technology,
37(21), 4871–4876.
Croue, J.P., Lefebvre, E., Martin, B., Legube, B., 1993. Removal of dissolved
hydrophobic and hydrophilic organic substances during coagulation/flocculation
of surface waters. Water Science and Technology, 27(11), 143-152.
Deborde, M., von Gunten, U., 2008. Reactions of chlorine with inorganic and organic
compounds during water treatment kinetics and mechanisms: A critical review.
Water Research, 42(1-2), 13-51.
178
Diehl, A.C., Speitel, G.E.Jr., Symons, J.M., Krasner, S.W., Hwang, C.J., Barret, S.E.,
2000. DBP formation during chloramination. Journal of the American Water
Works Association, 92(6), 76–90.
Dotson, A., Westerhoff, P., 2009. Occurrence and removal of amino acids during
drinking water treatment. Journal of the American Water Works Association,
101(9), 101-115.
Dotson, A., Westerhoff, P., Krasner, S.W., 2007. Nitrosamine formation from natural
organic matter isolates and sunlight photolysis of nitrosamines. In: Proceedings of
AWWA Annual Conference and Exposition, Toronto, ON.
Dotson, A., Westerhoff, P., Krasner, S.W., 2009. Nitrogen enriched dissolved organic
matter (DOM) isolates and their affinity to form emerging disinfection by-
products. Water Science and Technology, 60(1), 135-143.
Fang, J., Yang, X., Ma, J., Shang, J., Zhao, Q., 2010. Characterization of algal organic
matter and formation of DBPs from chlor(am)ination. Water Research, 44(20),
5897-5906
Farré, M. J., Döderer, K., Keller, J., Poussade, Y., Mueller, J., Gernjak, W., 2010. N-
nitrosodimethylamine (NDMA) in Purified Recycled Water. Technical Report for
Urban Water Security Research Alliance: Queensland, Australia.
Farré, M.J., Reungoat, J., Argaud, F.X., Rattier, M., Keller, J., Gernjak, W., 2011. Fate of
N-nitrosodimethylamine, trihalomethane and haloacetic acid precursors in tertiary
treatment including biofiltration. Water Research, 45(17), 5695-5704.
179
Gan, X., Karanfil, T., Bekaroglu, S.S.K, Shan, J., 2013a. The control of N-DBP and C-
DBP precursors with MIEX®. Water Research, 47(3), 1344–1352.
Gan, X., Kim, D., Karanfil, T., 2013b. MIEX® treatment of an effluent-impacted stream.
Journal of the American Water Works Association, 105(4), E195-E206.
Gerecke, A.C., Sedlak, D.L., 2003. Precursors of N-nitrosodimetylamine in natural
waters. Environmental Science and Technology, 37(7), 1331-1336.
Gough, T.A., Webb, K.S., McPhail, M.F., 1977. Volatile nitrosamines from ion-exchange
resins. Food and Cosmetics Toxicology, 15(5), 437-440.
Graham, J.E., Andrews, S.A., Farquhar, G.J., Meresz, O., 1995. Factors affecting NDMA
formation during drinking water treatment. In: Proceedings of the AWWA Water
Quality Technology Conference, New Orleans, LA.
Guo, Y.C., Krasner, S.W., 2009. Occurrence of primidone, carbamazepine, caffeine, and
precursors for N-Nitrosodimethylamine in drinking water sources impacted by
wastewater. Journal of the American Water Resources Association, 45(1), 58–67.
Hagedorn, F., Schleppi, P., Waldner, P., Fluhler, H., 2000. Export of dissolved organic
carbon and nitrogen from Gleysol dominated catchments - the significance of
water flow paths. Biogeochemistry, 50(2), 137-161.
Hanigan, D., Zhang, J., Herckes, P., Krasner, S.W., Chen, C., Westerhoff, P., 2012.
Adsorption of N‑nitrosodimethylamine precursors by powdered and granular
activated carbon. Environmental Science and Technology, 46(22), 12630–12639.
Heasley, V.L., Fisher, A.M., Herman, E.E., Jacobsen, F.E., Miller, E.W., Ramirez, A.M.,
Royer, N.R., Whisenand, J.M., Zoetewey, D.L., Shellhamer, D.F., 2004.
180
Investigations of the reactions of monochloramine and dichloramine with selected
phenols: Examination of humic acid models and water contaminants.
Environmental Science and Technology, 38(19), 5022-5029.
Hoehn, R.C., Barnes, D.B., Thompson, B.C., Randall, C.W., Grizzard, T.J., Shaffer,
P.T.B., 1980. Algae as a source of trihalomethane precursors. Journal of the
American Water Works Association, 72(6), 344-350.
Hong, H.C., Wong, M.H., Liang, Y., 2009. Amino acids as precursors of trihalomethane
and haloacetic acid formation during chlorination. Archives of Environmental
Contamination and Toxicology, 56(4), 638-645.
Hong, Y., Liu, S., Song, H., Karanfil, T., 2007. Formation during chloramination -
significance of monochloramine's direct reaction with DOM. Journal of the
American Water Works Association, 99(8), 57-69.
Hu, J., Song, H., Addison, J.W., Karanfil, T., 2010. Halonitromethane formation
potentials in drinking waters. Water Research, 44(1), 105-114.
Hatt, J.W., Lamy, C., Germian, E., Tupper, M., Judd, S.J., 2013. NDMA formation in
secondary wastewater effluent. Chemosphere, 91(1), 83–87.
Hureiki, L., Croue, J.P., Legube, B., 1994. Chlorination studies of free and combined
amino acids. Water Research, 28(12), 2521-2531.
Jones, D.B., Song, H., Karanfil, T., 2012. The effects of selected preoxidation strategies
on I-THM formation and speciation. Water Research, 46(17), 5491-5498.
181
Jørgensen, N.O.G., 1987. Free amino acids in lakes: Concentrations and assimilation
rates in relation to phytoplankton and bacterial production. Limnology and
Oceanography, 32(1), 97-111.
Karanfil, T., Hong, Y., Song, H., Orr O., 2007. Exploring HAA Formation Pathways
during Chloramination. AWWA Research Foundation Report, ISBN 978-1-
84339-801-1, Denver, CO.
Karanfil, T., Schalutman, M.A., Erdogan, I., 2002. Survey of DOC and UV measurement
practices with implications for SUVA determination. Journal of the American
Water Works Association, 94(12), 68-80.
Kemper, J.M., Walse, S.S., Mitch, W.A., 2010. Quaternary amines as nitrosamine
precursors: A role for consumer products? Environmental Science and
Technology, 44(4), 1224-1231.
Kemper, J.M., Westerhoff, P., Dotson, A., Mitch, W.A., 2009. Nitrosamine,
dimethylnitramine, and chloropicrin formation during strong base anion-exchange
treatment. Environmental Science and Technology, 43(2), 466–472.
Kim, H.C., Yu, M.J., 2005. Characterization of natural organic matter in conventional
water treatment processes for selection of treatment processes focused on DBPs
control. Water Research, 39(19), 4779-4789.
Kim, S., Choi, W., 2002. Kinetics and mechanisms of photocatalytic degradation of
(CH3)nNH4-n+ (0 ≤ n ≤ 4) in TiO2 suspension: The role of OH radicals.
Environmental Science and Technology, 36(9), 2019–2025.
182
Kimoto, W.I., Dooley, C.J., Carre, J., Fiddler, W., 1980. Role of strong ion exchange
resins in nitrosamine formation in water. Water Research, 14(7), 869–876.
Kohut, K.D., Andrews, S.A., 2003. Polyelectrolyte age and N-nitrosodimethylamine
formation in drinking water treatment. Water Quality Research Journal of Canada,
38(4), 719-735.
Kosaka, K., Asami, M., Konno, Y., Oya, M., Kunikane, S., 2009. Identification of
antiyellowing agents as precursors of N-nitrosodimethylamine production on
ozonation from sewage treatment plant influent. Environmental Science and
Technology, 43(14), 5236-5241.
Krasner, S.W., Sclimenti, M. J., Guo, Y. C., Hwang, C. J., Westerhoff, P., 2004.
Development of DBP and nitrosamine formation potential tests for treated
wastewater, reclaimed water, and drinking water. In: Proceeding of the AWWA
Water Quality Technology Conference, Denver, CO.
Krasner, S.W., Garcia, E.A., Dale, M.S., Labernik, S.M., Yun, T.I., 2008a. Source and
removal of NDMA precursors. In: Proceedings of the AWWA Annual
Conference and Exposition, Atlanta, GA.
Krasner, S.W., Westerhoff, P., Chen, B., Amy, G., Nam, S.-N., Chowdhury, Z.K., Sinha,
S., Rittman, B.E., 2008b. Contribution of Wastewater to DBP Formation.
Technical Report for AWWA Research Foundation and U.S. Environmental
Protection Agency, Denver, CO.
Krasner, S.W., Westerhoff, P., Chen, B., Rittmann, B., Nam, S.G., Amy, G., 2009.
Impact of wastewater treatment processes on organic carbon, organic nitrogen,
183
and DBP precursors in effluent organic matter. Environmental Science and
Technology, 43(8), 2911-2918.
Krasner, S.W., Dale, M.S., Lee, C.F.T., Garcia, E.A., Wong, T.M., Mitch, W., Von
Gunten, U., 2010. Difference in reactivity and chemistry of NDMA precursors
from treated wastewater and from polyamine polymers. In: Proceedings of the
AWWA Water Quality Technology Conference, Savannah, GA.
Krasner, S.W., Lee, C.F.T., Liang, S., Mitch, W., von Gunten, U., Westerhoff, P., 2012a.
Impact of a nitrified biofilter on NDMA formation. In: Proceedings of the
AWWA Annual Conference and Exposition, Dallas, TX.
Krasner, S.W., Mitch, W.A., Westerhoff, P., Dotson, A., 2012b. Formation and control of
emerging C- and N-DBPs in drinking water. Journal of the American Water
Works Association, 104(11), 33-34.
Krasner, S.W., Westerhoff, P., Mitch, W.A., Skadsen, J., 2012c. Case studies on
nitrosamine formation and control at full-scale drinking water treatment plants.
In: Proceedings of the 2012 American Water Works Association Water Quality
Technology Conference, Denver, CO.
Krasner, S.W., Mitch, W.A., McCurry, D.L., Hanigan, D., Westerhoff, P., 2013.
Formation, precursors, control, and occurrence of nitrosamines in drinking water:
A review. Water Research, 47(13), 4433–4450.
Krauss, M., Longree, P., Dorusch, F., Ort, C., Hollender, J., 2009. Occurrence and
removal of N-nitrosamines in wastewater treatment plants. Water Research,
43(17), 4381–4391.
184
Le Roux, J., Gallard, H., Croué, J.-P., 2011. Chloramination of nitrogenous contaminants
(pharmaceuticals and pesticides): NDMA and halogenated DBPs formation.
Water Research, 45(10), 3164–3174.
Le Roux, J., Gallard, H., Croué, J.-P., 2012a. Formation of NDMA and halogenated
DBPs by chloramination of tertiary amines: The influence of bromide ion.
Environmental Science and Technology, 46(3), 1581–1589.
Le Roux, J., Gallard, H., Croué, J.-P., Papot, S., Deborde, M., 2012b. NDMA formation
by chloramination of ranitidine: Kinetics and mechanism. Environmental Science
and Technology, 46(20), 11095–11103.
Lee, C., Lee, Y., Schmidt, C., Yoon, J., Von Gunten, U., 2008. Oxidation of suspected N-
nitrosodimethylamine (NDMA) precursors by ferrate (VI): Kinetics and effect on
the NDMA formation potential of natural waters. Water Research, 42(1-2), 433-
441.
Lee, C., Schmidt, C., Yoon, J., von Gunten U., 2007a. Oxidation of N-
nitrosodimethylamine (NDMA) precursors with ozone and chlorine dioxide:
kinetics and effect on NDMA formation potential. Environmental Science and
Technology, 41(6), 2056-2063.
Lee. C., Yoon, J., Von Gunten, U., 2007b. Oxidative degradation of N-
nitrosodimethylamine by conventional ozonation and the advanced oxidation
process ozone/hydrogen peroxide. Water Research, 41(3), 5815-90.
185
Lee, C., Yoon, J., 2007. UV-A induced photochemical formation of N-
nitrosodimethylamine (NDMA) in the presence of nitrite and dimethylamine.
Journal of Photochemistry and Photobiology A: Chemistry, 189(1), 128–134.
Lee, W., Westerhoff, P., 2006. Dissolved organic nitrogen removal during water
treatment by aluminum sulfate and cationic polymer coagulation. Water Research,
40(20), 3767– 3774.
Lee, Y., von Gunten, U., 2010. Oxidative transformation of micropollutants during
municipal wastewater treatment: Comparison of kinetic aspects of selective
(chlorine, chlorine dioxide, ferrate(VI), and ozone) and non-selective oxidants
(hydroxyl radical). Environmental Science and Technology, 44(2), 555−566.
Li, C., 2011. Trends and effects of chloramine in drinking water. Water Conditioning and
Purification, 53(10), 52-56.
Li, L., Gao, N., Deng, Y., Yao, J., Zhang, K., 2012. Characterization of intracellular and
extracellular algae organic matters (AOM) of Microcystic aeruginosa and
formation of AOM-associated disinfection byproducts and odor and taste
compounds. Water Research, 46(4), 1233-1240.
Lide, R.D., 1991. Handbook of Chemistry and Physics. 72nd Edition, CRC Press, Boca
Raton, FL.
Liu, Y.D., Selbes, M., Zeng, C., Zhong, R., Karanfil, T., 2014. Formation mechanism of
NDMA form ranitidine and other tertiary amines during chloramination: A
computational study. Environmental Science and Technology, Just Accepted
Manuscript (DOI: 10.1021/es500997e).
186
Loeppky, R.N., Outram, J.R., Tomasik, W., Faulconer, J.M., 1983. Rapid nitrosamine
formation from a tertiary amine: the nitrosation of 2-(N,N-
dimethylaminomethyl)pyrrole. Tetrahedron Letters, 24(40), 4271-4274.
Luh, J., Marinas, B.J., 2012. Bromide ion effect on N-nitrosodimethylamine (NDMA)
formation by monochloramine. Environmental Science and Technology, 46(9),
5085-5092.
Lv, C.L., Liu, Y.D., Zhong, R.G., 2009. Theoretical investigation of N-
Nitrosodimethylamine formation from dimethylamine nitrosation catalyzed by
carbonyl compounds. The Journal of Physical Chemistry A, 113(4), 713–718.
Lv, J., Li, Y., Song, Y., 2013. Reinvestigation on the ozonation of N-
nitrosodimethylamine: Influencing factors and degradation mechanism. Water
Research, 47(14), 4993-5002.
MassDEP (Massachusetts Department of Environmental Protection), 2004. Current
Regulatory Limit: N-nitrosodimethylamine (NDMA), CASRN 62759.
http://www.mass.gov/eea/agencies/massdep/water/drinking/standards/n-
nitrosodimethylamine-ndma.html (accessed on November 22, 2013).
Meon, B., Kirchman, D.L., 2001. Dynamics and molecular composition of dissolved
organic material during experimental phytoplankton blooms. Marine Chemistry,
75(3), 185-199.
Mirvish, S.S., 1975. Formation of N-nitroso compounds – chemistry, kinetics and in vivo
occurrence. Toxicology and Applied Pharmacology, 31(3), 325-351.
187
Mitch, W.A., Sharp, J.O., Trussell, R.R., Valentine, R.L., Alvarez-Cohen, L., Sedlak,
D.L., 2003a. N-nitrosodimethylamine (NDMA) as a drinking water contaminant:
a review. Environmental Engineering Science, 20(5), 389-404.
Mitch, W.A., Gerekce, A.C., Sedlak, D.L., 2003b. A N-nitrosodimethylamine (NDMA)
precursor analysis for chlorination of water and wastewater. Water Research,
37(15), 3733-3741.
Mitch, W.A., Schreiber, I.M., 2008. Degradation of tertiary alkylamines during
chlorination/chloramination: Implications for formation of aldehydes, nitriles,
halonitroalkanes, and nitrosamines. Environmental Science and Technology,
42(13), 4811-4817.
Mitch, W.A., Krasner, S.W., Westerhoff, P., Dotson, A., 2009. Occurrence and
Formation of Nitrogenous Disinfection By-Products. Water Research Foundation
Report, Report No. 91250, ISBN 978-1-60573-053-0, Denver, CO.
Mitch, W.A., Sedlak, D.L., 2002. Formation of N-nitrosodimethylamine (NDMA) from
dimethylamine during chlorination. Environmental Science and Technology,
36(4), 588-595.
Mitch, W.A., Sedlak, D.L., 2004. Characterization and fate of N-nitrosodimethylamine
precursors in municipal wastewater treatment plants. Environmental Science and
Technology, 38(5), 1445-1454.
Miyashita, Y., Park, S.-H., Hyung, H., Huang, C.-H., Kim, J.-H., 2009. Removal of N-
nitrosamines and their precursors by nanofiltration and reverse osmosis
membranes. Journal of Environmental Engineering, 135(9), 788-795.
188
MOE (Canada Ontario Ministry of the Environmental and Energy), 2003. Ontario
Regulation 268/03 made under the safe drinking water act, The Ontario Gazette:
July 19, 2003. http://www.e-
laws.gov.on.ca/html/source/regs/english/2003/elaws_src_regs_r03268_e.htm
(accessed July 18, 2014)
Morran, J., Whittle, M., Fabris, R.B., Harris, M., Leach, J.S., Newcombe, G., Drikas, M.,
2011. Nitrosamines from pipeline materials in drinking water distribution
systems. Journal of the American Water Works Associaction, 103(10), 76–82.
Muñoz, F., von Sonntag, C., 2000. The reactions of ozone with tertiary amines including
the complexing agents nitrilotriacetic acid (NTA) and ethylenediaminetetraacetic
acid (EDTA) in aqueous solution. Journal of the Chemical Society-Perkin
Transactions 2, 10, 2029-2033.
Münster, U., 1999. Amino acid profiling in natural organic matter isolated by reverse
osmosis from eight different boreal freshwaters. Environment International, 25(2-
3), 209-224.
Na, C.Z., Olson, T.M., 2006. Mechanism and kinetics of cyanogen chloride formation
from the chlorination of glycine. Environmental Science and Technology, 40(5)
1469-1477.
Najm, I., Trussell, R.R., 2001. NDMA formation in water and wastewater. Journal of the
American Water Works Association, 93(2), 92-99.
Nawrocki, J., Andrzejewski, P., 2011. Nitrosamines and water. Journal of Hazardous
Materials, 189(1-2), 1–18.
189
Novak, J.T., Langford, M., 1977. Use of polymers for improving chemical sludge
dewatering on sand beds. Journal of the American Water Works Association,
69(2), 106-110.
Novak, J.T., Montgomery, G.E., 1975. Chemical sludge dewatering on sand beds. Journal
of the Environmental Engineering Division, 101(1), 1-14.
OEHHA (Office of Environmental Health Hazard Assessment), 2006. Public health goal
for chemicals in drinking water: N-nitrosodimethylamine.
http://oehha.ca.gov/water/phg/pdf/122206NDMAphg.pdf (accessed June 24,
2013).
Oya, M., Kosaka, K., Asami, M., Kunikane, S., 2008. Formation of N-
nitrosodimethylamine (NDMA) by ozonation of dyes and related compounds.
Chemosphere, 73(11), 1724−1730.
Padhye, L., Wang, P., Karanfil, T., Huang, C.-H., 2010. Unexpected role of activated
carbon in promoting transformation of secondary amines to N-nitrosamines.
Environmental Science and Technology, 44(11), 4161–4168.
Padhye, L., Luzinova, Y., Cho, M., Mizaikoff, B., Kim, J.-H., Huang, C.-H., 2011a.
PolyDADMAC and dimethylamine as precursors of N-nitrosodimethylamine
during ozonation: Reaction kinetics and mechanisms. Environmental Science and
Technology, 45(10), 4353–4359.
Padhye, L., Hertzberg, B., Yushin, G., Huang, C.-H., 2011b. N-Nitrosamines formation
from secondary amines by nitrogen fixation on the surface of activated carbon.
Environmental Science and Technology, 45(19), 8368–8376.
190
Park, S.H., Wei, S., Huang, C.-H., Mizaikoff, B., Aral, M.M., 2007. A Study of the Effect
of Polymers on Potential N-nitrosodimethylamine (NDMA) Formation at Water
and Wastewater Treatment Plants. Research Report No.: MESL-03-07.
Parris, G.E., 1980. Covalent binding of aromatic amines to humates. 1. Reactions with
carbonyls and quinones. Environmental Science and Technology, 14(9), 1099-
1106.
Pehlivanoglu-Mantas, E., Sedlak, D.L., 2008. Measurement of dissolved organic nitrogen
forms in wastewater effluents: Concentrations, size distribution and NDMA
formation potential. Water Research, 42(14), 3890-3898.
Planas, C., Palacios, O., Ventura, F., Rivera, J., Caixach, J., 2008. Analysis of
nitrosamines in water by automated SPE and isotope dilution GC/HRMS -
Occurrence in the different steps of a drinking water treatment plant, and in
chlorinated samples from a reservoir and a sewage treatment plant effluent.
Talanta, 76(4), 906-913.
Plewa, M.J., Wagner, E.D., Muellner, M.G., Hsu, K.-M., Richardson, S.D., 2008.
Comparative mammalian cell toxicty of N-DBPs and C-DBPs. Editors, T.
Karanfil, S.W. Krasner, P. Westerhoff, and Y. Xie. Disinfection by-products in
drinking water: Occurrence, Formation, Health Effects, and Control. American
Chemical Society, Washington, D.C.
Rice, R.G., Gomez-Taylor, M., 1986. Occurrence of by-products of strong oxidants
reacting with drinking water contaminants--scope of the problem. Environmental
Health Perspectives, 69, 31-44.
191
Richardson, S.D., Plewa, M.J., Wagner, E.D., Schoeny, R., DeMarini, D.M., 2007.
Occurrence, genotoxicity, and carcinogenicity of regulated and emerging
disinfection by-products in drinking water: A review and roadmap for research.
Mutation Research. 636(1-3), 178-242.
Roberson, J.A., 2011. Regulatory options for nitrosamines. In: Proceedings of AWWA
Annual Conference and Exposition, Washington, DC.
Russell, C.G., Blute, N.K., Via, S., Wu, X.Y., Chowdhury, Z., 2012. Nationwide
assessment of nitrosamine occurrence and trends. Journal of the American Water
Works Association, 104(3), E205-E217.
Sacher, F., Schmidt, C.K., Lee, C., Von Gunten, U., 2008. Strategies for Minimizing
Nitrosamine Formation during Disinfection. Water Research Foundation Report,
Report No. 91209, ISBN 978-1-60573-008-0, Denver, CO.
Schmidt, C.K., Brauch, H.J., 2008. N,N-dimethylsulfamide as precursor for N-
nitrosodimethylamine (NDMA) formation upon ozonation and its fate during
drinking water treatment. Environmental Science and Technology, 42(17), 6340-
6346.
Schreiber, I.M., Mitch, W.A., 2005. Influence of the order of reagent addition on NDMA
formation during chloramination. Environmental Science and Technology,
39(10), 3811-3818.
Schreiber, I.M., Mitch, W.A., 2006. Nitrosamine formation pathway revisited: The
importance of chloramine speciation and dissolved oxygen. Environmental
Science and Technology, 40(19), 6007-6014.
192
Sedlak, D.L., Deeb, R.A., Hawley, E.L., Mitch, W.A., Durbin, T.D., Mowbray, S., Carr,
S., 2005. Sources and fate of nitrosodimethylamine and its precursors in
municipal wastewater treatment plants. Water Environment Research, 77(1), 32–
39.
Sellner, K.G., Nealley, E.W., 1997. Diel fluctuations in dissolved free amino acids and
monosaccharides in Chesapeake Bay dinoflagellate blooms. Marine Chemistry,
56(3-4), 193-200.
Shah, A.D., Krasner, S.W., Lee, C.F.T., von Gunten, U., Mitch, W.A., 2012. Trade-offs
in disinfection byproduct formation associated with precursor preoxidation for
control of N-nitrosodimethylamine formation. Environmental Science and
Technology, 46(9), 4809–4818.
Shah, A.D., Mitch, W.A., 2012. Halonitroalkanes, halonitriles, haloamides, and N-
nitrosamines: A critical review of nitrogenous disinfection byproduct formation
pathways. Environmental Science and Technology, 46(1), 119–131.
Shen, R., Andrews, S.A., 2011a. Demonstration of 20 pharmaceuticals and personal care
products (PPCPs) as nitrosamine precursors during chloramine disinfection.
Water Research, 45(2), 944-952.
Shen, R., Andrews, S.A., 2011b. NDMA formation kinetics from three pharmaceuticals
in four water matrices. Water Research, 45(17), 5687-5694.
Shen, R., Andrews, S.A., 2013a. Formation of NDMA from ranitidine and sumatripan:
The role of pH. Water Research, 47(2), 802-810.
193
Shen, R., Andrews, S.A., 2013b. NDMA formation from amine-based pharmaceuticals –
impact from prechlorination and water matrix. Water Research, 47(7), 2446-2457.
Singer, P.C., Flower, R.C., 2012. Anion Exchange Resins as Sources of Nitrosamines and
Nitrosamine Precursors. Water Research Foundation, Denver, CO.
Soltermann, F., Lee, M., Canonica, S., von Gunten, U., 2013. Enhanced N-nitrosamine
formation in pool water by UV irradiation of chlorinated secondary amines in the
presence of monochloramine. Water Research, 47(1), 79-90.
Streitwieser, A., Heathcock, C. H., Kosower, E. M., 1992. Introduction to Organic
Chemistry. 4th Ed. International Ed. Macmillan Publishing Com., New York, NY.
Sun, Z., Liu, Y.D., Zhong, R.G., 2011. Carbon dioxide in the nitrosation of amine:
catalyst or inhibitor? The Journal of the Physical Chemistry A, 115(4), 7753-
7764.
Teefy, S., Chan, C.C., Wong, W., Work, L., 2011. NDMA formation from gaskets used
in Water Storage Tanks. In: Proceedings of the 2011 American Water Works
Association Water Quality Technology Conference, Denver, CO.
Ternes, T.A., Joss, A., 2006. Human Pharmaceuticals, Hormones and Fragrances. The
Challenge of Micropollutants in Urban Water Management. IWA Publishing,
London, New York.
Thorn, K.A., Pettigrew, P.J., Goldenberg, W.S., Weber, E.J., 1996. Covalent binding of
aniline to humic substances. 2. 15N NMR studies of nucleophilic addition
reactions. Environmental Science and Technology, 30(9), 2764-2775.
194
Thurman, E.M., 1985. Organic Geochemistry of Natural Waters. Martinus Nijhoff/Dr W.
Junk Publishers: Dordrecht, the Netherlands.
Trehy, M.L., Yost, R.A., Miles, C.J., 1986. Chlorination by-products of amino acids in
natural waters. Environmental Science and Technology, 20(11), 1117–1122.
Tricker, A.R., Preussmann, R., 1991. Carcinogenic N-nitrosamines in the diet:
occurrence, formation, mechanisms and carcinogenic potential. Mutation
Research, 259(3-4), 277–289.
USEPA, 1993. Integrated Risk Information System Home Page. Office of Research and
Development (ORD), National Center for Environmental Assessment.
http://www.epa.gov/iris/subst/0045.htm (accessed March 26, 2013).
USEPA, 1999. Alternative disinfectants and oxidants guidance manual.
http://www.epa.gov/ogwdw/mdbp/alternative_disinfectants_guidance.pdf
(accessed June 19, 2014)
USEPA, 2004. Method 521: Determination of nitrosamines in drinking water by solid
phase extraction and capillary column gas chromatography with large volume
injection and chemical tandem mass spectrometry (MS/MS).
http://www.epa.gov/microbes/m_521.pdf (accessed on March 26, 2012).
USEPA, 2006. Unregulated Contaminant Monitoring Rule 2 (UCMR 2).
http://www.epa.gov/safewater/ucmr/ucmr2/basicinformation.html#list (accessed
June 25, 2013)
USEPA, 2008. Fate of high priority pesticides during drinking water treatment.
EPA/600/R-08/089, U.S. Environmental Protection Agency, 2004.
195
http://www.epa.gov/athens/publications/reports/Duirk_600R08089_Fate_High_Pr
iority_Pesticides.pdf (accessed on October 11, 2012).
USEPA, 2009. Drinking Water Contaminant Candidate List 3–Final.
http://www.gpo.gov/fdsys/pkg/FR-2009-10-08/pdf/E9-24287.pdf (accessed June
25, 2013)
Uzun, H., Kim, D., Ates, N., Karanfil, T., 2012. NDMA precursors in source waters and
water treatment plants. In: Proceedings of AWWA Annual Conference and
Exposition, Dallas, TX.
Valentine, R.L., Jafvert, C.T., 1988. General acid catalysis of monochloramine
disproportionation. Environmental Science and Technology, 22(6), 691–696.
Valentine, R.L., Ozekin, K., Vikesland, P.J., 1998. Chloramine decomposition in
distribution system and model waters. AWWA Research Foundation Report,
ISBN 978-0-89867-945-8, Denver, CO.
Valentine, R.L., Choi, J., Chen, Z., Barrett, S.E., Hwang, C., Guo, Y., Wehner, M.,
Fitzsimmons, S., Andrews, S.A., Werker, A.G., Brubacher, C., Kohut, K., 2005.
Factors Affecting the Formation of NDMA in Water and Occurrence. AWWA
Research Foundation Report, Denver, CO.
Vikesland, P.J., Ozekin, K., Valentine, R.L., 1998. Effect of natural organic matter on
monochloramine decomposition: Pathway elucidation through the use of mass
and redox balances. Environmental Science and Technology, 32(10), 1409–1416.
Vikesland, P.J., Ozekin, K., Valentine, R.L., 2001. Monochloramine decay in model and
distribution system waters. Water Research, 35(7), 1766-1776.
196
von Gunten, U., 2003. Ozonation of drinkingwater: Part I. Oxidation kinetics and product
formation. Water Research, 37(7), 1443–1467.
von Gunten, U., Salhi, E., Schmidt, C.K., Arnold, W.A., 2010. Kinetics and mechanisms
of N-nitrosodimethylamine formation upon ozonation of N,N-dimethylsulfamide-
containing waters: bromide catalysis. Environmental Science and Technology,
44(15), 5762−5768.
Vorob’ev-Desyatovskii, N.V., Ibragimova, R.I., Gordeev, S.K., Nikolaev, B.P., 2006.
Chemical processes on active carbon surface: A new example of nitrogen fixation.
Russian Journal of General Chemistry, 76(6), 946–954.
Walse, S.S., Mitch, W.A., 2008. Nitrosamine carcinogens also swim in chlorinated pools.
Environmental Science and Technology, 42(4), 1032–1037.
Weber, E.J., Spidle, D.L., Thorn, K.A., 1996. Covalent binding of aniline to humic
substances. 1. Kinetic studies. Environmental Science and Technology, 30(9),
2755-2763.
Wilczak, A., Assadi-Rad, A., Lai, H.H., Hoover, L.L., Smith, J.F., Berger, R., Rodigari,
F., Beland, J.W., Lazzelle, L.J., Kincannon, E.G., Baker, H., Heaney, C.T., 2003.
Formation of NDMA in chloraminated water coagulated with DADMAC cationic
polymer. Journal of the American Water Works Association, 95(9), 94-106.
Xu, B., Ye, T., Li, D.P., Hu, C.-Y., Lin, Y.-L., Xia, S.J., Tian, F.-X., Gao, N.Y., 2011.
Measurement of dissolved organic nitrogen in a drinking water treatment plant:
size fraction, fate, and relation to water quality parameters. Science of the Total
Environment, 409(6), 1116–1122.
197
Yang, L., Chen, Z.L., Shen, J.M., Xu, Z.Z., Liang, H., Tian, J.Y., Ben, Y., Zhai, X., Shi,
W.X., Li, G.B., 2009. Reinvestigation of the nitrosamine-formation mechanism
during ozonation. Environmental Science and Technology, 43(14), 5481-5487.
Zamyadi. A., Ho., L., Newcombe G., Daly, R.I., Burch, M., Baker, P., Prevost, M., 2010.
Release and oxidation of cell-bound saxitoxins during chlorination of Anabaena
circinalis cells. Environmental Science and Technology, 44(23), 9055–9061.