THE EFFECTS OF AFFORESTATION - Göteborgs … · THE EFFECTS OF AFFORESTATION ... problemas com a...
65
EARTH SCIENCES CENTRE GÖTEBORG UNIVERSITY B332 2002 THE EFFECTS OF AFFORESTATION – a minor field study of climate, soil, land use and socio-economy in two small areas on Santiago Island, Cape Verde Jonna Eklund Anders Kronhamn Department of Physical Geography GÖTEBORG 2002
Transcript of THE EFFECTS OF AFFORESTATION - Göteborgs … · THE EFFECTS OF AFFORESTATION ... problemas com a...
EARTH SCIENCES CENTREGÖTEBORG UNIVERSITYB332 2002
THE EFFECTS OF AFFORESTATION– a minor field study of climate, soil, land use and
socio-economy in two small areas on Santiago Island, Cape Verde
Jonna EklundAnders Kronhamn
Department of Physical GeographyGÖTEBORG 2002

GÖTEBORGS UNIVERSITETInstitutionen för geovetenskaperNaturgeografiGeovetarcentrum
THE EFFECTS OF AFFORESTATION– a minor field study of climate, soil, land use and
socio-economy in two small areas on Santiago Island, Cape Verde
Jonna EklundAnders Kronhamn
ISSN 1400-3821 B332 Projketarabete
Göteborg 2002
Postadress Besöksadress Telefo Telfax Earth SciencesCentre Geovetarcentrum Geovetarcentrum 031-773 19 51 031-773 19 86 Göteborg UniversityS-405 30 Göteborg Guldhedsgatan 5A S-405 30 Göteborg
SWEDEN

AbstractThe Republic of Cape Verde consists of 14 islands and is an extension of the Sahelian climatic zone. The fragileecosystem was disrupted when the Portuguese colonised the islands in 1462. Records of droughts date back to 1719.The steep slopes on the mountainous islands give a strong orographic effect with few, but intense, precipitationevents. The problems with land degradation led to large afforestation programmes which started after independencein 1975 with finanicial support from abroad. Since 53% of Cape Verdes’ approximately 408,000 inhabitants areoccupied with agriculture, it is important to stop the land degrading processes through restorative measures.
The ITCZ brings rain to Cape Verde and precipitation varies radically from year to year. The statistical analysiscomparing Cape Verde with Sahel show decreasing precipitation trends in all stations. The stations within Santiagoshow great variability in the amount of precipitations and also in the number of events.
Two small areas, Sao Goncalo in Ribeira Sao Joao on the west side of Santiago and Poilao in Ribeira Seca on the eastside, were investigated during May and June in 2001. Interpretation of aerial photographs and maps and soil analysiswere conducted at INIDA, Sao Jorge dos Orgaos.
The mean annual precipitation (1961-2001) in Sao Jorge dos Orgaos (350 masl) is 449 mm and in Sao Francisco (100masl) 196 mm. The effects of ENSO (El Niño Southern Oscillation) on precipitation in Cape Verde appears to beweak. A sheltering effect of the trees on micro-climatic conditions in the afforested areas, measured throughtemperature and dew point temperature in transects, is not seen, but the sheltering effects are visible beneath thetrees.
The soils in both areas are mainly entisols and inceptisols. These soils are arable when sufficient plant nutrients,water and erosion control are provided. The organic matter content increases with increasing vegetation cover inboth areas. 54% of the land in Sao Goncalo and 12% in Poilao have been afforested since 1979. All interviewees arepositive to the afforestation programmes. Previously, restorative work was an important source of income during thedriest season every year, but the decrease in financial support has lead to great problems. The island faces a future ofdegrading processes if nothing is done.
SumárioA República de Cabo Verde é constituída por 14 ilhas e é uma extensão da zona climática do Sahel. O frágilecossistema foi rompido pela colonização portuguesa em 1462. Registos de secas datam de 1719. As íngremesinclinações nas ilhas montanhosas produzem um forte efeito orográfico com precipitações raras mas intensas. Osproblemas com a degradação das terras conduziram a grandes programas de reflorestamento que começaram logoapós a independência em 1975, com apoios financeiros exteriores. Uma vez que 53% dos cabo-verdianos, cerca de408.000 habitantes, têm como ocupação principal a agricultura, é importante acabar com o processo de degradaçãoatravés de medidas construtivas.
O ITCZ traz chuvas para Cabo Verde e a precipitação é extremamente variável de ano para ano. A análise estatísticaque compara Cabo Verde com o Sahel mostra tendências de diminuição da precipitação em todas as estações. Asestações em Santiago mostram grande variabilidade na quantidade de precipatação e igualmente no número deocorrências. Duas pequenas áreas, São Gonçalo, na Ribeira de São João no lado oeste de Santiago, e Poilão, naRibeira Seca no lado leste da mesma ilha, foram estudadas entre Maio e Junho de 2001. A interpretação dasfotografias, mapas e análise de solos foram feitos pelo INIDA, em São Jorge dos Orgãos.
A precipitação média anual (1961-2001) em São Jorge dos Orgãos (350 masl) é de 449 mm e em São Francisco (100masl) de 196 mm. Os efeitos do ENSO (Oscilação Setentrional do El Niño) sobre a precipitação em Cabo Verdeparecem fracos. O efeito de protecção das árvores em condições micro-climáticas nas áreas reflorestadas, medidoatravés da temperatura e da temperatura de ponto de condensação em transecto, não é assinalável, mas os efeitos deprotecção são visíveis sob as árvores.
Os solos em ambas as áreas são principalmente "entisols" e "inceptisols". Estes solos são aráveis quando o fornecimentode nutrientes e de água às plantas e o controlo da erosão são suficientes. O conteúdo em matéria orgânica aumentacom aumento da cobertura de vegetação em ambas as áreas. 54% da terra em São Gonçalo e 12% em Poilão foramreflorestadas desde 1979. Todos os entrevistados estão de acordo com os programas de reflorestamento. O trabalhode reflorestamento tem sido, em cada ano, uma fonte de rendimento importante durante a estação mais seca, masdesde que o apoio financeiro diminuiu existem grandes problemas. A ilha enfrenta de novo um futuro de degradaçãose nada for feito.

2

3
ForewordThis thesis is written by two authors, and has therefore been divided into separate parts. JonnaEklund has the main responsibility for collecting data, analysing and writing the parts concerningsoil and land use. Anders Kronhamn has the main responsibilty for collecting statisticalinformation, field observations and writing the parts concerning climate. The parts concerningsocio-economy have been analysed and written by both authors.
4
Abbreviations
DGASP Direccão Geral Agricultura e Pecuaria (General Administration for
Agriculture Forestry and Livestock)
ENSO El Niño Southern Oscillation
FAIMO Frentes de Alta Intensidade de Mão Obra (High Labor Intensive Front)
INGRH Instituto Nacional de Gestão de Recursos Hidricos (National Institute for
Water Resources Management)
INIDA Instituto Nacional de Investigacão e Desenvolvimento Agrario (National
Research Institute for Agriculture and Rural Development)
ITCZ Inter Tropical Convergense Zone
5
1. INTRODUCTION...............................................................................................................................................................7
PURPOSE.................................................................................................................................................................................. 8DEFINING LAND DEGRADATION........................................................................................................................................... 9
Land degradation - climate .......................................................................................................................................... 10Land degradation - soil and land use......................................................................................................................... 11Land degradation – Cape Verde.................................................................................................................................. 11
QUESTIONS............................................................................................................................................................................ 12
2. THE CAPE VERDE ISLANDS ....................................................................................................................................13
GEOLOGY AND TOPOGRAPHY ............................................................................................................................................ 13CLIMATE ............................................................................................................................................................................... 14
Agro-climatological zones on Santiago ..................................................................................................................... 15SOILS AND LANDUSE ........................................................................................................................................................... 15
Soil and Water Conservation (SWC) structures ....................................................................................................... 17
3. METHODS .........................................................................................................................................................................18
INVESTIGATED AREA ........................................................................................................................................................... 18CLIMATE ............................................................................................................................................................................... 19
Statistical analysis.......................................................................................................................................................... 19Field observations.......................................................................................................................................................... 19
SOIL AND LANDUSE ............................................................................................................................................................. 19Interpretation of aerial photographs and maps........................................................................................................ 19Field observations.......................................................................................................................................................... 19Soil samples..................................................................................................................................................................... 20
SOCIO-ECONOMY................................................................................................................................................................. 21Interviews......................................................................................................................................................................... 21
SOURCES OF ERROR............................................................................................................................................................. 22Micro-climate.................................................................................................................................................................. 22Soil and land use ............................................................................................................................................................ 22Socio-economy ................................................................................................................................................................ 22
4. RESULTS ............................................................................................................................................................................23
A DESCRIPTION OF THE INVESTIGATED AREAS................................................................................................................ 23CLIMATE - CAPE VERDE AND MAINLAND SAHEL........................................................................................................... 23REGIONAL CLIMATE ............................................................................................................................................................ 29CONNECTIONS TO EL NIÑO ................................................................................................................................................ 33LAND USE .............................................................................................................................................................................. 34
West area - São Gonçalo .............................................................................................................................................. 35East area Poilão ............................................................................................................................................................. 37
SOILS...................................................................................................................................................................................... 38West area - São Gonçalo .............................................................................................................................................. 39East area - Poilão .......................................................................................................................................................... 41Field observations.......................................................................................................................................................... 42Soil and water conservation......................................................................................................................................... 42
MICRO-CLIMATE.................................................................................................................................................................. 43West area - São Gonçalo .............................................................................................................................................. 43East area - Poilão .......................................................................................................................................................... 44
FARMERS PERCEPTION........................................................................................................................................................ 45SOCIO-ECONOMY................................................................................................................................................................. 46
Background questions................................................................................................................................................... 46Crops and irrigation ...................................................................................................................................................... 46West area - São Gonçalo .............................................................................................................................................. 47East area - Poilão .......................................................................................................................................................... 47Animals............................................................................................................................................................................. 47Afforestation and SWC .................................................................................................................................................. 48
CHAPTER SUMMARY............................................................................................................................................................ 49Climate............................................................................................................................................................................. 49Soil and land use ............................................................................................................................................................ 49Socio-economy ................................................................................................................................................................ 49
6
5. DISCUSSION.....................................................................................................................................................................50
CLIMATE ............................................................................................................................................................................... 50CONNECTIONS TO ENSO..................................................................................................................................................... 52LAND USE .............................................................................................................................................................................. 52
Soils .................................................................................................................................................................................. 53MICRO-CLIMATE.................................................................................................................................................................. 55SOCIO ECONOMY.................................................................................................................................................................. 56CLOSING REMARKS.............................................................................................................................................................. 57
6. CONCLUSIONS ...............................................................................................................................................................58
ACKNOWLEDGEMENTS ................................................................................................................................................59
REFERENCES.......................................................................................................................................................................60
INTERNET REFERENCES...................................................................................................................................................... 61MAPS AND AERIAL PHOTOGRAPHS..................................................................................................................................... 61
7
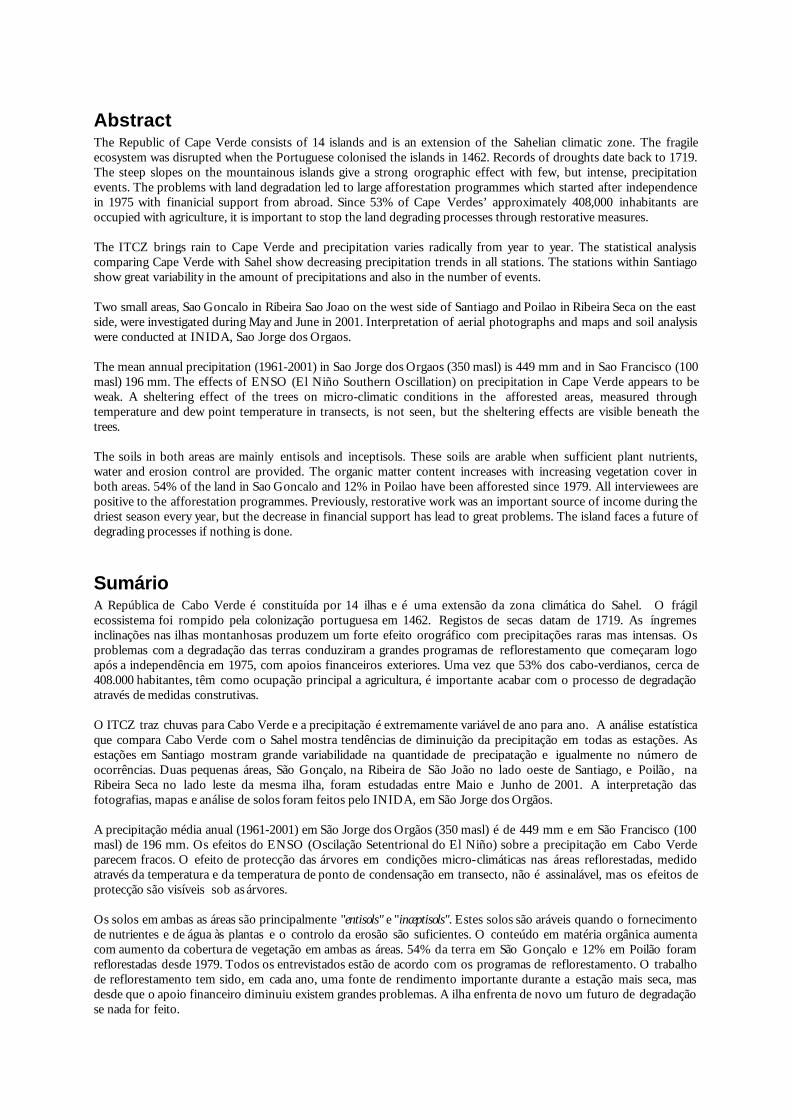
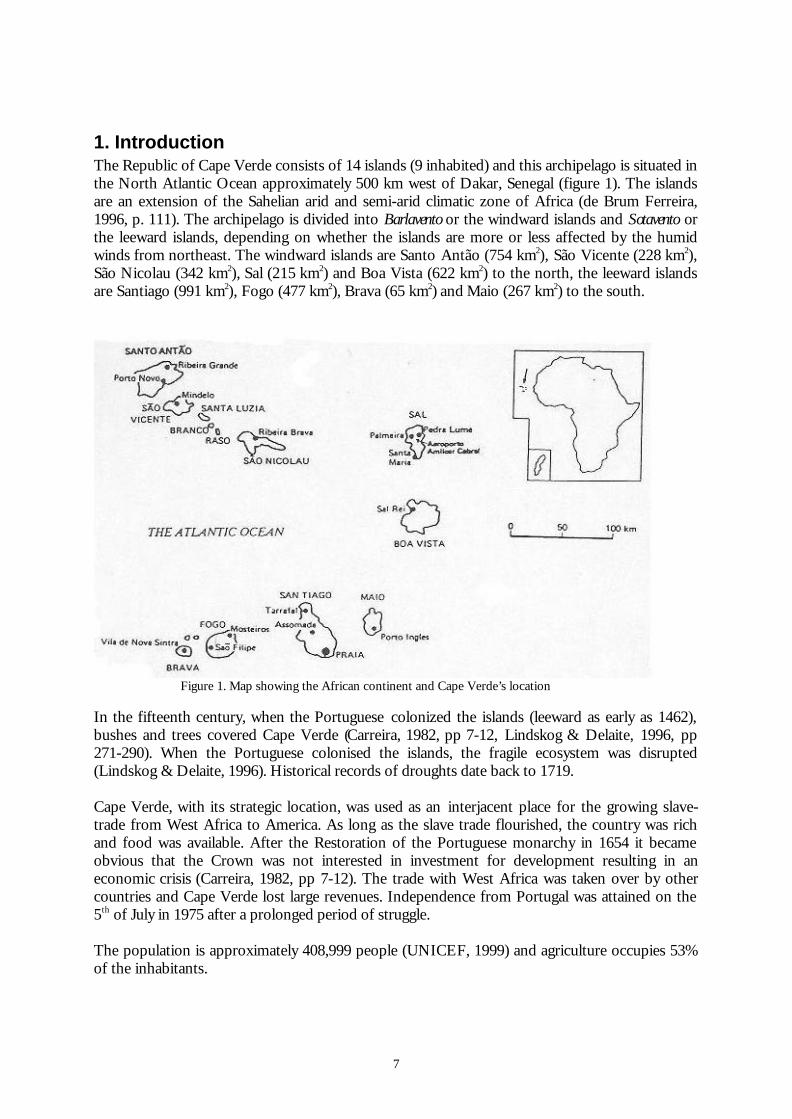
1. IntroductionThe Republic of Cape Verde consists of 14 islands (9 inhabited) and this archipelago is situated inthe North Atlantic Ocean approximately 500 km west of Dakar, Senegal (figure 1). The islandsare an extension of the Sahelian arid and semi-arid climatic zone of Africa (de Brum Ferreira,1996, p. 111). The archipelago is divided into Barlavento or the windward islands and Sotavento orthe leeward islands, depending on whether the islands are more or less affected by the humidwinds from northeast. The windward islands are Santo Antão (754 km2), São Vicente (228 km2),São Nicolau (342 km2), Sal (215 km2) and Boa Vista (622 km2) to the north, the leeward islandsare Santiago (991 km2), Fogo (477 km2), Brava (65 km2) and Maio (267 km2) to the south.
Figure 1. Map showing the African continent and Cape Verde’s location
In the fifteenth century, when the Portuguese colonized the islands (leeward as early as 1462),bushes and trees covered Cape Verde (Carreira, 1982, pp 7-12, Lindskog & Delaite, 1996, pp271-290). When the Portuguese colonised the islands, the fragile ecosystem was disrupted(Lindskog & Delaite, 1996). Historical records of droughts date back to 1719.
Cape Verde, with its strategic location, was used as an interjacent place for the growing slave-trade from West Africa to America. As long as the slave trade flourished, the country was richand food was available. After the Restoration of the Portuguese monarchy in 1654 it becameobvious that the Crown was not interested in investment for development resulting in aneconomic crisis (Carreira, 1982, pp 7-12). The trade with West Africa was taken over by othercountries and Cape Verde lost large revenues. Independence from Portugal was attained on the5th of July in 1975 after a prolonged period of struggle.
The population is approximately 408,999 people (UNICEF, 1999) and agriculture occupies 53%of the inhabitants.
8
The mountainous islands have steep slopes creating a strong orographic effect with few, butintense, precipitation events (Mannaerts, 2000). The disruption of the ecosystem in combinationwith the intense rain led to increasing land degradation (see definition below). The volcanic soilsof Cape Verde need to be covered to prevent erosion, and afforestation programmes haveimproved the situation over a period of only 15 years (deBrum Ferreira, 1996).
PurposeThe purpose of this study is to investigate the effects of the afforestation programme throughclimatic studies (statistics and field measurements), soil and land use studies (field studies andmapping) and interviews with people in two small areas on Santiago Island, Cape Verde. Oneimportant reason for afforestation is the worldwide problem with land degradation (definitionbelow). The disruption of the fragile ecosystem in Cape Verde has lead to many differentrestorative measures after 1975 to prevent the situation from deteriorating further.
9
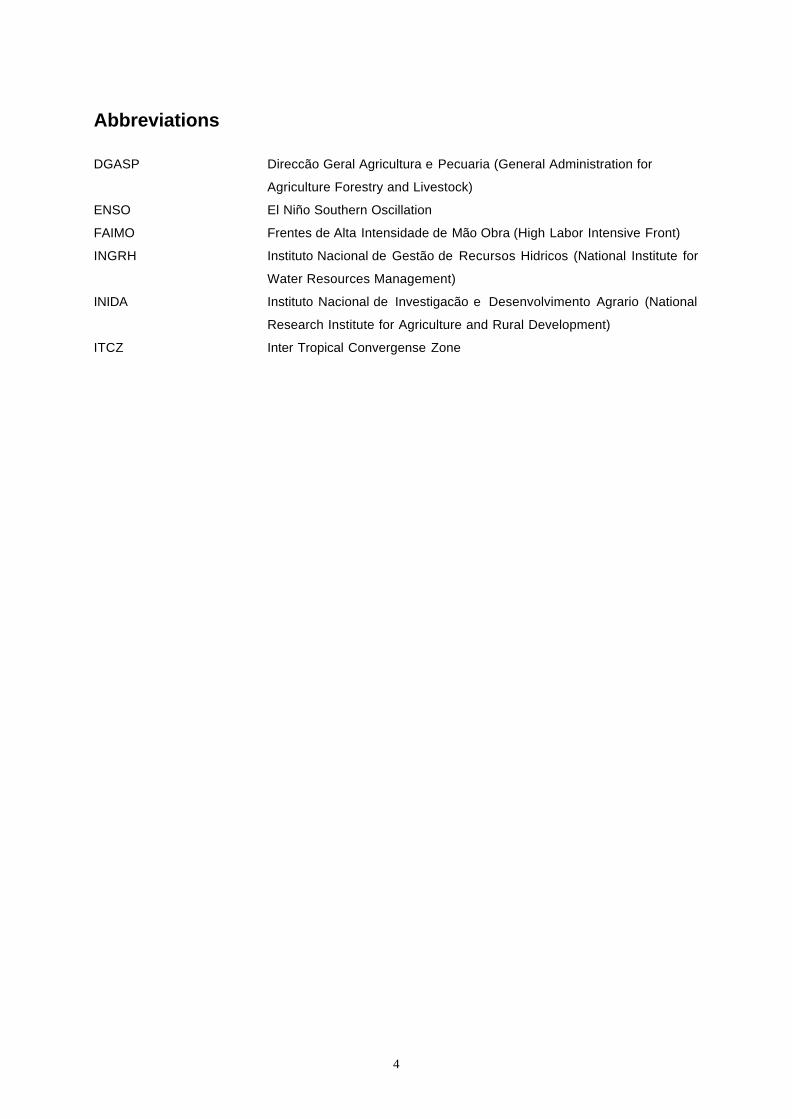
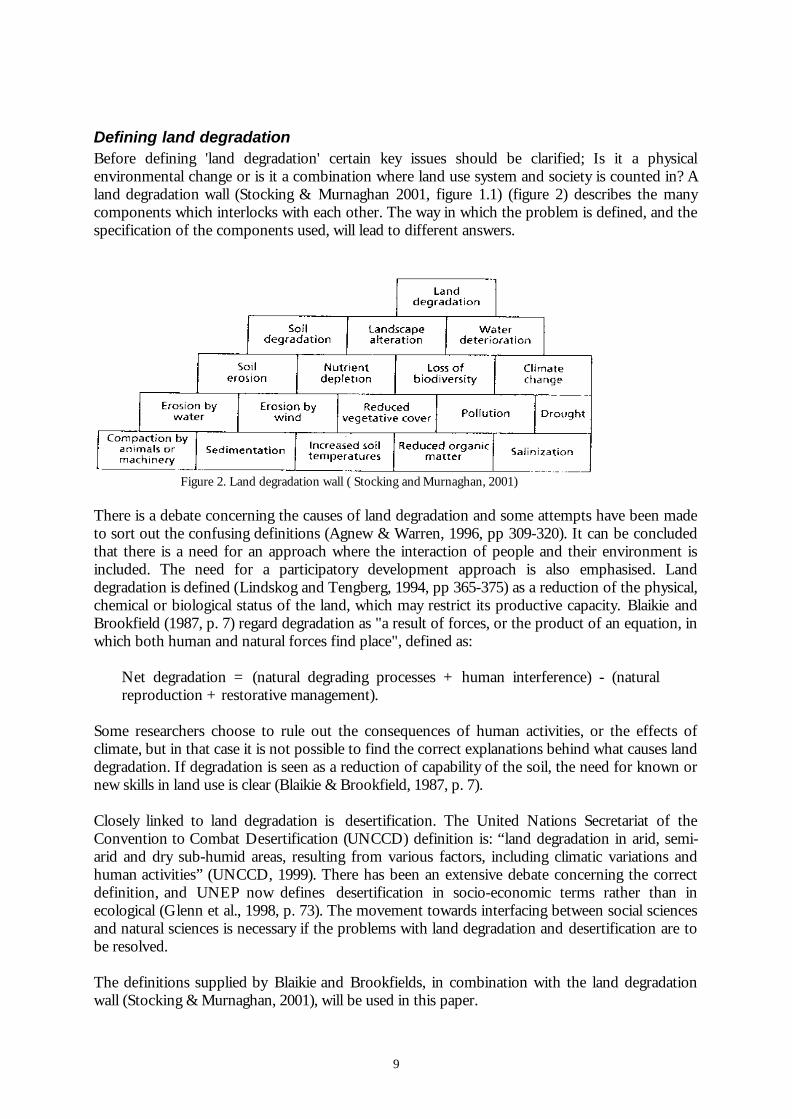
Defining land degradationBefore defining 'land degradation' certain key issues should be clarified; Is it a physicalenvironmental change or is it a combination where land use system and society is counted in? Aland degradation wall (Stocking & Murnaghan 2001, figure 1.1) (figure 2) describes the manycomponents which interlocks with each other. The way in which the problem is defined, and thespecification of the components used, will lead to different answers.
Figure 2. Land degradation wall ( Stocking and Murnaghan, 2001)
There is a debate concerning the causes of land degradation and some attempts have been madeto sort out the confusing definitions (Agnew & Warren, 1996, pp 309-320). It can be concludedthat there is a need for an approach where the interaction of people and their environment isincluded. The need for a participatory development approach is also emphasised. Landdegradation is defined (Lindskog and Tengberg, 1994, pp 365-375) as a reduction of the physical,chemical or biological status of the land, which may restrict its productive capacity. Blaikie andBrookfield (1987, p. 7) regard degradation as "a result of forces, or the product of an equation, inwhich both human and natural forces find place", defined as:
Net degradation = (natural degrading processes + human interference) - (naturalreproduction + restorative management).
Some researchers choose to rule out the consequences of human activities, or the effects ofclimate, but in that case it is not possible to find the correct explanations behind what causes landdegradation. If degradation is seen as a reduction of capability of the soil, the need for known ornew skills in land use is clear (Blaikie & Brookfield, 1987, p. 7).
Closely linked to land degradation is desertification. The United Nations Secretariat of theConvention to Combat Desertification (UNCCD) definition is: “land degradation in arid, semi-arid and dry sub-humid areas, resulting from various factors, including climatic variations andhuman activities” (UNCCD, 1999). There has been an extensive debate concerning the correctdefinition, and UNEP now defines desertification in socio-economic terms rather than inecological (Glenn et al., 1998, p. 73). The movement towards interfacing between social sciencesand natural sciences is necessary if the problems with land degradation and desertification are tobe resolved.
The definitions supplied by Blaikie and Brookfields, in combination with the land degradationwall (Stocking & Murnaghan, 2001), will be used in this paper.
10
Land degradation - climateClimatic conditions are a major factor regulating land degradation, mainly through erosion bywater and wind. Investigations of the relationship between soil loss and climate show that erosionreaches a maximum in areas with an effective mean annual precipitation of 300 mm. Effectiveprecipitation is the precipitation required to produce a specific quantity of runoff under specifiedtemperature conditions. When precipitation totals fall below 300 mm, erosion increases asprecipitation increases. However, as a consequence of increasing precipitation, the vegetationcover also increases, resulting in better protection of the soil surface. At precipitation totals above300 mm, the protective effect of vegetation cover counteracts the erosive effect of greaterprecipitation, so that erosion decreases as precipitation increases (Morgan, 1995, p. 2). Theconsequences of soil erosion are soil loss, a breakdown of soil structure and a decline in organicmatter and nutrients. But erosion also reduces available soil moisture, resulting in more drought-prone conditions (Morgan, 1995, p. 1).
Climatic change will probably cause significant shifts in climate zones and as such will affect thesuitability of land for agricultural and other purposes (Glenn, et al., 1998, p. 77). The climaticchanges are already present, for example, in Sahel where prolonged droughts have beenpredominant in the last decades (Hulme, 2001). There are quite a few links between desiccationand ocean-atmosphere interaction and/or regional feedback processes involving land covercharacteristics (Hulme, 2001). These two explanations for the Sahelian desiccation are notmutually exclusive, but the discussion as to which force dominates still continues. The dominantSea Surface Temperature (SST) anomaly configuration associated with the Sahelian desiccationhas been the pattern whereby southern oceans are warmer and northern oceans are cooler thanaverage. This pattern has tended to persist during multi-year periods of Sahelian desiccation. Thisrelationship can account for a large part of the longer-term trend in Sahel precipitation withoutbeing able to account for any year-to-year variations. The year-to-year variability tends to be morerelated to SST anomaly patterns in the tropical Atlantic or associated with the El Niño SouthernOscillation (Nicholson & Kim, 1997).
The phenomena of El Niño Southern Oscillation (ENSO) has been shown to be an importantfactor influencing inter-annual precipitation variability in the low latitudes, but its influence overparts of Africa is still unclear. Several studies have confirmed a relationship between precipitationand ENSO in parts of eastern and southern Africa. In other parts of Africa no clear effects ofENSO on precipitation pattern exist (Nicholson & Kim, 1997). West Africa appears to be lesssensitive to ENSO events, compared to other low-latitude regions . However, West Africa mayexperience ENSO-related climatic impacts in the form of reduced south-west monsoonprecipitation amounts during exceptionally strong ENSO events. An example of this is the 1983ENSO event (McGregor & Nieuwolt, 1998, p. 108).
Micro-climatic conditions are often dependent on the physical setting of the local environment.A vegetated surface will have a micro-climate that is different from that of a non-vegetatedsurface. A forest has a different micro-climate than an open, non-vegetated surface. In a forest,air motion is weak, it is cooler and more humid (Oke, 1987, p. 153). This is because the trees of aforest produce a sheltering surface and the active surface is situated in the treetops. The daytimeair temperature and humidity will have their highest values at the level of maximum leaf area,where radiative absorption and transpiration provide the most heat and water vapour (Oke, 1987,p. 154). Hence the air temperature will be lower and the humidity higher in the forest than in thesurrounding open areas. The sheltering surface of the trees also protects the soil surface from theerosive effects of wind and precipitation, resulting in less erosion in wooded areas.
11
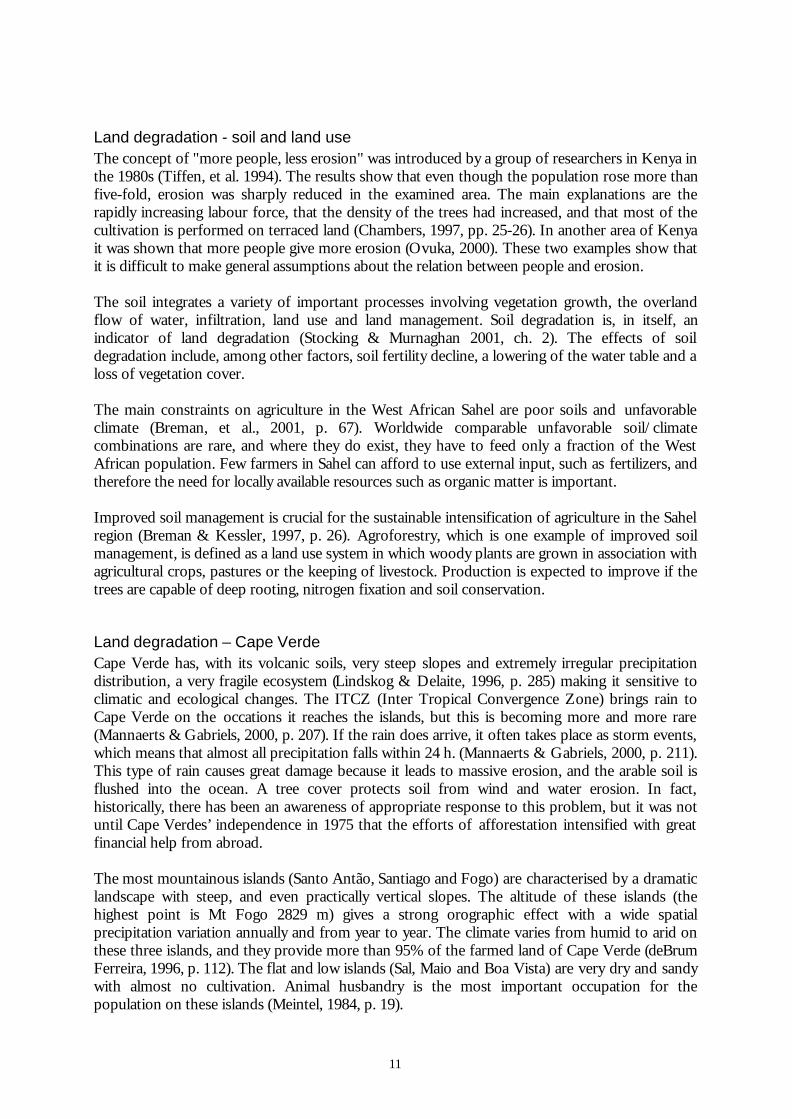
Land degradation - soil and land useThe concept of "more people, less erosion" was introduced by a group of researchers in Kenya inthe 1980s (Tiffen, et al. 1994). The results show that even though the population rose more thanfive-fold, erosion was sharply reduced in the examined area. The main explanations are therapidly increasing labour force, that the density of the trees had increased, and that most of thecultivation is performed on terraced land (Chambers, 1997, pp. 25-26). In another area of Kenyait was shown that more people give more erosion (Ovuka, 2000). These two examples show thatit is difficult to make general assumptions about the relation between people and erosion.
The soil integrates a variety of important processes involving vegetation growth, the overlandflow of water, infiltration, land use and land management. Soil degradation is, in itself, anindicator of land degradation (Stocking & Murnaghan 2001, ch. 2). The effects of soildegradation include, among other factors, soil fertility decline, a lowering of the water table and aloss of vegetation cover.
The main constraints on agriculture in the West African Sahel are poor soils and unfavorableclimate (Breman, et al., 2001, p. 67). Worldwide comparable unfavorable soil/climatecombinations are rare, and where they do exist, they have to feed only a fraction of the WestAfrican population. Few farmers in Sahel can afford to use external input, such as fertilizers, andtherefore the need for locally available resources such as organic matter is important.
Improved soil management is crucial for the sustainable intensification of agriculture in the Sahelregion (Breman & Kessler, 1997, p. 26). Agroforestry, which is one example of improved soilmanagement, is defined as a land use system in which woody plants are grown in association withagricultural crops, pastures or the keeping of livestock. Production is expected to improve if thetrees are capable of deep rooting, nitrogen fixation and soil conservation.
Land degradation – Cape VerdeCape Verde has, with its volcanic soils, very steep slopes and extremely irregular precipitationdistribution, a very fragile ecosystem (Lindskog & Delaite, 1996, p. 285) making it sensitive toclimatic and ecological changes. The ITCZ (Inter Tropical Convergence Zone) brings rain toCape Verde on the occations it reaches the islands, but this is becoming more and more rare(Mannaerts & Gabriels, 2000, p. 207). If the rain does arrive, it often takes place as storm events,which means that almost all precipitation falls within 24 h. (Mannaerts & Gabriels, 2000, p. 211).This type of rain causes great damage because it leads to massive erosion, and the arable soil isflushed into the ocean. A tree cover protects soil from wind and water erosion. In fact,historically, there has been an awareness of appropriate response to this problem, but it was notuntil Cape Verdes’ independence in 1975 that the efforts of afforestation intensified with greatfinancial help from abroad.
The most mountainous islands (Santo Antão, Santiago and Fogo) are characterised by a dramaticlandscape with steep, and even practically vertical slopes. The altitude of these islands (thehighest point is Mt Fogo 2829 m) gives a strong orographic effect with a wide spatialprecipitation variation annually and from year to year. The climate varies from humid to arid onthese three islands, and they provide more than 95% of the farmed land of Cape Verde (deBrumFerreira, 1996, p. 112). The flat and low islands (Sal, Maio and Boa Vista) are very dry and sandywith almost no cultivation. Animal husbandry is the most important occupation for thepopulation on these islands (Meintel, 1984, p. 19).
12
It is shown (deBrum Ferreira 1996, p. 123-124) that a minimal programme of agroecologicalrehabilitation, on farm level, improved the situation in Cape Verde over a period of 15 years.These projects have been financed from abroad (France, Belgium, FAO, USAID, etc) and thedonors are currently giving more aid to other countries, thus facing Cape Verde with a greatproblem. deBrum Ferreira writes "it would be ironic if it were necessary to reduce the effort,especially when the viability of Cape Verde depends on it" (1996. p. 124). Prevention of landdegradation is succeeded through cooperation with the farmers (Chambers, 1997). This strategyhas shown great results in afforestation and reforestation projects, which is a viable way toprevent land degradation.
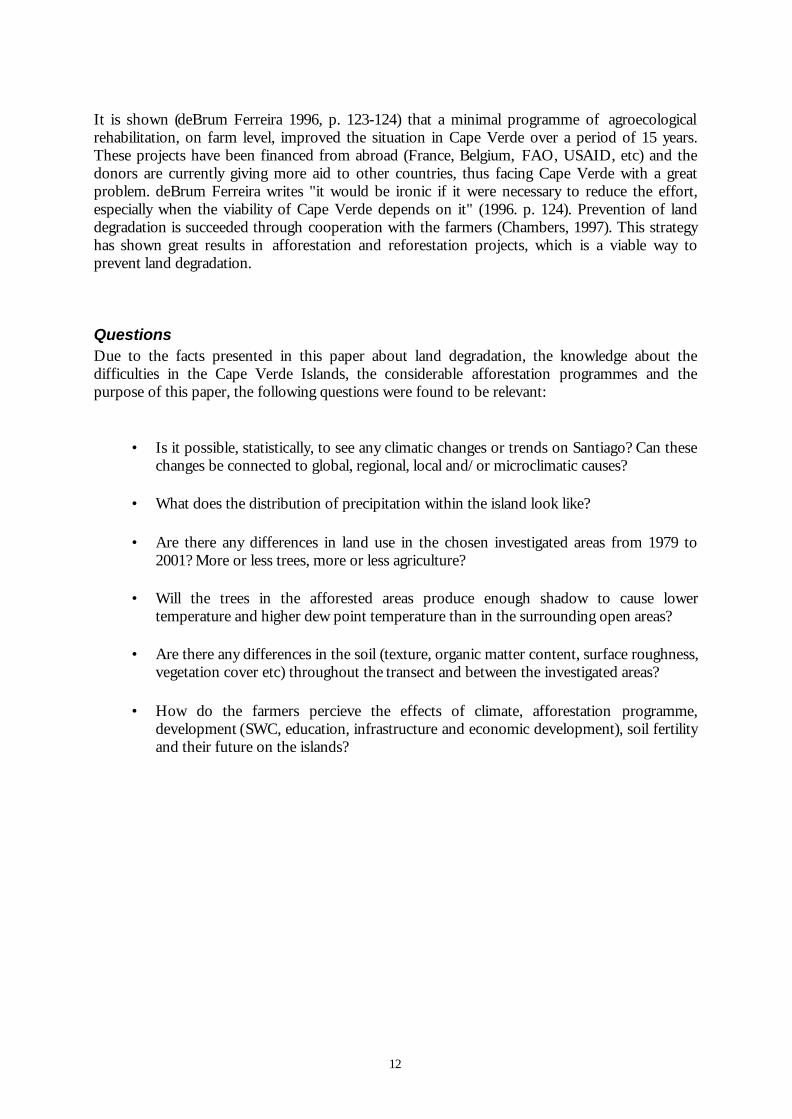
QuestionsDue to the facts presented in this paper about land degradation, the knowledge about thedifficulties in the Cape Verde Islands, the considerable afforestation programmes and thepurpose of this paper, the following questions were found to be relevant:
• Is it possible, statistically, to see any climatic changes or trends on Santiago? Can thesechanges be connected to global, regional, local and/or microclimatic causes?
• What does the distribution of precipitation within the island look like?
• Are there any differences in land use in the chosen investigated areas from 1979 to2001? More or less trees, more or less agriculture?
• Will the trees in the afforested areas produce enough shadow to cause lowertemperature and higher dew point temperature than in the surrounding open areas?
• Are there any differences in the soil (texture, organic matter content, surface roughness,vegetation cover etc) throughout the transect and between the investigated areas?
• How do the farmers percieve the effects of climate, afforestation programme,development (SWC, education, infrastructure and economic development), soil fertilityand their future on the islands?
13
2. The Cape Verde islands
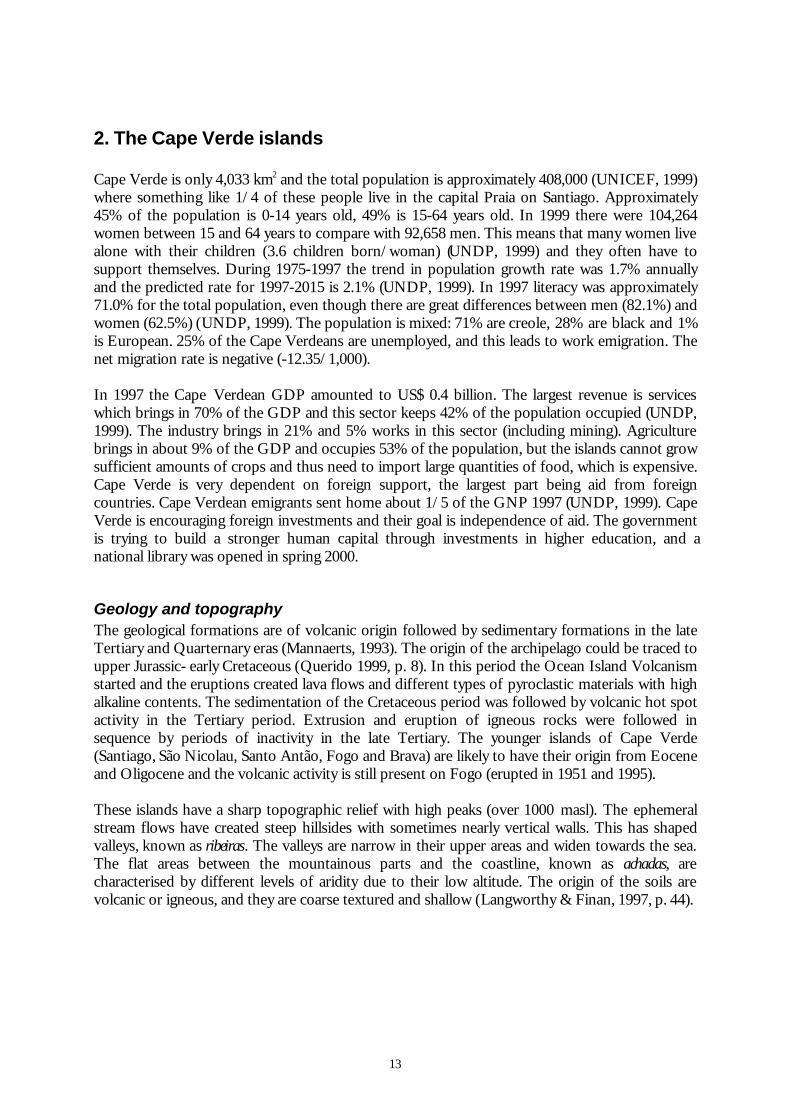
Cape Verde is only 4,033 km2 and the total population is approximately 408,000 (UNICEF, 1999)where something like 1/4 of these people live in the capital Praia on Santiago. Approximately45% of the population is 0-14 years old, 49% is 15-64 years old. In 1999 there were 104,264women between 15 and 64 years to compare with 92,658 men. This means that many women livealone with their children (3.6 children born/woman) (UNDP, 1999) and they often have tosupport themselves. During 1975-1997 the trend in population growth rate was 1.7% annuallyand the predicted rate for 1997-2015 is 2.1% (UNDP, 1999). In 1997 literacy was approximately71.0% for the total population, even though there are great differences between men (82.1%) andwomen (62.5%) (UNDP, 1999). The population is mixed: 71% are creole, 28% are black and 1%is European. 25% of the Cape Verdeans are unemployed, and this leads to work emigration. Thenet migration rate is negative (-12.35/1,000).
In 1997 the Cape Verdean GDP amounted to US$ 0.4 billion. The largest revenue is serviceswhich brings in 70% of the GDP and this sector keeps 42% of the population occupied (UNDP,1999). The industry brings in 21% and 5% works in this sector (including mining). Agriculturebrings in about 9% of the GDP and occupies 53% of the population, but the islands cannot growsufficient amounts of crops and thus need to import large quantities of food, which is expensive.Cape Verde is very dependent on foreign support, the largest part being aid from foreigncountries. Cape Verdean emigrants sent home about 1/5 of the GNP 1997 (UNDP, 1999). CapeVerde is encouraging foreign investments and their goal is independence of aid. The governmentis trying to build a stronger human capital through investments in higher education, and anational library was opened in spring 2000.
Geology and topographyThe geological formations are of volcanic origin followed by sedimentary formations in the lateTertiary and Quarternary eras (Mannaerts, 1993). The origin of the archipelago could be traced toupper Jurassic- early Cretaceous (Querido 1999, p. 8). In this period the Ocean Island Volcanismstarted and the eruptions created lava flows and different types of pyroclastic materials with highalkaline contents. The sedimentation of the Cretaceous period was followed by volcanic hot spotactivity in the Tertiary period. Extrusion and eruption of igneous rocks were followed insequence by periods of inactivity in the late Tertiary. The younger islands of Cape Verde(Santiago, São Nicolau, Santo Antão, Fogo and Brava) are likely to have their origin from Eoceneand Oligocene and the volcanic activity is still present on Fogo (erupted in 1951 and 1995).
These islands have a sharp topographic relief with high peaks (over 1000 masl). The ephemeralstream flows have created steep hillsides with sometimes nearly vertical walls. This has shapedvalleys, known as ribeiras. The valleys are narrow in their upper areas and widen towards the sea.The flat areas between the mountainous parts and the coastline, known as achadas, arecharacterised by different levels of aridity due to their low altitude. The origin of the soils arevolcanic or igneous, and they are coarse textured and shallow (Langworthy & Finan, 1997, p. 44).
14
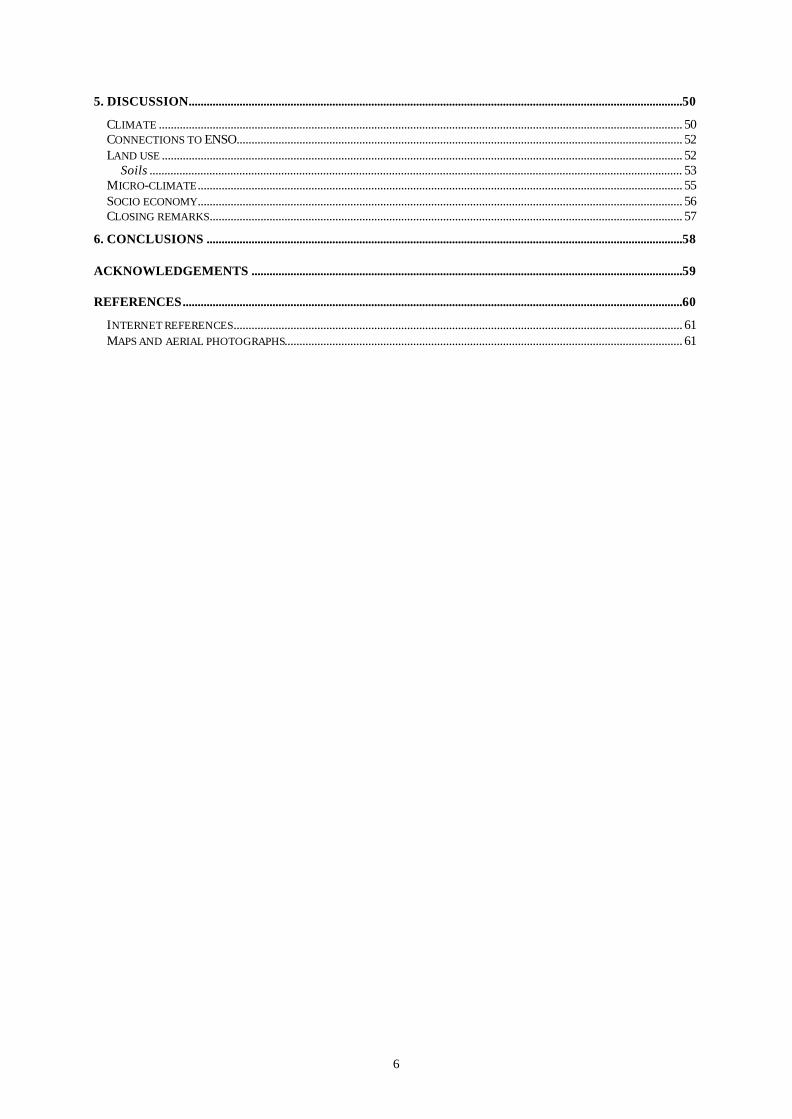
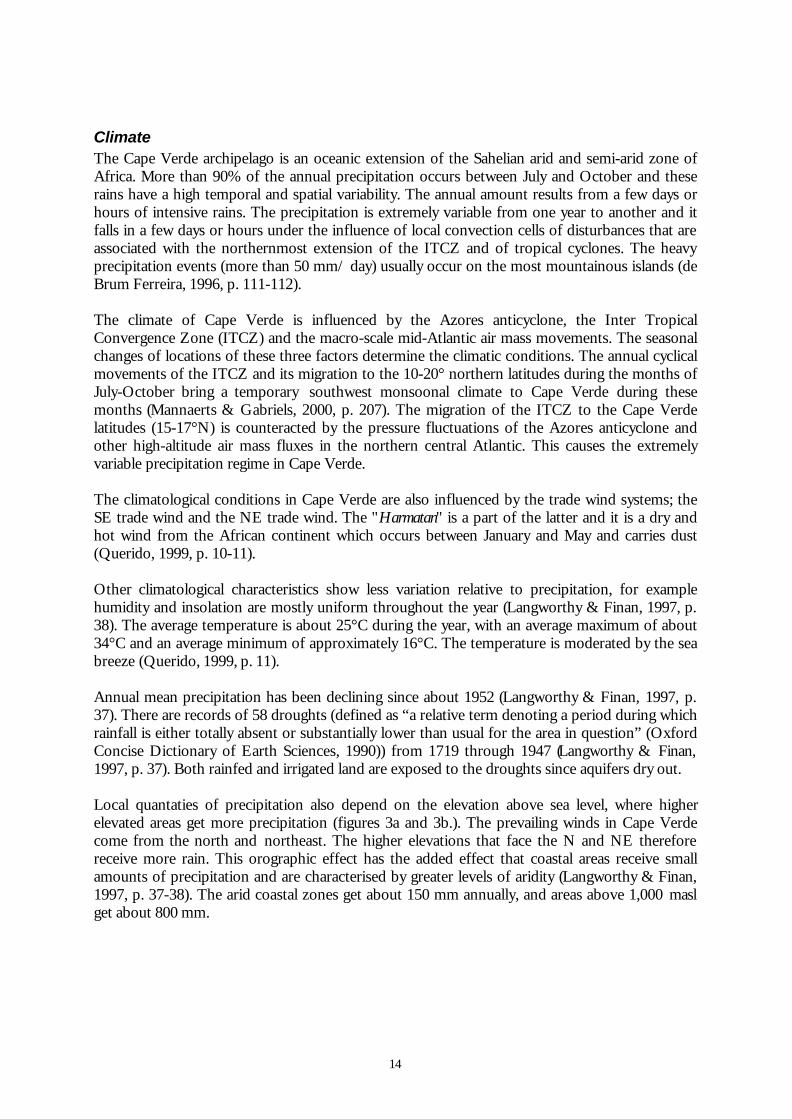
ClimateThe Cape Verde archipelago is an oceanic extension of the Sahelian arid and semi-arid zone ofAfrica. More than 90% of the annual precipitation occurs between July and October and theserains have a high temporal and spatial variability. The annual amount results from a few days orhours of intensive rains. The precipitation is extremely variable from one year to another and itfalls in a few days or hours under the influence of local convection cells of disturbances that areassociated with the northernmost extension of the ITCZ and of tropical cyclones. The heavyprecipitation events (more than 50 mm/ day) usually occur on the most mountainous islands (deBrum Ferreira, 1996, p. 111-112).
The climate of Cape Verde is influenced by the Azores anticyclone, the Inter TropicalConvergence Zone (ITCZ) and the macro-scale mid-Atlantic air mass movements. The seasonalchanges of locations of these three factors determine the climatic conditions. The annual cyclicalmovements of the ITCZ and its migration to the 10-20° northern latitudes during the months ofJuly-October bring a temporary southwest monsoonal climate to Cape Verde during thesemonths (Mannaerts & Gabriels, 2000, p. 207). The migration of the ITCZ to the Cape Verdelatitudes (15-17°N) is counteracted by the pressure fluctuations of the Azores anticyclone andother high-altitude air mass fluxes in the northern central Atlantic. This causes the extremelyvariable precipitation regime in Cape Verde.
The climatological conditions in Cape Verde are also influenced by the trade wind systems; theSE trade wind and the NE trade wind. The "Harmatan" is a part of the latter and it is a dry andhot wind from the African continent which occurs between January and May and carries dust(Querido, 1999, p. 10-11).
Other climatological characteristics show less variation relative to precipitation, for examplehumidity and insolation are mostly uniform throughout the year (Langworthy & Finan, 1997, p.38). The average temperature is about 25°C during the year, with an average maximum of about34°C and an average minimum of approximately 16°C. The temperature is moderated by the seabreeze (Querido, 1999, p. 11).
Annual mean precipitation has been declining since about 1952 (Langworthy & Finan, 1997, p.37). There are records of 58 droughts (defined as “a relative term denoting a period during whichrainfall is either totally absent or substantially lower than usual for the area in question” (OxfordConcise Dictionary of Earth Sciences, 1990)) from 1719 through 1947 (Langworthy & Finan,1997, p. 37). Both rainfed and irrigated land are exposed to the droughts since aquifers dry out.
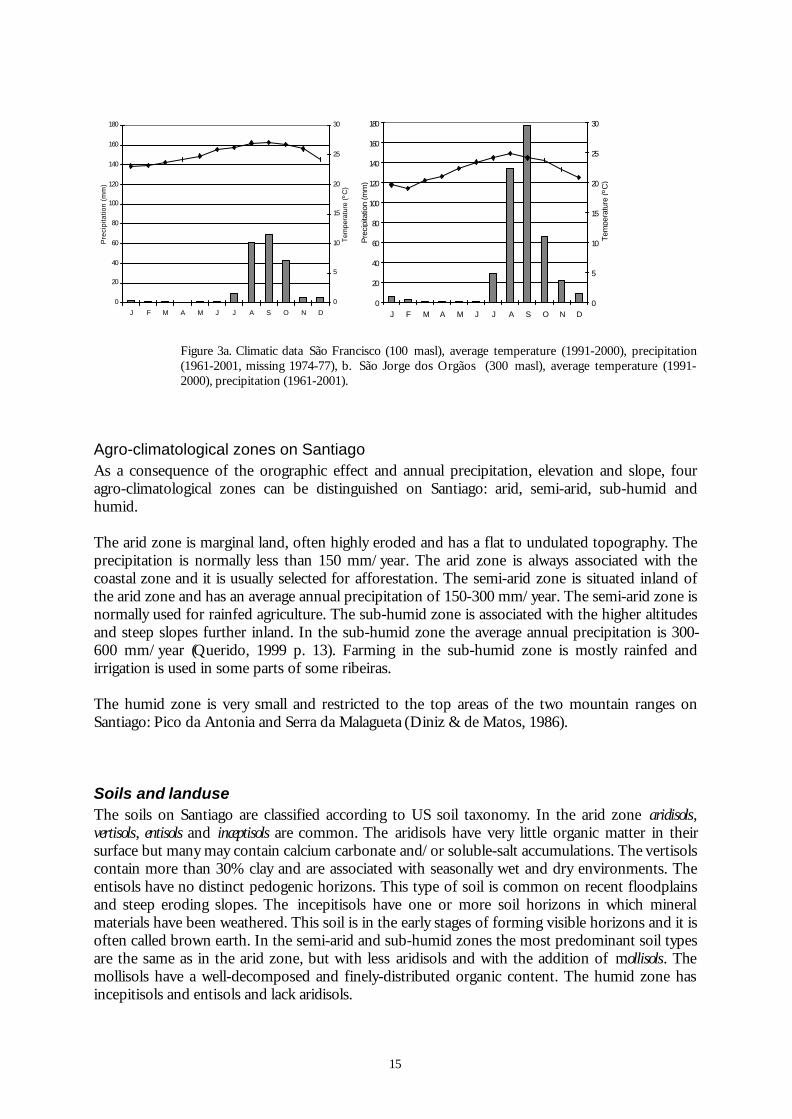
Local quantaties of precipitation also depend on the elevation above sea level, where higherelevated areas get more precipitation (figures 3a and 3b.). The prevailing winds in Cape Verdecome from the north and northeast. The higher elevations that face the N and NE thereforereceive more rain. This orographic effect has the added effect that coastal areas receive smallamounts of precipitation and are characterised by greater levels of aridity (Langworthy & Finan,1997, p. 37-38). The arid coastal zones get about 150 mm annually, and areas above 1,000 maslget about 800 mm.
15
0
20
40
60
80
100
120
140
160
180
J F M A M J J A S O N D
Pre
cipi
tatio
n (m
m)
0
5
10
15
20
25
30
Tem
pera
ture
(ºC
)
0
20
40
60
80
100
120
140
160
180
J F M A M J J A S O N D
Pre
cipi
tatio
n (m
m)
0
5
10
15
20
25
30
Tem
pera
ture
(ºC
)
Figure 3a. Climatic data São Francisco (100 masl), average temperature (1991-2000), precipitation(1961-2001, missing 1974-77), b. São Jorge dos Orgãos (300 masl), average temperature (1991-2000), precipitation (1961-2001).
Agro-climatological zones on SantiagoAs a consequence of the orographic effect and annual precipitation, elevation and slope, fouragro-climatological zones can be distinguished on Santiago: arid, semi-arid, sub-humid andhumid.
The arid zone is marginal land, often highly eroded and has a flat to undulated topography. Theprecipitation is normally less than 150 mm/year. The arid zone is always associated with thecoastal zone and it is usually selected for afforestation. The semi-arid zone is situated inland ofthe arid zone and has an average annual precipitation of 150-300 mm/year. The semi-arid zone isnormally used for rainfed agriculture. The sub-humid zone is associated with the higher altitudesand steep slopes further inland. In the sub-humid zone the average annual precipitation is 300-600 mm/year (Querido, 1999 p. 13). Farming in the sub-humid zone is mostly rainfed andirrigation is used in some parts of some ribeiras.
The humid zone is very small and restricted to the top areas of the two mountain ranges onSantiago: Pico da Antonia and Serra da Malagueta (Diniz & de Matos, 1986).
Soils and landuseThe soils on Santiago are classified according to US soil taxonomy. In the arid zone aridisols,vertisols, entisols and inceptisols are common. The aridisols have very little organic matter in theirsurface but many may contain calcium carbonate and/or soluble-salt accumulations. The vertisolscontain more than 30% clay and are associated with seasonally wet and dry environments. Theentisols have no distinct pedogenic horizons. This type of soil is common on recent floodplainsand steep eroding slopes. The incepitisols have one or more soil horizons in which mineralmaterials have been weathered. This soil is in the early stages of forming visible horizons and it isoften called brown earth. In the semi-arid and sub-humid zones the most predominant soil typesare the same as in the arid zone, but with less aridisols and with the addition of mollisols. Themollisols have a well-decomposed and finely-distributed organic content. The humid zone hasincepitisols and entisols and lack aridisols.
16
The mountain complexes are very fragile and need to be protected from erosion. One way toprevent soil erosion is to protect the heights with trees. The government of Cape Verde started alarge afforestation programme, with support from USAID, in 1975 and about 60,000 ha hadbeen afforested in 1991. The plantation was performed by work fronts - Frentes da AltaIntensidade de Mão-de-Obra (FAIMO), where the rural population, mostly women, did thework. The annual rate of afforestation (mainly Santiago and Santo Antao) between 1986-1990was 5,700 ha (Santiago received about 80 % or 4,560 ha). This was a big step towards landrestoration. Afforestation still continues, but not to the same extent as previously. Two regionsbenefit from the afforestation, both the mountainous parts of the islands in the valley heads andthe arid and semi-arid zones. The flat islands are generally very dry and not suitable foragriculture.
The early settlers cultivated African grains and root crops to support the subsistence economy.Around the end of the fifteenth century or the beginning of the sixteenth century, maize wasintroduced from America (Carreira, 1982, pp 6-7). Today maize and beans are the most grownsubsistence crops. Agriculture occupies an important position in the Cape Verdean economyeven though these crops only cover 20 to 40% of the national consumption (Baptista, 1996, p. 4).The Portuguese land-owning system has lead to a concentrated ownership structure on Santiagoand Fogo. This means that a small number of farmers own most of the arable land (Langworthy& Finan, 1997, pp 57-58). About 40,000 ha is cultivated and 5% of this area is irrigated, the rest isnonirrigated or rainfed land. Santiago is the largest producer of food crops.
The agricultural cycle begins in June or July. Since Cape Verde has a constant lack of water it isimportant for the farmers to use the available moisture as much as possible and therefore theyeliminate any vegetation covers during the critical stages. They also use maize and bean straw asfodder, which means that little organic material is mixed into the soil. The combination of theremoval of vegetation cover, and the fact that goats graze any shrubs available has largelycontributed to soil erosion and degradation (Baptista, 1996, ch. 2, p. 4).
Farmers prepare the soils by removing most vegetation from their fields and some burn it justbefore the rains come. The seeding practices vary from area to area; in some areas seeding occursbefore the initial precipitation and in others seeding is done after the first precipitation. Most ofthe agriculture is low-input farming of subsistence crops (Baptista, 1996), and even though theharvest continuously fails, farmers intercrop 4 seeds of maize with 2-3 seeds of beans every yearon their stony fields (Querido, 1999, p.15)
The largest cause of soil erosion is the high-velocity flooding which moves not only topsoil butalso coarser material (even boulders) downstream (Langworthy & Finan, 1997, pp 47). When thesheet wash declines it changes from continuous layer flow into subdivided rill wash (Cook, et al.,1993, pp 198). Along with sheet wash another important factor is wind erosion.
17
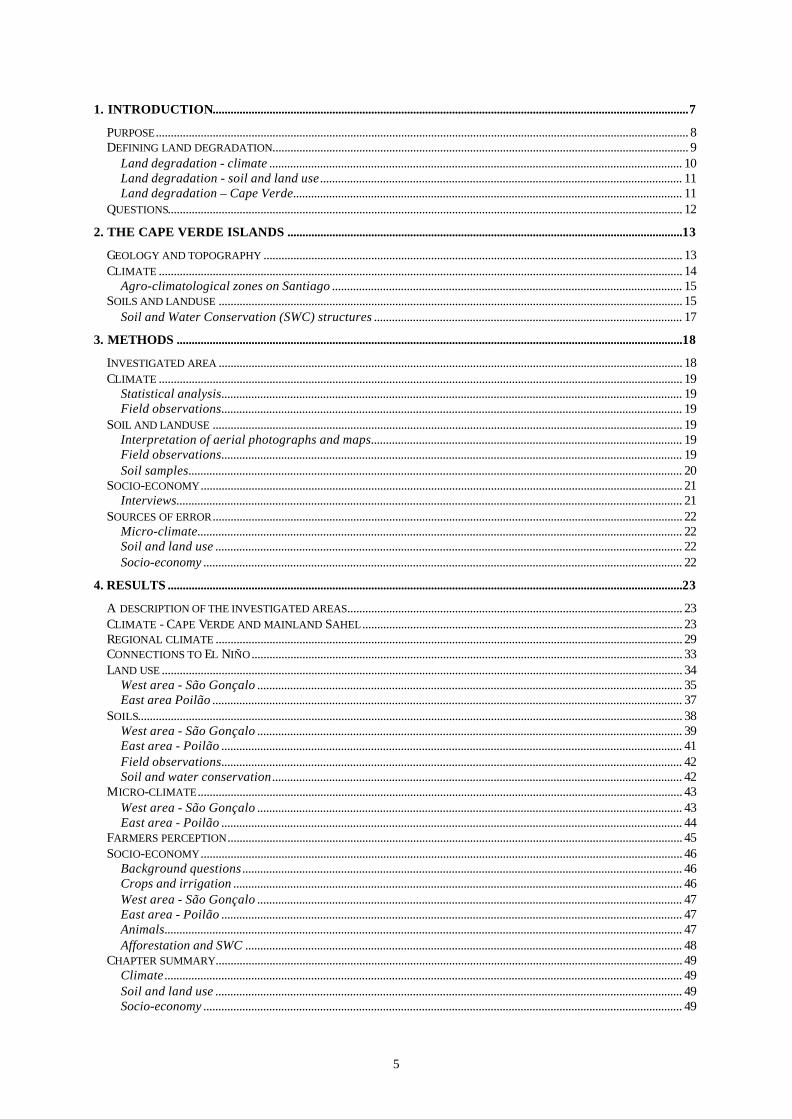
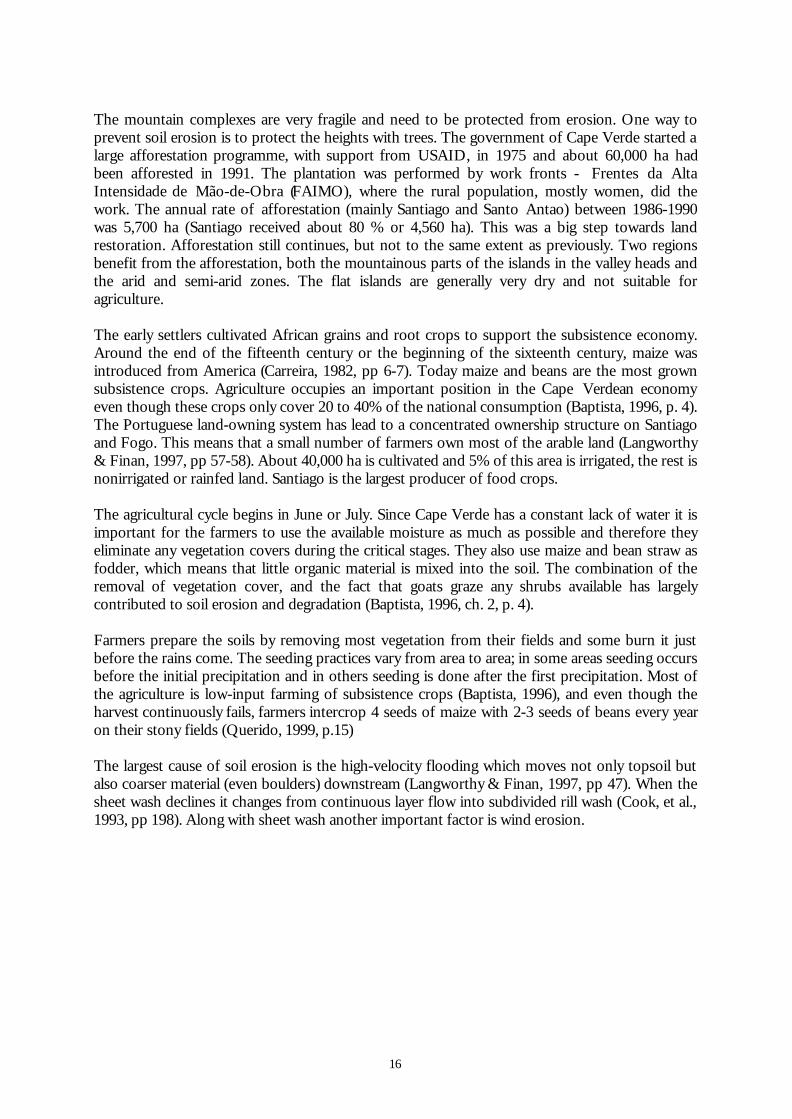
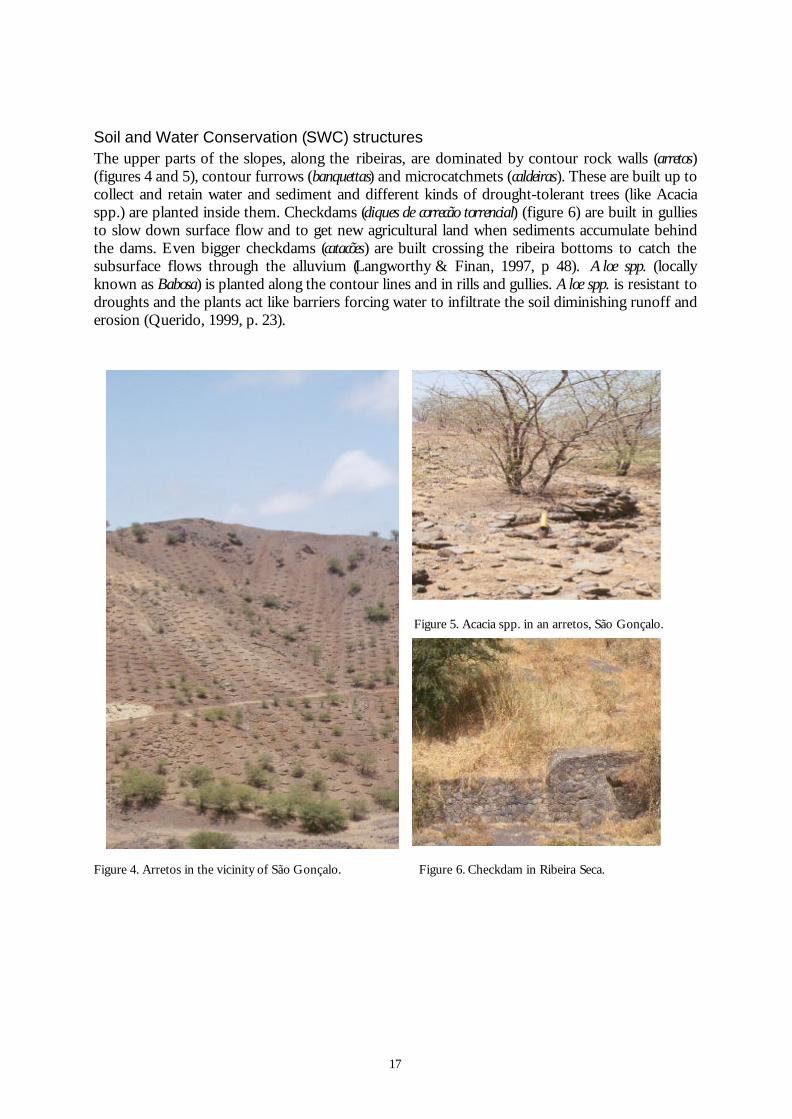
Soil and Water Conservation (SWC) structuresThe upper parts of the slopes, along the ribeiras, are dominated by contour rock walls (arretos)(figures 4 and 5), contour furrows (banquettas) and microcatchmets (caldeiras). These are built up tocollect and retain water and sediment and different kinds of drought-tolerant trees (like Acaciaspp.) are planted inside them. Checkdams (diques de correcão torrencial) (figure 6) are built in gulliesto slow down surface flow and to get new agricultural land when sediments accumulate behindthe dams. Even bigger checkdams (catacões) are built crossing the ribeira bottoms to catch thesubsurface flows through the alluvium (Langworthy & Finan, 1997, p 48). Aloe spp. (locallyknown as Babosa) is planted along the contour lines and in rills and gullies. Aloe spp. is resistant todroughts and the plants act like barriers forcing water to infiltrate the soil diminishing runoff anderosion (Querido, 1999, p. 23).
Figure 5. Acacia spp. in an arretos, São Gonçalo.
Figure 4. Arretos in the vicinity of São Gonçalo. Figure 6. Checkdam in Ribeira Seca.
18
3. Methods
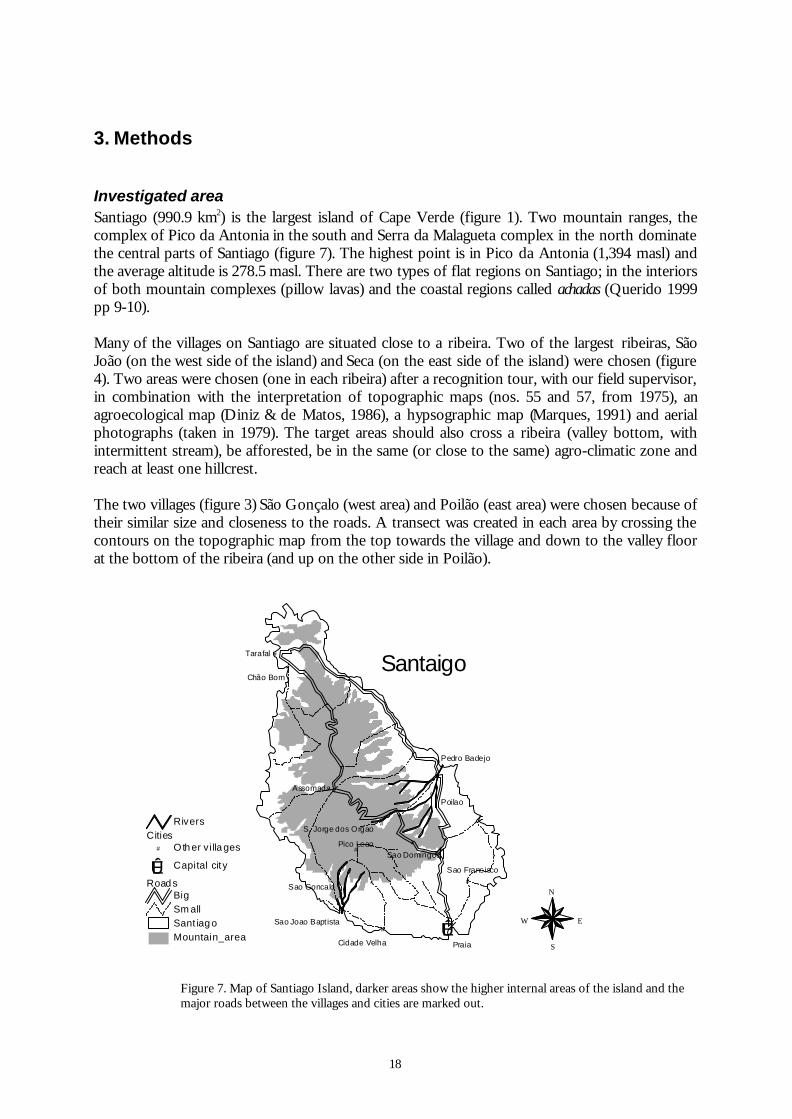
Investigated areaSantiago (990.9 km2) is the largest island of Cape Verde (figure 1). Two mountain ranges, thecomplex of Pico da Antonia in the south and Serra da Malagueta complex in the north dominatethe central parts of Santiago (figure 7). The highest point is in Pico da Antonia (1,394 masl) andthe average altitude is 278.5 masl. There are two types of flat regions on Santiago; in the interiorsof both mountain complexes (pillow lavas) and the coastal regions called achadas (Querido 1999pp 9-10).
Many of the villages on Santiago are situated close to a ribeira. Two of the largest ribeiras, SãoJoão (on the west side of the island) and Seca (on the east side of the island) were chosen (figure4). Two areas were chosen (one in each ribeira) after a recognition tour, with our field supervisor,in combination with the interpretation of topographic maps (nos. 55 and 57, from 1975), anagroecological map (Diniz & de Matos, 1986), a hypsographic map (Marques, 1991) and aerialphotographs (taken in 1979). The target areas should also cross a ribeira (valley bottom, withintermittent stream), be afforested, be in the same (or close to the same) agro-climatic zone andreach at least one hillcrest.
The two villages (figure 3) São Gonçalo (west area) and Poilão (east area) were chosen because oftheir similar size and closeness to the roads. A transect was created in each area by crossing thecontours on the topographic map from the top towards the village and down to the valley floorat the bottom of the ribeira (and up on the other side in Poilão).
Figure 7. Map of Santiago Island, darker areas show the higher internal areas of the island and themajor roads between the villages and cities are marked out.
ÊÚ
#
#
#
#
#
#
#
#
#
#
#
#
Praia
Poilao
Tarafal
Assomada
Chão Bom
Pico Leao
Sao Goncalo
Sao Domingos
Cidade Velha
Pedro Badejo
Sao Frans isco
Sao Joao Bapt ista
S. Jorge dos Orgao
Mountain_areaSant iag o
Road sBigSm all
Cities# Oth er v illa ges
ÊÚ Capital cit y
Rivers
N
EW
S
Santaigo
19
Climate
Statistical analysisThe precipitation data for the stations in mainland Sahel, Praia and São Vicente were collectedfrom the Global Historical Climatology Network (GHCN) (www.cdiac.esd.ornl.gov /ghcn/ghcn.html) where the time series stretched as far back as around the 1860s at the most, up to2000. The data for São Jorge dos Orgãos and São Francisco (1961-2001) and the daily data (1991-2000) were obtained from Instituto Nacional de Investigacão e Desenvolvimento Agrario (NationalResearch Institute for Agriculture and Rural Development - INIDA) in Cape Verde.
The precipitation data was analysed in Winstat with time series analysis using simple regression.The precipitation data was detrended, and the given residuals were then displayed in aperiodogramme. The peaks in the periodogramme were used for calculating the returning periodsin precipitation events.
Field observationsTwo climatic transect walks were made using a Testo 615 measuring instrument givingtemperature, relative air humidity and dew point temperature at a height of approximately 1 m.This measuring instrument does not have a logger function. The Testo 615 has a fixed measuringantenna in which the measuring unit is situated. The top of the antenna is not entirely closed, butprotects the measuring unit from direct solar radiation and allows the surrounding air to circulatethrough the top of the antenna.
During the transect walks the values from the Testo 615 were read and noted after standing stillfor about one minute. The walks took about one to three hours, and were conducted during themiddle of the day. Two complete walks were performed, one in the east area, and one in the westarea. The walks were made on the 1st and the 5 th of June.
Soil and landuse
Interpretation of aerial photographs and mapsAerial photographs (1979, 79-ICV.1/150 Uag 1068 152.16) and topographic maps were analysedand mapped. The aerial photographs were interpreted in stereoscope at INIDA. Thephotographs (nos. 280 and 281 cover the east area, nos. 36 and 37 the west area) were used asreference material when mapping the areas visually.
Field observationsThe two areas were covered on foot. Two transect walks were performed from afforestedmountain crests to cultivated valley floors. Each plot was chosen to provide a representative viewwithin the transect. Soil samples were collected from each plot, into one joint sample, and thechoice of sample sites depended on whether it was possible to dig up soil or not. Investigatedfactors:
1. Slope angle, with inclinometer (Suunto).2. Visual observation of what crops the farmers grow on different parts of the slope.
20
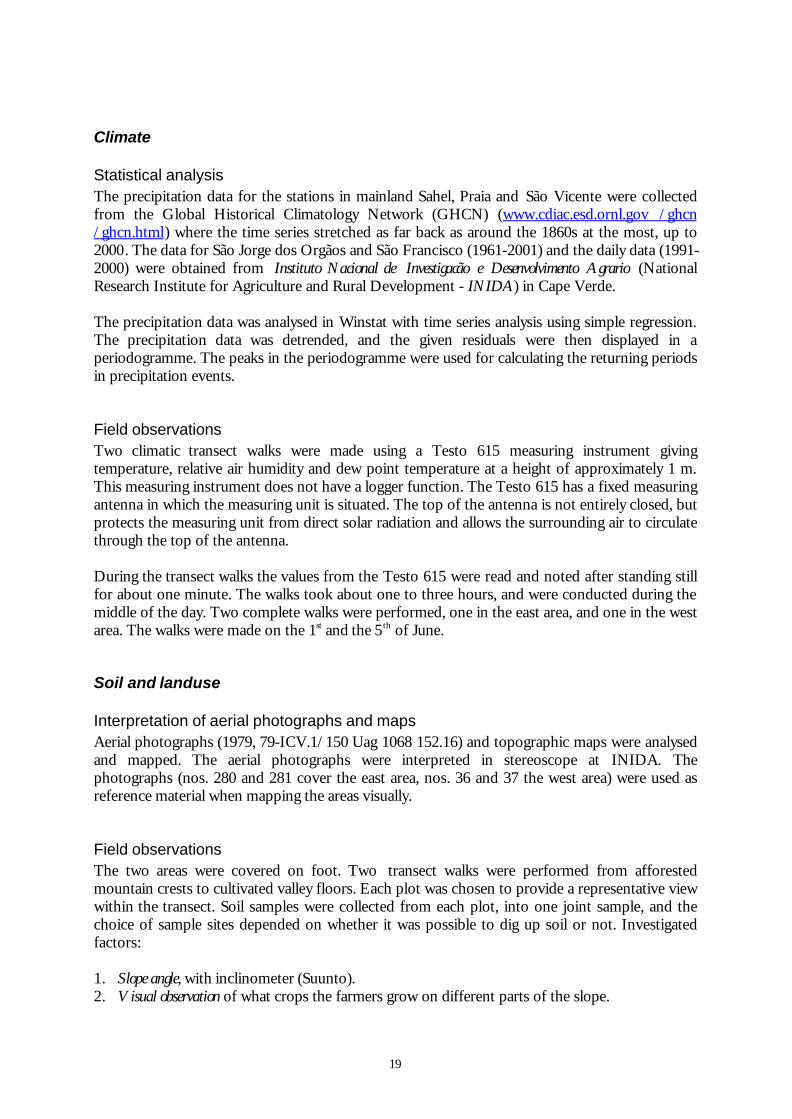
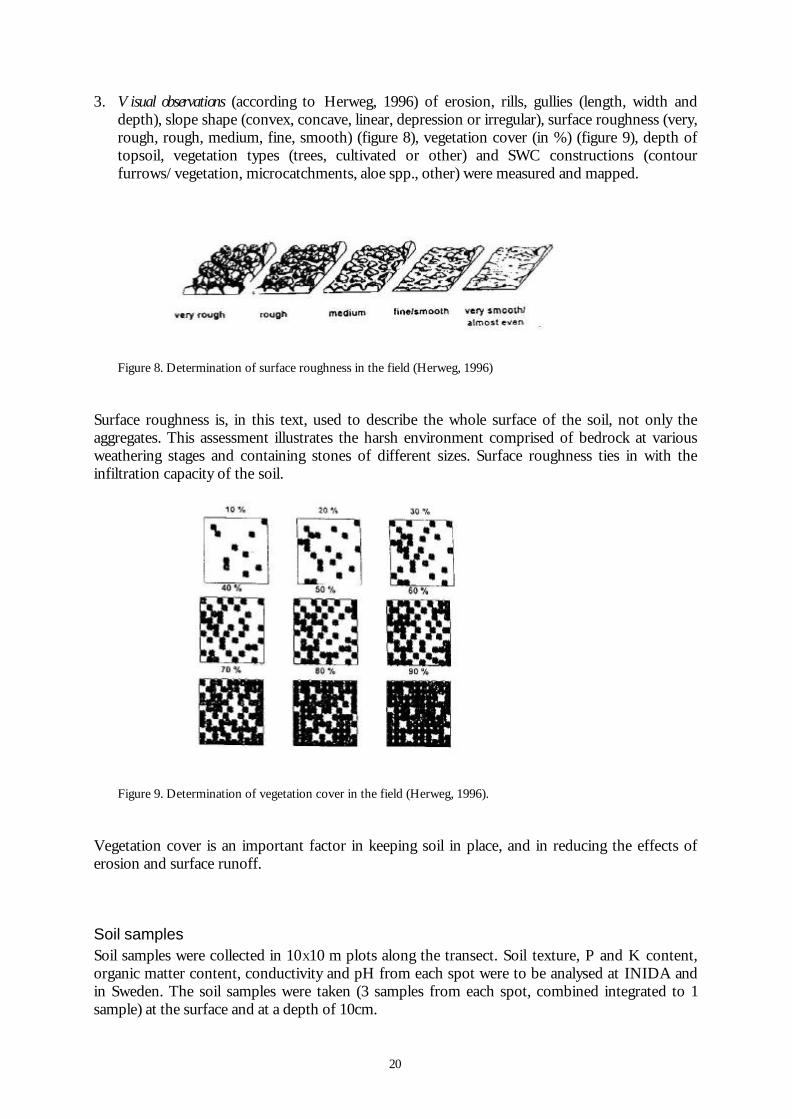
3. Visual observations (according to Herweg, 1996) of erosion, rills, gullies (length, width anddepth), slope shape (convex, concave, linear, depression or irregular), surface roughness (very,rough, rough, medium, fine, smooth) (figure 8), vegetation cover (in %) (figure 9), depth oftopsoil, vegetation types (trees, cultivated or other) and SWC constructions (contourfurrows/vegetation, microcatchments, aloe spp., other) were measured and mapped.
Figure 8. Determination of surface roughness in the field (Herweg, 1996)
Surface roughness is, in this text, used to describe the whole surface of the soil, not only theaggregates. This assessment illustrates the harsh environment comprised of bedrock at variousweathering stages and containing stones of different sizes. Surface roughness ties in with theinfiltration capacity of the soil.
Figure 9. Determination of vegetation cover in the field (Herweg, 1996).
Vegetation cover is an important factor in keeping soil in place, and in reducing the effects oferosion and surface runoff.
Soil samplesSoil samples were collected in 10X10 m plots along the transect. Soil texture, P and K content,organic matter content, conductivity and pH from each spot were to be analysed at INIDA andin Sweden. The soil samples were taken (3 samples from each spot, combined integrated to 1sample) at the surface and at a depth of 10cm.
21
The analyses of soil texture were made through the Pipette method and the particle size gradewas classified according to USDA standards (Landon, 1991). The Olsen method was used fordetermining the P2O5 and K2O content. These results were then converted to P and K content(Landon, 1991, p. 333).
The salinity of the soil electrical conductivity (EC) was done by suspending the soil sample inwater (1:2) to get ECW followed by measurements with a conductivimeter. pH was measuredusing a pH meter in a suspension of soil in water (1:2.5). Organic matter content samples wereanalysed through the combustion of approximately 20 g. soil at 700º C for 12 hours in Sweden.The weight loss yields the organic matter content.
No soil classification was performed in the field, because no classification schemes were available.Litterature studies form the base of this classification, following US soil taxonomy.
Socio-economy
InterviewsThe transect walks were combined with a questionnaire (see appendix) which provided thefarmers’ views and attitudes on the effects of afforestation, farming, climate and other factors.Since the farmers’ point of view of agriculture and about afforestation programmes are veryimportant, a questionnaire was made but not handed out. The interviews were a combination ofclosed quantitative, semi-structured interviews, and wealth ranking (Mikkelsen 1995, 75 ff.). Thequestionnaire was originally written in English, translated to Portuguese and occasionally theinterviewer translated the material into Crioulo during the course of the interview.
Almost all households (one or more people living together who may or may not be related) in thetwo investigated areas were interviewed. The interviews opened with questions regardingbackground information about the household: size, education, history of the land use and itsownership.
The next group of questions concerned their perception of the climate, the soil, agriculture, thedifferent types of cropping, and the production rates. The effects (positive and negative) ofafforestation programs in the farming area were outlined by next group of questions, and thequestions were concluded with an overall view of the interviewees’ situation by way of a wealthranking where 13 different issues were ranked (see appendix).
22
Sources of error
Micro-climateThe constantly blowing winds caused by the sea breeze mixed the air effectively, causingtemperatures to fluctuate widely. The investigation was made during the driest season and thecircumstances were not favourable with respect to noticeable beneficial effects. The trees in thewest area were quite leafless and did not provide much shadow. The time needed to finish thetransect walks may have been too long. During the course of the walk the temperature had risenin the investigated areas due to the increased insolation.
Soil and land useThe P and K values are difficult to obtain and occasional power failures made it even more so.General conclusions drawn from soil analytic results give rise to at least four difficulties (Landon,1991, p. 106 ff):
1) The soil samples may not be representative, inadequate field-sampling techniques, effects ofpre-treatments, cropping history, management practices and the time of year influences thesamples. 2) Standard methods are used, but they do not necessarily reflect the availability of anutrient to the plant. 3) Interpretations of laboratory results are seldom universally applicable. 4)The variability of soil analytic results tends to be high.
The erosion in this type of soil and area is often characterised by sheet wash, small rills andcracks and is therefore visible only during and directly following precipitation.
Socio-economyThe interviews were made with an interpreter and the language difficulties have to be taken intoaccount as they may be a possible source of error. Many of the questions were difficult to followup due to language problems. Since nearly every household was interviewed, the answers shouldbe representative, but this is difficult to assess.
The wealth rankings were intended to give a picture of how the interviewees perceive theirsituation. As it turned out, they gave a more general view of what the interviewees felt was moreor less good/important in their lives, and did not reflect their reality.
23
4. Results
A description of the investigated areasThe west area, with the village São Gonçalo, is situated in one of the driest parts of the island(figure 7) and large parts of this region are using afforestation as a form of SWC. One largeribeira, São João, runs from the top of Pico da Antonio down the canyon-shaped valley towardsthe ocean. The records kept by the climatic station of Pico Leão (500 masl) situated in the upperpart of Ribeira Belèm which runs into Ribeira São João are used to get a picture of the producedrunoff. There are two roads leading to São Gonçalo, one that follows the ribeira during the dryseason and one that runs along the edge of the hillside. The closest towns are São João Baptista(approx. 2 km away) and Cidade Velha (approx. 6 km away). São Gonçalo is situated on a plateaubetween the upper road and the ribeira. The surface of the reddish soil is medium to rough with agreat deal of visible bedrock in different weathering stages. This area is characterised by sparsevegetation, small and thin trees (some more like shrubs than trees) with stems that split close tothe ground. The village has a nice big tree that shades the square surrounded by houses. Thesquare has a built-up area with some very small trees. These trees are tendered by the elderly menof the village, who protect the trees from goats and give them all the wastewater they can.
The east area, with the village Poilão, is situated in one of the food-basket areas in Ribeira Secaon Santiago. The station of São Jorge dos Orgãos (350 masl) is situated in the upper part ofRibeira Seca, and the records provide a picture of the runoff reaching Poilão. This area has a lotof SWC but not so much in the form of afforestation. The SWC efforts are concentrated to thefarming land in the ribeira and are targeted as restoring it after the rains. Large checkdams (fourwithin the investigated area) cross Ribeira Seca. One quite large road passes Poilão and leads tothe coastal town Pedro Badejo (approx. 6 km away), and it is quite easy to travel there by thelocal cars called "yaz". Poilão is a sprawling type of village with no specific centre. The village isseparated both by the ribeira and the small road crossing the ribeira. The vegetation is rich, byCape Verde standards, even during the driest times of the years. The trees have well-definedstems, and they are about 3-4 m high. There is a great deal of shrubs and grasses, and the surfaceof the brown to reddish soil is medium to fine. An area with greyish sand in the bottom of theribeira is used as a small football field.
Climate - Cape Verde and mainland SahelSince the Cape Verde islands are an oceanic extension of the Sahelian arid and semi-arid zone,the precipitation data for Cape Verde (Mindelo on São Vicente, Praia on Santiago) is comparedwith data from seven stations in mainland Sahel, to investigate to what degree Cape Verdeconforms to the Sahelian precipitation events and characteristics. Of the seven selected Sahelianstations three have been chosen: Dakar in Senegal, Ouagadougou in Burkina Faso and N’djamenain Chad. These stations are situated at approximately 12-15ºN.
The graphs (figures 10-14) show the precipitation data for the five different stations. In all thegraphs a linear regression trend has been added to show whether the trend is decreasing,increasing or if no trend is apparent. All five stations show decreasing trends.
Some yearly data is missing in the statistic material, and some years, especially in the 1990s, havebeen excluded since the lack of monthly data in the wet season is too severe to permit accurate
24
yearly summaries. For Praia the year 1906 has been excluded because of its extremely high andunrealistic value, 1,051.3 mm.
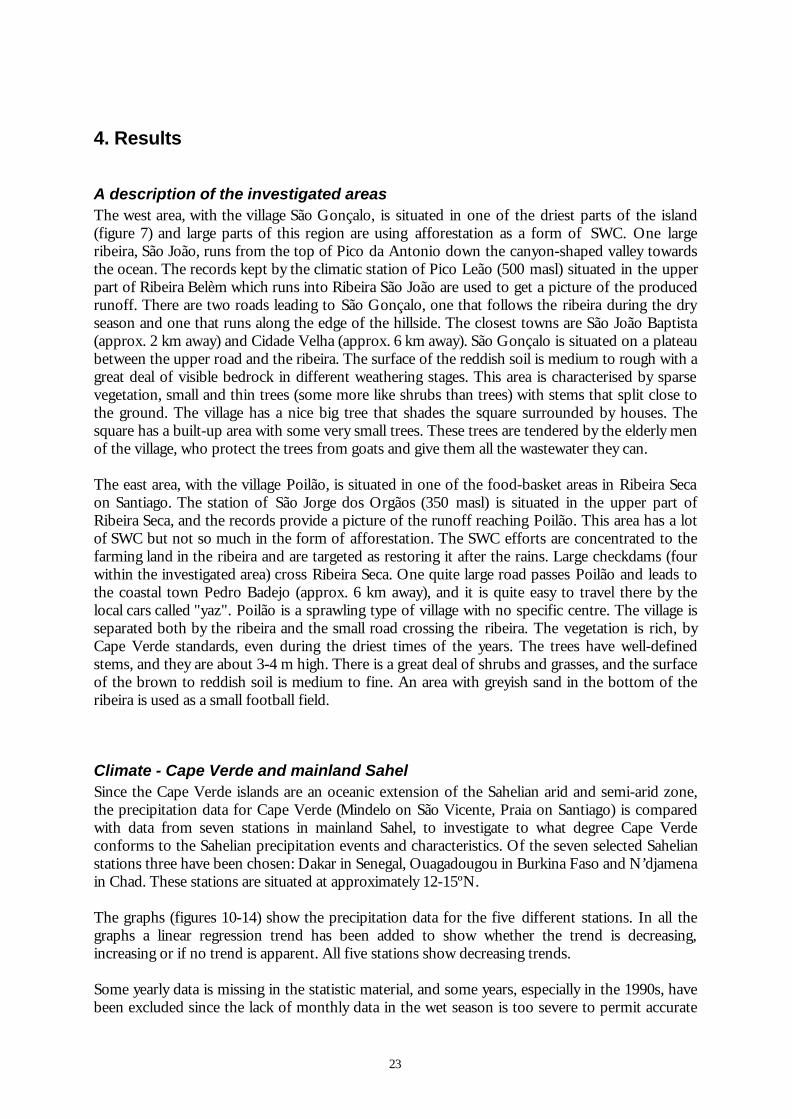
In Mindelo on the island of São Vicente (figures 10a+b) precipitation shows a decreasing trend(years 1884-1975, missing years;1886, 1888, 1896 and 1901) and the mean annual precipitation is104 mm. The graph shows that precipitation is very variable from year to year.
0
1 0 0
2 0 0
3 0 0
4 0 0
5 0 0
6 0 0
7 0 0
8 0 0
9 0 0
1 0 0 0
1 1 0 0
1 2 0 0
1884
1890
1894
1899
1904
1908
1912
1916
1920
1924
1928
1932
1936
1940
1944
1948
1952
1956
1960
1964
1968
1972
Y e a r s
Prec
ipita
tion
(mm
)
Figure 10a. Precipitation in Mindelo, São Vicente, Cape Verde (1884-1975).
- 5 0 0
- 4 0 0
- 3 0 0
- 2 0 0
- 1 0 0
0
1 0 0
2 0 0
3 0 0
4 0 0
5 0 0
6 0 0
1884
1891
1897
1903
1908
1913
1918
1923
1928
1933
1938
1943
1948
1953
1958
1963
1968
1973
Y e a r s
Dev
iatio
n fro
m m
ean
in m
m p
reci
pita
tion
Figure 10b. Deviation from mean precipitation in Mindelo, São Vicente, Cape Verde (1884-1975).
25
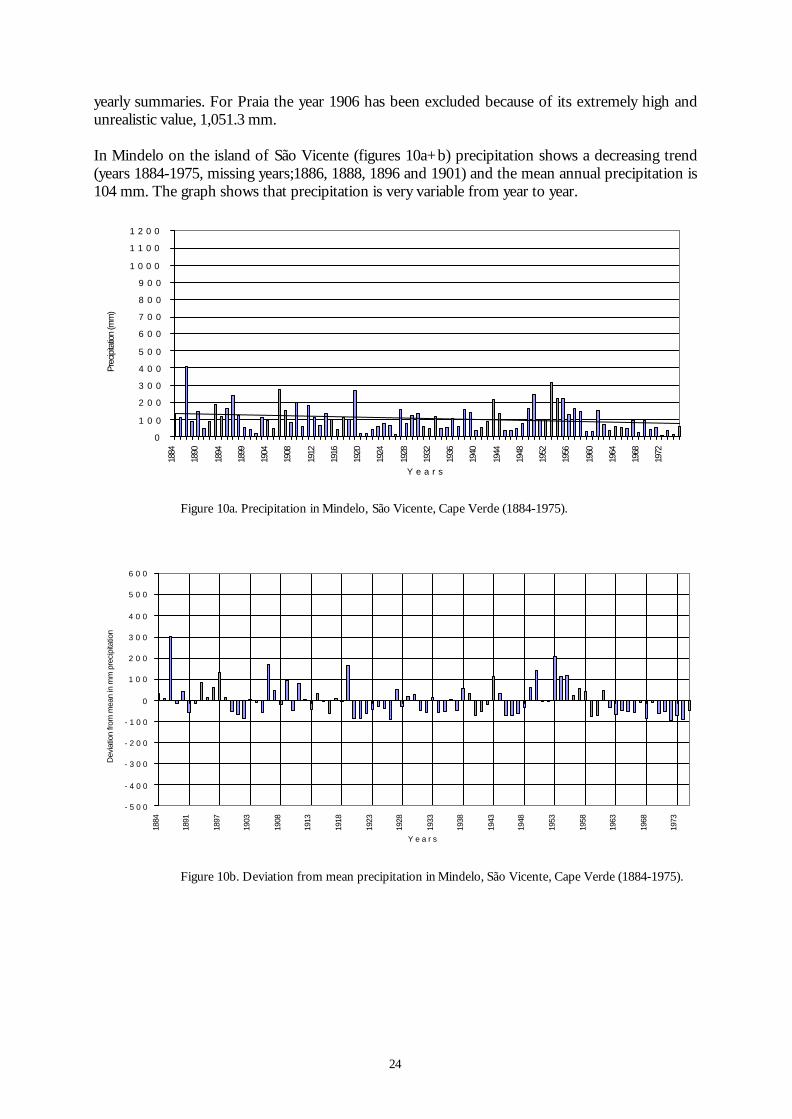
The station in Praia, Santiago (figures 11a+b) has a mean annual precipitation of 219 mm (years1865-1973, missing years; 1886-1874, 1882-1884, 1906, 1928, 1931, 1934 and 1936). There is adecreasing trend in precipitation. Just like on São Vicente the precipitation has a high inter-annualvariability.
Mindelo on São Vicente is situated in rain-shadow, which explains why the mean annualprecipitation is lower than in Praia, Santiago.
0
1 0 0
2 0 0
3 0 0
4 0 0
5 0 0
6 0 0
7 0 0
8 0 0
9 0 0
1 0 0 0
1 1 0 0
1 2 0 0
1865
1878
1885
1889
1893
1897
1901
1905
1910
1914
1918
1922
1926
1932
1938
1942
1946
1950
1954
1958
1962
1966
1970
Y e a r s
Pre
cipi
tatio
n (m
m)
Figure 11a. Precipitation in Praia, Santiago, Cape Verde (1865-1973).
- 5 0 0
- 4 0 0
- 3 0 0
- 2 0 0
- 1 0 0
0
1 0 0
2 0 0
3 0 0
4 0 0
5 0 0
6 0 0
1865
1879
1887
1892
1897
1902
1908
1913
1918
1923
1929
1937
1942
1947
1952
1957
1962
1967
1972
Y e a r s
Dev
iation
from
mea
n in
mm
pre
cipita
tion
Figure 11b. Deviation from mean precipitation in Praia, Santiago, Cape Verde (1865-1973).
26
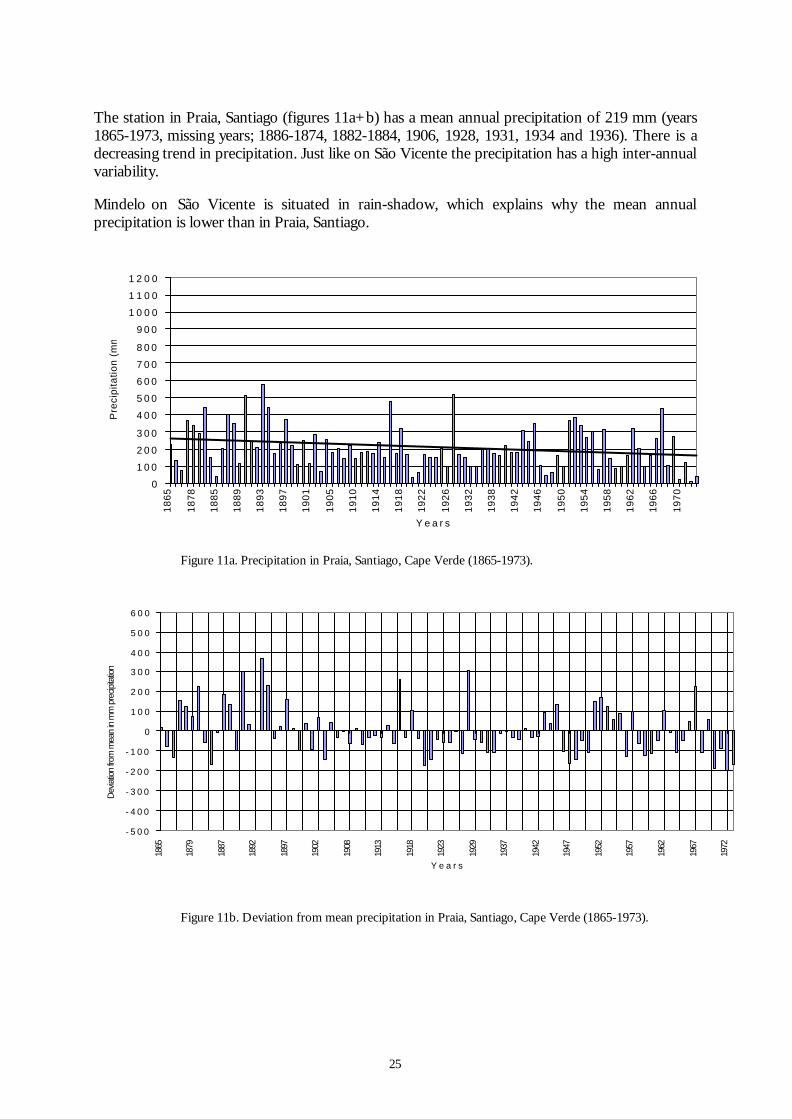
The African mainland station closest to Cape Verde is Dakar, Senegal (figures 12a+b). The meanannual precipitation in Dakar (years 1898-2000, missing years; 1991, 1994 and 1998) is 493 mm.The trend in precipitation in Dakar is also decreasing.
0
1 0 0
2 0 0
3 0 0
4 0 0
5 0 0
6 0 0
7 0 0
8 0 0
9 0 0
1 0 0 0
1 1 0 0
1 2 0 0
1898
1903
1908
1913
1918
1923
1928
1933
1938
1943
1948
1953
1958
1963
1968
1973
1978
1983
1988
1995
Y e a r s
Pre
cipi
tatio
n (m
m)
Figure 12a. Precipitation in Dakar, Senegal (1898-2000).
- 5 0 0
- 4 0 0
- 3 0 0
- 2 0 0
- 1 0 0
0
1 0 0
2 0 0
3 0 0
4 0 0
5 0 0
6 0 0
1898
1903
1908
1913
1918
1923
1928
1933
1938
1943
1948
1953
1958
1963
1968
1973
1978
1983
1988
1995
Y e a r s
Dev
iation
from
mea
n in
mm
pre
cipita
tion
Figure 12b. Deviation from mean precipitation in Dakar, Senegal (1898-2000).
27
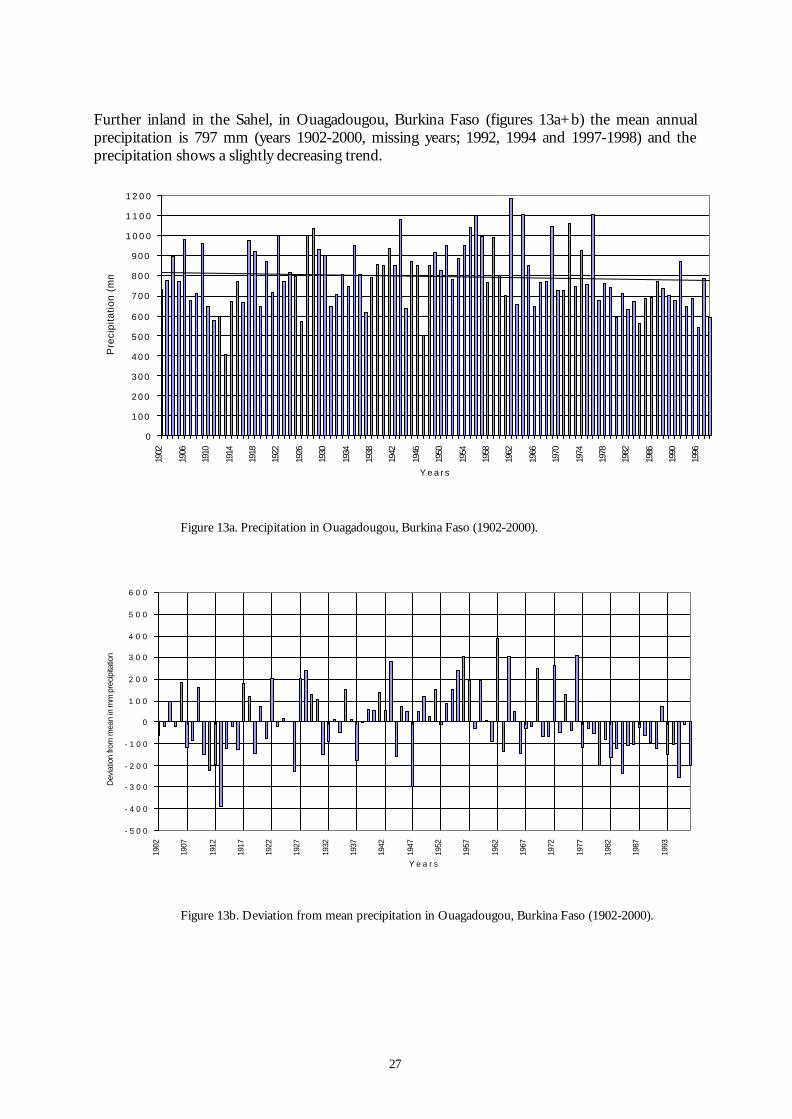
Further inland in the Sahel, in Ouagadougou, Burkina Faso (figures 13a+b) the mean annualprecipitation is 797 mm (years 1902-2000, missing years; 1992, 1994 and 1997-1998) and theprecipitation shows a slightly decreasing trend.
0
1 0 0
2 0 0
3 0 0
4 0 0
5 0 0
6 0 0
7 0 0
8 0 0
9 0 0
1 0 0 0
1 1 0 0
1 2 0 0
1902
1906
1910
1914
1918
1922
1926
1930
1934
1938
1942
1946
1950
1954
1958
1962
1966
1970
1974
1978
1982
1986
1990
1996
Y e a r s
Pre
cipi
tatio
n (m
m)
Figure 13a. Precipitation in Ouagadougou, Burkina Faso (1902-2000).
- 5 0 0
- 4 0 0
- 3 0 0
- 2 0 0
- 1 0 0
0
1 0 0
2 0 0
3 0 0
4 0 0
5 0 0
6 0 0
1902
1907
1912
1917
1922
1927
1932
1937
1942
1947
1952
1957
1962
1967
1972
1977
1982
1987
1993
Y e a r s
Dev
iatio
n fro
m m
ean
in m
m p
reci
pita
tion
Figure 13b. Deviation from mean precipitation in Ouagadougou, Burkina Faso (1902-2000).
28
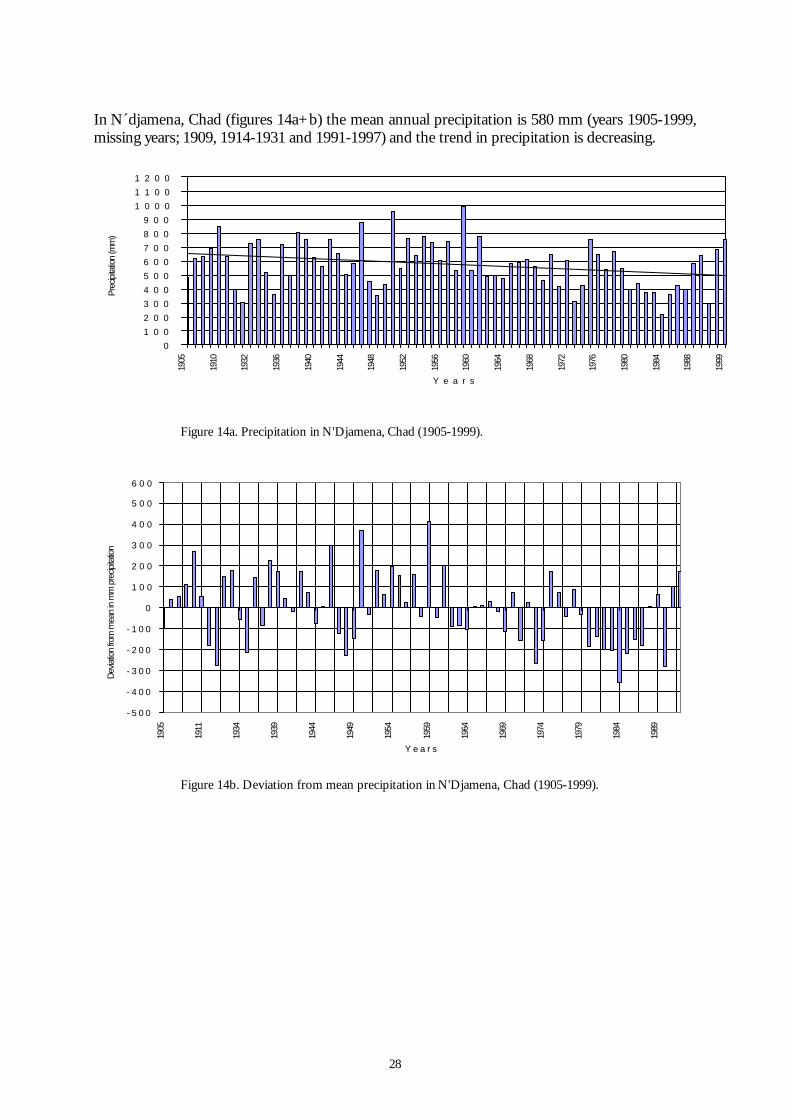
In N´djamena, Chad (figures 14a+b) the mean annual precipitation is 580 mm (years 1905-1999,missing years; 1909, 1914-1931 and 1991-1997) and the trend in precipitation is decreasing.
0
1 0 0
2 0 0
3 0 0
4 0 0
5 0 0
6 0 0
7 0 0
8 0 0
9 0 0
1 0 0 0
1 1 0 0
1 2 0 019
05
1910
1932
1936
1940
1944
1948
1952
1956
1960
1964
1968
1972
1976
1980
1984
1988
1999
Y e a r s
Prec
ipita
tion
(mm
)
Figure 14a. Precipitation in N'Djamena, Chad (1905-1999).
- 5 0 0
- 4 0 0
- 3 0 0
- 2 0 0
- 1 0 0
0
1 0 0
2 0 0
3 0 0
4 0 0
5 0 0
6 0 0
1905
1911
1934
1939
1944
1949
1954
1959
1964
1969
1974
1979
1984
1989
Y e a r s
Dev
iation
from
mea
n in
mm
pre
cipita
tion
Figure 14b. Deviation from mean precipitation in N'Djamena, Chad (1905-1999).
29
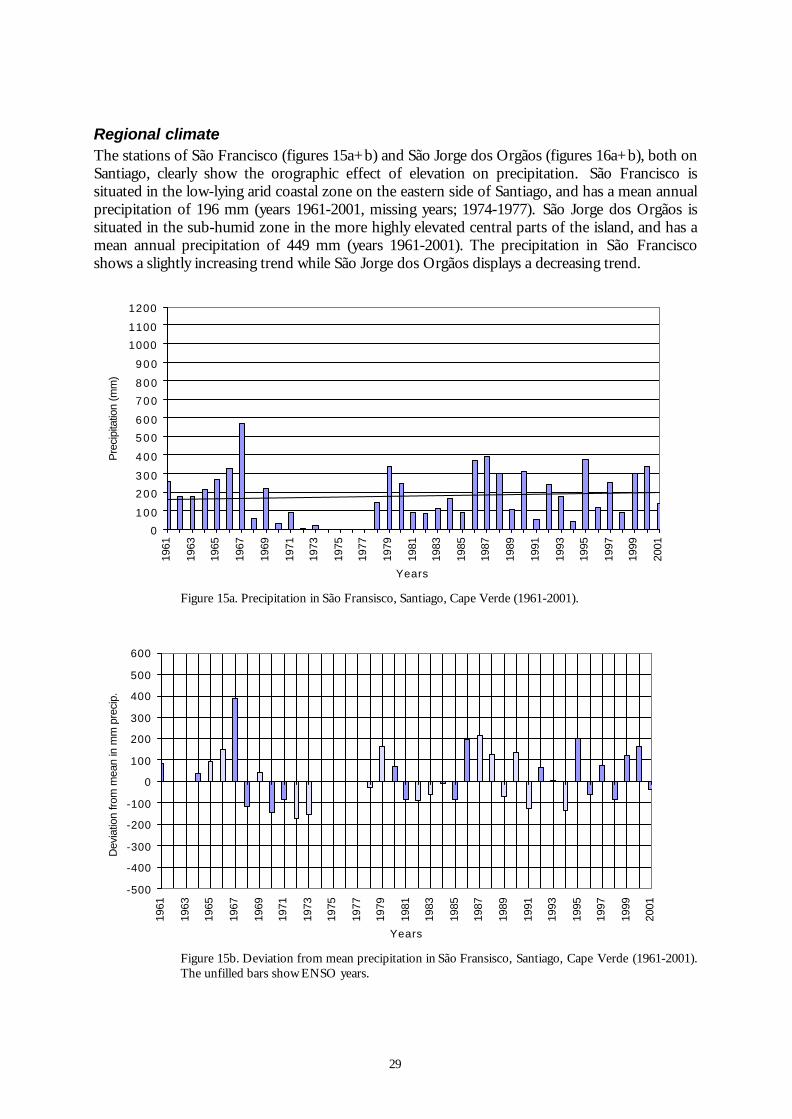
Regional climateThe stations of São Francisco (figures 15a+b) and São Jorge dos Orgãos (figures 16a+b), both onSantiago, clearly show the orographic effect of elevation on precipitation. São Francisco issituated in the low-lying arid coastal zone on the eastern side of Santiago, and has a mean annualprecipitation of 196 mm (years 1961-2001, missing years; 1974-1977). São Jorge dos Orgãos issituated in the sub-humid zone in the more highly elevated central parts of the island, and has amean annual precipitation of 449 mm (years 1961-2001). The precipitation in São Franciscoshows a slightly increasing trend while São Jorge dos Orgãos displays a decreasing trend.
0
1 0 0
2 0 0
3 0 0
4 0 0
5 0 0
6 0 0
7 0 0
8 0 0
9 0 0
1000
1100
1200
1961
1963
1965
1967
1969
1971
1973
1975
1977
1979
1981
1983
1985
1987
1989
1991
1993
1995
1997
1999
2001
Years
Pre
cipi
tatio
n (m
m)
Figure 15a. Precipitation in São Fransisco, Santiago, Cape Verde (1961-2001).
-500
-400
-300
-200
-100
0
100
200
300
400
500
600
1961
1963
1965
1967
1969
1971
1973
1975
1977
1979
1981
1983
1985
1987
1989
1991
1993
1995
1997
1999
2001
Years
Dev
iatio
n fro
m m
ean
in m
m p
reci
p.
Figure 15b. Deviation from mean precipitation in São Fransisco, Santiago, Cape Verde (1961-2001).The unfilled bars show ENSO years.
30
0
1 0 0
2 0 0
3 0 0
4 0 0
5 0 0
6 0 0
7 0 0
8 0 0
9 0 0
1 0 0 0
1 1 0 0
1 2 0 0
1961
1964
1967
1970
1973
1976
1979
1982
1985
1988
1991
1994
1997
2000
Y e a r s
Prec
ipita
tion
(mm
)
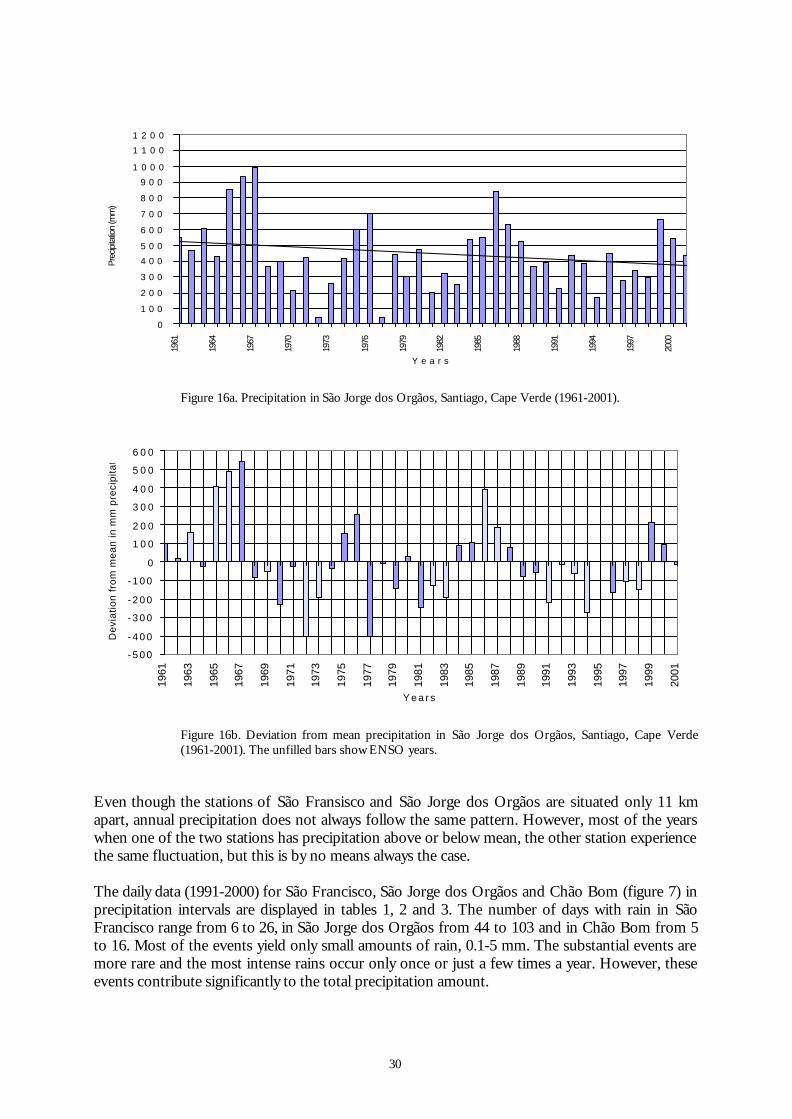
Figure 16a. Precipitation in São Jorge dos Orgãos, Santiago, Cape Verde (1961-2001).
- 5 0 0
- 4 0 0
- 3 0 0
- 2 0 0
- 1 0 0
0
1 0 0
2 0 0
3 0 0
4 0 0
5 0 0
6 0 0
1961
1963
1965
1967
1969
1971
1973
1975
1977
1979
1981
1983
1985
1987
1989
1991
1993
1995
1997
1999
2001
Y e a r s
Dev
iatio
n fr
om m
ean
in m
m p
reci
pita
tion
Figure 16b. Deviation from mean precipitation in São Jorge dos Orgãos, Santiago, Cape Verde(1961-2001). The unfilled bars show ENSO years.
Even though the stations of São Fransisco and São Jorge dos Orgãos are situated only 11 kmapart, annual precipitation does not always follow the same pattern. However, most of the yearswhen one of the two stations has precipitation above or below mean, the other station experiencethe same fluctuation, but this is by no means always the case.
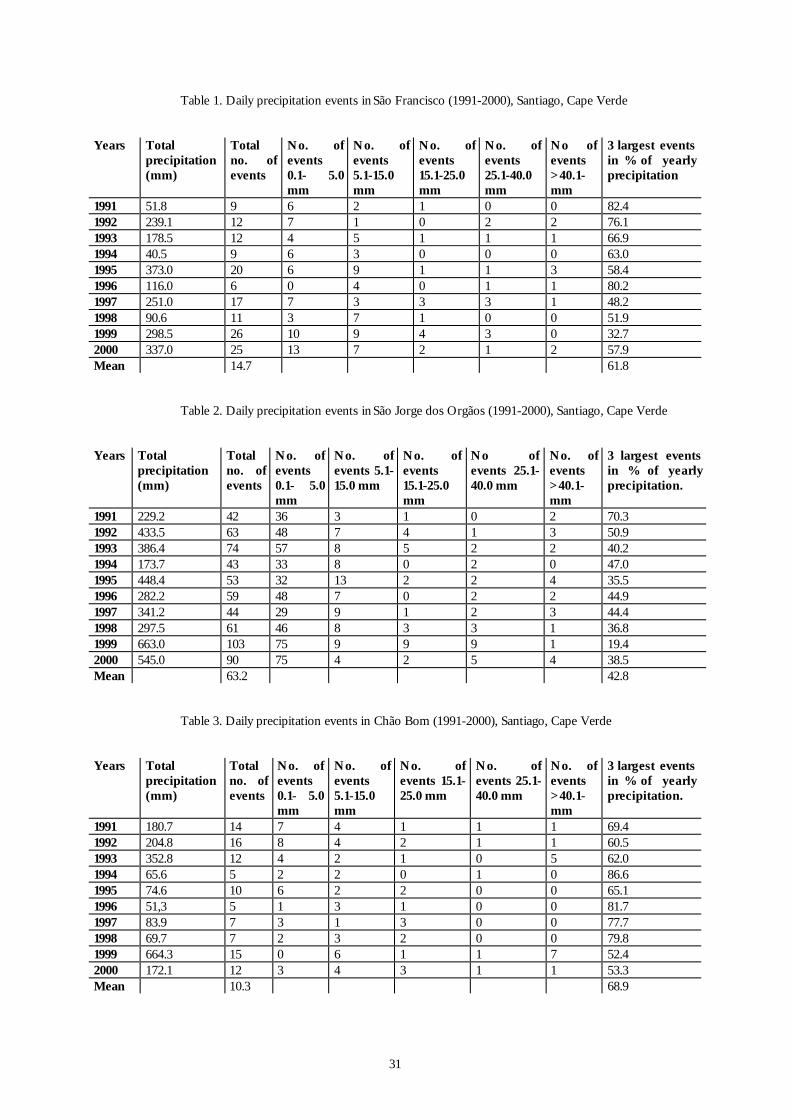
The daily data (1991-2000) for São Francisco, São Jorge dos Orgãos and Chão Bom (figure 7) inprecipitation intervals are displayed in tables 1, 2 and 3. The number of days with rain in SãoFrancisco range from 6 to 26, in São Jorge dos Orgãos from 44 to 103 and in Chão Bom from 5to 16. Most of the events yield only small amounts of rain, 0.1-5 mm. The substantial events aremore rare and the most intense rains occur only once or just a few times a year. However, theseevents contribute significantly to the total precipitation amount.
31
Table 1. Daily precipitation events in São Francisco (1991-2000), Santiago, Cape Verde
Years Totalprecipitation(mm)
Totalno. ofevents
No. ofevents0.1- 5.0mm
No. ofevents5.1-15.0mm
No. ofevents15.1-25.0mm
No. ofevents25.1-40.0mm
No ofevents>40.1-mm
3 largest eventsin % of yearlyprecipitation
1991 51.8 9 6 2 1 0 0 82.41992 239.1 12 7 1 0 2 2 76.11993 178.5 12 4 5 1 1 1 66.91994 40.5 9 6 3 0 0 0 63.01995 373.0 20 6 9 1 1 3 58.41996 116.0 6 0 4 0 1 1 80.21997 251.0 17 7 3 3 3 1 48.21998 90.6 11 3 7 1 0 0 51.91999 298.5 26 10 9 4 3 0 32.72000 337.0 25 13 7 2 1 2 57.9Mean 14.7 61.8
Table 2. Daily precipitation events in São Jorge dos Orgãos (1991-2000), Santiago, Cape Verde
Years Totalprecipitation(mm)
Totalno. ofevents
No. ofevents0.1- 5.0mm
No. ofevents 5.1-15.0 mm
No. ofevents15.1-25.0mm
No ofevents 25.1-40.0 mm
No. ofevents>40.1-mm
3 largest eventsin % of yearlyprecipitation.
1991 229.2 42 36 3 1 0 2 70.31992 433.5 63 48 7 4 1 3 50.91993 386.4 74 57 8 5 2 2 40.21994 173.7 43 33 8 0 2 0 47.01995 448.4 53 32 13 2 2 4 35.51996 282.2 59 48 7 0 2 2 44.91997 341.2 44 29 9 1 2 3 44.41998 297.5 61 46 8 3 3 1 36.81999 663.0 103 75 9 9 9 1 19.42000 545.0 90 75 4 2 5 4 38.5Mean 63.2 42.8
Table 3. Daily precipitation events in Chão Bom (1991-2000), Santiago, Cape Verde
Years Totalprecipitation(mm)
Totalno. ofevents
No. ofevents0.1- 5.0mm
No. ofevents5.1-15.0mm
No. ofevents 15.1-25.0 mm
No. ofevents 25.1-40.0 mm
No. ofevents>40.1-mm
3 largest eventsin % of yearlyprecipitation.
1991 180.7 14 7 4 1 1 1 69.41992 204.8 16 8 4 2 1 1 60.51993 352.8 12 4 2 1 0 5 62.01994 65.6 5 2 2 0 1 0 86.61995 74.6 10 6 2 2 0 0 65.11996 51,3 5 1 3 1 0 0 81.71997 83.9 7 3 1 3 0 0 77.71998 69.7 7 2 3 2 0 0 79.81999 664.3 15 0 6 1 1 7 52.42000 172.1 12 3 4 3 1 1 53.3Mean 10.3 68.9
32
In São Francisco the three largest yearly precipitation events (1991-2000) produce 32.7-82.4% ofthe annual rainfall. The mean event gives 61.8% of the annual amount. In São Jorge dos Orgãosthe three largest yearly events (1991-2000) give 19.4-70.3% of the annual amounts. The meanevent gives 42.8% of the annual amount. In Chão Bom the three largest yearly events (1991-2000) give 52.4-86.6% of the annual amounts. The mean event gives 68.9% of the annualamount.
In São Francisco and Chão Bom the three largest events every year therefore have a greaterimpact on the total annual precipitation than in São Jorge dos Orgãos. In São Jorge dos Orgãosthe number of events with small amounts of precipitation is greater than in São Francisco andChão Bom, and therefore also have a greater impact on the total annual amounts.
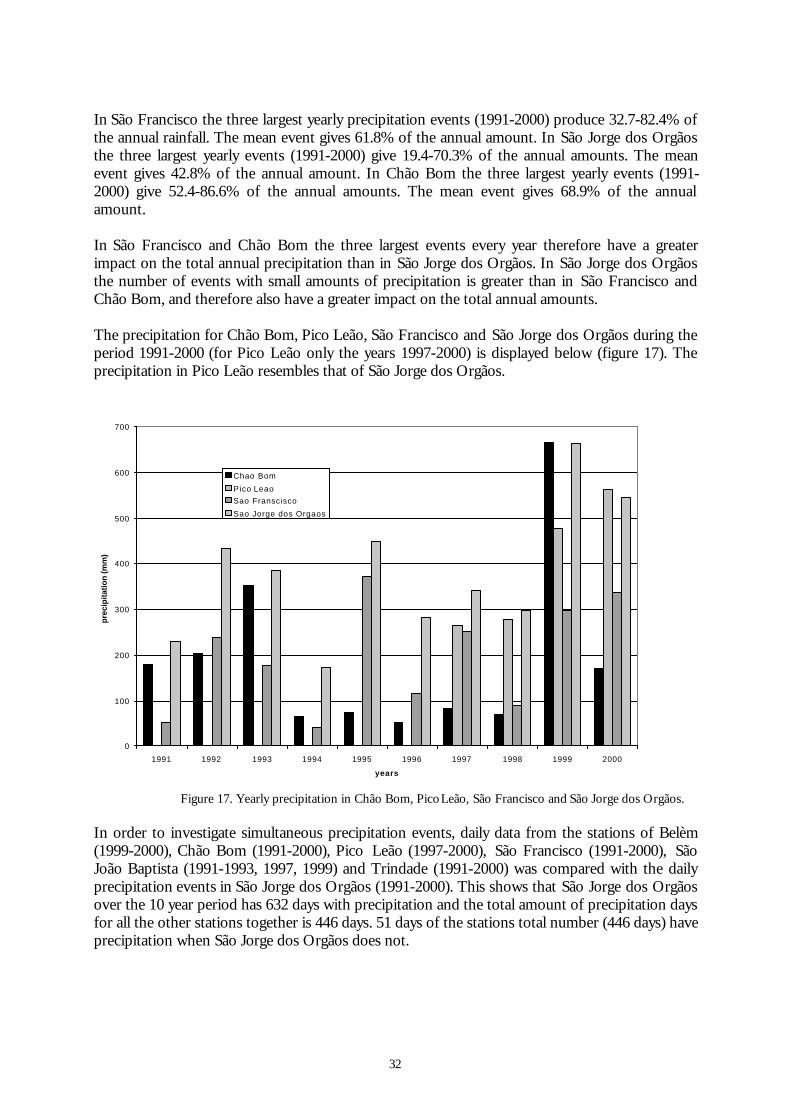
The precipitation for Chão Bom, Pico Leão, São Francisco and São Jorge dos Orgãos during theperiod 1991-2000 (for Pico Leão only the years 1997-2000) is displayed below (figure 17). Theprecipitation in Pico Leão resembles that of São Jorge dos Orgãos.
Figure 17. Yearly precipitation in Chão Bom, Pico Leão, São Francisco and São Jorge dos Orgãos.
In order to investigate simultaneous precipitation events, daily data from the stations of Belèm(1999-2000), Chão Bom (1991-2000), Pico Leão (1997-2000), São Francisco (1991-2000), SãoJoão Baptista (1991-1993, 1997, 1999) and Trindade (1991-2000) was compared with the dailyprecipitation events in São Jorge dos Orgãos (1991-2000). This shows that São Jorge dos Orgãosover the 10 year period has 632 days with precipitation and the total amount of precipitation daysfor all the other stations together is 446 days. 51 days of the stations total number (446 days) haveprecipitation when São Jorge dos Orgãos does not.
0
100
200
300
400
500
600
700
1991 1992 1993 1994 1995 1996 1997 1998 1999 2000
years
pre
cip
itat
ion
(mm
)
Chao Bom
Pico LeaoSao Franscisco
Sao Jorge dos Orgaos
33
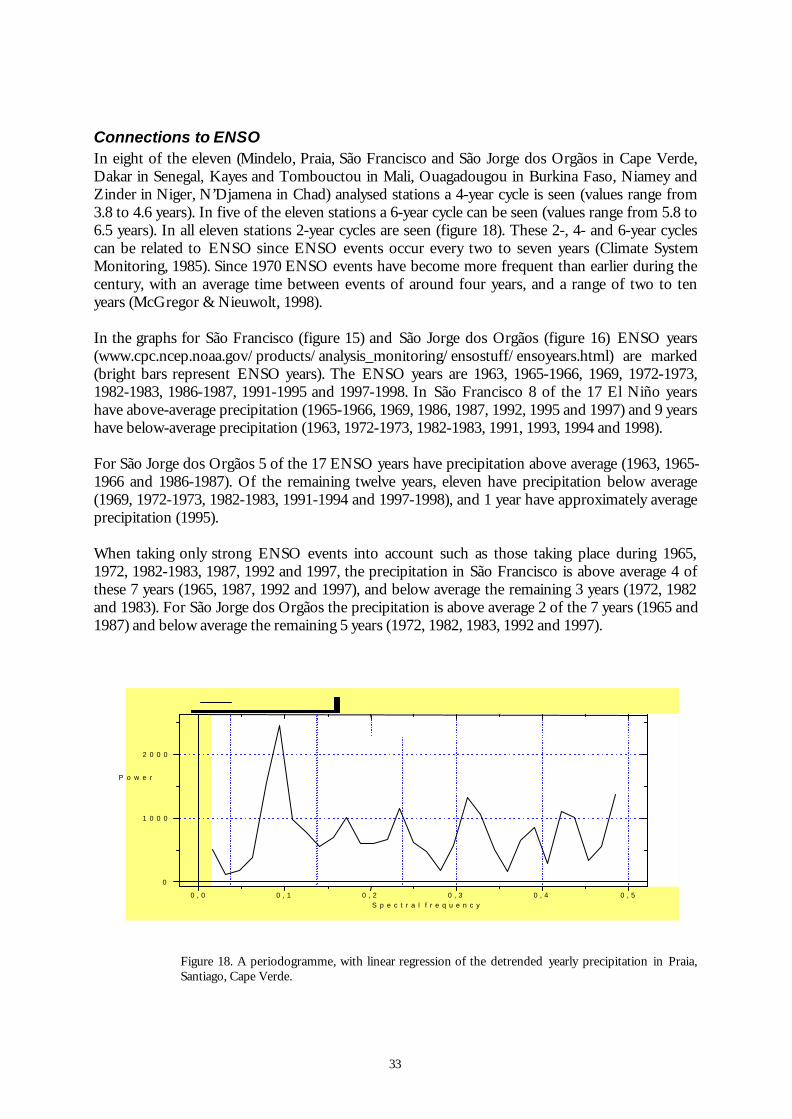
Connections to ENSOIn eight of the eleven (Mindelo, Praia, São Francisco and São Jorge dos Orgãos in Cape Verde,Dakar in Senegal, Kayes and Tombouctou in Mali, Ouagadougou in Burkina Faso, Niamey andZinder in Niger, N’Djamena in Chad) analysed stations a 4-year cycle is seen (values range from3.8 to 4.6 years). In five of the eleven stations a 6-year cycle can be seen (values range from 5.8 to6.5 years). In all eleven stations 2-year cycles are seen (figure 18). These 2-, 4- and 6-year cyclescan be related to ENSO since ENSO events occur every two to seven years (Climate SystemMonitoring, 1985). Since 1970 ENSO events have become more frequent than earlier during thecentury, with an average time between events of around four years, and a range of two to tenyears (McGregor & Nieuwolt, 1998).
In the graphs for São Francisco (figure 15) and São Jorge dos Orgãos (figure 16) ENSO years(www.cpc.ncep.noaa.gov/products/analysis_monitoring/ensostuff/ensoyears.html) are marked(bright bars represent ENSO years). The ENSO years are 1963, 1965-1966, 1969, 1972-1973,1982-1983, 1986-1987, 1991-1995 and 1997-1998. In São Francisco 8 of the 17 El Niño yearshave above-average precipitation (1965-1966, 1969, 1986, 1987, 1992, 1995 and 1997) and 9 yearshave below-average precipitation (1963, 1972-1973, 1982-1983, 1991, 1993, 1994 and 1998).
For São Jorge dos Orgãos 5 of the 17 ENSO years have precipitation above average (1963, 1965-1966 and 1986-1987). Of the remaining twelve years, eleven have precipitation below average(1969, 1972-1973, 1982-1983, 1991-1994 and 1997-1998), and 1 year have approximately averageprecipitation (1995).
When taking only strong ENSO events into account such as those taking place during 1965,1972, 1982-1983, 1987, 1992 and 1997, the precipitation in São Francisco is above average 4 ofthese 7 years (1965, 1987, 1992 and 1997), and below average the remaining 3 years (1972, 1982and 1983). For São Jorge dos Orgãos the precipitation is above average 2 of the 7 years (1965 and1987) and below average the remaining 5 years (1972, 1982, 1983, 1992 and 1997).
0 , 0 0 , 1 0 , 2 0 , 3 0 , 4 0 , 5
0
1 0 0 0
2 0 0 0
P o w e r
S p e c t r a l f r e q u e n c y
Figure 18. A periodogramme, with linear regression of the detrended yearly precipitation in Praia,Santiago, Cape Verde.
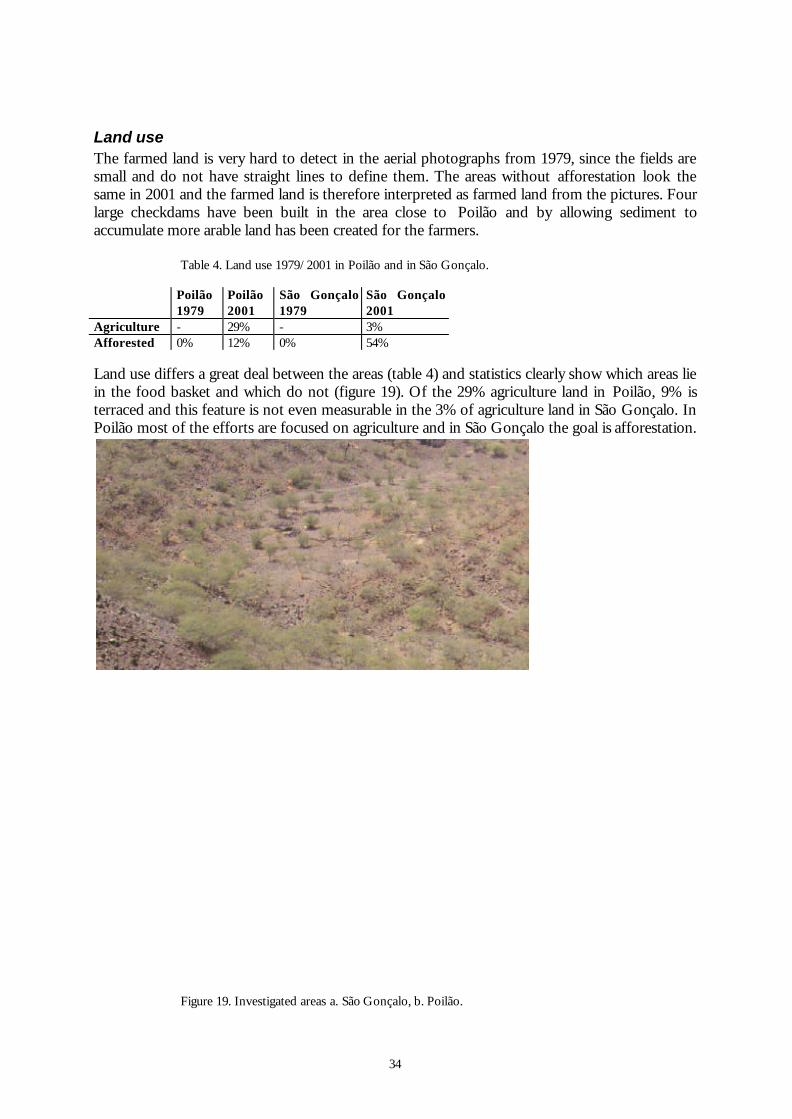
34
Land useThe farmed land is very hard to detect in the aerial photographs from 1979, since the fields aresmall and do not have straight lines to define them. The areas without afforestation look thesame in 2001 and the farmed land is therefore interpreted as farmed land from the pictures. Fourlarge checkdams have been built in the area close to Poilão and by allowing sediment toaccumulate more arable land has been created for the farmers.
Table 4. Land use 1979/2001 in Poilão and in São Gonçalo.
Poilão1979
Poilão2001
São Gonçalo1979
São Gonçalo2001
Agriculture - 29% - 3%Afforested 0% 12% 0% 54%
Land use differs a great deal between the areas (table 4) and statistics clearly show which areas liein the food basket and which do not (figure 19). Of the 29% agriculture land in Poilão, 9% isterraced and this feature is not even measurable in the 3% of agriculture land in São Gonçalo. InPoilão most of the efforts are focused on agriculture and in São Gonçalo the goal is afforestation.
Figure 19. Investigated areas a. São Gonçalo, b. Poilão.

35
West area - São GonçaloThe west area is approximately 3.5 km2 (figure 20), and interpretation of aerial photographsshows that 54% has been afforested after 1979 (figures 21a+b). The investigated area inclines towest/southwest. It stretches from a hillcrest, close to the road, down to a valley floor, in RibeiraBelèm, and includes a small village called São Gonçalo. The area consists of 3% farmed land thatis terraced to a very limited extent. The people in São Gonçalo are dependent on water frompumphouses (owned by INGRH), to be able to cultivate. Those who own land along the valleyfloors are able to grow crops (both subsistence and cash crops) both there and on the valleysides. The rest of the population in São Gonçalo could also possibly grow crops on the slopes ofthe valley, but water is too expensive and the lack of precipitation on this side of Santiago issevere. This means that the risk of loosing their input (having to buy maize and bean seeds) byfailing growth is too great. Many people in São Gonçalo lack the opportunity to grow even theslightest bean or maize crops.
Grassland and nFarmed landReforested areaSão GoncaloRibeira São JoãRoadsOld gullyTransect
São Gon
Figure 20. Field mapping of São Gonçalo area 2001.
Most of the trees (Prosopis juliflora, Acacia spp. and Ziziphus mauritianus) are low (< 2m.) and themain stem of the trees split close to the surface. Prosopis juliflora, locally known as Acaciaamericana, dominates. Many of these trees look almost dead, but scratch the surface of the tree,and a green layer will come to light, thus proving that the tree is in fact alive. The trees conservewater and only a few have sparse leaves that are protected from grazing by long thorns. The treescloser to the ribeira have more developed main stems and are generally taller (approx. 4 m.). inaddition to the trees there is some, but not much, dry grass of different species.
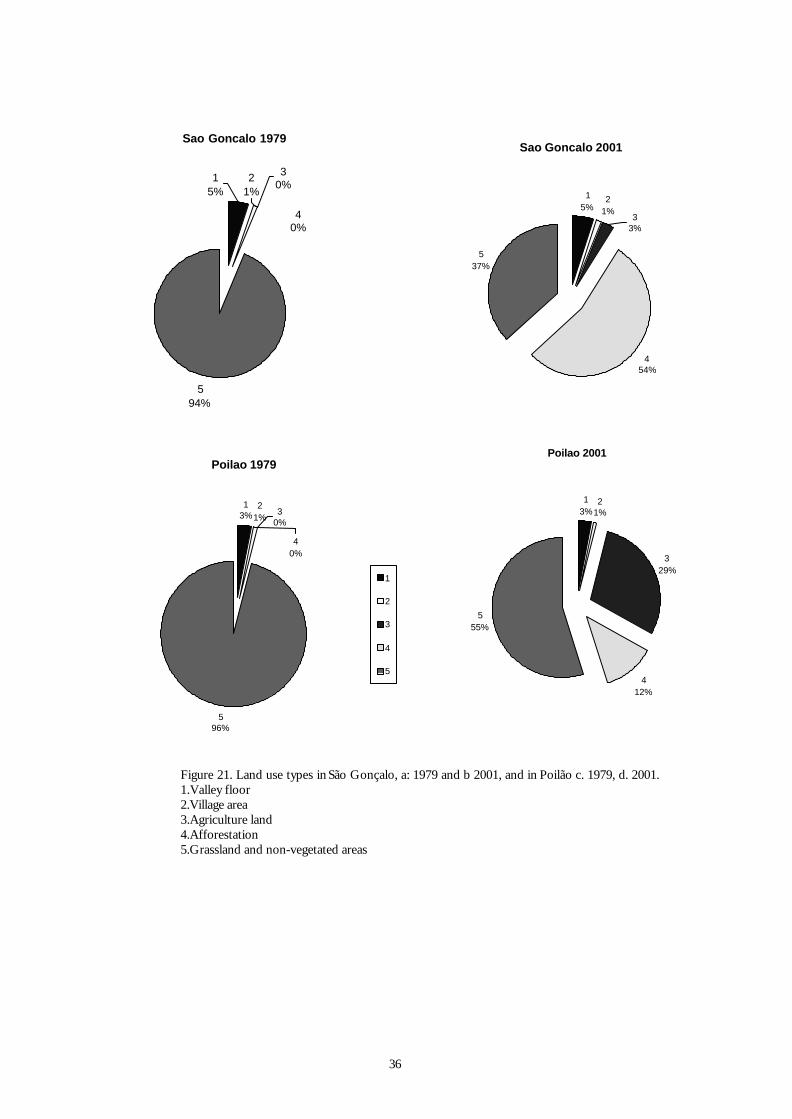
36
Figure 21. Land use types in São Gonçalo, a: 1979 and b 2001, and in Poilão c. 1979, d. 2001.1.Valley floor2.Village area3.Agriculture land4.Afforestation5.Grassland and non-vegetated areas
Sao Goncalo 2001
15%
21%
454%
537%
33%
Sao Goncalo 1979
594%
21%
15%
30%
40%
Poilao 1979
13%
21%
596%
30%
40%
1
2
3
4
5
Poilao 2001
13%
21%
329%
412%
555%
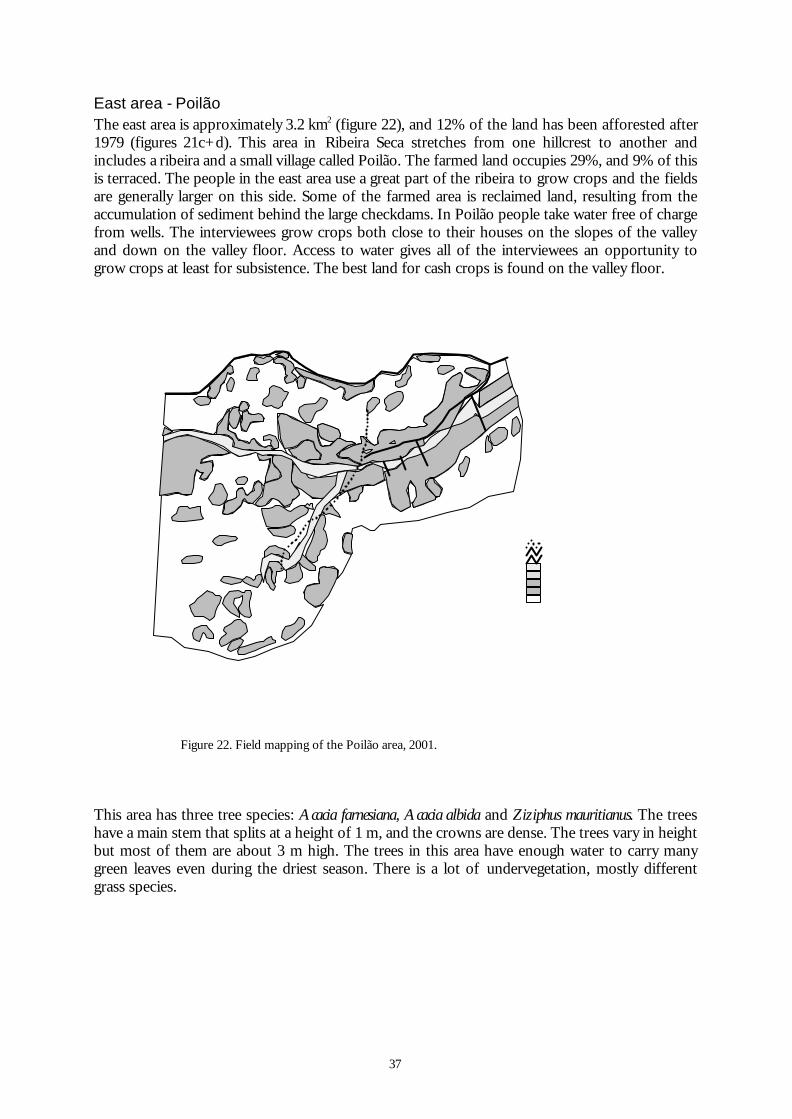
37
East area - PoilãoThe east area is approximately 3.2 km2 (figure 22), and 12% of the land has been afforested after1979 (figures 21c+d). This area in Ribeira Seca stretches from one hillcrest to another andincludes a ribeira and a small village called Poilão. The farmed land occupies 29%, and 9% of thisis terraced. The people in the east area use a great part of the ribeira to grow crops and the fieldsare generally larger on this side. Some of the farmed area is reclaimed land, resulting from theaccumulation of sediment behind the large checkdams. In Poilão people take water free of chargefrom wells. The interviewees grow crops both close to their houses on the slopes of the valleyand down on the valley floor. Access to water gives all of the interviewees an opportunity togrow crops at least for subsistence. The best land for cash crops is found on the valley floor.
GFRPRRCT
Figure 22. Field mapping of the Poilão area, 2001.
This area has three tree species: Acacia farnesiana, Acacia albida and Ziziphus mauritianus. The treeshave a main stem that splits at a height of 1 m, and the crowns are dense. The trees vary in heightbut most of them are about 3 m high. The trees in this area have enough water to carry manygreen leaves even during the driest season. There is a lot of undervegetation, mostly differentgrass species.
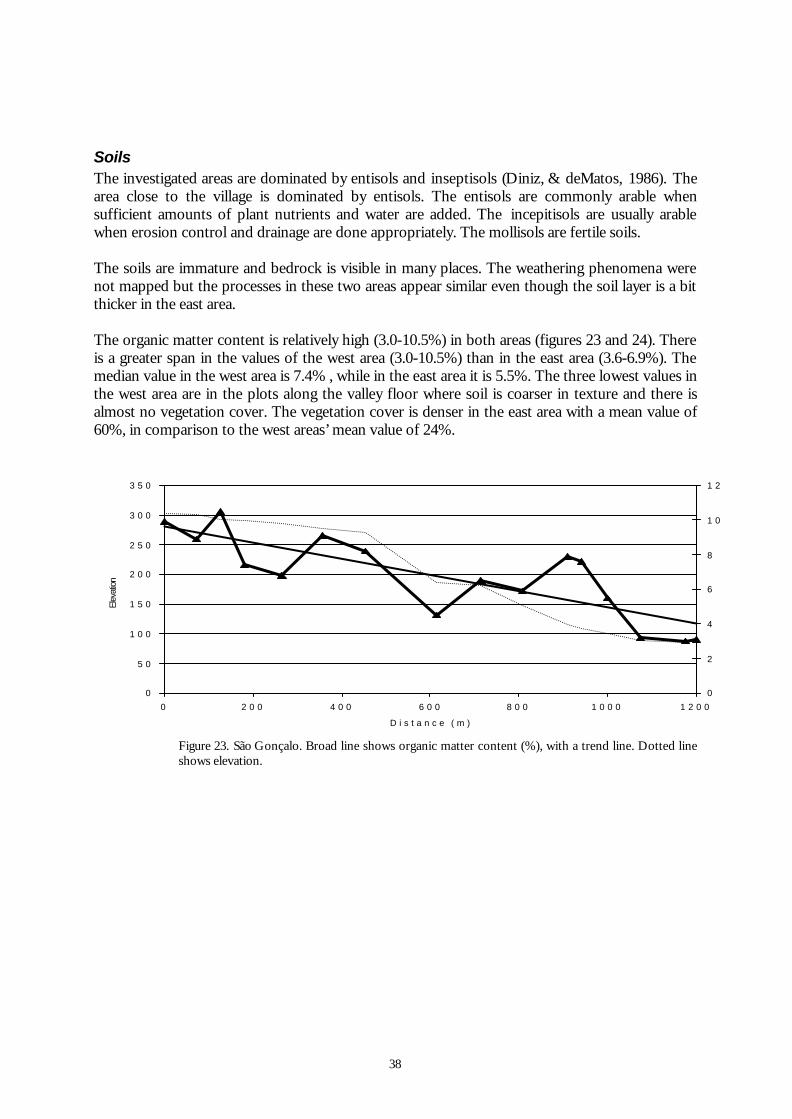
38
SoilsThe investigated areas are dominated by entisols and inseptisols (Diniz, & deMatos, 1986). Thearea close to the village is dominated by entisols. The entisols are commonly arable whensufficient amounts of plant nutrients and water are added. The incepitisols are usually arablewhen erosion control and drainage are done appropriately. The mollisols are fertile soils.
The soils are immature and bedrock is visible in many places. The weathering phenomena werenot mapped but the processes in these two areas appear similar even though the soil layer is a bitthicker in the east area.
The organic matter content is relatively high (3.0-10.5%) in both areas (figures 23 and 24). Thereis a greater span in the values of the west area (3.0-10.5%) than in the east area (3.6-6.9%). Themedian value in the west area is 7.4% , while in the east area it is 5.5%. The three lowest values inthe west area are in the plots along the valley floor where soil is coarser in texture and there isalmost no vegetation cover. The vegetation cover is denser in the east area with a mean value of60%, in comparison to the west areas’ mean value of 24%.
0
5 0
1 0 0
1 5 0
2 0 0
2 5 0
3 0 0
3 5 0
0 2 0 0 4 0 0 6 0 0 8 0 0 1 0 0 0 1 2 0 0
D i s t a n c e ( m )
Elev
ation
0
2
4
6
8
1 0
1 2
Figure 23. São Gonçalo. Broad line shows organic matter content (%), with a trend line. Dotted lineshows elevation.
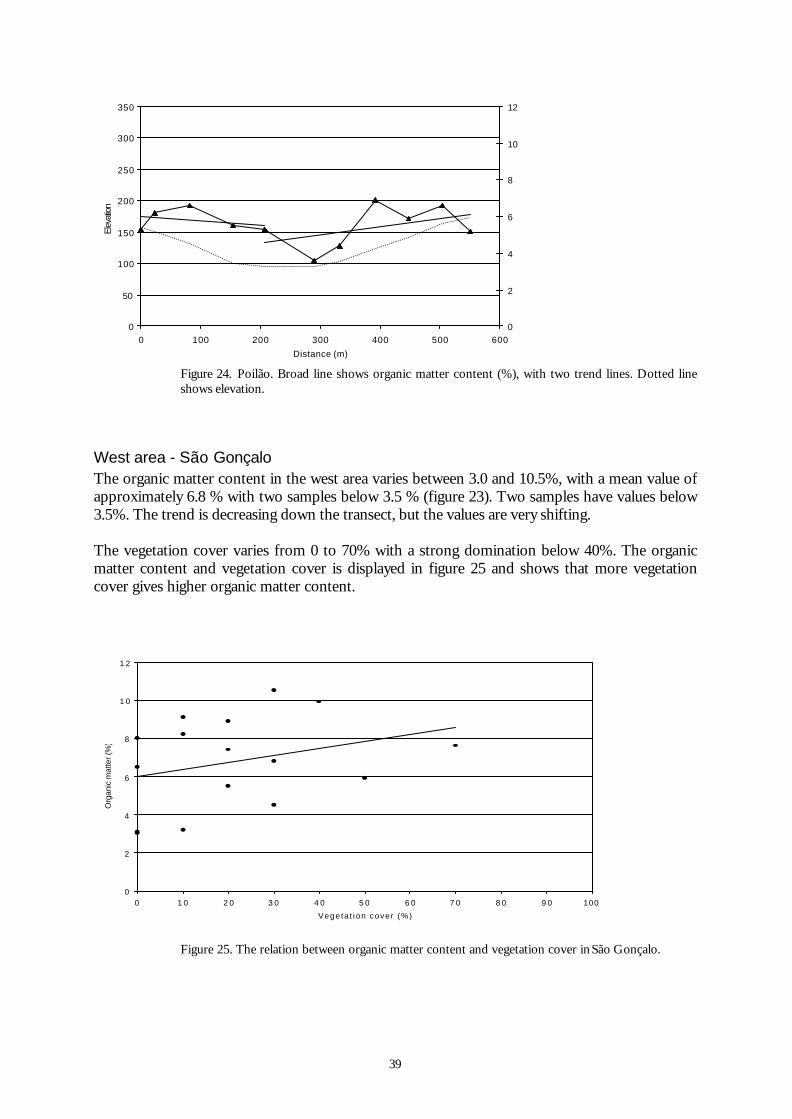
39
0
50
100
150
200
250
300
350
0 100 200 300 400 500 600
Distance (m)
Elev
ation
0
2
4
6
8
10
12
Figure 24. Poilão. Broad line shows organic matter content (%), with two trend lines. Dotted lineshows elevation.
West area - São GonçaloThe organic matter content in the west area varies between 3.0 and 10.5%, with a mean value ofapproximately 6.8 % with two samples below 3.5 % (figure 23). Two samples have values below3.5%. The trend is decreasing down the transect, but the values are very shifting.
The vegetation cover varies from 0 to 70% with a strong domination below 40%. The organicmatter content and vegetation cover is displayed in figure 25 and shows that more vegetationcover gives higher organic matter content.
0
2
4
6
8
1 0
1 2
0 1 0 2 0 3 0 4 0 5 0 6 0 7 0 8 0 9 0 100
Vege ta t i on cove r (%)
Org
anic
mat
ter (
%)
Figure 25. The relation between organic matter content and vegetation cover in São Gonçalo.

40
The soil texture is dominated by silty loam and sandy loam. The conductivity (ECW) variesbetween 0.16-0.41 mScm-1 with a mean of 0.24 mScm-1. The correlation between soil texture andconductivity shows a slightly increasing trend of salinity with coarser texture (figure 26).
0
0,05
0,1
0,15
0,2
0,25
0,3
0,35
0,4
0,45
1 2 3 4 5
Texture
Con
duct
ivity
mS
/cm
Figure 26. São Gonçalo, conductivity and texture. 1. Loam 2. Silty loam 3. Sandy loam 4. Loamysand 5. Sand
The correlation between conductivity and vegetation cover shows a decreasing trend withincreasing vegetation cover (figure 27).
0
0,05
0,1
0,15
0,2
0,25
0,3
0,35
0,4
0,45
0 10 20 30 40 50 60 70 80 90 100
Vegetation cover (%)
Con
duct
ivity
mS
/cm
Figure 27. São Gonçalo, the relation between conductivity and vegetation cover.
The pH values range from 6.9 to 8.2 and the pH trend decreases as the vegetation coverincreases, and increases with coarser soil texture. The slope angles are less than 20º in all plots,but two that have values of 20º and 22º. This area is characterised by a very thin soil layer(approx. 5-15 cm) on the hillsides and a rough to medium rough surface.
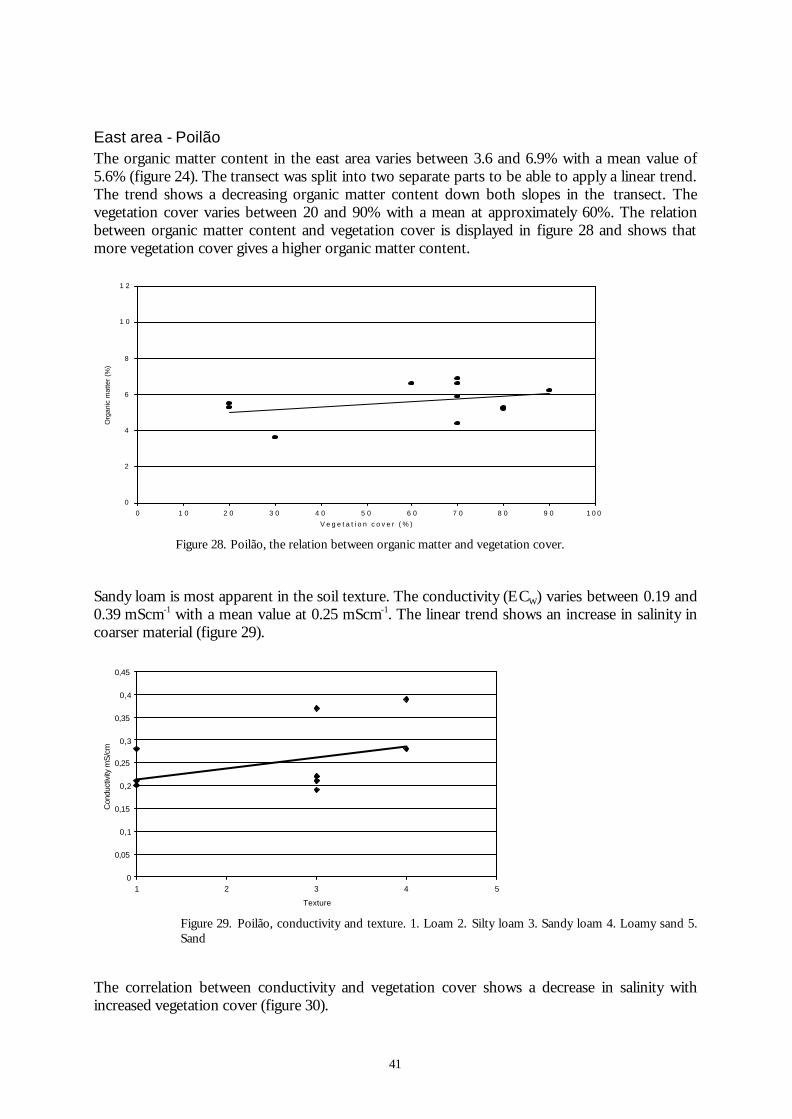
41
East area - PoilãoThe organic matter content in the east area varies between 3.6 and 6.9% with a mean value of5.6% (figure 24). The transect was split into two separate parts to be able to apply a linear trend.The trend shows a decreasing organic matter content down both slopes in the transect. Thevegetation cover varies between 20 and 90% with a mean at approximately 60%. The relationbetween organic matter content and vegetation cover is displayed in figure 28 and shows thatmore vegetation cover gives a higher organic matter content.
0
2
4
6
8
1 0
1 2
0 1 0 2 0 3 0 4 0 5 0 6 0 7 0 8 0 9 0 1 0 0
V e g e t a t i o n c o v e r ( % )
Org
anic
mat
ter
(%)
Figure 28. Poilão, the relation between organic matter and vegetation cover.
Sandy loam is most apparent in the soil texture. The conductivity (ECW) varies between 0.19 and0.39 mScm-1 with a mean value at 0.25 mScm-1. The linear trend shows an increase in salinity incoarser material (figure 29).
0
0,05
0,1
0,15
0,2
0,25
0,3
0,35
0,4
0,45
1 2 3 4 5
Texture
Con
duct
ivity
mS
/cm
Figure 29. Poilão, conductivity and texture. 1. Loam 2. Silty loam 3. Sandy loam 4. Loamy sand 5.Sand
The correlation between conductivity and vegetation cover shows a decrease in salinity withincreased vegetation cover (figure 30).
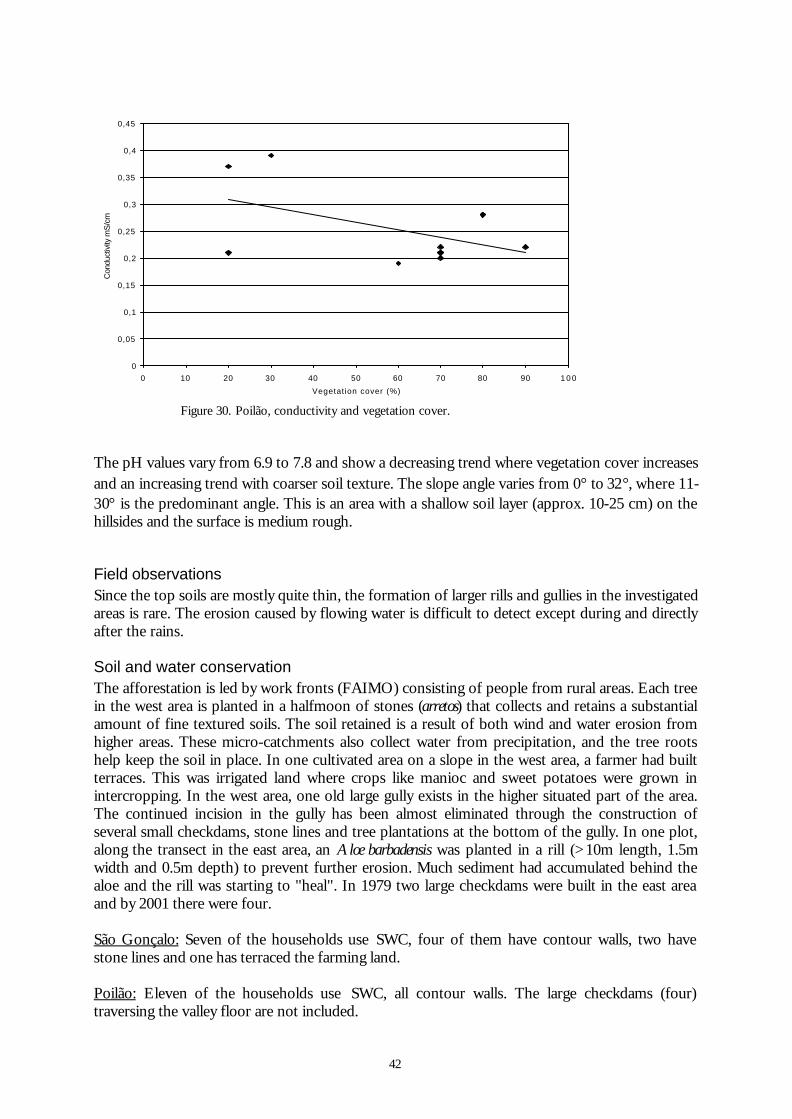
42
0
0,05
0,1
0,15
0,2
0,25
0,3
0,35
0,4
0,45
0 10 20 30 40 50 60 70 80 90 1 0 0
Vegetation cover (%)
Con
duct
ivity
mS
/cm
Figure 30. Poilão, conductivity and vegetation cover.
The pH values vary from 6.9 to 7.8 and show a decreasing trend where vegetation cover increasesand an increasing trend with coarser soil texture. The slope angle varies from 0° to 32°, where 11-30° is the predominant angle. This is an area with a shallow soil layer (approx. 10-25 cm) on thehillsides and the surface is medium rough.
Field observationsSince the top soils are mostly quite thin, the formation of larger rills and gullies in the investigatedareas is rare. The erosion caused by flowing water is difficult to detect except during and directlyafter the rains.
Soil and water conservationThe afforestation is led by work fronts (FAIMO) consisting of people from rural areas. Each treein the west area is planted in a halfmoon of stones (arretos) that collects and retains a substantialamount of fine textured soils. The soil retained is a result of both wind and water erosion fromhigher areas. These micro-catchments also collect water from precipitation, and the tree rootshelp keep the soil in place. In one cultivated area on a slope in the west area, a farmer had builtterraces. This was irrigated land where crops like manioc and sweet potatoes were grown inintercropping. In the west area, one old large gully exists in the higher situated part of the area.The continued incision in the gully has been almost eliminated through the construction ofseveral small checkdams, stone lines and tree plantations at the bottom of the gully. In one plot,along the transect in the east area, an Aloe barbadensis was planted in a rill (>10m length, 1.5mwidth and 0.5m depth) to prevent further erosion. Much sediment had accumulated behind thealoe and the rill was starting to "heal". In 1979 two large checkdams were built in the east areaand by 2001 there were four.
São Gonçalo: Seven of the households use SWC, four of them have contour walls, two havestone lines and one has terraced the farming land.
Poilão: Eleven of the households use SWC, all contour walls. The large checkdams (four)traversing the valley floor are not included.
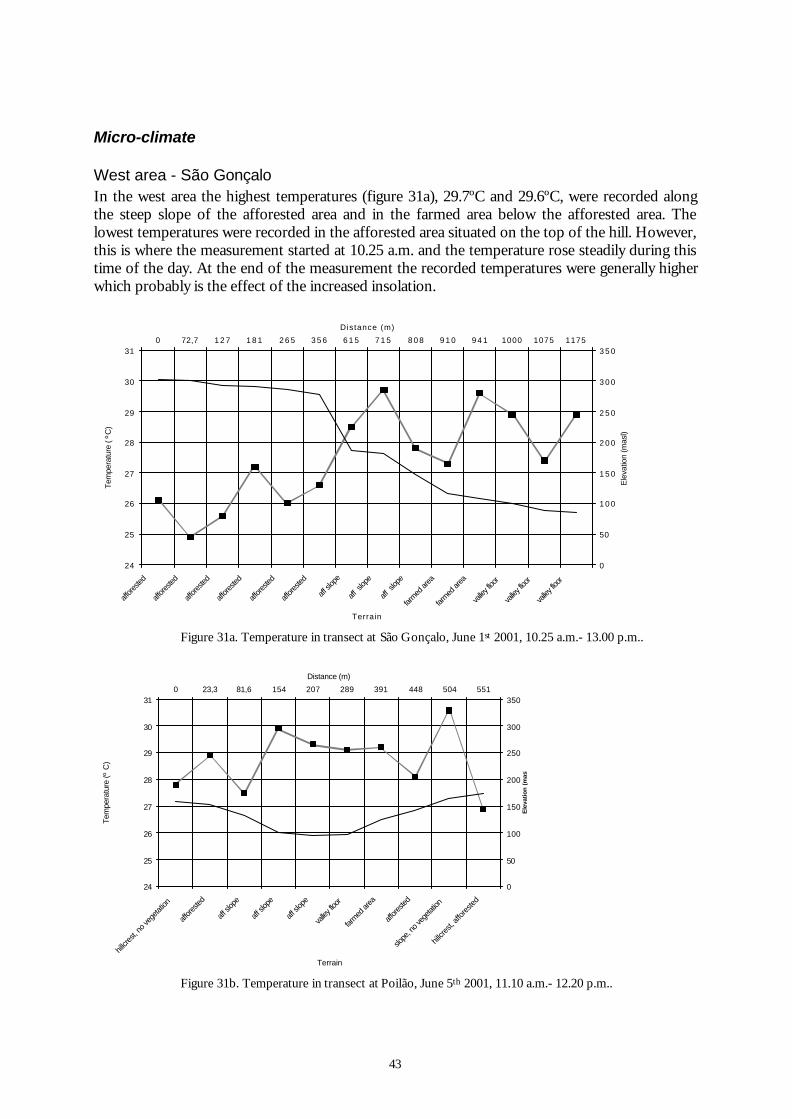
43
Micro-climate
West area - São GonçaloIn the west area the highest temperatures (figure 31a), 29.7ºC and 29.6ºC, were recorded alongthe steep slope of the afforested area and in the farmed area below the afforested area. Thelowest temperatures were recorded in the afforested area situated on the top of the hill. However,this is where the measurement started at 10.25 a.m. and the temperature rose steadily during thistime of the day. At the end of the measurement the recorded temperatures were generally higherwhich probably is the effect of the increased insolation.
24
25
26
27
28
29
30
31
affore
sted
affore
sted
affore
sted
affore
sted
affore
sted
affore
sted
aff sl
ope
aff s
lope
aff s
lope
farmed
area
farmed
area
valley
floor
valley
floor
valley
floor
Terrain
Tem
pera
ture
( ºC
)
0
50
1 0 0
1 5 0
2 0 0
2 5 0
3 0 0
3 5 00 72,7 1 2 7 1 8 1 2 6 5 3 5 6 6 1 5 7 1 5 8 0 8 9 1 0 9 4 1 1000 1075 1175
Distance (m)
Ele
vatio
n (m
asl)
Figure 31a. Temperature in transect at São Gonçalo, June 1st 2001, 10.25 a.m.- 13.00 p.m..
24
25
26
27
28
29
30
31
hillcr
est, n
o veg
etatio
n
affore
sted
aff sl
ope
aff sl
ope
aff sl
ope
valley
floor
farmed
area
affore
sted
slope
, no v
egeta
tion
hillcr
est, a
ffores
ted
Terrain
Tem
pera
ture
(º C
)
0
50
100
150
200
250
300
3500 23,3 81,6 154 207 289 391 448 504 551
Distance (m)
Ele
vati
on
(m
asl)
Figure 31b. Temperature in transect at Poilão, June 5th 2001, 11.10 a.m.- 12.20 p.m..
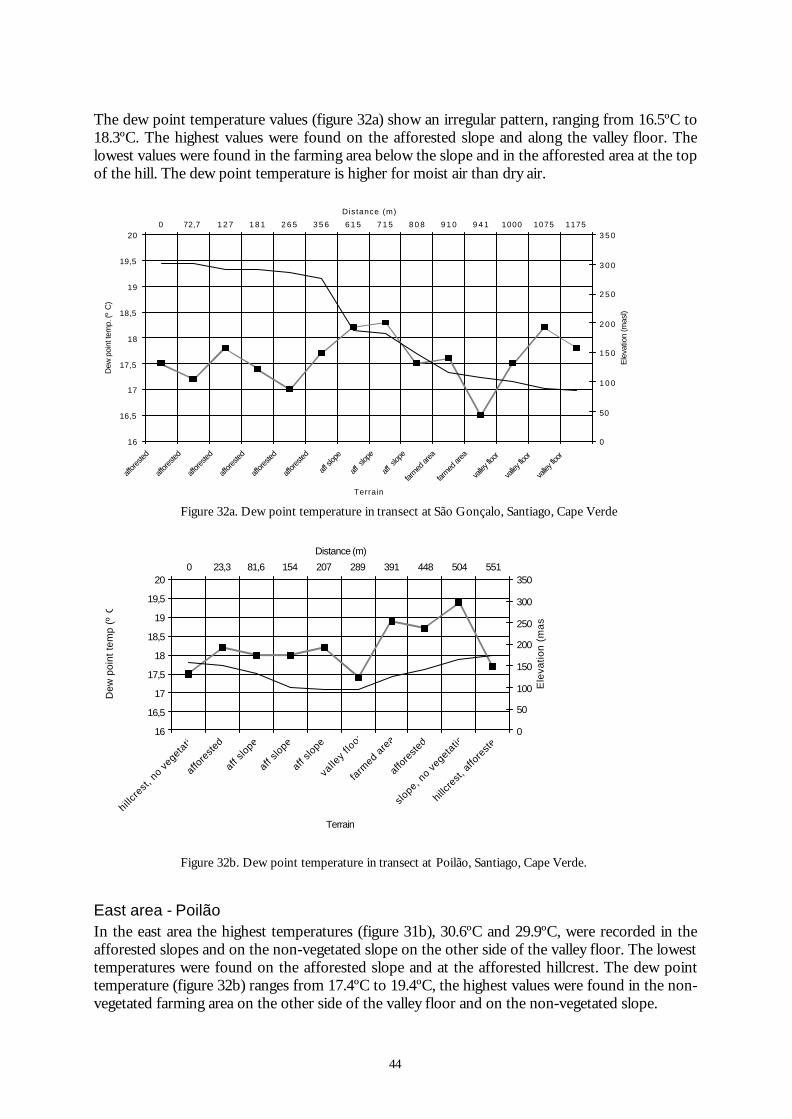
44
The dew point temperature values (figure 32a) show an irregular pattern, ranging from 16.5ºC to18.3ºC. The highest values were found on the afforested slope and along the valley floor. Thelowest values were found in the farming area below the slope and in the afforested area at the topof the hill. The dew point temperature is higher for moist air than dry air.
16
16,5
17
17,5
18
18,5
19
19,5
20
affore
sted
affore
sted
affore
sted
affore
sted
affore
sted
affore
sted
aff sl
ope
aff s
lope
aff s
lope
farmed
area
farmed
area
valley
floor
valley
floor
valley
floor
Terrain
Dew
poi
nt te
mp.
(º C
)
0
50
1 0 0
1 5 0
2 0 0
2 5 0
3 0 0
3 5 00 72,7 1 2 7 1 8 1 2 6 5 3 5 6 6 1 5 7 1 5 8 0 8 9 1 0 9 4 1 1000 1075 1175
Distance (m)
Ele
vatio
n (m
asl)
Figure 32a. Dew point temperature in transect at São Gonçalo, Santiago, Cape Verde
16
16,5
17
17,5
18
18,5
19
19,5
20
hillcre
st, n
o vegeta
tion
affo
reste
d
aff slo
pe
aff slo
pe
aff slo
pe
valle
y flo
or
farm
ed are
a
affo
reste
d
slope, n
o vegeta
tion
hillcr
est,
affo
reste
d
Terrain
Dew
poi
nt te
mp
(º C
)
0
50
100
150
200
250
300
3500 23,3 81,6 154 207 289 391 448 504 551
Distance (m)E
leva
tion
(mas
l)
Figure 32b. Dew point temperature in transect at Poilão, Santiago, Cape Verde.
East area - PoilãoIn the east area the highest temperatures (figure 31b), 30.6ºC and 29.9ºC, were recorded in theafforested slopes and on the non-vegetated slope on the other side of the valley floor. The lowesttemperatures were found on the afforested slope and at the afforested hillcrest. The dew pointtemperature (figure 32b) ranges from 17.4ºC to 19.4ºC, the highest values were found in the non-vegetated farming area on the other side of the valley floor and on the non-vegetated slope.
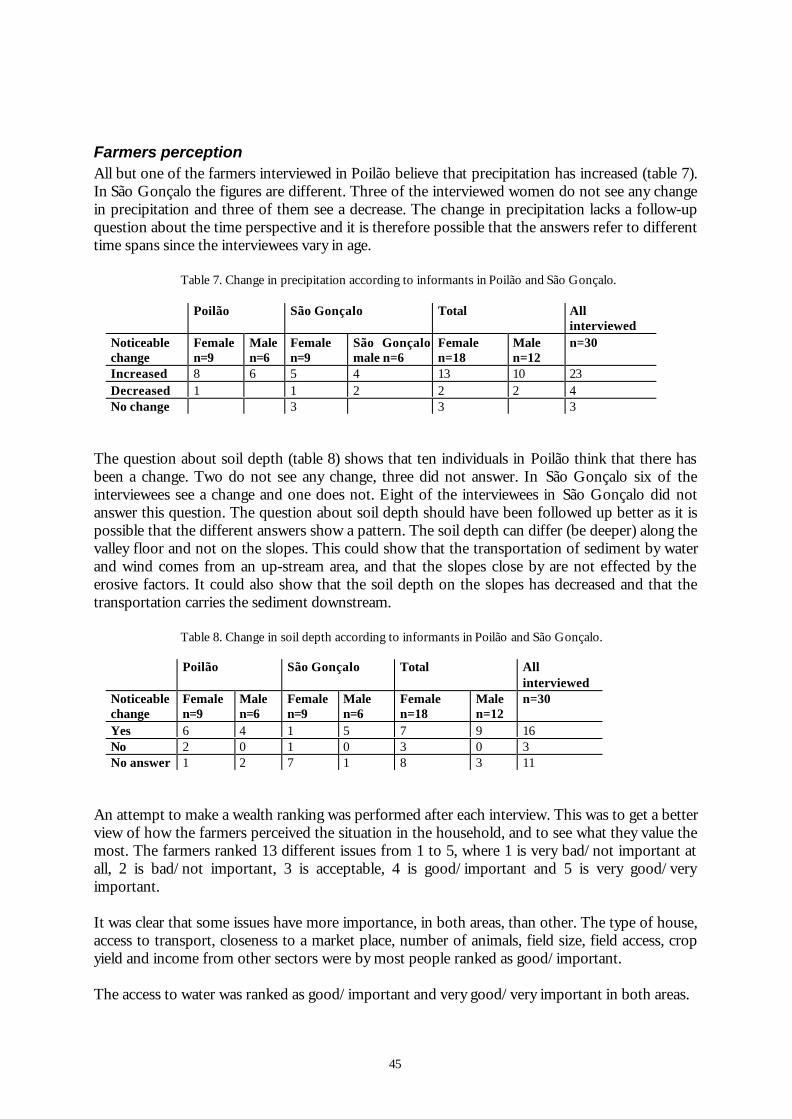
45
Farmers perceptionAll but one of the farmers interviewed in Poilão believe that precipitation has increased (table 7).In São Gonçalo the figures are different. Three of the interviewed women do not see any changein precipitation and three of them see a decrease. The change in precipitation lacks a follow-upquestion about the time perspective and it is therefore possible that the answers refer to differenttime spans since the interviewees vary in age.
Table 7. Change in precipitation according to informants in Poilão and São Gonçalo.
Poilão São Gonçalo Total Allinterviewed
Noticeablechange
Femalen=9
Malen=6
Femalen=9
São Gonçalomale n=6
Femalen=18
Malen=12
n=30
Increased 8 6 5 4 13 10 23Decreased 1 1 2 2 2 4No change 3 3 3
The question about soil depth (table 8) shows that ten individuals in Poilão think that there hasbeen a change. Two do not see any change, three did not answer. In São Gonçalo six of theinterviewees see a change and one does not. Eight of the interviewees in São Gonçalo did notanswer this question. The question about soil depth should have been followed up better as it ispossible that the different answers show a pattern. The soil depth can differ (be deeper) along thevalley floor and not on the slopes. This could show that the transportation of sediment by waterand wind comes from an up-stream area, and that the slopes close by are not effected by theerosive factors. It could also show that the soil depth on the slopes has decreased and that thetransportation carries the sediment downstream.
Table 8. Change in soil depth according to informants in Poilão and São Gonçalo.
Poilão São Gonçalo Total Allinterviewed
Noticeablechange
Femalen=9
Malen=6
Femalen=9
Malen=6
Femalen=18
Malen=12
n=30
Yes 6 4 1 5 7 9 16No 2 0 1 0 3 0 3No answer 1 2 7 1 8 3 11
An attempt to make a wealth ranking was performed after each interview. This was to get a betterview of how the farmers perceived the situation in the household, and to see what they value themost. The farmers ranked 13 different issues from 1 to 5, where 1 is very bad/not important atall, 2 is bad/not important, 3 is acceptable, 4 is good/important and 5 is very good/veryimportant.
It was clear that some issues have more importance, in both areas, than other. The type of house,access to transport, closeness to a market place, number of animals, field size, field access, cropyield and income from other sectors were by most people ranked as good/important.
The access to water was ranked as good/important and very good/very important in both areas.
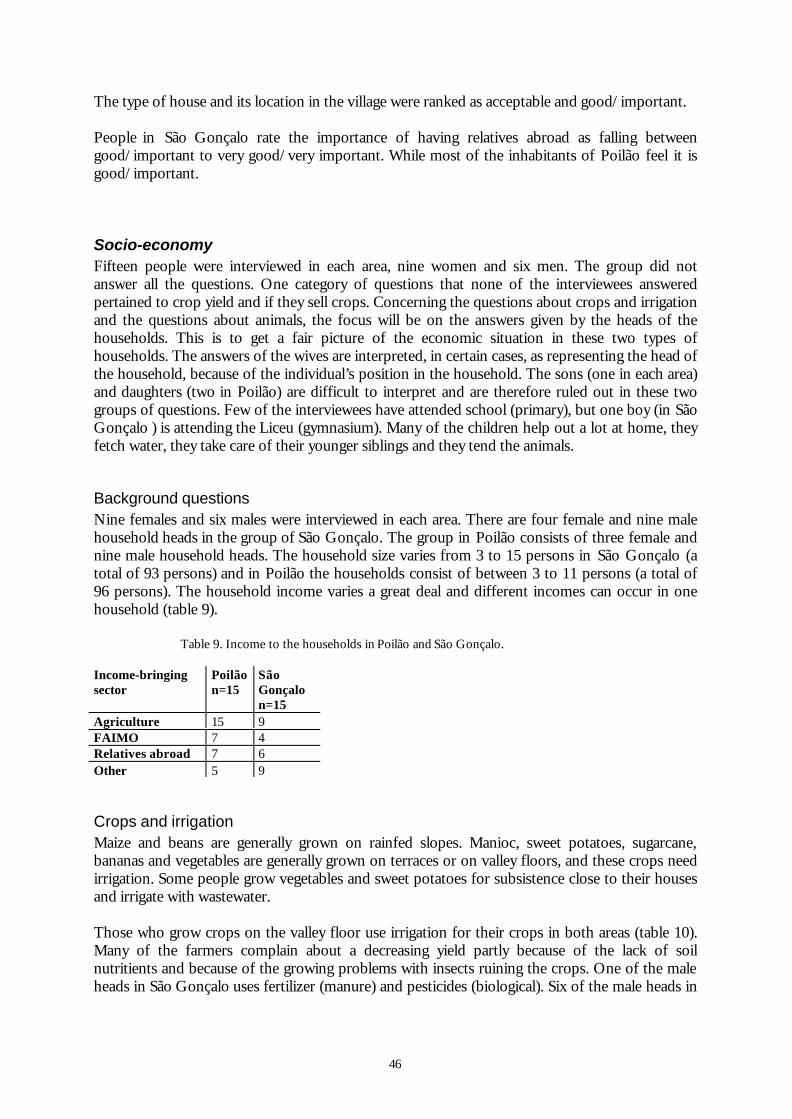
46
The type of house and its location in the village were ranked as acceptable and good/important.
People in São Gonçalo rate the importance of having relatives abroad as falling betweengood/important to very good/very important. While most of the inhabitants of Poilão feel it isgood/important.
Socio-economyFifteen people were interviewed in each area, nine women and six men. The group did notanswer all the questions. One category of questions that none of the interviewees answeredpertained to crop yield and if they sell crops. Concerning the questions about crops and irrigationand the questions about animals, the focus will be on the answers given by the heads of thehouseholds. This is to get a fair picture of the economic situation in these two types ofhouseholds. The answers of the wives are interpreted, in certain cases, as representing the head ofthe household, because of the individual’s position in the household. The sons (one in each area)and daughters (two in Poilão) are difficult to interpret and are therefore ruled out in these twogroups of questions. Few of the interviewees have attended school (primary), but one boy (in SãoGonçalo ) is attending the Liceu (gymnasium). Many of the children help out a lot at home, theyfetch water, they take care of their younger siblings and they tend the animals.
Background questionsNine females and six males were interviewed in each area. There are four female and nine malehousehold heads in the group of São Gonçalo. The group in Poilão consists of three female andnine male household heads. The household size varies from 3 to 15 persons in São Gonçalo (atotal of 93 persons) and in Poilão the households consist of between 3 to 11 persons (a total of96 persons). The household income varies a great deal and different incomes can occur in onehousehold (table 9).
Table 9. Income to the households in Poilão and São Gonçalo.
Income-bringingsector
Poilãon=15
SãoGonçalon=15
Agriculture 15 9FAIMO 7 4Relatives abroad 7 6Other 5 9
Crops and irrigationMaize and beans are generally grown on rainfed slopes. Manioc, sweet potatoes, sugarcane,bananas and vegetables are generally grown on terraces or on valley floors, and these crops needirrigation. Some people grow vegetables and sweet potatoes for subsistence close to their housesand irrigate with wastewater.
Those who grow crops on the valley floor use irrigation for their crops in both areas (table 10).Many of the farmers complain about a decreasing yield partly because of the lack of soilnutritients and because of the growing problems with insects ruining the crops. One of the maleheads in São Gonçalo uses fertilizer (manure) and pesticides (biological). Six of the male heads in
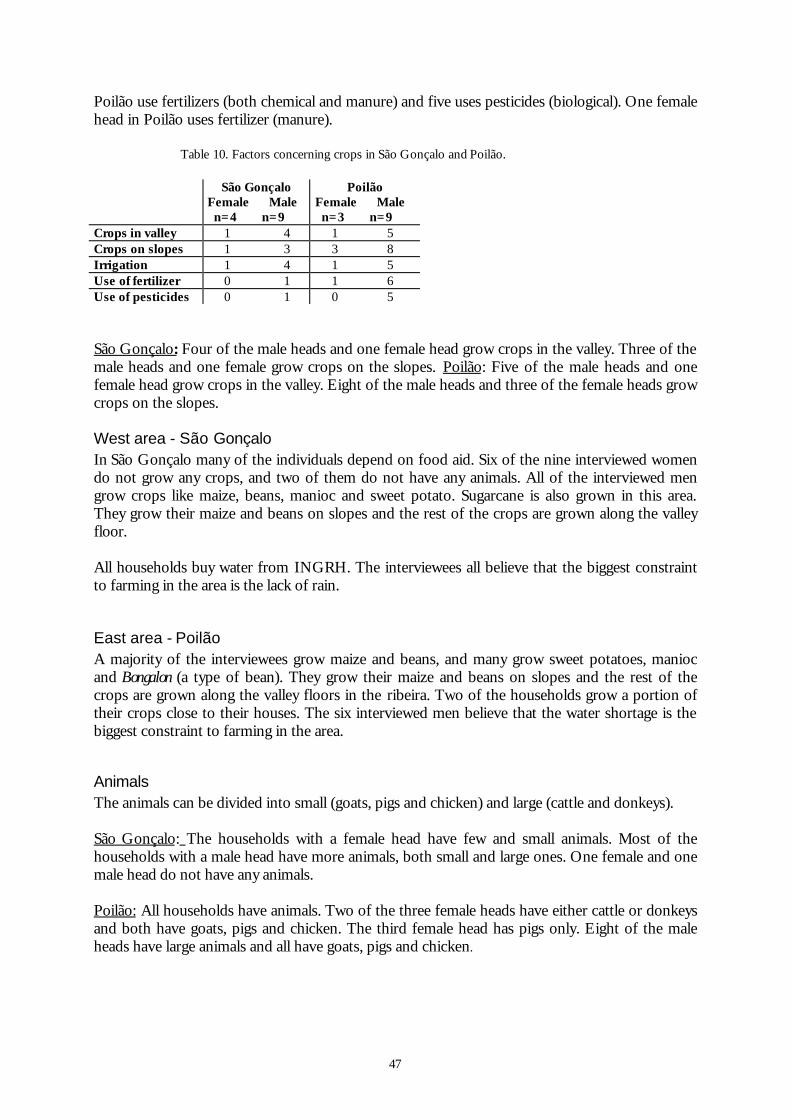
47
Poilão use fertilizers (both chemical and manure) and five uses pesticides (biological). One femalehead in Poilão uses fertilizer (manure).
Table 10. Factors concerning crops in São Gonçalo and Poilão.
São GonçaloFemale Male n=4 n=9
PoilãoFemale Male n=3 n=9
Crops in valley 1 4 1 5Crops on slopes 1 3 3 8Irrigation 1 4 1 5Use of fertilizer 0 1 1 6Use of pesticides 0 1 0 5
São Gonçalo: Four of the male heads and one female head grow crops in the valley. Three of themale heads and one female grow crops on the slopes. Poilão: Five of the male heads and onefemale head grow crops in the valley. Eight of the male heads and three of the female heads growcrops on the slopes.
West area - São GonçaloIn São Gonçalo many of the individuals depend on food aid. Six of the nine interviewed womendo not grow any crops, and two of them do not have any animals. All of the interviewed mengrow crops like maize, beans, manioc and sweet potato. Sugarcane is also grown in this area.They grow their maize and beans on slopes and the rest of the crops are grown along the valleyfloor.
All households buy water from INGRH. The interviewees all believe that the biggest constraintto farming in the area is the lack of rain.
East area - PoilãoA majority of the interviewees grow maize and beans, and many grow sweet potatoes, maniocand Bongalon (a type of bean). They grow their maize and beans on slopes and the rest of thecrops are grown along the valley floors in the ribeira. Two of the households grow a portion oftheir crops close to their houses. The six interviewed men believe that the water shortage is thebiggest constraint to farming in the area.
AnimalsThe animals can be divided into small (goats, pigs and chicken) and large (cattle and donkeys).
São Gonçalo: The households with a female head have few and small animals. Most of thehouseholds with a male head have more animals, both small and large ones. One female and onemale head do not have any animals.
Poilão: All households have animals. Two of the three female heads have either cattle or donkeysand both have goats, pigs and chicken. The third female head has pigs only. Eight of the maleheads have large animals and all have goats, pigs and chicken.
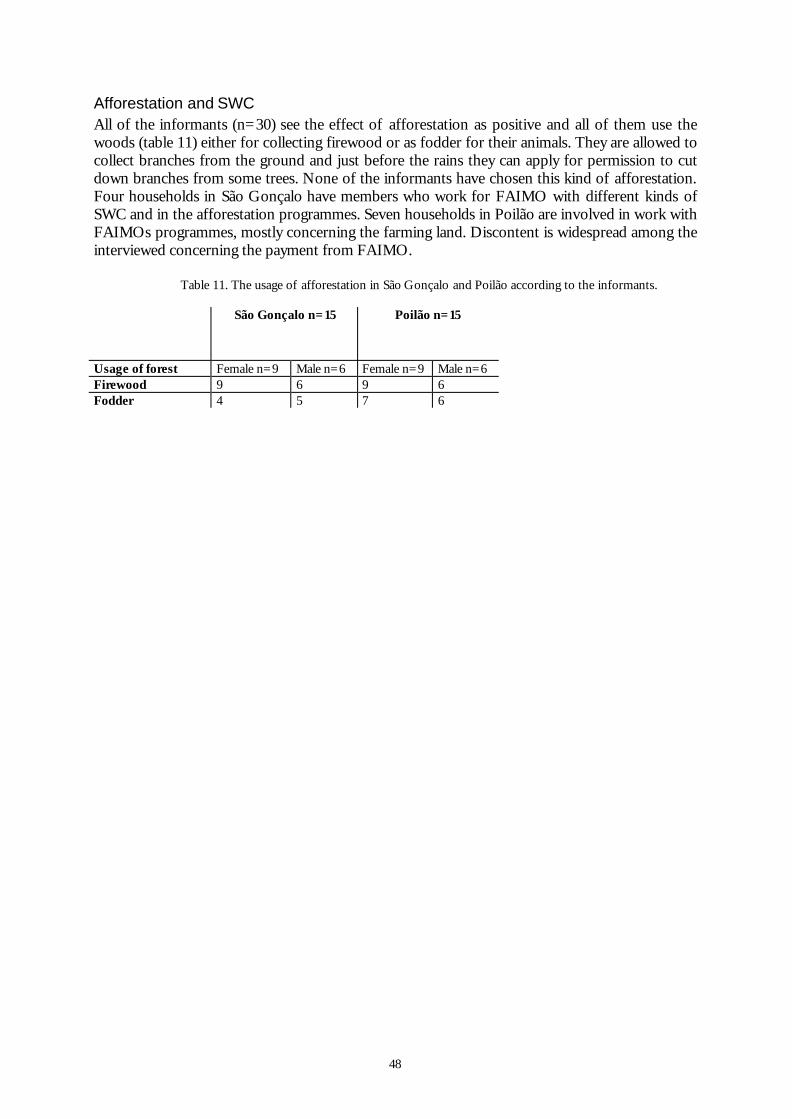
48
Afforestation and SWCAll of the informants (n=30) see the effect of afforestation as positive and all of them use thewoods (table 11) either for collecting firewood or as fodder for their animals. They are allowed tocollect branches from the ground and just before the rains they can apply for permission to cutdown branches from some trees. None of the informants have chosen this kind of afforestation.Four households in São Gonçalo have members who work for FAIMO with different kinds ofSWC and in the afforestation programmes. Seven households in Poilão are involved in work withFAIMOs programmes, mostly concerning the farming land. Discontent is widespread among theinterviewed concerning the payment from FAIMO.
Table 11. The usage of afforestation in São Gonçalo and Poilão according to the informants.
São Gonçalo n=15 Poilão n=15
Usage of forest Female n=9 Male n=6 Female n=9 Male n=6Firewood 9 6 9 6Fodder 4 5 7 6
49
Chapter summary
Climate• The two Cape Verdean and three Sahelian stations all show decreasing precipitation trends.• The regional variation in mean precipitation is great on Santiago, where São Francisco
(approx. 100 masl) has 196 mm, and São Jorge dos Orgãos (approx. 350 masl) has 449 mm.The regional variation is even more apparent with regard to the daily data, where SãoFrancisco has 16-26 days with precipitation, São Jorge dos Orgãos 44-103, and Chão Bom 5-16 days (1991-2000).
• The three largest precipitation events represent as much as 87% of the total yearlyprecipitation, but also as little as 19%.
• The connection to ENSO events is weak, with El Niño events occurring both in years withprecipitation above average and in years with precipitation below average.
• It is difficult to see effects of the afforested areas on temperature and dew point temperature.Most probably due to increased insolation, small trees and turbulence caused by the seabreeze.
• 9 households in São Gonçalo and 14 in Poilão see an increase in precipitation. 3 in SãoGonçalo and 1 in Poilão see a decrease in precipitation. 3 in São Gonçalo do not see anychange.
Soil and land use• 54% of the land in the São Gonçalo area is afforested, compared to 12% in the Poilão area, in
2001. Many trees in São Gonçalo are low (<2m) and the stems split close to the surface. InPoilão the trees are approximately 3m with well-developed stems that split at 1m and thathave dense crowns.
• All individuals interviewed (n=30) believe that afforestation is positive, and they all use theforest as firewood and some use it for animal fodder.
• Both areas are dominated by entisols and inceptisols, both are arable when enough water,nutrients and erosion control are available.
• 3% is agricultural land in São Gonçalo, compared to 29% in Poilão (9% is terraced), in 2001.• The organic matter content is relatively high in both areas (>3%). The organic matter content
increases with increasing vegetation cover in both areas. 7 people in Poilão use fertilizers andonly 1 in São Gonçalo.
• In both areas the conductivity (mScm-1) shows an increasing trend as soil texture gets coarser.An increasing pH trend is also apparent in both areas. The conductivity shows a decreasingtrend with increasing vegetation cover in both areas. The pH trend is also decreasing withincreasing vegetation cover in both areas.
• 6 households in São Gonçalo, and 10 in Poilão, see a change in soil depth. 1 household inSão Gonçalo and 2 in Poilão do not see any change. 8 households in São Gonçalo and 3 inPoilão did not answer this question.
Socio-economy• Many of the households keep goats. All households in Poilão have animals, and many have
large animals like donkeys and cattle.• Many people have income from more than one sector.• 9 interviewees in São Gonçalo, and 15 in Poilão, have agriculture as a household income.• In São Gonçalo people buy water, in Poilão they take it from wells where it is free of charge.
50
5. Discussion
ClimateIn stations where data reaches the 1990s, a clear reduction in precipitation can be seen from the1970s. This desiccation has been examined in several studies, and recent research attributes it tonatural causes (that is, not suggesting it is caused by the degradation of regional land cover causedby land use changes, or the general warming of the planet). The most probable cause of the thesedrier circumstances is the coupled ocean-atmosphere system, and the dominant Sea SurfaceTemperature (SST) anomaly configuration associated with the Sahelian desiccation has been thepattern where southern oceans are warmer and northern oceans are cooler than average. Thispattern has tended to persist during the multi-year dry periods in Sahel (Hulme, 2001). Thisrelationship can account for a large part of the longer-term trend in Sahel precipitation withoutbeing able to account for the year-to-year variations around this trend. The year-to-year variabilitytends to be more related to SST anomaly patterns in the tropical Atlantic or associated with theEl Niño Southern Oscillation (Nicholson & Kim, 1997).
The long-term precipitation records for the stations of Praia and Mindelo in Cape Verde do notreach past 1975 and nothing can therefore be said about their current situation. The data for SãoJorge dos Orgãos and São Francisco does however show that dry years keep returning eventhough the last three years have given substantial precipitation amounts.
The precipitation is caused by local convection cells associated with the northernmost extensionof the ITCZ and the tropical cyclones (de Brum Ferreira, 1996, p 112). But orographic liftinggives the mountainous areas more precipitation than the flat, lower situated areas. Since mostprecipitation falls in the mountains, the south-western part of the island of Santiago tends to getonly small amounts of precipitation. The precipitation data for the west side of Santiago ishowever insufficient, and for the 1990s two years have enough data to allow accurate annualsummaries. However the differences in precipitation amounts between the areas around Poilãoand São Gonçalo are clearly apparent when looking at the vegetation. On the west side, whereSão Gonçalo is situated, the trees are generally in less good shape than those in Poilão, and sometrees, particularly in the higher-elevated areas, are more like shrubs than trees. The differences inundergrowth are even more obvious. In São Gonçalo (west area) the undergrowth is very sparseand in higher elevated ground, almost non-existent. In Poilão, on the contrary, the undergrowth(mainly grass) is abundant and more dense than in São Gonçalo .
The precipitation falling in the mountains reaches the lower sites as runoff in the ribeiras. Sincethe mountains in the eastern parts of Santiago receives most precipitation, the lower-situatedparts of eastern Santiago benefit more from the runoff than the western parts of Santiago. Rainshadow makes the western parts of Santiago less suitable for farming, and rainfed farming isalmost impossible.
The number of days with precipitation for the stations of São Francisco, São Jorge dos Orgãosand Chão Bom reveal the impact of the large precipitation events on the yearly totals. In thetables (3, 4, 5) for the daily events, the three largest precipitation events every year (1991-2000)are shown as percentage of the yearly precipitation. The values range from as low as 19.4% (SãoJorge dos Orgãos, 1994) to as high as 86.6% (Chão Bom, 1994). On the average, the three largestevents give 61.8% of the total precipitation in São Francisco, 42.8% in São Jorge dos Orgãos and68.9% in Chão Bom (years 1991-2000, all three stations). The marked difference between São
51
Jorge dos Orgãos and the stations of São Francisco and Chão Bom can be explained by thelocations of the stations. While São Jorge dos Orgãos is situated in the mountains in the centralparts of the islands, the stations of Chão Bom and São Francisco are situated in the low-lyingarid/semi-arid parts of the island, in the north-west and in the south-east respectively. São Jorgedos Orgãos therefore benefits from the orographic effects on precipitation, receiving a highertotal precipitation and having more days with precipitation. The higher number of days withprecipitation in São Jorge dos Orgãos is an effect of orographic lifting, which results in more dayswith low amounts of precipitation than what occurs in the low-lying parts of the island. Thehigher number of days with low precipitation amounts is, to a large extent, responsible for thehigher yearly totals in São Jorge dos Orgãos, and the three largest events therefore affect theyearly total to a lesser extent at this station than they do in the stations of Chão Bom and SãoFrancisco. From the tables (3, 4, 5) it is also clear that the number of precipitation events variesconsiderably from year to year. This variability is one of the characteristics of the Sahelian climate(Hulme, 2001, p. 19).
The daily data for the stations of Belèm (1999-2000), Chão Bom (1991-2000), Pico Leão (1997-2000), São Francisco (1991-2000), São João Baptista (1991-1993, 1997, 1999), São Jorge dosOrgãos (1991-2000) and Trindade (1991-2000) reveals that, when using São Jorge dos Orgãos asa reference, almost all precipitation events coincide. That is, when precipitation occurs at one ofthe stations mentioned above, São Jorge dos Orgãos most certainly also experiencesprecipitation. However, precipitation may occur at one station and not in São Jorge dos Orgãos,but normally this happens only a few times a year, and some years not at all. Precipitation mayhowever occur at one station and not at any of the other stations, disregarding São Jorge dosOrgãos. The distribution of precipitation could therefore be considered to vary widely spatially.
The eastern parts of Santiago clearly benefits from the orographic induced precipitation broughtby the NE trade winds. This has made the eastern side of Santiago the food basket of the island,and most areas here are used for agriculture, except for some parts of the heights and the mostlow-lying parts facing the sea, which are used for afforestation. When comparing the land use inPoilão and São Gonçalo, the differences in afforestation and agriculture are striking. In Poilão,situated on the east side of Santiago, 29% of the land is used for agriculture, while in SãoGonçalo only 3% of the land is used for agriculture. When comparing the figures forafforestation, Poilão 12%, and São Gonçalo 54%, it is quite clear that the two areas have vastlydifferent conditions regarding land use. Since the area of Poilão benefits from its eastward facingposition, getting more precipitation and water runoff, it is much more suitable for farming thanthe westward area of São Gonçalo, which is situated in rain shadow. The area of São Gonçalo ispractically impossible to farm without irrigation and is instead mostly used for afforestation.
The aquifers in the valley floors are annually recharged through precipitation. Even thoughprecipitation falls in Pico Leão, the amounts are less and the events are fewer than in São Jorgedos Orgãos, and the produced runoff reaching São Gonçalo is less than in Poilão.
Both investigated areas are situated in approximately the same climatic zone, the semi-arid, butthe area of Poilão benefits greatly from its eastward facing position getting more runoff from thehigher areas, and therefore having water more readily available than the area of São Gonçalo .
The orographic effects of elevation on precipitation are clearly shown by the differences betweenSão Francisco and São Jorge dos Orgãos. The regional climate in São Francisco is much drierthan in São Jorge dos Orgãos as a result of the differences in altitude.
52
It is surprising that São Francisco shows a slightly increasing precipitation trend while São Jorgedos Orgãos and the other stations all show decreasing trends. The slightly increasing trend mightbe caused by the fact that the years 1974-1977 are lacking certain data in São Francisco, but notin São Jorge dos Orgãos. The year of 1977 was the driest year recorded in São Jorge dos Orgãos1961-2001.
During the last three years (1999-2001), the precipitation has been good on Santiago, and that isthe most probable explanation to why some of the interviewed farmers believe that precipitationhas increased.
Connections to ENSOThe influence of ENSO on the precipitation in Cape Verde is displayed in the graphs of SãoFrancisco and São Jorge dos Orgãos (figures 15b and 16b). Although the time series analysisindicates that there may be connections to ENSO, with cycles of 2, 4 and 6 years, the graphs withENSO years marked show that ENSO can not entirely be linked to years which are drier thannormal. ENSO events occur both during years with more precipitation than normal and yearswith less precipitation than normal. This indicates that the Cape Verde islands are not as sensitiveto ENSO events as other parts of Africa. This supports the theory that West Africa appears to beless sensitive to ENSO events compared to other low-latitude regions (McGregor & Nieuwolt,1998).
Nicholson & Kim (1997) found that no clear ENSO effect of rainfall is evident in the Sahel,although some anomalies could be attributed to ENSO. The strongest effects of ENSO foundwere the reduction of rainfall in eastern equatorial and south-eastern Africa during the secondhalf of the ENSO-cycle.
Land useThe farming of Cape Verde does not meet the needs of its population. The lack of water, no orlittle access to fertilizers, and the poor soil are major constraints (Breman, et al, 2001, p 68) thatprobably makes it difficult for Cape Verde to ever be completely self-supporting in food crops.There are large differences in land use from 1979 to 2001.
Different restorative management plans, financed by FAIMO, have helped “build up” both areassince 1979. Since work fronts traditionally offer jobs to the rural population during times ofcrops failure or droughts, they have provided a possible source of income. This extra income hasmade it possible for many of the interviewees to stay in their villages thus eliminated the need toseek work elsewhere. In São Gonçalo many trees have been planted and many arretos have beenbuilt. More than 50% of the region was afforested during that period in the drier west area. Thisarea is not suited for cash crops, and barely for subsistence crops like maize and beans either.Efforts have been concentrated on afforestation rather than on farming. Trees take care ofthemselves and can be used as firewood and animal fodder during the driest periods of the year.Those who grow cash crops in São Gonçalo have access to the flat areas, on the valley floor, andwater. Only 3% of São Gonçalo is farmed. This area is isolated and the frequency oftransportation opportunities is low.
In Poilão a lot of the farmed land has been terraced, two large checkdams have been built andplantation of trees on the steep slopes and on the heights have been made since 1979. In the eastarea, a part of the island where a lot of cash crops are grown, only 12% is afforested. Since the
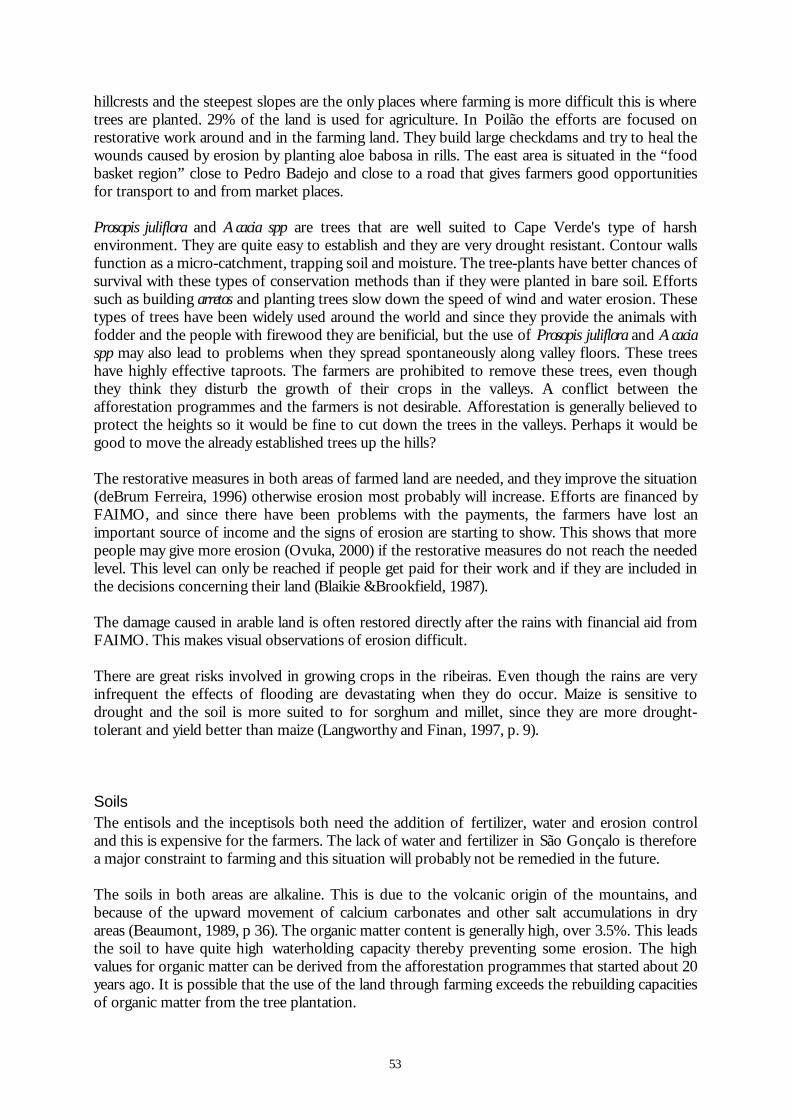
53
hillcrests and the steepest slopes are the only places where farming is more difficult this is wheretrees are planted. 29% of the land is used for agriculture. In Poilão the efforts are focused onrestorative work around and in the farming land. They build large checkdams and try to heal thewounds caused by erosion by planting aloe babosa in rills. The east area is situated in the “foodbasket region” close to Pedro Badejo and close to a road that gives farmers good opportunitiesfor transport to and from market places.
Prosopis juliflora and Acacia spp are trees that are well suited to Cape Verde's type of harshenvironment. They are quite easy to establish and they are very drought resistant. Contour wallsfunction as a micro-catchment, trapping soil and moisture. The tree-plants have better chances ofsurvival with these types of conservation methods than if they were planted in bare soil. Effortssuch as building arretos and planting trees slow down the speed of wind and water erosion. Thesetypes of trees have been widely used around the world and since they provide the animals withfodder and the people with firewood they are benificial, but the use of Prosopis juliflora and Acaciaspp may also lead to problems when they spread spontaneously along valley floors. These treeshave highly effective taproots. The farmers are prohibited to remove these trees, even thoughthey think they disturb the growth of their crops in the valleys. A conflict between theafforestation programmes and the farmers is not desirable. Afforestation is generally believed toprotect the heights so it would be fine to cut down the trees in the valleys. Perhaps it would begood to move the already established trees up the hills?
The restorative measures in both areas of farmed land are needed, and they improve the situation(deBrum Ferreira, 1996) otherwise erosion most probably will increase. Efforts are financed byFAIMO, and since there have been problems with the payments, the farmers have lost animportant source of income and the signs of erosion are starting to show. This shows that morepeople may give more erosion (Ovuka, 2000) if the restorative measures do not reach the neededlevel. This level can only be reached if people get paid for their work and if they are included inthe decisions concerning their land (Blaikie &Brookfield, 1987).
The damage caused in arable land is often restored directly after the rains with financial aid fromFAIMO. This makes visual observations of erosion difficult.
There are great risks involved in growing crops in the ribeiras. Even though the rains are veryinfrequent the effects of flooding are devastating when they do occur. Maize is sensitive todrought and the soil is more suited to for sorghum and millet, since they are more drought-tolerant and yield better than maize (Langworthy and Finan, 1997, p. 9).
SoilsThe entisols and the inceptisols both need the addition of fertilizer, water and erosion controland this is expensive for the farmers. The lack of water and fertilizer in São Gonçalo is thereforea major constraint to farming and this situation will probably not be remedied in the future.
The soils in both areas are alkaline. This is due to the volcanic origin of the mountains, andbecause of the upward movement of calcium carbonates and other salt accumulations in dryareas (Beaumont, 1989, p 36). The organic matter content is generally high, over 3.5%. This leadsthe soil to have quite high waterholding capacity thereby preventing some erosion. The highvalues for organic matter can be derived from the afforestation programmes that started about 20years ago. It is possible that the use of the land through farming exceeds the rebuilding capacitiesof organic matter from the tree plantation.
54
Both areas show an increasing trend in organic matter content with increasing vegetation cover.The organic matter content decreases downslopes towards the valley floor and the agricultureland in both areas. It is possible that the organic matter is used by the crops and that the lack offertilization causes this negative trend on the valley floors. The trees grow slowly and use only asmall amount of the organic matter content. When the animals graze from the trees and from theundervegetation their manure remains on the ground.
The reason why conductivity and pH values increase with coarser soil texture is because saltsaccumulate in the spaces between the particles in the soil. Increasing vegetation cover, on thecontrary, gives a decreasing trend both with regard to conductivity and pH values in the soils inthe transects in both areas. This can mean that the vegetation collects fine grained soils and thetrees use the available soil water.
The soil surface is rough in many of the rainfed fields, a condition regarded by the farmers to befavourable. The stones in the fields retain dew longer in the morning, giving the plants moreavailable water. This is not an issue we tried to verify, but it is a prevalent belief among thefarmers.
55
Micro-climateA major problem when performing the microclimatic transects was the constantly changingvalues given by the measuring instrument (Testo 615). Upon arriving at a measuring plot, thetemperature often changed 3-4ºC within one minute, and the given values were only stable for afew seconds. The dew point temperature was also constantly fluctuating, often up to 1ºC. Thispresented a major problem in assessing the values and reading the values after approximately oneminute became a way to deal with it. Whether the constantly changing values were an effect of airpockets in the surrounding environment set in motion by the sea breeze and/or an effect of themeasuring instrument being less suited to outdoor use, is hard to say. Because of the difficultiesin getting reliable readings, microclimatic transects were only made once in each investigated area.
In São Gonçalo the highest temperatures were found on the afforested steep slope and in thefarmed area below the slope. The lowest temperatures were found in the afforested area situatedabove the slope, the site where the measurement commenced at 10.25 a.m., and the lowertemperatures are most certainly an affect of increased insolation. The trees in the afforested areaabove the slope are in many cases no bigger than shrubs, and do not provide much shade. In SãoGonçalo the most moist air (highest dew point values) was found on the afforested slope andalong the valley floor. The most dense parts of the afforestation are found on the slope and if thetrees had any sheltering effect this could explain the more moist air there. But almost the samedew point temperature is found along the valley floor where no vegetation at all is present, andthat is hard to explain other than by the constantly changing values. The relative differencebetween the highest value (18.3ºC) and the lowest value (16.5ºC) is only 1.8ºC and, taking intoaccount that the values often changed as much as 1ºC, that is not much to use as an indicator.
In Poilão the highest temperatures were found on the afforested slope and on the non-vegetatedslope. The lowest temperatures were also found on the afforested slope and on the afforestedhillcrest. The temperature was also low on the non-vegetated hillcrest where measurementcommenced. The highest dew point temperatures were found in the farmed area, in theafforested area next to the farmed area and on the non-vegetated slope. The lowest values werefound on the non-vegetated hillcrest, along the valley floor and on the afforested hillcrest. Thisdoes not give a clear picture of what factors control dew point temperature. The relativedifference between the highest (19.5ºC) and the lowest (17.4ºC) value is only 2.1ºC.
According to Oke (1987, p. 141), the amplitude of the temperature wave is depressed due to theradiation shading afforded by the forest canopy. In a forest, air motion is weak, it is cooler andmore humid (Oke, 1987, p. 153). This may be true in temperate areas, but it is not as marked inthe investigated afforested areas, where the tree density is poor, the canopy in most cases is notparticulary developed and the trees are more like shrubs, producing a very limited shelteringeffect. Neither the lowest temperatures nor the highest dew point temperatures were found in theafforested areas.
The most probable reasons why no sheltering effect of the trees in the afforested areas could befound were 1) the effect of the sea breeze, causing the temperatures and dew point temperaturesto fluctuate 2) the poor tree density and size of the trees in the afforested areas.
The effects of the afforested areas may not be enough to effectively lower temperature andincrease dew point temperature, at least not during the drier season, but the trees are mostcertainly important due to their reduction of wind speed and subsequent reduction of winderosion.
56
Socio economyPopulation survival strategies are often short-sighted, due to a constant shortage of water, land tofarm and money. The inhabitants do their best and spread their risks on many different sectorsbut the most important sector, despite all the problems entailed, is farming.
The differences in welfare within the investigated villages are large, and much depends onwhether the farmers have good land to cultivate or not. The best soils for farming lie within theribeiras on flat land. These areas are often what is known as reclaimed land, which builds upbehind large checkdams in Ribeira Seca on the east side of Santiago. Farmers seldom have thepossibility to store food, fodder or to save money, but if they could they would have theopportunity to act more for the future. They do not see the longterm benefits in planting (fruit orother) trees on terraces or in growing more drought-resistant crops, because they generally needto deal with their day-to-day survival.
The farmers in Poilão have more large animals, like cattle and donkeys, than the farmers in SãoGonçalo. All animals serve as a money reserve, and large ones are very expensive. Thesedifferences in combination with the fact that the people in Poilão get their water from wells freeof charge, while those in São Gonçalo have to pay for their water (taken from pumphouses)makes life easier for the villagers of Poilão. The household sizes vary from 3 to 15 persons in SãoGonçalo and from 4 to 11 persons in Poilão. The richer families generally consist of moremembers than those with lesser earnings. Households with relatives abroad generally have abetter situation but things may be difficult anyway. If an adult from a household moves abroad,the available work power is reduced and this leads to even harder work for those who stay. Theymight not even be able to take care of their crops.
In São Gonçalo the dry environment, costly water and shallow soils yield some subsistence cropsand only a small amount of cash crops. FAIMO used to be a source of income for manyhouseholds. In Poilão, people need to repair the damages caused by water erosion after the rains.They generally wait to do this until FAIMO arrives with a project and financial aid. The amountof damage is generally lesser in São Gonçalo, and people do not grow seeds on the slopes asmuch as in Poilão. Many people in São Gonçalo leave their village and work in cities like Praia orCidade Velha, and some have their husbands or wives abroad.
There is a long history of work fronts in Cape Verde. The idea is to give the farmers theopportunity to gain an income during droughts. FAIMO is one of these fronts and they used tohave people (often women) build different kinds of erosion-prevention measures on the slopesnearby the farming areas. Because of the lack of participatory approach when the afforestationprogrammes began, the people do not feel responsible for keeping up the restorativemanagement if they are not paid to do so. Work fronts like FAIMO do not have the full supportof the population. There are perhaps several reasons for this and one problem is that FAIMOalmost never had a plan for the projects, and as a consequence of this, the farmers were unable toparticipate in the planning of the projects. "They just did some kind of work and got paid withoutknowing for what and without seeing the benefits of the projects, and recently they have noteven received any money" (oral information from anonymous).
57
Closing remarksNatural degrading processes like erosion (originating from wind and water) decrease if avegetation cover protects the soil. The vegetation cover is more easily established with help fromrestorative management like afforestation and SWC measures. Human interference (in the formof farming, lowering of the water table and letting animals graze) breaks down the environment ifrestorative measures are not appropriate and fast. To make the future of the Cape Verde Islandslook brighter, it is crucial to keep improving the restorative management and to let naturalreproduction (the accumulation of sediment around vegetation to build up better nutritions in thesoil) take its time.
If the foreign aid programmes are discontinued, it will be devastating for Cape Verde. Thecountry does not have the money needed to perform large afforestation programmes on its own.Many of the positive effects from the programmes over the years will be lost in a few years andthe erosion effects on farming will probably give a decline in the yield of most crops.
58
6. Conclusions
• Precipitation has decreased both in Sahel and in Cape Verde during the 20th century. Thistrend is connected to world climatic changes. However, during the last three yearsprecipitation has been good on Santiago.
• The great variability in precipitation in addition to the recurring droughts should beconsidered as normal features of Cape Verde’s climate. Extra-dry years do not seem to beconnected to ENSO events, since these events occur both during wet and dry years.
• The trees in the afforested areas do not seem to provide enough sheltering effect to givelower temperatures and higher dew point temperatures due to their small size and sparsespatial distribution. The sea breeze effectively mixes the lower air layers causing temperaturesto fluctuate significantly close to the sea.
• The afforestation programmes have established forests that cover a great part of the island.This helps prevent both wind and water erosion in many parts of the island.
• The organic matter content has increased in the afforested areas. This gives better crop-growing capabilities.
• The farmers believe that the afforestation programmes have positive impact on their lives.They use the woods for firewood in their households and for animal fodder.
• The people of Poilão are more fortunate than the people of São Gonçalo. This is a directeffect of the regional climate.
59
Acknowledgements
We are grateful to KTH and Sida for the Minor Field Study grant which financed this study. Weare also grateful to PhD student Lisa Åkesson for providing important and valuable informationabout Cape Verde before our departure, and to University Lecturer Per Lindskog for help withthe initial contacts, literature and information.
The authors would like to thank the supervisors at Göteborg University, Department of EarthSciences, Assoc. Prof. Lars Franzén, Assoc. Prof. Torbjörn Gustavsson, Assoc. Prof. BjörnHolmer and University Lecturer Margit Werner for all their help and support. The help, supportand good advise from Hans Alter, PhD Mira Ovuka, PhD Madelene Ostwald, PhD studentStaffan Rosell, and PhD student Sofia Thorsson was also invaluable and highly appreciated.
Last, but certainly not least, we would like to thank the entire personnel at INIDA, São Jorge dosOrgãos, and especially Dr José Levy who provided us with a contact at INIDA (since he left aspresident of the institute just before our arrival in Cape Verde); Mrs Zuleika Levy for“mothering” all the students from both near and far; our field supervisor Antonio Querido whohelped us tremendously with our field work and with practical issues; our interviewer ”Zelito” forbeing so patient during the interviews; Isaurinda Baptista for being there all the time and beyond;Manuela Santos for performing the soil analysis; Abel Monteiro, the very friendly and helpfullibrarian; and all the dedicated and helpful drivers. We would also like to thank the people of SãoJorge dos Orgãos, São Gonçalo and Poilão for their friendliness and helpfulness. Theopportunity to meet all these wonderful people is one of the greatest things with a Minor FieldStudy.
And for those not mentioned, you are not forgotten - THANK YOU ALL!
60
References
Agnew, C., Warren, A., (1996): A framework for tackling drought and land degradation, Journal ofArid Environments 33:309-320
Baptista, I., (1996): Use of animal manure to supply N to crops in Cape Verde, Athens, GeorgiaMasters thesis, Unpublished.
Beaumont, P., (1989):Environmental management and development in drylands, Routledge, London 505pp
Blaikie, P., Brookfield, H., (1987): Land degradation and society, Routledge, London 296 pp.Breman, H, Groot, R., J., J., van Keulen, H., (2001): Resources limitations in Sahelian agriculture,
Global Environmental Change 11:59-68Breman, H., Kessler, J., J., (1997): The potential benefits of agroforestry in the Sahel and other
semi-arid regions, European Journal of Agronomy 7, 1997, 25-33deBrum Ferreira, D., (1996): Water erosion in Cape Verde Islands: Factors, characteristics and
methods of control, In: Geomorphic hazards, edited by Slaymaker, O., WileyCarreira, A., (1982): The people of the Cape Verde islands- exploitation and emigration, C Hurst &Co.
(publishers) Ltd., London 224pp.Chambers, R., (1997): Whose Reality Counts? - Putting the first last, Intermediate Technology
Publications, 297 pp.Climate System Monitoring (CSM), (1985): The global climate system – a critical review of the climate
system during 1982-1984, World climate data programme, WMOCooke, R. U., Warren, A., Goudie, A., S., (1993): Desert geomorphology, London, UCL Press. 526 pp.Darwin, C., (1860): Journal of researches into the natural history and geology of the countries visited during the
voyage of H.M.S. Beagle round the world. London: John Murray 1st edition 1839Glenn, E., I.,Stafford Smith, M., Squires, V., (1998): On our failure to control desertification:
implications for global change issues, and a research agenda for the future, Environmental Scienceand Policy 1 pp. 71-78
Herweg, K., (1996): Field manual for Assessment of Current Erosion Damage, Soil ConservationResearch Programme & Centre for Development and Environment Geographica Bernensia,65 pp.
Hulme, M., (2001): Climatic perspectives on Sahelian desiccation: 1973-1998, Global EnvironmentalChange 11 pp. 19-29
Landon, J.,L., (ed.) (1991): Booker Tropical Soil manual - a handbook for soil survey and agricultural landevaluation in the tropics and subtropics, Booker Tate Ltd, Longman, 474 pp.
Langworthy, M., Finan, T., J., (1997): Waiting for rain- agriculture and ecological imbalance in Cape Verde,Lynne Rienner Publisher Inc. 211 pp.
Lindskog, P., Delaite, B., (1996): Degrading land: an environmental history perspective of theCape Verde islands, Environment and History 2:271-90
Lindskog, P., Tengberg, A., (1994): Land degradation, natural resources and local knowledge inthe Sahel zone of Burkina Faso. GeoJournal 33:365-375
Mannaerts, C., M., (1993): Assessment of the transferability of laboratory precipitation-runoffand precipitation-soil loss relationships to field and catchment scales – a study in the CapeVerde islands, ITC Publication Number 19, Enschede, The Netherlands
Mannaerts, C., M., Gabriels, D., (2000): Precipitation erosivity in Cape Verde - shortcommunication, Soil & Tillage Research. 55, 207-212
Meintel, D., (1984): Race, culture and Portuguese colonialism in Cabo Verde, Syracuse, New York, 201pp
McGregor, G., R., Nieuwolt, S., (1998): Tropical Climatology 2nd ed. Wiley, 339pp.
61
Mikkelsen, B., (1995): Methods for Development Work and Research - a guide for practitioners, SagePublications, 296 pp.
Morgan, R., P., C., (1995): Soil erosion & Conservation, 198pp. 2nd ed. Longman, 198 pp.Nicholson, S.,E., Kim, J., (1997): The relationship of El Niño-Southern Oscillation to African
rainfall, International Journal of Climatology, Vol 17, 117-135.Oke, T., R., (1987): Boundary Layer Climates, 435pp. 2nd ed.RoutledgeOvuka, M., (2000): More people, less erosion? - Land use, soil erosion and soil productivity in
Murang'a district, Kenya, Land degradation and development, 11:111-124Oxford Concise dictionary of Earth sciences, Allaby, A., Allaby, M., 1990, Oxford University
PressQuerido, A., (1999): Watershed system analysis for evaluating the efficiency of soil and water
conservation works - a case study in Ribeira Seca, Santiago Island, Cape Verde, ITC,Enschede
Stocking,M., A., Murnaghan, N., (2001): Handbook for the field assessment of land degradation,Earthscan 169pp.
Tiffen, M., Mortimore, M., Gichuki, F., (1994): More people, less erosion - environmental recovery inKenya, John Wiley & Sons, 311pp.
UNEP, (1997): World Atlas of Desertification 2nd editionUNDP, (1999): Human development report, 262pp. Oxford University Press
Internet referencesGlobal History Climate Network (GHCN); www.cdiac.esd.ornl.gov /ghcn /ghcn.htmlUNCCD;www.unccd.gov/cop/reports/africa/national/1999/cap_verde-fre.pdfUNICEF, (1999):www.unicef.orgwww.cpc.ncep.noaa.gov/products/analysis_monitoring/ensostuff/ensoyears.html
Maps and aerial photographsDiniz, A., C., de Matos, G., C., (1986): Carta de Zongem Agro-Ecológica e da Vegetação de Cabo Verde,
I- Ilha de Santiago, Separata de Garcia de Orta, Sér. Bot.,Lisboa, 8 (1-2) 1986Marques, M., M., (1991): Notíca explicativa da carta hipsométrica Da ilha de Santiago (República da Cabo
Verde), Centro de Documentação e Informação do IICT, Lisboa, Portugal