
The effectiveness of the Geriatric Depression Scale to …/67531/metadc9109/m2/1/high_res_d ·...
80
APPROVED: James Hall, Major Professor Claudia Coggin, Committee Member Frank Collins, Committee Member Charles A. Guarnaccia, Committee Member Andrew W. Houtz, Committee Member Linda Marshall, Chair of the Department of Psychology Sandra L. Terrell, Dean of the Robert B. Toulouse School of Graduate Studies THE EFFECTIVENESS OF THE GERIATRIC DEPRESSION SCALE TO DISTINGUISH APATHY FROM DEPRESSION IN ALZHEIMER’S DISEASE AND RELATED DEMENTIAS Tommy E. Davis, Jr., M.P.H. Dissertation Prepared for the Degree of DOCTOR OF PHILOSOPHY UNIVERSITY OF NORTH TEXAS August 2008
Transcript of The effectiveness of the Geriatric Depression Scale to …/67531/metadc9109/m2/1/high_res_d ·...
APPROVED: James Hall, Major Professor Claudia Coggin, Committee Member Frank Collins, Committee Member Charles A. Guarnaccia, Committee Member Andrew W. Houtz, Committee Member Linda Marshall, Chair of the Department of
Psychology Sandra L. Terrell, Dean of the Robert B. Toulouse
School of Graduate Studies
THE EFFECTIVENESS OF THE GERIATRIC DEPRESSION SCALE TO DISTINGUISH
APATHY FROM DEPRESSION IN ALZHEIMER’S DISEASE
AND RELATED DEMENTIAS
Tommy E. Davis, Jr., M.P.H.
Dissertation Prepared for the Degree of
DOCTOR OF PHILOSOPHY
UNIVERSITY OF NORTH TEXAS
August 2008

Davis, Jr., Tommy E., The effectiveness of the Geriatric Depression Scale to distinguish
apathy from depression in Alzheimer’s disease and related dementias. Doctor of Philosophy
(Health Psychology and Behavioral Medicine), August 2008, 71 pp., 13 tables, 20 figures,
references, 83 titles.
Early detection of Alzheimer’s disease (AD) and related dementias in the elderly is
critical for improving treatment methods and is a necessary component for improving public
health interventions. One of the earliest and most common behavioral syndromes of AD is
apathy and is associated with executive dysfunction. Apathy in AD is often misdiagnosed as
depression due to an overlap in symptoms. Studies that have found depression to be associated
with executive dysfunction have not always controlled for the presence of apathy. The Geriatric
Depression Scale (GDS) is a widely used instrument designed to assess depression in the elderly.
This study utilized the GDS and a set of standard neuropsychological instruments to investigate
the relationship between apathy, depression, and executive functions in individuals with AD and
related dementias. The first objective of this study was to determine if apathy has a greater
impact on executive functions compared to depression in AD and related dementias. The second
objective was to determine the effectiveness of the GDS as a screen for apathy. The results of the
analyses did not support the hypotheses. However, exploratory analyses suggested a possible
non-linear relationship with apathy and various levels of dementia severity. Exploratory analysis
also suggested mean levels of endorsement for apathy varied by diagnosis. Further research is
warranted to investigate this relationship and the GDS endorsement patterns for caregivers
regarding their impression of the demented individual.

Copyright 2008
by
Tommy E. Davis, Jr.
ii
ACKNOWLEDGEMENTS
I would like to acknowledge and thank my Committee Chair and Major Professor, Dr.
James Hall who provided ongoing support and mentoring throughout my graduate education
culminating in this dissertation. I would also like to acknowledge and thank the following
individuals: Dr. Claudia Coggin who encouraged a public health perspective, Dr. Charles
Guarnaccia who helped me with research design, and Dr. Andrew Houtz who fostered and
promoted my research interests through outstanding clinical mentoring. This dissertation is
dedicated to my father who, through example, taught me the value of hard work, integrity, and
responsibility and my mother who helped me understand the true meaning and importance of
compassion.
iii
TABLE OF CONTENTS
Page
ACKNOWLEDGEMENTS........................................................................................................... iii
LIST OF TABLES......................................................................................................................... vi LIST OF FIGURES ...................................................................................................................... vii Chapters
1. INTRODUCTION................................................................................................... 1
Definition, Clinical Features, and Prevalence of Apathy ........................... 3
Causes of Apathy in Alzheimer’s Disease and Related Dementias............ 5
Neuroimaging and Autopsy Studies ............................................... 5
Apathy and Global Cognitive Dysfunction..................................... 6
Apathy and Executive Dysfunction ................................................ 6
The Association of Apathy with Depression .................................. 9
Geriatric Depression Scale........................................................................ 11
Factor Analyses of the Geriatric Depression Scale....................... 12
Investigation of Apathy Related Subscales on the GDS............... 13
Hypotheses................................................................................................ 15
2. METHOD.............................................................................................................. 16
Participants................................................................................................ 16
Measures ................................................................................................... 16
Geriatric Depression Scale (GDS) ................................................ 17
Behavioral Dyscontrol Scale (BDS) ............................................. 18
Clock Drawing Task (CDT).......................................................... 19
Trail Making Test Part A and Part B (TMT, TMT-A, TMT-B) ... 20
Design and Procedure ............................................................................... 22 3. RESULTS ............................................................................................................. 23
Descriptive Statistics................................................................................. 23
Inferential Statistics .................................................................................. 24
Hypotheses................................................................................................ 29
iv
Hypothesis Testing.................................................................................... 29 4. DISCUSSION ....................................................................................................... 31
Purpose of Study....................................................................................... 31
Overall Summary of Results..................................................................... 31
Possible Conceptual Explanations for Study Findings ............................. 32
Validity and Reliability of the GDS Subscales............................. 33
Relationships of Impairment and Affective Symptoms Vary across Diagnoses...................................................................................... 37
Non-linear Relationship between Symptoms and Neuropsychological Instruments .................................................. 39
An Interaction Obscuring Significant Relationships .................... 40
General Conclusions ................................................................................. 44
Study Limitations...................................................................................... 45
Future Research ........................................................................................ 45 REFERENCES ............................................................................................................................. 65
v
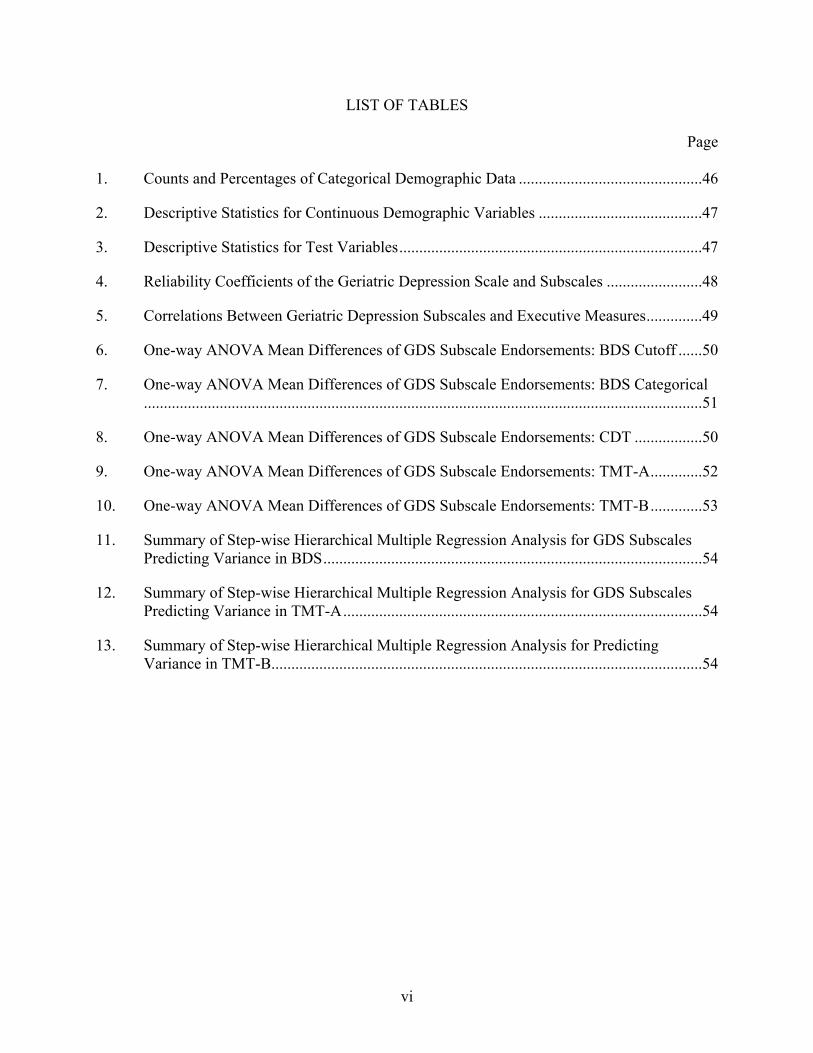
LIST OF TABLES
Page 1. Counts and Percentages of Categorical Demographic Data ..............................................46
2. Descriptive Statistics for Continuous Demographic Variables .........................................47
3. Descriptive Statistics for Test Variables............................................................................47
4. Reliability Coefficients of the Geriatric Depression Scale and Subscales ........................48
5. Correlations Between Geriatric Depression Subscales and Executive Measures..............49
6. One-way ANOVA Mean Differences of GDS Subscale Endorsements: BDS Cutoff ......50
7. One-way ANOVA Mean Differences of GDS Subscale Endorsements: BDS Categorical ............................................................................................................................................51
8. One-way ANOVA Mean Differences of GDS Subscale Endorsements: CDT .................50
9. One-way ANOVA Mean Differences of GDS Subscale Endorsements: TMT-A.............52
10. One-way ANOVA Mean Differences of GDS Subscale Endorsements: TMT-B.............53
11. Summary of Step-wise Hierarchical Multiple Regression Analysis for GDS Subscales Predicting Variance in BDS...............................................................................................54
12. Summary of Step-wise Hierarchical Multiple Regression Analysis for GDS Subscales Predicting Variance in TMT-A..........................................................................................54
13. Summary of Step-wise Hierarchical Multiple Regression Analysis for Predicting Variance in TMT-B............................................................................................................54
vi

LIST OF FIGURES
Page
1. Mean number of endorsed GDS Apathy subscale items across BDS Cutoff levels of impairment .........................................................................................................................55
2. Mean number of endorsed GDS Dysphoria subscale items across BDS Cutoff levels of impairment .........................................................................................................................55
3. Mean number of endorsed GDS Meaninglessness subscale items across BDS Cutoff levels of impairment ..........................................................................................................56
4. Mean number of endorsed GDS Cognitive Impairment subscale items across BDS Cutoff levels of impairment ..........................................................................................................56
5. Mean number of endorsed GDS Apathy subscale items across BDS Categorical levels of impairment .........................................................................................................................57
6. Mean number of endorsed GDS Dysphoria subscale items across BDS Categorical levels of impairment.....................................................................................................................57
7. Mean number of endorsed GDS Meaninglessness subscale items across BDS Categorical levels of impairment ..........................................................................................................58
8. Mean number of endorsed GDS Cognitive Impairment subscale items across BDS Categorical levels of impairment .......................................................................................58
9. Mean number of endorsed GDS Apathy subscale items across CDT Cutoff levels of impairment .........................................................................................................................59
10. Mean number of endorsed GDS Dysphoria subscale items across CDT Cutoff levels of impairment .........................................................................................................................59
11. Mean number of endorsed GDS Meaninglessness subscale items across CDT Cutoff levels of impairment ..........................................................................................................60
12. Mean number of endorsed GDS Cognitive Impairment subscale items across CDT Cutoff levels of impairment ..........................................................................................................60
13. Mean number of endorsed GDS Apathy subscale items across TMT-A Categorical levels of impairment.....................................................................................................................61
14. Mean number of endorsed GDS Dysphoria subscale items across TMT-A Categorical levels of impairment ..........................................................................................................61
15. Mean number of endorsed GDS Meaninglessness subscale items across TMT-A Categorical levels of impairment .......................................................................................62
vii

viii
16. Mean number of endorsed GDS Cognitive Impairment subscale items across TMT-A Categorical levels of impairment .......................................................................................62
17. Mean number of endorsed GDS Apathy subscale items across TMT-B Categorical levels of impairment.....................................................................................................................63
18. Mean number of endorsed GDS Dysphoria subscale items across TMT-B Categorical levels of impairment ..........................................................................................................63
19. Mean number of endorsed GDS Meaninglessness subscale items across TMT-B Categorical levels of impairment .......................................................................................64
20. Mean number of endorsed GDS Cognitive Impairment subscale items across TMT-B Categorical levels of impairment .......................................................................................64
1
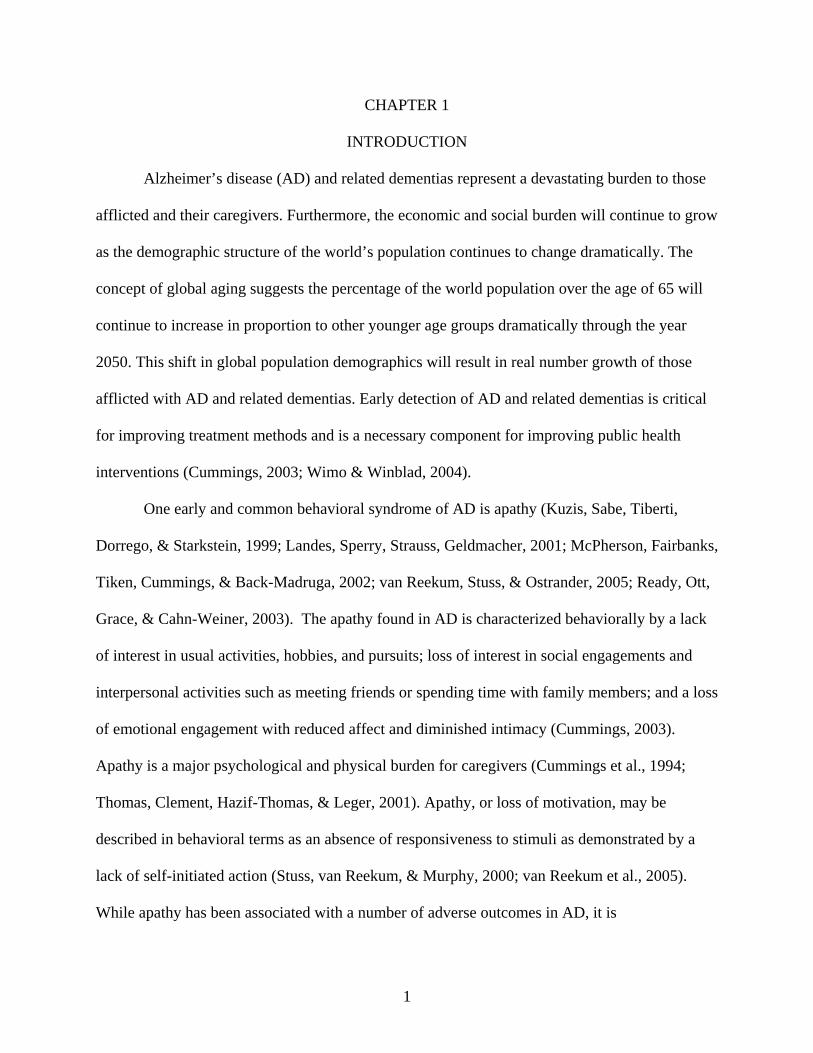
CHAPTER 1
INTRODUCTION
Alzheimer’s disease (AD) and related dementias represent a devastating burden to those
afflicted and their caregivers. Furthermore, the economic and social burden will continue to grow
as the demographic structure of the world’s population continues to change dramatically. The
concept of global aging suggests the percentage of the world population over the age of 65 will
continue to increase in proportion to other younger age groups dramatically through the year
2050. This shift in global population demographics will result in real number growth of those
afflicted with AD and related dementias. Early detection of AD and related dementias is critical
for improving treatment methods and is a necessary component for improving public health
interventions (Cummings, 2003; Wimo & Winblad, 2004).
One early and common behavioral syndrome of AD is apathy (Kuzis, Sabe, Tiberti,
Dorrego, & Starkstein, 1999; Landes, Sperry, Strauss, Geldmacher, 2001; McPherson, Fairbanks,
Tiken, Cummings, & Back-Madruga, 2002; van Reekum, Stuss, & Ostrander, 2005; Ready, Ott,
Grace, & Cahn-Weiner, 2003). The apathy found in AD is characterized behaviorally by a lack
of interest in usual activities, hobbies, and pursuits; loss of interest in social engagements and
interpersonal activities such as meeting friends or spending time with family members; and a loss
of emotional engagement with reduced affect and diminished intimacy (Cummings, 2003).
Apathy is a major psychological and physical burden for caregivers (Cummings et al., 1994;
Thomas, Clement, Hazif-Thomas, & Leger, 2001). Apathy, or loss of motivation, may be
described in behavioral terms as an absence of responsiveness to stimuli as demonstrated by a
lack of self-initiated action (Stuss, van Reekum, & Murphy, 2000; van Reekum et al., 2005).
While apathy has been associated with a number of adverse outcomes in AD, it is

underrecognized (Landes et al., 2001; van Reekum et al., 2005). The impact of apathy on AD is
associated with the connection between apathy and impairment in executive functions (Boyle et
al., 2003; Landes et al., 2001; McPherson et al., 2002; Ready et al., 2003). Executive functions
involve the selection, initiation, direction, implementation, and regulation of cognitive skills and
behaviors (Cummings, 2003; Landes et al., 2001). Consequently, executive dysfunction broadly
impairs the successful performance of tasks by impacting the initiation, planning, and problem
solving, that self-directed, goal-oriented behaviors require (Cummings, 2003; Landes et al.,
2001).
Apathy in AD and related dementias is often misdiagnosed as depression due to an
overlap in symptoms (Landes et al., 2001; Levy et al., 1998; Marin, 1990; Marin, Firinciogullari,
& Biedrzycki, 1993). Instruments designed to assess depression often contain items related to
apathy. Depression has often been found to be associated with executive dysfunction. However,
many of these studies (Fitz & Teri, 1994; Lyketsos et al., 1997; Payne et al., 1998) have not
always controlled for the presence of apathy (Kuzis et al., 1999; McPherson et al., 2002). The
Geriatric Depression Scale (GDS; Brink, Yesavage, Lum, Heersema, Adey, & Rose, 1982) is a
widely administered (Kieffer & Reese, 2002), single-dimension instrument designed to assess
depression in the elderly. Several factor analyses of the GDS have determined certain items of
the GDS to be associated with apathy and other items associated with dysphoria (Adams, 2001;
Adams, Matto, & Sanders, 2004).
The present study investigated the relationship between apathy, depression, and executive
functions in individuals with AD and related dementias. The first objective of this study was to
determine if apathy had a greater impact on executive functions compared to depression. The
second objective was to determine the effectiveness of the GDS as a screen for apathy. Two
2
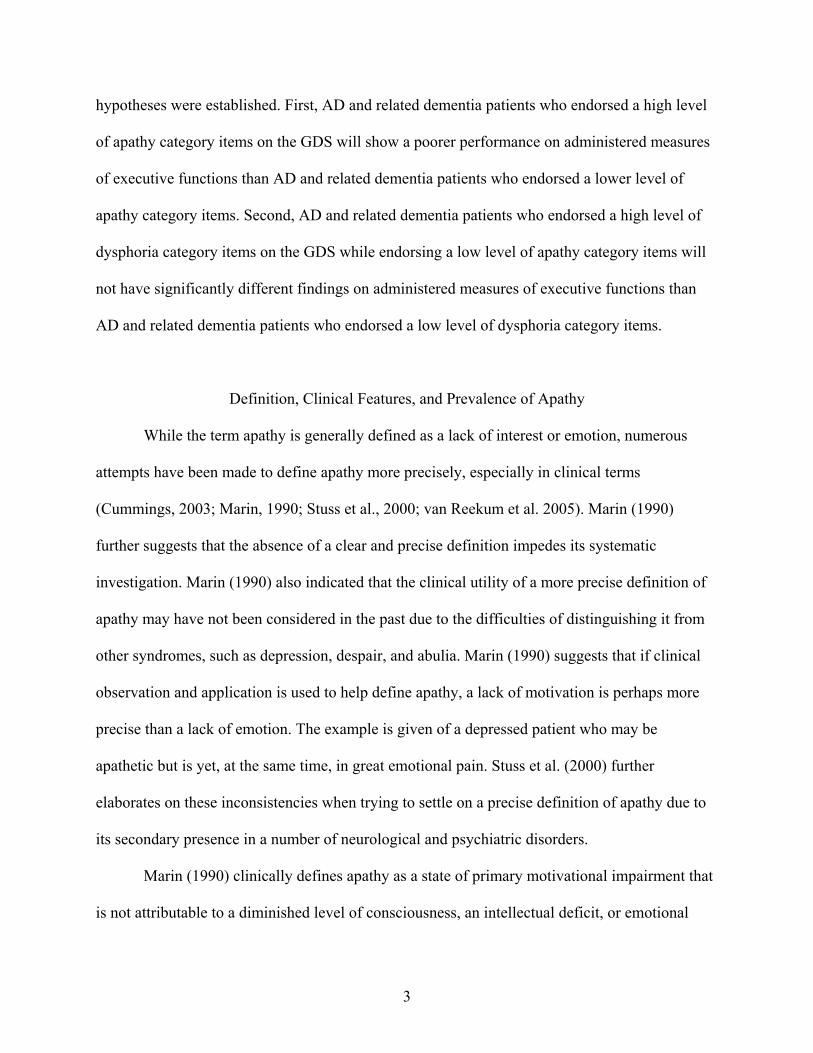
hypotheses were established. First, AD and related dementia patients who endorsed a high level
of apathy category items on the GDS will show a poorer performance on administered measures
of executive functions than AD and related dementia patients who endorsed a lower level of
apathy category items. Second, AD and related dementia patients who endorsed a high level of
dysphoria category items on the GDS while endorsing a low level of apathy category items will
not have significantly different findings on administered measures of executive functions than
AD and related dementia patients who endorsed a low level of dysphoria category items.
Definition, Clinical Features, and Prevalence of Apathy
While the term apathy is generally defined as a lack of interest or emotion, numerous
attempts have been made to define apathy more precisely, especially in clinical terms
(Cummings, 2003; Marin, 1990; Stuss et al., 2000; van Reekum et al. 2005). Marin (1990)
further suggests that the absence of a clear and precise definition impedes its systematic
investigation. Marin (1990) also indicated that the clinical utility of a more precise definition of
apathy may have not been considered in the past due to the difficulties of distinguishing it from
other syndromes, such as depression, despair, and abulia. Marin (1990) suggests that if clinical
observation and application is used to help define apathy, a lack of motivation is perhaps more
precise than a lack of emotion. The example is given of a depressed patient who may be
apathetic but is yet, at the same time, in great emotional pain. Stuss et al. (2000) further
elaborates on these inconsistencies when trying to settle on a precise definition of apathy due to
its secondary presence in a number of neurological and psychiatric disorders.
Marin (1990) clinically defines apathy as a state of primary motivational impairment that
is not attributable to a diminished level of consciousness, an intellectual deficit, or emotional
3

distress. Marin (1990) indicates that when a lack of motivation is attributable to intellectual
impairment, emotional distress, or diminished level of consciousness, then apathy is a symptom
of some other syndrome such as abulia, akinesia and akinetic mutism, depression, dementia,
delirium, despair, and demoralization (Stuss et al., 2000). While the definition by Marin is
widely cited and clinically utilized (Landes et al., 2001; Levy, 1998; McPherson et al., 2002;
Stuss et al. 2000; van Reekum et al., 2005), Stuss et al. (2000) argue that apathy cannot be
clinically defined as simply a lack of motivation.
Stuss et al. (2000) suggest that amotivation describes a state of lacking an inner urge that
moves or prompts one to action. Their argument is that the assessment of an inner urge, such as
motivation, is problematic and could only be assessed through inferences based on affect or
behavior. Therefore, Stuss et al. (2000) define apathy as, “an absence of responsiveness to
stimuli as demonstrated by a lack of self-initiated action,” which allows for objective behavioral
measurements. Initiation is central to this definition and the self-initiated response may be
affective, behavioral or cognitive in nature (van Reekum et al., 2005). Stuss et al. (2000)
conceptualize two types of apathy. The first being related to disturbed arousal perhaps associated
with the reticular activating system, and the second associated with frontal-subcortical
dysfunction, which they label executive apathy. Using this distinction, executive apathy would
appear to be the type of apathy most associated with AD and related dementias.
A review (van Reekum et al., 2005) of various AD research with outpatients showed an
overall point prevalence of apathy of 60.3% across the studies. Another review (Mega,
Cummings, Fiorello, & Gornbein, 1996) showed a point prevalence of 70%. Apathy across
dementia severity as determined by Mini-Mental State Examination (MMSE; Folstein, Folstein,
& McHugh, 1975) showed a point prevalence of 47%, 80%, and 93%, in mild, moderate, and
4

severe conditions respectively (Cummings, 2003). Research by Cummings (2003) has shown
point prevalence of apathy in up to 70% of patients with AD, 90% with frontotemporal dementia,
dementia with Lewy bodies, and progressive supranuclear palsy; 40% of those with corticobasal
degeneration, and 20% of those with Parkinson’s disease.
Causes of Apathy in Alzheimer’s Disease and Related Dementias
Causation of apathy in AD and related dementias has been explored through
neuroimaging and autopsy studies, examination of apathy with general cognitive dysfunction and
with executive dysfunction, and the relationship of apathy with depression.
Neuroimaging and Autopsy Studies
Neuroimaging and autopsy studies appear to implicate subcortical-frontal circuits,
involving, in particular, the anterior cingulate and dorsolateral prefrontal cortex in the
pathophysiology of apathy (Landes et al., 2001; Tekin & Cummings, 2002; van Reekum et al.,
2005). Apathy in AD, as well, appears to be specifically related to the disruption of the anterior
cingulate-subcortical circuit (Landes et al., 2001; McPherson et al., 2002; Stuss et al., 2000). The
anterior cingulate mediates motivated behavior and dysfunction associated with lesions in this
area is reflected behaviorally in decreased motivation (Tekin & Cummings, 2002). Functional
imaging studies in AD patients show decreased activity in the anterior cingulate cortex
correlating with apathy (Craig et al., 1996; Levy et al., 1998; Tekin & Cummings, 2002; van
Reekum et al., 2005). A SPECT study of 40 AD patients reported a correlation between apathy
and diminished blood flow to the right temporoparietal regions (Ott, Noto, & Fogel, 1996).
5

Apathy and Global Cognitive Dysfunction
Research that has focused on the impact of apathy on global cognitive impairment has
had mixed results (Landes et al., 2001; McPherson et al., 2002; van Reekum et al., 2005). Most
of this research has utilized the MMSE (Folstein et al., 1975), which does not provide a sensitive
measure of executive function or frontal lobe impairment (Landes et al., 2001; van Reekum et
al., 2005). Studies that have incorporated neuropsychological measures of executive function
have shown apathy correlating with poorer performance on these measures and thus suggestive
of executive dysfunction (Boyle et al., 2003; Kuzis et al., 1999; McPherson et al., 2002; Ready et
al., 2003). Neuropsychological measures not dependent on executive functions were unrelated to
apathy.
Apathy and Executive Dysfunction
While research suggests that apathy found in AD and related dementias is related to
executive dysfunction, questions of specifically how apathy impacts executive functions are
being explored (Cummings, 2003; Damasio, 1994; Ott et al., 1996). Cummings (2003) defines
executive functions as integrative, synthetic, and generative. Furthermore, Cummings (2003)
suggests that these functions mediate the choice, planning, programming, implementation, and
feedback refinement of volitional actions. Cummings (2003) also suggests that executive
functions have multiple dimensions and are dependent on instrumental functions such as
language, memory, praxis, and perception. This theoretical model for executive functions utilizes
memory, emotional, and sensory information as inputs for the process of volitional activity.
Clinical description of patients with frontal lobe damage, and thus probable executive
dysfunction, are related by Luria (1980):
6

These patients were found to preserve all type of sensation, to have no sign of disturbance of movement, and to have no disturbances of gnosis, praxis, and speech; nevertheless, their complex psychological activity was grossly impaired. They were unable to produce stable plans and became inactive and aspontaneous. They could respond to ordinary questions or perform habitual actions, but they were quite unable to carry out complex, purposive, and goal-directed actions. They were unable to evaluate their attempts, they were not critical of their behavior, and could not control their actions; they continued to perform automatic actions which had long ceased to be meaningful, without any attempt at correction. They were no longer concerned about their failure, they were hesitant and indecisive, and, most frequently of all, they became indifferent or they exhibited features of euphoria, as a result of the loss of their critical awareness of their behavior (p. 247).
Luria (1980) noted, as other researchers (Tekin & Cummings, 2002), the rich connections of the
frontal lobes with the underlying limbic structures and thus other areas involved in interoception
to suggest that the frontal lobes are intimately involved in the regulation of body states.
Damasio (1994) goes further to specify the relationship between the goal-directed aspect
of executive functions, what he labels as reasoning/decision making and emotion/feeling and the
neuroanatomical substrates that are involved when these processes are impaired.
First, there is a region of the human brain, the ventromedial prefrontal cortices, whose damage consistently compromises, in a pure fashion as one is likely to find, both reasoning/decision making, and emotion/feeling, especially in the personal and social domain. One might say, metaphorically, that reason and emotion “intersect” in the ventromedial prefrontal cortices and that they also intersect in the amygdala. Second, there is a region of the human brain, the complex of somatosensory cortices in the right hemisphere, whose damage also compromises reasoning/decision making and emotion/feeling, and, in addition, disrupts the processes of basic body signaling. Third, there are regions located in prefrontal cortices beyond the ventromedial sector, whose damage also compromises reasoning and decision making, but in a different pattern: Either the defect is far more sweeping, compromising intellectual operations over all domains, or the defect is more selective, compromising operations on words, numbers, objects, or space, more so than operations in the personal and social domain…In short, there appears to be a collection of systems in the human brain consistently dedicated to the goal-oriented thinking process we call reasoning, and to the response selection we call decision making, with a special emphasis on the personal and social domain. This same collection of systems is also involved in emotion and feeling, and is partly dedicated to processing body signals (p. 70).
Anosognosia, or a lack of awareness of one’s cognitive deficits is often found in AD
(Landes et al., 2001; Ott et al., 1996). Anosognosia in AD has been shown to be highly
7

correlated with apathy, which suggests that this unawareness of deficits is more closely related to
emotional changes than to cognitive impairment (Landes et al., 2001). Damasio (1994) has
investigated anosognosia in patients who have right somatosensory damage located in the right
temporoparietal cortical region and suggests these individuals exhibit similar deficits as those
with prefrontal damage. These patients with right temporoparietal damage are unable to make
appropriate decisions on personal and social matters, and the patients with prefrontal damage,
like patients with temporoparietal damage are usually indifferent to their health status or
impairment. Marin (1990) also indicated right hemisphere lesions may produce apathy or
indifference, along with anosognosia, with little or few elementary sensory or motor
abnormalities.
As noted earlier, Ott et al. (1996) reported a correlation between apathy and diminished
blood flow to the right temporoparietal regions and suggested that disruption of the
temporolimbic structures in AD may result in a loss of the integration of emotional and sensory
information necessary for goal-directed behavior and motivation. These findings would suggest
that disruption of the anterior cingulate-subcortical circuit via limbic structures provides one
explanation for the occurrence of apathy in AD (McPherson et al., 2002).
Research has defined five frontal-subcortical circuits. These circuits are named according
to their function or site of origin in the cortex (Tekin & Cummings, 2002).
The anterior cingulate circuit is suggested to mediate motivated behavior and lesions in this
circuit are associated with decreased motivation. In other words, the anterior cingulate circuit
facilitates the internal selection of environmental stimuli based on their internal relevance (Tekin
& Cummings, 2002). This description of the function of the anterior cingulate circuit provides an
elegant corollary to the Stuss et al. (2000) definition of apathy as an absence of responsiveness to
8
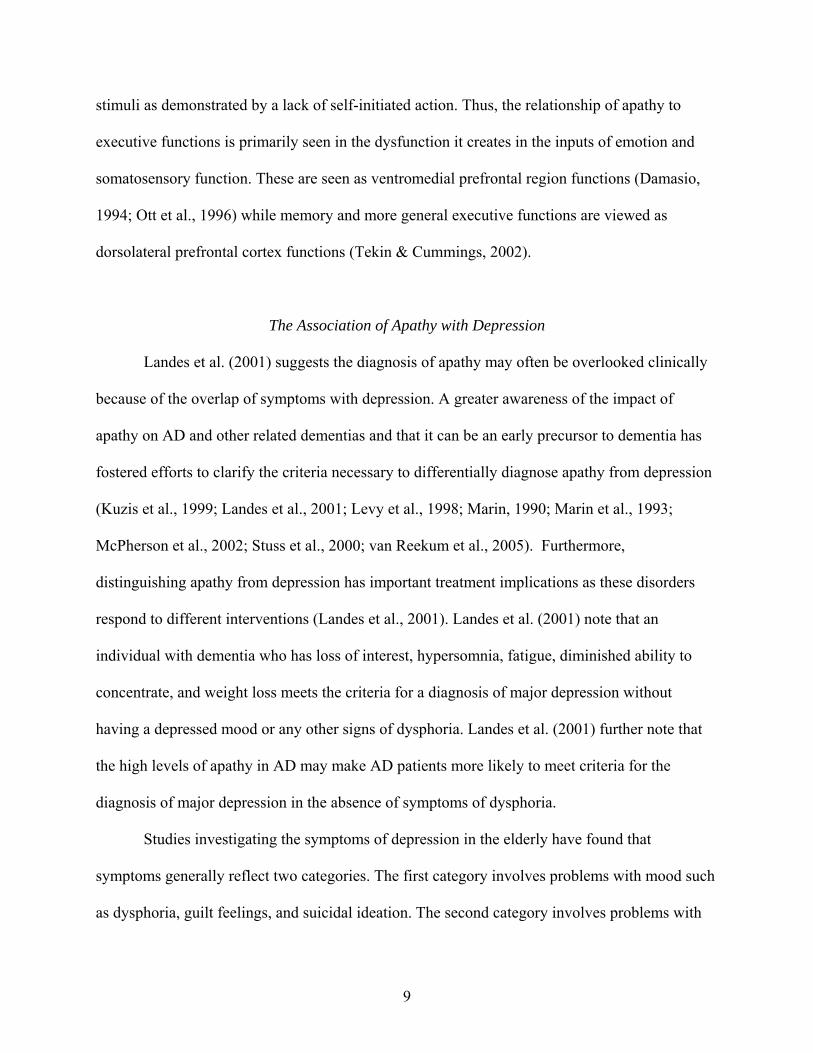
stimuli as demonstrated by a lack of self-initiated action. Thus, the relationship of apathy to
executive functions is primarily seen in the dysfunction it creates in the inputs of emotion and
somatosensory function. These are seen as ventromedial prefrontal region functions (Damasio,
1994; Ott et al., 1996) while memory and more general executive functions are viewed as
dorsolateral prefrontal cortex functions (Tekin & Cummings, 2002).
The Association of Apathy with Depression
Landes et al. (2001) suggests the diagnosis of apathy may often be overlooked clinically
because of the overlap of symptoms with depression. A greater awareness of the impact of
apathy on AD and other related dementias and that it can be an early precursor to dementia has
fostered efforts to clarify the criteria necessary to differentially diagnose apathy from depression
(Kuzis et al., 1999; Landes et al., 2001; Levy et al., 1998; Marin, 1990; Marin et al., 1993;
McPherson et al., 2002; Stuss et al., 2000; van Reekum et al., 2005). Furthermore,
distinguishing apathy from depression has important treatment implications as these disorders
respond to different interventions (Landes et al., 2001). Landes et al. (2001) note that an
individual with dementia who has loss of interest, hypersomnia, fatigue, diminished ability to
concentrate, and weight loss meets the criteria for a diagnosis of major depression without
having a depressed mood or any other signs of dysphoria. Landes et al. (2001) further note that
the high levels of apathy in AD may make AD patients more likely to meet criteria for the
diagnosis of major depression in the absence of symptoms of dysphoria.
Studies investigating the symptoms of depression in the elderly have found that
symptoms generally reflect two categories. The first category involves problems with mood such
as dysphoria, guilt feelings, and suicidal ideation. The second category involves problems with
9
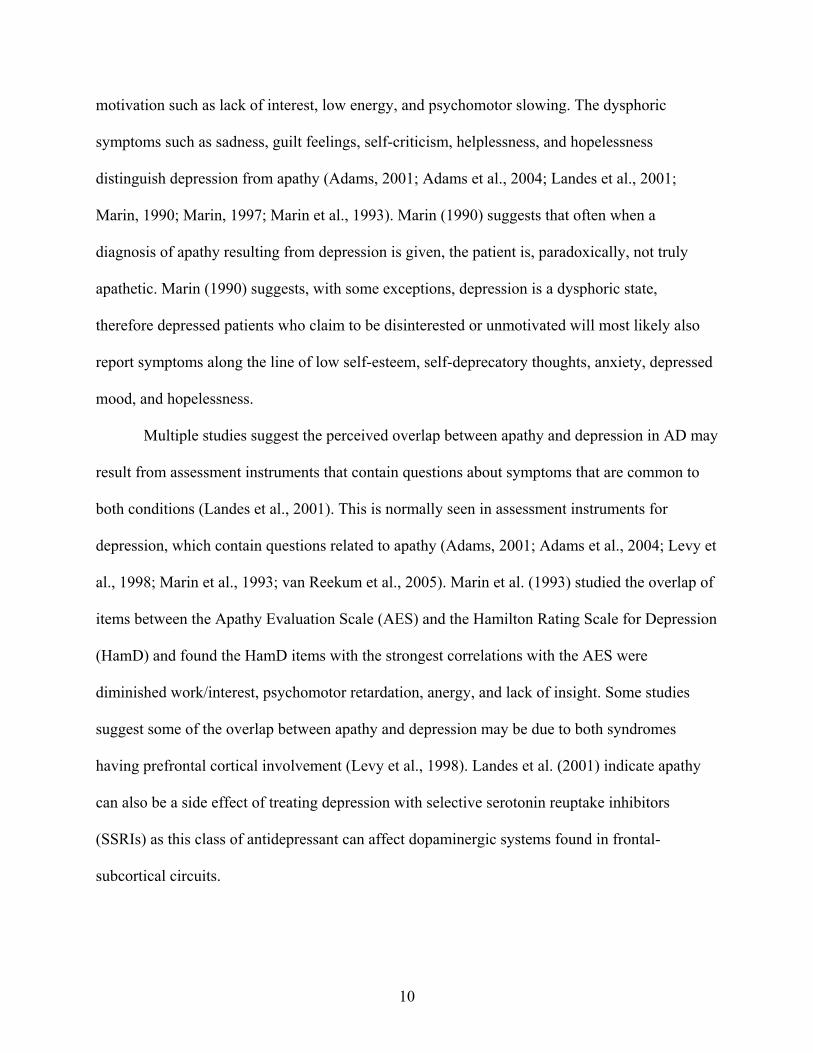
motivation such as lack of interest, low energy, and psychomotor slowing. The dysphoric
symptoms such as sadness, guilt feelings, self-criticism, helplessness, and hopelessness
distinguish depression from apathy (Adams, 2001; Adams et al., 2004; Landes et al., 2001;
Marin, 1990; Marin, 1997; Marin et al., 1993). Marin (1990) suggests that often when a
diagnosis of apathy resulting from depression is given, the patient is, paradoxically, not truly
apathetic. Marin (1990) suggests, with some exceptions, depression is a dysphoric state,
therefore depressed patients who claim to be disinterested or unmotivated will most likely also
report symptoms along the line of low self-esteem, self-deprecatory thoughts, anxiety, depressed
mood, and hopelessness.
Multiple studies suggest the perceived overlap between apathy and depression in AD may
result from assessment instruments that contain questions about symptoms that are common to
both conditions (Landes et al., 2001). This is normally seen in assessment instruments for
depression, which contain questions related to apathy (Adams, 2001; Adams et al., 2004; Levy et
al., 1998; Marin et al., 1993; van Reekum et al., 2005). Marin et al. (1993) studied the overlap of
items between the Apathy Evaluation Scale (AES) and the Hamilton Rating Scale for Depression
(HamD) and found the HamD items with the strongest correlations with the AES were
diminished work/interest, psychomotor retardation, anergy, and lack of insight. Some studies
suggest some of the overlap between apathy and depression may be due to both syndromes
having prefrontal cortical involvement (Levy et al., 1998). Landes et al. (2001) indicate apathy
can also be a side effect of treating depression with selective serotonin reuptake inhibitors
(SSRIs) as this class of antidepressant can affect dopaminergic systems found in frontal-
subcortical circuits.
10

Geriatric Depression Scale
The Geriatric Depression Scale (GDS; Brink et al., 1982) is an instrument that has been
used extensively in clinical and research settings since it first appeared more than 20 years ago
(Adams et al., 2004; Peach, Koob, & Kraus, 2001). This was the first depression scale primarily
used as a screening instrument designed specifically for a geriatric population (Adams et al.
2004; Yesavage et al., 1983). The GDS has become prominent in the gerontological literature. It
has been recommended as a standard measure for depression in the elderly to facilitate research
comparison and replication in studies (Koder, Brodaty, & Anstey, 1996). The GDS consists of a
30-item self-rating scale, which was designed to remedy some of the purported problems in
screening for depression in the elderly (Adams, 2001; Yesavage et al., 1983). Scales such as the
Zung Self-Rating Depression Scale (SDS; Zung, 1965) and the Minnesota Multiphasic
Personality Inventory (MMPI; Hathaway & McKinley, 1943) tended to overdiagnose depression
in the elderly because of the many questions regarding somatic concerns, which are beneficial in
diagnosing depression in younger persons (Adams, 2001; Yesavage et al., 1983). Furthermore, at
the time of the development of the GDS, it was suggested the scale must be sensitive in
addressing issues such as suicidality and sexuality as these types of questions could make the
elderly cohort defensive (Adams, 2001; Yesavage et al., 1983). Another concern is that the
instrument be in a simple, easy to understand format. Several of the depression self-rating scales
have multiple answer, Likert-type scales, which have been found to be confusing to some of the
elderly in that these involve a greater number of choices and discriminations (Yesavage et al.,
1983). The GDS addresses this by containing items that are endorsed either yes or no. The GDS
uses its 30 items as a single additive scale with one point being scored for each “depressed”
response (Adams, 2001). Twenty items represent a depressed response with a “yes” answer and
11

ten items indicate a depressed response with a “no” answer. The direction of item endorsement is
interspersed to inhibit perseverative yes or no response sets. Brink et al. (1982) suggest a cutoff
score of 11 points or above to indicate a depressed individual. The cutoff score of 11 points
resulted in a sensitivity of 84% and a specificity of 95% for their study (Yesavage et al., 1983).
Kieffer and Reese (2002) published a reliability generalization study of 338 previously published
research studies of the GDS and determined the reliability across these studies was .85 (SD =
.09).
Factor Analyses of the Geriatric Depression Scale
While the GDS has been widely used in clinical and research settings, very few factor
analytical studies have been performed to investigate the underlying structure of the scale
(Adams et al., 2004). Adams et al. (2004) suggest only four principal components analyses
(PCA) of the English-language, 30-item GDS and only one PCA of the shorter form of the GDS,
the 15-item GDS-S (Sheikh & Yesavage, 1986) are found in the literature. At present, the
literature indicates Adams et al. (2004) appear to have performed the only confirmatory factor
analysis (CFA) on the GDS. The earliest published PCA study of the GDS (Parmelee, Lawton, &
Katz, 1989) suggest a six factor structure, which included a 14-item factor labeled as Dysphoria,
with additional factors of Worry (4-items), Withdrawal-Apathy (4-items), Vigor (3-items),
Decreased Concentration (2-items), and Anxiety (3-items). The Parmelee et al. (1989) PCA of
the GDS resulted in nine eigenvalues over one. The Cattell scree plot suggested a final six-
component solution with a Varimax rotation that converged in nine iterations (Adams, 2001).
Subsequent factor analyses all contained a factor that was designated as representing a construct
of withdrawal or apathy (Adams et al., 2004). The recent CFA performed by Adam and
12
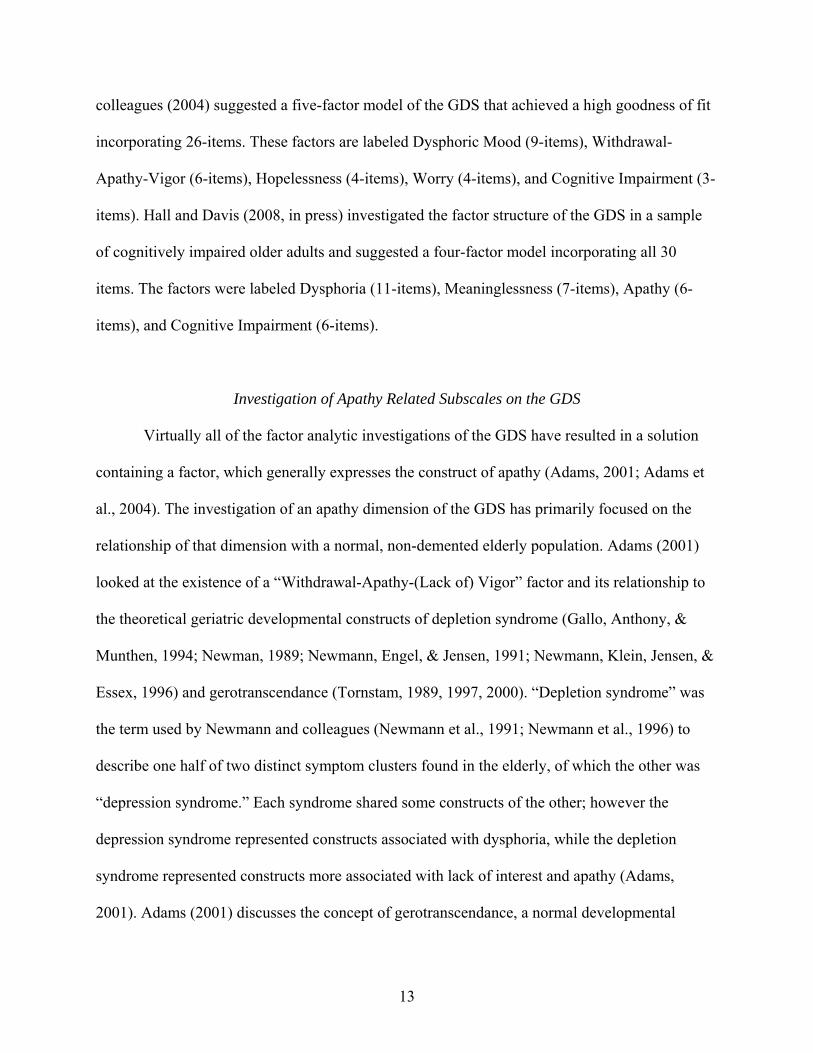
colleagues (2004) suggested a five-factor model of the GDS that achieved a high goodness of fit
incorporating 26-items. These factors are labeled Dysphoric Mood (9-items), Withdrawal-
Apathy-Vigor (6-items), Hopelessness (4-items), Worry (4-items), and Cognitive Impairment (3-
items). Hall and Davis (2008, in press) investigated the factor structure of the GDS in a sample
of cognitively impaired older adults and suggested a four-factor model incorporating all 30
items. The factors were labeled Dysphoria (11-items), Meaninglessness (7-items), Apathy (6-
items), and Cognitive Impairment (6-items).
Investigation of Apathy Related Subscales on the GDS
Virtually all of the factor analytic investigations of the GDS have resulted in a solution
containing a factor, which generally expresses the construct of apathy (Adams, 2001; Adams et
al., 2004). The investigation of an apathy dimension of the GDS has primarily focused on the
relationship of that dimension with a normal, non-demented elderly population. Adams (2001)
looked at the existence of a “Withdrawal-Apathy-(Lack of) Vigor” factor and its relationship to
the theoretical geriatric developmental constructs of depletion syndrome (Gallo, Anthony, &
Munthen, 1994; Newman, 1989; Newmann, Engel, & Jensen, 1991; Newmann, Klein, Jensen, &
Essex, 1996) and gerotranscendance (Tornstam, 1989, 1997, 2000). “Depletion syndrome” was
the term used by Newmann and colleagues (Newmann et al., 1991; Newmann et al., 1996) to
describe one half of two distinct symptom clusters found in the elderly, of which the other was
“depression syndrome.” Each syndrome shared some constructs of the other; however the
depression syndrome represented constructs associated with dysphoria, while the depletion
syndrome represented constructs more associated with lack of interest and apathy (Adams,
2001). Adams (2001) discusses the concept of gerotranscendance, a normal developmental
13

process of aging in which, as one ages, one relinquishes broad, wide-ranging social interests for a
more narrowly defined set of interests that reflect a natural increased desire for solitude and a
less active lifestyle. The basic intent of Adams (2001) factor analytic research was to bring to
light the possible tendency to over-diagnose the normal elderly with depression when, in fact,
these individuals may simply be undergoing a normal developmental aging process. While,
indeed, this diagnostic error may be occurring, concern is warranted as an over-reliance on these
theoretical disengagement constructs as an explanation for withdrawal in the elderly could result
in a tendency to overlook early precursors of possible dementia, in particular apathy.
Research by Newmann and her colleagues (1996) found that the depletion syndrome
increased linearly with age, while the depression syndrome did not. Coincidentally, the
prevalence of AD in the elderly increases substantially along with increases in age (Cummings,
2003; Wimo & Winblad, 2004). Additionally, executive functions are noted to be the cognitive
process most susceptible to decline in aging (Cahn-Weiner, Malloy, Boyle, Marran, & Salloway,
2000). Furthermore, higher levels of apathy in AD have been shown to be associated with greater
cognitive impairment (Craig et al., 1996; Mega et al., 1996; Paulsen, Stout, DeLaPena, &
Romero, 1996) and older age (Cummings et al., 1994). To reiterate, while many studies (Fitz &
Teri, 1994; Lyketsos et al., 1997; Payne et al., 1998) have found a link between depression and
executive dysfunction, the majority of these studies have not controlled for the presence of
apathy (Kuzis et al., 1999; McPherson et al., 2002). An initial exploratory factor analysis (Hall &
Davis, 2008, in press) of the GDS in a sample of cognitively impaired older adults suggested a
four-factor model incorporating all 30 GDS items. These four factors consisting of Dysphoria
(11-items), Meaninglessness (7-items), Apathy (6-items), and Cognitive Impairment (6-items)
will be utilized to assess the differential impact of apathy and depression on executive functions.
14
Hypotheses
Two hypotheses were proposed:
1. AD and related dementia patients who endorsed a high level of apathy category items
on the GDS will show a poorer performance on administered measures of executive
functions than AD and related dementia patients who endorsed a lower level of
apathy category items.
2. AD and related dementia patients who endorsed a high level of dysphoria category
items on the GDS while endorsing a low level of apathy category items will not have
significantly different findings on administered measures of executive functions than
AD and related dementia patients who endorsed a low level of dysphoria category
items.
15
CHAPTER 2
METHOD
Participants
Participants for this study included 140 individuals (91 females, 49 males; mean age =
78.2 years old, SD = 7.23) who were obtained retrospectively from a database of community-
dwelling patients, who presented during the period of 2003 to 2005 to a metropolitan outpatient
clinic for a neuropsychological evaluation for dementia. Self-rating of depressive symptoms with
the Geriatric Depression Scale (GDS) has been shown to be valid in patients with a Mini-Mental
State Examination (MMSE, Folstein, Folstein, & McHugh, 1975) score of at least 15 (Katz,
1998) and thus participants with an MMSE below 15 on the date of evaluation were excluded.
Participants from this database were largely composed of individuals in the ethnic/racial majority
with some high school education or greater. Cognitive impairment diagnoses consisted primarily
of Alzheimer’s disease (AD), vascular dementia (VaD), and mild cognitive impairment (MCI)
(McKhann et al., 1984; Petersen, 2003; Román et al., 1993). Although AD, VaD, and MCI
represent various stages and types of dementia, and may progress differently, similar dysfunction
across diagnoses has been noted with respect to the executive aspects of independent functioning
(Boone, Ponton, Gorsuch, Gonzalez, & Miller, 1998). Participants were at least 65 years of age
on the date of evaluation.
Measures
Measures consisted of the Geriatric Depression Scale (GDS) and three standardized
neuropsychological pencil and paper based testing instruments chosen to assess frontal systems
and executive functions.
16
Geriatric Depression Scale (GDS)
The GDS (Yesavage et al., 1983) consists of a 30-item self-rating scale, which was
designed to remedy some of the purported problems in screening for depression in the elderly
(Adams, 2001; Peach et al., 2001; Yesavage et al., 1983). Scales such as the Zung Self-Rating
Depression Scale (SDS; Zung, 1965) and the Minnesota Multiphasic Personality Inventory
(MMPI; Hathaway & McKinley, 1943) tended to over-diagnose depression in the elderly
because of the many questions regarding somatic concerns, which are beneficial in diagnosing
depression in younger persons (Adams, 2001; Yesavage et al., 1983). Several depression self-
rating scales have multiple answer, Likert-type scales, which have been found to be confusing to
a some of the elderly in that these involve a greater number of choices and discriminations
(Yesavage et al., 1983). The GDS addresses this by containing items that are endorsed either yes
or no. The GDS uses its 30 items as a single additive scale with one point being scored for each
“depressed” response (Adams, 2001). Twenty items represent a depressed response with a “yes”
answer and ten items indicate a depressed response with a “no” answer. The direction of item
endorsement is interspersed to inhibit perseverative yes or no response sets. Brink et al. (1982)
suggest a cutoff score of 11 points or above to indicate a depressed individual. The cutoff score
of 11 points resulted in a sensitivity of 84% and a specificity of 95% for their study (Yesavage et
al., 1983). Kieffer and Reese (2002) published a reliability generalization study of 338
previously published research studies of the GDS and determined the reliability across these
studies was .8482 (SD = .0870).
17

Behavioral Dyscontrol Scale (BDS)
The BDS (Grigsby, Kaye, & Robbins, 1992; Grigsby & Kaye, 1996)is based on Luria’s
(1980) theory of frontal lobe functioning and was designed to predict the capacity for an
individual to independently regulate their own behavior. It consists of simple cognitive and
motor tasks that assess motor programming, inhibition, working memory, and insight (Suchy &
Bolger, 1999). The BDS consists of nine items and has a possible total score of 19 points. The
first seven of the items involve a motor response from the examinee, while the eighth item
consists of a verbal response. The ninth item is not administered to the examinee, but rather
represents the examiner’s assessment of the degree of insight demonstrated by the examinee into
his or her performance (Grigsby et al., 1992; Grigsby & Kaye, 1996). The first eight items are
scored on a 3-point scale. These scores represent examinee performance as adequate (2), mildly
to moderately deficient (1), and very impaired (0). The rating of examinee insight utilizes a 4-
point scale and assesses the individual’s awareness of the existence, nature, severity, and
significance of errors in their performance (Grigsby et al., 1992). The specific criteria for
administration and scoring are found in the BDS manual (Grigsby & Kaye, 1996). Test-retest
reliability was high (.89 to .93), with good internal consistency (Cronbach’s alpha of .87), and
high interrater reliability (total BDS score of .98) with trained raters (Grigsby et al., 1992; Kaye,
Grigsby, Robbins, & Korzun, 1990). Kaye et al. (1990) suggest a BDS total score of 0 to 6
indicates severe impairment of behavioral control, scores from 7 to 10 suggest moderately severe
impairment, and a score of 11 to 15 may indicate mild to moderate impairment. Elderly
individuals scoring less than 11 are particularly susceptible to having difficulty independently
regulating their behavior (Grigsby et al., 1992). Initial (Grigsby et al., 1992) and subsequent
(Suchy, Blint, & Osmon, 1997) factor analytic examinations of the BDS revealed comparable
18

three-factor solutions. The three-factors by Grigsby et al. (1992) corresponded to (1) “the ability
to use intention and guide behavior”; (2) “the ability to use feedback”; and (3) “the capacity for
inhibition” (Suchy et al., 1997). A recent pilot factor analysis performed on sample of
cognitively impaired elderly outpatients to be used in this study (Hall & Harvey, 2008) revealed
a three-factor solution with BDS the following items: two go no-go tasks, the Head's test, a piano
exercise, and Luria's fist-edge-palm task loading on the Motoric Problem-Solving factor, two
items of alternate hand-tapping loading on the Simple Motoric Repetitive Behaviors factor, and
an examiner-rated item of the examinee's performance loading on the Insight factor. The BDS
has been shown to predict executive aspects of functional independence, particularly the impact
of apathy and disinhibition, while being unrelated to depression or apraxia (Kaye et al., 1990).
Performance on the BDS has been shown to be an independent predictor of both basic physical
and instrumental activities of daily living (pADLs and iADLs) performance as well as
discriminating between AD and MCI (Belanger et al., 2005).
Clock Drawing Task (CDT)
While numerous scoring systems (Freedman et al., 1994; Shulman, 2000) exist for the
CDT (Sunderland et al., 1989), a paper and pencil instrument, this study used a four-point CDT
scoring system (Nolan & Mohs, 1994), which consists of four criteria scored one-point each for
successful performance for an overall best possible score of four and a worst possible score of
zero. One point is given for successfully completing each of the following tasks: drawing a
closed circle, placing numbers in the correct positions, including all 12 correct numbers, and
placing the clock hands in the correct positions. The CDT administration performed with this
study consists of giving the examinee a blank 8.5 X 11 inch sheet of paper and reading the
19

instructions stated at the top of the paper, “Please draw the face of a clock and put the numbers in
the correct positions. Now, draw in the hands at ten minutes after eleven.” No further instructions
are given. The CDT has been suggested to be more sensitive in detecting early dementia than the
Mini-Mental State Examination (MMSE; Folstein et al., 1975) (Fujii, 1992). The CDT
performed in command administration with the instruction that the clock hands be placed at “ten
after eleven” has been suggested to put greater demands on executive functions as mediated by
the frontal lobes than other types of CDT administration (Freedman et al., 1994; Shulman, 2000).
With respect to the four-point scoring criteria, results of a study by Davis and Houtz (2005)
suggest that clock hand position places the greatest demands on executive functions followed by
number position. Clock hand position requires the frontal system to interpret the meaning of “ten
past eleven” and then to plan and implement a procedure to accomplish that part of the task.
Correct number position placement also requires a strategy to effectively place each of the 12
numbers in the appropriate positions with each number evenly spaced around the clock face. It
can be construed that more rote tasks such as listing numbers from 1 to 12 and drawing a circle
are less susceptible to early cognitive dysfunction than the other two criteria.
Trail Making Test Part A and Part B (TMT, TMT-A, TMT-B)
The TMT (Reitan & Wolfson, 1993), a paper and pencil instrument, consists of two parts.
The TMT-A requires the examinee to draw a pencil line that sequentially connects 25 encircled
numbers, beginning with 1 and ending with 25, distributed on an 8.5 X 11 inch sheet of paper.
The TMT-B task is comparable except that the examinee must connect a distributed array of 25
encircled numbers 1 through 13 and letters A through L. The sequence on the TMT-B follows an
alternating number-letter order (e.g., 1, A, 2, B, 3, C, etc.). The tasks are timed and examinees
20
are instructed to perform the task as quickly as possible. Examinees are redirected by the
examiner if they make an error during administration. TMT-A and TMT-B are scored separately.
The score for each part is the number of seconds required for completion of the task and the
number of errors (Reitan & Wolfson, 1993). Both parts of the TMT require motor speed
coordination, attention, visual scanning, and sequential processing (Lezak, Howieson, & Loring,
2004; Rasmusson, Zonderman, Kawas, & Resnick, 1998; Reitan & Wolfson, 1993; Spreen &
Strauss, 1998). TMT-B most likely requires additional analytic logical cognitive processes
known as set shifting, or attentional, mental, or cognitive flexibility (Lezak et al., 2004;
Rasmusson et al., 1998; Reitan & Wolfson, 1993; Spreen & Strauss, 1998). According to the
norms set by Reitan and Wolfson (1993), a time of 40 to 51 seconds and a time of 86 to 120
seconds are suggested to be indicative of mild to moderate neuropsychological impairment on
the TMT-A and TMT-B respectively. A time of 52 seconds or greater and a time of 121 seconds
or greater are suggested to be indicative of severe neuropsychological impairment on the TMT-A
and TMT-B respectively. The presence of any errors on TMT-A or TMT-B is suggestive of
neuropsychological impairment (Reitan & Wolfson, 1993). Studies reporting reliability
coefficients vary greatly from .60s to .90s, however most are in the .80s (Lezak et al., 2004;
Spreen & Strauss, 1998). Both TMT-A and TMT-B are very sensitive to the progressive
cognitive decline associated with dementing processes (Lezak et al., 2004), while elderly
individuals who perform poorly on TMT-B are likely to have difficulties with instrumental
activities of daily living (iADLs) such as managing a home, medications, and finances even after
statistically controlling for age, sex, and education (Bell-McGinty, Podell, Franzen, Baird, &
Williams, 2002; Lezak et al., 2004). A study examining of error types in the TMT suggests an
inhibitory deficit in AD (Amieva et al., 1998).
21
Design and Procedure
Institutional Review Board (IRB) approval was obtained from the University of North
Texas and the University of North Texas Health Science Center. As outlined in the Participants
section, participants for this study were obtained retrospectively from a database of community-
dwelling patients, who presented during the period of 2003 to 2005 to a metropolitan outpatient
clinic for a neuropsychological evaluation for dementia. The specific instruments investigated in
this study were part of a larger battery of neuropsychological instruments administered to the
participants. The database was derived from a review of the patient medical records. A data
collection sheet with an assigned code number was utilized to transfer and aggregate the raw
instrument data from the patient medical records for input into the computer database. After the
participant data was transferred to the data collection sheet, the patient medical records are
promptly returned to medical records. The assigned code number on the data collection sheet
was cross-referenced to a separate list containing only the code number and medical record. This
separate list is kept in a locked cabinet in which only the principal investigator has access. The
code number was cross-referenced to an SPSS database where the participant’s age, race, gender,
diagnosis, and neuropsychological evaluation data are recorded. Access to the database was
limited to the principal investigator. De-linked and de-identified participant demographics,
diagnoses, raw scores and individual item endorsements on the specific test instruments were
analyzed in SPSS.
22

CHAPTER 3
RESULTS
Descriptive Statistics
Counts and percentages were calculated for the categorical demographic variables:
gender, diagnosis, and diagnosis severity. Participants for this study included 140 individuals (91
females, 49 males) who were obtained retrospectively from a database of community-dwelling
patients, who presented during the period of 2003 to 2005 to a metropolitan outpatient clinic for
a neuropsychological evaluation for dementia. Cognitive impairment diagnoses consisted of 41
cases of Alzheimer’s disease (AD, 29.3%), 41 cases of vascular dementia (VaD, 29.3%), 24
cases of cognitive disorder NOS or mild cognitive impairment (MCI, 17.1%), 13 cases of mixed
dementia (13.6%), nine cases of other (6.4%), and three cases of none (2.1%). Diagnosis severity
ranged from a high of 68 cases of mild (48.6%) to a low of 1 case of severe (0.7%). These results
are summarized in Table 1. Means and standard deviations were also calculated for the
continuous demographic variables: age (M = 78.2, SD = 7.23) and Mini-Mental State
Examination (MMSE; M = 24.86, SD = 3.35). These results are summarized in Table 2.
The pilot study (Hall & Davis, 2008, in press) exploratory factor analysis (EFA) of the
Geriatric Depression Scale (GDS) was used to set the criteria for GDS subscales and the specific
GDS items that comprise each of those subscales used in this research. The subscales are
Apathy, Dysphoria, Meaninglessness, and Cognitive Impairment. The standardized
neuropsychological pencil and paper based testing instruments chosen to assess frontal systems
and executive functions consisted of the Behavioral Dyscontrol Scale (BDS), Trail Making Test
– Part A and Part B (TMT-A, TMT-B), and the Clock Drawing Task (CDT). Means, standard
deviations, skewness, and kurtosis were calculated for the GDS total score, subscale scores, and
23
the noted neuropsychological test instruments. These results are summarized in Table 3. Alpha
internal consistencies were calculated for the GDS and noted subscales with higher internal
consistencies observed in subscales with a greater number of items. These results are
summarized in Table 4.
Inferential Statistics
In order to broaden readership and interest in this research, both categorical and
continuous data statistical research methodologies were undertaken to investigate the hypotheses
and the relationship between the GDS subscales and the standardized neuropsychological
instruments representing executive functions, BDS, CDT, TMT-A, and TMT-B.
Initial bivariate correlations were calculated between the GDS subscales and the
standardized neuropsychological instruments noted as executive measures. Statistically
significant (p < .01, two-tailed) correlations were noted between the four GDS subscales.
Similarly, statistically significant (p < .01, two-tailed) correlations were observed between the
three executive measures. Modest statistically significant (p < .05, two-tailed) correlations were
observed between the GDS subscales Meaninglessness, Cognitive Impairment and the executive
measures TMT-A, TMT-B, and the BDS. No significant correlations were observed between the
GDS subscales Apathy, Dysphoria, and the executive measures. These results are summarized in
Table 5.
Clinical relevance was investigated through the use of categorical statistical processes,
grouping the study participants by existing established cutoff scores (presence/absence) of
executive dysfunction or categorical level (normal, mild to moderate, severe) of executive
dysfunction across the standardized neuropsychological instruments. The BDS was examined
24

with both the established cutoff score and categorical levels. The CDT was examined with the
established cutoff score. The TMT-A and TMT-B were examined with categorical levels.
The hypotheses were investigated by observing the categorical relationship between the
standardized neuropsychological instruments and the level of endorsement (mean number of
endorsed items in each factor) of the Apathy and Dysphoria factors of the GDS. One-way
analyses of variance (ANOVAs) were calculated to compare the category groups for statistical
differences. The Meaninglessness and Cognitive Impairment factors were comparably analyzed
to investigate their relationship with the standardized neuropsychological instruments.
A one-way ANOVA was calculated on the BDS cutoff score and the GDS subscales
Apathy and Dysphoria. The other subscales Meaninglessness and Cognitive Impairment were
included in the analysis. The analysis for Apathy was not significant, F(1, 138) = .518, p = .473.
The analysis for Dysphoria was not significant, F(1, 138) = .842, p = .360. The analysis for
Meaninglessness was also not significant, F(1, 138) = .268, p = .606. The analysis for Cognitive
Impairment was significant, F(1, 138) = 7.768, p = .006. These results with means and standard
deviations for each GDS subscale in each BDS cutoff group are summarized in Table 6. The
mean numbers of endorsed items for the GDS subscales across BDS cutoff levels of impairment
are graphically represented in Figures 1 through 4.
A one-way analysis of variance (ANOVA) was calculated on the BDS categorical scores
and the GDS subscales Apathy and Dysphoria. The other subscales Meaninglessness and
Cognitive Impairment were included in the analysis. The analysis for Apathy was not significant,
F(3, 136) = .855, p = .466. The analysis for Dysphoria was not significant, F(3, 136) = .360, p =
.782. The analysis for Meaninglessness was not significant, F(3, 136) = .257, p = .856. The
analysis for Cognitive Impairment was also not significant, F(3, 136) = 2.600, p = .055. These
25

results with means and standard deviations for each GDS subscale in each BDS categorical
group are summarized in Table 7. The mean numbers of endorsed items for the GDS subscales
across BDS categorical levels of impairment are graphically represented in Figures 5 through 8.
A one-way ANOVA was calculated on the CDT cutoff score and the GDS subscales
Apathy and Dysphoria. The other subscales Meaninglessness and Cognitive Impairment were
included in the analysis. The analysis for Apathy was not significant, F(1, 138) = .996, p = .320.
The analysis for Dysphoria was not significant, F(1, 138) = .749, p = .388. The analysis for
Meaninglessness was not significant, F(1, 138) = 1.227, p = .270. The analysis for Cognitive
Impairment was also not significant, F(1, 138) = .559, p = .456. These results with means and
standard deviations for each GDS subscale in each CDT cutoff group are summarized in Table 8.
The mean numbers of endorsed items for the GDS subscales across CDT cutoff levels of
impairment are graphically represented in Figures 9 through 12.
A one-way ANOVA was calculated on the TMT-A categorical scores and the GDS
subscales Apathy and Dysphoria. The other subscales Meaninglessness and Cognitive
Impairment were included in the analysis. The analysis for Apathy was not significant, F(2, 137)
= .532, p = .589. The analysis for Dysphoria was not significant, F(2, 137) = 1.370, p = .258. The
analysis for Meaninglessness was not significant, F(2, 137) = .917, p = .402. The analysis for
Cognitive Impairment was also not significant, F(2, 137) = .894, p = .412. These results with
means and standard deviations for each GDS subscale in each TMT-A categorical group are
summarized in Table 9. The mean numbers of endorsed items for the GDS subscales across
TMT-A categorical levels of impairment are graphically represented in Figures 13 through 16.
A one-way ANOVA was calculated on the TMT-B categorical scores and the GDS
subscales Apathy and Dysphoria. The other subscales Meaninglessness and Cognitive
26

Impairment were included in the analysis. The analysis for Apathy was not significant, F(2, 137)
= 1.040, p = .356. The analysis for Dysphoria was not significant, F(2, 137) = .207, p = .813. The
analysis for Meaninglessness was not significant, F(2, 137) = 2.539, p = .083. The analysis for
Cognitive Impairment was also not significant, F(2, 137) = .136, p = .873. These results with
means and standard deviations for each GDS subscale in each TMT-B categorical group are
summarized in Table 10. The mean numbers of endorsed items for the GDS subscales across
TMT-B categorical levels of impairment are graphically represented in Figures 17 through 20.
Empirical relevance was investigated through the use of a continuous statistical process.
A step-wise hierarchical multiple regression model was used to investigate the relative amount of
variance in the standardized neuropsychological instruments that is explained by the GDS
subscales of Apathy and Dysphoria respectively. The stated hypotheses suggested that Apathy
would explain the majority of the variance, while Dysphoria should not statistically add value to
the regression model. Additionally, the Meaninglessness and Cognitive Impairment subscales
were also similarly analyzed to investigate their contribution to the variance across the
standardized neuropsychological instruments.
Within the hierarchical multiple regression model, the step-wise method criteria for
independent predictor variables was set with a probability of F to enter the model at p ≤ .05 and
be removed from the model at p ≥ .10. By model design, if the probability method criteria were
not met the hierarchical multiple regression model could not be calculated.
A step-wise hierarchical multiple regression was attempted for the BDS with the GDS
subscales Apathy and Dysphoria. Neither GDS subscale met the probability of F at p ≤ .05 entry
criterion and thus the model was not calculated. Correlations with the BDS for GDS subscales
Apathy and Dysphoria were .099 and -.004, respectively, as noted in Table 5. An identical
27

regression was attempted for the BDS with the GDS subscales Meaninglessness and Cognitive
Impairment. Meaninglessness (correlation -.093 with BDS, as noted in Table 5) did not meet the
model entry criterion, while the model was significant with Cognitive Impairment. Adjusted R
square = .029; F(1, 138) = 5.146, p = .025. These results are summarized in Table 11.
A step-wise hierarchical multiple regression was attempted for the CDT with the GDS
subscales Apathy and Dysphoria. Neither GDS subscales met the probability of F at p ≤ .05 entry
criterion and thus the model was not calculated. Correlations with the CDT for GDS subscales
Apathy and Dysphoria were -.026 and .022, respectively, as noted in Table 5. An identical
regression was attempted for the CDT with the GDS subscales Meaninglessness and Cognitive
Impairment. Neither Meaninglessness or Cognitive Impairment (respective correlations -.078,
.050 with CDT, as noted in Table 5) met the entry criterion and thus the model was not
calculated.
A step-wise hierarchical multiple regression was attempted for TMT-A with the GDS
subscales Apathy and Dysphoria. Neither GDS subscale met the probability of F at p ≤ .05 entry
criterion and thus the model was not calculated. Correlations with TMT-A for GDS subscales
Apathy and Dysphoria were -.077 and .000, respectively, as noted in Table 5. An identical
regression was attempted for TMT-A with the GDS subscales Meaninglessness and Cognitive
Impairment. The model was significant with both Meaninglessness and Cognitive Impairment.
Adjusted R square = .070; F(2, 137) = 6.197, p = .003. These results are summarized in Table 12.
A step-wise hierarchical multiple regression was attempted for TMT-B with the GDS
subscales Apathy and Dysphoria. Neither GDS subscale met the probability of F at p ≤ .05 entry
criterion and thus the model was not calculated. Correlations with the BDS for GDS subscales
Apathy and Dysphoria were .091 and -.001, respectively, as noted in Table 5. An identical
28

regression was attempted for TMT-B with the GDS subscales Meaninglessness and Cognitive
Impairment. Cognitive Impairment (correlation -.093 with BDS, as noted in Table 5) did not
meet the model entry criterion, while the model was significant with Meaninglessness. Adjusted
R square = .035; F(1, 138) = 6.017, p = .015. These results are summarized in Table 13.
Hypotheses
Two hypotheses were proposed:
1. AD and related dementia patients who endorsed a high level of apathy category items
on the GDS will show a poorer performance on administered measures of executive
functions than AD and related dementia patients who endorsed a lower level of
apathy category items.
2. AD and related dementia patients who endorsed a high level of dysphoria category
items on the GDS while endorsing a low level of apathy category items will not have
significantly different findings on administered measures of executive functions than
AD and related dementia patients who endorsed a low level of dysphoria category
items.
Hypothesis Testing
The ANOVAs and the step-wise hierarchical multiple regression analyses did not support
the first hypothesis. With respect to the ANOVAs, the mean number of endorsed GDS Apathy
items was not statistically different across the impaired and non-impaired groups of the
administered measures of executive functions. Due to the lack of statistical differences, no
additional analyses were undertaken to develop a cut score on the GDS Apathy subscale that
29

would suggest the clinical presence or absence of apathy and, thus, executive dysfunction. With
respect to the hierarchical multiple regression analyses, the GDS Apathy predictor variable did
not meet the minimum criterion to enter the model, and thus did not support the first hypothesis.
In order to verify support for the second hypothesis, the analyses would need to support
the first hypothesis. With respect to the analyses, in the ANOVAs, the mean number of endorsed
GDS Dysphoria items was not statistically different across the impaired and non-impaired
groups. In the hierarchical multiple regression analyses GDS Dysphoria did not statistically add
value to the regression model. In light of the fact that the first hypothesis was not supported, the
second hypothesis could not be supported.
30

CHAPTER 4
DISCUSSION
Purpose of Study
This study investigated the relationship between apathy, depression, and executive
functions in individuals with Alzheimer’s disease (AD) and related dementias. Two objectives
were established. The first objective of this study was to determine if apathy had a greater impact
on executive functions compared to depression. The second objective was to determine the
effectiveness of the Geriatric Depression Scale (GDS) as a screen for apathy. Two hypotheses
were established. First, AD and related dementia patients who endorsed a high level of apathy
category items on the GDS will show a poorer performance on administered measures of
executive functions than AD and related dementia patients who endorsed a lower level of apathy
category items. Second, AD and related dementia patients who endorsed a high level of
dysphoria category items on the GDS while endorsing a low level of apathy category items will
not have significantly different findings on administered measures of executive functions than
AD and related dementia patients who endorsed a low level of dysphoria category items.
Overall Summary of Results
This study yielded some interesting, yet albeit, non-supportive results. Significant mean
differences were not observed for the GDS Apathy subscale across the levels of impairment on
the examined executive measures. Furthermore, within the regression analyses, the GDS Apathy
subscale did not significantly contribute to the model. These non-significant statistical analyses
resulted in a lack of support for the aforementioned hypotheses and thus the two study
objectives. The first study objective to determine if apathy had a greater impact on executive
31
functions compared to depression was not ascertained through the analyses. In light of these
indeterminate results, the second objective to determine the effectiveness of the GDS as a screen
for apathy was not empirically supported. The initial bivariate correlations that were calculated
between the GDS subscales and the standardized neuropsychological instruments established as
executive measures showed statistically significant (p < .01, two-tailed) correlations among the
four GDS subscales as well as statistically significant (p < .01, two-tailed) correlations among
the three executive measures. No significant correlations were observed between the GDS
subscales Apathy, Dysphoria, and the executive measures. While not the focus of the hypotheses,
modest statistically significant (p < .05, two-tailed) correlations between the GDS subscales
Meaninglessness, Cognitive Impairment and the executive measures Trail Making Test – Part A
and Part B (TMT-A, TMT-B) and the Behavioral Dyscontrol Scale (BDS) were of interest.
Possible Conceptual Explanations for Study Findings
While a multitude of possible explanations exist for these results, the following
discussion will examine a few of perhaps the most reasonable explanations that are supported by
the study findings, study limitations, and the relevant literature. This examination should set the
framework and direction for future research. Four possible conceptual explanations for the study
findings will be explored. First, the validity and reliability of the GDS subscales. Second,
different diagnoses have different relationships with impairment and affective symptoms. Third,
the relationship of symptoms, as noted by GDS subscales, to neuropsychological variables is not
linear and is related to severity of impairment, not specific neuropsychological domains. Fourth,
there is some particular interaction between diagnosis, symptoms, level of impairment, and
neuropsychological domain that is obscuring significant relationships. It should be noted that the
32

four areas of explanation are theoretically and clinically overlapping between one another. Data
limitations with respect to linearity and normality will be addressed throughout.
Validity and Reliability of the GDS Subscales
A discussion of the validity and reliability of the GDS subscales may best begin with a
review of the relationship between constructs and measures. DeVellis (2003) noted items within
a scale are usually a means to an end for the assessment of a construct. In a way, measures are
substitutes for variables that we cannot observe. As the relationship between measures is
assessed, the relationship between constructs is inferred. The underlying phenomenon or
construct that a scale is intended to reflect is frequently called the latent variable (DeVellis,
2003). It is latent in that it is often not directly observable and variable in that its magnitude or
strength changes. A scale or measure is designed to estimate the unobservable actual magnitude
of a variable, which is known as its true score. DeVellis (2003) noted that this latent variable is
regarded as the cause of the item or set of items to take on a certain score or value. It becomes
evident that if an underlying latent variable or phenomenon is not clearly defined or well agreed
upon, this will become problematic in creating items or scales of items that are generally
accepted to represent the phenomenon. As DeVellis (2003) noted reliability is concerned with
how much a variable influences a set of items while validity is concerned with whether the latent
variable is the underlying cause of item covariation. As noted in the Introduction section, much
work has been undertaken to precisely define the construct of apathy. These definitions often
have philosophical underpinnings and a heterogeneous taxonomy. The abstract nature of general
definitions for apathy, such as a lack of interest, emotion, or motivation, makes it difficult to
empirically determine if an instrument actually corresponds to a latent variable it is purported to
33

measure. This difficulty or lack of precision resulted in Stuss et al. (2000) to define apathy as,
“an absence of responsiveness to stimuli as demonstrated by a lack of self-initiated action,”
which allows for objective behavioral measurements. As noted, initiation is central to this
definition and the self-initiated response may be affective, behavioral or cognitive in nature (van
Reekum et al., 2005). A recurring theme noted throughout the literature on apathy is the
tendency for it to be defined based on its psychological cause and the associated neuroanatomical
region involved (Marin, 1990; Marin, 1997; Stuss et al., 2000). While numerous theoretical
conceptualizations exist, Stuss et al. (2000) conceptualized two basic types of apathy. The first
being related to disturbed arousal perhaps associated with the reticular activating system, and the
second associated with frontal-subcortical dysfunction, which they labeled executive apathy.
Based on this distinction and general review of the literature, it appeared reasonable to interpret
executive apathy as the type of apathy most associated with AD and related dementias.
With respect to the reliability and validity of the Apathy subscale as found in the study by
Hall and Davis (2008, in press), the basic empirical questions that arise are how much the
underlying latent variable or construct of executive apathy as defined by Stuss et al. (2000)
influences the items in the Apathy subscale (reliability) and is the cause of the Apathy subscale
item covariation (validity). When examining the reliability and validity of the subscales within
the Hall and Davis (2008, in press) it is helpful to review the method used to establish the
original unidimensional GDS. The GDS was designed by a team of clinicians and researchers
involved in geriatric psychiatry who selected 100 questions that were believed to potentially
distinguish the elderly depressed from normals (Yesavage et al., 1983). They looked for potential
questions that were relevant to depression, such as somatic complaints, cognitive complaints,
motivation, future/past orientation, self-image, losses, agitation, obsessive traits, and mood. The
34

initial data analysis was based on the rationale that the initial 100 items on the scale should have
prima facia validity for depression. Ultimately they settled on 30 items that were most highly
and significantly correlated. Based on the research, the remaining 30 items were viewed to be the
core of geriatric depression and included lowered affect, inactivity, irritability, withdrawal,
distressing thoughts, and negative judgments about the past, present, and future (Brink et al.,
1982). With respect to validity, the GDS showed a comparable or superior ability to differentiate
between depressed and normals as compared to other measures (Yesavage et al., 1983). With
respect to reliability, the Cronbach’s alpha coefficient was used to measure overall internal
consistency of the GDS and found to be .94 in the original study (Yesavage et al., 1983). GDS
total score (30 items) Cronbach’s alpha coefficients for Hall and Davis (2008, in press) and the
present study were .838 and .816, respectively.
The GDS subscales as derived in the Hall and Davis (2008, in press) research appeared to
have reliability coefficients that are consistent with other literature. That study reported the GDS
subscales with Cronbach’s alpha coefficients for Apathy (6 items), Dysphoria (11 items),
Meaninglessness (7 items), and Cognitive Impairment (6 items) as .634, .793, .721, and .468,
respectively with 173 participants. The present study obtained the respective Cronbach’s alpha
coefficients of .505, .755, .635, and .596 with 140 participants. The present study had 140
participants while the Hall and Davis (2008, in press) had 173. Other GDS factor analyses
performed on non-demented samples had comparable reliability coefficients (Adams, 2001;
Adams et al., 2004). Parmelee et al. (1989) obtained a six subscale structure for the GDS with
Cronbach’s alpha measures of internal consistency at .91, .60, .58, .46, .54, and .51 for
Dysphoria (14 items), Worry (4 items), Withdrawal/Apathy (4 items), Vigor (3 items),
Decreased Concentration (2 items), and Anxiety (3 items) respectively, with a sample size of
35

417. Based on the values of internal consistency found in their study, Parmelee et al. (1989)
recommended the GDS continue to be used as a single total scale. Cronbach’s alpha represents
the proportion of a subscale’s total variance that is attributable to a common source, which
presumably would be the true score of the latent variable underlying the items (DeVellis, 2003).
With respect to the Apathy subscale, the alpha values were .505 and .634, for the present study
and the Hall and Davis (2008, in press) study, respectively. This suggests in the present study
roughly half of the variation is common variance to total variance. This is less than desirable for
statistical purposes.
Studies that have shown a statistically significant linear relationship between measures of
apathy and executive dysfunction have often utilized apathy measures that were endorsed by the
caregiver as opposed to the actual patient (Cummings et al., 1994; McPherson et al., 2002;
Landes et al., 2001). The general rationale for using caregiver endorsement as opposed to the
patient is that the psychological processes and neuroanatomical substrates involved in apathy
may result in an impairment of awareness, and more particularly, self-awareness (Cummings et
al., 1994; McPherson et al., 2002; Landes et al., 2001). The level of participant self-awareness
may not be adequately assessed by the Mini-Mental State Examination (MMSE) (Folstein et al.,
1975), which was used to determine inclusion in the present study. Tabachnick and Fidell (2001)
noted that a good factor analysis will “make sense” while DeVellis (2003) reflected on a
parsimonious account of the factors. Both of these concepts were considered with the Hall and
Davis (2008, in press) factor analytic derived four subscale structure used in this study. While
obviously designed as a unidimensional instrument, the widespread use of the GDS makes it a
well-desired source to glean additional empirical and clinical information. Future studies
utilizing the Hall and Davis (2008, in press) GDS subscales may benefit from concurrent
36

endorsement by caregivers. Cummings et al. (1994) developed the Neuropsychiatric Inventory
(NPI), a 10-domain scale used for the assessment of psychopathology in dementia (McPherson et
al., 2002). The information is gathered from an individual who has daily contact with the patient
and is familiar with the patient’s behavior.
Relationships of Impairment and Affective Symptoms Vary across Diagnoses
A second explanation for the study findings may be the possibility that different
diagnoses have different relationships with impairment and affective symptoms. The
neuropsychiatric expression and neuroanatomical correlated pathology differ across Alzheimer’s
disease and the related dementias (Cummings, 2003). The temporal pattern of symptomatology
also varies across diagnoses. For example, the hallmark of frontotemporal dementia (FTD) is
marked by the onset of behavioral changes, such as apathy and disinhibition with a later onset of
cognitive impairment. Alzheimer’s disease (AD) follows a gradually progressive course.
Vascular dementia (VaD) is frequently characterized by an abrupt onset with subsequent periods
of sudden cognitive decline, often described as a stair-step progression (Cummings, 2003). The
initial neuroanatomical substrates and the progressive spread of histopathology also vary by type
of dementia (Cummings, 2003; Landes et al., 2001; Levy et al, 1998; Schultz, Del Tredici, &
Braak, 2004; Tekin & Cummings, 2002). This variation in location of onset and progression may
have implications on the severity and temporal onset of neuropsychiatric symptoms. A study
performed by Levy et al. (1998) hypothesized that apathy was different from depression,
speculated that the two symptoms are produced by different neuroanatomical or neurochemical
substrates, and were manifested differently in various neurologic disorders. The results by Levy
et al. (1998) noted a large number of AD patients and even more FTD and progressive
37
supranuclear palsy (PSP) patients had apathy without depression, whereas many Parkinson’s
disease (PD) and Huntington’s disease (HD) patients had depression without apathy. Levy et al.
(1998) determined that generally across diagnoses apathy was correlated with cognitive
impairment while depression was not. The relationship between apathy and depression appeared
to be disease-specific. AD, FTD, and PSP had more prevalent and severe apathy, while PD and
HD had more prevalent and severe depression. PSP patients exhibited the most frequent and
severe apathy and the least depression.
An exploratory one-way ANOVA with the current study noted a statistically significant
F(5, 131) = 3.264, p = .008 difference between the mean endorsements of the GDS Apathy
subscale for AD (M = 1.15, SD = 1.15) and VaD (M = 2.00, SD = 1.34). The higher mean
endorsement for VaD over AD is consistent with the literature noting the increased subcortical
involvement in VaD (Cummings, 2003; de la Torre, 2002). Cummings (2003) noted that some
VaD patients evidence a predominance of white matter ischemic injury with a clinical syndrome
that tends to be gradually progressive in contrast to one punctuated by periods of acute decline.
Cognitively and behaviorally, these patients manifest prominent frontal executive dysfunction
with diminished motivation, loss of insight, apathy, and abulia (Cummings, 2003). Studies with
the NPI (Cummings et al., 1994) revealed more severe agitation, depression, anxiety, and apathy
in patients with subcortical VaD compared with patients with AD (Cummings, 2003). Of the ten
domains of the NPI, the apathy domain had the highest mean endorsement in VaD compared to
the other domains (Cummings, 2003). Perhaps it is possible that the disruption of the anterior
cingulate-subcortical circuit so often implicated in apathy is more greatly impacted in VaD
versus AD. While a growing body of literature notes the lack of mutual exclusivity of VaD and
38

AD (de la Torre, 2002), differentiating levels of neuropsychiatric symptoms clearly exist
between the two dementias (Cummings, 2003).
Non-linear Relationship between Symptoms and Neuropsychological Instruments
A third explanation for the study findings may be the possibility that the relationship of
symptoms, as noted by GDS subscales, to neuropsychological variables is not linear and is
related to severity of impairment, not specific neuropsychological domains. An exploratory one-
way ANOVA with the current study did not show a statistically significant linear relationship
with any of the GDS subscales and diagnosis severity. By study design and composition of
patients in the database, moderate to severe and severely demented individuals were not included
while mild, mild to moderate, and moderately demented individuals were included in the study.
A review of the GDS subscale mean endorsement levels across diagnosis severity shows a non-
linear relationship. This type of endorsement may be a result of a non-linear interaction between
an increase in neuropsychiatric symptoms as described by the GDS subscales and an increasing
lack of insight into these symptoms by the patient as the dementing processes become more
severe. As noted in the introduction, anosognosia, or a lack of awareness of one’s cognitive
deficits is often found in AD and related dementias (Landes et al., 2001; Ott et al., 1996).
Anosognosia in AD has been shown to be highly correlated with apathy, which suggests that this
unawareness of deficits is more closely related to emotional changes than to cognitive
impairment (Landes et al., 2001). This begs the question as to the relationship of emotional
changes to cognitive impairment. Is the relationship linear? How do severity of cognitive
impairment and emotional changes impact the other? Is there an interaction? Also as noted in the
introduction, Damasio (1994) investigated anosognosia in patients who had right somatosensory
39

damage located in the right temporoparietal cortical region and suggested these individuals
exhibited similar deficits as those with prefrontal damage. These patients with right
temporoparietal damage were unable to make appropriate decisions on personal and social
matters, and the patients with prefrontal damage, like patients with temporoparietal damage were
usually indifferent to their health status or impairment. The relationship of the lack of insight into
one’s emotional function longitudinally through the dementing process may not be a constant or
in other words linear. The relationship between cognitive impairment and emotional function
certainly bears further elucidation. A substantial body of literature has linked apathy and its
behavioral correlates to executive dysfunction (Cummings, 2003; Kuzis et al., 1999; McPherson
et al., 2002). However, executive dysfunction is not discrete from other cognitive domains. This
also calls into question the relationship of a particular neuropsychological instrument to the
domain it is purported to represent.
An Interaction Obscuring Significant Relationships
A fourth explanation for the study findings may be the possibility that there is some
particular interaction between diagnosis, symptoms, level of impairment, and neuropsychological
domain that is obscuring significant relationships. A substantial portion of the discussion has
focused on specific possible interactions between study variables. It is possible that there is an
interaction that is either obscuring or cancelling out various relationships based on the statistical
methods employed in this study. One possibility that could be obscuring significant relationships
between GDS subscale endorsement and executive measures may be an interaction between a
patient’s normative sense of decline associated with aging versus an autobiographical awareness
of their own dysfunction or impairment. This is consistent with Damasio’s (1994) description of
40
anosognosia in which, in the absence of self-awareness, a patient will apply what they perceive
as a normative, hypothetical endorsement or response pattern to their own situation based on
generalized stereotypical conceptualizations. While maybe not fully analogous with the concept
of confabulation, the substitution of perceived normative responses for responses based on actual
self-awareness would appear comparable. Concurrent endorsement of the GDS by caregiver
perception of the patient’s level of function could help differentiate this type of hypothetical
normative endorsement by a patient from an endorsement that actually reflects self-awareness.
As noted by Landes et al. (2001), apathy was found to be the main correlate of anosognosia
which, like apathy is associated with decreased cerebrovascular perfusion of the frontal lobe.
This line of thought sheds light on the heterogeneity and overlap between diagnosis, symptoms,
level of impairment, and neuropsychological domain. This heterogeneity is also observed in
research into the etiology and neuropathology of late-life depression.
A substantial body of literature investigating the course of cognitive deficits associated
with depression in the elderly often implicates specific impairments associated with apathy under
an inclusive conceptualization of depression (Alexopoulos et al., 2000; Keller, Buckley, &
Schatzberg, 2004; Krishnan, 2004; Schultz, Del Tredici, & Braak, 2004; Small, 2004). While
apathetic behaviors exist within the clinical definition of depression, this lack of precision may
lead to a lack of clarity in the literature. The importance of this precision is critical as much of
the literature often notes depression as a precursor to dementia (Keller, Buckley, & Schatzberg,
2004; Krishnan, 2004; Rapp et al., 2006; Steffens et al., 2000; Steffens et al., 2002).
Krishnan (2004) noted the links between depression and cognition being complex and
multifactorial. Krishnan (2004) further noted that the neuropathology associated with AD and
VaD is overlapping with both neurodegenerative and vascular processes occurring in both
41
dementias. The neurodegenerative process involves hippocampal volume and APOE genotype
while the vascular process specifically related to depression involves frontal and striatal areas,
particularly the prefrontal cortex, caudate (Krishnan, 2004) and hypometabolism of the rostral
anterior cingulate (Alexopoulos, 2000). Memory impairment is the hallmark of dementia. While
memory function or dysfunction is often related to hippocampal integrity and volume (Rapp et
al., 2006; Steffens et al., 2000; Steffens et al., 2002), successful memory encoding and retrieval
strategies are frontally mediated (Luria, 1980; Lezak et al., 2004; Stuss & Levine, 2002)
providing further evidence of the multifactorial nature of successful memory function.
The literature further describes the multifactorial relationship between hippocampal
volume (Rapp et al., 2006; Steffens et al., 2000; Steffens et al., 2002), amygdala volume,
hypothalamic-pituitary-adrenal axis dysregulation (Keller et al., 2004), executive dysfunction
(Alexopoulos, 2000), apathy (Landes et al., 2001; van Reekum, 2005), depression, and memory
with respect to AD and the related dementias (de la Torre, 2002; Krishnan, 2004; Schultz et al.,
2004; Small, 2004). While these relationships are complex and overlapping, it becomes clear for
the necessity of precise definitions and operationalizations in the ongoing research.
Another possibility that may be obscuring the results is the relative insensitivity of
standard neuropsychological executive function measures to executive dysfunction in the ventral
prefrontal cortex (VPFC). Stuss et al. (2001) indicated that patients with VPFC damage were not
impaired on the TMT-B. Stuss and Levine (2002) noted that much of what is known about
frontal or executive functions is based on neuropsychological studies on patients with
dysfunction in the dorsolateral prefrontal cortex (DLPFC) and that this is the frontal area most of
the standardized neuropsychological instruments are suggested to assess. They indicated patients
with VPFC damage can appear normal on frontal tests of PLPFC functions. Stuss and Levine
42

(2002) further noted that the primary distinction between the function of the DLPFC and the
VPFC is cognitive and affective, respectively. They indicated that within the frontal lobes further
functional/anatomical distinctions can be made. Specifically pertinent to this discussion is the
fact that superior medial lesions, particularly in the anterior cingulate, can cause an apathetic
syndrome in which the functional basis of this impairment is a lack of initiation (Stuss et al.,
2000). The frontal poles, which are anatomically close to the anterior cingulate, are involved in
more recently evolved human processes – particularly autonoetic (or “self-knowing”)
consciousness and self-awareness (Stuss & Levine, 2002). This speaks directly to the decreasing
self-awareness that is seen in AD and the related dementias. Damage in the VPFC region has a
tremendous impact on decision making and strategic self-regulation (Damasio, 1994; Stuss &
Levine, 2002). Stuss and Levine (2002) use the term “self-regulatory disorder” (SRD) to
describe patients who have an inability to regulate behavior according to internal goals and
constraints. They noted that it arises from the inability to hold a mental representation of the self
on-line and to use this self-related information to inhibit inappropriate responses. Stuss and
Levine (2002) further indicated that SRD becomes most apparent in unstructured situations as
opposed to structured situations where an individual can rely upon over-learned routines or pick
up on environmental cues such as in a structured neuropsychological examination. The evidence
of frontal lobe involvement in self-awareness has been obtained through memory research (Stuss
& Levine, 2002). Right frontal lobe activation is associated with episodic memories. These
memories are described as temporally tagged memories that are personally relevant, emotionally
salient to the individual, and involved in self-awareness (Stuss & Levine, 2002). Stuss & Levine
(2002) further noted that research supports a preeminent role of the right frontal lobe for personal
memory, self-reflective memory, and when retrieving emotional memories from the past. Stuss
43
& Levine (2002) relate frontal lobe impairment and deficits in self-awareness that are difficult to
detect with standard neurological or neuropsychological assessment:
Performance on executive tests was normal/superior in one, and only mildly impaired in the other. Both patients could clearly identify their failings, exhibited concern about their problems, and could identify appropriate corrections to the problems. Neither, however, could return to their high-level executive work. The deficits in these patients were not at the level of executive control. Rather, they had a lack of real understanding of the implications of the problems and an inability to act in their own self-interest, despite knowing what to do and at least verbalizing an intent to change. These patients lack a mental model, not of the world, but of their own capacities and role in the world. The discrepancy between their mental model and their experience leaves them without a purpose or ability to organize perceptions and actions for future goals. (p. 421-422)
While these patients were not suffering from the behavioral precursors of AD or any related
dementias, the functional impact of their impairment is analogous to the loss of self-reflection
and loss of a personal sense of relationship to the world. This loss of self-awareness, while
devastating to the individual, is perhaps even more catastrophic to family members and
caregivers. The role of affect in the cognitive process appears critical to successfully initiate
one’s cognitive capacity adaptively in service to one’s self.
General Conclusions
This study investigated the relationship between apathy, depression, and executive
functions in individuals with AD and related dementias. The first objective of this study was to
determine if apathy had a greater impact on executive functions compared to depression. The
second objective was to determine the effectiveness of the GDS as a screen for apathy. The two
hypotheses established to meet these objectives were not supported with the analyses. However,
exploratory analyses suggested a possible non-linear relationship with apathy and various levels
of dementia severity. Exploratory analysis also suggested mean levels of endorsement for apathy
44

varied by diagnosis. This study, while not confirming the established hypotheses, did suggest
there some type of relationship with apathy and dementia.
Study Limitations
This study had several limitations that may have impacted the results. First, most clinical
databases will have limitations such as missing data as well as skewed or kurtotic variables that
impact the conclusions that can be reached under the general linear model. This database was no
exception. Furthermore, the study design itself limited the range of dementia severity and thus
may have decreased the opportunity to observe a statistically significant relationship between the
study variables.
Future Research
The next step for future research would be to perform a confirmatory factor analysis
(CFA) on the existing principal components analysis (PCA) to further validate the GDS factor
structure on the cognitively impaired elderly. Additional executive measures that tap various
aspects of executive function, particularly functions found to be associated with the VPFC,
should be incorporated to further elucidate the relationship between apathy as measured by the
GDS subscale and executive dysfunction. Non-parametric statistical procedures could be applied
to the existing data to further understand the possible non-linear relationship between the
variables. For future patients, it would be interesting to have a caregiver concurrently fill out the
GDS to see if the caregiver’s endorsement pattern differs from that of the patient. Other studies
have used caregiver endorsement measures to minimize the effect of the patient’s diminished
45
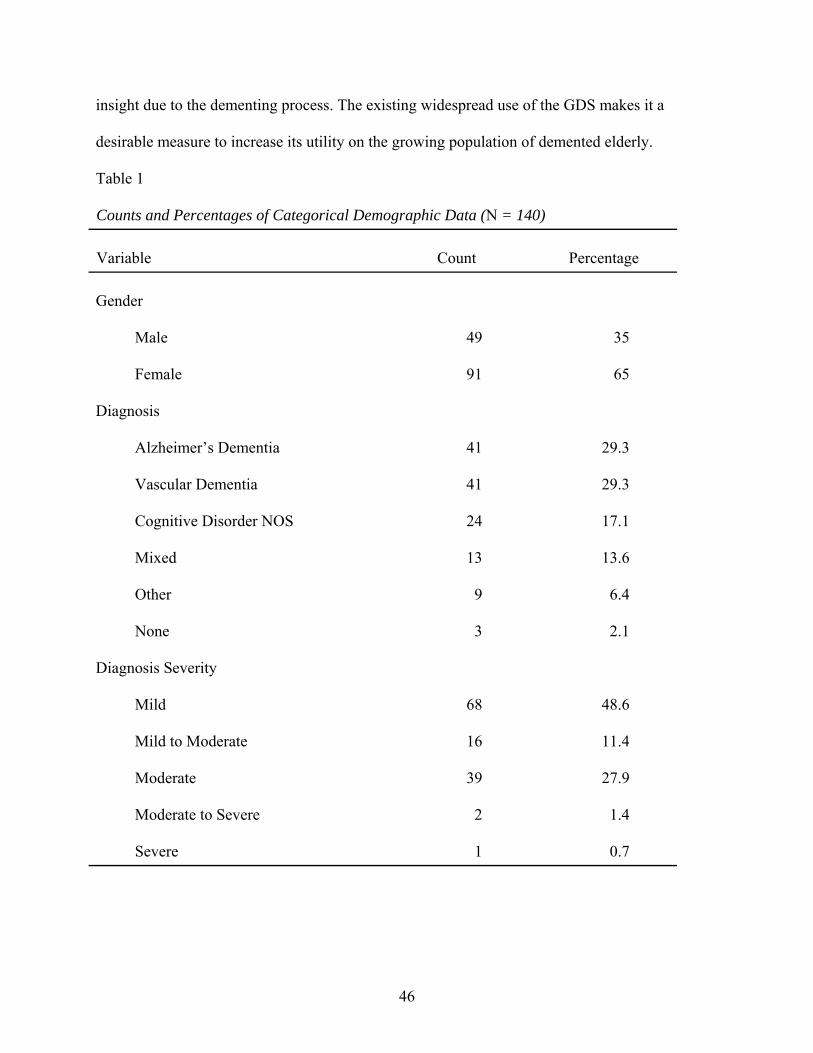
insight due to the dementing process. The existing widespread use of the GDS makes it a
desirable measure to increase its utility on the growing population of demented elderly.
Table 1 Counts and Percentages of Categorical Demographic Data (N = 140) Variable
Count
Percentage
Gender
Male
49
35
Female
91
65
Diagnosis
Alzheimer’s Dementia
41
29.3
Vascular Dementia
41
29.3
Cognitive Disorder NOS
24
17.1
Mixed
13
13.6
Other
9
6.4
None
3
2.1
Diagnosis Severity
Mild
68
48.6
Mild to Moderate
16
11.4
Moderate
39
27.9
Moderate to Severe
2
1.4
Severe
1
0.7
46

Table 2 Descriptive Statistics for Continuous Demographic Variables (N = 140) Variable
M
SD
Range
Age
78.20
7.23
28.0
Mini-Mental State Exam
24.86
3.35
15.0
Table 3 Descriptive Statistics for Test Variables (N = 140) Test Instruments
M
SD
Skewness
Kurtosis
Geriatric Depression Scale
Apathy
1.66
1.39
3.12
-0.49
Dysphoria
2.71
2.52
3.71
-0.13
Meaninglessness
1.26
1.45
6.80
4.81
Cognitive Impairment
2.11
1.52
2.29
-0.78
Total Score
7.74
4.97
2.75
-.0.30
Behavioral Dyscontrol Scale
12.00
3.68
-1.77
-1.32
Trail Making Test – Part A
77.96
55.02
11.76
16.27
Trail Making Test – Part B
228.59
79.75
-2.61
-3.10
Clock Drawing Task
2.93
1.05
-3.54
-0.85
47

48
Table 4 Reliability Coefficients of the Geriatric Depression Scale and Subscales (N = 140) GDS Variable
No. of Items
Cronbach’s α
Dysphoria
11
.755
Meaninglessness
7
.635
Apathy
6
.505
Cognitive Impairment
6
.596
Total
30
.816

Table 5 Correlations Between Geriatric Depression Subscales and Executive Measures (N = 140)
GDS Subscale
TMT
Apathy
Dysphoria
Meaninglessness
Cognitive
Impairment
Part A
Part B
CDT
BDS Apathy
.331**
.366**
.360**
-.077
.091
-.026
.099
Dysphoria
.455**
.349**
.000
-.001
.022
-.004
Meaninglessness
.178*
.165
.204*
-.078
-.093
Cognitive Impairment
-.203*
-.032
.050
.190*
Part A
.453**
-.270**
.328**
Part B
-.373**
-.394**
CDT
.359**
BDS
*p < .05 (2-tailed). **p < .01 (2-tailed).
49

Table 6 One-way ANOVA Mean Differences of GDS Subscale Endorsements: BDS Cutoff
Behavioral Dyscontrol Scale
Impaired
(n = 46)
Non-Impaired
(n = 94)
GDS Subscale
M
SD
M
SD
df
F
p
Apathy
1.54
1.24
1.72
1.45
138
.518
.473
Dysphoria
2.43
2.30
2.85
2.62
138
.842
.360
Meaninglessness
1.35
1.51
1.21
1.42
138
.268
.606
Cognitive Impairment
1.61
1.31
2.35
1.56
138
7.768**
.006
**p < .01.
Table 8 One-way ANOVA Mean Differences of GDS Subscale Endorsements: CDT (N = 140)
Clock Drawing Task
Impaired
(n = 89)
Non-Impaired
(n = 51)
GDS Subscale
M
SD
M
SD
df
F
p
Apathy
1.75
1.35
1.51
1.45
138
.996
.320
Dysphoria
2.85
2.67
2.47
2.23
138
.749
.388
Meaninglessness
1.36
1.52
1.08
1.29
138
1.227
.270
Cognitive Impairment
2.18
1.56
1.98
1.44
138
.559
.456
50

Table 7 One-way ANOVA Mean Differences of GDS Subscale Endorsements: BDS Categorical (N = 140)
Behavioral Dyscontrol Scale
Severe
(n = 15)
Moderate
(n = 31)
Mild
(n = 69)
Non-Impaired
(n = 25)
GDS Subscale
M
SD
M
SD
M
SD
M
SD
df
F
p
Apathy
1.13
.99
1.74
1.32
1.70
1.45
1.80
1.50
136
.855
.466
Dysphoria
2.60
2.38
2.35
2.29
2.91
2.75
2.68
2.27
136
.360
.782
Meaninglessness
1.40
1.45
1.32
1.56
1.27
1.51
1.04
1.36
136
.257
.856
Cognitive Impairment
1.53
1.36
1.64
1.30
2.38
1.61
2.28
1.43
136
2.600
.055
51

Table 9 One-way ANOVA Mean Differences of GDS Subscale Endorsements: TMT-A (N = 140)
Trail Making Test – Part A
Severe
(n = 89)
Mild to Moderate
(n = 25)
Non-Impaired
(n = 26)
GDS Subscale
M
SD
M
SD
M
SD
df
F
p
Apathy
1.74
1.43
1.64
1.29
1.42
1.36
137
.532
.589
Dysphoria
2.79
2.42
3.16
3.20
2.04
2.05
137
1.370
.258
Meaninglessness
1.36
1.53
1.24
1.20
.923
1.35
137
.917
.402
Cognitive Impairment
1.98
1.38
2.32
1.75
2.35
1.72
137
.894
.412
52

53
Table 10 One-way ANOVA Mean Differences of GDS Subscale Endorsements: TMT-B (N = 140)
Trail Making Test – Part B
Severe
(n = 121)
Mild to Moderate
(n = 14)
Non-Impaired
(n = 5)
GDS Subscale
M
SD
M
SD
M
SD
df
F
p
Apathy
1.69
1.37
1.79
1.58
.80
1.30
137
1.040
.356
Dysphoria
2.74
2.57
2.71
2.46
2.00
1.41
137
.207
.813
Meaninglessness
1.35
1.50
.93
.83
.00
.00
137
2.539
.083
Cognitive Impairment
2.11
1.50
2.21
1.80
1.80
1.30
137
.136
.873
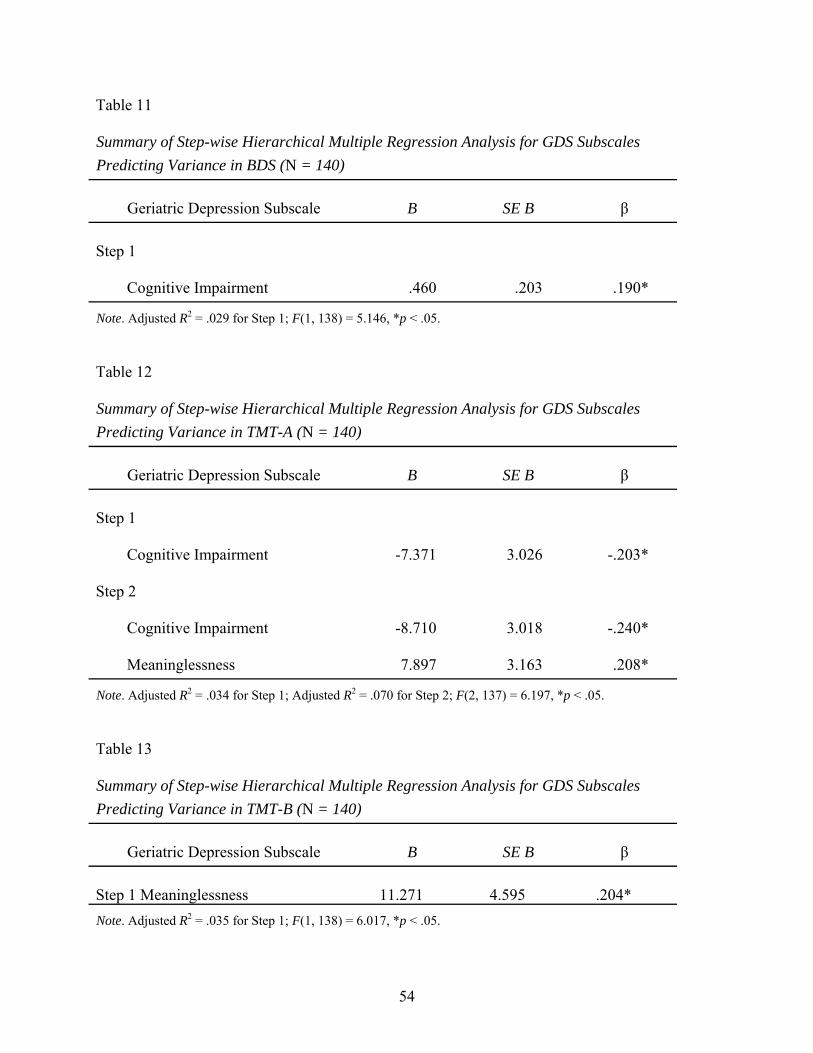
Table 11 Summary of Step-wise Hierarchical Multiple Regression Analysis for GDS Subscales Predicting Variance in BDS (N = 140)
Geriatric Depression Subscale
B
SE B β
Step 1
Cognitive Impairment
.460
.203
.190*
Note. Adjusted R2 = .029 for Step 1; F(1, 138) = 5.146, *p < .05.
Table 12 Summary of Step-wise Hierarchical Multiple Regression Analysis for GDS Subscales Predicting Variance in TMT-A (N = 140)
Geriatric Depression Subscale
B
SE B β
Step 1
Cognitive Impairment
-7.371
3.026
-.203*
Step 2
Cognitive Impairment
-8.710
3.018
-.240*
Meaninglessness
7.897
3.163
.208*
Note. Adjusted R2 = .034 for Step 1; Adjusted R2 = .070 for Step 2; F(2, 137) = 6.197, *p < .05.
Table 13 Summary of Step-wise Hierarchical Multiple Regression Analysis for GDS Subscales Predicting Variance in TMT-B (N = 140)
Geriatric Depression Subscale
B
SE B β
Step 1 Meaninglessness
11.271
4.595
.204*
Note. Adjusted R2 = .035 for Step 1; F(1, 138) = 6.017, *p < .05.
54

Level of Impairment - BDS Cutoff
Non- ImpairedImpaired
Mea
n Ite
ms
- GD
S Ap
athy
1.8
1.7
1.6
1.5
Figure 1. Mean number of endorsed GDS Apathy subscale items across BDS Cutoff levels of impairment.
Level of Impairment - BDS Cutoff
Non- ImpairedImpaired
Mea
n Ite
ms
- GD
S D
ysph
oria
2.9
2.8
2.7
2.6
2.5
2.4
Figure 2. Mean number of endorsed GDS Dysphoria subscale items across BDS Cutoff levels of impairment.
55
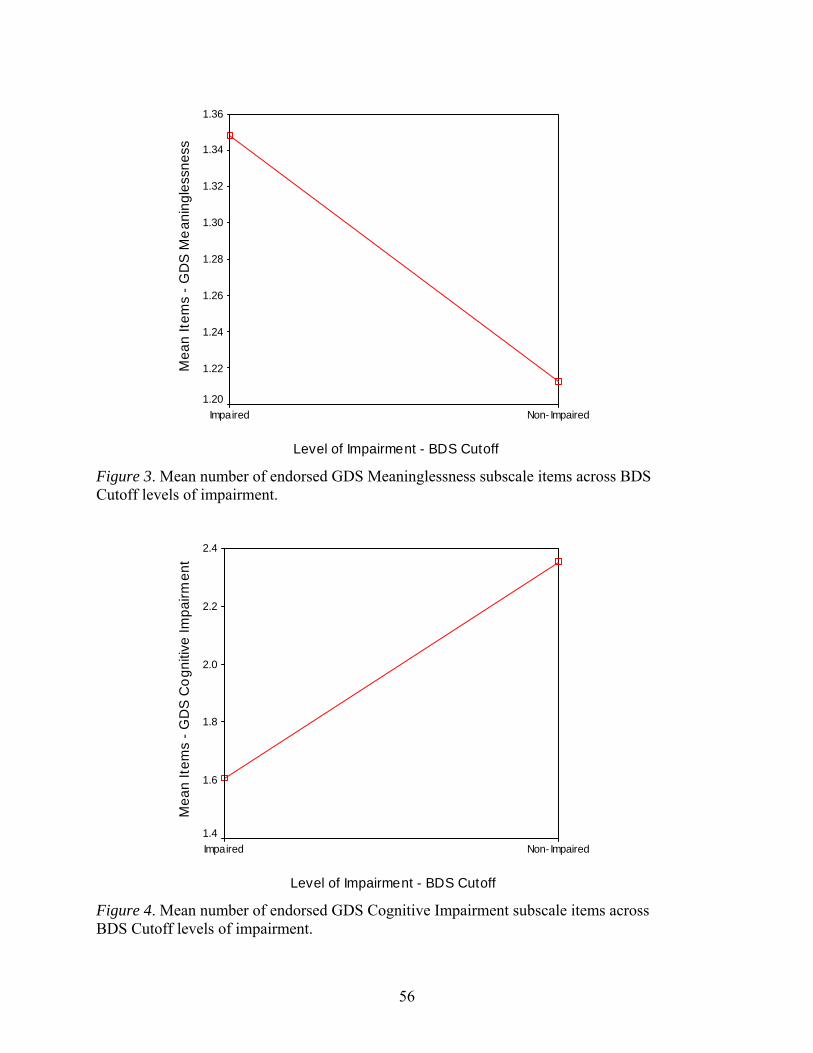
Level of Impairment - BDS Cutoff
Non- ImpairedImpaired
Mea
n Ite
ms
- GD
S M
eani
ngle
ssne
ss
1.36
1.34
1.32
1.30
1.28
1.26
1.24
1.22
1.20
Figure 3. Mean number of endorsed GDS Meaninglessness subscale items across BDS Cutoff levels of impairment.
Level of Impairment - BDS Cutoff
Non- ImpairedImpaired
Mea
n Ite
ms
- GD
S C
ogni
tive
Impa
irmen
t
2.4
2.2
2.0
1.8
1.6
1.4
Figure 4. Mean number of endorsed GDS Cognitive Impairment subscale items across BDS Cutoff levels of impairment.
56

Level of Impairment - BDS Categorical
Non- ImpairedMildModerateSevere
Mea
n Ite
ms
- GD
S Ap
athy
2.0
1.8
1.6
1.4
1.2
1.0
Figure 5. Mean number of endorsed GDS Apathy subscale items across BDS Categorical levels of impairment.
Level of Impairment - BDS Categorical
Non- ImpairedMildModerateSevere
Mea
n Ite
ms
- GD
S D
ysph
oria
3.0
2.9
2.8
2.7
2.6
2.5
2.4
2.3
Figure 6. Mean number of endorsed GDS Dysphoria subscale items across BDS Categorical levels of impairment.
57
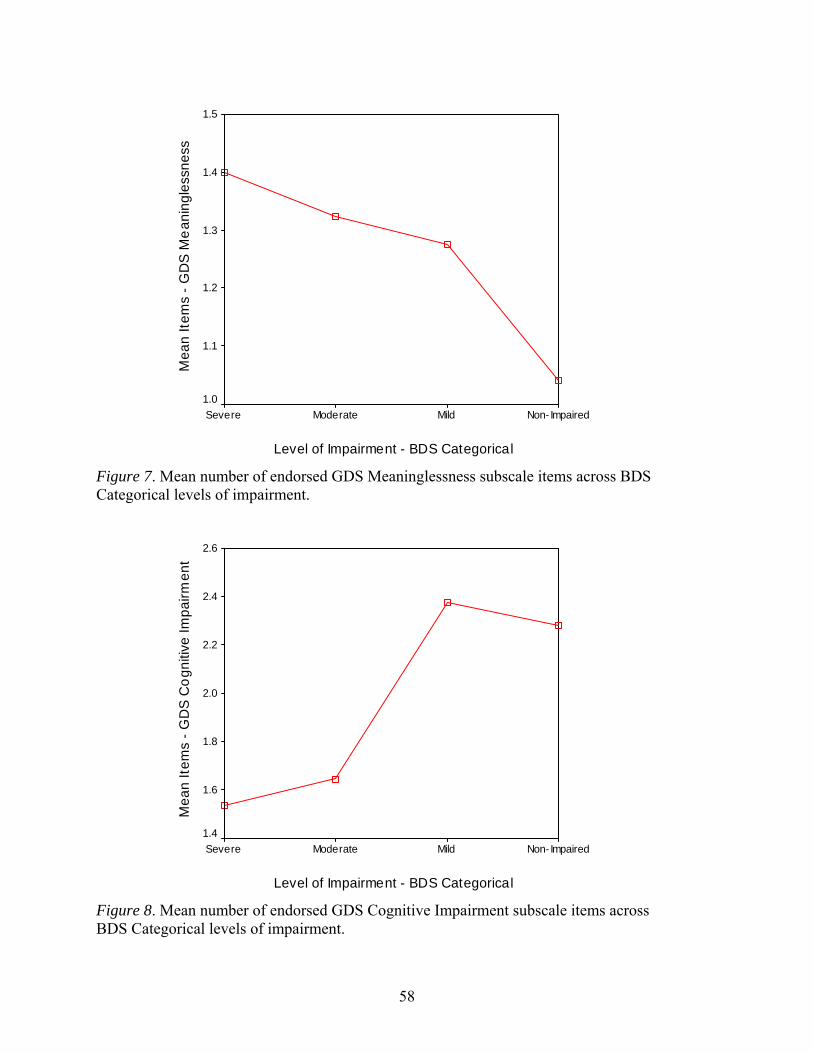
Level of Impairment - BDS Categorical
Non- ImpairedMildModerateSevere
Mea
n Ite
ms
- GD
S M
eani
ngle
ssne
ss
1.5
1.4
1.3
1.2
1.1
1.0
Figure 7. Mean number of endorsed GDS Meaninglessness subscale items across BDS Categorical levels of impairment.
Level of Impairment - BDS Categorical
Non- ImpairedMildModerateSevere
Mea
n Ite
ms
- GD
S C
ogni
tive
Impa
irmen
t
2.6
2.4
2.2
2.0
1.8
1.6
1.4
Figure 8. Mean number of endorsed GDS Cognitive Impairment subscale items across BDS Categorical levels of impairment.
58

Level of Impairment - CDT Cutoff
Non- ImpairedImpaired
Mea
n Ite
ms
- GD
S Ap
athy
1.8
1.7
1.6
1.5
1.4
Figure 9. Mean number of endorsed GDS Apathy subscale items across CDT Cutoff levels of impairment.
Level of Impairment - CDT Cutoff
Non- ImpairedImpaired
Mea
n Ite
ms
- GD
S D
ysph
oria
2.9
2.8
2.7
2.6
2.5
2.4
Figure 10. Mean number of endorsed GDS Dysphoria subscale items across CDT Cutoff levels of impairment.
59

Level of Impairment - CDT Cutoff
Non- ImpairedImpaired
Mea
n Ite
ms
- GD
S M
eani
ngle
ssne
ss
1.4
1.3
1.2
1.1
1.0
Figure 11. Mean number of endorsed GDS Meaninglessness subscale items across CDT Cutoff levels of impairment.
Level of Impairment - CDT Cutoff
Non- ImpairedImpaired
Mea
n Ite
ms
- GD
S C
ogni
tive
Impa
irmen
t
2.2
2.1
2.0
1.9
Figure 12. Mean number of endorsed GDS Cognitive Impairment subscale items across CDT Cutoff levels of impairment.
60
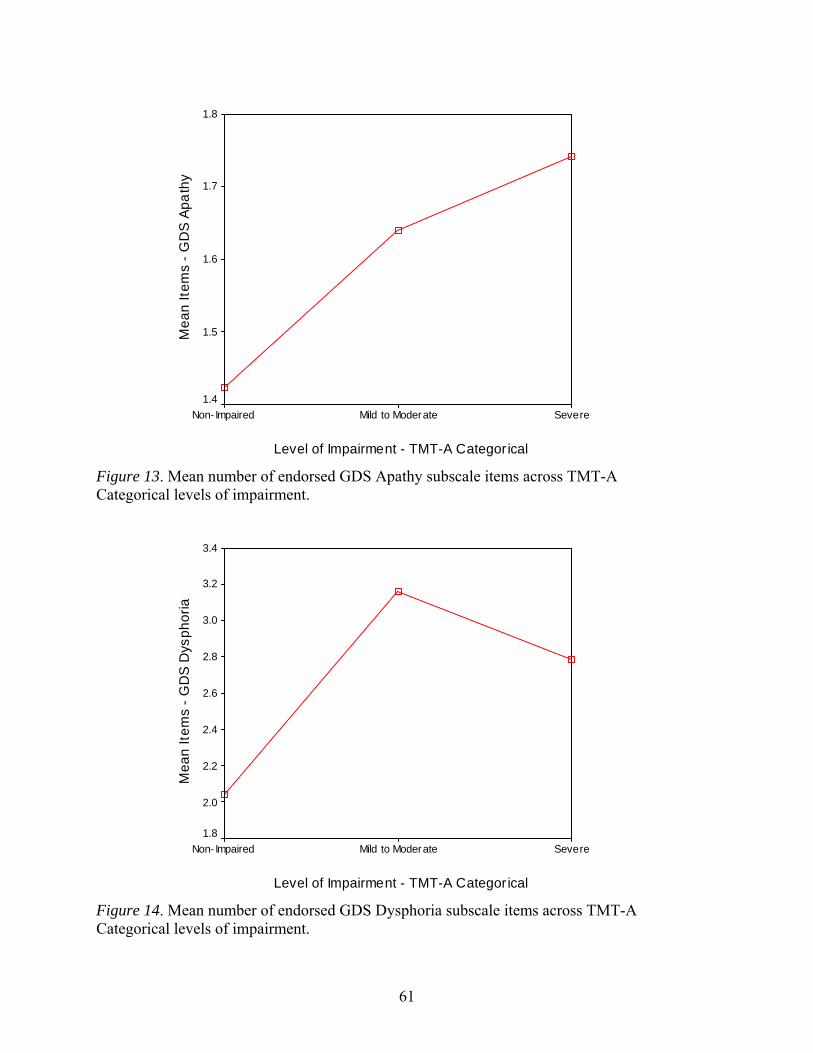
Level of Impairment - TMT-A Categor ical
SevereMild to ModerateNon- Impaired
Mea
n Ite
ms
- GD
S Ap
athy
1.8
1.7
1.6
1.5
1.4
Figure 13. Mean number of endorsed GDS Apathy subscale items across TMT-A Categorical levels of impairment.
Level of Impairment - TMT-A Categor ical
SevereMild to ModerateNon- Impaired
Mea
n Ite
ms
- GD
S D
ysph
oria
3.4
3.2
3.0
2.8
2.6
2.4
2.2
2.0
1.8
Figure 14. Mean number of endorsed GDS Dysphoria subscale items across TMT-A Categorical levels of impairment.
61
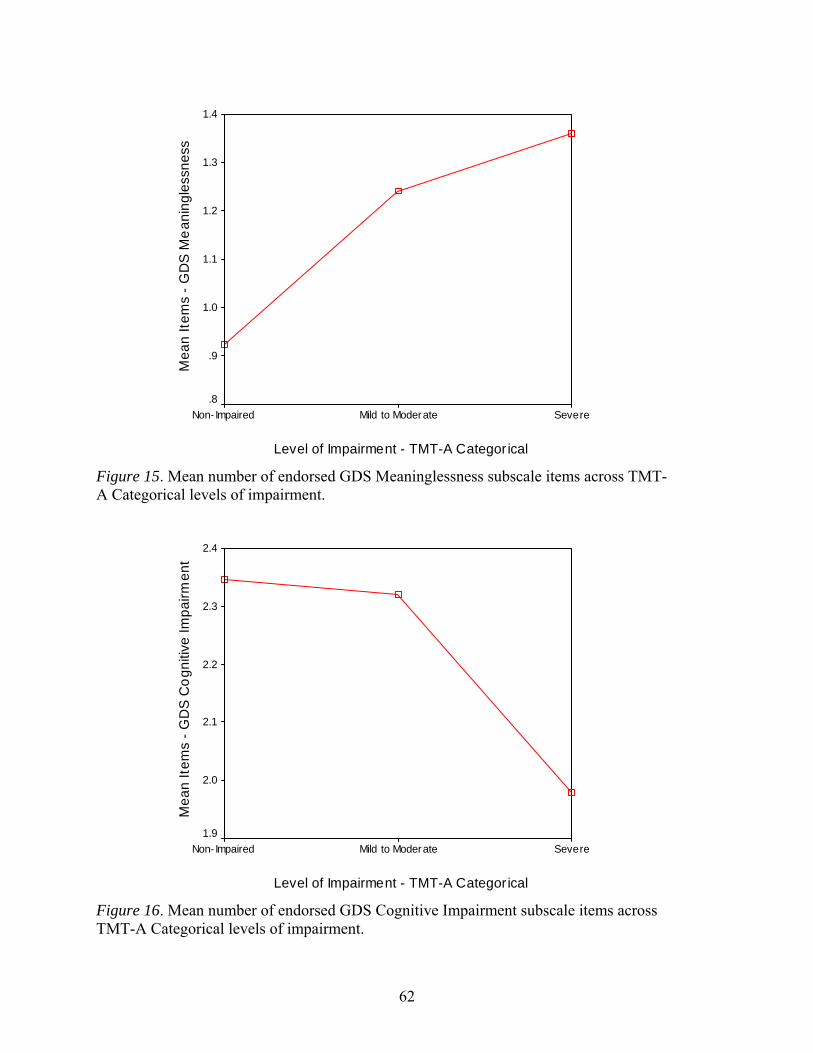
Level of Impairment - TMT-A Categor ical
SevereMild to ModerateNon- Impaired
Mea
n Ite
ms
- GD
S M
eani
ngle
ssne
ss
1.4
1.3
1.2
1.1
1.0
.9
.8
Figure 15. Mean number of endorsed GDS Meaninglessness subscale items across TMT-A Categorical levels of impairment.
Level of Impairment - TMT-A Categor ical
SevereMild to ModerateNon- Impaired
Mea
n Ite
ms
- GD
S C
ogni
tive
Impa
irmen
t
2.4
2.3
2.2
2.1
2.0
1.9
Figure 16. Mean number of endorsed GDS Cognitive Impairment subscale items across TMT-A Categorical levels of impairment.
62

Level of Impairment - TMT-B Categor ical
SevereMild to ModerateNon- Impaired
Mea
n Ite
ms
- GD
S Ap
athy
2.0
1.8
1.6
1.4
1.2
1.0
.8
.6
Figure 17. Mean number of endorsed GDS Apathy subscale items across TMT-B Categorical levels of impairment.
Level of Impairment - TMT-B Categor ical
SevereMild to ModerateNon- Impaired
Mea
n Ite
ms
- GD
S D
ysph
oria
2.8
2.6
2.4
2.2
2.0
1.8
Figure 18. Mean number of endorsed GDS Dysphoria subscale items across TMT-B Categorical levels of impairment.
63

64
Level of Impairment - TMT-B Categor ical
SevereMild to ModerateNon- Impaired
Mea
n Ite
ms
- GD
S M
eani
ngle
ssne
ss
1.6
1.4
1.2
1.0
.8
.6
.4
.2
0.0
Figure 19. Mean number of endorsed GDS Meaninglessness subscale items across TMT-B Categorical levels of impairment.
Level of Impairment - TMT-B Categorical
SevereMild to ModerateNon-Impaired
Mea
n Ite
ms
- GD
S C
ogni
tive
Impa
irmen
t
2.3
2.2
2.1
2.0
1.9
1.8
1.7
Figure 20. Mean number of endorsed GDS COGNITIVE IMPAIRMENT subscale items across TMT-B Categorical levels of impairment.

REFERENCES
Adams, K. B. (2001). Depressive symptoms, depletion, or developmental change? Withdrawal, apathy, and lack of vigor in the geriatric depression scale. Gerontologist, 41, 768-777.
Adams, K. B., Matto, H. C., & Sanders, S. (2004). Confirmatory factor analysis of the geriatric depression scale. Gerontologist, 44, 818-826.
Alexopoulos, G. S., Meyers, B. S., Young, R. C., Kalayam, B., Kakuma, T., Gabrielle, M., Sirey, J. A., & Hull, J. (2000). Executive dysfunction and long-term outcomes of geriatric depression. Archives of General Psychiatry, 57, 285-290.
Amieva, H., Lafont, S., Auriacombe, S., Rainville, C., Orgogozo, J.-M., Dartigues, J.-F., et al. (1998). Analysis of error types in the Trail Making Test evidences an inhibitory deficit in dementia of the Alzheimer’s type. Journal of Clinical and Experimental Neuropsychology, 20, 280-285.
Belanger, H. G., Wilder-Willis, K., Malloy, P., Salloway, S., Hamman, R. F., & Grigsby, J. (2005). Assessing motor and cognitive regulation in AD, MCI, and controls using the Behavioral Dyscontrol Scale. Archives of Clinical Neuropsychology, 20, 183-189.
Bell-McGinty, S., Podell, K., Franzen, M., Baird, A. D., & Williams, M. J. (2002). Standard measures of executive function in predicting instrumental activities of daily living in older adults. International Journal of Geriatric Psychiatry, 17, 828-834.
Boone, K., Ponton, M. O., Gorsuch, R. L., Gonzalez, J. J., & Miller, B. L. (1998). Factor analysis of four measures of prefrontal lobe functioning. Archives of Clinical Neuropsychology, 13, 585-595.
Boyle, P. A., Malloy, P. F., Salloway, S., Cahn-Weiner, D. A., Cohen, R., & Cummings, J. L. (2003). Executive dysfunction and apathy predict functional impairment in Alzheimer disease. American Journal of Geriatric Psychiatry, 11, 214-221.
Brink, T. L., Yesavage, J. A., Lum, O., Heersema, P. H., Adey, M., & Rose, T. L. (1982). Screening tests for geriatric depression. Clinical Gerontologist, 1, 37-43.
Cahn-Weiner, D. A., Malloy, P. F., Boyle, P. A., Marran, M., & Salloway, S. (2000). Prediction of functional status from neuropsychological tests in community-dwelling elderly individuals. Clinical Neuropsychologist, 14, 187-195.
Craig, A. H., Cummings, J. L., Fairbanks, L., Itti, L., Miller, B. L., Li, J., & Mena, I. (1996). Cerebral blood flow correlates of apathy in Alzheimer’s disease. Archives of Neurology, 53, 1116-1120.
Cummings, J. L. (2003). The neuropsychiatry of Alzheimer’s disease and related dementias. London: Martin Dunitz.
65

Cummings, J. L., Mega, M., Gray, K., Rosenberg-Thompson, S., Carusi, D. A., & Gornbein, J. (1994). The Neuropsychiatric Inventory: Comprehensive assessment of psychopathology in dementia. Neurology, 44, 2308-2314.
Damasio, A. R. (1994). Descartes’ error: Emotion, reason, and the human brain. New York: Putnam Publishing Group.
Davis, T. E., & Houtz, A. W. (2005). Clock-drawing task: An executive function task comparison. Unpublished manuscript.
de la Torre, J. C. (2002). Alzheimer disease as a vascular disorder nosological evidence. Stroke, 33, 1152-1162.
DeVellis, R. F. (2003). Scale development: Theory and applications (2nd ed.) [Applied Social Research Methods Series, 26]. Thousand Oaks, CA: Sage Publications.
Fitz, A. G., & Teri, L. (1994). Depression, cognition, and functional ability in patients with Alzheimer’s disease. Journal of the American Geriatrics Society, 42, 186-191.
Folstein, M. F., Folstein, S. E., & McHugh, P. R. (1975). Mini-mental state: A practical method for grading the cognitive state of patients for the clinician. Journal of Psychiatric Research, 12, 189-198.
Freedman, M., Leach, L., Kaplan, E., Delis, D., Shulman, K., & Winocur, G. (1994). Clock-drawing: A neuropsychological analysis. New York: Oxford University Press.
Fujii, D. E. (1992). The clock drawing test as a screening measure for dementia of the Alzheimer type: Development and validation of a theoretically based scoring criteria. Dissertation Abstracts International, 53(4-B), 2059.
Gallo, J. J., Anthony, J. C., & Munthen, B. O. (1994). Age differences in the symptoms of depression: A latent trait analysis. Journal of Gerontology: Psychological Sciences, 49, 251-264.
Grigsby, J., Kaye, K., & Robbins, L. J. (1992). Reliabilities, norms and factor structure of the Behavioral Dyscontrol Scale. Perceptual and Motor Skills, 74, 883-892.
Grigsby, J., & Kaye, K. (1996). Behavioral Dyscontrol Scale: Manual (2nd ed.). Authors.
Hall, J. R., & Davis, T. E. (2008, in press). Factor structure of the Geriatric Depression Scale with cognitively impaired elderly. Clinical Gerontologist.
Hall, J. R. & Harvey, M. B. (2008). Behavioral regulation: Factor analysis and application of the Behavioral Dyscontrol Scale in dementia and mild cognitive impairment. International Journal of Geriatric Psychiatry, 23, 314-318.
Hathaway, S. R., McKinley, J. C. (1943). Booklet for the Minnesota Multiphasic Personality Inventory. New York: The Psychological Corporation.
66

Katz, I. R. (1998). Diagnosis and treatment of depression in patients with Alzheimer’s disease and other dementias. Journal of Clinical Psychiatry, 59, 38-44.
Kaye, K., Grigsby, J., Robbins, L. J., & Korzun, B. (1990). Prediction of independent functioning and behavior problems in geriatric patients. Journal of the American Geriatrics Society, 38, 1304-1310.
Keller, J., Buckley, T. M., & Schatzberg, A. F. (2004). Late-life depression and the vascular hypothesis. In S. P. Roose & H. A. Sackheim (Eds.), Late-life depression (157-166). New York: Oxford.
Kieffer, K. M., & Reese, R. J. (2002). A reliability generalization study of the geriatric depression scale. Educational and Psychological Measurement, 62, 969-994.
Koder, D., Brodaty, H. & Anstey, K. J. (1996). Cognitive therapy for depression in the elderly. International Journal of Geriatric Psychiatry, 11, 97-107.
Krishnan, K. R. R. (2004). Late-life depression and the vascular hypothesis. In S. P. Roose & H. A. Sackheim (Eds.), Late-life depression (148-156). New York: Oxford.
Kuzis, G., Sabe, L., Tiberti, C., Dorrego, F., & Starkstein, S. E., (1999). Neuropsychological correlates of apathy and depression in patients with dementia. Neurology, 52, 1403-1407.
Landes, A. M., Sperry, S. D., Strauss, M. E., & Geldmacher, D. S. (2001). Apathy in Alzheimer’s disease. Journal of the American Geriatrics Society, 49, 1700-1707.
Levy, M. L., Cummings, J. L., Fairbanks, L. A., Masterman, D., Miller, B. L., Craig, A. H., Paulsen, J. S., & Litvan, I. (1998). Apathy is not depression. Journal of Neuropsychiatry and Clinical Neurosciences, 10, 314-319.
Lezak, M. D., Howieson, D. B., & Loring, D. W. (2004). Neuropsychological assessment (4th ed.). New York: Oxford University Press.
Luria, A. R. (1980). Higher cortical functions in man (2nd ed.). New York: Basic Books.
Lyketsos, C. G., Steele, C., Baker, L., Galik, E., Kopunek, S., Steinberg, M., & Warren, A. (1997). Major and minor depression in Alzheimer’s disease: Prevalence and impact. Journal of Neuropsychiatry and Clinical Neurosciences, 9, 556-561.
Marin, R. S. (1990). Differential diagnosis and classification of apathy. American Journal of Psychiatry, 147, 22-30.
Marin, R. S. (1997). Differential diagnosis of apathy and related disorders of diminished motivation. Psychiatric Annals, 27, 30-33.
Marin, R. S., Firinciogullari, S., & Biedrzycki, R. C. (1993). The sources of convergence between measures of apathy and depression. Journal of Affective Disorders, 28, 117-124.
67

McKhann, G., Drachman, D., Folstein, M., Katzman, R., Price, D., & Stadlan, E. M. (1984). Clinical diagnosis of Alzheimer’s disease: Report of the NINCDS-ADRDA Work Group under the auspices of Department of Health and Human Services Task Force on Alzheimer’s disease. Neurology, 34, 939-944.
McPherson, S., Fairbanks, L. Tiken, S., Cummings, J. L., & Back-Madruga, C. (2002). Apathy and executive function in Alzheimer’s disease. Journal of the International Neuropsychological Society, 8, 373-381.
Mega, M. S., Cummings, J. L., Fiorello, T., & Gornbein, J. (1996). The spectrum of behavioral changes in Alzheimer’s disease. Neurology, 46, 130-135.
Newmann, J. P. (1989). Aging and depression. Psychology and Aging, 4, 150-165.
Newmann, J. P., Engel, R. J., & Jensen, J. E. (1991). Age differences in depressive symptom experiences. Journal of Gerontology: Psychological Sciences, 46A, 223-235.
Newmann, J. P., Klein, M. H., Jensen, J. E., & Essex, M. J. (1996). Depressive symptom experience among older women: A comparison of alternative measurement approaches. Psychology and Aging, 11, 112-126.
Nolan, K. A., & Mohs, R. C. (1994). Screening for dementia in family practice. In R. W. Richter & J. P. Blass (Eds.), Alzheimer’s disease: A guide to practical management, Part II (pp. 81-95). St. Louis, MO: Mosby.
Ott, B. R., Noto, R. B., & Fogel, B. S. (1996). Apathy and loss of insight in Alzheimer’s disease: A SPECT imaging study. Journal of Neuropsychiatry and Clinical Neurosciences, 8, 41-46.
Parmelee, P. A., Lawton, M. P., & Katz, I. R. (1989). Psychometric properties of the Geriatric Depression Scale among the institutionalized aged. Psychological Assessment: A Journal of Consulting and Clinical Psychology, 1, 331-338.
Paulsen, J. S., Stout, J. C., DeLaPena, J., & Romero, R. (1996). Frontal behavioral syndromes in cortical and subcortical dementia. Assessment, 3, 327-337.
Payne, J. L., Lyketsos, C. G., Steele, C., Baker, L., Galik, E., Kopunek, S., Steinberg, M., & Warren, A. (1998). Relationship of cognitive and functional impairment to depressive features in Alzheimer’s disease and other dementias. Journal of Clinical Neuropsychiatry and Clinical Neurosciences, 10, 440-447.
Peach, J., Koob, J. J., & Kraus, M. J., (2001). Psychometric evaluation of the Geriatric Depression Scale (GDS): Supporting its use in health care settings. Clinical Gerontologist, 23, 57-68.
Petersen, R. D. (Ed.). (2003). Mild cognitive impairment: Aging to Alzheimer’s disease. New York: Oxford University Press.
68

Rapp, M. A., Schnaider-Beeri, M., Grossman, H., Sano, M., Perl, D. P., Purohit, D. P., Gorman, J. M., & Haroutunian, V. (2006). Increased hippocampal plaques and tangles in patients with Alzheimer disease with a lifetime history of major depression. Archives of General Psychiatry, 63, 161-167.
Rasmusson, D. X., Zonderman, A. B., Kawas, C., Resnick, S. M. (1998). Effects of age and dementia on the Trail Making Test. Clinical Neuropsychologist, 12, 169-178.
Ready, R. E., Ott, B. R., Grace, J. G., & Cahn-Weiner, D. A. (2003). Apathy and executive dysfunction in mild cognitive impairment and Alzheimer disease. American Journal of Geriatric Psychiatry, 11, 222-228.
Reitan, R. M., & Wolfson, D. (1993). The Halstead-Reitan neuropsychological test battery: Theory and clinical application (2nd ed.). Tucson, AZ: Neuropsychology Press.
Román, G. C., Tatemichi, T. K., Erkinjuntti, T., Cummings, J. L., Masdeu, J. C., Garcia, J. H., et al. (1993). Vascular dementia: Diagnostic criteria for research studies. Report of the NINDS-AIREN International Workshop. Neurology, 3, 250-260.
Schultz, C., Del Tredici, K., & Braak, H. (2004). Neuropathology of Alzheimer’s disease. In R. W. Richter & B. Z. Richter (Eds.), Alzheimer’s disease: A physician’s guide to practical management (pp. 21-32). Totowa, NJ: Humana Press.
Sheikh, J. I., & Yesavage, J. A. (1986). Geriatric Depression Scale (GDS): Recent evidence and development of a shorter version. In T. L. Brink (Ed.). Clinical gerontology: A guide to assessment and interventions (pp. 165-173). New York: Haworth Press.
Shulman, K. I. (2000). Clock-drawing: Is it the ideal cognitive screening test? International Journal of Geriatric Psychiatry, 15, 548-561.
Small, S. A. (2004). Mild forgetfulness. In R. W. Richter & B. Z. Richter (Eds.), Alzheimer’s disease: A physician’s guide to practical management (pp. 147-152). Totowa, NJ: Humana Press.
Spreen, O., & Strauss, E. (1998). A compendium of neuropsychological tests: Administration, norms, and commentary (2nd ed.). New York: Oxford University Press.
Steffens, D. C., Byrum, C. E., McQuoid, D. R., Greenberg, D. L., Payne, M. E., Blitchington, T. F., MacFall, J. R., & Krishnan, K. R. R. (2000). Hippocampal volume in geriatric depression. Biological Psychiatry, 48, 301-309.
Steffens, D. C., Payne, M. E., Greenberg, D. L., Byrum, C. E., Welsh-Bohmer, K. A., Wagner, H. R., & MacFall, J. R. (2002). Hippocampal volume and incident dementia in geriatric depression. American Journal of Geriatric Psychiatry, 10, 62-71.
Stuss, D. T., Bisschop, S. M., Alexander, M. P., Levine, B., Katz, D., & Izukawa, D. (2001). The Trail Making Test: A study in focal lesion patients. Psychological Assessment, 13, 230-239.
69
Stuss, D. T., Levine, B. (2002). Adult clinical neuropsychology: Lessons from studies of the frontal lobes. Annual Review of Psychology, 53, 401-33.
Stuss, D. T, van Reekum, R., & Murphy, K. J. (2000). Differentiation of states and causes of apathy. In J. C. Borod (Ed.), The neuropsychology of emotion (pp. 340-363). New York: Oxford University Press.
Suchy, Y., Blint, A., & Osmon, D. C. (1997). Behavioral Dyscontrol Scale: Criterion and predictive validity in an inpatient rehabilitation unit population. Clinical Neuropsychologist, 11, 258-265.
Suchy, Y., & Bolger, J. (1999). The Behavioral Dyscontrol Scale as a predictor of aggression against self or others in psychogeriatric inpatients. Clinical Neuropsychologist, 13, 487-494.
Sunderland, T, Hill, J. L., Mellow, A. M., Lawlor, B. A., Gundersheimer, J., Newhouse, P. A., & Grafman, J. H. (1989). Clock drawing in Alzheimer’s disease: A novel measure of dementia severity. Journal of the American Geriatric Society, 37, 725-729.
Tabachnick, B. G., & Fidell, L. S. (2001). Using multivariate statistics (2nd ed.). Boston: Allyn and Bacon.
Tekin, S., & Cummings, J. L. (2002). Frontal-subcortical neuronal circuits and clinical neuropsychiatry: An update. Journal of Psychosomatic Research, 53, 647-654.
Thomas, P., Clement, J. P., Hazif-Thomas, C., & Leger, J. M. (2001). Family, Alzheimer’s disease and negative symptoms. International Journal of Geriatric Psychiatry, 16, 192-202.
Tornstam, L. (1989). Gero-transcendence: A reformulation of disengagement theory. Aging, 1, 55-63.
Tornstam, L. (1997). Gerotranscendence: The contemplative dimension of aging. Journal of Aging Studies, 11, 143-154.
Tornstam, L. (2000). Transcendence in later life. Generations, 33, 10-14.
van Reekum, R., Stuss, D. T., & Ostrander, L. (2005). Apathy: Why care? Journal of Neuropsychiatry and Clinical Neurosciences, 17, 7-19.
Wimo, A., & Winblad, B. (2004). The economic burden of Alzheimer’s disease and dementia. In R. W. Richter & B. Z. Richter (Eds.), Alzheimer’s disease: A physician’s guide to practical management (pp. 57-63). Totowa, NJ: Humana Press.
Yesavage, J. A., Brink, T. L., Rose, T. L., Lum, O., Huang, V., Adey, M., & Leirer, V. O. (1983). Development and validation of a geriatric depression screening scale: A preliminary report. Journal of Psychiatric Research, 17, 37-49.
70

71
Zung, W. W. K. (1965). A self-rating depression scale. Archives of General Psychiatry, 12, 63-70.