The Effectiveness of Gun Control Legislation: A ... · Section B: Purpose and Overview of Paper The...
22
The Effectiveness of Gun Control Legislation: A Comparative Study By: Charles K. Poliseno [email protected] U52113919 GEB 4970 Business Honors Program Thesis University of South Florida, College of Business Advised By: Professor Walter Andrusyszyn
Transcript of The Effectiveness of Gun Control Legislation: A ... · Section B: Purpose and Overview of Paper The...

The Effectiveness of Gun Control Legislation: A
Comparative Study
By: Charles K. Poliseno
U52113919
GEB 4970
Business Honors Program Thesis
University of South Florida, College of Business
Advised By: Professor Walter Andrusyszyn

Chapter 1: Introduction
Section A: Prologue
In the course of history in the United States, few topics have caused as much controversy
and debate as the ownership and use of firearms among the general population. A right protected
by the Second Amendment to the U.S. Constitution, which states: “A well regulated Militia,
being necessary to the security of a free State, the right of the people to keep and bear Arms,
shall not be infringed,” has come under fire, so to speak, as tragedies such as Columbine High
School and Sandy Hook Elementary School demonstrate the power and destruction these tools
can wreak when wielded by the wrong individuals.
Citizens and lawmakers alike search for ways to end the tragic loss of life that taints
evening news broadcasts night after night. However, the appropriate response to do so is a major
point of debate. Who should own firearms? How should they be tracked? What firearms are
appropriate for civilian ownership? Should civilians be allowed to own and carry weapons at
all?
This paper maintains the premise that the root cause of excessive gun violence is not the
mere presence of guns in our society; rather, the individuals who utilize them for their own ill
intentions. While the state and federal governments aim to protect us through legislation
restricting the ownership of guns en masse in some cases, there are schools of thought that
believe such legislation does not reduce such violence, and may in fact increase their likelihood.
Keeping the above premise in mind, answers to the previously stated questions can begin
to be analyzed. In order to do so, a comprehensive analysis of established data works on the
topic is necessary. This piece aims to assist in that regard.

Section B: Purpose and Overview of Paper
The first relationship that should be drawn exists between the types of gun control
regulations present in a sampling of U.S. states and the level and types of violent crimes present
in those states. Have the levels of violent crime using firearms changed and in what way? In
essence, have the strict laws pertaining gun control been effective in limiting the crime levels in
the states in question?
The second relationship that bears studying is between the sample states chosen and the
occurrence of mass violence and the types of episodes that occur in those states. By looking at
data pertaining to specific events, we can approach these terrible tragedies from an objective
stand point and evaluate if the laws in place had any impact on those involved or if any potential
policy changes could be beneficial in prevent further similar episodes of violence.
This level of understanding is paramount when it comes to addressing an issue as
important as gun control. Decision makers at all levels of the issue need as much information as
possible to make the best decision for the constituents. The decision to remove a person’s right
to arm and defend themselves should not be taken lightly, and these relationships and their
analysis is an aim to further the goal of providing that information to those who need it.

Section C: Preliminary Information
In evaluating information and data, it is always important to set a standard by which all
things will be evaluated. In this case, the idea of which states’ gun laws are the strictest is a very
subjective issue that must be given a qualitative means by which they will be judged. For this
purpose, this piece will use the Brady Scorecard to evaluate which states’ gun laws are the
strictest.
According to Matthew Hartvigsen, a writer for Deseret News, the Brady Campaign has
created a 100-point scale judging the strength of a state’s gun regulations, and has been issuing
these “scorecards” for the past five years for all 50 states. For the most recent scorecard,
published April 2013, the evaluation takes into account laws enacted by yearend 2011.
For this paper, the top five states based on the Brady Scorecard will be examined more
closely. Those states are as follows, their Brady Score listed in parenthesis (out of 100 possible
points):
1. California (81)
2. New Jersey (72)
3. Massachusetts (65)
4. New York (62)
5. Connecticut (58)
From these states, the most recent data provided by the FBI will be analyzed in comparison with
available information regarding individual incidents other available information. It should be
noted that the most recent FBI data is from the calendar year 2011, and will be provided and
cited at the end of this piece.

Regarding the information relating specific incidences in the selected states, many of the
examples compiled here are taken from a study done by Mayors Against Illegal Guns (MAIG),
published in January 2012. The study analyzes all documented mass shootings in the United
States since January 2009, thus the data compiled by MAIG is synchronous with the data
retrieved from the FBI. In their report, MAIG utilizes the FBI’s definition of a mass shooting:
“For purposes of tracking crime data, the FBI defines ‘mass shooting’ as any incident where at
least four people were murdered with a gun,” (Mayors, pg. 1, 2013). The study also breaks down
incidences in terms of weapon and ammunition type and a small profile of the shooter and the
context of the incident, when possible.
Also relevant in the topic of preliminary information are the aggregate, or “big picture,”
ideas and statistics the MAIG study brings to light. The findings in the report show that in terms
of all gun violence in the United States, “less than one percent of gun murder victims recorded
by the FBI in 2010 were killed in incidents with four or more victims,” (Mayors, pg. 1, 2013).
The study also takes into account issues highly publicized after the tragic events in
Aurora, CO and Newtown, CT, in terms of the use of assault weapons and the mental health of
the shooters in question. Regarding assault weapons and “high-capacity magazines,” they “were
used in at least 12 of the incidents (28%)…resulted in an average of 15.6 total people shot –
123% more people shot than in other incidents (7.0),” (Mayors, pg. 1, 2013).
In terms of mental health of the shooters, the MAIG study “did not find evidence that any
of the shooters were prohibited from possessing guns by federal law because they had been
adjudicated mentally ill or involuntarily committed for treatment,” (Mayors, pg. 1, 2013). The
study notes that 4 of the total 43 episodes involved shooters about whom “concerns about the
mental health of the shooter had been brought to the attention of a medical practitioner, school

official, or legal authority prior to the shooting.” Added as a footnote in the study, four more
incidents involved shooters whose “possible mental health problems were known to friends or
family but were not reported…until after the shooting,” (Mayors, pg. 1, 2013).
Section D: Breaking Down the States by the Numbers
Subsection 1: California
Beginning with the state of California, the state ranked highest by the Brady Campaign
in terms of strength of their gun control regulation, we find that number of total murders in the
state outranks the number of total murders in all other states, year ending 2011. In that year,
California reported a total of 1,790 murders of all types representing approximately 14% of the
United States’ total murders (12,664). Not surprisingly, then, California also experienced the
most firearms related murders in the same year, 1,220, accounting for approximately 68% of the
states total murder count and a roughly proportional 14% of total firearms related murders
nationwide (8,583).
Of course, these numbers should be taken with a small grain of salt, considering the state
of California does represent the highest state population in the country, 37,571,959 residents
according to the 2010 census. Thus, the data is broken down into ratios based on a per 100,000
resident scale. By nature, this relationship does not perfectly account for state population
differences, but for the intents and purposes of this piece, it serves its purpose.
Keeping that in mind, we see that California experienced firearm related murders at a rate
of 3.25 murders/100,000 residents. This number, unlike the raw data above, does not rank at the
top of the list nationwide. In fact this number is about average, as the District of Columbia
experienced a firearm murder rate of 12.46 murders/100,000 residents in the same year. In the

same vein as the previous statistics, when we expand our view from just murders and look at
other crimes, namely assault and robbery, involving firearms, the state of California has rates of
45.39 and 42.97/100,000 residents respectively, both also near the mean value of their respective
categories.
It is also telling to note that in the MAIG study, five of the 43 mass shooting incidents
occurred in the state of California. This is the most by any state represented in the piece.
While all five incidences are significant and tragic by nature, two stand out as particularly
telling about the legislative power in preventing these episodes. The first involves a 43 year old
former student of a “Korean Christian college.” He was expelled from the school for
“disciplinary problems.” He returned to the college, where he proceeded to kill 7 people with a
legally purchased and owned handgun. The point to be taken from this particular tragedy is that
California, the top state in terms of gun control regulation, is one of 22 states in the US strictly
banning the carrying of weapons (including concealed carry) on college campuses, according to
a National Conference of State Legislatures article (Mayors, 2013).
The second incident involves an ex-husband finding and murdering his ex-wife and seven
others at a hair salon in 2011. The shooter carried three legally purchased and registered
handguns. The relevant legislative point to be made here involves his mental state. When
embroiled in a custody battle, “his ex-wife had filed court papers claiming that he was mentally
unstable and had threatened to kill himself or someone else at least once,” (Mayors, pg. 5, 2013).
The shooter had also had a restraining order placed on him, restricting him from owning
firearms; however, that restriction expired three years before this incident (Mayors, 2013).

Subsection 2: New Jersey
Ranking second on the Brady Campaign Scorecard, the state of New Jersey, in terms of
total population size (8,759,125), is about 23% of the size of the state of California. That said,
the state of New Jersey saw 379 firearm-related murders in the year 2011, up 110 (9%) from the
year 2010.
Returning to the firearms-related murders per 100,000 residents statistic, New Jersey’s
rate of 3.07 firearms murders/100,000 is comparable to California’s 3.25. However, New
Jersey’s firearms murders as a percentage of all murders is 71%, beating out California’s 68%,
though the difference in population and sample size should be noted here.
In terms of other crimes committed using firearms, New Jersey saw 49.87 robberies and
26.94 assaults per 100,000 residents. While the assaults using a firearm pales in comparison to
California, the robberies per 100,000 residents actually exceeds California’s.
The state of New Jersey is not represented in the MAIG study, as the state did not
document a mass shooting in years the study encompassed.
Subsection 3: Massachusetts
The state of Massachusetts ranks third on the Brady Campaign Scorecard, though its
proportional statistics nearly mirror those of California. Massachusetts saw 183 total murders in
2011, 122 of those perpetrated by people using firearms. This equates to approximately 67% of
all murders in the state, on par with the 68% of all murders seen in California. In terms of year
to year progression, Massachusetts only saw four additional firearms related murders from 2010
to 2011, a 3% increase. In terms of other crimes committed with firearms, Massachusetts

experienced 27.84 firearms related robberies and 33.19 firearms related assaults per 100,000
residents in 2011.
Looking at the MAIG study, Massachusetts is represented once. In a drug related
shooting in Boston, two shooters killed four and wounded one using two separate handguns. The
legislative point to be made here regards the circumstances surrounding the shooting. These
criminals had intentions of breaking the law prior to committing the shooting. The drug
infractions they were already involved with gives us an idea of their stance on the legality of
their actions. It can be argued from this incident and many others like it that those who intend to
break the law will do so, regardless of legislation in place to prevent it, even in the third best
state in terms of gun regulation (Mayors, 2013).
Subsection 4: New York
In terms of publicity regarding its gun policy, few states live up to the standard set by the
state of New York. Ranking fourth on the Brady Campaign Scorecard, New York has been in
the news recently regarding the legality of its “Stop-And-Frisk” laws and its benefits. New York
experienced 774 reported murders of all types in 2011, 445 of those (57%) were carried out
using firearms. The 57% proportional rate is the lowest among all five states being compared in
this paper. On the other side of the spectrum, the state of New York also boasts the highest
firearm murder rate per 100,000 residents, at a ratio of 4.12. Other crimes committed with the
use of firearms per 100,000 residents are represented at or below average rates in New York, as
23.28 robberies/100,000 and 20.06 assaults/100,000 are carried out using firearms.
Referring back to the MAIG study, New York has two mass shooting episodes to its
name. The first is interesting as it relates in terms of criminal intent to the incident in Boston.

The 24 year old shooter opened fire outside a bar, killing four and wounding four. He had not
been prohibited to own a firearm; however, he was arrested twice in the two years leading up to
the shooting: once on felony drug charges and once for carrying a loaded rifle in his vehicle. He
was not found guilty on either charge, though had he been, he would have been prohibited from
owning firearms. Once again, this makes a case for the argument that it’s not the weapon that
makes a difference, but rather the mindset of the person carrying it, which will be discussed in
further detail later (Mayors, 2013).
Along the same line of thought, the second incident involved a shooter killing 14 people
outside a Binghamton civic association. He carried out the act using two handguns and fired 98
rounds. While there was no circumstance prohibiting him from owning firearms and the two he
had were properly registered, the issue here lies in the shooter’s mental state. People who knew
him claimed that he exhibited no outward signs of mental instability; however, a letter he wrote
to the local newspaper, which was received shortly after the shooting, painted him as suffering
from paranoia and an unstable mental condition (Mayors, 2013).
Subsection 5: Connecticut
The final state being analyzed in this paper and the fifth on the Brady Campaign
Scorecard is Connecticut, the state that unfortunately has been in the most headlines in recent
memory due to gun violence after the tragedy at Sandy Hook Elementary School.
Looking at the state as a whole, Connecticut saw 128 total murders in 2011, 94 (72%) of
those carried out by use of firearms. That percentage is highest of all states in this study. Year
to year, Connecticut had a menial drop in firearms murders, 3 (3%), from 2010 to 2011. 2.71

firearms murders/100,000 residents occurred, 2nd
most in this ranking. Other crimes using
firearms saw rates of 34.85 robberies/100,000 residents and 20.06 assaults/100,000 residents.
In terms of mass shootings listed in the MAIG study, Connecticut had two incidents,
headlined by the Sandy Hook Elementary School tragedy. The shooter in this case embodies the
reasoning behind the argument that it is not the existence or presence of the weapons that causes
these incidents; rather, it is the person who chooses to carry it out. The shooter would have been
restricted from owning the handguns he used, as he was under the age of 21, while he would
have been allowed to own the long rifle. All of the weapons were legally registered to his
mother, who he murdered prior to the mass incident. His mental state was questioned, even
leading up to the tragedy. Clearly, the shooter’s troubled state and intent to carry out his actions
were the source of this episode. The presence of the guns or his access to them did not change
the way he chose to act; rather, it was his own volition that spawned this terrible event (Mayors,
2013).

Section E: Critical Analysis
Subsection 1: Opponent vs. Proponent
In any debate over legislative opinions and differences, the battle lines are clearly drawn
and emotion runs high on either side. Gun control not only adheres to this trend, but arguably
leads the charge in terms of heightened emotional ties to the issue due to the direct implications
on the physical value of human life determinant upon its outcome.
For this reason, it is important to approach this issue from a third party, objective stance,
removing as much emotion from the equation and doing what is justified by the statistics.
However, even judging the strength and validity of said statistics is difficult, if not impossible to
do entirely as the people compiling and publishing those statistics have agendas and motives to
which they are emotionally attached.
Two recent studies clearly portray the difference between proponent and opponent views
and statistical offerings. Both studies certainly have their academic and policy based merits;
however, the pro-gun control vs. anti-gun control theme in both pieces is evident.
The first is a study published in the American Journal of Public Health in November
2013. The article, entitled “The Relationship Between Gun Ownership and Firearm Homicide
Rates in the United States, 1981–2010,” claims that an increase in household gun ownership in
US states leads to a direct increase in risk of firearms related homicide, citing empirical evidence
that shows that for every 1% increase in gun ownership in US states, there is a 0.9% increase in
the firearm homicide rate. I came across this study in a Huffington Post article, a typically left-
leaning publication. The authors of the study, Drs. Michael Siegel and Charles King III and
Professor Craig S. Ross, MBA, all of Boston University, note in their conclusions that while the
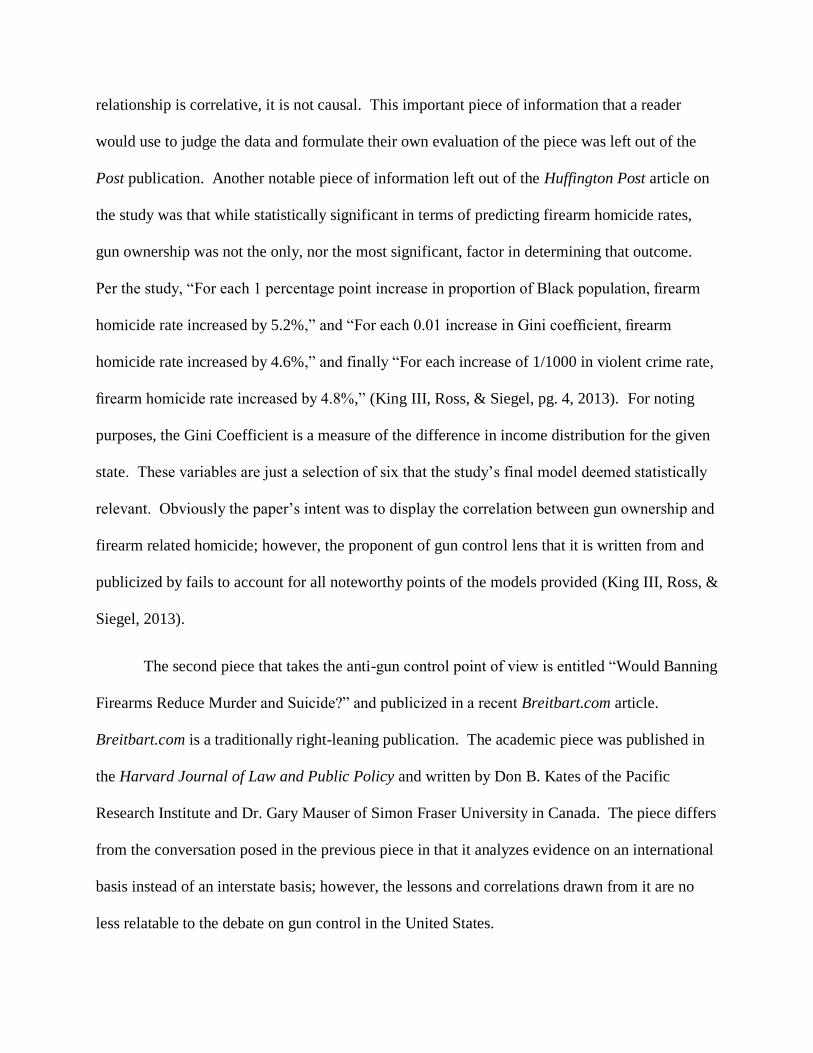
relationship is correlative, it is not causal. This important piece of information that a reader
would use to judge the data and formulate their own evaluation of the piece was left out of the
Post publication. Another notable piece of information left out of the Huffington Post article on
the study was that while statistically significant in terms of predicting firearm homicide rates,
gun ownership was not the only, nor the most significant, factor in determining that outcome.
Per the study, “For each 1 percentage point increase in proportion of Black population, firearm
homicide rate increased by 5.2%,” and “For each 0.01 increase in Gini coefficient, firearm
homicide rate increased by 4.6%,” and finally “For each increase of 1/1000 in violent crime rate,
firearm homicide rate increased by 4.8%,” (King III, Ross, & Siegel, pg. 4, 2013). For noting
purposes, the Gini Coefficient is a measure of the difference in income distribution for the given
state. These variables are just a selection of six that the study’s final model deemed statistically
relevant. Obviously the paper’s intent was to display the correlation between gun ownership and
firearm related homicide; however, the proponent of gun control lens that it is written from and
publicized by fails to account for all noteworthy points of the models provided (King III, Ross, &
Siegel, 2013).
The second piece that takes the anti-gun control point of view is entitled “Would Banning
Firearms Reduce Murder and Suicide?” and publicized in a recent Breitbart.com article.
Breitbart.com is a traditionally right-leaning publication. The academic piece was published in
the Harvard Journal of Law and Public Policy and written by Don B. Kates of the Pacific
Research Institute and Dr. Gary Mauser of Simon Fraser University in Canada. The piece differs
from the conversation posed in the previous piece in that it analyzes evidence on an international
basis instead of an interstate basis; however, the lessons and correlations drawn from it are no
less relatable to the debate on gun control in the United States.

Right off the bat in this Harvard publication, the writers directly challenge through their
own research the validity of the claims of the previous study:
“Many different data sets from various kinds of sources are summarized as follows by the
leading text: [T]here is no consistent significant positive association between gun ownership lev
els and violence rates: across (1) time within the United States, (2) U.S. cities, (3) counties withi
n Illinois, (4) country‐sized areas like England, U.S. states, (5) regions of the United States, (6)
nations, or (7) population subgroups…” (Kates & Mauser, pg. 653, 2013).
The Breitbart article does a good job of pulling some relevant pieces of data from the
piece that further this position. The article highlights the murder rates of selected countries
(following the same per 100,000 residents criteria found in the FBI data used earlier in this
document) and their relationship to their respective gun ownership rates. For instance, one of the
most telling correlations of this type is exemplified by Russia. For a country whose law of the
land is a total restriction on ownership of handguns, their murder rate per 100,000 residents is
30.6, compared to the US’s own rate of 7.8. Looking at Western Europe, the article highlights
Norway, the country that, according to the scholarly piece, “has far and away Western Europe's
highest household gun ownership rate (32%), but also its lowest murder rate,” (Hawkins, pg. 1,
2013). This is not to say that countries such as Norway are free of their tragedies or acts of
violence; however, these actions are more anomalous than in other countries and the high rate of
gun ownership can be partially thanked for that.
By looking at these two opposing studies, which both analyze similar statistics by similar
means but yet still draw opposing conclusions, we begin to see that even in the realm of
academia, the opponent vs. proponent argument still stands to sway public opinion.

Subsection 2: Who’s to Blame?
From a statistical standpoint, it is clear that the opponent vs. proponent paradigm stands
to sway public opinion using facts, figures, and reasoning. From these educated platforms,
people have drawn proverbial battle lines from which they debate the necessity for regulations on
the possession of firearms.
However, it is not from these educated platforms that the most fundamental divide exists
in this debate. Rather it is simply from the observation of each incident as it happens and who,
or in this case “what,” is to blame for the terrible tragedies that headline news publications and
broadcasts on what seems like a daily basis.
The divide is simple to understand, yet very difficult to break down due to the emotional
nature of the subject, as was mentioned earlier. The two sides of the debate take the positions of
either blaming the individual who wields the firearm for his actions or blaming the presence and
mere existence of the gun itself for making it possible for the violence to unfold.
Looking at the viewpoint of those who believe the gun itself is to blame, their reasoning
is easily understood: if the shooter had no access to the gun in the first place, the violence never
would have occurred. The argument here lies in the “out of sight, out of mind” premise that if
the individuals responsible for these tragedies never had the means to carry them out, then the
numbers and statistics mentioned in this paper would plummet.

In a utopian society, this argument would stand to reason. If the mere removal of a
means to commit crime would make it disappear entirely, our prisons would be empty, as it
would be impossible to break the law. Unfortunately, this is not the case in reality.
To provide a parallel example, look at the presence and regulations on illegal drugs and
controlled substances. Materials such as heroin, methamphetamines, cocaine, and non-
prescription marijuana are all strictly banned in the United States. By the logic presented by
those claiming that the simple banning of an unwanted agent in a given market, we should see a
huge decline in the number of arrests made and victims of overdose from these terrible drugs.
However, this is not the case.
To bring the argument back to the firearm arena, look back at the statistics regarding the
percentage of all murders carried out by criminals using firearms:
California: 68%
New Jersey: 71%
Massachusetts: 67%
New York: 57%
Connecticut: 73%
While these numbers are frightening and staggering and certainly appear to devalue the
argument against gun control, keep in mind that for the 57% of murders perpetrated by firearm
wielding criminals in New York, for instance, there is another 43% of murders being carried out
using knives, blunt objects, or even the criminals’ bare hands.
To look at this fact from an economic standpoint, what would the banning of firearm
ownership do to the percentages of murders carried out by non-firearm using criminals? It
stands to reason that these figures would increase. The supply of a preferred means of action

would dissipate (assuming there is no existence of a black market, which is a bold assumption to
say the least); however, the demand for their actions, in their mind, would still exist, driving
them to other means of carrying out their deeds.
Individuals who are intent on carrying out their actions to achieve their desired results
will go beyond the boundaries of the law to ensure the success of their actions. This is why such
illegal markets for drugs and firearms exist, and why murders and violence occur in the first
place. It is not due to the presence of an agent or legislation deeming it illegal; rather, it is due to
the state of mind and the character of those who choose to act in such undesirable ways.
Section F: Conclusions
Bearing in mind the statistics posed and arguments given from both sides, this paper
maintains the principle that it is not the existence of guns or their presence in society that dictates
the violence that they carry out; rather, it is the quality of the character of the individual who
wields them that is so determinant. Due to this principle and the evidence given, it is not of any
significant benefit to ban or restrict the ownership of firearms in the United States from law
abiding, mentally sound individuals.
Even in the top five states, according to the Brady Campaign Scorecard, where gun
control legislation is deemed strongest by the organization, firearms related murders account for
57-73% of all murders, calling into question the effectiveness of those regulations in the first
place. This paper also maintains that a restriction on the ownership of firearms would not
decrease the total number of violent acts or murders in the populace; rather it would simply shift
the percentages to a greater proportion of non-firearm related murders and illegal trading and
movement of the firearms in question.

These policy issues are difficult to rule over and make decisions on. The emotional ties
to both sides are palpable and the psychological wounds left by the criminals who carry out these
terrible tragedies stay fresh, regardless of the time that passes. However, it is not feasible to ban
a means of protection and defense for all due to the pernicious actions carried out by so few.

Works Cited
"Bill of Rights Transcript Text." Bill of Rights Transcript Text. US National Archives and
Records Administration, n.d. Web. 27 Nov. 2013.
"Brady Campaign to Prevent Gun Violence." Brady Campaign to Prevent Gun Violence. N.p.,
n.d. Web. 27 Nov. 2013.
"Criminals' Black Market in Guns Detailed." The New York Times. The New York Times, 21
Dec. 1999. Web. 27 Nov. 2013.
Goyette, Braden. "Gun Violence Study Links State Levels Of Gun Ownership And Homicide."
The Huffington Post. TheHuffingtonPost.com, 13 Sept. 2013. Web. 27 Nov. 2013.
"Guns on Campus: Overview." Guns on Campus: Overview. National Conference of State
Legislatures, July 2013. Web. 27 Nov. 2013.
Hartvigsen, Matthew. "10 States with the Strictest Gun Laws." DeseretNews.com. Deseret News,
17 Apr. 2013. Web. 27 Nov. 2013.
Hawkins, AWR. "Breitbart.com." Breitbart News Network. Breitbart.com, 28 Aug. 2013. Web.
27 Nov. 2013.

Kates, Don B., and Gary Mauser. WOULD BANNING FIREARMS REDUCE MURDER AND
SUICIDE? A REVIEW OF INTERNATIONAL AND SOME DOMESTIC EVIDENCE.
Harvard Journal of Law & Public Policy. Harvard Law School, n.d. Web. Oct.-Nov.
2013. <http://www.law.harvard.edu/students/orgs/jlpp/Vol30_No2_
KatesMauseronline.pdf>.
Lott, Jr. , J. R. (1998). More Guns Less Crime: Understanding Crime and Gun-Control Laws. (2
ed.). Chicago, IL: The University of Chicago Press.
Siegel, Michael; Ross, Craig S.; and King III, Charles. The Relationship Between Gun
Ownership and Firearm Homicide Rates in the United States, 1981–2010. American
Journal of Public Health: November 2013, Vol. 103, No. 11, pp. 2098-2105. doi:
10.2105/ AJPH.2013.301409. Retrieved from
<http://ajph.aphapublications.org/doi/pdf/10.2105/AJPH.2013.301409>.
Table data provided in the appendix below retrieved from the following citation, data provided
by the Federal Bureau of Investigations (FBI).
Rogers, Simon. "Gun Crime Statistics by US State: Latest Data." The Guardian.
TheGuardian.com, 17 Dec. 2012. Web. 24 Nov. 2013.
<http://www.theguardian.com/news/datablog/2011/jan/10/gun-crime-us-state>.

Murder
by State, Types of Weapons, 2011
State State code
Total murders
Total firearms murders,
2011
Total firearms murders,
2010
% change, 2010-11
Firearms murders as % of all murders
Firearms murders per 100,000 population
Firearms robberies per 100,000 pop)
Firearms assaults per 100,000 population
United States United States 12,664 8,583 8,874 -3 68 2.75 39.25 43.77
Alaska AK 29 16 19 -16 55 2.24 18.19 80.47
Arizona AZ 339 222 232 -4 65 3.53 50.24 57.36
Arkansas AR 153 110 93 18 72 4.39 45.45 100.56
California CA 1,790 1,220 1,257 -3 68 3.25 42.97 45.39
Colorado CO 147 73 65 12 50 1.51 25.74 45.72
Connecticut CT 128 94 97 -3 73 2.71 34.85 20.06
Delaware DE 41 28 38 -26 68 3.09 69.67 81.36
District of Columbia DC 108 77 99 -22 71 12.46 242.56 87.70
Georgia GA 522 370 376 -2 71 3.93 72.48 58.64
Hawaii HI 7 1 7 -86 14 0.07
Idaho ID 32 17 12 42 53 1.14 3.41 23.43
Illinois IL 452 377 364 4 83 2.93 2.26 5.26
Indiana IN 284 183 142 29 64 3.29 53.14 29.91
Iowa IA 44 19 21 -10 43 0.71 7.31 21.95
Kansas KS 110 73 63 16 66 2.78 24.86 76.87
Kentucky KY 150 100 116 -14 67 2.36 39.77 25.14
Louisiana LA 485 402 351 15 83 10.16 63.48 99.51
Maine ME 25 12 11 9 48 0.90 5.80 4.52
Maryland MD 398 272 293 -7 68 4.70 79.71 41.18
Massachusetts MA 183 122 118 3 67 2.02 27.84 33.19

Michigan MI 613 450 413 9 73 5.06 55.95 86.41
Minnesota MN 70 43 53 -19 61 0.82 20.11 22.52
Mississippi MS 187 138 120 15 74 7.46 60.07 51.69
Missouri MO 364 276 321 -14 76 4.64 52.47 88.90
Montana MT 18 7 12 -42 39 0.76 3.78 29.03
Nebraska NE 65 42 32 31 65 2.50 25.44 33.84
Nevada NV 129 75 84 -11 58 3.07 69.77 53.30
New Hampshire NH 16 6 5 20 38 0.53 9.83 15.14
New Jersey NJ 379 269 246 9 71 3.07 49.87 26.94
New Mexico NM 121 60 67 -10 50 2.98 34.96 87.26
New York NY 774 445 517 -14 57 4.12 23.28 20.06
North Carolina NC 489 335 286 17 69 3.87 48.72 67.44
North Dakota ND 12 6 4 50 50 0.93 4.79 4.79
Ohio OH 488 344 310 11 70 3.54 65.45 37.97
Oklahoma OK 204 131 111 18 64 3.64 42.81 58.07
Oregon OR 77 40 36 11 52 1.05 14.57 17.55
Pennsylvania PA 636 470 457 3 74 3.97 54.69 39.44
Rhode Island RI 14 5 16 -69 36 0.57 12.71 17.86
South Carolina SC 319 223 207 8 70 5.41 52.93 127.88
South Dakota SD 15 5 8 -38 33 0.68 4.91 20.60
Tennessee TN 373 244 219 11 65 3.92 72.88 137.58
Texas TX 1,089 699 805 -13 64 2.91 50.21 58.28
Utah UT 51 26 22 18 51 0.97 10.98 21.32
Vermont VT 8 4 2 100 50 0.75 4.32 12.60
Virginia VA 303 208 250 -17 69 2.58 35.40 21.35
Washington WA 161 79 93 -15 49 1.25 20.72 28.44
West Virginia WV 74 43 27 59 58 2.87 16.08 52.04
Wisconsin WI 135 80 97 -18 59 1.47 43.86 27.40
Wyoming WY 15 11 5 120 73 2.01 3.65 20.44