The Effect os f Jo Insecuritb oyn Employe Safete Outcomesy ... · Although the effects of this...
21
Journal of Occupational Health Psychology 2001, Vol. 6, No. 2, 139-159 Copyright 2001 by the Educational Publishing Foundation 1076-8998/01/$5.00 DOI: 10.1037//1076-8998.6.2.139 The Effects of Job Insecurity on Employee Safety Outcomes: Cross-Sectional and Longitudinal Explorations Tahira M. Probst and Ty L. Brubaker Washington State University Vancouver Job insecurity research has focused primarily on attitudinal (e.g., job satisfaction), behavioral (e.g., employee turnover), and health outcomes. Moreover, research in the area of workplace safety has largely focused on ergonomic factors and personnel selection and training as primary antecedents of safety. Two cross-sectional structural equational modeling analyses and 1 longi- tudinal regression analysis of 237 food-processing plant employees unite these 2 disparate areas of research by exploring the relatively uncharted relationship between job insecurity and safety outcomes. Results indicate that employees who report high perceptions of job insecurity exhibit decreased safety motivation and compliance, which in turn are related to higher levels of workplace injuries and accidents. The specter of losing one's job as a result of corporate restructuring, mergers and acquisitions, or organizational downsizing looms in the foreground for many of today's employees. Fortune 500 compa- nies alone have reduced their total workforce from an aggregate 14.1 million employees to 11.6 million between 1983 and 1993, with approximately 500,000 U.S. employees facing job loss each year as a result of these transitions (Simons, 1998). These are im- pressive numbers; however, they do not even begin to capture the number of employees who might be con- cerned about losing their own jobs or the effect job insecurity can have on a range of important individ- ual and organizational outcomes (Cameron, Freeman, & Mishra, 1991) Studies have shown that job insecurity among em- ployees leads to job dissatisfaction (Ashford, Lee, & Bobko, 1989; Davy, Kinicki, & Sheck, 1991), an increase in negative physical health outcomes (Dooley, Rook, & Catalano, 1987; Kuhnert, Sims, & Lahey, 1989; Roskies & Louis-Guerin, 1990), and higher reports of psychological distress (Dekker & Schaufeli, 1995; Probst, 2000). In addition, employ- Tahira M. Probst and Ty L. Brubaker, Department of Psychology, Washington State University Vancouver. Portions of this article were presented at the 2000 West- ern Psychological Association conference in Portland, Or- egon, and the 2000 Annual Conference of the Society for Industrial/Organizational Psychology in New Orleans, Louisiana. Correspondence concerning this article should be ad- dressed to Tahira M. Probst, Washington State University Vancouver, 14204 NE Salmon Creek Avenue, Vancouver, Washington 98686. Electronic mail may be sent to [email protected]. ees with perceptions of low job security are more likely to engage in work withdrawal behaviors (Probst, 1998/1999) and report lower organizational commitment (Ashford et al., 1989; Davy et al., 1991), which often leads to employee turnover (Ashford et al., 1989; Davy et al., 1991). Although the effects of this rising job insecurity on employee attitudes, behaviors, and physical and men- tal health outcomes have been well documented, re- search on the implications of job insecurity for em- ployee safety is virtually nonexistent. However, in a review of literature, Landisberger, Cahill, and Schnall (1999) reported that studies examining the impact of lean production on employee safety found detrimental effects on employee health and injury rates in a variety of industries, including automobile manufacturing, telecommunications, and health care. Although these studies did not address job insecurity in particular, it is accepted that one of the hallmarks of lean production is the implementation of organi- zational downsizing (American Management Associ- ation, 1997; Landisberger et al., 1999). There is also a voluminous literature on anteced- ents of worker safety, addressing the impact of such factors as ergonomic conditions (Melamed, Luz, Na- jenson, Jucha, & Green, 1989); employee personal characteristics such as gender, education, and person- ality (e.g., Ferguson, McNally, & Both, 1984; Han- sen, 1989; Leigh, 1986; Leveson, Hirschfeld, & Hirschfeld, 1980); and organizational characteristics such as safety climate (e.g., Brown & Holmes, 1986; Dedobbeleer & Beland, 1991; Zohar, 1980). Yet, to date, there has been no research considering em- ployee job insecurity as a predictor of worker safety. The purpose of this study was to unite these dis- 139
-
Upload
truongminh -
Category
Documents
-
view
213 -
download
0
Transcript of The Effect os f Jo Insecuritb oyn Employe Safete Outcomesy ... · Although the effects of this...

Journal of Occupational Health Psychology2001, Vol. 6, No. 2, 139-159
Copyright 2001 by the Educational Publishing Foundation1076-8998/01/$5.00 DOI: 10.1037//1076-8998.6.2.139
The Effects of Job Insecurity on Employee Safety Outcomes:Cross-Sectional and Longitudinal Explorations
Tahira M. Probst and Ty L. BrubakerWashington State University Vancouver
Job insecurity research has focused primarily on attitudinal (e.g., job satisfaction), behavioral(e.g., employee turnover), and health outcomes. Moreover, research in the area of workplacesafety has largely focused on ergonomic factors and personnel selection and training as primaryantecedents of safety. Two cross-sectional structural equational modeling analyses and 1 longi-tudinal regression analysis of 237 food-processing plant employees unite these 2 disparate areasof research by exploring the relatively uncharted relationship between job insecurity and safetyoutcomes. Results indicate that employees who report high perceptions of job insecurity exhibitdecreased safety motivation and compliance, which in turn are related to higher levels ofworkplace injuries and accidents.
The specter of losing one's job as a result ofcorporate restructuring, mergers and acquisitions, ororganizational downsizing looms in the foregroundfor many of today's employees. Fortune 500 compa-nies alone have reduced their total workforce from anaggregate 14.1 million employees to 11.6 millionbetween 1983 and 1993, with approximately 500,000U.S. employees facing job loss each year as a resultof these transitions (Simons, 1998). These are im-pressive numbers; however, they do not even begin tocapture the number of employees who might be con-cerned about losing their own jobs or the effect jobinsecurity can have on a range of important individ-ual and organizational outcomes (Cameron, Freeman,& Mishra, 1991)
Studies have shown that job insecurity among em-ployees leads to job dissatisfaction (Ashford, Lee, &Bobko, 1989; Davy, Kinicki, & Sheck, 1991), anincrease in negative physical health outcomes(Dooley, Rook, & Catalano, 1987; Kuhnert, Sims, &Lahey, 1989; Roskies & Louis-Guerin, 1990), andhigher reports of psychological distress (Dekker &Schaufeli, 1995; Probst, 2000). In addition, employ-
Tahira M. Probst and Ty L. Brubaker, Department ofPsychology, Washington State University Vancouver.
Portions of this article were presented at the 2000 West-ern Psychological Association conference in Portland, Or-egon, and the 2000 Annual Conference of the Society forIndustrial/Organizational Psychology in New Orleans,Louisiana.
Correspondence concerning this article should be ad-dressed to Tahira M. Probst, Washington State UniversityVancouver, 14204 NE Salmon Creek Avenue, Vancouver,Washington 98686. Electronic mail may be sent [email protected].
ees with perceptions of low job security are morelikely to engage in work withdrawal behaviors(Probst, 1998/1999) and report lower organizationalcommitment (Ashford et al., 1989; Davy et al., 1991),which often leads to employee turnover (Ashford etal., 1989; Davy et al., 1991).
Although the effects of this rising job insecurity onemployee attitudes, behaviors, and physical and men-tal health outcomes have been well documented, re-search on the implications of job insecurity for em-ployee safety is virtually nonexistent. However, in areview of literature, Landisberger, Cahill, andSchnall (1999) reported that studies examining theimpact of lean production on employee safety founddetrimental effects on employee health and injuryrates in a variety of industries, including automobilemanufacturing, telecommunications, and health care.Although these studies did not address job insecurityin particular, it is accepted that one of the hallmarksof lean production is the implementation of organi-zational downsizing (American Management Associ-ation, 1997; Landisberger et al., 1999).
There is also a voluminous literature on anteced-ents of worker safety, addressing the impact of suchfactors as ergonomic conditions (Melamed, Luz, Na-jenson, Jucha, & Green, 1989); employee personalcharacteristics such as gender, education, and person-ality (e.g., Ferguson, McNally, & Both, 1984; Han-sen, 1989; Leigh, 1986; Leveson, Hirschfeld, &Hirschfeld, 1980); and organizational characteristicssuch as safety climate (e.g., Brown & Holmes, 1986;Dedobbeleer & Beland, 1991; Zohar, 1980). Yet, todate, there has been no research considering em-ployee job insecurity as a predictor of worker safety.
The purpose of this study was to unite these dis-
139
140 PROBST AND BRUBAKER
parate areas of research by assessing the effects ofjob insecurity on variables known to be related toworkplace accidents and injuries. In particular, thisstudy assessed attitudinal outcomes such as job sat-isfaction, employee knowledge regarding appropriatesafety behaviors, and employee motivation to complywith organizational safety policies, in conjunctionwith self-reported safety violations, on-the-job acci-dents, and workplace injuries.
Development of a Model Addressing JobInsecurity and Safety
The following sections describe the developmentof a model (see Figure 1) illustrating the possiblerelationships among job insecurity, safety motiva-tion, knowledge, compliance, and job-related injuriesand accidents. From this model, several testable hy-potheses were developed.
Job Insecurity and Job Satisfaction
Dunbar (1993) found that negative affect, anxiety,and depression were all negatively related to the useof personal protective equipment. Therefore, one ex-planation for the proposed link between job insecu-rity and safety outcomes is that job insecurity causesnegative job attitudes in the form of anxiety regard-ing job security (i.e., job security dissatisfaction) andreduced satisfaction with other facets of the job (e.g.,pay and promotion opportunities). These, in turn,may result in a reduction in adherence to safetypolicies. In fact, decreased perceptions of job securityhave consistently been found to be related to de-creased job satisfaction in many studies (e.g., Ash-ford et al., 1989; Davy et al., 1991; Probst, 2000). Jobsatisfaction has many facets (e.g., satisfaction withwork, pay, promotion opportunities, supervision, andcoworkers; Smith, Kendall, & Hulin, 1969). In addi-tion, more recent work has found that a sixth facet ofjob satisfaction (Probst, 1998/1999), namely, job se-curity satisfaction, is also important to consider intoday's work environment. On the basis of this work,the first part of the model postulates the following:
Hypothesis 1: There will be a negative relationshipbetween job insecurity and job satisfaction.
Recent research suggests that many of the effectsof job insecurity on individual and organizationaloutcomes are mediated by employee levels of jobsatisfaction. For example, in a path analysis modelingthe effects of being a layoff survivor, Davy et al.(1991) found that although job security positively
affected job satisfaction, it did not directly influenceemployees' behavioral intent to withdraw or organi-zational commitment. Rather, the relationship be-tween these variables and job security existed onlythrough the intervening variable of job satisfaction.In other words, when job attitudes were held con-stant, there was no relationship between job insecu-rity and turnover intentions or organizational com-mitment. On the basis of this and other similarfindings (e.g., Probst, 1998/1999), job insecurity isnot expected to directly influence safety motivationor knowledge levels. Rather, it is predicted that jobinsecurity must lead to job dissatisfaction for nega-tive outcomes to occur. Therefore,
Hypothesis 2: Job satisfaction will mediate the rela-tionship between job insecurity and safety motivationand safety knowledge.
Job Satisfaction and Safety Knowledge andMotivation
Research suggests that safety knowledge andsafety motivation are important factors in predictingsafety compliance (Hofmann, Jacobs, & Landy,1995; Neal, Griffin, & Hart, 2000). Safety motivationhas been defined as an employee's "motivation toperform a job in a safe manner" (Hofmann et al.,1995, p. 133) and the motivation to perform safetybehaviors (Neal et al., 2000). It is important to note,however, that motivation is sometimes defined ex-trinsically and other times intrinsically. Using a con-tingency approach, Hofmann et al. predicted thatemployees would be less motivated to comply withsafety policies to the extent that they are not re-warded for performing in a safe manner. In thisstudy, we similarly define safety motivation as anemployee's degree of incentive to adhere to theirorganization's safety regulations, as they understandthem to be. In other words, we were interested inextrinsic safety motivation.
Safety motivation was operationalized using anexpectancy-valence motivational approach. Accord-ing to valence-instrumentality-expectancy theory(Vroom, 1964), individuals will expend effort onactivities that lead to desired rewards. Therefore, ifan individual is rewarded for adhering to safety pol-icies, one would expect that person's motivationalforce to be high for those behaviors. If the rewardstructure is such that individuals are "rewarded" fornoncompliance, then one would expect their motiva-tional force to comply with safety policies to be low(Hofmann et al., 1995).

JOB INSECURITY AND EMPLOYEE SAFETY 141
S•3

142 PROBST AND BRUBAKER
It is important to note that safety motivation is notnecessarily inclusive of safety knowledge or compli-ance. Safety knowledge is characterized by an em-ployee's understanding of safe operating proceduresand adequate safety training and instruction (Hof-mann et al., 1995). An employee who is knowledge-able of safety rules may not always be motivated tocomply. Likewise, an employee who does not under-stand all of the safety rules may be motivated, but thismotivation may or may not translate into actual com-pliance because of the lack of proper knowledge orskill. Therefore, it is important to measure these twoconstructs separately.
Both safety motivation and safety knowledge areexpected to be adversely affected when an individualperceives that his or her job security is threatened andis dissatisfied by that perception. In particular, jobdissatisfaction is predicted to be related to lowerlevels of safety knowledge and safety motivation.This prediction is generated from a cognitive re-sources framework (Kanfer & Ackerman, 1989) andfrom Eysenck and Calvo's (1992) model of anxietyand performance.
According to Kanfer and Ackerman (1989), thereis a set amount of available cognitive resources thateach individual has when engaged in the completionof any given task. These finite cognitive resourcescan be allocated to on-task, off-task, or self-regula-tory activities. In a work setting, on-task activitiesinclude those behaviors related to production, qualityassurance, and safety compliance. Off-task activitiesinclude behaviors such as chatting with coworkers,thinking about family, or planning for the weekend.Self-regulatory activities include the monitoring ofone's environment. In particular for this study, themonitoring of job security would be aptly classifiedas a self-regulatory activity. This involves estimatingthe chances that one might be affected by an impend-ing organizational transition, how one's job mightchange as a result, keeping up-to-date with organiza-tional rumors, and the like.
When individuals have high job security, theseself-regulatory activities can be disengaged, leavingmore resources available for the on-task activities ofproduction, quality, and safety. However, when jobsecurity is perceived to be low, some of those cog-nitive resources may be funneled into self-regulatoryactivities aimed at monitoring progress toward thegoal of job retainment. Thus, during times of orga-nizational transition, valuable cognitive resourcesmay be consumed in the monitoring of job securityand in the maintenance of production schedules thatwould otherwise be used to maintain (or increase)
safety knowledge, extrinsic safety motivation, andcompliance. However, during times of organizationalstability and job security, these cognitive resourcescan be solely devoted to the demands of safety andproduction.
Other theories also suggest that the stress anddissatisfaction resulting from job insecurity will leadto lowered safety knowledge and motivation. Stresshas been shown to lead individuals to focus narrowlyon a few specific aspects of their environment (Bar-thol & Ku, 1959; Mandler, 1982). According to Hof-mann and Stetzer (1996), one consequence of thismay be that employees tend to focus their attentionon performance rather than safety during times ofstress, such as the felt threat of losing their jobs.Similarly, Eysenck and Calvo (1992) suggested thatanxiety (such as is expected to result from job inse-curity) can either (a) drain working memory re-sources leading to a decrease in performance or (b)increase cognitive arousal, thereby serving as a mo-tivational source that results in performance improve-ment. Where one will see performance decrementsversus performance improvements depends on theemployee's perception of organizational prioritiza-tion of safety, quality, and production. Wickens(1992) suggested that safety, in particular, representsan additional task that can compete with perfor-mance-related tasks when attention or performancecapacities are exceeded. In addition, Sanders andBaron (1975) in then" distraction-conflict theory sug-gested that arousal and anxiety can result in employ-ees relegating workplace hazards to the background.On the basis of these theories, the following hypoth-esis was predicted:
Hypothesis 3: Dissatisfied employees will exhibitlower levels of safety knowledge and motivation thanwill more satisfied employees.
It has been suggested that workers face a conflictbetween safety and production (Faverge, 1980; Jans-sens, Brett, & Smith, 1995; Kjellen, 1984; Leplat &Rasmussen, 1984). The more an organization placesan emphasis on production, the more employees per-ceive that safety is subordinated to the demands ofproduction (Janssens et al., 1995). The degree towhich employees choose production over safety willbe in part determined by their perceptions regardingorganizational reward contingencies.
Hofmann and Stetzer (1996) predicted that em-ployees who are experiencing job stress will focus onperformance rather than safety because performanceis more likely to result in salient rewards for theemployee. In addition, unsafe behavior may actually

JOB INSECURITY AND EMPLOYEE SAFETY 143
be perceived to be rewarding if it allows the em-ployee to perform work tasks more quickly (Slappen-dal, Laird, Kawachi, Marshall, & Cryer, 1993). Theseare conditions that are likely to be present duringtimes of job insecurity. Therefore, it is predicted thatjob stress and dissatisfaction have an impact onsafety compliance primarily through a reduced em-phasis on safety knowledge and motivation. In otherwords,
Hypothesis 4: Safety knowledge and motivation medi-ate the relationship between job dissatisfaction andsafety compliance.
Safety Compliance
A crucial component of the job security and safetymodel concerns actual compliance or, alternatively,violation of organizational safety policies. Safetycompliance has been defined as the extent to whichemployees adhere to safety procedures and carry outwork in a safe manner (Neal et al., 2000). Accordingto J. P. Campbell (1992), performance on any task isa function of three components: skill, knowledge, andmotivation. Therefore, compliance with safety poli-cies is expected to be predicted both by safety moti-vation and knowledge. On the basis of the theory ofreasoned action (Fishbein, 1979; Fishbein & Azjen,1975) and other theories of motivation (e.g., expec-tancy theory; Vroom, 1964), it is assumed that em-ployees who have low motivation to comply withsafety rules and regulations will also have a greaterincidence rate of violating those safety rules. Thus,
Hypothesis 5: Employees who are less motivated tocomply with safety rules and regulations will violatemore organizational safety rules than employees whoare more motivated to comply.
All things being equal (e.g., motivation), individ-uals who have received safety-related training andunderstand organizational safety incentive systems(and, therefore, presumably have greater knowledgeregarding appropriate safety behavior) are expectedto adhere to proper safety protocol more frequentlythan individuals who have less normative knowledge.Employees may or may not be motivated to complywith safety policies, but if they do not possess therequisite knowledge to do so, they are not expected tobe able to consistently comply with safety rules.Consistent with this, Neal et al. (2000) found thatsafety knowledge significantly predicted actual com-pliance with safety policies in their study of 525hospital employees. Thus,
Hypothesis 6: Employees who have less safety knowl-edge are predicted to have more safety violations thanemployees with more safety knowledge.
Workplace Injuries and Accidents
Finally, it is expected that lowered safety knowl-edge and reduced motivation to comply with safetypolicies will result in a higher incidence of workplaceinjuries and accidents as a result of increased non-compliance with organizational safety policies. Ac-cidents are defined to include actual reported acci-dents, unreported accidents, and "near misses"(incidents that could have caused an injury but didnot; Smecko & Hayes, 1999). Therefore, the follow-ing was predicted:
Hypothesis 7: Noncompliance with organizationalsafety policies is expected to be related to higher levelsof workplace accidents, injuries, and near misses.
Theorists studying the relationship among atti-tudes, behaviors, and outcomes (e.g., Fishbein, 1979;Fishbein & Azjen, 1975) suggest that one must makea careful distinction between outcomes (e.g., acci-dents and injuries) and behaviors (e.g., safety com-pliance). Attitudes (such as safety motivation) canonly predict behavior (i.e., compliance), whereas out-comes such as injuries are best predicted by bothbehavior and extraneous factors not under the controlof the individual. Therefore, attitudes should not beexpected to have a direct influence on outcomes suchas injuries and accidents, but rather the effects ofattitudes on outcomes are mediated through theireffect on behavior (i.e., compliance). As such, thefollowing was predicted:
Hypothesis 8: Safety compliance will mediate the re-lationships between safety knowledge, safety motiva-tion, and injuries and accidents.
Method
Participants
Participants were sampled from two geographically dis-tinct plants of a large food-processing company located inthe Pacific Northwest of the United States. Both plants weresimilar with respect to technologies used, production, jobcategories, and organizational structure. Both plants hadundergone major organizational changes affecting the jobsecurity of the organization's employees. In the first plant,an entire shift of workers was laid off, and during focus-group interviews employees reported a general feeling thatthe plant was being slowly phased out of existence in favorof a larger plant located elsewhere. This impression wasconfirmed through later interviews with the human re-sources manager, who indicated the plant was indeed being

144 PROBST AND BRUBAKER
slowly phased out. In the second location, the swing shiftwas being eliminated in favor of a night shift. Employeeswho could not accommodate the new shift schedule (i.e.,many single-parent employees with no day-care alterna-tives) were expected to lose their jobs. On the basis ofinterviews with employees, the general plant manager, andthe human resources manager, production was expected toremain at former levels during these organizational transi-tions. Thus, even though there would be fewer employees,overall plant production levels were expected to remainconstant.
Employees were asked to participate in the study at twodifferent time periods: (a) immediately after the shiftchanges and elimination were announced and (b) 6 monthsfollowing the organizational restructuring. The first timeperiod was selected to gather data while job insecurity waspresumably at its highest levels. The second time period wasselected to allow employees to adjust to the organizationalrestructuring, while also potentially showing the long-termeffects of such insecurity on safety outcomes.
Time I sampling. A total of 300 employees from the twosites were randomly selected to participate in the study atTime I: 200 from Site 1 (which is twice as large as Site 2)and 100 from Site 2. Of those invited, a total of 168employees chose to participate in the study at Time I (N, =92; N2 = 76), resulting in an overall participation rate of56%. Although exact numbers regarding turnover were notavailable, yearly estimates were extremely high at 200%,meaning that employees are quitting after an average of 6months. Thus, a participation rate of 56%, allowing forturnover between time of initial sampling and survey ad-ministration, was deemed satisfactory.
The modal age category of respondents at Time I was35-39 years. Male participants accounted for 58% of therespondents; 42% of the respondents were female. Themodal level of education completed was high school orgeneral equivalency diploma (GED). The majority of thesample (71%) indicated they were Caucasian or White; 16%checked Hispanic/Latino; and 8% self-identified as NativeAmericans. The remaining 5% were African American,Asian American, or chose not to affiliate themselves with anethnic category. Managers made up 16% of the sample. Themedian number of subordinates per manager was 22.
Time II sampling. At Time II, a total of 279 employeesfrom the two sites were randomly selected to participate inthe study: 200 from Site 1 and 79 from Site 2.1 Of thoseinvited, a total of 141 employees chose to participate (Nt =94; N2 = 47), resulting in an overall participation rate of51%.
The modal age category of respondents at Time II was35—39 years. Male participants accounted for 52% of therespondents; 48% of the respondents were female. Themodal level of education completed was high school di-ploma or GED. The majority of the sample (82%) againindicated they were Caucasian or White; 9% checked His-panic/Latino; and 4% self-identified as Native Americans.The remaining 6% were African American, Asian Ameri-can, or chose not to affiliate themselves with an ethniccategory. Managers accounted for 21% of the sample. Themedian number of subordinates was 17.5.
Time I and II participants. A total of 72 employeesfrom the two sites participated in both data collections.Therefore, longitudinal analyses were conducted for thatsubset of employees. The modal age category of respon-
dents who participated in both data collections was 40-44years. Male participants accounted for 57% of the respon-dents; 43% of the respondents were female. The modal levelof education completed was again high school diploma orGED. Eighty-two percent of the sample indicated they wereCaucasian or White; 10% checked Hispanic/Latino; and 6%self-identified as Native Americans. The remaining 3%were African American, Asian American, or chose not toaffiliate themselves with a racial category. Twenty-two per-cent of the sample indicated they were a manager or super-visor. The median number of subordinates was 17.5.
Sample Differences
The three samples were not significantly different withrespect to the demographic variables reported above, exceptfor the variable age. Participants who participated in bothsessions were somewhat older (median age = 40—44 years)than those who participated solely in Time I or Time II(median age = 30-34 years), F(2, 228) = 7.44, p < .001.
Analyses of variance were conducted to test for differ-ences across the two plant sites at the two data collectiontime points. Results suggest that there were very few sig-nificant differences between the two plant sites at eithertime point. Specifically, employees at Plant 1 had a highermean organizational tenure than those at Plant 2. In addi-tion, employees at Plant 1 had significantly lower perceivedjob security at both data collections. Finally, employees atPlant 2 had more accidents at Time 2 and more injuries atTime 1 than employees in Plant 1. See Table 1 for acomplete description of demographics and descriptive sta-tistics broken down by plant and time point.
Measures
To assess the model of interest, we administered surveysassessing each of the constructs in person at each data site.The following scales were included in the survey, whichwas billed as a "Workplace Environment Survey." Unlessotherwise noted, all scales were administered at both datacollection sessions.
Perceptions of job security. The Job Security Index(Probst, 1998/1999) was used to measure employees' cog-nitive appraisal of the future of their job with respect to theperceived level of stability and continuance of that job.Respondents indicated on a 3-point scale (1 = yes, 2 = ?,3 = no) the extent to which 18 adjectives or phrasesdescribed the future of their job (e.g., "my job is almostguaranteed," "permanent position if I want it," "insecure,""future is vague," and "well-established").
1 Because of historically high turnover in the food-pro-cessing industry (Komaki, Collins, & Penn, 1982), only 79of the originally sampled 100 employees remained with theSite 2 organization at Time II. Because of organizationalconstraints, we were not able to replace those employees inour sampling. At Site 1, however, we were able to replacethrough random sampling those individuals who had quitsince Time I. Therefore, the total number of employeessampled from the first site remained 200.

JOB INSECURITY AND EMPLOYEE SAFETY 145
Table 1Sample Demographics and Descriptive Statistics
Sample
Plant I Plant H
Variable
Total respondentsModal age category (years)Male respondentsFemale respondentsUnreportedManagers (self-report)Mean tenure in years (SD)Modal level of educationJob security perceptions (SD)Job attitudes (SD)Safety knowledge (SD)Safety motivation (SD)Safety compliance (SD)Workplace injuries (SD)Workplace accidents (SD)
Time I
7630-34383089 (12%)
6.9 (7-9).HS/GED
1.79(1.13).1.81 (0.53)5.42(1.15)4.83 (1.20)4.78 (0.54)0.23 (0.42),
—
TimeJJ
4735-39192537 (15%)
7.4 (7.6).HS/GED
1.57(0.98)a
1.82(0.57)5.54(1.11)4.87 (0.93)4.67 (0.47)0.26 (0.44)0.42 (0.64)a
Time I
9230-3453372
17 (16%)2.4 (3.6)b
HS/GED2.07 (0.88)b
1.68 (0.51)5.54(1.20)4.69(1.17)4.63 (0.73)0.38 (0.49)b
—
TimeJI
944(M45241
122 (23%)3.1 (4.6)b
HS/GED2.17 (0.90)b
1.70(0.58)5.63 (1.05)4.39 (1.29)4.59 (0.67)0.33 (0.47)0.70(0.75)b
Note. Means with the same subscript are not significantly (p < .05) different from each other during the same time point.Dashes denote data are not available for this variable. HS/GED refers to high school diploma or general equivalencydiploma.
Job satisfaction. Six scales were used to measure em-ployee job satisfaction. Responses from these scales werecollapsed into a single measure of overall job satisfaction.The first five scales were taken from the Job DescriptiveIndex (Smith et al., 1969), with each scale containing 9items. These included satisfaction with supervision, co-workers, pay, promotions, and work itself. The sixth scalewas the 20-item Job Security Satisfaction scale (Probst,1998/1999), which measures satisfaction with one's level ofjob security. Whereas the Job Security Index was designedto assess perceptions of job security, the Job Security Sat-isfaction scale was designed to capture an individual's at-titudes regarding that level of job security. Thus, it capturesthe individual's evaluative judgment of his or her job secu-rity. As recommended by Hanisch (1992), agreement withpositively worded job attitude items was scored 3; disagree-ment with positively worded items was scored 0; and ?responses were scored 1. Negatively worded items werereverse scored, such that higher numbers indicate morepositive job attitudes. Sample items from each of the sixattitude scales, respectively, are "knows how to supervise,""work well together," "barely live on income," "dead-endjob," "challenging," and "excellent amount of security."
Safety knowledge. Two items measured the degree towhich employees were knowledgeable about their organi-zation's safety policies. Respondents indicated on a scalefrom 1 to 7 the extent to which they agreed or disagreedwith the following statements, "I know who to ask if I amnot sure about the safe way to complete a task" and "I feelfree to request additional safety training if I think it isneeded." At Time II, a third item ("I know the safe way tocomplete my work tasks") was included. Items were scoredsuch that higher numbers reflect more safety knowledge.
Safety motivation. Four items were written to assess thedegree to which employees were extrinsically motivated to
comply with safety rules and policies. Respondents indi-cated on a scale from 1 to 7 the extent to which they agreedor disagreed with the following statements: "There is noincentive for me to follow all the safety policies in my plant.I am not rewarded for being 'safe'"; "My supervisor strictlyenforces safety rules and regulations"; "My supervisorpraises me when he or she sees that I am following propersafety procedures"; and "When I ignore safety rules, mysupervisor punishes me." Items were scored such that highernumbers reflect more safety motivation.
Because the safety knowledge and motivation scales werewritten for the purpose of this study, confirmatory factoranalyses were conducted on the Time I and Time U datasetsto provide evidence that these items tapped two distinctconstructs. Confirmatory factor analysis results indicate thata two-factor solution provides a good fit to the data. (Factorloadings and fit indices may be obtained by contacting thefirst author.)
Safety compliance. At Time I, a single item was writtento assess safety compliance. Respondents indicated the fre-quency with which they "ignore safety rules and regulationsat work" ranging on a scale from 1 (never) to 5 (constantly).Responses to this item were reverse-scored such that highernumbers reflect more compliance. At Time II, an additionalitem was included to measure compliance, which askedparticipants to rate the frequency with which they "takeshortcuts in safety guidelines in order to get the job donefaster" using the same response scale noted above.
Workplace injuries. Because of the repetitive nature ofthe work and the use of sharp implements, injuries, in thissample were defined as wrist, hand, or arm injuries, becausethese were the most common injuries associated with work-ing in these food-processing plants. Thus, at Time I andTime II, a single item (dichotomously scored) assessed

146 PROBST AND BRUBAKER
whether employees currently had a wrist, hand, or arminjury.
Workplace accidents. Three items assessed workplaceaccidents. Using a measure developed by Smecko andHayes (1999), we asked employees to report how manysafety accidents they reported to their supervisor, how manyunreported accidents they had experienced, and how manynear accidents (something that could have caused an injurybut did not) they were involved in over the past 12 months.Workplace accidents were measured in the Time II surveyonly. Responses to the three items were summed to give atotal number of workplace accidents for each employee.Given that accident data are frequently positively skewed,the accident data were transformed using the square roottransformation for nonnormality (Neter, Wasserman, &Kutner, 1990). This made the accidents data distributionmore normal compared with the untransformed data.
Although the workplace accidents and injuries variablesare self-report in nature, previous studies have indicated thatself-report measures of accidents and unsafe behaviors arerelated to independent observations of these variables(Lusk, Ronis, & Baer, 1995). In addition, social desirabilityresponding would, if anything, act to suppress the varianceon these measures as people would probably tend to under-report these variables (Hofmann & Stetzer, 1996). There-fore, reliance on these self-report measures would, at worst,attenuate the relationship between these variables and theirposited predictors.
Data Analysis
The main purpose of this study was to test the model ofjob insecurity and safety described above. The model wasinitially tested using the Time I data, then cross-validated byassessing the same model using the Time II data. Finally, togather additional support for the hypothesized directionalityof the model paths, we conducted longitudinal regressionanalyses using the data from respondents who participatedin both data collection sessions.
SEM analyses. To conduct the first two tests of themodel, we performed the two-step structural equation mod-eling (SEM) approach recommended by Anderson andGerbing (1988) using LISREL 8 (Joreskog & Sorbom,1993). First, the measurement model was assessed to dis-criminate empirically the theoretical constructs of the modeland to validate the operational measures thereof. As recom-mended by Fitzgerald, Drasgow, Hulin, Gelfand, and Ma-gley (1997), three parallel indicators were formed for eachof the latent constructs on the basis of confirmatory factorloadings, item—total correlations, and item content. Second,the structural equation model, specifying the causal rela-tionships among the latent variables, was tested. Finally,alternative models that allowed for direct effects and thehypothesized mediated effects throughout the model weredeveloped. In other words, these alternative models freedthe direct paths between independent and dependent vari-ables, as well as the mediating paths. In this fashion, thestructural and alternative nested models could be comparedto assess whether the alternative models explained signifi-cantly more variance relative to the lost degrees of freedom.Figures 1, 2, 3, and 4 show the paths that were freed in theestimation of the proposed and alternative structural mod-els. All remaining paths were fixed at zero.
Assessment of model fit. To assess the adequacy of themeasurement and structural models, researchers (Bentler &Bonett, 1980; Joreskog & Sorbom, 1993; Mulaik et al.,1989) recommend examining several goodness-of-fit indi-ces: the )?ldf ratio, goodness-of-fit index (GFI), adjustedgoodness-of-fit index (AGFI), nonnormed fit index (NNFI),root mean square error of approximation (RMSEA), rootmean square residual (RMSR), and comparative fit index(CFI).
Longitudinal analyses. Because of the small samplesize of participants who responded to questionnaires atboth time points, LISREL analyses could not be con-ducted to assess the validity of the model in a longitudi-nal context. Therefore, to gather support for the hypoth-esized directionality of the proposed model, weconducted several multiple regression analyses by pre-dicting Time II dependent variables with the Time Iindependent variables while controlling for baseline lev-els of the dependent variable collected at Time I (D.Campbell & Stanley, 1966).
Time I Cross-Sectional Results
Table 2 presents descriptive statistics and scalereliabilities; Table 3 presents zero-order product-moment correlations among the study variables.
Measurement Model Results
Table 4 contains the goodness-of-fit statistics ob-tained from analyses of the parallel indicators. The•fldf ratio was 1.35, the GFI was .93, the AGFI was.88, the RMSR was .05, and the NNFI was .96. As isevident from the indices, the measurement modelprovided a satisfactory fit to the data. The factorloadings obtained from fitting the measurementmodel to the parallel indicators are provided in Table5. All factor loadings from the measurement modelare large and statistically significant beyond the .01level. Together, these results suggest a good fit of themeasurement model to the data.
The next phase in the analysis was the structuralmodeling procedure. Elements of the ft and Fmatrices were either fixed at zero or freed (i.e.,estimated) according to the proposed model of jobinsecurity and safety presented in Figure 1. Max-imum likelihood estimation was used to estimateparameters.
Structural Model Results
The goodness-of-fit indices for the proposedstructural model are presented in Table 4 and alsosuggest a good fit of the model to the data. Table 4shows that the ^Idf ratio was 1.52, which is sat-
(text continues on page 150)
JOB INSECURITY AND EMPLOYEE SAFETY 147
I

148 PROBST AND BRUBAKER
aI
.3
•a
.00
fe.
JOB INSECURITY AND EMPLOYEE SAFETY 149
'•3

150 PROBST AND BRUBAKER
Table 2Descriptive Statistics and Scale Reliabilities
Variable
Time I1. Job security perceptions2. Job attitudes3. Safety knowledge4. Safety motivation5. Safety compliance6. Workplace injuries
Time 07. Job security perceptions8. Job attitudes9. Safety knowledge
10. Safety motivation1 1 . Safety compliance12. Workplace injuries13. Workplace accidents
N
162168152153158159
137141138138138138134
M
1.941.745.494.754.700.31
1.971.745.604.554.620.300.89
SO
1.000.521.181.180.660.47
0.960.581.071.200.610.461.68
a
.91
.91
.67
.56——
.90
.92
.61
.60
.66—.67
Note. Dashes denote one-item measure.
isfactory. The GFI was .91; the NNFI was .93; andthe RMSEA and RMSR were .06 and .07, respec-tively. Finally, the CFI was .95. Next, an exami-nation of the path coefficients was undertaken,which are presented in Figure 1.
Five of the seven paths were in the expected di-rection and significant beyond the traditional signif-icance level of p < .05, providing support for manyof the hypotheses outlined earlier. In Figure 1, it isevident from the path coefficient of .72 that jobsecurity perceptions were strongly related to job sat-isfaction, providing support for Hypothesis 1. Ofgreater interest are the relationships between job sat-isfaction and safety knowledge and safety motiva-tion. Job satisfaction was positively related to safetyknowledge (.24), suggesting that individuals who are
satisfied with multiple aspects of their job, includingjob security, report greater knowledge of safety pol-icies. Similarly, higher levels of job satisfaction wererelated to higher levels of safety motivation (.33),supporting Hypothesis 3. As would be expected,there was a significant relationship between safetyknowledge and safety motivation (.42), such thatindividuals reporting higher levels of safety knowl-edge also report correspondingly higher levels ofmotivation to comply with safety rules. An examina-tion of the latter part of the model reveals that,contrary to Hypothesis 6, safety knowledge was notsignificantly related to reported safety compliance.However, safety compliance was significantly pre-dicted by safety motivation (.24), as was anticipatedin Hypothesis 5. Finally, in this test of the model,
Table 3Interscale Correlations of Study Variables
Variable
1. Job security perceptions2. Job satisfaction3. Safety knowledge4. Safety motivation5. Safety compliance6. Workplace injuries7. Workplace accidents
1
.52**
.55**
.17*
.22**
.07-.07
—
2
.39**
.70**
.32**
.40**
.04-.20*
—
3
.19*
.27**
.12
.36**-.02
.15—
4
.17*
.48**
.45**
.66**
.21**-.08
—
5
.13
.17*
.22*
.40**
.43**
.06—
6
-.07-.39**-.24**-.29**-.31**
.37**—
7
-.20*-.32**-.25**-.28**-.20*
.10—
Note. Time I correlations are presented below the diagonal. Time U correlations are presented above the diagonal.Cross-time correlations for each study variable are reported along the diagonal. Dashes denote item was not measured atTime I.* p < .05. **p < .01.

JOB INSECURITY AND EMPLOYEE SAFETY 151
Table 4Goodness-of-Fit Indices for Measurement and Structural Models
Model
Time IMeasurementStructuralAlternative model
Time IIMeasurementStructuralAlternative model
x2
70.2291.3484.17
105.08148.83126.25
df
526055
728579
)fldf
1.351.521.53
1.461.751.60
GFI
.93
.91
.92
.90
.87
.89
AGFI
.88
.86
.86
.84
.82
.83
NNFI
.96
.93
.93
.93
.88
.91
RMSEA
.05
.06
.06
.06
.08
.07
RMSR
.05
.07
.06
.06
.09
.07
CFI
.97
.95
.95
.95
.90
.93
Note. GFI = goodness-of-fit index; AGFI = adjusted goodness-of-fit index; NNFI = nonnormed fit index; RMSEA =root mean square error of approximation; RMSR = root mean square residual; CFI = comparative fit index. The structuralmodels tested are the a priori models presented in the article. The alternative models allow for direct effects throughout themodel, in addition to the hypothesized mediating effects.
safety compliance was not significantly related toworkplace injuries, contrary to the expectations ofHypothesis 7.
Alternative Model Results: Testing forDirect Effects
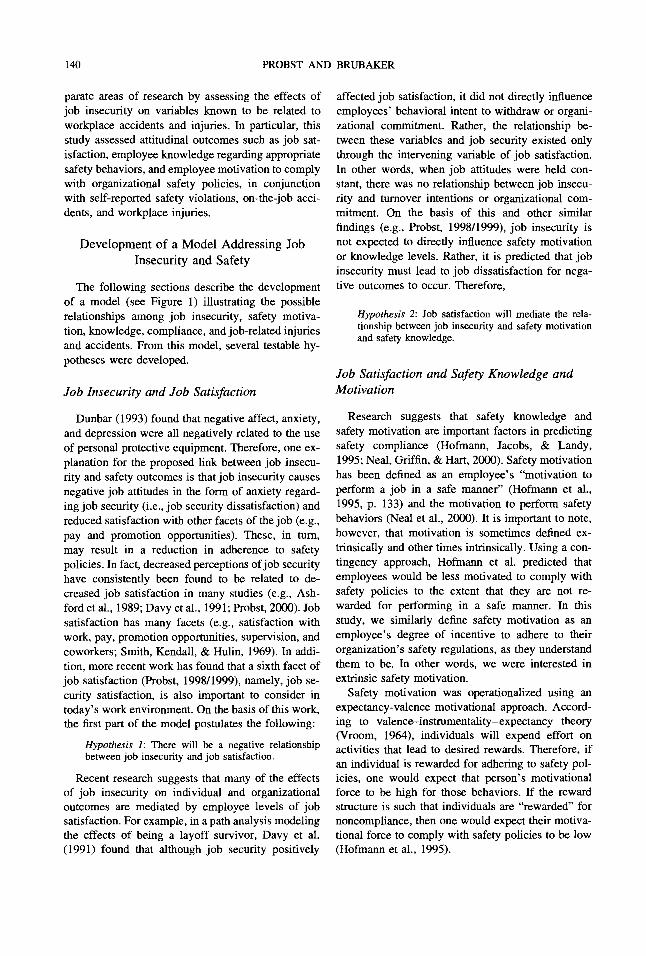
The goodness-of-fit indices for the alternativestructural model allowing for direct as well as medi-ating effects are presented in Table 4. The x^/df ratiowas 1.53. The GFI was .92; the NNFI was .93; andthe RMSEA and RMSR were both .06. Finally, theCFI was .95. Although the fit indices reflect a satis-factory fit of the model to the data, the sequential
Table 5Measurement Model Confirmatory Factor Loadings
Indicator
Construct
Time IJob security perceptionsJob attitudesSafety knowledgeSafety motivation
TimellJob security perceptionsJob attitudesSafety knowledgeSafety motivation
.83
.83
.74
.38
.84
.91
.44
.63
.93
.82
.69
.52
.91
.79
.73
.38
.64
.86—.79
.69
.90
.64
.49
Note. Only factor loadings of latent variables are reportedhere. All reported factor loadings were significant at p <.05. The factor loadings of the single indicator manifestvariables (e.g., safety compliance, injuries, and accidents)were fixed at 1.00. The dash denotes only two indicators forsafety knowledge at Time I.
chi-square was nonsignificant, indicating that the al-ternative model does not explain a significantly in-cremental portion of the variance relative to the de-grees of freedom lost, )fsexi(5) = 7.17, ns. Anexamination of the path coefficients confirms theseresults. The direct paths from job security perceptionsto safety knowledge and to safety motivation andfrom job satisfaction to safety compliance are non-significant, providing support for Hypotheses 2 and4. The direct paths from safety knowledge and safetymotivation to workplace injuries, however, are sig-nificant, suggesting that a partially (rather than fully)mediating model might be more appropriate for thesevariables. Thus, Hypothesis 8, which predicted thatsafety compliance mediates the relationships betweensafety knowledge, motivation, and injuries, may notbe fully supported.
Time II Cross-Sectional Results
Table 2 presents descriptive statistics and reliabili-ties at Time II. Zero-order product-moment correla-tions among the study variables at Time n can befound in Table 3.
Measurement Model Results
Table 4 contains the goodness-of-fit statistics ob-tained from analyses of the parallel indicators. TheX^/df ratio was 1.46; the GFI was .90 and AGFI was.84. The NNFI was .93, and the RMSEA and RMSRwere both .06. Finally, the CFI was .95. The factorloadings obtained from fitting the measurementmodel to the parallel indicators are provided in Table5. All factor loadings from the measurement model

152 PROBST AND BRUBAKER
are large and statistically significant beyond the .01level. Together, these results suggest a satisfactory fitof the measurement model to the data.
The next phase in the analysis was the structuralmodeling procedure. Elements of the ft and F matri-ces were either fixed at zero or freed (i.e., estimated)according to the proposed model of job insecurityand safety presented in Figure 3. (Note that Figure 3differs slightly from Figure 1 in that workplaceaccidents were measured at Time II.) Maximumlikelihood estimation was again used to estimateparameters.
Structural Model Results
The goodness-of-fit indices for the proposed struc-tural model are presented hi Table 4 and suggest areasonable fit of the model to the data. Table 4 showsthat the ^Idf ratio was 1.75, which is satisfactory.The GFI was .87; the NNFI was .88; and the RMSEAand RMSR were .08 and .09, respectively. Finally,the CFI was .90. Next, the path coefficients wereexamined and are presented in Figure 3.
Seven of the eight paths were in the expecteddirection and significant beyond the traditional sig-nificance level of p < .05, providing additionalsupport for many of the hypotheses outlined ear-lier. Job security perceptions were again related tojob satisfaction (.35), providing support for Hy-pothesis 1. Job satisfaction was also positivelyrelated to safety knowledge (.26), suggesting thatindividuals who are secure in their job and satisfiedwith that level of security report greater knowledgeof safety policies. Similarly, greater job satisfac-tion was related to higher levels of safety motiva-tion (.46), supporting Hypothesis 3. There wasagain a significant relationship between safetyknowledge and safety motivation (.54), such thatindividuals reporting higher levels of safetyknowledge also report correspondingly higher lev-els of motivation to comply with safety rules. Aswas found at Time I, safety knowledge was notsignificantly related to reported safety compliance.Rather, safety compliance was significantly pre-dicted by safety motivation (.58), as was antici-pated in Hypothesis 5. Finally, both workplaceinjuries and workplace accidents were significantlypredicted by safety compliance (-.32 and -.24,respectively), suggesting that greater safety com-pliance is related to fewer workplace injuries andaccidents, in accordance with Hypothesis 7.
Alternative Model Results: Testing forDirect Effects
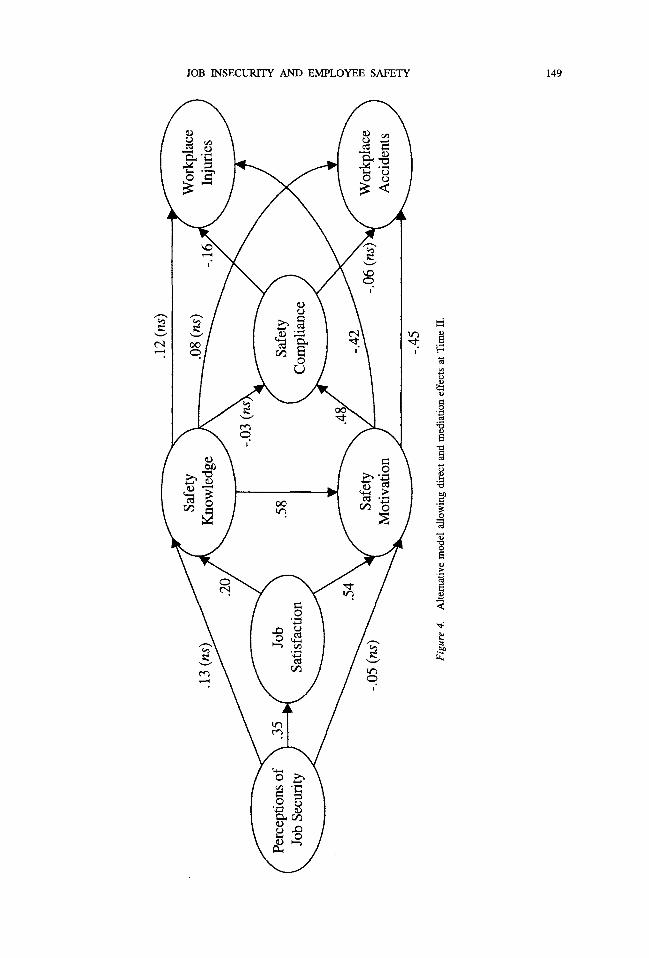
The goodness-of-fit indices for the alternativestructural model at Time II allowing for direct as wellas mediating effects are presented in Table 4. The•fldf ratio was 1.60. The GFI was .89; the NNFI was.91; and the RMSEA and RMSR were both .07.Finally, the CFI was .93. These fit indices appear toreflect a better fit of the model to the data than theproposed structural model. As confirmation, the se-quential chi-square was significant, indicating thatthe alternative model explains a significantly incre-mental portion of the variance relative to the degreesof freedom lost, ^2
seq(6) = 22.58, p < .01.An examination of the path coefficients suggests
that these results are largely being driven by thedirect effects allowed between safety motivation andworkplace injuries (-.42) and accidents (-.45). Allother direct effect paths were nonsignificant. Consis-tent with the Time I alternative model results, thissuggests that a partially (rather than fully) mediatingmodel might be more appropriate for these variables.
Comparison of Time I and Time IIStructural Models
Before moving on to the longitudinal analyses, wesummarize the consistencies and inconsistencies inthe structural models at Time I and Time II to providesome cross-validation of the proposed model in thetwo samples. At both time points, the data indicatethat perceptions of job security are significantly re-lated to job satisfaction. In turn, more positive jobsatisfaction is related to higher levels of safetyknowledge and motivation. Further, at both timepoints, although safety knowledge is related to safetymotivation, it is not related to safety compliance.Safety compliance is better explained by safety mo-tivation in both of the models. Finally, safety com-pliance at Time I was not related to workplace inju-ries, whereas safety compliance as measured in TimeII was related to both workplace injuries and acci-dents at Time II.
At first glance, it appears that the tests of thealternative models were inconsistent. The Time Imodel explained a nonsignificant amount of addi-tional variance over the proposed structural model,whereas the Time II model did explain a significantamount of additional variance. However, both mod-els consistently indicated that extrinsic safety moti-vation has strong direct (as well as indirect) effectson workplace injuries and accidents.

JOB INSECURITY AND EMPLOYEE SAFETY 153
Longitudinal Regression Results
Although the cross-sectional tests of the modelsreported above suggest that job insecurity has signif-icant and strong relationships with important safetyoutcomes, there is a significant limitation to thoseanalyses. Because those results are based on cross-sectional data, the direction of effects can be hypoth-esized but not directly tested. It is clear that there aresignificant relationships between job insecurity andimportant safety outcomes. However, it is unclear ifjob insecurity is the cause of lower safety motivationand compliance. An alternative, and equally plausi-ble, explanation is that employees with poor safetymotivation and compliance are more likely to beinsecure in their job as a result of their poor safetyattitudes and lack of compliance. Thus, each path ofthe hypothesized model was further tested using lon-gitudinal data collected on a subset of the Time I andTime II participants. By showing that job securityperceptions at Time I were related to Time II safetyoutcomes, while controlling for baseline levels of theoutcome variables at Time I, we can make a bettercase for the hypothesized model of job security safety(D. Campbell & Stanley, 1966).
The longitudinal multiple regression results arepresented in Table 6. For each analysis, the Time Icontrol variable was first entered into the equation topredict the Time II outcomes. In the second equation,both the predictor and Time I control variables wereentered into the regression equation. The last twocolumns of Table 6 indicate the change in R2 and thesignificance of the Fchange statistic.
Predicting Time II Job Satisfaction
The first multiple regression analysis assessed theability of Time I job security perceptions to predictjob satisfaction at Time II, while controlling for base-line Time I levels of participant job satisfaction. Ascan be seen in Table 6, although job satisfaction atTime I was significantly related to job satisfaction atTime II (/3 = .70), job security perceptions at Time Ialso significantly predicted satisfaction at Time IIO = .39), accounting for an additional 10% of thevariance (Fchange = 41.24, p < .01). This provideslongitudinal support for Hypothesis 1, in addition tothe two cross-sectional tests earlier reported.
Predicting Time II Safety Knowledge
As anticipated by Hypothesis 3, job satisfaction atTime I was a significant predictor of safety knowl-
VO<us
a
"31«£^as^
ssio
n
£so^
OS
•Si
i•e•3a
!
co
5"T*ofaCOU
i-cO
"§
P-.
C_o
.y
otg§u
|Isf
r)
^
^
it,
fS™C
aa
*;C
8
sa>
is,
NOS
ca
GO
2•no"
1H
*og§o
iH
oo
4>
i
*
^o
o\
°*
**C lo\oo
^
Q^in
**
**^
s
**cs
r-
^
oin
**or-
c
1ts
X)i-
_o
ca
>^
£r
^
**
06
M*~~^
5(N
*V)r-Tf
Tj-
*-*
**ft
O
["
s
a\o
<NO
2
•S1
1_§
I
oil
o
<§«
C3_Oy
CS
^5
*
in
in
2(N
**in
-H
*(N
**O
en
**ooTf
O
**s
•a
11
O•1on
g
11s&
gtj
XI
*
vS
p
3(N
**VI0)
0
ino-l
*oo(N
**
^
(S
**Oa\m
oo
**
1*&
oa
1<fi
0
too<st3
co•a
CO-S
1OT
m f>d o
p p
S2cs cs
•It
* *
\D ^t
o\ •*
gs1
* ** *•*
ss
* ** *o inrt- mc*-i 0\
OO (T)
* ** *m \o
^
I f io ^o JSpt
1|c/5 !>
o .g
If^i
^M O
00
u g
II^ &*
1 8
PCO CO«3 00
2
~
*O
•*
*b
*s1
~
"3
u_a
s
8)
'
uu
1&1
oo
I
05
•f
I•5?<ug£!COO
"2O
•a3o
•S
J3S
^(D
H
3
>
I£?2•a
accid
ents
CJ
"S.|
g
Vn.
p
V0,
*

154 PROBST AND BRUBAKER
change
edge at Time II (j3 = .37) after controlling for TimeI safety knowledge levels. Entering job satisfactioninto the regression equation at Step 2 resulted in anR2 change of .12, which was significant (Fch
8.44, p < .01).
Predicting Time II Safety Motivation
Providing additional support for Hypothesis 3, thelongitudinal multiple regression analysis suggeststhat job satisfaction at Time I significantly predictssafety motivation at Time II (/3 = .24), even afteraccounting for safety motivation levels at Time I(|3 = .60). Thus, although Time II safety motivationis best predicted by earlier levels of motivation, TimeI job satisfaction did account for an additional 5%variance in the dependent variable (Fchange = 5.13,p < .05).
Predicting Time II Safety Compliance
Safety compliance at Time II was significantlypredicted by both Time I safety compliance (j3 = .43)in the first equation and Time I safety motivation(j3 = .28) in the second equation. Thus, even afterTime I safety compliance was accounted for, safetymotivation remained a significant predictor of thisoutcome variable, accounting for an additional 7%variance (Fchange = 5.57, p < .05). As was found inboth of the cross-sectional analyses, safety knowl-edge was not a significant predictor of safety com-pliance O = .09) and did not account for any incre-mental variance explained (Fchange = 0.53, ns).
Predicting Time II Workplace Injuries
Time II workplace injuries appear to be best pre-dicted by Time I workplace injuries (j3 = .36). Thus,individuals who suffered from wrist, hand, or arminjuries at Time I were also likely to have these typesof injuries at Time II. Safety compliance at Time Idid not account for any additional variability in work-place injuries (A/? = .01, Fchange = 0.36, ns), al-though the regression coefficient was in the expecteddirection (/? = -.07).
Predicting Time II Workplace Accidents
Because workplace accidents were not measured atTime I, baseline levels of such accidents could not becontrolled for in this analysis. However, in tentativesupport of the job security model, Time I safetycompliance levels were related to Time II reports of
workplace accidents (j3 = -.27), such that individualsreporting more compliance at Time I were found tohave fewer reported and unreported accidents andnear misses at Time II than individuals who exhibitedless compliance with safety regulations at Time I(F,change = 4.70, P < . 05).
Comparison of Cross-Sectional andLongitudinal Results
Overall, the results of the longitudinal regressionanalyses were quite consistent with the results of thetwo cross-sectional SEM analyses. First, in bothcross-sectional SEM analyses and in the longitudinalmultiple regression analysis, job insecurity was con-sistently shown to be a strong predictor of job satis-faction. This supports previous research conducted inthis area. Next, safety motivation was consistentlypredicted by job satisfaction. This was true in both ofthe cross-sectional analyses and in the longitudinalresults. Therefore, it appears that job insecurity canhave an important effect on safety motivationthrough its impact on such job attitudes as job secu-rity satisfaction, coworker and supervisor satisfac-tion, and satisfaction with pay, promotions, and thework itself. In addition, consistent support across thethree tests was found for the proposition that jobsatisfaction is related to safety knowledge.
The latter portion of the model assessed behavioraland physical outcomes of job insecurity and de-creased safety motivation and knowledge. Partici-pants consistently reported less compliance withsafety policies when their extrinsic motivation tocomply with safety rules was reduced. Safety knowl-edge, on the other hand, did not appear to be animportant predictor of safety compliance in any ofthe three analyses. With respect to physical healthoutcomes, greater numbers of workplace accidentswere consistently found when safety compliance wasreduced. Finally, partial support was found for thehypothesis that safety compliance is related to expe-rienced injuries on the job. Of the three analyses,only the Time II cross-sectional analyses showed thispredicted relationship.
Additional Analyses
Because managers may be exposed to fewer haz-ards, and thus may report fewer injuries and acci-dents, one final analysis was performed to assesswhether managerial status had a significant effect onthe safety variables of interest—specifically, safety
JOB INSECURITY AND EMPLOYEE SAFETY 155
knowledge, safety motivation, safety compliance,workplace injuries, and workplace accidents. We per-formed hierarchical multiple regression analyses byentering managerial status as a control variable in thefirst step and entering the relevant predictors in thesecond step. These analyses were performed succes-sively on the Time I dataset, the Time II dataset, andthe longitudinal subset of data.
Results indicate that managerial status had littleimpact on the safety variables of interest. In the TimeI dataset, one of the six analyses was significantsuggesting that managerial status was negatively re-lated to reported safety compliance, F(2, 144) =16.66, p < .001, such that managers reported beingless compliant than nonmanagers (/3 = -.39). How-ever, even after entering this control variable, safetymotivation remained a significant predictor of safetycompliance (j3 = .27, p < .001). In the Time IIdataset, there was again one significant result out ofthe six analyses. Managers reported fewer workplaceinjuries than nonmanagers, F(2, 134) = 11.56, p <.001. However, safety compliance remained a signif-icant predictor of injuries (/3 = -.31, p < .001), suchthat greater compliance was related to fewer injuries.Finally, in the longitudinal dataset, none of the sixregression analyses were significant.
Discussion
The purpose of this study was to explore the rela-tionship between employee perceptions of job inse-curity and safety outcomes such as extrinsic moti-vation to comply with safety policies on the job,self-reported incidences of safety violations, andworkplace injuries and accidents. Previous researchon the outcomes of job insecurity had focused pri-marily on attitudinal outcomes, such as organiza-tional commitment and job satisfaction, health out-comes including both physical and mental healthconditions, and employee withdrawal intentions (i.e.,turnover). However, little attention has been paid tosafety as a potentially important outcome.
The results of this study confirmed previous re-search that suggests job security perceptions arestrongly related to job satisfaction. In turn, this studyshowed that job satisfaction is an important predictorof safety motivation and knowledge. More impor-tantly, this study produced important initial evidencethat job security is also related to meaningful safetyoutcome measures, such as safety knowledge, safetymotivation, and reported compliance with safety pol-icies. In turn, injuries and accidents were shown to bepredicted by safety motivation, and, to a lesser de-
gree, by safety knowledge and compliance. Perhapsmost significantly, the majority of these results wereconfirmed in both cross-sectional samples and a morerigorous longitudinal design.
Implications for Practice and Research
The results of this study have potentially importantpractical and theoretical implications. With respect topractical implications, these results suggest that or-ganizations not only need to consider the effects thatemployee job insecurity has on the job satisfaction,health, and turnover intentions of employees, but alsoneed to consider the possibility that job insecurity canhave potentially dangerous implications for em-ployee safety attitudes and behaviors. Employeeswho feel that their jobs are insecure may choose toignore critical safety policies. The reason for this linkand how organizations might circumvent it warrantsfurther exploration. Possibly, employees operatingunder conditions of job insecurity choose to ignorecritical safety policies and "cut corners" to maintainor increase their production numbers in an effort toretain their job. Of course, lifetime job security is notthe solution; however, organizations do need to becognizant of this potentially dangerous relationshipbetween job insecurity and safety violations. In par-ticular, organizations need to be aware of the poten-tially competing demands of safety and productionduring times of organizational transition and jobinsecurity.
Of particular interest to organizations may be theconsistent finding that safety knowledge in the ab-sence of motivation had little impact on safety out-comes. With the exception of the alternative modeltested at Time I, there were no significant paths toinjury except through safety motivation. This hasimplications for the current focus on behavioralsafety programs in industry today, as it questions therole of safety knowledge. Equally troubling is thelack of consistent relationship between complianceand injury. Possibly, this indicates that the organiza-tion's safety rules may be inadequate to preventinjury despite employee compliance to those rules.2
Theoretically, this study ties together two previ-ously independent streams of research. As noted ear-lier, there has been a great deal of research on theoutcomes of job insecurity, but researchers have up tothis point ignored safety motivation and compliance
2 We thank an anonymous reviewer for drawing ourattention to these implications.

156 PROBST AND BRUBAKER
as possible outcomes. Similarly, there is a growingbody of literature on work and organizational ante-cedents of employee safety outcomes (e.g., Hofmannet al, 1995; Hofmann & Morgeson, 1999; Hofmann& Stetzer, 1996, 1998; Simard & Marchand, 1997;Thompson, Hilton, & Witt, 1998; Zohar, 1980).However, to date, there has been no research consid-ering job insecurity as a predictor of worker safety.This study was a first attempt to bring together theseareas of research.
Explaining the Job Insecurity—Safety Link
There are possibly multiple explanations for theconsistent link between job insecurity and safety.However, the most plausible explanation appears tobe related to a finite amount of resources on the partof the employee. Consider the employee who has tojuggle the competing job demands of production,quality, and safety. When jobs are threatened andorganizations are run by the bottom line, employeesmay feel pressured to cut safety corners to keep theirproduction numbers up. Thus, when employees per-ceive that the demands of safety and production areincompatible, safety motivation may be replaced bythe demands of production motivation when the em-ployee feels his or her job is insecure, particularly ifthe employee is not actively rewarded for safe be-havior. In the present study, the organization wasdownsizing by eliminating one shift and changinganother shift schedule, yet overall organizational pro-duction demands remained constant. In other words,employees were expected to produce equivalentamounts under conditions of fewer human resources.
Although production demands were not specifi-cally included in the model or directly measured,there were three items in the questionnaire that as-sessed the extent to which employees perceived theirorganization to place an emphasis on production.Analyses assessing production emphasis as a media-tor of the relationship between job insecurity andsafety outcomes are presented in Table 7 using thethree-step approach by Baron and Kenny (1986) andsuggest that production demands may partially me-diate the relationship between (a) job insecurity andjob satisfaction and (b) job insecurity and safetymotivation. In other words, employees who feel in-secure perceive a greater emphasis on production,which then translates into lower job satisfaction andreduced motivation to attend to safety.
r-
3cdH
5
1
"3sco
1I3
H-43
'.dia
led
Mi
S|
_
O
•rH
<Jt0
•3is•3'•3&
oSBt§1£
.21too*3
1s^"Q
k,
&:
•o«
of
•o
CQ_
"
k,
OS
CO.
v^"*3
k,
olOS
CQ.
rite
rion
O
ga
••3S
Pred
icto
r
a.
X
<N
*
S•Oen
enen
**00
ON
]
S
*#csSOos
om
**U")v^
OS
#*CS•*ON
(N
*
r
tisfa
ctio
n
S|
§
11
"&It'S §> V
H
^mTJ~<spjoi
3
2;
§i
$
*fN
^
P
*r-T—>
ON
*#CN
ON
01•— <
**
rw>
know
led
>^
1M§11
o1)
1
z
^r
<N
?5rf
S
•X-
8
gi5
*#in
""•
P
#
*c-lr>)
ON
*
OJ
ON
0)1-*
**
SiGr>
mot
ivat
ii
taUS
S30
O
1M& *s
" a•8 p
P
a.
mIN
^pj
^Oscs
**nom
#*CXIen
1
en
*#en00enO4
*£
#
ONen
inen
Ren
0)p
vn
f
tisfa
ctio
n
S|
§3
1
0)
1
z
(Tl
<N
*
Pen
S
*oo
§1
fNen
*
in
S
*OS^H
»oen
r-
rn
01p
!2r0
know
led
&•S00
§
1«g
f
1
UH
en
of
*
^
S
2
#ON
I
m
*
OSm
mp
*r—l
flcn
^~
C*lO
!2rs
mot
ivat
ii
£••Sc«
§O3
1
1
crtO
feU
.S
1oG
1!
^13T3Og
3B
1l l
PH
ii"S
1S
is'•§H
Bu
I
p
Va.**
p
Va.*
o
Va.
JOB INSECURITY AND EMPLOYEE SAFETY 157
Limitations and Future Directions
Although the proposed model of job insecurity andsafety was supported in the cross-sectional and lon-gitudinal analyses, there are several limitations thatshould be noted. First, these results can only providetentative support for the hypothesized directionalityof the model. Establishing a link between the Time Ipredictor and the Time II criterion does not neces-sarily establish causality because the link could occurthrough the Time II predictor. Stronger statementsregarding causality can only be made through thecollection of quasi-experimental or experimentaldata. Although experimental data on the effects of jobinsecurity on safety outcomes would be fairly diffi-cult and possibly unethical to collect in the field, suchdata could conceivably be collected in the laboratory.This multimethod approach would provide evenstronger support for this model. The external validityof this model could also be enhanced through thecollection of data in populations other than the food-processing industry in which safety is a primaryconcern.
In addition, although it seems clear that there is alink between job insecurity and safely outcomes, theexact nature of the effects of safety knowledge andmotivation on injuries and accidents warrants furtherstudy. In particular, it is unclear whether safety mo-tivation and knowledge have direct effects on work-place injuries and accidents or if these effects aremediated through safety compliance. The tests ofalternative models seem to suggest that safety moti-vation and knowledge have direct effects on work-place injuries (in the Time I dataset) and that safetymotivation has both direct and indirect effects(through compliance) on injuries and accidents in theTime II dataset.
One parsimonious explanation for these equivocalresults may be that the measure of compliance wasfaulty. Recall that compliance was measured by oneitem at Time I and two items at Time II. Single-itemmeasures have unknown reliability, and it is difficultto make judgments about their psychometric proper-ties. In general, future research should use a moreestablished and better validated measure of thisconstruct.
Future research should also strive to move beyondthe realm of single-source self-report data by gather-ing independent- or multiple-source data on severalof the variables of interest. Self-report data raiseconcerns about the possible operation of single-source bias as an alternative explanation to the sub-stantive findings. Although this is a limitation of the
present study, a perusal of the zero-order correlationcoefficients does not point to consistently high coef-ficients as would be expected if such a bias washaving a strong impact on the data. In addition,similar findings across the two cross-sectional andone longitudinal datasets offset some of this concern.Nevertheless, using archival data on accidents, inju-ries, and safety violations in conjunction with self-report measures may be preferable, as research sug-gests that the accurate recall of workplace accidentsmay only extend back 4 weeks (Landen & Hendricks,1995).
Conclusion
Up until this point, research on the consequencesof job insecurity and research on the antecedents ofemployee workplace safety have largely proceededindependently of each other. Job insecurity researchhas primarily focused on attitudinal, behavioral, andmental health outcomes, largely ignoring the poten-tial impact on safety. Similarly, research in the areaof workplace safety has largely focused on ergo-nomic factors and personnel selection and training asprimary antecedents of safety, thus ignoring the po-tential role of job insecurity. This research was a firstattempt to unite these disparate fields by developingand testing a model linking job insecurity to safetymotivation, compliance, and workplace injuries andaccidents.
References
American Management Association. (1997). Corporate jobcreation, job elimination, and downsizing. New York:Author.
Anderson, J., & Gerbing, D. (1988). Structural equationmodeling in practice: A review and recommended two-step approach. Psychological Bulletin, 103, 411-423.
Ashford, S., Lee, C., & Bobko, P. (1989). Content, causes,and consequences of job insecurity: A theory-based mea-sure and substantive test. Academy of Management Jour-nal, 32, 803-829.
Baron, R. M., & Kenny, D. A. (1986). The moderator-mediator variable distinction in social psychological re-search: Conceptual, strategic, and statistical consider-ations. Journal of Personality and Social Psychology, 51,1173-1182.
Barthol, R. P., & Ku, N. D. (1959). Regression under stressto first learned behavior. Journal of Abnormal and SocialPsychology, 59, 134-136.
Bentler, P. M., & Bonett, G. (1980). Significance tests andgoodness of fit in the analysis of covariance structures.Psychological Bulletin, 88, 588-606.
Brown, R. L., & Holmes, H. (1986). The use of a factor-analytic procedure for assessing the validity of an em-

158 PROBST AND BRUBAKER
ployee safety climate model. Accident Analysis and Pre-vention, 18, 455-470.
Cameron, K., Freeman, S. J., & Mishra, A. K. (1991). Bestpractices in white-collar downsizing: Managing contra-dictions. Academy of Management Executive, 5, 57-73.
Campbell, D., & Stanley, J. (1966). Experimental andquasi-experimental designs for research. Chicago: RandMcNally.
Campbell, J. P. (1992). Modeling the performance predic-tion problem in industrial and organizational psychology.In M. Dunnette & L. M. Hough (Eds.), Handbook ofindustrial and organizational psychology (2nd ed.. Vol.3, pp. 687-732). Palo Alto, CA: Consulting Psycholo-gists Press.
Davy, J., Kinicki, A., & Scheck, C. (1991). Developing andtesting a model of survivor responses to layoffs. Journalof Vocational Behavior, 38, 302-317.
Dedobbeleer, N., & Beland, F. (1991). A safety climatemeasure for construction sites. Journal of Safety Re-search, 22, 97-103.
Dekker, S. W., & Shaufeli, W. B. (1995). The effects of jobinsecurity on psychological health and withdrawal: Alongitudinal study. Australian Psychologist, 30, 57-63.
Dooley, D., Rook, K., & Catalano, R. (1987). Job andnon-job stressors and their moderators. Journal of Occu-pational Psychology, 60, 115-132.
Dunbar, E. (1993). The role of psychological stress andprior experience in the use of personal protective equip-ment. Journal of Safety Research, 24, 181-187.
Eysenck, M. W., & Calvo, M. G. (1992). Anxiety andperformance: The processing efficiency theory. Cogni-tion and Emotion, 6, 409-434.
Faverge, J. M. (1980). Le travail en tant qu' activite derecuperation [Troubleshooting as a part of job perfor-mance]. Bulletin de Psychologie, 33, 203-206.
Ferguson, J. L., McNally, M. S., & Both, R. F. (1984).Individual characteristics as predictors of accidental in-juries in naval personnel. Accident Analysis and Preven-tion, 16, 47-54.
Fishbein, M. (1979). A theory of reasoned action: Someapplications and implications. Nebraska Symposium onMotivation, 27, 65-116.
Fishbein, M., & Azjen, I. (1975). Belief, attitudes, inten-tions, and behavior: An introduction to theory and re-search. Boston: Addison-Wesley.
Fitzgerald, L. F., Drasgow, F., Hulin, C. L., Gelfand, M. J.,& Magley, V. J. (1997). Antecedents and consequencesof sexual harassment in organizations: A test of an inte-grated model. Journal of Applied Psychology, 82, 578-589.
Hanisch, K. (1992). The Job Descriptive Index revisited:Questions about the question mark. Journal of AppliedPsychology, 77, 377-382.
Hansen, C. P. (1989). A causal model of the relationshipamong accidents, biodata, personality, and cognitive fac-tors. Journal of Applied Psychology, 74, 81-90.
Hofmann, D. A., Jacobs, R., & Landy, F. (1995). Highreliability process industries: Individual, micro, andmacro organizational influences on safety performance.Journal of Safety Research, 26, 131—149.
Hofmann, D. A., & Morgeson, F. P. (1999). Safety-relatedbehavior as a social exchange: The role of perceivedorganizational support and leader-member exchange.Journal of Applied Psychology, 84, 286-296.
Hofmann, D. A., & Stetzer, A. (1996). A cross-level inves-tigation of factors influencing unsafe behaviors and ac-cidents. Personnel Psychology, 49, 307-339.
Hofmann, D. A., & Stetzer, A. (1998). The role of safetyclimate and communication in accident interpretation:Implication from negative events. Academy of Manage-ment Journal, 41, 644-657.
Janssens, M. J., Brett, J. M., & Smith, F. J. (1995). Confir-matory cross-cultural research: Testing the viability of acorporation-wide safety policy. Academy of ManagementJournal, 38, 364-382.
JOreskog, K. G., & Sorbom, D. (1993). L1SREL 8: User'sreference guide. Mooresville, IN: Scientific Software.
Kanfer, R., & Ackerman, P. L. (1989). Motivation andcognitive abilities: An integrative/aptitude-treatment in-teraction approach to skill acquisition. Journal of AppliedPsychology, 74, 657-690.
Kjellen, U. (1984). The deviation concept in occupationalaccident control. Accident Analysis and Prevention, 16,289-323.
Komaki, J. L., Collins, R. L., & Penn, P. (1982). The role ofperformance antecedents and consequences in work mo-tivation. Journal of Applied Psychology, 67, 334-340.
Kuhnert, K., Sims, R., & Lahey, M. (1989). The relationshipbetween job security and employees' health. Group andOrganization Studies, 14, 399-410.
Landen, D. D., & Hendricks, S. (1995). Effect of recall onreporting of at-work injuries. Public Health Reports, 110,350-354.
Landisberger, P. A., Cahill, J., & Schnall, P. (1999). Theimpact of lean production and related new systems ofwork organization on worker health. Journal of Occupa-tional Health Psychology, 4, 108-130.
Leigh, J. P. (1986). Individual and job characteristics aspredictors of industrial accidents. Accident Analysis andPrevention, 18, 209-216.
Leplat, J., & Rasmussen, J. (1984). Analysis of humanerrors in industrial incidents and accidents for improve-ment of work safety. Accident Analysis and Prevention,16, 77-88.
Leveson, H., Hirschfeld, M. L., & Hirschfeld, A. H. (1980).Industrial accidents and recent life events. Journal ofOccupational Medicine, 22, 53—57.
Lusk, S., Ronis, D., & Baer, L. (1995). A comparison ofmultiple indicators: Observations, supervisor report, andself-report measures of worker's hearing protection use.Evaluation and the Health Professions, 18(1), 51—63.
Mandler, G. (1982). Stress and thought process. In L. Gold-berger & S. Breznitz (Eds.), Handbook of stress (pp.88-104). New York: Free Press.
Melamed, S., Luz, J., Najenson, T., Jucha, E., & Green, M.(1989). Ergonomic stress levels, personal characteristics,accident occurrence, and sickness absence among factoryworkers. Ergonomics, 32, 1101-1110.
Mulaik, S. A., James, L. R., Van Alstine, J., Bennett, N.,Lind, S., & Stilwell, C. D. (1989). Evaluation of good-ness-of-fit indices for structural equations models. Psy-chological Bulletin, 105, 430-445.
Neal, A., Griffin, M. A., & Hart, P. M. (2000). The impactof organizational climate on safety climate and individualbehavior. Safety Science, 34, 99-109.
Neter, J., Wasserman, W., & Kutner, M. H. (1990). Appliedlinear statistical models. Homewood, IL: Irwin.
Probst, T. M. (1999). Antecedents and consequences of job

JOB INSECURITY AND EMPLOYEE SAFETY 159
insecurity: Development and test of an integrated model(Doctoral dissertation, University of Illinois at Urbana-Champaign, 1998). Dissertation Abstracts International,6102.
Probst, T. M. (2000). Wedded to the job: Moderating effectsof job involvement on the consequences of job insecurity.Journal of Occupational Health Psychology, 5, 63—73.
Roskies, E., & Louis-Guerin, C. (1990). Job insecurity inmanagers: Antecedents and consequences. Journal ofOrganizational Behavior, 11, 345-359.
Sanders, G. S., & Baron, R. S. (1975). The motivatingeffects of distraction on task performance. Journal ofPersonality and Social Psychology, 32, 956-963.
Simard, M., & Marchand, A. (1997). Workgroups' propen-sity to comply with safety rules: The influence of micro-macro organisational factors. Ergonomics, 40, 172-188.
Simons, J. (1998, November 18). Despite low unemploy-ment, layoffs soar—corporate mergers and overseas tur-moil are cited as causes. The Wall Street Journal, p. A2.
Slappendal, C., Laird, I., Kawachi, I., Marshall, S., & Cryer,C. (1993). Factors affecting work-related injury amongforestry workers: A review. Journal of Safety Research,24, 19-32.
Smecko, T., & Hayes, B. (1999, April). Measuring compli-ance with safety behaviors at work. Paper presented atthe 14th annual conference of the Society for Industrialand Organizational Psychology, Atlanta, GA.
Smith, P. C., Kendall, L., & Hulin, C. L. (1969). Themeasurement of satisfaction in work and retirement. Chi-cago: Rand McNally.
Thompson, R. C., Hilton, T. F., & Witt, L. A. (1998). Wherethe safety rubber meets the shop floor: A confirmatorymodel of management influence on workplace safety.Journal of Safety Research, 29(1), 15-24.
Vroom, V. H. (1964). Work and motivation. New York:Wiley.
Wickens, C. D. (1992). Engineering psychology and humanperformance. New York: Harper Collins.
Zohar, D. (1980). Safety climate in industrial organizations:Theoretical and applied implications. Journal of AppliedPsychology, 65, 96-102.
Received January 11, 2000Revision received October 5, 2000
Accepted November 13, 2000 •
ORDER FORMStart my 2001 subscription toJournal of Occupational HealthPsychology! ISSN: 1076-8998
_ $32.00, APA Member/Affiliate_ $40.00, Individual Nonmember_ $92.00, Institution
TOTAL AMOUNT ENCLOSED
Subscription orders must be prepaid. (Subscriptions are ona calendar basis only.) Allow 4-6 weeks for delivery of thefirst issue. Call for international subscription rates.
SEND THIS ORDER FORM TO:Educational Publishing Foundationc/o APA, Subscriptions750 First Street, NEWashington, DC 20002-4242
Or call (800) 374-2721, fax (202) 336-5568.TDD/TTY (202)336-6123. Email: [email protected]
Send me a Free Sample Issue Q
Q Check Enclosed (make payable to EPF/APA)
Chargemy: Q VISAQMasteKinl Q American ExpressCardholder NameCard No. Exp. date
Signature (Required for Charge)
Credit CardBilling AddressCity State Zip.Davtime PhoneSHIP TO:NameAddressCitv State ZipAPA Customer #
PLEASE DO NOT REMOVE - A PHOTOCOPY MAY BE USED