The Effect of Workforce Diversity on Employee Performance ...
27
_____________________________________________________________________________________________________ *Corresponding author: E-mail: [email protected]; Asian Journal of Economics, Business and Accounting 8(1): 1-27, 2018; Article no.AJEBA.43760 ISSN: 2456-639X The Effect of Workforce Diversity on Employee Performance (The Case of Ethio-Telecom South West Addis Ababa Zone) Amdemicheal Berhanu Kerga 1* and Abdilgelil Asefa 2 1 Department of Management, Wolkite University, Ethiopia. 2 Ethio Life Insurance Company, Ethiopia. Authors’ contributions This work was carried out in collaboration between both authors. Author ABK designed the study, performed the statistical analysis, wrote the protocol and the manuscript. Author AA wrote the first draft of the managed the analyses of the study, managed the literature searches. Both authors read and approved the final manuscript. Article Information DOI: 10.9734/AJEBA/2018/43760 Editor(s): (1) Dr. Fang Xiang, International Business School, University of International and Business Economics, China. (2) Dr. Chan Sok Gee, Professor, Department of Finance and Banking, Faculty of Business and Accountancy, University of Malaya, 50603 Kuala Lumpur, Malaysia. Reviewers: (1) SrinivasaRao Kasisomayajula, Madanapalle Institute of Technology and Science, India. (2) A. S. Sajuyigbe, National Open University, Nigeria. (3) Pius Kiongo, Kenyatta University, Kenya. (4) Lawrence Okoye, University of Maiduguri, Nigeria. Complete Peer review History: http://www.sciencedomain.org/review-history/26308 Received 23 June 2018 Accepted 08 September 2018 Published 21 September 2018 ABSTRACT The value of diversity at the workplace is becoming a key business consideration for most organizations. Close and continuous attention to the issues of workforce diversity is important because it can be one of the major sources of competitive advantage. However, there were limited research works was conducted on the topic area especially in the Ethiopian context and in Ethio- telecom. Therefore, the objective of this study was to investigate the effect of workforce diversity i.e. age, gender, ethnicity, education background, work experience and marital status on employee performance in the case of Ethio-telecom south-west Addis Ababa zone. The study reviews the theoretical and empirical literature and develops a conceptual framework. When we come to the methodology the study takes descriptive research design and used cluster sampling technique with Original Research Article
Transcript of The Effect of Workforce Diversity on Employee Performance ...

_____________________________________________________________________________________________________ *Corresponding author: E-mail: [email protected];
Asian Journal of Economics, Business and Accounting 8(1): 1-27, 2018; Article no.AJEBA.43760 ISSN: 2456-639X
The Effect of Workforce Diversity on Employee Performance (The Case of Ethio-Telecom South
West Addis Ababa Zone)
Amdemicheal Berhanu Kerga1* and Abdilgelil Asefa2
1Department of Management, Wolkite University, Ethiopia.
2Ethio Life Insurance Company, Ethiopia.
Authors’ contributions
This work was carried out in collaboration between both authors. Author ABK designed the study, performed the statistical analysis, wrote the protocol and the manuscript. Author AA wrote the first
draft of the managed the analyses of the study, managed the literature searches. Both authors read and approved the final manuscript.
Article Information
DOI: 10.9734/AJEBA/2018/43760
Editor(s): (1) Dr. Fang Xiang, International Business School, University of International and Business Economics, China.
(2) Dr. Chan Sok Gee, Professor, Department of Finance and Banking, Faculty of Business and Accountancy, University of Malaya, 50603 Kuala Lumpur, Malaysia.
Reviewers: (1) SrinivasaRao Kasisomayajula, Madanapalle Institute of Technology and Science, India.
(2) A. S. Sajuyigbe, National Open University, Nigeria. (3) Pius Kiongo, Kenyatta University, Kenya.
(4) Lawrence Okoye, University of Maiduguri, Nigeria. Complete Peer review History: http://www.sciencedomain.org/review-history/26308
Received 23 June 2018 Accepted 08 September 2018 Published 21 September 2018
ABSTRACT The value of diversity at the workplace is becoming a key business consideration for most organizations. Close and continuous attention to the issues of workforce diversity is important because it can be one of the major sources of competitive advantage. However, there were limited research works was conducted on the topic area especially in the Ethiopian context and in Ethio-telecom. Therefore, the objective of this study was to investigate the effect of workforce diversity i.e. age, gender, ethnicity, education background, work experience and marital status on employee performance in the case of Ethio-telecom south-west Addis Ababa zone. The study reviews the theoretical and empirical literature and develops a conceptual framework. When we come to the methodology the study takes descriptive research design and used cluster sampling technique with
Original Research Article

Kerga and Asefa; AJEBA, 8(1): 1-27, 2018; Article no.AJEBA.43760
2
probability proportional to the cluster size. The researchers are used Primary data for the study was collected from 74 (seventy-four) respondents through a structured questionnaire and analyzed it through descriptive and explanatory research design using software package for social science (SPSS). Statistical techniques such as mean, standard deviation, correlation, regression and analysis of variance were employed in data analysis and the finding shows that there is a positive relationship between all independent variables and dependent variable. Whereas, the only ethnicity has significant to explain employee performance by 28.7% while others are insignificant to predict employee performance. Based on the findings of the study the researcher forwards the following points as a recommendation, Thus, Ethio-telecom should understand how to manage the diverse workforce in ethnicity where it can increase the advantage of such diversity and Ethio-telecom should give a chance to employees to learn more skills through course and training so as to improve their performance.
Keywords: Diversity; gender; age; ethnicity; work experience; marital status and educational
background; employee performance; Ethio-telecom. 1. INTRODUCTION
The content of this chapter includes the background of the study, statement of the problem, objective, significance, scope, limitation, operational definition and organization of the study.
1.1 Background of the Study
The world’s increasing globalization requires more interaction among people from diverse cultures, beliefs, and backgrounds than ever before. People no longer live and work in an insular marketplace; they are now part of a worldwide economy with competition coming from nearly every continent. For this reason, profit and non-profit organizations need diversity to become more creative and open to change [1].
Recently innovative advancements and the appearance of a worldwide economy brought the general population of the globe more and more closely to one another. Due to this increasing globalization, most of the organizations, educational institutions, small and large scale firm and different associations are examining and attempting to discover distinctive approaches to better serve their constituents. This integrates that one breaks through is having the capacity to draw in and hold the best and most qualified diverse workforce. Organizations that can take the activity to create and utilize significant strategies and approaches to doing this will have a reasonable advantage to build their competence [2].
The value of diversity at the workplace is becoming a key business consideration for most organizations. Close and continuous attention to
the issues of workforce diversity is important because it can be a major source of competitive advantage. It can also be a source of organizational conflict leading to poor employee relations. Workforce diversity issues may also adversely affect an organization’s public reputation, competitiveness and can significantly threaten the bottom line [3]. Diversity in the workplace may result in deficient communication and conflict if employers fail to manage it. Many organizations observe gender, ethnicity, and education background as the most commonly diversified demographic variables among its workforce. To be effective, organizations need to motivate employees towards more contributing to building the organization. Employees must be aware of and get the most out of the diversity of the workforce. Understanding how to interact and work with people from diverse backgrounds is even more crucial than just bringing them into the workforce [4]. Managers within organizations are primarily responsible for the success of diversity policies because they must ensure that the policies are effective. Instead of treating every employee alike in recognizing and responding to those differences, it is a way to ensure employee retention and greater productivity. The most important issues of workforce diversity are to address the problems of discrimination. When diversity is not realized properly, there may be a potential for higher turnover, difficult in communication and interpersonal conflicts which in turn affect employee performance. Overall, it may have an adversarial to an organization’s performance, profitability and reputation [5].

Kerga and Asefa; AJEBA, 8(1): 1-27, 2018; Article no.AJEBA.43760
3
Workforce diversity refers to organizations that are becoming more heterogeneous with the mix of people in terms of gender, disabilities, age, race, and education background. The leading sources of diversity comprise age, gender, ethnicity and educational background [6]. Moreover, many more sources of diversity are there like personal demographics; skills, experience, knowledge, marital status, abilities, values, beliefs and outlooks, personality and cognitive and interactive style of an individual. Currently, with the expanding propensity of diversity in the workforce, the organizations should look forward to the development of their perspectives and use inventive strategies and creative policies to become profitable [2]. Although the relationship between workforce diversity and employee performance in the private commercial companies has been fairly well studied and documented especially in developed countries, the issue has not received adequate attention in the case of public organizations, particularly those located in the Developing World [7]. Peteraf [8] stated in his study on the impact of workforce diversity on organizational effectiveness in selected banks of Tigray region of Ethiopia that very few researches were conducted in the African continent and some of them fall in short of a comprehensive examination of workforce diversity variables. The study also indicates that business organizations in the developed and developing countries are all caught up in the globalization web, which has indicated increased demographic diversity in the workforce and this phenomenon is one of the most challenging human resource and organizational issue. Academicians and practitioners have sought to understand the impact of diversity and its management on organizational success. Moreover, Organization culture, human resource practices, nature of work and business strategy of individual firms are different from each other and the differences are likely to mask the impact of variables on the employee performance in one firm with that observed in another firm [9]. Accordingly, to add some additional knowledge in the study area beyond the existed works, from those numerous workforce diversity variables which can affect employee performance the most critical variables (stated by many researchers and authors) among all others such as gender, age, ethnicity, educational background, work
experience and marital status of employees were used, the study is based on social categorization theory. Therefore, this study was conducted with a focus on examining the effect of workforce diversity on employee performance at Ethio- telecom south-west Addis Ababa zone.
1.2 Statement of Problem The growing diverse work force in organizations has lead scholars to pay increased attention to the issues of workforce diversity in the past twenty years [1]. In the contemporary environment, the general consensus is that organizations that capitalize on diversity are likely to perform better than organizations without the advantages that diversity brings [10]. Diverse workforce ensures a high level of performance for human and intellectual capital and provides business organizations with a competitive advantage in their expanded markets [11]. Manpower diversity is a great challenge for organizations. There are big differences among employees in various companies and there is no one method that can be the best to treat them all [12]. Moreover, diversity is more conducive to performance in the service industry where firm members come into contact with customers who prefer to be served and interact with similar others, than in the manufacturing industry [13]. There are limited research works on the effect of workforce diversity on employee performance and many were revealed workforce diversity has a significant effect on employee performance while others found an insignificant effect. The findings of the study by [14] to determine the effect of Gender, Age, Ethnicity and Educational background on employee performance presents 83.5% of employee performance was explained by the four independent variables [15] study on the difference between Employees Marital Status and Performance Level in IT Industry also reveals that there was a significant level difference between marital status and performance of employee. [16] on their study titled “Education and Work-Experience Influence on the Performance”, concludes that both variables have their respective direct influence on the performance of the workers. Moreover, according to Elsaid [17] study on “The effects of cross cultural work force diversity on employee performance” in Egyptian pharmaceutical organizations, gender, age and
Kerga and Asefa; AJEBA, 8(1): 1-27, 2018; Article no.AJEBA.43760
4
educational background explain 20.7% of the variation in employee performance, but only gender and education background are significant in explaining the variance, while age does not. The study conducted by Assefa [18] on “The effect of workforce diversity towards employee performance” in Total Ethiopia S.C. shows, gender, age, ethnicity and education background explain 21.1% of the variation in employee performance, leaving 78.9% to other variables. The study by Gitonga et al. [3] reveals age, gender, work experience and culture have significantly influence the performance of organizations with specific reference to telecommunication firms in Kenya. Consequently, all studies indicated above are tried to know the effect of workforce diversity on employee performance with respect to limited diversity variables (maximum of four), various business nature, diverse socio-economic factors, different human resource availability, and varied scope and finally got different result. Thus, despite all the effect workforce diversity can have over employee performance in an organization in Ethiopia particularly in Ethio-telecom as a service sector with high customer-employee contact and those employees are the main interface of Ethio- telecom that play crucial role to delight customers (around 60 million various customers) and serve as a key source of employee performance which in turn touch organizational goals and objectives, almost no research has been conducted on the study area. Therefore, this study was required to provide potential points to fill the gap in literature through investigating the effect of workforce diversity variables such as gender, age, ethnicity, education background, work experience and marital status on employee performance of Ethio telecom South West Addis Ababa Zone. Thus, this study tried to answer the following basic research questions:
1. Does gender diversity have effect on employee performance?
2. How age diversity has effect on employee performance?
3. Is there any relationship between ethnicity and employee performance?
4. Does work experience diversity effect on employee performance?
5. Does educational background diversity effect on employee performance?
6. What is the effect of marital status diversity on employee performance?
1.3 Research Objective The general objective of the study was to investigate the effect of workforce diversity on employee performance. In addition to the general objective, the study had the following specific objectives:
1. To investigate the effect of gender diversity on employee performance.
2. To investigate the effect of age diversity on employee performance.
3. To investigate the effect of ethnicity diversity on employee performance.
4. To investigate the effect of work experience diversity on employee performance
5. To investigate the effect of educational background diversity on employee performance.
6. To investigate the effect of marital status diversity on employee performance.
1.4 Significance of the Study The optimum outcome of this study has to benefit Ethio-telecom through providing potential points to the managements and workers from different backgrounds that enable to distinguish the dimensions of workforce diversity variables to improve employee work performance as well as to access the value of workforce diversity in their organization. The study also adds a piece of information (especially in service sectors) to the current knowledge regarding the study area. finally, the study serves as a reference for other researchers who intend to conduct similar studies concerning the research topic in the future. 1.5 Scope of the Study This study was conducted just for the purpose to investigate the effect of workforce diversity on employee performance in the case of Ethio telecom South West Addis Ababa zone. Thus, the study only focused on the variables of workforce diversity beyond age, gender, marital status, work experience, ethnicity, and educational background. The scope also delimited to the data that obtained from only sample representative employees of Ethio Telecom south-west Addis Ababa zone office and nine shops under its jurisdiction, where the year 2017/18 was the study period.

Kerga and Asefa; AJEBA, 8(1): 1-27, 2018; Article no.AJEBA.43760
5
1.6 Limitations of Study None of the studies can go beyond the boundary of some limitations and this study was also not an exception. One of the limitations during the process of completing this study was eliminating the respondents` bias during the filling of the questionnaire. The effects of other extraneous variables (other independent variables that are not the purpose of this study) take a limitation in the absence of effective control mechanisms. In addition, the focus of the study was on a single zonal office of Ethio telecom and thus the findings of the study where confound to the zone and by the specific variables effect.
1.7 Operational Definition Diversity: The condition of having or being composed of differing elements: especially the inclusion of different types of people (as people of different age, gender, marital status, work experience, educational background and ethnicity) in an organization [10]. Ethnicity: Pertaining to or characteristic of a people, sharing a common and distinctive culture, religion, language, or the like [10]. Employee Performance: Self-perceived performance of an employee in doing their day to day activities [10].
1.8 Organization of the Study This research paper has been structured in the following five chapters. The study starts with an introduction, which includes: Background of the study, statement of the problem, objective, significance, scope, operational definition and organization of the study of the study part. The second and third chapter discusses the review of related literature and research methodology. The fourth chapter dealt with the research analysis with its discussion part. The last chapter points out the essential summary of the research finding, conclusion and recommendation.
2. REVIEW OF RELATED LITERATURE 2.1 Introduction Under this section of the paper, it tried to describe the reviewed literature on the area, empirical reviews and conceptual frame work
related to workforce diversity variables and their effects on employee performance in various organizations, the review of Journals and articles. 2.2 Theoretical Review 2.2.1 Social categorization theory Social-categorization theory suggests that people belong to many different social groups (e.g. nation, employer, or school). It predicts that individuals sort themselves into identity groups based upon noticeable characteristics and that they act in concert with their categories and favor contexts that affirm group identity. In consequence, dissimilar individuals are less likely to collaborate with one another compared to similar individuals. In this way, social categorization may disrupt elaboration of task-relevant information because of possible biases towards in-group members and negative biases towards out-group members. This is a theory of the self, group processes, and social cognition [19] which emerged from research on social identity theory. It is concerned with variation in self-categorization in the level, content and meaning of self-categories. It focuses on the distinction between personal and social identity. Social-categorization theory seeks to show how the emergent, higher-order processes of group behavior can be explained in terms of a shift in self-perception from self-categorization in terms of personal identity to self-categorization in terms of social identity. Thus employees in an organization may sort themselves in social categories of particular age, gender and ethnicity group. This may influence their group behavior as well as responses to the micro and macroeconomic environment which in-turn affect their performance. 2.2.2 Similarity/ attraction theory Similarity/attraction theory suggests that peoples like and attracted to others who are similar, rather than dissimilar, to themselves. Social scientific research has provided considerable support for tenets of the theory since the mid-1900s. The theory provides an explanatory and predictive framework for examining how and why people are attracted to and influenced by others in their social worlds. In addition to people’s inclinations to be attracted to those who share similar attitudes, people are also attracted to

Kerga and Asefa; AJEBA, 8(1): 1-27, 2018; Article no.AJEBA.43760
6
others who manifest personality characteristics that are similar to their own [20]. Various researchers from a variety of fields such as marketing, political science, social psychology, and sociology have supported the assumptions of similarity/attraction theory. The argument is that people of similar religious background, ethnicity, age group and gender may tend to prefer to work together due to their common characteristics thus enhancing group cohesiveness and performance. In addition, interactions that may be perceived to be discriminatory on the basis of religion, ethnicity, age and gender may lead to harmful and negative effects on team cohesiveness [21]. 2.2.3 Resource based view theory Resource Based View (RBV) theory views organizations as consisting of a variety of resources generally including four categories; physical capital, financial capital, human capital, and corporate capital. The attributes of resources held by firms can contribute and determine their level of performance. Resources that allow a firm to implement its strategies are viewed as valuable and can be a source of competitive parity [22]. Resources that are viewed as valuable and rare can be a source of competitive advantage. Those that are valuable, rare and inimitable can be a source of sustained competitive advantage. Moreover, to achieve a sustained competitive advantage, a firm need to have the ability to fully exploit the potential and stock of its valuable, rare and inimitable resources. Such ability and potential often reside in the diverse characteristics of its workforce. [20]. The resource-based view (RBV) as a basis for the competitive advantage of a firm lies primarily in the application of a bundle of valuable tangible or intangible resources at the firm's disposal. To transform a short-run competitive advantage into a sustained competitive advantage requires that the resources are heterogeneous in nature and not perfectly mobile [8]. Effectively, this translates into valuable resources that are neither perfectly imitable nor substitutable without great effort. (Barney 1991). If these conditions hold, the bundle of resources can sustain the firms above-average returns. Notably, employees of different age, gender and ethnicity groups may be endowed with different capabilities and are viewed as resources that if
well appropriated, can enhance employee and organizational performance.
2.3 Empirical Review 2.3.1 Ethnic diversity and employee
performance
A study conducted by Mwatumwa et al.[10]) on the effect of workforce diversity on employee work performance had been evident that ethnicity has no significant effect on work performance at the studied area of country government of Mombasa. Employees are found to be ethnically harmonious. The study further shows over 85% of the respondents feel that ethnic differences in work groups never encourage conflict. However, even though there is harmony, ethnicity has not seemed to have any significant contributory effect, negatively or positively on work performance.
Based on research by Opstal [23], ethnic diversity can affect organizations positively or negatively. Nonetheless, organizations should understand how to manage their diverse workforce where it can increase the pros of such diversity and eliminate its cons. Further, diversity management is essential for organizations to maximize these advantages and minimize its disadvantages that may negatively affect organizational performance.
There is a positive significant association between ethnic diversity and employee performance in the banking industry [24]. From the finding of the study, members of the minority group can experience less job satisfaction, lack of commitment, problems with identity, perceived discrimination among others. The study also reveals that Customs, cultures, and values, languages and tribe influence employee performance in the banking industry [24]. Moreover, statistically, there is a significant effect of ethnicity toward employee performance [4]. 2.3.2 Age diversity and employee
performance The concept of diversity has been expanded and people start recognizing in addition to appreciating demographic variances and how it affects the working relationship between employees toward their performance [13]. The researcher confirmed that gender diversity had positive effects toward productive group operations and procedures were boosted

Kerga and Asefa; AJEBA, 8(1): 1-27, 2018; Article no.AJEBA.43760
7
through diversity- focused human resources practices. Age-diverse workforces display a host of different knowledge, values, perspectives, interpretations and preferences that are prerequisites for innovation. Moreover, younger managers are more likely to have greater learning capabilities, are more recently educated, and thus are more likely to be more risk-taking, flexible, and innovative. A combination of young and old partners of workers with different knowledge pools can, therefore, increase innovation as compared to having homogeneous workers (Winnie 2008). However, according to Kyalo and Gachunga [24], there is a weak negative and insignificant relationship between age diversity and employee performance. The inclusion of all age groups also influences employee performance. The young generation people are viewed as too proud and ambitious while the old people are viewed as people who have experienced and possess better problem solving [24]. A study which examines whether employee engagement moderates the relationship between workforce diversity and organizational performance by Gitonga et al. [3] states, young employees can be more creative, learn faster and can drive innovation in an organization as compared with older employees leading to high organization performance more so in the area of technological innovations. Due to their different way of socialization and exposure, they can easily embrace change that drives innovation and organizational performance. Age of employees may also influence their level of commitment and engagement with the organization. Certain employees approaching their retirement age may unconsciously begin to disengage from the organizations they work for as they begin to prepare for their retirement. They may constantly absent themselves from work or report late to work. Old employees may also spend more time seeing doctors due to age related illnesses as opposed to younger employees. This, in essence, could affect their individual contributions to their work performance and subsequently the overall performance of the organization. Gellner and Veen [25] found that age heterogeneity on its own has a negative effect on individual productivity. Moreover, in the case of routine tasks, there are no substantial gains from age heterogeneity that could offset the increasing
costs resulting from greater age heterogeneity. Thus, in companies with routine types of work, increasing age heterogeneity overall leads to a decline in productivity. The researchers also stated that the older and younger employees must come together to form coherent and viable corporate culture. These values possessed by different age groups can complement each other in companies and it tends to achieve better firm performance. From previous studies, it is possible to say that there is a significant relationship between age and performance of the employee. 2.3.3 Gender diversity and employee
performance The increase in workforce gender diversity in work place has attracted the attention of researchers. Empirical research has found inconsistent results suggesting that gender diversity can be either good or bad for businesses. In the early 1990s, both scholars and practitioners were generally optimistic about the effects of workforce diversity on performance. However, theories and empirical research suggest that diversity can lead to either positive or negative outcomes. The study shows that moderate level of gender diversity has increased competitive advantage while a higher level of gender diversity in organizations has a negative impact on organizational performance [1]. The findings of Gellner and Veen [25] and some other researchers showed that gender group and employee performance is positively linked. Based on the information provided in the research the overall feeling is that, for the most part, gender was not an area of concern. All divisions of the company must meet annual targets for the representation of majority and minority males and females in each employee grade level [26]. According to Childs [10], it is evident that gender diversity is well encouraged. A performance criterion for success at work is equally expected to be higher for female as well as for male employees. The study also shows that there is no discrimination during hiring and recruitment process on a gender basis. The researcher further states that, women are given the opportunity to work in positions that utilize their skills, education and training, employees are given fair treatment throughout, and attract and hire employees enormously and that whether male or female. Gitonga [3] state there is a

Kerga and Asefa; AJEBA, 8(1): 1-27, 2018; Article no.AJEBA.43760
8
positive association between gender diversity and employee performance. Gender equality, male female ratio, fair treatment and gender consideration in hiring and promotion influence employee performance. Further, most of the organization opportunities for growth and advancement exist for both men and women in their organization. The effect of gender diversity on company performance is the most studied type of diversity because there are different countries that gender quota is introduced. It is important to study the relationship between gender diversity and company performance because then the effect of the gender quota will be known. There is no consistent relationship between gender diversity and company performance found. Most of the research done in the US even in his study in the same country, find different relationships [4] found a significant relationship between diversity and group operations, but the nature of the relationship connected with diversity among gender groups. Assuring the same point that gender diversity increased constructive group operations and performance. Therefore, most of the literature show that there is a significance relationship between gender diversity and performance of the organization. 2.3.4 Education background and employee
performance According to Tracy and David (2011), organizations commonly reject employing people whose training, experience or education is judged to be inadequate. They argued that, educational background is important to employees and that employees cannot find a job and perform well without adequate educational background. There is significantly positive and slight, almost negligible relationship between education background group and employee performance. Different education types or a more balance in the education types a firm possesses would increase the likelihood of having an innovation. Variation in education levels and backgrounds can lead to wider awareness and knowledge since it promotes mutual learning with a wider range of intellectual skills [4]. Mwatumwa et al. [10] state that educational backgrounds have no significant effect on work performance. Although educational background appears very crucial since it forms the basis for the recruitment plan in the study, low educational qualifications have not affected the esteem of
lower workers because opportunities for growth and advancement exists for all employees regardless of their educational background. The study further shows that the difference in the educational background has not brought conflict among the employees. According to Mkoji and Sikalieh [7] a study conducted in kenya banking industry on Effect of diversity in the workplace on employee performance, most of the staff working in the banking industry in Kenya had a university education. Employers commonly employ staff whose training, experience, or education is adequate in offering financial services to customers. The study also established that education diversity influences an employee’s performance in the banking industry in Kenya and finally concludes that there a positive significant relationship between education diversity and employee performance in the banking industry in Kenya. Further, the level of education, training attended and skills and competence influence employee performance positively. The recruitment plan for most of the banks in Kenya is based on the education diversity of the employees [3] According to Eduard [27], employees who are less educated are likely to suffer an inferiority complex, which to a large measure may affect their performance. He argued that such employees might develop a persistent feeling of being inferior. Such employees end up feeling socially insecure and they become less confident at work. He concluded that the lack of confidence would greatly impair their performance and could even make them develop a negative attitude toward other employees and the entire organization. Thus, most of the literature observed that there is a significance relationship between educational background and employee performance. 2.3.5 Work experience and employee
performance The results of the study by Quinones et al. [28] reveals that the relationship between work experience and job performance is positive regardless of the work experience measure used. The relationship is stronger when hard performance measures such as work samples are used as compared to soft performance measures such as supervisory ratings. Further, the study shows some variation in the relationship between work experience and job
Kerga and Asefa; AJEBA, 8(1): 1-27, 2018; Article no.AJEBA.43760
9
performance as a function of measurement mode. The strongest relationship occurs between amounts of experience and performance. Time and type measure shows the weakest relationships. Finally, variability in the relationship between experience and performance as a function of level of specificity is found. Task level experience has the strongest relationship with performance whereas organizational level shows the weakest. Van [29] states that “In ancestral environments, some situations required the possession of unique and specialized knowledge, for example, where to find a waterhole that has not yet dried up. Knowledge about where to go would have been more likely to be held by older or experienced individuals” and thus experience will make a person perform better and hence dependable. In the present time, evidence for this link between knowledge, experience and performance can still be found in professions that require a considerable amount of specialized knowledge and experience, such as in science, politics, and arts [29]. According Elsaid [16] study on Education and Work-Experience Influence on the Performance, the performance of the employees gradually increases with their experience and after an experience of 20 years the performance is again getting lower. With growing experience in a job, the employees learn almost all the knacks concerned with the job and nothing much remains to the learned. In the early stages of doing a job, there are many things to learn and individuals are curious about things and they will show interest in the job. But, when everything has been explored, repeating the same job, again and again, gives the sense of boredom in the minds of the employees and this might effect on their performance negatively. Due to more involvement they lose interest in their jobs. This is just like the newly married couple showing more interest toward their spouse and later on the levels of interest will gradually decrease [16]. 2.3.6 Marital status and employee
performance A study on Difference between Employees Marital Status and Performance Level in IT Industry by Padmanabhan [15] states, there is a significant difference between marital status and performance of employees, which shows that unmarried employee can perform well than married employees since their commitment
towards their family and other circumstances are considerably less when compared to the married employees. On the contrary, in certain cases where married employees are forced to handle more stress and perform well than unmarried employees with respect to their promotions. Anyway both married and unmarried employees are treated and given the same level of work pressure that is to be done in an IT industry. The only place where the performance of a marital status of an employee differs depends on one’s capability in handling the situations and the distracting factors which an employee faces in workplace and family life [15]. Seung-min and Mustafa [30] have discussed in his thesis that the effects of marital status show that married officers achieved better performance than single officers this makes evident that there are differences in job performance between married and single employers. 2.3.7 Workforce diversity and employee
performance The data of the study by Alghazo and others showed that workforce diversity in age, and gender related positively to employee performance. Organization’s HRD should focus on diversity management and keep it in their development strategies in order to be locally and globally competitive since global economy requires form each company to empower their employees to be more creative, innovative, problem solvers [12]. While diversity is an acceptable phenomenon, its variables of ethnicity, gender and educational background do not portray significant effect on performance, positively nor negatively [10]. Elsaid [17] did a study on the Effects of Cross Cultural Work Force Diversity on Employee Performance in Egyptian Pharmaceutical Organizations. This study explores the impact of gender, age, and education diversity on employee performance in the Egyptian Pharmaceutical industry which is renowned to employ highly diversified workforce. The study sample was 300 middle level management positions. Data were collected via self-administered questionnaires methodology. The results indicated that only two variables, gender and education diversity, were significant in explaining the variance in employee performance when different work force work together, while surprisingly, age diversity does not.
Kerga and Asefa; AJEBA, 8(1): 1-27, 2018; Article no.AJEBA.43760
10
The paper studied by Elsaid [17] examines the way various elements of workforce diversity namely; age, gender, work experience and culture can significantly influence the performance of organizations with specific reference to telecommunication firms in Kenya. Workforce diversity has evolved to be a moral, social, and economic factor as well as a legal responsibility of employers. A workplace culture that supports diversity ensures that all people have the opportunity to compete for careers without being disadvantaged by the difference. Organizations with a positive workplace culture ensure a rich workforce mix that better reflects the community and takes advantage of the benefits a diverse workforce can bring. Organizations with a positive workplace culture create a workplace that accommodates and capitalizes on the needs, values and differences within their workforce [31]. One significant disadvantage of working with a diverse workforce are discrimination on the part of both managers and employees. It can exist but hidden aspect of a poorly managed workplace. When a worker is being discriminated, it affects his ability to perform well and it also affects the perception of equity and raises issues of litigation.
The study conducted by Assefa [18] tries to find the effect of workforce diversity towards employee performance in Total Ethiopia S.C. The Study adopted a descriptive and explanatory research design which consisted of all the staffs belong to Total Ethiopia S.C. with a sample size of 80 respondents using through questionnaire data collection method. The study reveals that gender; age, ethnicity and educational background are positively correlated and the strength of the relationship is small but definite relationship to employee performance. Based on the results, the overall effects of workforce diversity (gender, age, ethnicity and education background) towards employee performance in Total Ethiopia S.C is significant. [20] did a study on the effects of workplace diversity
management on organizational effectiveness in Kenya commercial bank limited. Specifically, the study sought to establish the extent of demographic diversity, extent of social-cultural diversity, the management of diversity at the bank branches and how the management of the workforce diversity affects organizational effectiveness. The finding show that although, there are deliberate efforts to capitalize on diversity, very little is being achieved and negative diversity are likely to affect organizational effectiveness, if not properly addressed. A combination of employees drawn from diverse cultures could bring to organization diverse experiences, attitudes, perspectives, approaches to work and different levels of commitment to work, thus influencing the overall performance of their organizations. Where there is perceived level of discrimination on the basis of culture, team performance may be adversely affected. It may further influence their level of engagement with the organization and subsequently the level of organizational performance. [3]. Thus, while most of the literature indicate that there is a significant relationship between workforce diversity and the performance of employee, some indicate that workforce diversity has no significant effect on employee performance but that doesn`t mean there is no relationship between them.
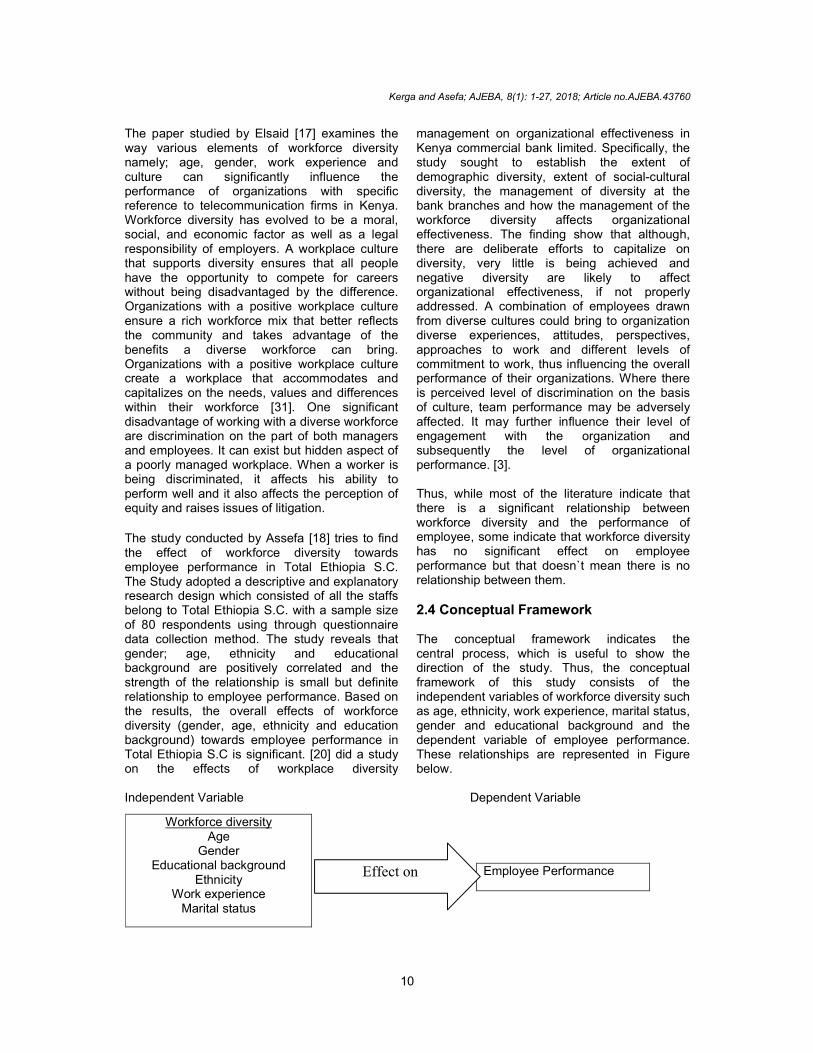
2.4 Conceptual Framework The conceptual framework indicates the central process, which is useful to show the direction of the study. Thus, the conceptual framework of this study consists of the independent variables of workforce diversity such as age, ethnicity, work experience, marital status, gender and educational background and the dependent variable of employee performance. These relationships are represented in Figure below.
Independent Variable Dependent Variable
Workforce diversity Age
Gender Educational background
Ethnicity Work experience
Marital status
Employee Performance Effect on

Kerga and Asefa; AJEBA, 8(1): 1-27, 2018; Article no.AJEBA.43760
11
3. RESEARCH METHODOLOGY
3.1 Introduction This chapter presents the methodology which indicates how the study was carried out. It describes the research design, the target population, sample size and sampling technique, data collection tools, data analysis method.
3.2 Research Design A research design is the arrangement of conditions for collection and analysis of data in a manner that aims to combine relevance to the research purpose with economy in procedure [26]. This research was conducted to investigate the effect of workforce diversity on performance of employee. Thus, descriptive and explanatory research designs were employed for data collection and data interpretation. Besides, some descriptive statistics (i.e., measure of central tendency), along with different inferential tools were used so as to elaborate the relationship and interactions between variables.
3.3 Target Population Population refers to an entire group of individuals, objectives or items from which the researcher wants information (Kothari 2004). Target population of this study were employees of Ethio Telecom South West Addis Ababa zone which include a round nine shops under it i.e. Wolkite Shop, Woliso Shop, Tulubolo Shop, Sebeta Shop, Ayer tena Shop, Keranio Shop, Mekanisa Shop, ketenahulet Shop, and Sarbet shop. Thus, the target population of the study became 466 permanent employees worked in all shops of Ethio-telecom south-west Addis Ababa zone. The following Table 3.1 shows the detail.
3.4 Sample Size and Sampling Technique
A sample is a small group of subjects drawn from the population in which researcher is interested in gaining information and drawing conclusions about the universe (Kothari 2004). As to the sample size determination, from among different methods, the one which has developed by Barney [20] was used. The method is presented in Table 3.2. As indicated above the population size of the study which was 466 be in a range from 281 -
500. According to Carvalho`s sample size determination from the total population of 466 employees under study 80 respondent employees were taken as a sample by taking in to account a high population size variance and the representativeness of taking high sample size was applied in accordance with the given population size. Table 3.1. Population size of each shop in the
zone
S.r no. Name of shop Number of employees
1 Wolkite shop 38 2 Woliso shop 24 3 Tulubolo Shop 12 4 Ayertena Shop 50 5 Sebeta Shop 65 6 Keranio Shop 17 7 Mekanisa Shop 54 8 ketenahulet Shop 8 9 Sarbet shop 198 Total 466 Source: From human resource department of Ethio
Telecom south west Addis Ababa zone
Table 3.2. Sample size determination
Population size
Sample size Low Medium High
51-90 5 13 20 91-150 8 20 32 151-280 13 32 50 281-500 20 50 80 501-1200 32 80 125 1201-3200 50 125 200 3021-10000 80 200 315 1001-35000 125 315 500 35001-150000 200 500 800
(Source: Daniel Tadesse, Service quality and customer satisfaction [12])
The study used cluster sampling technique to group each shop in their geographical area and the sample size under each shop was determined through sampling with probability proportional to the cluster size. The appropriate sampling interval was 5.825 (466 divided by 80), then to get the sample size of each shop divide each shop number of employee by the sampling interval 5.825 and round it to the nearest integer. Finally, to take sample respondents from each clustered shop the researcher used purposive sampling to select employees who have a particular characteristic which makes them suitable to the predefined purpose. Accordingly,

Kerga and Asefa; AJEBA, 8(1): 1-27, 2018; Article no.AJEBA.43760
12
the researcher was taken respondents from all clustered shop, depending upon the study workforce diversity variables.
3.5 Data Collection Tools
The data collection tools for the study were both primary and secondary sources. The primary data was collected through a structured questioner from sample respondent employees of Ethio telecom south-west Addis Ababa zone. Compared to constructing own questionnaire, accepting and modifying questions from other several related types of research well developed questionnaire ensure higher validity of the questions used to ask the targeted respondents. It is known that the higher the validity means the more accurate the measure could represent a concept. The secondary data was collected from relevant Ethio telecom website, previous researches, journals and articles.
3.6 Data Analysis Tools In the analysis part of the study, a substantial follows up and identification of respondents return and non-return on questionnaires and analysis was made to saw the actual collected
number of respondents. The numerical data were analyzed using SPSS (statistical packages for social science software program). The analytical tool was also supported using cross tabulation and percentage. Statistical techniques such as Mean, Standard deviation, correlation, linear and multiple regressions were employed in data analysis. The final results of the study were depicted using tables.
3.7 Reliability Test
Reliability analysis is very important in research and is widely used to measure the accuracy of the study. Reliability refers to which a measurement instrument is able to yield consistent result each time if it is applied under similar conditions. It is the constituent of a measurement device that causes it to yield similar outcome results for similar inputs. The questionnaire for the study was Pilot tested using the Cronbach alpha test using the alpha coefficient. The researcher distributed 30 sets of questionnaires to specific respondents and made easy modification on some of the items to improve clarity accordingly. Reliability of the questionnaire was tested through Statistical Package for Social Science (SPSS) software.
Table 3.3. Sample size of each shop
s.r no.
Name of shop Number of employees
Dividing each number of employee by sample interval of 6
Sample size
1 Wolkite 38 38 / 5.825 = 6.52 7
2 Woliso 24 24 / 5.825 = 4.12 4
3 Tulubolo 12 12 / 5.825 = 2.06 2
4 Ayertena 50 50 / 5.825 = 8.58 9
5 Sebeta 65 65 / 5.825 = 11.16 11
6 Keranio 17 17 / 5.825 = 2.92 3
7 Mekanisa 54 54 / 5.825 = 9.27 9
8 ketenahulet 8 8 / 5.825 = 1.37 1
9 Sarbet 198 198 / 5.825 = 33.99 34
Total 466 466 / 5.825 = 80 80 Source: researcher
Table 3.4. Reliability statistics
No. Constructs Coefficient alpha No. of item N
1 Gender .766 6 30
2 Age .811 5 30
3 Ethnicity .791 6 30
4 Educational Background .747 6 30
5 Work Experience .763 5 30
6 Marital Status .713 5 30
7 Employee performance .908 14 30 Source: Researcher survey generated by SPSS

Kerga and Asefa; AJEBA, 8(1): 1-27, 2018; Article no.AJEBA.43760
13
A reliability values of 7.0 to 0.80 and above were considered as good and accepted reliability by researchers [32]. It indicated that composite Cronbach’s Alpha was within acceptable range and each of workforce diversity variables has reliability coefficient greater than the standard and thus they were found reliable. In conclusion, the reliability coefficient (coefficient alpha) of all examined constructs in the questionnaire was acceptable. All the constructs show a Cronbach alpha more than 0.7 which signifies the consistency and reliability of the questionnaire. Therefore, the questionnaire was distributed to 80 targeted respondents.
3.8 Ethical Consideration and Consent
Before the research was conducted, the researcher informed the participants of the study about the objectives of the study, and was consciously consider ethical issues in seeking consent, avoiding deception, maintaining confidentiality, respecting the privacy, and protecting the anonymity of all respondents. A researcher must consider these points because the law of ethics on research condemns conducting a research without the consensus of the respondents for the above listed reasons.
4. Data Presentation, Analysis and Interpretation
4.1 Introduction This chapter present analyses and interpret the data get from respondents filled questionnaires including response rate, descriptive analysis, correlation and inferential analysis, of the study variables. The descriptive analyses summarize the specific respondent demographic profile and central tendency measurement of construct. Correlation analysis part of this chapter revealed the degree of association between the study variables. The inferential analysis of the study variables is also presented under this chapter.
4.2 Response Rate A total of 80 questionnaires were distributed to selected employees of south west Addis Ababa zone office and various shops under its jurisdiction. At the end of which 74 questionnaires, representing 92.50% were returned, the entire analysis given in this study was based on the actual returned questionnaires.
4.3 Descriptive Analysis
Under this section the research discussed the respondent background profile and central tendencies measurement of construct.
4.3.1 Respondents background profile
In the first section of the questionnaire survey, each respondent was asked six questions regarding their profile, including gender, age, ethnicity, education level, working experience (in years), and marital status. This part provided an analysis of the background characteristics of the respondents.
As shown on the above Table 4.1, from descriptive analysis the respondent’s gender was dominated by male respondents accounted for 51.4%, leaving the remaining 48.6% for female respondents. Age of respondent was dominated by under category of 31-40, shares 43.20%, followed by age group of 18-30, 41-50 and 51-60 with share of 31.10%, 18.90% and 6.80% respectively. From the above data one can understand that gender distribution was proportional and Ethio telecom has employees of age group from 18 to 60 years.
Respondent’s educational background was as follows, BA degree holder’s respondent has been lion's share of 82.40%, followed by diploma, and masters with share of 9.5%, and 8.1% respectively. 56.71% composition of respondent ethnicity was leaved blank and this indicates that above average percent of respondents might not sensitive with it. However, 20.3% of respondent ethnicity was indicated as Oromo, while Amhara, Gurage, Tigre, and Halaba constitute a share of 12.2%, 5.4%, 4.1% and 1.4% respectively.
The descriptive analysis of most of respondents work experience was from 1-5 years which accounts for 36.5% followed by 11-15 years with share of 23% and others 6-10 years, above 20 years and 16-20 years accounted for 14.9%, 13.5% and 12.2% respectively. From descriptive analysis respondent marital status was dominated by married employees accounted for 74.3% of the total followed by single employees who accounted for 23% and divorced employee who accounted 2.7% of the respondents. From the descriptive analysis it is possible to infer that respondents of the study fairly include from all groups of the diversified employees from workforce diversity variables under study and Ethio telecom have a diversified employee from all groups.

Kerga and Asefa; AJEBA, 8(1): 1-27, 2018; Article no.AJEBA.43760
14
Table 4.1. Respondents profile
Variable Category Frequency Percent (%) Gender Male
Female 38 36
51.40% 48.60%
Age 18-30 years 31-40 years 41-50 years 51-60 years Above 60 years
23 32 14 5
31.10% 43.20% 18.90% 6.80%
Educational background Diploma and below Degree Masters PhD and above
7 61 6
9.50% 82.40% 8.10%
Ethnicity Unknown Oromo Amhara Gurage Tigre Halaba
42 15 9 4 3 1
56.71% 20.30% 12.20% 5.40% 4% 1.40%
Work Experience 1 - 5 years 6 - 10 years 11 - 15 years 16 - 20 years Above 20 years
27 11 17 9 10
36.50% 14.90% 23% 12.20% 13.50%
Marital Status Married Single Divorced Widowed
55 17 2
74.30% 23% 2.7%
Source: Researcher survey, 2018 (N=74)
4.3.2 Central tendencies measurement of
construct Measurement of central tendencies was used to discover the mean scores for the five interval-scaled constructs. A total of 47 items or questions with a particular percentage, mean score and standard deviation were obtained from SPSS output. Thus, the statistical records of the respondent level of agreement with regard to attribute on each independent and dependent variable with their responses were shown in Table 4.2. The percentage, mean score and standard deviation responses for all respondents for gender with regard to employee work performance were presented on the above Table 4.2. From the listed questions, with regard to the item on discrimination, 71.7% of the respondent positively responded that employees were not discriminated by Ethio telecom during hiring and recruitment process on gender basis. For the same majority of the respondents who
constitutes above 60% agreed with all the statements given under attributes on gender. Thus, opportunity for growth and advancement existed for women at Ethio telecom with 79.7%, fair treatment is given to all employees whether male or female with 81.10%, women were involved in Ethio telecom decision making process as much as men with 60.80%, performance criteria for success at Ethio telecom was expected to be equal for both male and female with 85.10%, and 81.10% of respondents agreed that Ethio-telecom encourage employees to work with employees of different gender. This indicates that respondents were positive to the treatment of gender diversity at Ethio-telecom.
The highest mean score from items was 4.03 for the statement “Ethio telecom encourage employees to work with employees of different gender” and the item “Women are involved in Ethio telecom decision making process as much as men” has the lowest mean score of 3.53. 1.137 was the highest standard deviation for item “Women are involved in Ethio-telecom decision making process as much as men” while 0.759 is the lowest standard deviation for item “The

Kerga and Asefa; AJEBA, 8(1): 1-27, 2018; Article no.AJEBA.43760
15
Table 4.2. Attributes on gender
Attribute on Gender SD D N A SA Mean SD 1. Employees are not discriminated during hiring and recruitment process on gender basis
5.4% 16.2% 6.8% 54.1% 17.6% 3.62 1.119
2. Opportunities for growth and advancement exist for women at Ethio telecom.
2.7% 6.8% 10.8% 58.1% 21.6% 3.89 .915
3. Ethio telecom provides fair treatment to all employees whether male or female.
1.4% 9.5% 8.1% 51.4% 29.7% 3.99 .944
4. Women are involved in Ethio telecom decision making process as much as men.
5.4% 16.2% 17.6% 41.9% 18.9% 3.53 1.137
5. The performance criteria for success are expected to be equal for both male and female employees.
0% 6.8% 8.1% 63.5% 21.6% 4.00 .759
6. Ethio telecom encourage employees to work with employees of different gender
0% 6.8% 12.2% 52.7% 28.4% 4.03 .827
Source: Researcher survey, 2018 (N=74)
performance criteria for success are expected to be equal for both male and female employees”. Based on the information provided in the study the overall feeling is that, for the most part, gender was not an area of concern.
According to Kochan et al. [26], gender based inequities in organizations are reinforced and justified by stereotypes and biases that describe positive characteristics and therefore a higher status to males. They argued that organizations prefer to hire male employees compared to females because they are perceived to have better performance and abilities to manage their job. From the study and analysis of the responses this is not the perception of Ethio telecom and in contrary to this study finding.
The percentage, mean, and standard deviations of responses for each of the items for attributes on age are shown in Table 4.3.
The statement “at work, I experience bonding with people of different age group” scores the highest level of agreement from respondents out of others with 82.4%. Respondents were also granted with the statements “Ethio telecom provides equal opportunities for training and career development to all age groups”, “Supervisors at different sections include all members at different ages in problem solving and decision making”, “The age differences in work place do not create conflict” and “Ethio telecom encourages employees to work with employees of different age” with 66.20%,
70.30%, 62.10% and 81.10% respectively. From the responses above it’s possible to say that the age diversity at Ethio telecom were not create conflict rather it strengthens the bond between employees. “At work, I experience bonding with people of different age group” was also the item with highest mean (mean = 4.04), followed by “Ethio telecom encourages employees to work with employees of different age” (means = 4.00). The item “The age differences in work place do not create conflict” has the highest standard deviation, which was 1.252 and the item with lowest standard deviation was “Ethio telecom encourages employees to work with employees of different age”, with the standard deviation value of 0.794. From the Table 4.4 summary above most of the respondents 75.7% agreed that Ethio telecom attracts and hires employees from all ethnic background and the ethnic differences in work area do not encourage conflict at Ethio telecom. Further, 71.7%, 68.9%, 58.1, and 56.7% of the respondents agreed with the items “Ethio telecom encourages employees to work with employees of different ethnicity”, “Opportunities for growth and advancement exist for all ethnic groups”, “Ethio telecom is concerned about employees` customs, cultures and values”, and “Different languages used to communicate do not create problems among employees” respectively.

Kerga and Asefa; AJEBA, 8(1): 1-27, 2018; Article no.AJEBA.43760
16
Table 4.3. Attribute on age
Attribute on age SD D N A SA Mean SD 7. Ethio telecom provides equal opportunities for training and career development to all age group.
8.1% 8.1% 17.6% 50% 16.2% 3.58 1.11
8. Supervisors at different sections include all members at different ages in problem solving and decision making.
5.4% 12.2% 12.2% 58.1% 12.2% 3.59 1.033
9. The age differences in work place do not create conflict.
5.4% 24.3% 8.1% 37.8% 24.3% 3.51 1.252
10. At work, I experience bonding with people of different age group.
2.7% 8.1% 6.8% 47.3% 35.1% 4.04 .999
11. Ethio telecom encourages employees to work with employees of different age
1.4% 2.7% 14.9% 56.8% 24.3% 4.00 .794
Source: Researcher survey, 2018 (N=74)
Table 4.4. Attribute on ethnicity
Attribute on ethnicity SD D N A SA Mean SD 12. Ethio telecom attracts and hires employees from all ethnic background.
1.4% 8.1% 14.9% 51.4% 24.3% 3.89 .915
13. Opportunities for growth and advancement exist for all ethnic groups.
6.8% 8.1% 16.2% 52.7% 16.2% 3.64 1.067
14. Ethio telecom is concerned about employees` customs, cultures and values.
4.1% 13.5% 24.3% 43.2% 14.9% 3.51 1.037
15. Different languages used to communicate do not create problems among employees
8.1% 16.2% 18.9% 40.5% 16.2% 3.41 1.181
16. The ethnic differences in work area do not encourage conflict at Ethio telecom.
1.4% 8.1% 14.9% 51.4% 24.3% 3.89 .915
17. Ethio telecom encourages employees to work with employees of different ethnicity
1.4% 1.4% 25.7% 51.4% 20.3% 3.88 .793
Source: Researcher survey, 2018 (N=74)
The statements “Ethio telecom attracts and hires employees from all ethnic background” and “The ethnic differences in work area do not encourage conflict at Ethio telecom” were a highest mean of 3.89. The item with the lowest mean was 3.41 for the statement “Different languages used to communicate do not create problems among employees”. The item that has the lowest standard deviation (0.793) was “Ethio telecom encourages employees to work with employees of different ethnicity” leaving the highest standard deviation to the item “Different languages used to communicate do not create problems among employees” with a value of 1.181. The mean of each question above was above the moderate level and it infer that respondents were positively
responded each item that the age diversity were an accepted at work area. According to Jackson et al. [28], ethnicity can bring about communication problems and conflict. From the responses, this experience was not there at Ethio telecom. discrimination as a disadvantage of ethnicity while [25] cited lack of social cohesion in organizational work groups as a disadvantage of ethnicity but from the analysis, this perception was not experienced at Ethio telecom. There were as much as 83.8% of the respondents agreed that the recruitment plan of Ethio telecom was based on the education
Kerga and Asefa; AJEBA, 8(1): 1-27, 2018; Article no.AJEBA.43760
17
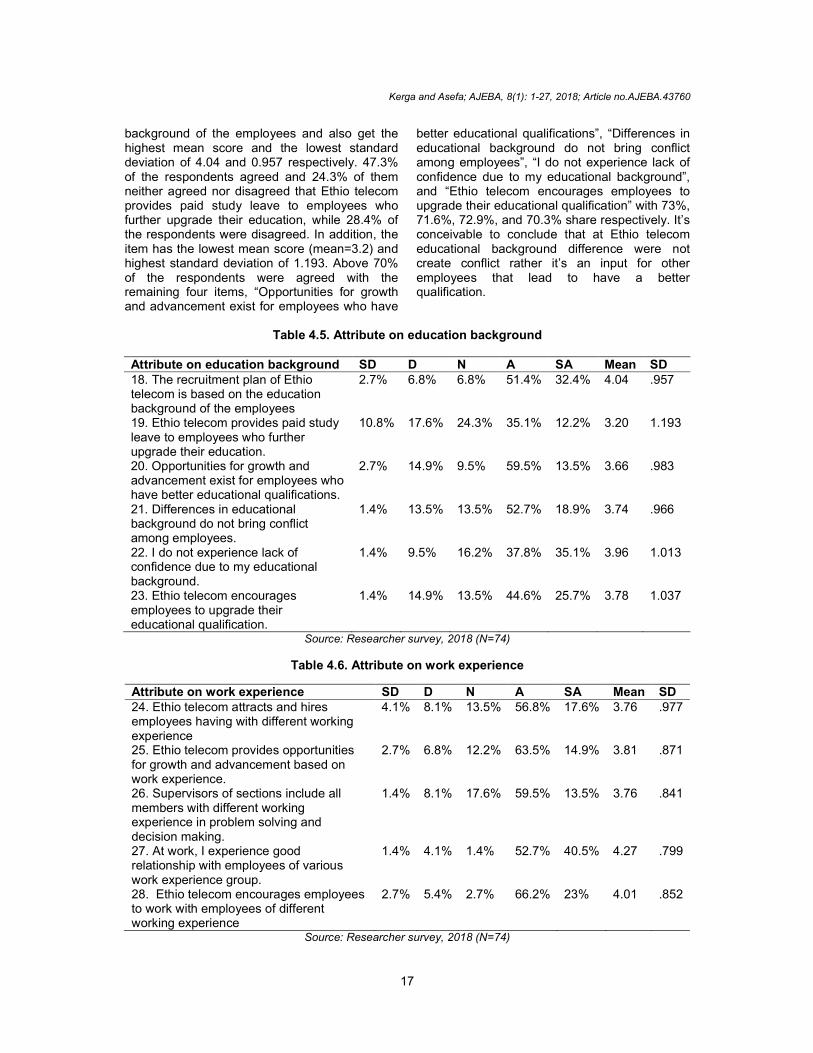
background of the employees and also get the highest mean score and the lowest standard deviation of 4.04 and 0.957 respectively. 47.3% of the respondents agreed and 24.3% of them neither agreed nor disagreed that Ethio telecom provides paid study leave to employees who further upgrade their education, while 28.4% of the respondents were disagreed. In addition, the item has the lowest mean score (mean=3.2) and highest standard deviation of 1.193. Above 70% of the respondents were agreed with the remaining four items, “Opportunities for growth and advancement exist for employees who have
better educational qualifications”, “Differences in educational background do not bring conflict among employees”, “I do not experience lack of confidence due to my educational background”, and “Ethio telecom encourages employees to upgrade their educational qualification” with 73%, 71.6%, 72.9%, and 70.3% share respectively. It’s conceivable to conclude that at Ethio telecom educational background difference were not create conflict rather it’s an input for other employees that lead to have a better qualification.
Table 4.5. Attribute on education background
Attribute on education background SD D N A SA Mean SD 18. The recruitment plan of Ethio telecom is based on the education background of the employees
2.7% 6.8% 6.8% 51.4% 32.4% 4.04 .957
19. Ethio telecom provides paid study leave to employees who further upgrade their education.
10.8% 17.6% 24.3% 35.1% 12.2% 3.20 1.193
20. Opportunities for growth and advancement exist for employees who have better educational qualifications.
2.7% 14.9% 9.5% 59.5% 13.5% 3.66 .983
21. Differences in educational background do not bring conflict among employees.
1.4% 13.5% 13.5% 52.7% 18.9% 3.74 .966
22. I do not experience lack of confidence due to my educational background.
1.4% 9.5% 16.2% 37.8% 35.1% 3.96 1.013
23. Ethio telecom encourages employees to upgrade their educational qualification.
1.4% 14.9% 13.5% 44.6% 25.7% 3.78 1.037
Source: Researcher survey, 2018 (N=74)
Table 4.6. Attribute on work experience
Attribute on work experience SD D N A SA Mean SD 24. Ethio telecom attracts and hires employees having with different working experience
4.1% 8.1% 13.5% 56.8% 17.6% 3.76 .977
25. Ethio telecom provides opportunities for growth and advancement based on work experience.
2.7% 6.8% 12.2% 63.5% 14.9% 3.81 .871
26. Supervisors of sections include all members with different working experience in problem solving and decision making.
1.4% 8.1% 17.6% 59.5% 13.5% 3.76 .841
27. At work, I experience good relationship with employees of various work experience group.
1.4% 4.1% 1.4% 52.7% 40.5% 4.27 .799
28. Ethio telecom encourages employees to work with employees of different working experience
2.7% 5.4% 2.7% 66.2% 23% 4.01 .852
Source: Researcher survey, 2018 (N=74)

Kerga and Asefa; AJEBA, 8(1): 1-27, 2018; Article no.AJEBA.43760
18
According to Triana [21], organizations commonly reject employing people whose training, experience or education is judged to be inadequate. They argued that education background is important to employees and that employees cannot find a job and perform well without adequate educational background. Daniel [33] conducted a study which showed that an individual will be more productive depending on the level of their education. From the responses received from employees of Ethio telecom, this argument is true at Ethio telecom as well. According to Eduard [27], employees who are less educated are likely to suffer inferiority complex which to a large measure may affect performance but the perception at Ethio telecom was different with regard to low qualification. Employees of Ethio telecom do not experience lack of confidence because of their educational background. From the percentage responses for work experience with regard to employee work performance, majority of the respondents 93.2% and 89.2% were agreed that they experience good relationship with employees of various work experience group and Ethio telecom encourage employees to work with employees of different working experience with highest mean score of 4.27 and 4.01 respectively. Further, the items “Ethio telecom attracts and hires employees having with different working experience”, “Ethio telecom provides opportunities for growth and advancement based on work experience” and “Supervisors of sections include all members with different working experience in problem
solving and decision making” got a percentage response of 74.40%, 78.40% and 73% level of agreement respectively. The highest standard deviation was 0.977 to the item “Ethio telecom attracts and hires employees having with different working experience” and 0.799 was the lowest to the item “At work, I experience good relationship with employees of various work experience group”. Respondents were subjected to items with regard to their perception on marital status and its role in work performance. With regard to the recruitment plan, 75.7% of the respondents agreed that the recruitment plan of Ethio telecom includes all marital status groups with a lowest mean score of 3.82 and highest standard deviation of 0.881. Meanwhile 81.10% and 82.4% of the respondents agreed with the item, equal opportunity for training and career development is given to all marital status groups and Growth and advancement opportunities exist in Ethio telecom for all marital status groups respectively. Respondents were also agreed with the statements “At work, I have a strong bond with employees of different marital status group” and “Ethio telecom encourages employees to work with employees of different marital status" at 86.4% and 85.1% respectively. The highest mean score 4.23 and the lowest standard deviation 0.706 was to the item “At work, I have a strong bond with employees of different marital status group” and “Ethio telecom encourages employees to work with employees of different marital status” respectively. The implication here was fair treatment to all marital status groups.
Table 4.7. Attribute on marital status
Attribute on marital status SD D N A SA Mean SD
29. Recruitment plan of Ethio telecom includes all marital status group
0% 12.2% 12.2% 56.8% 18.9% 3.82 .881
30. Equal opportunity for training and career development is given to all marital status group
1.4% 2.7% 14.9% 52.7% 28.4% 4.04 .818
31. Growth and advancement opportunities exist in Ethio telecom for all marital status group
1.4% 6.8% 9.5% 55.4% 27% 4.00 .876
32. At work, I have a strong bond with employees of different marital status group.
0% 4.1% 9.5% 45.9% 40.5% 4.23 .786
33. Ethio telecom encourages employees to work with employees of different marital status
0% 2.7% 12.2% 58.1% 27% 4.09 .706
Source: Researcher survey, 2018 (N=74)

Kerga and Asefa; AJEBA, 8(1): 1-27, 2018; Article no.AJEBA.43760
19
Table 4.8. Attribute on employee performance
Employee performances SD D N A SA Mean SD 34. I enjoy my tasks and the division’s work approach.
2.7% 9.5% 14.9% 50% 23% 3.81 .989
35. I am committed to the mission and direction of my organization.
4.1% 8.1% 5.4% 37.8% 44.6% 4.11 1.093
36. I am motivated to complete the task that is assigned to me.
2.7% 5.4% 9.5% 41.9% 40.5% 4.12 .979
37. I co-operate well with my colleagues of different ethnicity.
0% 4.1% 6.8% 54.1% 35.1% 4.20 .740
38. I enjoy working with opposite gender and can perform well.
0% 4.1% 1.4% 54.1% 40.5% 4.31 .701
39. My performance level affects my salary level.
6.8% 16.2% 16.2% 48.6% 12.2% 3.43 1.111
40. I perform better while working with others of different age
0% 6.8% 8.1% 62.2% 23% 4.01 .767
41. Working with employees of different educational background add value to my performance
0% 6.8% 4.1% 45.9% 43.2% 4.26 .829
42. My performance gets better because of working with employees of different work experience
2.7% 8.1% 4.1% 36.5% 48.6% 4.20 1.033
43. Other employees with different marital status have a contribution to my performance level
0% 9.5% 12.2% 54.1% 24.3% 3.93 .865
44. I am satisfied with my current salary level.
14.9% 31.1% 16.2% 33.8% 4.1% 2.81 1.178
45. I am given the chance to try my own method of doing the job.
4.1% 14.9% 23% 48.6% 9.5% 3.45 .995
46. By learning more skills through courses/training, I can improve my task performance.
4.1% 4.1% 6.8% 51.4% 33.8% 4.07 .970
47. Good employee performance is important for the future growth of my organization.
4.1% 2.7% 2.7% 36.5% 54.1% 4.34 .969
Source: Researcher survey, 2018 (N=74) Employee work performance was the dependent variable in this study and respondents were subjected to some very specific items in its respect and the responses were recorded statistically in Table 4.8. As shown in below Table 4.8, most of the respondents above 50% were agreed with all the items related to employee performance except for the item “I am satisfied with my current salary level” which has 37.9% of the respondents were agreed with the statement, while 46% were disagreed and 16.2% were neutral with the lowest mean score of 2.81 and highest standard deviation of 1.178. Most of employees at Ethio telecom were dissatisfied with their salary that why they agreed at 60.8% with the statement “my performance level affects my salary level”. There were as much as 73% of the respondents
agreed that they enjoy their tasks and the division’s work approach while 14.9% were feeling neutral with that statement. 82.4% of the respondents agreed with the statements that they were committed to the mission and direction of their organization and they were motivated to complete the task that was assigned to them. Most of the respondents who constitutes 89.2%, agreed that they co-operate well with their colleagues of different ethnicity. More than 90% of the respondents agreed that opposite gender can perform well and they enjoy working with them. In addition, more than 85% of the respondents were agreed with the statements that they perform better while working with others of different age, working with employees of different educational background add values to their performance, employee performance gets

Kerga and Asefa; AJEBA, 8(1): 1-27, 2018; Article no.AJEBA.43760
20
better while working with employees of different working experience and through learning more skills and training they improve their task performance. 78.4% of the respondents agreed with the statement “Other employees with different marital status have a contribution to my performance level”. Meanwhile 90.60% of the respondents agreed that good employee performance was important for the future growth of their organization. Finally, there was 58.10% of the respondents agreed and 23% of them neither agreed nor disagreed that they are given the chance to try their own method of doing the job. “Good employee performance is important for the future growth of my organization” was the item with highest mean (mean=4.34), followed by the statement “I enjoy working with opposite gender and can perform well” (mean of 4.31). The item “I enjoy working with opposite gender and can perform well” has the lowest standard deviation of 0.701. According to Aswathapa (2008), employee performance can be systematically measured against many factors including cooperation. From the analysis of the responses, employees of Ethio telecom were cooperative and happy. Robbins and Judge, [34] has argued that the interest stemmed from the commonsense belief that the satisfied employees are more productive than those who are dissatisfied. It is also believed that satisfied employees are more committed to their job than the dissatisfied. This perception was also there at Ethio telecom according to the analysis above. Workforce diversity leads to synergistic performance when team members are able to understand and appreciate each other, and capitalize on one another’s experiences, knowledge and perspectives. Furthermore,
through effective communication, members would be able to evaluate problems and situations from various viewpoints, determine underlying cultural assumptions and create a common social reality, ascertain and explain culturally synergistic alternative solutions appropriately, and establish agreed-upon norms for interaction (Choy, 2007; Adler, 1980; Maznevski, 1995). This was another inference which was consistent result with the responses of employees of Ethio telecom. There was a diverse workforce with a satisfying work environment which is highly socialized and there is no discrimination and conflict on the basis of workforce diversity variables under study. 4.4 Inferential Analysis Inferential analysis was used by the researcher so that to generate conclusion regarding the characteristics of the population based on the sample data. Furthermore, it was aimed to examine the individual variables and its relationships with other variables. 4.4.1 Pearson’s correlation coefficient The Pearson’s correlation coefficient analysis helped the researcher to better understand whether there was a positive relationship, negative relationship, or no correlation between dependent variable and independent variables. Thus, the strength and direction of relationship between variables was able to be analyzed by the researcher using Pearson correlation coefficient analysis. In addition, the researcher used it to measure whether there was a significant relationship between independent variables and dependent variable. Pearson’s correlation coefficient result analysis of this study was depicted in Table 4.10.
Table 4.9. Rule of thumb about correlation coefficient size, coefficient range and strength of
association
Coefficient range Strength of association
±0.91 to ±1.00 Very strong
±0.71 to ±0.90 High
±0.41 to ±0.70 Moderate
±0.21 to ±0.40 Small but definite relationship
±0.01 to ±0.20 Slight, almost negligible Source: Adapted from: Hair, Money, Samouel and Page (2007), Research Method for Business, John Wiley and
Son Inc.

Kerga and Asefa; AJEBA, 8(1): 1-27, 2018; Article no.AJEBA.43760
21
Table 4.10. Correlation result
Variables Employee performance gender Pearson Correlation .358**
Sig. (2-tailed) .002 N 74
age Pearson Correlation .557**
Sig. (2-tailed) .000 N 74
ethnicity Pearson Correlation .659**
Sig. (2-tailed) .000 N 74
educational background Pearson Correlation .471**
Sig. (2-tailed) .000 N 74
work experience Pearson Correlation .423** Sig. (2-tailed) .000 N 74
marital status Pearson Correlation .606** Sig. (2-tailed) .000 N 74
**. Correlation is significant at the 0.01 level (2-tailed) N=74. Source: Researcher survey, 2018 (N=74)
Based on the result of correlation coefficient for gender and employee performance was significance (r=0.358, n=74, p<0.005), which indicate that there was a significant small but definite relationship between gender and employee performance. Educational background and work experience have a correlation coefficient value (r=0.471, n=74, p<0.005) and (r=0.423, n=74, p<0.005) respectively. This means that there was a moderate positive correlation between these two independent variables and employee performance, and 0.000 was the significance value for educational background and work experience each with employee performance, which were lesser than alpha value of 0.01; it means that there was a significant relationship between these two independent variables and employee performance. Thus, there were significant relationship between gender, educational background and work experience diversity with employee performance though the strength of the association was different. Evidence from various literatures those three results of this study were consistent with other researchers finding. According to Elsaid [17] study result, there was a significant positive and small but definite relationship between gender group and employee performance which carried correlation coefficient value of 0.333 and p-value of 0.000 which was significant at the alpha value 0.01. A study Mwatumwa [10] also shows that
there was a significant with correlation coefficient of 0.335 relationships between gender and employee performance. The findings of the study by Rahman et al. [14] revealed that there were significant positive correlations between Gender diversity and employee performance (r=0.805, p<0.000), and Education diversity and employee performance (r=0.718, p<0.001). In addition, [20] found a significant positive and slight, almost negligible relationship between education background group and employee performance which carried correlation coefficient value of 0.190 and p-value of 0.001 which was significant at the alpha value 0.01. The result of other study by Mwatumwa [10] evidenced that a significant relationship between education background and employee performance with a correlation coefficient of 0.185 was existed. Furthermore, the results of the study by Eduard. [27] revealed that the relationship between work experience and job performances was positive regardless of the work experience measure used. The findings of Kotur and Anbazhagan [16] also shows the two variables chosen for their study, Education and Work-Experience, have their respective direct association with performance of the workers. The relationship between age, ethnicity and marital status with that of dependent variable employee performance was investigated using Pearson correlation coefficient and all were resulted in a moderate positive correlation
Kerga and Asefa; AJEBA, 8(1): 1-27, 2018; Article no.AJEBA.43760
22
between each of them (r=0.557, n=74, p<0.005), (r=0.659, n=74, p<0.005) and (r=0.606, n=74, p<0.005) respectively. The significance value for all three correlation coefficient value was 0.000 which was lower than alpha value of 0.01 and this means that there were statistically significant relationship and moderate strength of association between age, ethnicity and marital status with employee performance. Many other studies were there to strengthen the findings of this study. The study by Mwatumwa et al. [10] evidenced that the relationship between ethnicity and employee work performance was significant with a correlation coefficient of 0.195. The findings of the study by Rahman et al. [14] revealed that there were significant positive correlations between age diversity and employee performance (r=0.594, p<0.000) and ethnic diversity and employee performance (r=0.893, p<0.000). The findings of the study by Eduard [15] on “Difference between Employees Marital Status and Performance Level in IT Industry” revealed that there was a significant level difference between marital status and performance of employees. 4.4.2 Multiple linear regression analysis Multiple linear regression analysis is an extension of bivariate regression analysis which allows the simultaneous investigation of the effect of two or more independent variables on a single dependent variable [35]. It allowed researcher to examine which independent variables have the most significant influence on the dependent variable. Thus, to understand the relationship between multiple independent variables and the single dependent variable the study used the regression model summary and the researcher examined the regression coefficients for each independent variable. Therefore, Multiple Regression Analysis was used to investigate the effect of workforce diversity towards employee performance. Moreover, many other researchers who were included in this study as a reference such as, [5] and others used multiple linear regression analysis for their study on the topic area, the effect of workforce diversity on employee performance, as a good fit model.
4.4.2.1 Model summary
The R value is the correlation coefficient between the dependent variable and the independent variables. According to the model summary in
Table 4.11, the value of correlation coefficient(R) for a set of independent variables (gender, age, ethnicity, education background, work experience and marital status) with the dependent variable (employee performance) was 0.718. Therefore, there was a high positive correlation between those independent variables and dependent variable. The value under a heading adjusted R square in the fourth column of Table 4.11 measures how much of the variance in the dependent variable (employee performance) was explained by the predictors (gender, age, ethnicity, education background, work experience and marital status). In this case the value was 0.472. Expressed as a percentage, this means that independent variables explained 47.2 percent of the variance in employee performance. In other word 52.8% (100% - 47.2%) of employee performance was explained by other factors which were not part of this study. Other studies result were evidenced for the consistent finding of this study such as the findings of the study by Rahman et al. [14] to determine the effect of Gender, Age, Ethnicity and Educational background on employee’s performance shown that there was strong association with R value of 0.914 between the workforce diversity variables and the performance of employees and the model summary shown that 83.5% of employee performance was explained by the four independent variables. A study conducted by Mwatumwa et al. [10] evidenced that there was a positive correlation with R value of 0.501 between ethnicity, gender and educational background and employee performance and indicated that 30.5% of the variation on employee performance was explained by ethnicity, [17] study shown that gender, age and educational background to employee performance has a correlation coefficient value of 0.455 and R squared value of 0.207. [18] study also resulted in there was a significant positive and moderate correlation (R=0.46) between the four variables (gender, age, ethnicity and education background) and employee performance and the overall effects of workforce diversity on employee performance was 21.1%, leaving 78.9% to other variables.
4.4.2.2 ANOVA test
Analysis of variance in this study was used to determine whether the model was a good fit for

Kerga and Asefa; AJEBA, 8(1): 1-27, 2018; Article no.AJEBA.43760
23
the data. The F value of the test for the data in Table 4.12 below is 11.895. The p-value associated with F value .000 which is lower than the alpha value 0.05. In addition, ANOVA table indicates that there was significant impact of the independent variables on the dependent variable and the model applied was significantly suitable to predict the dependent variable.
4.4.2.3 Regression coefficient
To know about the effect of workforce diversity on employee performance multiple regressions was used as a model. It allows us to compare the predictive ability of particular independent variables and to find the best set of variables to predict a dependent variable. As depicted below in Table 4.13, from the unstandardized coefficient values listed as β, the researcher constructs the following a regression equation: EP = α + β1G + β2A + β3Et + β4Eb + β5We + β6Ms + e EP = 1.683+(-0.046) G + 0.068 A + 0.287 Et + 0.013 Eb + 0.093 We + 0.206 Ms + 0.334
Where,
EP= Employee Performance Et = Ethnicity G = Gender Eb = Education background A = Age We = Work experience Ms = Marital status e = error term α = Constant
β1, β2, β3, β4, β5 and β6 are unstandardized beta Coefficients of Gender, Age, Ethnicity, Educational background, Work Experience and Marital status respectively.
The next thing the researcher wants to know was which of the variables included in the model contributed to the prediction of the dependent variable. We find this information in the above Table 4.13, Look in the column labeled beta under unstandardized coefficients. In this case the researcher was interested in comparing the contribution of each independent variable to influence the dependent variable.
Table 4.11. Model summary
Model R R Square Adjusted R square Std. error of the estimate 1 .718a .516 .472 .35310
a. Predictors: (Constant), age, marital status, gender, work experience, ethnicity, educational background
Table 4.12. ANOVAb
Model Sum of squares df Mean Square F Sig. 1 Regression 8.898 6 1.483 11.895 .000
a
Residual 8.354 67 .125 Total 17.252 73
a. Predictors: (Constant), marital status, gender, work experience, ethnicity, educational background, age b. Dependent Variable: employee performance
Table 4.13. Regression coefficients
Model Unstandardized
Coefficients Standardized Coefficients
t Sig.
B Std. error Beta 1 (Constant) 1.683 .334 5.046 .000
gender -.046 .080 -.063 -.578 .565 age .068 .091 .103 .751 .455 ethnicity .287 .088 .416 3.266 .002 educational background .013 .089 .018 .144 .886 work experience .093 .081 .127 1.152 .253 marital status .206 .109 .238 1.883 .064
a. Dependent Variable: employee performance

Kerga and Asefa; AJEBA, 8(1): 1-27, 2018; Article no.AJEBA.43760
24
The largest beta coefficient was 0.287, which was for ethnicity. This means that this variable makes the strongest unique contribution of 28.7% to explain the dependent variable, when the variance explained by all other variables in the model was controlled for. The Beta value for marital status and work experience was resulted in beta coefficient of 0.206 and 0.093 respectively, indicating that independently they made the second and third higher contribution to dependent variable to explain it with 20.6% and 9.3% respectively, keeping other variables constant for each. Age and educational background have a beta value of 0.068 and 0.013 respectively; this means that the two independent variables have 6.8% and 1.3% contribution to explain employee performance self-sufficiently. The last lowest beta value in the regression coefficient was gender which has a beta value of -0.046. Ethnicity was making a statistically significant unique contribution to the prediction of employee performance with value of 0.002, since significant value is less than 0.05 while other independent variables which are gender, age, work experience, educational background and marital status with significance value of 0.565, 0.455, 0.253, 0.886 and 0.064 have not significant contribution in prediction of employee performance due to their significant values are higher than 0.05. From the analysis above, although a set of all independent variables have a significant effect on employee performance, except ethnicity all other independent variables were not significantly affect employee performance separately or independently. The consistent findings of other researchers strengthen this study finding. The study by Rahman et al. [14] shown that ethnic diversity has significantly the highest impact on employee performance (beta =.549, t=6.169, p<0.05). There is a positive significant effect (beta=0.148 and p<0.031) of ethnic diversity on employee performance in the banking [24]. In addition, [4] study found statistically there was a significant effect of ethnicity toward employee performance. Further supported works were such as; according to Barney [20] and Kyalo and Gachunga [24] studies age diversity was insignificant to explain the variance in employee performance when different workforce works together. A study conducted in country
government of Mombasa by Mwatumwa [10] revealed that gender, age, and educational background have no significant effect towards employee work performance.
5. Summary, Conclusion and Recommendation
5.1 Introduction From the analysis and data collected, the following major summary, conclusion and recommendations were made. The responses were based on the objective of the study which sought to the effect of gender, age, ethnicity, educational background, work experience and marital status on employee performance.
5.2 Summary of Findings
The Pearson’s correlation coefficient analysis of the study shows that the association or relationship between gender, educational background, work experience, age, ethnicity and marital status with employee performance resulted (r=0.358, n=74, p<0.005), (r=0.471, n=74, p<0.005), (r=0.423, n=74, p<0.005), (r=0.557, n=74, p<0.005), (r=0.659, n=74, p<0.005) and (r=0.606, n=74, p<0.005) respectively indicating that there were positive correlation and small strength of association for gender and positive with moderate strength of association for other five independent variables with employee performance. Further, the association between all independent variables with employee performance is significant.
The correlation coefficient (R) in model summary indicates that there was a high positive correlation between those independent variables and dependent variable and all independent variables explain 47.2% of the variance in employee performance. The largest beta coefficient was 0.287 for ethnicity, making strongest statistically significant unique contribution (28.7%) to the prediction of employee performance. However, other independent variables were not significantly contributing to the prediction of employee performance due to their significant values were higher than 0.05.
5.3 Conclusion
Fruitful organizations are becoming more flexible, strong, quick to change directions, and customer

Kerga and Asefa; AJEBA, 8(1): 1-27, 2018; Article no.AJEBA.43760
25
centered. These organizations are hiring more diverse workforce to withstand global challenges and to face extensive competition. It is very important to know the impact of workforce diversity on employee performance that leads to the performance of employee and organization. This study reviews the literature on workforce diversity and performance link and find different dimensions have a different relation with performance. The descriptive analysis outcome shows, Ethio telecom encourages employees to work with various gender, age, ethnicity, education background, work experience and marital status and there is no discrimination and conflict on the basis of those diversity variables. Ethio telecom have a diverse workforce with a satisfying work environment which is highly socialized, committed, motivated, cooperated and enjoy their tasks for improved performance. Although, the result of correlation coefficient between each independent variable and dependent variable shown a significant positive relationship, the findings of regression coefficient showed that age, gender, education background work experience and marital status were insignificant to affect employee performance and only ethnicity was significant to explain employee performance. Thus, it can be concluded that the performance of employees working in Ethio telecom south west Addis Ababa zone does not affect significantly by their age, gender, education background, work experience and marital status diversity. But when it comes to ethnicity, it significantly impacts the performance of employees. Moreover, the insignificant effect of age, gender, education background, work experience and marital status on employee performance doesn`t indicate that the variables have no contributory effect to employee performance and disregard those variables, rather their individual contributions to employee performance is insignificant and have a combined contribution to total employee performance score.
5.4 Recommendations Diversity is a well-accepted occurrence at Ethio telecom and it is important for Ethio telecom to realize the need to capitalize on the diversified workforce specially on diversity variables under study in order to stay ahead with a view to discovering what needs to be done to enable Ethio telecom to increase its ability and make better its service delivery to the potential customers.
The effects of workforce diversity variables under study with the exception of ethnicity are insignificant to impact employee performance but have a significant relationship between them. Thus it’s advisable to Ethio telecom to understand how to manage the diverse workforce in ethnicity where it can increase the advantage of such diversity and eliminate or reduce the disadvantage if any. In general, since there is a significant positive relationship between variables, management of diversity is important to help Ethio telecom to benefit from the advantages and minimize the disadvantages of workforce diversity that can have negative effect on employee and organizational performance. So as to carry out performance of employees at Ethio telecom, performance appraisals and employees included measures i.e. give a chance to try doing on their own methods lead to enhance employee’s ability that constitutes to the performance of Ethio telecom. In addition to performance appraisals which might use for making promotion and compensation related decisions, it’s better to Ethio telecom to give a chance to employee to learn more skills through course and training so as to improve their performance. It is supposed that organization culture, human resource practices, nature of work and business strategy of individual firms are different from each other and since workforce diversity is a contemporary issue, such area needs to be researched and investigated more including additional variables beyond included in this study. Future researcher can also focus on a specific category i.e. Directors, Managers or Executives of employees. Moreover, the researcher recommends such similar research in other nature of business.
ETHICAL CONSIDERATION AND CONSENT Before the research was conducted, the researcher informed the participants of the study about the objectives of the study, and was consciously consider ethical issues in seeking consent, avoiding deception, maintaining confidentiality, respecting the privacy, and protecting the anonymity of all respondents. A researcher must consider these points because the law of ethics on research condemns conducting a research without the

Kerga and Asefa; AJEBA, 8(1): 1-27, 2018; Article no.AJEBA.43760
26
consensus of the respondents for the above listed reasons.
COMPETING INTERESTS
Authors have declared that no competing interests exist. The company name used for this research is commonly and predominantly selected in our area of research and country. There is absolutely no conflict of interest between the authors and company because we do not intend to use this company as an avenue for any litigation but for the advancement of knowledge. Also, the research was not funded by the company rather it was funded by personal efforts of the authors.
REFERENCES
1. Gupta R. Workforce diversity and organisational performance: International Journal of Business Management Invention. 2013;2(61):36-44.
2. Rizwan M, Khan M, Nadeem B, Abbas Q. the impact of workforce diversity towards employee performance: Evidence from banking sector of Pakistan; 2016.
3. Gitonga D, Kamaara M, Orwa G. Workforce diversity and the performance of telecommunication firms: The interactive effect of employee engagement (A Conceptual Framework), International Journal of Humanities and Social Science 2016;6:6.
4. Al-Ahmad R, Alkhawlani M. The effect of workforce diversity on employee performance: Conceptual Framework. 2017;3(3).
5. Weiliang E, Mun L, Chern T, Fong T, Yuan Y. The Effect of Workforce Diversity towards the Employee Performance in an Organisation; 2011.
6. Robbins S, Judge T. Organisational behavior. (13th Edition); 2009.
7. Mkoji D, Sikalieh D. The influence of personality dimensions on organisational performance: International Journal of Humanities and Social Science Vol. 2 No. 17.
8. Peteraf. The effect of affirmative action and officer salary on changes in managerial diversity. Industrial Relations Journal; 1995.
9. Joseph RD, Selvaraj P. The Effects of work force diversity on employee performance in Singapore Organisations, International Journal of Business Administration. Sciedu Press. 2015;6(2).
10. Mwatumwa A, Kingi W, Mohamed H, Ibua M, Omido K. Effect of workforce diversity on employee work performance: A study of the county government of Mombasa. International Journal of Management and Commerce Innovations; 2016.
11. Okoro E. Cross-Cultural etiquette and communication in global business; toward a strategic framework for managing corporate expansion. International Journal of Business and Management. 2012;7(16).
12. Alghazo A, Hamad M, Shaiban A. The effects of workforce diversity on employee performance at an oil and gas company: American Journal of Business and Society. 2016;1(3):148-153.
13. Richard O, Barnet K, Dwyer S, Chandwick K. Exploring the performance effects of visible attributes of diversity; The moderating role of span of control and organisational life cycle. International Journal of Human Resource Management; 2007.
14. Rahman MS, Ali M, Siddiqi KO. Effect of workforce diversity on employee work performance of selected firms in Bangladesh. European Journal of Business and Management. 2017;9(23).
15. Padmanabhan L, Magesh R. Difference between employee’s marital status and performance level in IT industry. Imperial Journal of Interdisciplinary Research. 2016;2(6):1173.
16. Kotur BR, Anbazhagan S. Education and work-experience - influence on the performance. Journal of Business and Management. 2014;16(5).
17. Elsaid A. The effects of cross cultural work force diversity on employee performance in Egyptian pharmaceutical organization’s. Business and Management Research. 2012;1(4).
18. Assefa A. Effects of workforce diversity towards employees’ performance in Total Ethiopia S.C; 2014.
19. Tajfel H, Turner J. The social identity theory of intergroup behavior: Psychology of intergroup relations: Chicago, Nelson-Hall; 1986.
20. Barney J. Firm resources and sustained competitive advantage. Journal of management; 1991.
21. Triana C, Garcia F, Colella A. Managing diversity: How organisational efforts to support diversity moderate the effects of perceived racial discrimination on effective

Kerga and Asefa; AJEBA, 8(1): 1-27, 2018; Article no.AJEBA.43760
27
commitment. Personnel Psychology. 2010;63:817-843.
22. Barney J, Clark D. Resource based theory: Creating and sustaining complete advantages; 2007.
23. Opstal E. The relationship between the management of ethnic cultural diversity and organisational performance; investigating the moderating effect of climate strength; 2009.
24. Kyalo J, Gachunga H. Effect of diversity in workplace on employee performance in the banking industry in Kenya. 2015;2(53): 145-181.
25. Gellner B, Veen S. Positive effects of aging and age diversity in innovative companies: Large scale empirical evidence on company productivity. Human Resource Management Journal. 2013;3(3):279-295.
26. Kochan T, Bezrukova K, Ely R, Jackson S, Joshi A, Jehn K, Leonard J, Levine, Thomas. The effects of diversity on business performance: Report of the diversity research network; 2003.
27. Eduard – News in. 2nd
march 2010; 2010.
28. Quinones M, Ford J, Teachout M. The relationship between work experience and job performance: Air Force Research
Laboratory War fighter training research division; 2001.
29. Van Vugt. M. Evolutionary origins of leadership and followership. Personality and Social Psychology Review. 2006; 10(4):354–371.
30. Seung-min R, Mustafa K. An analysis of the relationship between marital status and family structure on-the-job productivity, Calhoun the NPS Institutional Archive, Thesis collection. 2002;V:1-100.
31. Armstrong C, Flood P, Guthrie P, Liu W, Maccurtain S, Mkamwa T. The impact of diversity and equality management on firm performance: Beyond high performance systems. Human Resource Management Journal. 2010;49(6):977-998.
32. Hair J, Money A, Samouel P, Page M. Research Methods for Business: West Sussex: John Wiley Sons; 2007.
33. Daniel T. Service quality and customer satisfaction: The case of cellular phone users of Ethio-Telecommunications; 2015.
34. Robbins SP, Judge TA. Organisational behavior. (14th ed.); 2011.
35. Zikmund W, Babin B, Carr C, Griffin M. Business research methods (8thed.), New York: South-Western/Cengage Learning; 2010.
_________________________________________________________________________________ © 2018 Kerga and Asefa; This is an Open Access article distributed under the terms of the Creative Commons Attribution License (http://creativecommons.org/licenses/by/4.0), which permits unrestricted use, distribution, and reproduction in any medium, provided the original work is properly cited.
Peer-review history: The peer review history for this paper can be accessed here:
http://www.sciencedomain.org/review-history/26308