The Effect of Wind Loads on the Seismic Performance of ...
13
MODULUS | September 2020 Vol. 30 | No. 03 11 SOCIETY OF STRUCTURAL ENGINEERS SRI LANKA ENGINEERS’ FORUM The Effect of Wind Loads on the Seismic Performance of Tall Buildings in Sri Lanka and Thailand Abstract Due to the rapid increment of population in major cities around the world, the concept of vertical city is currently emerging to develop sufficient infrastructure facilities. The role of a tall building is to provide sustainable residential/office space to vertical community. Designing a safer city with skyscrapers, depends on safety of non- structural and structural components of tall buildings ensured by efficient structural design against wind and earthquake loadings that are the two major types of lateral dynamic excitations experienced by buildings. A 40-story dual system building (Building “A”) and a 45-story each, two tower residential building (Building “B”) have been evaluated in the present study. The first building will be located in Bangkok. A combined reinforced concrete core wall and a special moment resisting frame are incorporated to resist the lateral force developed by wind and earthquake loading conditions. Moderate seismic hazard level and three different levels of wind speeds (i.e. low, moderate and high) are adapted to represent the different wind zones globally. Three building models are designed according to a given wind hazard level combined with seismic demand. The second building is in Colombo, which is categorized as moderate wind zone and low to moderate seismic zone. Research into historic events has shown that significant seismic activities had occurred in the past in Sri Lanka. Thus, it is important to evaluate the capacity of a building for moderate seismic conditions as presented in this paper for the selected two tower residential buildings. The detailed seismic performance evaluation is then preceded using the Nonlinear Response History Analysis (NLRHA) procedure and the true inelastic seismic demands of all building cases is estimated. The results of the analysis indicate that the wind level can significantly affect the seismic performance of the building. Thus, it can be concluded that, the overall structural integrity and safety of a building can be ensured by the performance-based seismic evaluation procedure, even though the wind demand primarily controls the lateral load resisting system of tall buildings. The performance-based seismic evaluation is also equally important to identify the structural elements that required additional ductility to satisfy earthquake demands, though the structure was designed for critical wind load conditions. This kind of study waives away the need of future retrofitting work and undue expenses. Keywords: wind loading, performance-based seismic evaluation, high-rise buildings. 1. Introduction Tall buildings are dominating the image of urban communities around the metropolitan areas due to their economic advantages and sustainability considerations. With large height and slenderness, seismic and wind loads become the critical consideration in designing high-rise buildings. An ideal structural system for wind design can be described as a solid, heavy system with strong connections which helps to resist loads as the wind blows across and over the structure (Aly and Srinivasa, 2015 [1]). On the other hand, when seismic load is applied to the building, it experiences cyclic loading as the building’s inertia responds to the ground movement. Therefore, the building is designed to efficiently dissipate the seismic energy through damping and yielding of the structural components. In strong wind terrain, when traditional design codes are employed, the wind demands can be higher than the seismic design demands, and therefore, can control the design. However, studies have shown that the true nonlinear seismic demands can be significantly higher than those predicted by the code-based Response Spectrum Analysis (RSA). The outcomes may invoke the need of seismic performance evaluation of buildings originally designed for wind. 2. Literature Review This integrated approach to assess the structural performance for both types of loadings has been investigated by various researchers. Adam and Suradi (2008) [2] studied the performance of wind-designed RC buildings in Malaysia against the earthquake loads. The buildings were originally designed for wind with a design speed of 30 m/s to 40 m/s using the static analysis procedure. However, the detailed results show that these buildings were unable to perform well under lateral loads even at low seismic intensities. More S. Thilakarathna a , S. Fernando a , N. Anwar b S. Thilakarathna a , S. Fernando a , N. Anwar b a Civil and Structural Engineering Consultants Pvt. Ltd b Structural Engineering, School of Engineering and Technology, Asian Institute of Technology, Thailand
Transcript of The Effect of Wind Loads on the Seismic Performance of ...

MODULUS | September 2020Vol. 30 | No. 03
11SOCIETY OF STRUCTURAL ENGINEERS SRI LANKA
ENGINEERS’ FORUM
[1] Desnerck, P., Lees, J.M., Valerio, P., Loudon, N.and Morley, C.T., “Inspection of RC half-jointbridges in England: analysis of current practice,” in Proceedings of the Institution of Civil Engineers-Bridge Engineering, vol. 171, no. 4, pp. 290-302,December 2018.
[2] Desnerck, P., Lees, J.M. and Morley, C.T., “The effect of local reinforcing bar reductions andanchorage zone cracking on the load capacity ofRC half-joints,” Engineering Structures, 152, pp.865-877, 2017.
[3] Nicholson, T.A., “Design and construction of A34 Wolvercote highway viaduct replacement UK,” in Proceedings of the Institution of Civil Engineers-Bridge Engineering, vol. 167, no. 2, pp. 122-130,June 2014.
[4] Smith, D.A., “Refurbishment of the old Medway Bridge. In Bridge Management 5: Inspection,maintenance, assessment and repair,” Proceedingsof the fifth International Conference on BridgeManagement, Surrey, April 2005, pp. 210-218.
[6] Dirar, S., Lees, J.M. and Morley, C., “Phased nonlinear finite-element analysis of pre-cracked RC T-beams repaired in shear with CFRP sheets,” Journal of Composites for Construction, 17(4), pp. 476-487, 2013.
[7] Kurukulasuriya, M.C., Rathnayake, H.S. and Yapa, H.D., “Optimum Shear Strengthening of Reinforced Concrete Beams Using an Un-bonded CFRP Strap Shear Retrofitting System,” Proceedings of the eighth International Conference on Advanced Composites in Construction (ACIC 2017), Sheffield, UK, 2017, pp. 107-113.
[8] Dirar, S., Lees, J. and Morley, C., “Pre-cracked reinforced concrete T-beams repaired in shear with bonded carbon fiber-reinforced polymer sheets,” ACI Structural Journal, 109(2), pp. 215-224, 2012.
[9] MIDAS FEA V 2.8, “Nonlinear and Detail FE Analysis System for Civil Structures,” FEA Analysis and Algorithm Manual, 2008.
8. References [5] Desnerck, P., Lees, J.M. and Morley, C.T., “Strut-and-tie models for deteriorated reinforced concrete half-joints,” Engineering Structures, 161, pp. 41-54, 2018.
The Effect of Wind Loads on the Seismic Performance of Tall Buildings in Sri Lanka and Thailand
Abstract Due to the rapid increment of population in major cities around the world, the concept of vertical city is currently emerging to develop sufficient infrastructure facilities. The role of a tall building is to provide sustainable residential/office space to vertical community. Designing a safer city with skyscrapers, depends on safety of non-structural and structural components of tall buildings ensured by efficient structural design against wind and earthquake loadings that are the two major types of lateral dynamic excitations experienced by buildings. A 40-story dual system building (Building “A”) and a 45-story each, two tower residential building (Building “B”) have been evaluated in the present study. The first building will be located in Bangkok. A combined reinforced concrete core wall and a special moment resisting frame are incorporated to resist the lateral force developed by wind and earthquake loading conditions. Moderate seismic hazard level and three different levels of wind speeds (i.e. low, moderate and high) are adapted to represent the different wind zones globally. Three building models are designed according to a given wind hazard level combined with seismic demand. The second building is in Colombo, which is categorized as moderate wind zone and low to moderate seismic zone. Research into historic events has shown that significant seismic activities had occurred in the past in Sri Lanka. Thus, it is important to evaluate the capacity of a building for moderate seismic conditions as presented in this paper for the selected two tower residential buildings. The detailed seismic performance evaluation is then preceded using the Nonlinear Response History Analysis (NLRHA) procedure and the true inelastic seismic demands of all building cases is estimated. The results of the analysis indicate that the wind level can significantly affect the seismic performance of the building. Thus, it can be concluded that, the overall structural integrity and safety of a building can be ensured by the performance-based seismic evaluation procedure, even though the wind demand primarily controls the lateral load resisting system of tall buildings. The performance-based seismic evaluation is also equally important to identify the structural elements that required additional ductility to satisfy earthquake demands, though the structure was designed for critical wind load conditions. This kind of study waives away the need of future retrofitting work and undue expenses.
Keywords: wind loading, performance-based seismic evaluation, high-rise buildings.
1. Introduction
Tall buildings are dominating the image of urban communities around the metropolitan areas due to their economic advantages and sustainability considerations. With large height and slenderness, seismic and wind loads become the critical consideration in designing high-rise buildings. An ideal structural system for wind design can be described as a solid, heavy system with strong connections which helps to resist loads as the wind blows across and over the structure (Aly and Srinivasa, 2015 [1]). On the other hand, when seismic load is applied to the building, it experiences cyclic loading as the building’s inertia responds to the ground movement. Therefore, the building is designed to efficiently dissipate the seismic energy through damping and yielding of the structural components. In strong wind terrain, when traditional design codes are
employed, the wind demands can be higher than the seismic design demands, and therefore, can control the design. However, studies have shown that the true nonlinear seismic demands can be significantly higher than those predicted by the code-based Response Spectrum Analysis (RSA). The outcomes may invoke the need of seismic performance evaluation of buildings originally designed for wind.
2. Literature Review
This integrated approach to assess the structural performance for both types of loadings has been investigated by various researchers. Adam and Suradi (2008) [2] studied the performance of wind-designed RC buildings in Malaysia against the earthquake loads. The buildings were originally designed for wind with a design speed of 30 m/s to 40 m/s using the static analysis procedure. However, the detailed results show that these buildings were unable to perform well under lateral loads even at low seismic intensities. More
S. Thilakarathnaa, S. Fernandoa, N. Anwarb
S. Thilakarathnaa, S. Fernandoa, N. AnwarbaCivil and Structural Engineering Consultants Pvt. Ltd bStructural Engineering, School of Engineering and Technology, Asian Institute of Technology, Thailand

MODULUS | September 2020Vol. 30 | No. 03
12 SOCIETY OF STRUCTURAL ENGINEERS SRI LANKA
ENGINEERS’ FORUM
recently, Ali and Abburu (2015) [3] conducted a full dynamic case study to observe the behavior of high-rise buildings against earthquake and wind loads while assessing the basic difference between seismic and wind demands.
Two tall buildings (76- and 54-story) were examined against seismic and wind hazard using the Nonlinear Response History Analysis (NLRHA) and wind tunnel test, respectively. It was reported that the high-rise buildings designed for high wind were safe against moderate-level earthquake forces. Hoang (2011) [4] analyzed a 40-story RCcore wall building located in Hanoi, Vietnam designed according to ASCE 7-02 and UBC 97 codes for low to moderate seismic levels. The detailed NLRHA procedure was conducted for the maximum considered earthquake (MCE). It was observed that the true seismic demands computed by the NLRHA procedure were higher than both the wind and seismic demands computed by the code-based methods.
A building system that has multiple towers on a common podium is significantly impacted by the interactions between the towers (Xiaoxuan& Shuang, 1996 [5]). Therefore, two towers and podium should be modelled in same finite element model to capture interactions between the towers and, towers and the podium. This approached has been implemented for the Building “B” in this study.
3. Methodology
3.1 Description of the Buildings
The first case study building (Building “A”) is a 40-story RC core wall building and it is expected to be positioned in Bangkok which is reported as a moderate seismic and wind hazard area.Fig.1(a) shows the Etabs model of the Building “A”. It is designed separately against three levels of wind load i.e. low, moderate and high with moderate seismic load. The lateral load resisting system mainly comprises of a central RC core wall and the moment resisting frame. The gravity load carrying system includes a slab and beam system which rests on peripheral columns and on the central core.
The second building (Building “B”), proposed forty-five storied residential high rise twin towers has been selected to determine the wind effect on the building located in moderate seismic region. The selected case study building is situated in Colombo which is reported as a low to moderate seismic and moderate wind hazard region. Fig.1 (b) represent Etabs model of the building.
(a) Building “A” (b) Building “B”
Figure 1: .Etabs Building models of Building A and B
The Building “B” consists with two residential towers. Reinforced concrete central core located in the middle in each tower will provide vertical transportation, stairs and MEP services. The central core system is expected to be theprimary element providing Lateral Load Resisting Structural System (LLRSS). Podium levels proposed up to Level 7 are allocated for parking thus, a reinforced concrete column – beam structural frame is proposed up to the Level 9; where residential floors begin. A transfer floor is proposed at level 9 and from there onwards reinforced concrete walls are proposed to support all the apartment floors located above Level 9. Reinforced concrete flat slab system with perimeter beams is proposed for typical apartment floors to resist gravity loads.
3.2 The Wind and Seismic Loadings
The seismic demands of the case study buildings were determined using the standard RSA procedure for DBE-level response spectrum which is generally defined in seismic evaluation guidelines as the earthquake with 10% probability of exceedance in 50 years (500-year return period). The performance objective for this level is that the structure should ensure life safety. For the Building “A”, the design spectrum (5% damped) and other seismic design parameters for Bangkok were obtained from Thailand seismic standard (DPT 1302). The ASCE 7-10 was used as the main design code for the RSA analysis. For the Building “B”, Colombo response spectrum was obtained from the book of Numerical Simulation of
Earthquake Induced Ground Motion in Sri Lanka a Finite Difference Approach [6]. The AS-1170 was used as the main design code for the RSA and wind analysis. Finally, the detailed NLRHA procedure was performed to evaluate the seismic performance using a set of ground motion records scaled to Maximum Considered Earthquake (MCE) levels spectrum. The MCE-level earthquake is usually defined as the earthquake with a 2% probability of exceedance in 50 years (2500-year return period). In order to satisfy the performance objective for this hazard level, the structure should not collapse, however it may undergo a certain acceptable level of damage.
Three wind design parameters for Building “A” as low, moderate and high levels; 20 m/s, 40m/s and 55 m/s (3 second gust speed in 50-year return period) respectively were obtained as described by Holmes [7]. According to the Thailand’s DPT 1302 standards, Bangkok has a mean wind speed of 38 m/s (25 m/s hourly mean) which also closer to the selected wind speed for moderate level. The estimation of gust response factor was carried out according to ASCE 7-10. For the Building “B”, basic wind speed of 38 m/s (3 second gust speed in 50-year return period) which is the recommended value for calculating wind loads for post disaster conditions in non- cyclonic regions in Sri Lanka was considered for the design [8].
The structural members were designed based on the maximum demands obtained considering site specific lateral loading due to wind and earthquake loads along with vertical gravity loads. American stand was used for Building “A” and Australian Standard (AS) was used for Building “B” to obtain lateral loads.
3.3 Selection of the Ground Motion Records
The ground motions matching with the specific site conditions are selected from the PEER NGA databases [9]. The MCE response spectrum is calculated to be 1.5 times the 5%-damped DBE response spectrum and all the ground motion records were spectrally matched (Hancock et al., 2006 [10]) to this target response spectrum. Fig.2 and Fig.3show the spectra of selected ground motion records which were matched to 1.5 times the DBE-level of response spectrum for Bangkok and Colombo respectively.
3.4 Linear modeling considerations
A linear elastic 3D finite element model was created and analyzed using ETABS 2015. The modal properties (natural periods, mode shapes, and modal mass participation factors) of all significant vibration modes were obtained in each principal horizontal direction (X and Y). The number of significant modes
representing at least 90 percent of the cumulative participating mass of the building were considered. The elastic responses of all significant vibration modes were obtained and combined into the total responses by the SRSS method. Then, the combined force demands are reduced by the response modification factor (R) to obtain the seismic design demands. The R factor of 6 was selected according to the classification of “dual system with special moment frame” in ASCE 7-10 and 2.6 was selected according to the classification of “Concrete Structures – Limited ductile shear walls” in AS 1170 for Building “A” and Building “B” respectively. The design base shear demand obtained from the RSA procedure should not be less than 90 percent of the design base shear determined by the equivalent static force procedure. The RSA results were scaled as per this condition. Both the global and local responses were obtained from the linear elastic analysis. The case study structures were checked for the allowable displacement and drift limits against both wind and seismic force. Moreover, base shear, story shear and overturning moment values were also obtained.
Figure 2: Spectrum matched ground motion records for
Bangkok
Figure 3: Spectrum matched ground motion records for
Colombo

MODULUS | September 2020Vol. 30 | No. 03
13SOCIETY OF STRUCTURAL ENGINEERS SRI LANKA
ENGINEERS’ FORUM
recently, Ali and Abburu (2015) [3] conducted a full dynamic case study to observe the behavior of high-rise buildings against earthquake and wind loads while assessing the basic difference between seismic and wind demands.
Two tall buildings (76- and 54-story) were examined against seismic and wind hazard using the Nonlinear Response History Analysis (NLRHA) and wind tunnel test, respectively. It was reported that the high-rise buildings designed for high wind were safe against moderate-level earthquake forces. Hoang (2011) [4] analyzed a 40-story RCcore wall building located in Hanoi, Vietnam designed according to ASCE 7-02 and UBC 97 codes for low to moderate seismic levels. The detailed NLRHA procedure was conducted for the maximum considered earthquake (MCE). It was observed that the true seismic demands computed by the NLRHA procedure were higher than both the wind and seismic demands computed by the code-based methods.
A building system that has multiple towers on a common podium is significantly impacted by the interactions between the towers (Xiaoxuan& Shuang, 1996 [5]). Therefore, two towers and podium should be modelled in same finite element model to capture interactions between the towers and, towers and the podium. This approached has been implemented for the Building “B” in this study.
3. Methodology
3.1 Description of the Buildings
The first case study building (Building “A”) is a 40-story RC core wall building and it is expected to be positioned in Bangkok which is reported as a moderate seismic and wind hazard area.Fig.1(a) shows the Etabs model of the Building “A”. It is designed separately against three levels of wind load i.e. low, moderate and high with moderate seismic load. The lateral load resisting system mainly comprises of a central RC core wall and the moment resisting frame. The gravity load carrying system includes a slab and beam system which rests on peripheral columns and on the central core.
The second building (Building “B”), proposed forty-five storied residential high rise twin towers has been selected to determine the wind effect on the building located in moderate seismic region. The selected case study building is situated in Colombo which is reported as a low to moderate seismic and moderate wind hazard region. Fig.1 (b) represent Etabs model of the building.
(a) Building “A” (b) Building “B”
Figure 1: .Etabs Building models of Building A and B
The Building “B” consists with two residential towers. Reinforced concrete central core located in the middle in each tower will provide vertical transportation, stairs and MEP services. The central core system is expected to be theprimary element providing Lateral Load Resisting Structural System (LLRSS). Podium levels proposed up to Level 7 are allocated for parking thus, a reinforced concrete column – beam structural frame is proposed up to the Level 9; where residential floors begin. A transfer floor is proposed at level 9 and from there onwards reinforced concrete walls are proposed to support all the apartment floors located above Level 9. Reinforced concrete flat slab system with perimeter beams is proposed for typical apartment floors to resist gravity loads.
3.2 The Wind and Seismic Loadings
The seismic demands of the case study buildings were determined using the standard RSA procedure for DBE-level response spectrum which is generally defined in seismic evaluation guidelines as the earthquake with 10% probability of exceedance in 50 years (500-year return period). The performance objective for this level is that the structure should ensure life safety. For the Building “A”, the design spectrum (5% damped) and other seismic design parameters for Bangkok were obtained from Thailand seismic standard (DPT 1302). The ASCE 7-10 was used as the main design code for the RSA analysis. For the Building “B”, Colombo response spectrum was obtained from the book of Numerical Simulation of
Earthquake Induced Ground Motion in Sri Lanka a Finite Difference Approach [6]. The AS-1170 was used as the main design code for the RSA and wind analysis. Finally, the detailed NLRHA procedure was performed to evaluate the seismic performance using a set of ground motion records scaled to Maximum Considered Earthquake (MCE) levels spectrum. The MCE-level earthquake is usually defined as the earthquake with a 2% probability of exceedance in 50 years (2500-year return period). In order to satisfy the performance objective for this hazard level, the structure should not collapse, however it may undergo a certain acceptable level of damage.
Three wind design parameters for Building “A” as low, moderate and high levels; 20 m/s, 40m/s and 55 m/s (3 second gust speed in 50-year return period) respectively were obtained as described by Holmes [7]. According to the Thailand’s DPT 1302 standards, Bangkok has a mean wind speed of 38 m/s (25 m/s hourly mean) which also closer to the selected wind speed for moderate level. The estimation of gust response factor was carried out according to ASCE 7-10. For the Building “B”, basic wind speed of 38 m/s (3 second gust speed in 50-year return period) which is the recommended value for calculating wind loads for post disaster conditions in non- cyclonic regions in Sri Lanka was considered for the design [8].
The structural members were designed based on the maximum demands obtained considering site specific lateral loading due to wind and earthquake loads along with vertical gravity loads. American stand was used for Building “A” and Australian Standard (AS) was used for Building “B” to obtain lateral loads.
3.3 Selection of the Ground Motion Records
The ground motions matching with the specific site conditions are selected from the PEER NGA databases [9]. The MCE response spectrum is calculated to be 1.5 times the 5%-damped DBE response spectrum and all the ground motion records were spectrally matched (Hancock et al., 2006 [10]) to this target response spectrum. Fig.2 and Fig.3show the spectra of selected ground motion records which were matched to 1.5 times the DBE-level of response spectrum for Bangkok and Colombo respectively.
3.4 Linear modeling considerations
A linear elastic 3D finite element model was created and analyzed using ETABS 2015. The modal properties (natural periods, mode shapes, and modal mass participation factors) of all significant vibration modes were obtained in each principal horizontal direction (X and Y). The number of significant modes
representing at least 90 percent of the cumulative participating mass of the building were considered. The elastic responses of all significant vibration modes were obtained and combined into the total responses by the SRSS method. Then, the combined force demands are reduced by the response modification factor (R) to obtain the seismic design demands. The R factor of 6 was selected according to the classification of “dual system with special moment frame” in ASCE 7-10 and 2.6 was selected according to the classification of “Concrete Structures – Limited ductile shear walls” in AS 1170 for Building “A” and Building “B” respectively. The design base shear demand obtained from the RSA procedure should not be less than 90 percent of the design base shear determined by the equivalent static force procedure. The RSA results were scaled as per this condition. Both the global and local responses were obtained from the linear elastic analysis. The case study structures were checked for the allowable displacement and drift limits against both wind and seismic force. Moreover, base shear, story shear and overturning moment values were also obtained.
Figure 2: Spectrum matched ground motion records for
Bangkok
Figure 3: Spectrum matched ground motion records for
Colombo

MODULUS | September 2020Vol. 30 | No. 03
14 SOCIETY OF STRUCTURAL ENGINEERS SRI LANKA
ENGINEERS’ FORUM
3.5 The Nonlinear Modeling Considerations
For the nonlinear evaluation purpose, considering shear wall flexure, all the piers are considered. All the coupling beams and link beams and the major columns have been considered for the evaluation. Table 1 illustrates Nonlinear and Linear components of above mentioned buildings. Considering the detailed NLRHA procedure, the full nonlinear 3D models were created in PERFORM 3D (CSI, 2011 [11]). Fig.4 shows the summary of nonlinear modeling approaches used for each type of structural component.
Table 1: Nonlinear and Linear Components of Buildings
Components Building “A” Building “B” RC Shear wall
Nonlinear (Fiber) Nonlinear (Fiber)
Columns Nonlinear (Fiber) Nonlinear (Fiber) Coupling Beams
Moment/Shear Hinge
Moment/Shear Hinge
Link Beams - Moment/Shear Hinge
Beams (Girders)
Moment/Shear Hinge
Linear
Basement Walls
- Linear
Slabs Linear Linear
Stiffness properties were obtained from LATBSDC [12] for different types of analyses. Nonlinear fibre elements automatically account for cracking of concrete because the concrete fibres have zero tension stiffness. So, stiffness modifiers were not used for shear walls. In fibre element modeling, an adequate amount of concrete and steel fibres were used to capture the realistic strain distribution across the members’ cross-sections. The stress-strain relationship for nonlinear materials were assigned to each fibre. The steel fibres were modeled using the Park’s model, while concrete was modeled using the Mander’s model [13].
3.6 Acceptance Criteria
For the deformation-controlled actions, the deformation capacities were calculated using the expected material properties and strength reduction factor of 1.0. The results were checked for mean value of demand from seven sets of ground motion records. For the force-controlled actions, the critical actions
were defined as the actions in which failure mode posed severe consequences to structural stability under gravity and/or lateral loads. For this purpose, 1.5 times the mean value of demand from seven sets of ground motions was used. The capacity was calculated using expected material strength and strength reduction factor of 1. Table 2 shows the acceptance criterion used in this study.
Table 2: The acceptance criteria for MCE level
Item Value Peak transient drift
Maximum of mean values shall not exceed 3%. Maximum drift shall not exceed 4.5%.
Residual drift
Maximum of mean values shall not exceed 1%. Maximum drift shall not exceed 1.5%.
Coupling & Link beam Rotation
≤0.025 radian for collapse prevention performance level ASCE 41-13 Limits
Column rotation
≤0.01 radian for collapse prevention performance level ASCE 41-13 Limits
Shear wall axial strain
≤0.02 in tension and ≤0.04 in compression
4. Analysis Results of Building “A”
4.1 Linear Analysis Results - Global
Three building models were considered for the linear analysis and reinforcement design in Building “A”. Fig.5 shows the typical building floor plan for Building “A” and the elements that are used to represent results in this paper.
Model 01 - Moderate-level seismic and high-level wind load Model 02 - Moderate-level seismic and wind load Model 03 - Moderate-level seismic and low-level wind load
After the design, the three-corresponding nonlinear structural models were developed for detailed performance evaluation and analyzed separately for Building “A” and separate nonlinear model for Building “B”. First, second and third vibration modes are translational in X direction, translational in Y direction and the torsion, respectively. The story shear forces for both wind and earthquake (RSA) are shown in the Fig.6 (a) for all three building models in both X and Y directions.
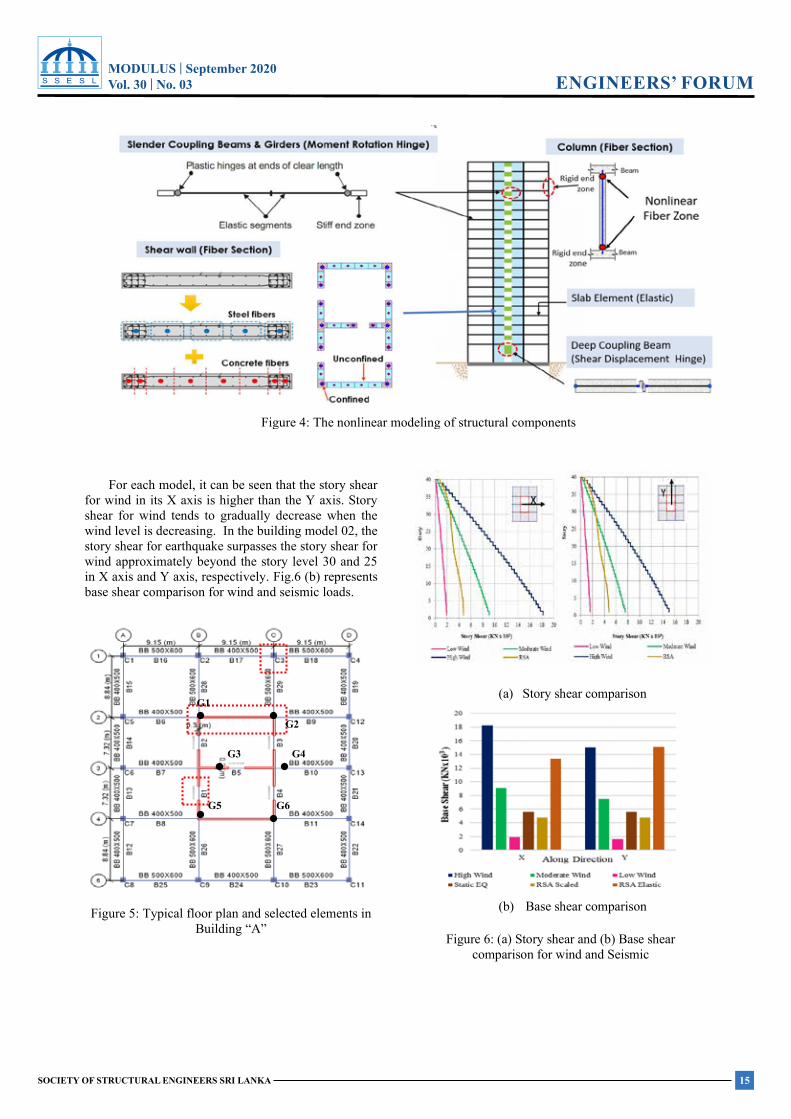
For each model, it can be seen that the story shear for wind in its X axis is higher than the Y axis. Story shear for wind tends to gradually decrease when the wind level is decreasing. In the building model 02, the story shear for earthquake surpasses the story shear for wind approximately beyond the story level 30 and 25 in X axis and Y axis, respectively. Fig.6 (b) represents base shear comparison for wind and seismic loads.
Figure 5: Typical floor plan and selected elements in
Building “A”
(a) Story shear comparison
(b) Base shear comparison
Figure 6: (a) Story shear and (b) Base shear comparison for wind and Seismic
Figure 4: The nonlinear modeling of structural components
G1
G2
G3 G4
G5 G6
MODULUS | September 2020Vol. 30 | No. 03
15SOCIETY OF STRUCTURAL ENGINEERS SRI LANKA
ENGINEERS’ FORUM
3.5 The Nonlinear Modeling Considerations
For the nonlinear evaluation purpose, considering shear wall flexure, all the piers are considered. All the coupling beams and link beams and the major columns have been considered for the evaluation. Table 1 illustrates Nonlinear and Linear components of above mentioned buildings. Considering the detailed NLRHA procedure, the full nonlinear 3D models were created in PERFORM 3D (CSI, 2011 [11]). Fig.4 shows the summary of nonlinear modeling approaches used for each type of structural component.
Table 1: Nonlinear and Linear Components of Buildings
Components Building “A” Building “B” RC Shear wall
Nonlinear (Fiber) Nonlinear (Fiber)
Columns Nonlinear (Fiber) Nonlinear (Fiber) Coupling Beams
Moment/Shear Hinge
Moment/Shear Hinge
Link Beams - Moment/Shear Hinge
Beams (Girders)
Moment/Shear Hinge
Linear
Basement Walls
- Linear
Slabs Linear Linear
Stiffness properties were obtained from LATBSDC [12] for different types of analyses. Nonlinear fibre elements automatically account for cracking of concrete because the concrete fibres have zero tension stiffness. So, stiffness modifiers were not used for shear walls. In fibre element modeling, an adequate amount of concrete and steel fibres were used to capture the realistic strain distribution across the members’ cross-sections. The stress-strain relationship for nonlinear materials were assigned to each fibre. The steel fibres were modeled using the Park’s model, while concrete was modeled using the Mander’s model [13].
3.6 Acceptance Criteria
For the deformation-controlled actions, the deformation capacities were calculated using the expected material properties and strength reduction factor of 1.0. The results were checked for mean value of demand from seven sets of ground motion records. For the force-controlled actions, the critical actions
were defined as the actions in which failure mode posed severe consequences to structural stability under gravity and/or lateral loads. For this purpose, 1.5 times the mean value of demand from seven sets of ground motions was used. The capacity was calculated using expected material strength and strength reduction factor of 1. Table 2 shows the acceptance criterion used in this study.
Table 2: The acceptance criteria for MCE level
Item Value Peak transient drift
Maximum of mean values shall not exceed 3%. Maximum drift shall not exceed 4.5%.
Residual drift
Maximum of mean values shall not exceed 1%. Maximum drift shall not exceed 1.5%.
Coupling & Link beam Rotation
≤0.025 radian for collapse prevention performance level ASCE 41-13 Limits
Column rotation
≤0.01 radian for collapse prevention performance level ASCE 41-13 Limits
Shear wall axial strain
≤0.02 in tension and ≤0.04 in compression
4. Analysis Results of Building “A”
4.1 Linear Analysis Results - Global
Three building models were considered for the linear analysis and reinforcement design in Building “A”. Fig.5 shows the typical building floor plan for Building “A” and the elements that are used to represent results in this paper.
Model 01 - Moderate-level seismic and high-level wind load Model 02 - Moderate-level seismic and wind load Model 03 - Moderate-level seismic and low-level wind load
After the design, the three-corresponding nonlinear structural models were developed for detailed performance evaluation and analyzed separately for Building “A” and separate nonlinear model for Building “B”. First, second and third vibration modes are translational in X direction, translational in Y direction and the torsion, respectively. The story shear forces for both wind and earthquake (RSA) are shown in the Fig.6 (a) for all three building models in both X and Y directions.
For each model, it can be seen that the story shear for wind in its X axis is higher than the Y axis. Story shear for wind tends to gradually decrease when the wind level is decreasing. In the building model 02, the story shear for earthquake surpasses the story shear for wind approximately beyond the story level 30 and 25 in X axis and Y axis, respectively. Fig.6 (b) represents base shear comparison for wind and seismic loads.
Figure 5: Typical floor plan and selected elements in
Building “A”
(a) Story shear comparison
(b) Base shear comparison
Figure 6: (a) Story shear and (b) Base shear comparison for wind and Seismic
Figure 4: The nonlinear modeling of structural components
G1
G2
G3 G4
G5 G6

MODULUS | September 2020Vol. 30 | No. 03
16 SOCIETY OF STRUCTURAL ENGINEERS SRI LANKA
ENGINEERS’ FORUM
Fig.7 shows the distributions of story moment about Y and X axis which tend to follow the same pattern as the story shear. However, the story moment for earthquake surpasses the story moment for moderate wind approximately beyond the level 25 and 15 about Y and X axis, respectively.
Story drift and displacement demands for the wind and RSA in both X and Y axes with allowable (Allow) limits on the three building models are presented in the Table 3. Both story drift and displacement in the X axis is greater than the Y axis and they are gradually decreasing with the decreasing wind level. However, both story drift and displacement stay within the allowable limit.
Table 3: Displacement and drift values for wind and earthquake
Model
Maximum Wind Drift
(Allow. 0.4%)
Maximum Wind
Displacement (Allow. 320mm)
Maximum RSA Drift (Allow2%)
X Y X Y X Y Model 01
0.21 0.12 211 120 0.16 0.12
Model 02
0.16 0.08 133 75 0.16 0.12
Model 03
0.02 0.02 25 14 0.16 0.12
4.2 Linear Analysis Results – Local (Elements)
It is apparent that in building model 01, the flexural D/C ratio is much higher for wind combo for all the considered columns and in building model 03 the ratio is slightly higher for RSA combo (Fig.8(a)). However, there are slight variations in the amount
which the flexural D/C ratio of wind combo exceeds the flexural D/C ratio of RSA combo and vice versa depending on the column position. In the building model 02, it is generally seen that up to story level 20, the flexural D/C ratio of wind combo significantly exceeds the flexural D/C ratio of RSA combo and beyond that level both of them are almost the same. Same trend can be seen in the shear demand capacity ratio (Fig.8 (b)).
(a) Flexure D/C ratio
(b) Shear D/C ratios
Figure 8: The distribution of (a) flexural and (b) shear D/C ratios with story level in column C3
The flexural demand-to-capacity (D/C) ratios of the TOP C pier (Core wall) is presented in Fig.9 (a). In all the piers in the building model 03, the flexural D/C ratio is completely governed by the RSA load combinations in each story level. In the building model 02, in most of the piers, up to story level 10, it is governed by the wind load combinations and then RSA demands exceeds the wind demands. In the building model 01, in almost every pier, up to story level 20, it is governed by the wind load combinations and then the flexural D/C ratio for RSA and wind becomes almost the same up to the roof level. The shear D/C ratios also show a similar pattern as the flexure D/C ratios (Fig.9. (b)).
Model 01 Model 02 Model 03
Model 01 Model 02 Model 03
Figure 7: Story Moments in X and Y directions
(a) Flexure D/C ratio
(b) Shear D/C ratios
Figure 9: The distribution of (a) flexural and (b) shear D/C ratios with story level in the pier TOP C
In the building model 03, the flexural D/C ratio is completely governed by the RSA load combinations in all coupling beams. In the building model 01 it is mostly governed by the wind load combinations with an exception of the uppermost stories (above level 30) where D/C ratio of RSA load combinations slightly exceeds the D/C ratio of wind load. In the building model 02, the flexural D/C ratio is governed by the wind load combinations up to the story level 25, and beyond that it is governed by the RSA load and beyond that it is governed by the RSA load combinations. Fig.10 (a) shows the flexure D/C ratio for coupling beam B1. In each building model, the shear D/C ratio for both wind and RSA combo in each coupling beam is showing a similar trend as the flexural D/C ratio (Fig.10 (b)).
4.3 Nonlinear analysis results
Fig.11 shows the story shear demand obtained from the NLRHA procedure. In order to evaluate the degree of nonlinearity, a linear response history analysis (LRHA) was also performed using the linear elastic model.The average story shear obtained from seven ground motion for three building models were compared with the corresponding linear story shears. Story shear in the linear model and the three nonlinear
models are not varying much along the X axis, however, they are varying reasonably along the Y axis.
Similarly, the average story moment of seven ground motions for nonlinear model 01, 02 and 03 are compared with corresponding values from the linear model (Fig.12). In this case, a reasonable difference can be seen in the story moment about X axis.
(a) Flexure D/C ratio
(b) Shear D/C ratios
Figure 10: The distribution of (a) flexural and (b) shear D/C ratios with story level in Coupling
Beam B1
Figure 11: The comparison of story shear in linear
and nonlinear models
Model 01
Model 01
Model 02
Model 02
Model 03
Model 03
Model 01 Model 02 Model 03
Model 01 Model 02 Model 03

MODULUS | September 2020Vol. 30 | No. 03
17SOCIETY OF STRUCTURAL ENGINEERS SRI LANKA
ENGINEERS’ FORUM
Fig.7 shows the distributions of story moment about Y and X axis which tend to follow the same pattern as the story shear. However, the story moment for earthquake surpasses the story moment for moderate wind approximately beyond the level 25 and 15 about Y and X axis, respectively.
Story drift and displacement demands for the wind and RSA in both X and Y axes with allowable (Allow) limits on the three building models are presented in the Table 3. Both story drift and displacement in the X axis is greater than the Y axis and they are gradually decreasing with the decreasing wind level. However, both story drift and displacement stay within the allowable limit.
Table 3: Displacement and drift values for wind and earthquake
Model
Maximum Wind Drift
(Allow. 0.4%)
Maximum Wind
Displacement (Allow. 320mm)
Maximum RSA Drift (Allow2%)
X Y X Y X Y Model 01
0.21 0.12 211 120 0.16 0.12
Model 02
0.16 0.08 133 75 0.16 0.12
Model 03
0.02 0.02 25 14 0.16 0.12
4.2 Linear Analysis Results – Local (Elements)
It is apparent that in building model 01, the flexural D/C ratio is much higher for wind combo for all the considered columns and in building model 03 the ratio is slightly higher for RSA combo (Fig.8(a)). However, there are slight variations in the amount
which the flexural D/C ratio of wind combo exceeds the flexural D/C ratio of RSA combo and vice versa depending on the column position. In the building model 02, it is generally seen that up to story level 20, the flexural D/C ratio of wind combo significantly exceeds the flexural D/C ratio of RSA combo and beyond that level both of them are almost the same. Same trend can be seen in the shear demand capacity ratio (Fig.8 (b)).
(a) Flexure D/C ratio
(b) Shear D/C ratios
Figure 8: The distribution of (a) flexural and (b) shear D/C ratios with story level in column C3
The flexural demand-to-capacity (D/C) ratios of the TOP C pier (Core wall) is presented in Fig.9 (a). In all the piers in the building model 03, the flexural D/C ratio is completely governed by the RSA load combinations in each story level. In the building model 02, in most of the piers, up to story level 10, it is governed by the wind load combinations and then RSA demands exceeds the wind demands. In the building model 01, in almost every pier, up to story level 20, it is governed by the wind load combinations and then the flexural D/C ratio for RSA and wind becomes almost the same up to the roof level. The shear D/C ratios also show a similar pattern as the flexure D/C ratios (Fig.9. (b)).
Model 01 Model 02 Model 03
Model 01 Model 02 Model 03
Figure 7: Story Moments in X and Y directions
(a) Flexure D/C ratio
(b) Shear D/C ratios
Figure 9: The distribution of (a) flexural and (b) shear D/C ratios with story level in the pier TOP C
In the building model 03, the flexural D/C ratio is completely governed by the RSA load combinations in all coupling beams. In the building model 01 it is mostly governed by the wind load combinations with an exception of the uppermost stories (above level 30) where D/C ratio of RSA load combinations slightly exceeds the D/C ratio of wind load. In the building model 02, the flexural D/C ratio is governed by the wind load combinations up to the story level 25, and beyond that it is governed by the RSA load and beyond that it is governed by the RSA load combinations. Fig.10 (a) shows the flexure D/C ratio for coupling beam B1. In each building model, the shear D/C ratio for both wind and RSA combo in each coupling beam is showing a similar trend as the flexural D/C ratio (Fig.10 (b)).
4.3 Nonlinear analysis results
Fig.11 shows the story shear demand obtained from the NLRHA procedure. In order to evaluate the degree of nonlinearity, a linear response history analysis (LRHA) was also performed using the linear elastic model.The average story shear obtained from seven ground motion for three building models were compared with the corresponding linear story shears. Story shear in the linear model and the three nonlinear
models are not varying much along the X axis, however, they are varying reasonably along the Y axis.
Similarly, the average story moment of seven ground motions for nonlinear model 01, 02 and 03 are compared with corresponding values from the linear model (Fig.12). In this case, a reasonable difference can be seen in the story moment about X axis.
(a) Flexure D/C ratio
(b) Shear D/C ratios
Figure 10: The distribution of (a) flexural and (b) shear D/C ratios with story level in Coupling
Beam B1
Figure 11: The comparison of story shear in linear
and nonlinear models
Model 01
Model 01
Model 02
Model 02
Model 03
Model 03
Model 01 Model 02 Model 03
Model 01 Model 02 Model 03

MODULUS | September 2020Vol. 30 | No. 03
18 SOCIETY OF STRUCTURAL ENGINEERS SRI LANKA
ENGINEERS’ FORUM
Figure 12: The comparison of story moment in linear and nonlinear models
Table 4 presents the maximum average residual drift, transient drift and displacement for seven ground motions in nonlinear models 01, 02 and 03. The values are found to remain within the acceptable limits.
Table 4: Residual Drift, Transient Drift and Displacement Comparison
Model
Maximum Avg.
Residual Drift
(Allow 1.0%)
Maximum Avg.
Transient Drift
(Allow 3.0%)
Maximum Avg.
Displacement
X Y X Y X Y Model 01
0.27 0.17 0.73 0.67 729 566
Model 02
0.23 0.23 0.69 0.59 689 484
Model 03
0.23 0.21 0.71 0.56 696 479
The amount of average energy dissipation from all ground motions is also evaluated for the purpose of comparison. All the nonlinear results can be interpreted in terms of energy dissipation of the elements. Since Model 01 is dissipating less energy, it has less overall damage when compared with other two models. Fig.13 shows the overall energy dissipation in three models.
Table 5 shows comparison of energy dissipated by individual structural components. The dissipated energy in columns is higher in model 01 and similarly, a higher rotation in columns can be seen in the model 01. Likewise, all the nonlinear results can be interpreted in terms of energy dissipation of the elements.
Figure 13: The overall energy dissipation for three building models
Table 5: Energy dissipation comparison
Element Type
Percentage of Energy Dissipation
Model 01
Model 02
Model 03
Column 0.14% 0.08% 0.05% Shear wall 0.30% 0.22% 0.44% Beam 0.77% 0.77% 2.08% Coupling beam
98.79% 98.93% 97.44%
The average column rotation for three nonlinear models is shown in Fig.14. The values were examined against the collapse prevention (CP) limit (lowest limit among three column sections is 0.01) and found to be staying within the limits in each column in each model. It can be seen that the columns in model 01 have more rotation than others towards the top of the building (above 20th floor). However, in lower stories, all three models exhibit the same column rotation.
Figure 14: The comparison of column rotation in three models
The average axial strain values are examined against the limit and it was found that in some locations (G1, G2, G5 and G6), this limit is exceeded in all the building models while in others (G3 and G4), the average stays within the limit. The comparison of axial strains for three models in G3 and G2 locations are shown in the Fig.15. The highest axial strain value at the bottom can be seen in the model 03.
Figure 15: The comparison of axial strain in three models
The average values rotations in coupling beams are examined against the limit of 0.5 and it was found that none of the beams exceed this limit in each model. Fig.16 shows the average rotation in coupling beams in three models. As an overall observation, the model 02 shows more rotation than other two models. However, beam the B3 shows more rotation in model 01 at the upper half of the building than others.
Figure 16: The comparison of average rotations in coupling beam in models
5. Analysis Results of Building “B”
5.1 Linear Analysis Results
The first and second vibration modes were translation in X-direction and Y-direction respectively, while the third mode was in torsion. It was found that the higher vibration modes were significant in the seismic response of the building. Fig.17 shows modal results for linear and nonlinear building models.
Figure 17: Modal results for linear and nonlinear
model Story displacement, drifts, shear and moment are
obtained along the height of the building against wind and earthquakes loads. Table 6 shows maximum deflection and base shear and base moment for wind load. Table 7 represents maximum drift, base shear and base moment of two towers against RSA earthquake load.
Table 6: Deflection, base shear and Base moment against wind
Tower (Tw)
Maximum Wind
Displacement (Allow. 328mm)
Base Shear (kN)
Base Moment (kNm x 103)
X Y X Y X Y Tower 01 72 72 5355 5785 906 949 Tower 02 83 71 5695 4995 923 895

MODULUS | September 2020Vol. 30 | No. 03
19SOCIETY OF STRUCTURAL ENGINEERS SRI LANKA
ENGINEERS’ FORUM
Figure 12: The comparison of story moment in linear and nonlinear models
Table 4 presents the maximum average residual drift, transient drift and displacement for seven ground motions in nonlinear models 01, 02 and 03. The values are found to remain within the acceptable limits.
Table 4: Residual Drift, Transient Drift and Displacement Comparison
Model
Maximum Avg.
Residual Drift
(Allow 1.0%)
Maximum Avg.
Transient Drift
(Allow 3.0%)
Maximum Avg.
Displacement
X Y X Y X Y Model 01
0.27 0.17 0.73 0.67 729 566
Model 02
0.23 0.23 0.69 0.59 689 484
Model 03
0.23 0.21 0.71 0.56 696 479
The amount of average energy dissipation from all ground motions is also evaluated for the purpose of comparison. All the nonlinear results can be interpreted in terms of energy dissipation of the elements. Since Model 01 is dissipating less energy, it has less overall damage when compared with other two models. Fig.13 shows the overall energy dissipation in three models.
Table 5 shows comparison of energy dissipated by individual structural components. The dissipated energy in columns is higher in model 01 and similarly, a higher rotation in columns can be seen in the model 01. Likewise, all the nonlinear results can be interpreted in terms of energy dissipation of the elements.
Figure 13: The overall energy dissipation for three building models
Table 5: Energy dissipation comparison
Element Type
Percentage of Energy Dissipation
Model 01
Model 02
Model 03
Column 0.14% 0.08% 0.05% Shear wall 0.30% 0.22% 0.44% Beam 0.77% 0.77% 2.08% Coupling beam
98.79% 98.93% 97.44%
The average column rotation for three nonlinear models is shown in Fig.14. The values were examined against the collapse prevention (CP) limit (lowest limit among three column sections is 0.01) and found to be staying within the limits in each column in each model. It can be seen that the columns in model 01 have more rotation than others towards the top of the building (above 20th floor). However, in lower stories, all three models exhibit the same column rotation.
Figure 14: The comparison of column rotation in three models
The average axial strain values are examined against the limit and it was found that in some locations (G1, G2, G5 and G6), this limit is exceeded in all the building models while in others (G3 and G4), the average stays within the limit. The comparison of axial strains for three models in G3 and G2 locations are shown in the Fig.15. The highest axial strain value at the bottom can be seen in the model 03.
Figure 15: The comparison of axial strain in three models
The average values rotations in coupling beams are examined against the limit of 0.5 and it was found that none of the beams exceed this limit in each model. Fig.16 shows the average rotation in coupling beams in three models. As an overall observation, the model 02 shows more rotation than other two models. However, beam the B3 shows more rotation in model 01 at the upper half of the building than others.
Figure 16: The comparison of average rotations in coupling beam in models
5. Analysis Results of Building “B”
5.1 Linear Analysis Results
The first and second vibration modes were translation in X-direction and Y-direction respectively, while the third mode was in torsion. It was found that the higher vibration modes were significant in the seismic response of the building. Fig.17 shows modal results for linear and nonlinear building models.
Figure 17: Modal results for linear and nonlinear
model Story displacement, drifts, shear and moment are
obtained along the height of the building against wind and earthquakes loads. Table 6 shows maximum deflection and base shear and base moment for wind load. Table 7 represents maximum drift, base shear and base moment of two towers against RSA earthquake load.
Table 6: Deflection, base shear and Base moment against wind
Tower (Tw)
Maximum Wind
Displacement (Allow. 328mm)
Base Shear (kN)
Base Moment (kNm x 103)
X Y X Y X Y Tower 01 72 72 5355 5785 906 949 Tower 02 83 71 5695 4995 923 895

MODULUS | September 2020Vol. 30 | No. 03
20 SOCIETY OF STRUCTURAL ENGINEERS SRI LANKA
ENGINEERS’ FORUM
Table 7: Drift, Base shear and base moment against RSA
Tower
Maximum RSA Drift (Allowable
0.5%)
Base Shear (kN)
Base Moment (kNm x
103)
X Y X Y X Y Tower 01 0.33 0.34 3683 3420 243 229 Tower 02 0.38 0.33 3043 3321 185 215
5.2 Nonlinear Analysis Results
Story displacements and drifts were checked along the height of the building against MCE earthquakes. Table 8 represent the deflection transient drift, residual drift values against MCE level earthquake and Fig.18 and Fig.19 show maximum value among two towers (Tw).
Table 8: Residual Drift, Transient Drift and Displacement Comparison between two towers
Tower
Maximum Avg.
Residual Drift (Allow
1.0%)
Maximum Avg.
Transient Drift
(Allow 3.0%)
Maximum Avg.
Displacement (mm)
X Y X Y X Y Tower 01 0.10 0.11 0.45 0.48 453 487 Tower 02 0.99 0.13 0.42 0.52 422 651
Figure 18: Max. Drift in Tw 02 Y Dir
Figure 19: Residual drift in Tw01 Y Dir
Base shear and overturning moment values are in table 9. Fig.20 and Fig.21 represent maximum story shear and story moment graphs. Tower 01 shows maximum base shear and moment value.
Table 9: Base shear and moment comparison
Tower
Maximum Average Base Shear x
103kN
Maximum Average Story
Moment x 105kNm
X Y X Y Tower 01 43.48 27.08 29.78 24.62 Tower 02 40.86 36.54 27.34 25.24
Figure 20: Story shear
Tw 01 X Dir Figure 21: Story Moment
Tw 01X Dir
Average compressive and tensile strains at the corners of shear walls shown in Fig.22 were checked under MCE level earthquakes. Compressive strain of concrete is limited to 0.004 while tensile strain in steel is limited to 0.05. In the plots, yielding strain of steel (0.002) is shown to check the flexural yielding of the wall. The Fig.23 shows the two maximum axial strains among 34 locations. Table 10 represents maximum strain values in tower 01 and 02.
Figure 22: Shear wall strain IDs and locations
Figure 23: Maximum strain at G4 Tower 01 and G5
Tower 02
Table 10: Maximum Strain Values in tower 01 and 02
Location Compressive Strain (x 10-3)
Tensile Strain (x 10-3)
Tw 1
G4 1.02 1.65 G5 1.05 1.02 G14 1.01 1.02
Tw 2
G2 1.01 0.52 G5 1.18 1.07 G14 1.24 0.59
Rotation of link beams and coupling beams were checked under MCE level earthquakes. In each story, the link beam and coupling beam rotations were not to exceed 0.025 rad in collapse prevention performance level. Following figures show the immediate occupancy (IO) level performance limit as 0.005 rad to present results in comparable level. Fig.24 represents coupling and link beams locations. Table 11 indicates
link beam rotation values. Fig.25 shows maximum rotation at B5 beam.
Figure 24: Link and Coupling beam IDs and locations
Table 11: Link beam rotation values in tower 01 and 02
Location Maximum Rotation (rad)
“IO” Limit(rad)
Tw 2
B1 0.0033 0.005 B2 0.0012 0.005 B3 0.0023 0.005
Tw 1
B4 0.0015 0.005 B5 0.0035 0.005 B6 0.0018 0.005
Figure 25: Maximum Link Beam Rotation in Tower 01 and 02
Tower 01_G4 Tower 02_G5

MODULUS | September 2020Vol. 30 | No. 03
21SOCIETY OF STRUCTURAL ENGINEERS SRI LANKA
ENGINEERS’ FORUM
Table 7: Drift, Base shear and base moment against RSA
Tower
Maximum RSA Drift (Allowable
0.5%)
Base Shear (kN)
Base Moment (kNm x
103)
X Y X Y X Y Tower 01 0.33 0.34 3683 3420 243 229 Tower 02 0.38 0.33 3043 3321 185 215
5.2 Nonlinear Analysis Results
Story displacements and drifts were checked along the height of the building against MCE earthquakes. Table 8 represent the deflection transient drift, residual drift values against MCE level earthquake and Fig.18 and Fig.19 show maximum value among two towers (Tw).
Table 8: Residual Drift, Transient Drift and Displacement Comparison between two towers
Tower
Maximum Avg.
Residual Drift (Allow
1.0%)
Maximum Avg.
Transient Drift
(Allow 3.0%)
Maximum Avg.
Displacement (mm)
X Y X Y X Y Tower 01 0.10 0.11 0.45 0.48 453 487 Tower 02 0.99 0.13 0.42 0.52 422 651
Figure 18: Max. Drift in Tw 02 Y Dir
Figure 19: Residual drift in Tw01 Y Dir
Base shear and overturning moment values are in table 9. Fig.20 and Fig.21 represent maximum story shear and story moment graphs. Tower 01 shows maximum base shear and moment value.
Table 9: Base shear and moment comparison
Tower
Maximum Average Base Shear x
103kN
Maximum Average Story
Moment x 105kNm
X Y X Y Tower 01 43.48 27.08 29.78 24.62 Tower 02 40.86 36.54 27.34 25.24
Figure 20: Story shear
Tw 01 X Dir Figure 21: Story Moment
Tw 01X Dir
Average compressive and tensile strains at the corners of shear walls shown in Fig.22 were checked under MCE level earthquakes. Compressive strain of concrete is limited to 0.004 while tensile strain in steel is limited to 0.05. In the plots, yielding strain of steel (0.002) is shown to check the flexural yielding of the wall. The Fig.23 shows the two maximum axial strains among 34 locations. Table 10 represents maximum strain values in tower 01 and 02.
Figure 22: Shear wall strain IDs and locations
Figure 23: Maximum strain at G4 Tower 01 and G5
Tower 02
Table 10: Maximum Strain Values in tower 01 and 02
Location Compressive Strain (x 10-3)
Tensile Strain (x 10-3)
Tw 1
G4 1.02 1.65 G5 1.05 1.02 G14 1.01 1.02
Tw 2
G2 1.01 0.52 G5 1.18 1.07 G14 1.24 0.59
Rotation of link beams and coupling beams were checked under MCE level earthquakes. In each story, the link beam and coupling beam rotations were not to exceed 0.025 rad in collapse prevention performance level. Following figures show the immediate occupancy (IO) level performance limit as 0.005 rad to present results in comparable level. Fig.24 represents coupling and link beams locations. Table 11 indicates
link beam rotation values. Fig.25 shows maximum rotation at B5 beam.
Figure 24: Link and Coupling beam IDs and locations
Table 11: Link beam rotation values in tower 01 and 02
Location Maximum Rotation (rad)
“IO” Limit(rad)
Tw 2
B1 0.0033 0.005 B2 0.0012 0.005 B3 0.0023 0.005
Tw 1
B4 0.0015 0.005 B5 0.0035 0.005 B6 0.0018 0.005
Figure 25: Maximum Link Beam Rotation in Tower 01 and 02
Tower 01_G4 Tower 02_G5

MODULUS | September 2020Vol. 30 | No. 03
22 SOCIETY OF STRUCTURAL ENGINEERS SRI LANKA
ENGINEERS’ FORUM
Table 12 shows coupling beam rotation values and Fig.26 represent maximum rotation among all the coupling beams in tower 01 and tower 02.
Table 12: Coupling beam rotations values in tower 01 and 02
Location Maximum Rotation (rad)
“IO” Limit(rad)
Tw 2
CB1 - 0.005 CB2 0.0035 0.005 CB3 0.0040 0.005 CB4 - 0.005
Tw 1
CB5 0.0015 0.005 CB6 - 0.005 CB7 0.0015 0.005 CB8 - 0.005
Figure 26: Maximum Coupling Beam Rotation in Tower 01 and 02
Rotations of columns were checked under MCE level earthquakes. Up to transfer level, the column rotations were not exceeding 0.01 rad in collapse prevention (CP) performance level. Following figures show the immediate occupancy (IC) performance level limit as 0.004 rad. Fig.27 represent column locations and IDs. Table 13 indicates maximum column rotation in tower 01 and tower 02. Fig.28 shows maximum rotation at C7 at tower 01 and C22 at tower 02.
Figure 27: Column locations and IDs
Table 13: Maximum column rotation
Location Maximum Rotation
(rad)
“IO” Limit (rad)
Tw 2
C2 0.0018 0.004 C3 0.0014 0.004 C5 0.0017 0.004 C7 0.0020 0.004
Tw 1
C14 0.0010 0.004 C16 0.0022 0.004 C18 0.0025 0.004 C22 0.0038 0.004
Figure 28: Maximum Coupling Beam Rotation in Tower 01 and 02
6. Conclusion The first study compares the seismic performance
of a 40-story high-rise building designed based ondifferent levels of lateral wind loads. It is shown thatthe true nonlinear seismic demands obtained from thedetailed NLRHA procedure at the MCE-level seismichazard are higher than those of both the wind andseismic demand determined by the RSA procedure.Model 02 which is the combination of moderate windand moderate seismic shows the seismic effect on thewind design significantly. Hence, if the designerssolely depend on the wind demand when designing astructure for a moderate seismic hazard region that willlead for an unsafe design. This shows that the level ofdesign wind load can alter the seismic performance ofhigh-rise dual system buildings.
According to the first case study results, it revealsthat moderate hazard zones such as Colombo city, theCapital of Sri Lanka which is considered as moderatewind and seismic zone should be prioritized withspecial attention in reinforcement designing. Building“B” which consist of a 45-story each two-towerresidential building originally designed for wind forcewhich is the governing lateral load has been evaluatedfor the true seismic performance. Considering thenonlinear behavior of the elements, it was noted thatthe collapse prevention limit was not exceeded.However, the true seismic demand which is obtainedfrom the NLRHA at MCE level is expressively higherthan that of both the wind and seismic demanddetermined by code based method. This shows that thelevel of design wind load can alter the seismicperformance of high-rise buildings. Therefore, even forthe cases where the wind demands control the design oflateral load-resisting system, the detailed performance-based seismic evaluation should be carried out toensure the overall structural safety and integrity.
7. References
[1] Aly, A. M., and Abburu, S., “On the Design of High-Rise Buildings for Multihazard: Fundamental Differences between Wind and Earthquake Demand". Shock and Vibration, Vol. 2015, Article ID 148681.
[2] Adnan, A., and Suradi, S., “Comparison on the effect of earthquake and wind loads on theperformance of reinforced concrete buildings”, 14th World Conference on EarthquakeEngineering, 2008.
[3] Aly, A. M., &Abburu, S., “Design of buildings for wind and earthquake”, Proceedings of the World Congress on Advances in Civil, Environmental,and Materials Research, ACEM’14, 2014.
[4] Thai Hoang, “Effect of the wind resistant design on the seismic design of high-rise buildings withRC core walls in low to moderate seismicityregions”, Master Thesis, Structural Engineering, Asian Institute of Technology, 2011.
[5] Xiaoxuan, Q., & Shuang, S., “Dynamic behavior and seismic design of structural systemshavingmultiple high-rise towers on a common podium”, 11th World Conference onEarthquakeEngineering, 1996.
[6] Shyanaka Dananjaya, “Numerical Simulation ofEarthquake Induced Ground Motion in Sri Lankaa Finite Difference Approach”, 2016.
[7] Holmes, John D. Wind loading of structures. CRCpress, 2015.
[8] Sri Lankan Ministry of Local Government Housingand Construction, “Design of Buildings for HighWinds”, 1980.
[9] http://peer.berkeley.edu/nga/, Visited 13th August2017.

MODULUS | September 2020Vol. 30 | No. 03
23SOCIETY OF STRUCTURAL ENGINEERS SRI LANKA
ENGINEERS’ FORUM
Table 12 shows coupling beam rotation values and Fig.26 represent maximum rotation among all the coupling beams in tower 01 and tower 02.
Table 12: Coupling beam rotations values in tower 01 and 02
Location Maximum Rotation (rad)
“IO” Limit(rad)
Tw 2
CB1 - 0.005 CB2 0.0035 0.005 CB3 0.0040 0.005 CB4 - 0.005
Tw 1
CB5 0.0015 0.005 CB6 - 0.005 CB7 0.0015 0.005 CB8 - 0.005
Figure 26: Maximum Coupling Beam Rotation in Tower 01 and 02
Rotations of columns were checked under MCE level earthquakes. Up to transfer level, the column rotations were not exceeding 0.01 rad in collapse prevention (CP) performance level. Following figures show the immediate occupancy (IC) performance level limit as 0.004 rad. Fig.27 represent column locations and IDs. Table 13 indicates maximum column rotation in tower 01 and tower 02. Fig.28 shows maximum rotation at C7 at tower 01 and C22 at tower 02.
Figure 27: Column locations and IDs
Table 13: Maximum column rotation
Location Maximum Rotation
(rad)
“IO” Limit (rad)
Tw 2
C2 0.0018 0.004 C3 0.0014 0.004 C5 0.0017 0.004 C7 0.0020 0.004
Tw 1
C14 0.0010 0.004 C16 0.0022 0.004 C18 0.0025 0.004 C22 0.0038 0.004
Figure 28: Maximum Coupling Beam Rotation in Tower 01 and 02
6. Conclusion The first study compares the seismic performance
of a 40-story high-rise building designed based ondifferent levels of lateral wind loads. It is shown thatthe true nonlinear seismic demands obtained from thedetailed NLRHA procedure at the MCE-level seismichazard are higher than those of both the wind andseismic demand determined by the RSA procedure.Model 02 which is the combination of moderate windand moderate seismic shows the seismic effect on thewind design significantly. Hence, if the designerssolely depend on the wind demand when designing astructure for a moderate seismic hazard region that willlead for an unsafe design. This shows that the level ofdesign wind load can alter the seismic performance ofhigh-rise dual system buildings.
According to the first case study results, it revealsthat moderate hazard zones such as Colombo city, theCapital of Sri Lanka which is considered as moderatewind and seismic zone should be prioritized withspecial attention in reinforcement designing. Building“B” which consist of a 45-story each two-towerresidential building originally designed for wind forcewhich is the governing lateral load has been evaluatedfor the true seismic performance. Considering thenonlinear behavior of the elements, it was noted thatthe collapse prevention limit was not exceeded.However, the true seismic demand which is obtainedfrom the NLRHA at MCE level is expressively higherthan that of both the wind and seismic demanddetermined by code based method. This shows that thelevel of design wind load can alter the seismicperformance of high-rise buildings. Therefore, even forthe cases where the wind demands control the design oflateral load-resisting system, the detailed performance-based seismic evaluation should be carried out toensure the overall structural safety and integrity.
7. References
[1] Aly, A. M., and Abburu, S., “On the Design of High-Rise Buildings for Multihazard: Fundamental Differences between Wind and Earthquake Demand". Shock and Vibration, Vol. 2015, Article ID 148681.
[2] Adnan, A., and Suradi, S., “Comparison on the effect of earthquake and wind loads on theperformance of reinforced concrete buildings”, 14th World Conference on EarthquakeEngineering, 2008.
[3] Aly, A. M., &Abburu, S., “Design of buildings for wind and earthquake”, Proceedings of the World Congress on Advances in Civil, Environmental,and Materials Research, ACEM’14, 2014.
[4] Thai Hoang, “Effect of the wind resistant design on the seismic design of high-rise buildings withRC core walls in low to moderate seismicityregions”, Master Thesis, Structural Engineering, Asian Institute of Technology, 2011.
[5] Xiaoxuan, Q., & Shuang, S., “Dynamic behavior and seismic design of structural systemshavingmultiple high-rise towers on a common podium”, 11th World Conference onEarthquakeEngineering, 1996.
[6] Shyanaka Dananjaya, “Numerical Simulation ofEarthquake Induced Ground Motion in Sri Lankaa Finite Difference Approach”, 2016.
[7] Holmes, John D. Wind loading of structures. CRCpress, 2015.
[8] Sri Lankan Ministry of Local Government Housingand Construction, “Design of Buildings for HighWinds”, 1980.
[9] http://peer.berkeley.edu/nga/, Visited 13th August2017.