The effect of visual impairment on driving performance · Visual impairment [cataracts, visual...
29
FEDERAL OFFICE OF ROAD SAFETY DOCUMENT RETRIEVAL INFORMATION Report Pages ISBN ISSN 144 2- Title and Subtitle A Report to the Federal Office of Road Safety on the Effect of Visual Impairment on Driving Performance Author (SI Joanne M Wood and Rod Troutbeck Performing OrganisationlName and Addressj Centre for Eye Research and Physical Infrastructure Centre Queensland University of Technology 2 George St BRISBANE QLD 4000 Sponsor GPG B o x 594 Federal Office of Road Safety CAXBERRA ACT 2601 Available from GPO Box 594 Federal Office of Road Safety CANBERRA ACT 2 601 Abstract This study investigates howvisual impairment affects driving performance and whether this can be predicted by visual testin! in a clinic. Visual impairment [cataracts, visual field restriction and monocular vision) was simulated for a group of young normal subjects. Driving performance was assessed (on a closed road circuit) by measuring peripheral awareness, manoeuvring, reversing, reaction times, speed estimation, road positioning and time to complete the course. Subjects function was assessed by measurement using a visuai search and localisation measure, a divided attention reaction time completed a questionnaire of their own perception of their driving performance under conditions of visual impairment. Visual the greatest detriment to driving performance followed by binocular visual field restriction, even though drivers would have measure, and measurement of visual acuity for low contrast letters, using the Pelli-Robson charts. Simulated cataracts cause passed the vision test employed by the driving licence Authorities. The monocular condition did not significantly affect drivin performance for any of the driving tasks assessed. Visual impairment significantly reduced visual search ability and increasec would assist in the appropriate licensing of drivers. reaction time. Visual impairment also increased low contrast visual acuity. There is a strong indication that these visual test! Keywords Vision, Driving, Visual Testing, Driving licence testing
Transcript of The effect of visual impairment on driving performance · Visual impairment [cataracts, visual...

FEDERAL OFFICE OF ROAD SAFETY
DOCUMENT RETRIEVAL INFORMATION
R e p o r t N o . D a t e Pages I S B N ISSN
144 2-
T i t l e and Subt i t le
A Report to the Federal Office of Road Safety on the Effect of Visual Impairment on Driving Performance
Author (SI Joanne M Wood and Rod Troutbeck
Performing O r g a n i s a t i o n l N a m e and A d d r e s s j
Centre for Eye Research and Physical Infrastructure Centre Queensland University of Technology 2 George St BRISBANE QLD 4000
Sponsor
GPG B o x 594 Federal Office of R o a d Safety
CAXBERRA ACT 2 6 0 1
A v a i l a b l e f r o m
GPO B o x 594 Federal O f f i c e of R o a d Sa fe ty
CANBERRA ACT 2 6 0 1
Abstract This study investigates how visual impairment affects driving performance and whether this can be predicted by visual testin! in a clinic. Visual impairment [cataracts, visual field restriction and monocular vision) was simulated for a group of young normal subjects. Driving performance was assessed (on a closed road circuit) by measuring peripheral awareness, manoeuvring, reversing, reaction times, speed estimation, road positioning and time to complete the course. Subjects
function was assessed by measurement using a visuai search and localisation measure, a divided attention reaction time completed a questionnaire of their own perception of their driving performance under conditions of visual impairment. Visual
the greatest detriment to driving performance followed by binocular visual field restriction, even though drivers would have measure, and measurement of visual acuity for low contrast letters, using the Pelli-Robson charts. Simulated cataracts cause
passed the vision test employed by the driving licence Authorities. The monocular condition did not significantly affect drivin performance for any of the driving tasks assessed. Visual impairment significantly reduced visual search ability and increasec
would assist in the appropriate licensing of drivers. reaction time. Visual impairment also increased low contrast visual acuity. There is a strong indication that these visual test!
K e y w o r d s
V i s i o n , D r i v i n g , V i s u a l Testing, D r i v i n g licence t e s t i n g

A Report to the Federal Office of Road Safety
on the
THE EFFECT OF VISUAL IMPAIRMENT ON DRIVING PERFORMANCE
Joanne M Wood* and Rod Troutbeck#
*Centre for Eye Research #Physical Infrastructure Centre
Queensland University of Technology 2 George Street Brisbane Q3000
June 1992
This project was funded by the Federal Office of Road Safety Seeding Grant Scheme.
d F e c t of visual impaim~ent on driving perfomlance Wood and Troutbeck 1
Summary
In modern society, driving is important for participation in many daily activities and may be regarded as
an essential component for maintenance of independence. To deny a person the right to drive imposes a
significant limitation on that person, and for the elderly will often be the first compromise to their
autonomy. The colnnlunity i s aging. Long term projections estimate a 100% increase in people aged 65 years and over. The incidence of visual impaimlent increases with age, thus over the next decade the
number of persons with visual impairment applying for license renewal will increase. This is important as
i t has been suggested that vision comprises the major sensory input for driving. How the changing
characteristics of the driving population, particularly visual characteristics, will affect road systems is as
yet unknown.
The aim of the study was to investigate how visual impairment affects driving performance and whether
this can be predicted by visual testing in a clinic.
Field Testing
Visual impairment was simulated for a group of young nomlal subjects. The subjects wore goggles
designed to simulate the effects of cataracts, visual field restriction and monocular vision. Given an
imposed visual impairment, driving perfomlance could only be assessed on a closed road circuit. Driving
peIformance was assessed by measuring peripheral awareness, manoeuwing, reversing, reaction tin~es,
speed estimation, road positioning and time to complete the course. Subjects completed a questionnaire of
their own perception of their driving perfom~ance under conditions of visual impairment. Onsoing studies
of a group of subjects with true visual impaimlent are being used to validate the field based results for
simulated visual impairment.
Clinical Vision Testing
Visual function was assessed by measurement using two recently developed types of functional visual
field tests. The first is a visual search and localisation measure developed at QUT based on a system used
at western Kentucky University in the late 1980. The second is a divided attention and reaction time
measure and was developed by the research team a t the Centre for Eye Research at QUT. The final
measurement was the assessment of visual acuity for low conbast letters using the Pelli-Robson charts.

dfec t of visual inlp'airment on driving performance Wood and Troutbeck 17
than subjects in whom simulated cataracts had been
imposed, however, the number of errors made was
greater. When the number of errors and the driving
time were combined to give a driving score the
results for the subjects with true cataracts and those
with simulations were comparable. Larger numbers
of visually impaired subjects will be tested as part of
an ongoing project.
Reproducibility of the driving measures
To evaluate the reproducibility and variability of the
assessment of driving performance, the measures
which were common between the present study and
that previously undertaken on the same driving
course (Wood and Troutbeck 1992) were compared.
These are given for baseline and monocular vision
for the two groups (Table 6) , as the visual field
restrictions in the two studies were not comparable.
A two tailed t-test confirmed that these scores were
not significantly different between groups. In the
previous study visual fields were restricted to a
horizontal extent of 40" and 80' to investigate the
extreme effects of field restriction on driving
performance, whilst in the present study the
horizontal field extent was 90'. The cataract
25.0
5.4 7.6
65.0 269.0 394.0
8.8(2.9) ll.O(S.2) 2.6 (2.8) 8.2 (3.3) l.2(1.3) 5.5(3.9) 66.8(8.3) 32.6 (7.7) 232.6 (11.6) 269 (17.5) 286.6 (22.6) 324.0 (31.3)
Table 6: Driving scores for a young subject with right homonymous hemianopia compared to young normal scores under conditions of simulated visual impainnent
Sew ~-.5$ - "
9.0 (2.5) 17 (3.9) 6.3 (4.4) 6.4 (4.3) Zfi(3.6) 3.3 (3.8) S . 7 (9.8) 62.5 (9.4) 247.8(20.7) 354.5([email protected] 297.0(15.0) 4345(121.8)
Table 7: Driving scores for three old subjects with m e cataracts compared to results from old nonmal subjects
simulation has not been previously evaluated
Questionnaire-based assessment
A multiple ANOVA using the statistical program
SAS demonstrated significant differences between
self assessed driving performance for all of the nine
questions (Table 7). In general subjects rated their
pel-formance with the cataract simulation as being
worse and that for baseline as being best. Subjects
noted that when driving into the sun, the cataract
simulation made a very significant impact on their
driving performance and made it very difficult for
them to drive safely.
Visual Performance
Visual acuity
Binocular visual acuity was decreased under
conditions of simulated visual impairment,
particularly for the cataract simulation, but was
always better than the visual requirement of 6/12 for
driving eligibility. Thus drivers with significant
visual impairment, arising from depression of
peripheral sensitivity or overall decrease of contrast
and increase in glare sensitivity, could still pass the
driver licence test.

cffect of visual impairment on driving performance Wood and Troutbeck 16
0 50 1 0 0 150 200 2 5 0 300 3 5 0 400 150
Drlvlng score
Figure 11 Histogram representing the group mean results for driving score for the three visual i m p h ~ e n t s relative to baseline (solid vertical line)
Driving score (Figure 11)
When the accuracy of the peripheral awareness task
and the time taken to complete the circuit were
con~bined as one score, driving performance for the
cataract simulation followed by field resmction had
the greatest decrement to driving performance.
Monocular vision had no significant effect on driving
performance as measured on this closed circuit
course.
True visual impairment
The results for the visually impaired subjects were
compared with age-matched normal data for
simulated visual impairment. Table 4 gives the
results for the young subject with visual field
restriction compared to the mean results for baseline
and simulated visual field restriction for the young
normal subjects described previously. Table 5 gives
the results for the three older subjects with cataracts
The results from the young subject with true visual
field restriction compared well with those from the
young subjects with simulated visual impairment.
For the simulated condition, subjects drove more
slowly and made less errors compared to the subject
who had adapted to a field restriction over a period of
six months. The time over which visual impairment
has developed and the period of adaptation will have
an important impact on driving performance and this
factor will be further investigated in the ongoing
studies.
The results from three patients with true cataracts
compared well with the cataract simulations for a
group of old normal subjects. As for the young
subject with true visual impairment, the older
subjects with true cataracts had shorter driving times
1
I n = 9 I I
Bml ine
2d6.6 212.0 67.0 13.4 5.0
\Ionwular
299.7 255.1
6 4 6 16.6
8.9
Table 4: Comparison between driving scores for the present study and that undertaken previously on the same driving course (Wood and Troutbeck 1992)
DF - 3.54 3.54 3. s 4 3 .54 3.54 3, 54 3.54 3. 54 3, 54
F >due
152.79 71.54 35.92 51.21 50.46
28.94 44.21
36.55 34.04
p rduc
< 0.001 < 0~001 < 0.001
< 0.001 < 0.001 c 0.w1 < 0.001 < 0.001 c 0.001
together with the mean results from six old normal Table 5: Results of the two-way ANOVA for the effect -
subjects (age range from 60 to 70 years) for baseline aSSeSSnlent ofdriving of simulated visual impainnenton questionnaire based
and simulated cataracts collected i n a nilnt studv.

cffect of visual impairment on driving performance W& and Trou tbeck 15 - baseline 15 .780
a > a 2a 3 0 4 0
Reverse Smrs (s-I
Figure 8 Histogranl representing the group mean results for reverse scores for the three visual impairments relative to baseline (solid vertical line)
subjects provided they have a longer period to
complete the task. No record of compe.nsatory head
movements were made in this study, although
qualitative assessment indicated that head movements
were more extrenle when the fields were resnicled as
compared to the other visual conditions.
Road position (Figure 9)
Subjects adopted a different road position when
driving under conditions of visual impairment
compared to baseline. There was a great deal of
variation between drivers in the way in which they
maintained a constant road position whilst driving
along the closed circuit. When n~onocularity was
imposed with the right eye occluded, 12/14 subjects
drove to the left (the kerbside of the road) of their
baseline position, that is in the direction of the seeing
eye.
Barelm 73 075
72.952
Figure 9 Histogram representing the group mean results for road position scores for the three visual impairments relative to baseline (solid vertical line)
Driving time (Figure 10)
The time to complete the circuit was significantly
longer for the cataract condition, followed by visual
field restriction and monocularity. This has
significant implications for traffic flow and may
indicate that persons with cataract and visual field
restriction should avoid peak hour traffic where
maintenance of a given traffic speed is necessary for
constant and efficient traffic flow.
Bassline 242 643
Figure 10 Histogram representing the group mean results for driving time for the three visual impairments relative to baseline (solid vertical line)

cffect of visual impairment on driving performance Wood and Troutbeck 14
the field of view is reduced or under monocular
viewing. Similarly, Groeger and Brown (1988)
using a laboratory simulation, reported that accuracy
of a combined speed and depth estimation task was
better for a 40" field than a 10' field, however, they
found that sensory information from other modalities
such as hearing were important in speed estimation.
The fact that peripheral information was not totally
excluded for any of the visual impaimxnts employed
in this study may explain the lack of a correlation
between speed estimation and extent of the binocular
field. It is likely that factors, other than the vision
(unless it is constricted to totally exclude parafoveal
vision), such as the sound and the vibrations of the
car engine, conhibute to the estimation of speed
(Gibson 1954; Evans 1970; Ohta and Komatsu
1991).
Manoeuvring (Figure 7)
Visual impairment resulted in subjects driving more
slowly through the line of cones which were
designed to simulate roads with cars parked on either
side or narrow gaps in car parks. The number of
cones touched or knocked over during the
manoeuvring task was not, however, significantly
increased for visual impairment. Thus in general
subjects responded to visual impairment by driving
more slowly rather than making more errors. This
has significant implications for the visually impaired
in that if they are given sufficient time they will make
no more errors in these types of tasks than a normal
person.
The finding of no significant difference between the
Figure 7 Histogram representing the group mean results for actual speed manoeuvring score for the three visual impainnents relative to baseline (solid vertical line)
number of manoeuvring errors made between
baseline and monocular vision is interesting as it
suggests that the binocular cues in depth perception
such as stereopsis and convergence are not essential
for nlanoeuvTing through a narrow set of cones. It is
likely that monocular cues such as hue, alignment
and size are more important in manoeuvring through
obstacles within this range. In support of this, it has
been reported that one-eyed private pilots land planes
better than two-eyed pilots (Lewis et a1 1973).
Reversing (Figure 8)
Visual impairment did not significantly affect the
accuracy of parking (in terms of straightness and
centrality) but as for the manoeuvring task, subjects
took significantly longer to reverse into the parking
bay under conditions of visual impairment. Thus for
tasks such as reversing and manoeuvring, subjects in
whom visual impairment has been imposed can
perfom1 the tasks as accurately as visually normal

rffect of visual impairment on driving performance Wood and Trou tbeck 13
Figure 5 Histogram representing the group mean results for reaction times for a) the LED located centrally 011 the dashboard b) the LED located peripherally for the three visual inlpairments relative to baseline (solid vemcal line)
catzact condition than for baseline, however these
differences were not significant. This finding may
have been an artifact of the LED stimuli employed for
the reaction time task, which being relatively bright
were scattered by the cataract simulation and were
therefore rendered more visible than the low contrast
objects such as cars or people which are normally
encountered in driving. For this reason, the reaction
times recorded in this study may have been better than
those measured for drivers with cataracts in response
to another vehicle or pedestxian appearing suddenly in
the field of view.
Speed Estimation (Figure 6 )
Subjects tended to drive slower under conditions of
simulated visual impairment compared to baseline
when requested to drive at a constant speed of 60
kh-1. Subjects commented that they relied upon the
sound and vibration of the car in order to judge speed
and that they drove slower under visually impaired
conditions as they felt less safe. The differences
between conditions was not, however, significant
which is contrary to previous studies which
suggest that flow patterns generated in the
periphery are critical cues for speed estimation
(Gordon 1966; Gibson 1968; Brandt et al 1973).
This hypothesis is also supported by the findings
of road-based studies by Cavallo et a1 (1986) and
Osaka (1988) who reported that subjects
underestimate the speed of a distant object when
Baraline 66 788
As1u.I Spead (kmlh)
Figure 6 Histogram representing the group mean results for actual speed (estimated to be 60 km/h) for the three visua1 impairments relative to baseline (solid vemcal line)

Effect of visual impairment on driving performance Wood and Troutbeck 12
slower for monocular, visual fjeld restriction and
cataracts.
Peripheral Awareness (Figure 4)
The finding that peripheral awareness was reduced
for cataracts and visual field restriction implies that
drivers with these impairments may not detect
peripheral cues, such as other vehicles at
intersections or people at the roadside and therefore
may not receive the same degree of forewarning as
the visually normal driver. This has significant
implications for the way in which drivers use road
systems in terms of their way-finding ability and
their adherence to road rules as dictated by signage.
The reduction in peripheral awaremess resulting
from visual field resbiction was also seen to depend
upon the horizontal extent of the remaining visual
field and the degree of compensatory head
movements that the subjects adopted. Monocular
vision had no significant effect on peripheral
awareness scores.
Paripherel Error Srorem
Figure 4 Histogram representing the group mean results for peripheral awareness error scores for the
verticle line) three visual impairments relative to baseline (solid
The decrement in peripheral awareness for cataracts
and field restriction conditions was most apparent at
times of information overload and is supported by
the results of a pilot study undertaken on the same
driving course (completed as part of a final year
student project) which demonstrated that if the
infomlation overload is reduced (by decreasing the
number of road obstacles and pieces of information
per sign) the difference in peripheral awareness
between the restricted field and the baseline condition
was reduced. There have been a number of studies
which have investigated the problems of divided
attention and time sharing between a number of
visual tasks (Robinson andDesai 1971; Kahneman et
a1 1973). however, little is known about their
contribution to road accidents. This has relevance to
suggestions that the visually impaired should be
permitted to drive under selected road conditions
(Fonda 1989; Bailey and Sheedy 1990).
Reaction times (Figure 5)
Restriction of the binocular visual field had the
greatest effect on reaction times. These results concur
with those of Lovsund and Hedin (1986) who
reported that visual field defects impaired detection
capacity for stimuli in the defective area when driving
performance was assessed by a simulator. Reaction
times were not significantly longer for either the
monocuIar or cataract conditions compared to
baseline although there were a range of results across
the group. These findings indicates that peripheral
vision is important for detecting a change in the
visual environment, such as other road users and
pedestrians and the initiation of appropriate
avoidance action. Reaction times were longer for the

cffect of visual impairment on driving performance Wood and Troutbeck 11
demonstrated that there is a significant learning
component in conventional (Wood et al 1987) and
functional (Shifliin and Schneider 1977) visual field
testing.
Visual acuity
Binocular visual acuity was measured using a high
contrast (90%) chart at the standard working distance
of 6 M to give a similar measure of visual
perfonnance to that used in driving test centres.
Pelli-Robson letter contrast sensitivity
A measure of low contrast letter sensitivity was
determined using the Pelli-Robson letter chart as
described by Pelli et al(1988). This comprised eight
rows of six uppercase letters of constant size which
decreased in contrast from approximately 100% in
the upper left hand corner to 0.95 at the lower right.
The letters were arranged in groups of three, where
contrast was constant within a group, and the
- DF - 3, 54 3, 54 3, 54 3. 54 3 ,54 3 .54 3 .54
3 ,54 3 ,54 3 , 5 4 3 , 5 4 3 , 5 4 3 , 5 4 -
Fvalue
11.42 1.03 2.96 17.68 0.94 5.96 4.31 15.20 20.60 19.13 22.55 32.95 8.68 I p Yalw
NS < 0.031
co.05 < 0.031 NS < 0.D35 NS
< 0.m1 < 0.w1 < O . W l < o col < 0.m1 <o.m1
Table 3: Results of the two-way ANOVA for the effect of simulated visual impaimlent on driving scores
conwast of each group decreased by approximately
0.15 log units. Subjects were required to name the
letters and continue until two or more errors were
made in a group; nil responses were not permitted
and subjects were encouraged to guess as the scoring
depends upon a forced choice paradigm. Contrast
threshold was detemined where each letter counted
as 0.05 log unit.
Results & Discussion
Driving Performance
The results demonstrate that imposing visual
impairment on young normal subjects significantly
affected the manner in which they drive, despite the
fact that they fulfilled the visual requirements for
driving licensure. A two-way AKOVA undertaken
on SAS demonstrated significant differences in
driving performance under the four visual conditions
for all driving tasks except speed estimation,
manoeuvring errors and reversing angle (Table 3).
Post hoc analysis showed that these differences were
between cataracts and the other visual conditions.
The mean scores for the group for each of the three
visual conditions compared to baseline (solid vertical
line) for each of the driving tasks, are given in
histogram form (Figures 4-11). Poorest performance
was recorded for subjects with the simulated cataract
condition, followed by visual field restriction,
monocular vision and then basehe for the peripheral
awareness, driving time, manoeuvring and reversing
measures. Reaction times were longest (worse
performance) for visual field restriction. In the speed
estimation task, subjects drove faster than the
required 60 knv'h for baseline, driving progressively

cffect of visual impairment on driving performance Wood and Troutbeck 10
peripheral task. The easier level comprised
presentation of the peripheral faces in the absence of
any distractor boxes. For the more difficult
condition, the peripheral targets had to be located
from within an array of 47 distractor boxes. The
peripheral response for any of the conditions was
only recorded if the subject gave a correct response
for the central task. To he tested at each of the 24
peripheral locations the subjects thus had to
undertake a minimum of 24 trials for any given
condition.
For a given trial, four consecutive displays were
presented on the computer screen. The first display
was of the central outline box which directed the
observers attention centrally. This was followed by
the appearance of the face in both the central and
peripheral locations, then a random masking noise
and finally a radial spoke pattern which allowed the
subject to indicate the location of the cartoon face.
For each of the four visual conditions, subjects were
tested at the low and high levels of central and
peripheral demand. The results were given as the
total number of errors and as a percentage of the total
number of trials.
Functional Visual Fields: Divided Attention
& Threshold Peripheral Targets
Functional visual fields were also measured whilst
the subject performed a concurrent central task
throughout the test, representing a divided attention
measure. Divided attention tasks have been used in
previous studies of driving to examine the effect of alcohol on driving pefiomance (Moskowitz 1974).
The divided attention functional visual fie'Idte3t yu
undertaken using a standard static automated
perimeter (Humphrey Field Analyser) adapted for
this purpose. Subjects were required to respond to
conventional perimetry spot targets of different
contrasts presented i n the periphery whilst
undertaking a central task which assessed reaction
times. A flashing LED was placed in the central
fixation aperture of the perimeter bowl and linked up
to a control box and a separate response button. The control box determined the pseudorandom
extinguishing of the LED and the response button
served to reactivate the LED when it flashed off.
Subjects were instructed to press the LED response
button whenever the LED flashed off in order to
maintain constant illumination of the central LED.
The response time between the LED flashing off and
activation by the response button was recorded as a
series of reaction times throughout the test. At the
same time perimemc sensitivity was measured at the
fovea and at eccentricities of 1 5 O , 30°, 45" and 60'
along the superior and inferior meridians and at
eccen~cities of 15", 30", 45O, 60" and 75" along the right and left horizontal meridians for target size m.
All measures were undertaken binocularly. Subjects
had two response buttons and were instructed to
respond to the peripherally presented spot targets by
pressing the perimetry button, whilst maintaining
illumination of the central LED target by pressing the
LED response button whenever the fixation light
flashed off.
Subjects were given a series of practice. trials without
the goggles prior to recording for both of the
functional field tests. This was undertaken to
minimise the effect of practice, as it has been

Lffect of visual impairment on driving prfommnce Wood and Troutbeck 9
perfomlance. Dynamic visual acuity nleasures were
found to be too difficult to standardise and the results
were variable. A battery of tests which included
functional visual field testing and low coneast visual
acuity was employed. Functional visual field tests
were selected as previous studies have reported a
comelation between measures of the functional visual
field and accident rates (Avolio et al 1986; Sloane et
al 1991), where the functional field is defined as that
visual field area from which target characteristics can
be acquired when eye and head movements are
precluded (Sanders 1970). A test of letter contrast
sensitivity, which employs low contrast letters was
included, as it has been suggested that such tests
better reflect the visual environment which conlprises
low contrast as well as high contrast detail (Carman
and Brown 1959).
Functional Visual Field: Useful Field of
View
A measure of the functional visual field for
peripheral search and localisation, known as the
Useful Field of View (UFOV), was determined.
Targets were generated on a large computer screen to
measure both central and peripheral information
processing as described by Sekuler and Ball (1986).
The central task provided a stimulus for fixation as
well as creating various levels of central demand.
The peripheral component was designed to measure
localisation of targets in the peripheral field when
targets were embedded within a distracting array and
when presented in an empty field.
A large screen (Sony, Trinitron) which subtended
56" by 51" at the working distance of 28 cm was
Figure 3. Schematic diagram of the display for measurement of the UFOV functional visual field test
employed for display of the targets. Targets
comprised cartcon faces (selected as these are simple
to explain to subjects) which were either smiling or
frowning and subtended 4" by 3.5". Cartoon faces
were presented centrally and in a given peripheral
location for a duration of 901x1s (Figure 3). There
were two levels of difficulty for the central task. For
the easier, or low demand condition, the central
cartoon face was either present or absent, and
subjects simply had to report on the presence of the
face as a yesho response. For the more difficult, or
high demand condition, two faces appeared centrally
(either both smiling, both frowning or one smiling
and one frowning) and the subject had to report
whether the faces were the same or different. In the
peripheral task, the cartoon faces appeared
predictably but eqnally often at 24 different locations
along 8 radial directions at eccentricities of 8", 17'
and 26". The distractor stimuli comprise outline
boxes of the same size and luminance as the cartoon faces. Two levels of difficulty were available for the

.ffect of visual impai~ment on driving perfolmance Wood and Trourbeck 8
Driving runs
Subjects were required to drive around the circuit six
times (each circuit took between 3 and 5 minutes to
complete). The first run was in a clockwise
direction, followed by a run where the car was
driven around in the opposite or anticlockwise
direction. These two runs were to familiarise the.
subjects with the car and the driving skills to be
tested and were undertaken without the goggles in
place. The subjects were allowed to practice all of the
driving tests except for the peripheral awareness task
(as we wished to minirnise the degree of leaming of
the signs). The following four runs were undertaken
in alternate clockwise and anti-clockwise directions
for each of the four visual conditions. The order of
visual conditions for each subject was predetermined
using a random number generator. For a given
subject the order of visual conditions was the same
for both the driving and visual performance
measures. All of the driving assessments were
undertaken between 4.00 pn1 and 6.00 pm (during
daylight saving) to standardise illumination
conditions as much as possible.
Questionnaire-based Assessment
Following completion of the driving assessment each
subject was given a questionnaire to determine self
assessment of driving perfom1ance under the four
visual conditions. The questionnaire comprised nine
questions are given in Table 2 and were designed to
obtain a subjective rating of degrees of driving
difficulty induced by visual impairment
Assessment of Visual Function
A battery of tests of visual function were employed
in order to determine which tests best predicts
driving perfomlance. Pilot studies demonstrated no
relationship between tests of ocular motor balance,
depth perception and colour vision and driving
Table 2: Questionnaire for the self assessment of driving performance

d f e c t of visual impairment on driving perfonnance Wood and Troutbeck 7
Road position
The road position of the car throughout each run
was recorded by a video camera positioned within
the car and directed backwards. The resulting
videotapes were analysed by taking measures of
position of the car relative to the markings at the
edge of the road at three right hand corners, three
left hand comers and three straight stretches of the
course. Five measures were made at each location
giving a total of 45 measures for each run.
Driving Time
The time to complete the course excluding the
manoeuvring and reversing tasks was recorded for
each subject.
Driving Score
This was calculated to assess the compensations for
visual disability made either by taking longer to
complete the course or by making more errors, or a
combination of both. Each error on the peripheral
awareness tasks was given an arbitrary time penalty
of 5 s and added to the total driving time to derive a
total score. Though this is ternled the overall score it
does not account for manoeuvring or reversing
skills.
Manoeuvring
Subjects were required to drive through a series of
cones which were positioned on a wide flat section
of the course (Fig 2). A number of different
arrangements of cones were trialled to detemine the
optimum arrangement whereby the level of difficulty
/z? .. . .
\ * . , .
I I
Figure 2: Schematic diagram of the arrangement of traffic cones for the manoeuvring task.
was great enough to avoid a ceiling effect and could
be easily reproduced from week to week o f the
study. Subjects were insmcted to drive as quickly as
possible through the manoeuvring course without
touching any of the cones. Each cone touched or
knocked over was recorded by an examiner external
to the car and given as an error score. Time taken to
comp1e;e the manoeuvring task was also recorded. A
manoeuning score was calculated as the time taken
to complete the task with a Is penalty for each error.
Reversing
Subjects were required to reverse into a standard
parking bay as quickly and accurately as possible.
The distance of the outer edge of each of the tyres to
the inside border of the white lines delineating the
parking bay were measured to calculate the
straightness of park (expressed as an angle) and
centrality o f parking within the bay. Time taken to
complete the reversing task was also recorded. A
reversing score which took into account both speed
and accuracy of reversing was calculated as time in
seconds with a Is penalty for accuracy.

dbect of visual impairment on driving performance Wood and Tmutbeck 6
STRAIGHT SECTION
I Figure 1 Schematic representation of the driving course at the Police Advanced Driver
Training Centre at Mt Cotton, Queensland.
mzasurid included per ipheral awareness ,
Izanoeuvring, reversing, reaction times, speed
es:<mation, road position and time to complete the C" ' -~-Ult .
PEripheral awareness
St5jects were required to report and identify any
rc,;itd signs or people seen as they drove around the
c k x i t . This included 19 standard road signs, six of
which contained two extra pieces of information
w k x h were changed between runs to mininlise
farAiarity effects. Two people were positioned the
roodside whose positions were changed between
IXUTIS.
Reaction times
TIW LEDs were located within the car interior and
l i n k d to a timing mechanism connected to the brake
pedal and a control box which the examiner
operated. One LED was positioned on the dashboard
and the other at 30' temporal to the left eye. Each
LED was illuminated twice on each run, with the
order and timing of LED presentation randomised to
avoid familiarity effects. On illumination of the LED
the driver was required to lightly press the brake
pedal as quickly as possible and the reaction time
automatically recorded.
Speed estimation
Subjects were instructed to drive at 60 kln/h along a
straight ff at suetch of the circuit, with theview of the
speedometer obscured. The mean speed driven
during this section was recorded. During the two
practice runs, the speedometer was visible to the
drivers, to familiarise them with the task and the
'feel' of the car t ravelhg at that speed.

Effect of visual impairment on driving perfomlance
simulated using frosted lenses. Peripheral field
restriction was simulated by placing pinholes of 6.5
mm in diameter into the swimming goggles, which
resulted in binocular visual fields of a horizontal
extent of approximately 90". The position of the
pinholes relative to the pupil centre of each subject
was individually adjusted to avoid diplopia. Each
subject was also advised to report to the examiner if
they noticed diplopia at any time during either the
driving or visual performance measures. Monocular
vision was simulated by a standard eye patch placed
before the right eye beneath the swimming goggles.
This effectively reduced the horizontal extent of the
visual field from 150' with the baseline swimming
goggles in place to 1OSo, with the physiological
blindspot at 15' eccentricity on the left temporal side.
For the baseline condition the subjects wore the
swimming goggles without any field condition. The
baseline goggles did not restrict the field of vision, as
was demonstrated by measuring binocular visual
fields with and without the goggles.
Visually Impaired Subjects
Twenty subjects with true visual impairment have
been recruited for inclusion in the study and four
have participated so far. A summary of the subject
characteristics are given in Table 1. Written infomxd
1
R > L lens opacnies R 616tZ; 6/S 2011 1/17 4
R > L lens opacitics R 6D; L616 29101121 3
R > L Icns opacities R 6M.5; L 616 31D7121 2
R homonymous hemianopia R 616; L 616 17/11/67
Table 1 Characteristics of the visually impaired snbjects
Wood and Troutbeck 5
consent was obtained from each participant after the
nature and purpose of the study had been fully
explained, with the option to withdraw from the
study at any time. All subjects had distance visual
acuity of 6/12 or better and were holders of a current
drivers license.
Research Vehicle
The car employed for these studies was specially
adapted for this purpose. A car with automatic
transmission was selected in preference to a car with
manual control to increase the number of subject
eligible for participation in the study. The car was
instrumented to record its location and to assess
various aspects of driving performance. It also had
two light emitting diodes (LED) one mounted on the
windscreen and one on the dashboard to provide the
stimulus for the reaction time task. These were linked
up to the brake pedal so an accurate measure of the
time between onset of the LED and braking could be
made. A video camera was mounted in the back of
the car in order to monitor road position on the
driving course,
Assessment of driving performance in the field
Driving performance was assessed on a closed road
circuit at the Police Advanced Driver Training Centre
in Queensland, Australia which comprises a closed
bitumen road containing hills, bends, straight
stretches and standard road signs (Fig 1). The nature
of the visual impairments necessitated that, in the
interests of safety, the circuit was free of other road
vehicles. The aspects of driving performance

cffect of visual impaimlent on driving performance Wood and Troutbeck 4
is the attribute that is most commonly screened,
however, there is no compe.lling evidence that visual
acuity as opposed to other visual functions better
predicts driving performance. Indeed, a number of
investigators have advocated that full visual fields, as
opposed to good central static vision are more
important to driving perfomlance (Buyck et al 1988;
Fonda 1989).
The aims of this study were to determine which types
of visual impairment cause the greatest detriment to
driving and to identify those tests of visual function
which can best predict driving performance. This
was undertaken in two stages. In the fust, the effect
of simulated visual impairment on the driving and
visual performance of normal subjects was
measured. In this way factors other than vision,
known to have an influence on driving performance,
such as experience and higher level of risk taking
would be constant for all visual conditions. In the
second stage, driving and visual performance were
measured for subjects with true visual impairment.
Subjects & Methods
Normal Subjects
Twenty normal subjects were recruited for
participation i n the study, of these, fourteen subjects
satisfied the inclusion criteria and completed all
sections of the study. The age range of the subjects
was from 19 years to 37 years (mean age 23.6 years;
SD 4.5 years). Written informed consent was
obtained from each participant after the nature and
purpose of the study had been fully explained, with
the option to withdraw from the study at any time.
All subjects were in good ocular health and had
distance visual acuity of 6/6 or better and were
holders of a current drivers licence.
Simulations
Three simulations of visual impairment including
monocular vision, cataracts and peripheral field
restriction were employed together with a baseline
condition. Cataracts were selected as they are one of
the most commonly occurring causes of visual
impainnent in elderly populations (Podger et a1
1983). Peripheral field restrictions were selected on
the premise that they are most commonly cited as
resulting in impaired driving performance (Kite and
King 1961; Keeney 1968; Liesmaa 1973) and
monocularity, as this condition excludes drivers
from operating passenger and heavy goods vehicles
in many countries such as Australia (Depmment of
Transport 1992). Pilot studies demonstrated that
simulation of central loss was impossible without the
assistance of sophisticated projection equipment.
Clear lenses with an opaque central spot were
suspended in the goggles but were unsuccessful
because subjects could easily look around the central
spot by moving their eyes. In an attempt to avoid this
problem contact lenses with a black pigmented area
located centrally were employed but this was also
unsuccessful because the central spot could not be
made sufficiently opaque to reduce central vision.
The visual impairments were suspended before the
eyes in modified swimming goggles. The goggles
were secured by a strip of Velcro material which
permitted easy removal of the goggles at any time.
The reduction in contrast and increase in glare
sensitivity experienced by cataract patients was

Effect of visual impaimlent on driving performance \V& and Troutbeck 3 . . /
Introduction
In modern society, driving is important for
participation in many daily activities and may be
regarded as an essential component for maintenance
of independence (Interrante 1986). This has
particular relevance for those living in rural areas of
Australia, where public transport is limited. To deny
a person the right to drive imposes a significant
limitation on that person, and for the elderly will
often be the f r s t compromise to their autonomy.
Since vision has been estimated to comprise u p to
90% of the sensory input for driving (Hills 1980), it
is generally believed that visual inlpairment reduces
driving performance. Most visual impaimlent arises
subsequent to eye disease. Since the prevalence of
eye disease increases significantly with age, the
problem of the visually impaired is likely to become
a major concern for Australia in the future. Long
term projections estimate a 95% increase in people
aged between 50-64 years from 2.2 million in 1984
to 4.3 million in 2021, and a projected 100%
increase in people aged 65 years and over from 1.6
million in 1984 to between 3.4 and 3.5 million in
2021 (Australian Bureau of Statistics 1988). Over
the next decade the number of persons with visual
impairment applying for license renewal will thus
significantly increase.
If visual criteria are used to determine driving
eligibility there should be strong evidence that those
who fail to meet the given vision standard do have
poorer driving performance leading to an
unacceptably high risk of accidents. Although there
is some evidence to support this, there have also
~~ - ~~ ~
been a large number of studies which have failed to
show any direct relationship between vision and
driving performance. Correlations have been
demonstrated between visual acuity (Burg 1967;
196S), visual fields (Keeney and Garvey 1981;
Johnson and Keltner 1983; Cavallo et a1 1986;
Lovsund and Hedin 1986; Groeger and Brown
1988; Osaka 1988; Wood and Troutbeck 19921,
motion perception (Henderson and Burg 1974) and
driving perfomlance. Conversely, other studies have
reported little or no relationship between visual
acuity (Buycket a1 1988; Fonda 1989), visual fields
(Council and Allen 1974; Cole 1979) and driving
performance. The inconsistencies in these findings
may have arisen from the relatively small numbers of
subjects studied and the crudity of the vision tests in
many of the studies. Additionally, with the exception
of the study of Wood and Troutbeck (1992). driving
performance was assessed by laboratory simulation
or by accident rates. The former may bear little
relationship to actual driving conditions and the latter
can only be an index of driving ability as many
accidents remain unreported and those drivers
involved in accident statistics may not necessarily be
'at fault'.
The cost of vision screening can only be jushfkd if it
leads to significant changes i n the visual
characteristics and safety of the driving population in
a manner that will reduce accident rates or enhance
traffic efficiency. There are many characteristics of
vision, which are impaired in eye disease, that could
be considered as requirements for a driving license.
These include measures of central static visual
acuity, dynamic visual acuity, visual fields, colour
vision and contrast sensitivity. Central visual acuity

Effect of visual impairment on driving perfonnance Wood and Tmutbeck 2
Findings
Simulated cataract caused the greatest detriment to driving performance followed by binocular visual field
restriction, even though drivers would have passed the vision test employed by the driving license authorities.
The monocular condition did not significantly affect driving performance for any of the driving tasks
assessed.
Visual impairment significantly reduced visual search ability and increased reaction time as measured by the
functional visual field tests. Visual impairment also decreased low contrast visual acuity.
A good correlation was demonstrated between aspects of driving performance and vision. There was also a
high correlation between visual inlpaimxnt and these tests of visual function. There is a strong indication that
these visual tests would assist in the appropriate licensing of drivers.
The population is expected to develop an increased frequency of visual impairment, thus the results will be
most relevant to road design and road traffic safety. There is a need for more definitive research on the
inter-relationship between visual performance and the performance of the road system. The results from this
study provide a basis for further investigations which will include large numbers of elderly subjects, both
those with visual impairment resulting from eye disease, as well as those with simulated visual impairment.
Gffect of visual impairment on driving performance Wood and Troutbeck 18
I I I I I I
Table 8: Error scores for the radial localisation functional field test as a function of eccentricity.
Functional Visual Field: Useful Field of
View
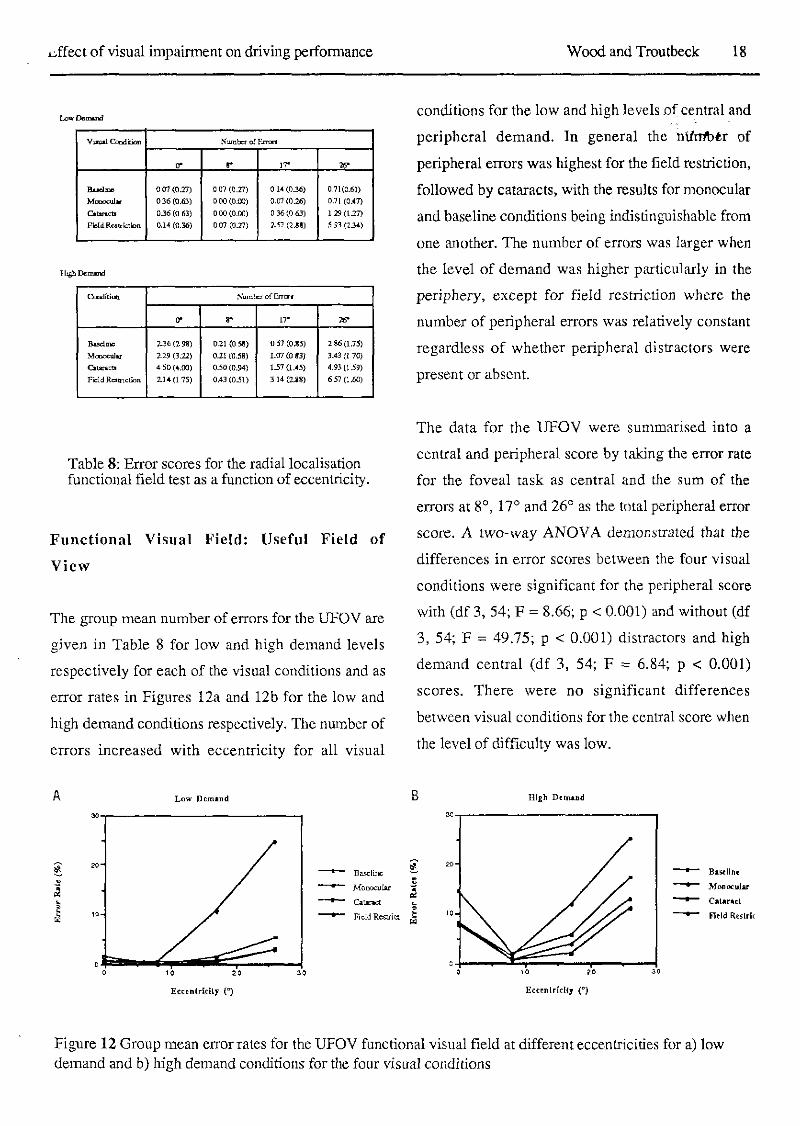
The group mean number of errors for the UFOV are
given in Table 8 for low and high demand levels
respectively for each of the visual conditions and as
error rates in Figures 12a and 12b for the low and
high demand conditions respectively. The nnnlber of
errors increased with eccentricity for all visual
conditions for the low and high levels o f central and
peripheral demand. In general the nilrrlbtr of
peripheral errors was highest for the field restriction,
followed by cataracts, with the results for monocular
and baseline conditions being indistinguishable from
one another. The number of errors was larger when
the level of demand was higher particularly in the
periphery, except for fie.ld restriction where the
number of peripheral errors was relatively constant
regardless of whether peripheral distractors were
present or absent.
. .
The data for the UFOV were summarised into a
central and peripheral score by taking the error rate
for the foveal task as central and the sum of the
errors at go, 17O and 26" as the total peripheral error
score. A two-way ANOVA demonsuated that the
differences in error scores between the four visual
conditions were significant for the peripheral score
with (df 3, 54; F = 8.66; p < 0.001) and without (df
3, 54; F = 49.75; p < 0.001) distractors and high
demand central (df 3, 54; F = 6.84; p < 0.001)
scores. There were no significant differences
between visual conditions for the central score when
the level of difficulty was low.
B Blgh Demand
Figure 12 Group mean error rates for the UFOV functional visual field at different eccentricities for a) low demand and b) high demand conditions for the four visual conditions
~. .. ! ~,
Gffect of visual impairment on driving performance Wood and Trou tbeck 1 9
The fact that the differences between visual
conditions were greatest when the UFOV was
measured under conditions of high demand concurs
with previous reports which suggested that the
difference in UFOV scores between young and
elderly observers was also greater when the task is
set at a high level of central and peripheral demand
(Sekuler and Ball 1986). Indeed, it has been
suggested that the age-related decline in the extent of
the UFOV, demonstrated both in the presence of
distractors (Ceralla 1985; Walker et al 1992) and
with secondary central tasks (Ball et a1 1987), reflect
the problems experienced by older adults with visual
distractors in real life situations such as locating a
familiar face in a crowd or hying to read a street sign
surrounded by other street signs (Kosniket al 1988).
This was also supported by our finding that the
correlations between driving performance and UFOV
scores were higher for the high demand condition.
The finding that visual impairment results in a
decrease in driving performance and an increase in
the number of errors on the UFOV under high
demand is also supported by Sloane et al(l991) who
reported a significant correlation between UFOV
scores and accident rates in elderly drivers. Thus the
UFOV, measured for a complex central task and
peripheral targets embedded within a distractor
array, more closely relates to driving which
comprises a divided attention task involving
localisation of relevant targets within cluttered
environments.
The importance of considering both the central and
peripheral errors on the UFOV task for prediction of
driving was illustrated for field restriction, which
resulted in reduced driving performame k'rt8 ti
significant increase in peripheral UFOV errors but
had little impact on the central scores. Field
restriction was also the only condition for which the
peripheral errors were not increased when distractors
were introduced. This arose because of a ceiling
effect, where subjects with field restriction made
almost the maximum number of peripheral errors in
the absence of distractors and thus the addition of
distractors could not increase number of errors even
though subjects indicated that the presence of the
distractors increased the difficulty of the task.
The fact that subjects performed more poorly on the
localisation task under simulated cataract conditions
indicates that contrast has an important role in this
task. Sekuler and Ball (1956) using a similar test
protocol reported that lens induced blur resulted in
mistakes being made on the central task, where
subjects had to report whether the face was smiling
or frowning, but no decrement in the peripheral
localisation scores. Change in contrast as opposed to
refractive blur thus compromised the localisation task
to a greater extent.
I Group Mean Dab
Condirmn Mm Sensivily (dB) R c a c ~ i o n T i e (s)
Barel~m 26.98(1.14) 0.60 (0.13)
lS.69(1.74) 19.53(1.43) M o n w u l a r
0.64 (0.22) a r a r a c u 0.73 (0.26)
7.60 (2.34) 0.60 (0.17) Field RubiClion
I
Table 9. Group mean reaction times and sensitivity for the divided attention functional visual field test for the four visual conditions

d f e c t of visual impairment on driving perfomlance Wood and Troutbeek 20
0 u c m
Figure 13 Group mean sensitivity measured for the divided attention functional visual field test at different eccentricities along the a) vertical and b) horizontal meridians for the four visual conditions
Functional Visual Fields: Divided Attention
Sr Threshold Peripheral Targets
The group mean differential light sensitivity
measured along the horizontal and venical meridians
of the visual field for each of the four visual
conditions are given in Figures 13a and 13b
respectively. Group mean reaction times and visual
field sensitivity for each of the four visual conditions
are given in Table 9. Reaction time for each field test
was recorded as the average reaction time measured
throughout a given field test, this ranged from
between 46 and 86 responses dependent upon the
examination and subject (the longer the examination
the higher the number of reaction time measures).
Average visual field sensitivity for all 19 measured
locations was calculated for each examination and
given as a mean sensitivity. A two-way ANOVA
demonstrated significant differences between visual
conditions and mean reaction times (df 3, 54; F
425.31; p< 0.001) and mean perimetric sensitivity
(df 3, 54; F 425.31; p< 0.001). Binocular sensitivity
was significantly higher in the inferior field relative
to the superior at 30°, 45' and 60" (p<0.05) and in
the left field relative to the right at 75O ( ~ 4 . 0 5 ) .
The finding that simulated cataracts reduced
sensitivity uniformly across the field is in accord
with previous reports on the effect of true cataracts
on visual fields measured with the static perimeters
such as the HFA (Wood et a1 1989). Restriction of
the visual fields using the simulating goggles linlited
the horizontal extent of the binocular divided
attention field to around 90°, whilst monocularit).
reduced the horizontal extent of the visual fields but
had little impact of the level of sensitivity across the
field.
Central reaction times measured during assessment
of peripheral sensitivity were significantly affected
by visual condition, being worse (increased reaction
times) for the monocular condition. The reason for
this is unclear, but may arise because the probability
of detecting a stimulus is higher if viewed with two
eyes rather than one, due to the phenomenon of
binocular summation. For visual field sensitivity,
binocular summalion has a magnitude of 42 ( W o d
et a1 1991). The finding that central reaction times
for the restricted field and baseline conditions were
not significantly different is not unexpected. Fewer
peripheral targets were visible for the restricted fields

effect of visual impairment on driving perfomlance Wood and Troutbeck 21
condition which reduced the extent of the divided
attention task, allowing the subject to concentrate
more on the central task. For cataracts, as for the
reaction time task in the driving assessment, the
relatively bright LED targets were scattered thus
artificially enhancing their visibility.
Pelli-Robson letter contrast sensitivity
Simulated visual impainnent significantly decreased
letter contrast sensitivity as measured with the
Pelli-Robson chart, where cataracts had the greatest
effect and monocular vision the least. Two-way
ANOVA demonstrated that visual impairment
significantly reduced the scores for the Pelli-Robson
chart (df, 3, 54; 19.674; p < 0.001). Post hoc
analysis showed that these differences were
significant between the cataract condition and all
other visual conditions tested.
The sensitivity of the Pelli-Robson scores to the
cataract simulation is in accord with previous studies
which have demonstrated that tests employing low
contrast letters differentiate better between patients
with cataracts and age-matched normal subjects than
tests of high contrast acuity (Elliot et a1 1991). Good
correlations were demonstrated between the overall
driving score and Pelli-Robson letter acuity and thus
this test may offer promise as a predictor of driving
performance.
Correlation between driving performance & visual function
The relationship between driving performance and
visual function was examined by using correlation
analysis. Significant co~~elations were demonstiatd
between driving score and letter contrast sensitivity
(p<0.05) and the UFOV at the high demand
condition (p<0.2). No correlation was found
between the other driving scores and visual function.
The divided attention visual fields did not reflect
changes in driving performance as well as the high
demand UFOV task, but exhibited similar
correlations to the UFOV for low demand
conditions. This is likely to arise because in these
tests the peripheral targets are presented against an
empty field, whereas in the driving situation,
relevant targets appear against a background of
clutter or irrelevant objects.
Monocular vision
The results regarding the minimal effect of
monocular vision on driving are conwary to previous
studies which report that monocular drivers are
involved in , and cause more accidents than
age-matched normal drivers. Kite and King (1961)
found a seven fold increase in intersection crashes
and pedesvian injuries for monocular drivers, and
Liesmaa (1973) observed that there were three times
as many nlonocular drivers in a group considered to
be driving dangerously compared to a group whose
driving was considered to be safe. Keeney (1968)
reported that the incidence of monocular vision in a
population of drivers cited for multiple driving
violations was as high as 8%. Monocular blindness
on the right side (as simulated in this study) has been
also reported to have more serious consequences for
driving than that on the left (Keeney 1968).
Conversely, Johnson and Keltner (1983) reported

cffect of visual impairment on driving performance 'wood and Troutbeck 22
that there were no significant difference in the
accident and conviction rates for drivers with
monocular visual field loss as compared to a nomlal
control group. More confidence may be placed upon
the latter study since i t used accurate and reliable
methods of visual field assessment, unlike many of
the earlier studies. The results of our study,
demonstrated that monocular drivers are not
significantly worse than visually normal drivers for
any of the driving tasks investigated. Further, since
it is acknowledged that artificial deterioration of the
visual field (without adaptation) would be more
traumatic than visual restriction from birth or when
adapted to over a period of time, we suggest that the
results reported here represent the worse possible
detriment to driving capacity arising from monocular
vision.
Binocular visual field restriction
Constriction of the binocular visual field to a
diameter of 90" reduced many aspects of driving
performance, resulting in slower and more inaccurate
driving performance. It was not until the field was
restricted to smaller than 40°, however, as
demonstrated in a previous study (Wood and
Troutbeck 1992). that any of the aspects of driving
' ' were depressed to a significant level as compared to
baseline. This concurs with the findings of Fishman
et al (1981), who compared the driving records of a
group of retinitis pigmentosa patients to those of
age-matched nom~als. They reported no differences
between the two groups, apart from a subgroup of
five female subjects who had abnomlally high and
unexplained accident rates. Indeed, Burg (1967) in
reported that there was no increase in accident rate
with constriction of the visual field and Council 8r
Allen (1974) found no difference in accident rates
between patients with binocular visual fields smaller
than 140' and those with visual fields larger than
160".
Cataracts
Reduction of contrast levels and increase in glare
sensitivity induced by the cataract simulations
resulted in the greatest decrement in driving
performance, despite the fact that all subjects
satisfied the visual requirements for a driving
licence. In support of these findings for Cataract
simulations, the three subjects with tnle cataracts
tested so far had poorer driving performance as
compared to the age-matched normal controls. The
decrease in driving performance recorded for
simulated and true cataracts was greatest whm
subjects were driving into the sun, particularly in the
late afternoon. These results have very important
implications in terms of road safety, since all elderly
people have some degree of cataract as part of the
age-related process, yet the cataract must be
relatively advanced to reduce visual acuity below the
level required for eligibility for driving. These.
studies are supported by the fact that one of the most
cotnmon complaints of the elderly in general and
particularly those with cataracts, are poor vision for
night-time driving and being almost blinded by
sunlight (Nadler et a1 1982; Cooper 1990). Whether
patients with cataracts have higher accident rates, or
whether accidents occur more frequently at times of
increased glare, such as in the late afternoon, has yet
to be investigated.
~ f f e c t of visual impairment on driving perfomlance Wocd and Troutbeck 23
The results of this study provide evidence that visual
impairment has a direct impact on driving
performance. Interestingly, for many of the driving
measures subjects compensated for artificial visual
impairment by driving more slowly rather than
making more errors. The impact of including the
visually impaired on the roads may therefore to
reduce traffic flow, but possibly not incur a greater
number of accidents and may explain why little
correlation has been found between visual re.striction
and accident rates.
Clearly, imposition of visual restrictions without
adaptation is an ardfcial situation and would produce
a greater impainnent to performance than for a
person whose visual impairment has developed
slowly and to which they will have adapted to some
extent. The study was conducted in this way without
adaptation to examine the worse possible effect that
visual impairment could impose on driving
performance and to isolate the effect of visual
restriction on driving perfonnance in the absence of
contaminating factors. The results from the subjects
with true visual impairment did, however, support
the findings for the subjects with simulated visual
impairment, where driving performance was
significantly worse than that of age-matched normal
' drivers, even though all the participants had a current
driving license.
It is likely that each patient compensates for visual
impairment in an individual manner which may or
may not result in a detriment to road safety, or
alternatively limits driving frequency to a level
commensurate with their perception of their own
driving ability. Indeed, Retchin et al (1988) found
that in a population of elderly subjects, there was a
significant correlation between the extent of the
horizontal peripheral field and the frequency of
driving; subjects with resmction of the horizontal
peripheral field tended to drive only infrequently. A
possible solution to the problem of determining
whether a person applying for reregistration for
driver license i s eligible may be to assess
performance on a selection of visual tasks. This
would provide an index of compensation to visual
compromise and its effect on driving perfomxtnce.
Tests of visual function such as low contrast letter
sensilivity and the UFOV under high levels of
demand may be suitable, as these were shown to
better predict driving performance than conventional
high coneast visual acuity measures. The fact that
these tests are both rapid and easily understood by
the subject, indicates their potential for inclusion in
such a testing battery.
Alternatively, if i t is accepted that the road system
should cater for the population of drivers it may
considered inappropriate to restrict some users
because of a visual impairment which could
reasonably be expected to exist in the driving
population. Drivers need to be able to see and
understand signs and also be able to apply a
reasonable level of car control. On the other hand, it
would be unreasonable for traffic engineers to expect
all drivers to have above average vision and above
average driving ability. Traffic engineers tend to
cater for drivers with lower levels of performance
by:

Lffect of visual impairment on driving performance Wood and Troutbeck 24
increasing the number of signs,
reducing the demands on drivers,
reducing the conflicts a driver must resolve,
* increasing the information given to drivers,
increasing the time between successive conflicts.
If the driving population was to change (as predicted
for our aging population) then there may be
considerably more drivers with these adverse driving
characterist ics which would have to be
accommodated by changing the road design
parameters in this manner.
Conclusions Visual impai~n~ent was shown to compronise certain
aspects of driving performance as assessed on a
driving course. If the population were to develop an
increased frequency of visual impairment, as would
be predicted in an aging population, the results will
be most relevant to road design and road traffic
safety. This indicates a need for more definitive
research on the inter-relationship between visual
performance and the performance of the road
system. The results from this study provide a basis
for further investigations which will include larger
numbers of subjects from all age groups, both those
with visual impairment resulting from eye disease, as
wel! as those with simulated visual impainnent.
Acknowledgements This project was funded by the Federal Office of
Road Safety Seeding Grant Scheme. We gratefully
acknowledge the cooperation of the Queensland
Department of Transport and the Queensland Police
for providing the Mt Cotton Complex for the driving
studies in the field.

Effect of visual impairment on driving perfonnance Wood and Troutheck 25
References
Australian Bureau of Statistics. Projections of the
populations of Australia, States and Territories 1987
to 2031. Catalogue No. 3222.0, 1988.
Avolio BJ, Kroeck KB, Panek PE. Individual
differences in information-processing ability as a predictor of motor vehicle accidents. Human Factors
27: 577-588, 1986.
Bailey TL, Sheedy J. Impaired vision and driving.
In: The International Conference on Low Vision,
1990. Low Vision Ahead 11. Johnston AW,
Lawrence M. (eds) pp. 279-281, 1990.
Ball KK, Beard BL, Miller R L , Roenker DL.
Mapping the useful field of view as a function of
age. Gerontologist 27: 166A, 1987.
Brandt T, Dichans J, Keonig E. Differential effects
of central versus peripheral vision on egocentric and
exocentric motion perception. Exp Brain Res 16,
476-491, 1973.
Burg A. The relationship between vision test scores
and driving record. General findings. Report No.
67-24. Los Angelas, UCLA, Department of
Engineering, 1967.
Burg A. The relationship between vision test scores
and dnving record. Additional findings. Report No.
' 68-27. Los Angelas, UCLA, Department of
. Engineering, 1968.
Buyck A, Missotten L, Maes MJ, Van de Voorde H.
Assessment of the driving behaviour of visually
handicappedpersons. In: Vision in Vehicles 11. Gale
AG, Freeman M H , Haslegrave CM, Smith P, Taylor
SP (eds) Holland: Elseiver Science Publishers BV,
1988 pp 131-142.
C m ~ a n PD, Brown H. Brightness of fine detail in
ground photography. J Opt Soc Am 49: 629-636,
1959.
Cavallo V, Laya 0, Laurent M. The estimation of
Time-to-Collision as a function of visual stimulation.
In: Vision in Vehicles I. Gale AG, Freeman MH,
Haslegrave CM, Smith P, Taylor SP (eds), Elseiver
Science Publishers BV, Holland, 179-183, 1986.
Ceralla J. Age-related decline in extrafoveal letter
perception. J Geront 40: 727-736, 1985.
Cole DG. Follow-up investigation of the visual
fields and accident experience among North Carolina
drivers. University of North Carolina, Highway
Safety Research Center, Chapel Hill, North
Carolina, 1979.
Cooper PJ. Elderly drivers' views of self and
driving in relation to the evidenec of accident data. J
Saf Res 21: 103-113, 1990.
Council FM, Allen JA. A study of the visual fields
of North Carolina drivers and their relationship to
accidents. Chapel Hill, University of North
Carolina, Highway Research Safety Centre, 1974.
Department of Transport (1992) Personal
comn~unication with Driver Licensing Centre,
Brisbane.
Elliott DB, Hurst MA, Weatherill J. Comparing
clinical tests of visual loss in cataract patients using a
quantification of forward light scatter. Eye 5: 601-606, 1991.
Evans L. Speed estimation from a moving
automobile. Ergonomics 13: 219-230, 1970.
Fishmnn GA, Anderson RJ, Stinson L, Haque A.
Driving perfommnce of retinitis pigmentosa patients.
Br JOphthalmol65: 122-126, 1981.
Fonda G. Legal blindness can be compatible with
safe driving. Ophthalmology 96: 1457-1459, 1989.
Gibson JJ. Visual perception of objective and
subjective movement. Psycho1 Rev 61: 304-314,
1954.

Lffect of visual impairment on driving performance Wood and Troutbeck . 76 .
Gibson JJ. What gives rise to the perception of
motion? Psycho1 Rev 75: 335-346, 1968.
Gordon DA. Perceptual basis of vehicular guidance.
Public Road 34: 53-68, 1966.
Groeger JA, Brown ID. Motion perception is not
direct with indirect viewing systems. In: Vision in
Vehicles 11. Gale AG, Freeman M H , Haslegrave
CM, Smith P, Taylor SP (eds) Elsevier Science
Publishers BV, Holland, 27-34, 1988.
Hills BL. Vision, mobility and perception in driving.
Perception 9: 183-216, 1980.
Hirsch RP, Nadler MP, Miller D. Glare
measurement as a predictor of outdoor vision among
cataract patients. Ann Ophthalmol 16: 965-968,
1984.
Interrante J, The road to autopia: The automobile and
the spatial transfomlation of American culture, In:
Lewis DL, Goldstein L (eds): The Automobile and
American Culture, Ann Arbor, The University of
Michigan Press, 89, 1986.
Johnson CA, Keltner JL. Incidence of visual field
loss in 20,000 eyes and its relationship to driving
perfonnance. Arch Ophthalmol 101: 371-375,1983.
Kahneman D, Ben-Ishai R, Lotan hi. Relation of a
test of divided attention to road accidents. J Appl
Psychol58: 113-115, 1973.
Keeney AH. Relationship of ocular pathology and
driving impairment. Trans Am Acad Ophthalmol
Otolaryngol72: 737-740, 1968.
Keeney AH, Garvey .I. The dilemma of the
monocular driver. Am J Ophthalmol 91: 801.802,
1981.
Kite CR, King JN A survey of the factors limiting
the visual fields of motor vehicle drivers in relation
to minimum visual fields and visibility standards. Br
J Physiol Opt 18: 85-107, 1961.
Lewis CF, Blakeley WR, Swaroop R, Masters RL,
McMurty TC. Landing performance by low-time
private pilots after the sudden loss of binocular
vision - Cyclops 11. Aerospace Medicine 44:
1241-1245, 1973.
Kosnik W, Winslow L, Kline D, Rasinski K,
Sekuler R. Visual changes in daily life throughout
adulthood. J Gerontol43: 63-70, 1988.
Liesmaa M. The influence of a drivers vision in
relation to his driving. Optician 166: 10-13, 1973.
Lovsund P, Hedin A. Effects on driving
performance of visual field defects. In: Vision in
Vehicles I. Gale AG, Freeman MH, Haslegrave CM,
Smith P, Taylor SP (eds): Elseiver Science
Publishers BV, Holland, 323-329, 1986.
hioskowitz H. Effects of alcohol on peripheral
vision as a function of attention. Human Factors 16:
174-180, 1974.
Nadler MP, Miller D, LeClaire J. Glare: The
problem, the implications, In: Emery J M , Jackson
AC (eds): Current concepts in cataract surgery.
Selected Proceedings of the Seventh Biennial
Cataract Surgical Congress. New York,
Appleton-Century-Crofts, 263-264, 1982.
Ohta H, Komatsu H. Speed perception in driving - comparison with TV observation. In: Vision in
Vehicles 111. Gale AG, Freeman MH, Haslegrave
CM, Smith P, Taylor SP (eds) Holland: Elseiver
Science Publishers BV, 415-426, 1991.
Osaka N. Speed estimation through restricted visual
field during driving in day and night: naso-temporal
hemifield differences. In: Vision in Vehicles 11. Gale
AG, Freeman M H , Haslegrave CM, Smith P, Taylor
SP. (eds) Elsevier Science Publishers BV, Holland
pp. 45-55, 1988. Pelli DG, Robson JG, Wilkins AJ. The design of a

hffect of visual impairment on driving pefornlance Wood and Troutbeck ~ 27
new letter chart measuring conskast sensitivity. Clin
Vis Sci 2: 187-199, 1988.
Podgor MI, Leske MC, Ederer F. Incidence
estimates for lens changes, macular changes,
open-angle glaucoma and diabetic retinopathy. Am J
Epidenliol 118: 206-212, 1983.
Retchin SM, Cox J, Fox M, Irwin L.
Performance-based measurements among elderly
drivers and nondrivers. J Am Ger SOC 36: 813-819,
1988.
Robinson GH, Desai SD. Control of attention as a
function of risk and risk preference. In:
Psychological Aspects of Driver Behavior, SWOV
Institute for Road Safety Research, Versburg, The
Netherlands, 1971.
Sanders AF. Some aspects of the selective process in
the functional field of view. Ergonoomics 13:
101-117, 1970.
Sekuler R, Ball K. Visual localization: age and
practice. J Opt Soc Am A3, 861-867, 1986.
Shiffrin R M , Schneider W. Conkolled and automatic
human information processing: 11. Perceptual
learning, automatic attending, and a general theory.
Psycho1 Rev 8 4 127-190,1977.
Sloane ME, Owsley, C, Ball K. Visual correlates of
vehicle accidents in older drivers. In Non-invasive
Assessment of the Visual System, Technical Digest
1991. Optical Society of
America, WashingtonDC. Vol 1: 50-53, 1991.
Walker J, Sedney CA, Mast TM. Older drivers and
useful field o f view in a part-task simulator.
Transportation Research Board. 71st meeting, Jan 1992, Washington DC: 1992.
Wood JM, Troutbeck R. The effect of restriction of
the binocular visual field on driving performance.
Ophthal Physiol Optics, In press.
~ ~ ~~- ~~
Wood JM, Collins MJ, Carkeet A. Regional
variations in binocular summation across the visual
field. Ophthal Physiol Opt 12: 46-51, 1992.
Wood JM, Wild JM, Hussey MK, Crews SJ. Serial
examination of the nolmal visual field using Octopus
automated projection perimetry: evidence for a
learning effect. Acta Ophthalmol65: 326-333, 1987.
Wood JM, Wild JM, Smerdon DL, Crews SJ.
Alterations in the shape of the automated perimetric
profile arising from cataract. Graefe's Arch Clin Exp
Ophthalmol 227: 157-161, 1989.