The Effect of the DC School Voucher Program on College ......2 THE EFFECT OF THE DC SCHOOL VOUCHER...
26
EDUCATION POLICY PROGRAM RESEARCH REPORT The Effect of the DC School Voucher Program on College Enrollment Matthew M. Chingos February 2018
Transcript of The Effect of the DC School Voucher Program on College ......2 THE EFFECT OF THE DC SCHOOL VOUCHER...

E D U C A T I O N P O L I C Y P R O G R A M
R E S E A RC H R E PO R T
The Effect of the DC School Voucher
Program on College Enrollment Matthew M. Chingos
February 2018

A BO U T THE U RBA N IN S T ITU TE
The nonprofit Urban Institute is dedicated to elevating the debate on social and economic policy. For nearly five
decades, Urban scholars have conducted research and offered evidence-based solutions that improve lives and
strengthen communities across a rapidly urbanizing world. Their objective research helps expand opportunities for
all, reduce hardship among the most vulnerable, and strengthen the effectiveness of the public sector.
Copyright © February 2018. Urban Institute. Permission is granted for reproduction of this file, with attribution to
the Urban Institute. Cover image by Tim Meko.
Contents Acknowledgments iv
Executive Summary v
The Effect of the DC School Voucher Program on College Enrollment 1
Background on the Opportunity Scholarship Program 2
Data and Methods 5
Student Characteristics and Program Participation 7
Results 8
Conclusions 11
Appendix 13
Notes 15
References 17
About the Author 18
Statement of Independence 19

I V A C K N O W L E D G M E N T S
Acknowledgments This report was funded by the Bill and Susan Oberndorf Foundation, the Walton Family Foundation, the
Robertson Foundation, Kate and Bill Duhamel, the Foundation for Excellence in Education, and the
Charles and Helen Schwab Foundation. We are grateful to them and to all our funders, who make it
possible for Urban to advance its mission.
The views expressed are those of the author and should not be attributed to the Urban Institute, its
trustees, or its funders. Funders do not determine research findings or the insights and
recommendations of Urban experts. Further information on the Urban Institute’s funding principles is
available at https://www.urban.org/aboutus/our-funding/funding-principles.
I thank Mark Dynarski, Brian Kisida, and Martin West for helpful comments on earlier drafts of this
report. I also thank Serving Our Children (especially Jackie Olcott and Rachel Sotsky) and the National
Student Clearinghouse for sharing the data used in this study, and Kristin Blagg, Victoria Lee, and
Warren Lewis for excellent work on various aspects of this project.

E X E C U T I V E S U M M A R Y V
Executive Summary Washington, DC’s, Opportunity Scholarship Program (OSP), the only federally funded voucher program
in the United States, has provided private-school scholarships to low-income students in DC since 2004.
The program is small, but it has received significant attention in national debates over private school
choice and has been the subject of rigorous evaluations mandated by Congress.
This study is the first look at OSP participants’ college enrollment outcomes, measured using
administrative data from the National Student Clearinghouse. I measure the effect of the OSP by
comparing the college enrollment rates of students who were offered a scholarship in lotteries held in
2004 and 2005 with those of students who applied but did not win a scholarship.
I find that students who won scholarships to attend private schools were not significantly more or
less likely to enroll in college than students who did not. These are the first experimental estimates of
the impact of a publicly funded private school choice program on college enrollment.


The Effect of the DC School Voucher
Program on College Enrollment The number of publicly funded private-school scholarships awarded to US children has increased
rapidly, from less than 150,000 in 2004 to more than 400,000 in 2017 (EdChoice 2017). School voucher
programs are almost exclusively enacted by state and local governments. The only federal program is
Washington, DC’s, Opportunity Scholarship Program (OSP), which was authorized by Congress in 2004.
Congress specifically cited concerns about the DC public school system, including lackluster
performance on the National Assessment of Educational Progress, when it created OSP.1
The OSP has been a political football in national debates over private school choice. The program
was closed to new participants under the Obama administration and a Democratic Congress in 2009,
and then reauthorized in 2011 and 2017 by a Republican-led Congresses as part of appropriations bills.
The OSP is currently part of legislation that provides $45 million to DC schools, with $15 million going
to the voucher program and $30 million split between the traditional school district and public charter
schools. This three-sector arrangement dates to the creation of the program, and the notion that
investments should be made in traditional public and charter schools while giving low-income students
immediate alternatives was instrumental in gaining the support of local officials (Hsu 2004).
The DC program is one of a small number of private school choice programs that have now been in
place long enough that student outcomes can be tracked beyond high school. An earlier evaluation of
the OSP found that it increased the rate at which participants graduated from high school, but this
analysis was only possible for a subset of participants and relied on information reported by parents
(Wolf et al. 2013).
More broadly, existing research on private school choice programs is limited but points toward
more positive effects on educational attainment (amount of schooling completed) than achievement
(scores on standardized tests). The handful of studies examining the longer-term effects of private
school choice programs have found positive effects on college enrollment rates among participants in
Milwaukee (Cowen et al. 2013) and Florida (Chingos and Kuehn 2017) and among subgroups of
participants in New York City (Chingos and Peterson 2015).2
In this study, I examine the college enrollment rates of students who applied for a voucher during
the first two years of the program (2004 and 2005) and who are now of college-going age. Like the
earlier studies, I take advantage of lotteries to ensure that the results are not biased by selection into

2 T H E E F F E C T O F T H E D C S C H O O L V O U C H E R P R O G R A M O N C O L L E G E E N R O L L M E N T
the program. This is the first study to examine the impact of a publicly funded private school choice
program on college enrollment using a randomized experiment.
I find that the program had no detectable impact, positive or negative, on the rates at which
participating students enrolled in college or the types of colleges they attended. However, the results
are not precise enough to rule out modest positive or negative effects.
Background on the Opportunity Scholarship Program
The DC Opportunity Scholarship Program, created by an act of Congress in January 2004, provides
scholarships to low-income families (defined as those making no more than 185 percent of the federal
poverty level) to attend private schools. Scholarships are only available to DC residents attending
participating DC private schools. Participating schools must agree to requirements including
nondiscrimination in admissions, fiscal accountability, and the provision of data and information for
evaluation purposes (Wolf et al. 2005).
Figure 1 shows that the program has enrolled between 1,000 and 2,000 students each year since its
inception in 2004–05, with a peak of 1,930 in 2007–08, and 1,166 enrolled in the most recent year for
which data are available (2016–17). Scholarship amounts were initially capped at $7,500 (about $9,700
in 2017 dollars); the maximum is now $8,653 for elementary and middle school and $12,981 for high
school.3
Enrollment in the program is small relative to public school enrollment in DC. OSP enrollment has
never exceeded 3 percent of total enrollment (district, public charter, and OSP) and is currently closer
to 2 percent.4 This largely reflects the fact that program funding can only accommodate a limited
number of students (roughly 1,200 scholarships per year in recent years).5

T H E E F F E C T O F T H E D C S C H O O L V O U C H E R P R O G R A M O N C O L L E G E E N R O L L M E N T 3
FIGURE 1
Enrollment in DC Opportunity Scholarship Program
2004–16
URBAN INSTITUTE
Source: “School Choice: District of Columbia, Opportunity Scholarship Program,” EdChoice, accessed January
25, 2018, https://www.edchoice.org/school-choice/programs/district-of-columbia-opportunity-scholarship-program/.
The law that created the OSP mandated that scholarships be allocated by lottery if there were more
applicant families than funding could accommodate or school spaces available. Two Congressionally
mandated evaluation efforts have used these lotteries to compare the outcomes of students awarded
scholarships to those who applied but did not win the lottery.
The first evaluation tracked 2,308 students who applied for a scholarship beginning in 2004 or
2005 through 2008–09 (Wolf et al. 2010). Three years after application, students who were offered a
scholarship scored significantly higher on reading tests than those who were not (Wolf et al. 2013). This
difference persisted for at least four years after application but was only statistically significant at the
90 percent level.
Estimated positive impacts on reading scores were smaller for students who initially attended
schools designated as in need of improvement (SINI), whom Congress gave priority in the lottery. But
the difference in impacts (for students who attended SINI versus not SINI schools at baseline) was not
statistically significant. There was no significant impact on math scores.
0
500
1,000
1,500
2,000
2,500
2004 2005 2006 2007 2008 2009 2010 2011 2012 2013 2014 2015 2016
Fall school year
Students enrolled

4 T H E E F F E C T O F T H E D C S C H O O L V O U C H E R P R O G R A M O N C O L L E G E E N R O L L M E N T
Parents reported higher levels of satisfaction and perceptions of school safety if their children won
the scholarship lottery, but there were no significant differences in how students perceived the quality
or safety of their school (Kisida and Wolf 2015; Wolf et al. 2013).
Among the subsample of about 500 applicants who were expected to graduate from high school by
2008–09, Wolf and colleagues (2010) report that the offer of a scholarship increased high school
graduation rates (as reported by parents) by 12 percentage points, a 17 percent increase relative to the
control group. The estimated impact of using a scholarship was 21 percentage points.
The second Congressionally mandated evaluation effort is tracking the outcomes of 1,771
participants from the 2012, 2013, and 2014 lotteries. Data from these students’ first school year
following the lottery indicate that receiving a scholarship reduced test scores in reading and math,
although only the math effects are statistically significant (Dynarski et al. 2017). Impacts on parent and
student satisfaction were generally positive but statistically insignificant, whereas impacts on parents’
(but not students’) perceptions of school safety were positive and significant.
These overall findings mask significant heterogeneity across students based on the type of school
they were initially attending and their grade level at the time of application. Students attending SINI
schools experienced negligible impacts on test scores, whereas students attending other schools
experienced large negative impacts. Students in elementary school experienced large negative impacts,
whereas students in middle or high school experienced modest positive impacts (although the latter
were not statistically significant).
A potentially important limitation of existing research on the OSP is that it has relied on voluntary
participation by students and families in data collection efforts, including standardized testing and
surveys. Wolf and colleagues (2010) tested 70 percent of eligible students at least four years after
application and Dynarski and colleagues (2017) tested about 75 percent of students in their study of
students’ first post-lottery year. The parent survey used to measure high school graduation in Wolf and
colleagues (2010) had a response rate of 63 percent.
These are high response rates, but they still require the investigators to assume that
nonrespondents do not differ in unmeasured ways between the treatment and control groups. This
assumption cannot be tested directly, and research indicates that nonresponse can bias estimates of
treatment effects in randomized evaluations of school vouchers, and that commonly used reweighting
techniques may not mitigate this bias (Chingos and Peterson 2015).

T H E E F F E C T O F T H E D C S C H O O L V O U C H E R P R O G R A M O N C O L L E G E E N R O L L M E N T 5
Data and Methods
The present study builds on existing work on the OSP by using administrative records to measure the
college enrollment patterns of participants in the first two lotteries. I track the college enrollment
outcomes of a subset of 1,594 students who applied for a scholarship in 2004 or 2005 and are now old
enough to have potentially graduated from high school and enrolled in college.
Urban Institute researchers worked with the current OSP administrator, Serving Our Children
(SOC), to reconstruct baseline files from the original lottery applications that the Washington
Scholarship Fund (the original OSP administrator) used in 2004 and 2005. These applications did not
include the rich baseline surveys (or measures of student achievement) that the first Congressionally
mandated evaluation used. It did include basic demographic information, including student race and
ethnicity, gender, age, whether the parents or guardians were married, whether parents or guardians
owned their home, and family income. Urban and SOC put in place strict procedures to ensure that
applicants’ personally identifiable information was never released to anyone outside SOC.
I used these data to identify students who met the same criteria used to construct the study sample
for the original evaluation. These were students who were attending a public school at baseline (or were
entering kindergarten) and who were subject to the lottery because they applied for a grade that was
oversubscribed and were not part of a priority group guaranteed to win a scholarship.6
I reconstructed baseline records for 2,282 students who met these requirements, which is 99
percent of the evaluation sample size of 2,308 reported in Wolf and colleagues (2010). I grouped
students based on the year of application, grade they were entering (as reported on the application),
and whether they were attending a SINI school at baseline.7 These groupings affected the likelihood
that the student won the lottery, which I adjust for throughout the analysis using the same base weights
used by Wolf and colleagues (2010, table A.4).
For this study, I limit the sample of students to those who can be observed for at least two years
following their expected graduation from high school (assuming on-time progression from the grade
they were entering at the time of their OSP application). This two-year window permits the observation
of college enrollment outcomes of students who repeated a grade before high school graduation or who
did not enroll in college immediately afterward.
A total of 1,601 students met this criterion, and the complete data on name and date of birth
needed to match to administrative records on college enrollment were available for 1,594 (99.6
percent) of these students. The students included in this study were entering grades 3–12 at the time of

6 T H E E F F E C T O F T H E D C S C H O O L V O U C H E R P R O G R A M O N C O L L E G E E N R O L L M E N T
application; the 681 students who were entering grades K–2 in 2004 and 2005 are not yet old enough
to be observed for at least two years after expected high school graduation.
These records were matched to administrative data on college enrollment maintained by the
National Student Clearinghouse (NSC), a nonprofit organization that collects student-level enrollment
and degree data from colleges and universities making up 97 percent of enrollment in the US. Coverage
rates exceed 95 percent in all sectors of higher education (as of fall 2016), except the for-profit sector,
where the coverage rate is 71 percent. These coverage rates have increased over time; in fall 2006, the
coverage rate was 89 percent.8
NSC data have been used extensively in education research (see, e.g., Chingos and Peterson 2015;
Dynarski, Hemelt, and Hyman 2015). These data are nearly universal and do not require contacting
students to obtain information. Administrative data from NSC are thus more complete and accurate
that can typically be obtained by survey.
I use the NSC data to measure whether students in the OSP lotteries enrolled in college within a
given number of years after expected high school graduation. I measure college enrollment overall as
well as by sector (two- versus four-year and public versus private) and whether the student ever
enrolled full time.9 The NSC data also include information on degree receipt, but too few students are
old enough to have potentially received a college degree, so I do not use this information in the present
study.
I report the effect of winning the OSP lottery as the difference between the average outcome of the
treatment group (won the lottery) and the control group (lost the lottery). All differences are weighted
as described above and are estimated as marginal effects from probit regressions with standard errors
clustered by family. I report results with and without control variables derived from the scholarship
application.
These estimates are “intent to treat” (ITT) in that they capture the effect of being offered a
scholarship, when in fact many students who were offered a scholarship did not use one. Among all
students who won the lottery, 70 percent used a scholarship for at least one year.10 I only report ITT
estimates throughout this study, but the effect of using a scholarship for at least one year can be
calculated by dividing the ITT estimates by 0.7.11
T H E E F F E C T O F T H E D C S C H O O L V O U C H E R P R O G R A M O N C O L L E G E E N R O L L M E N T 7
Student Characteristics and Program Participation
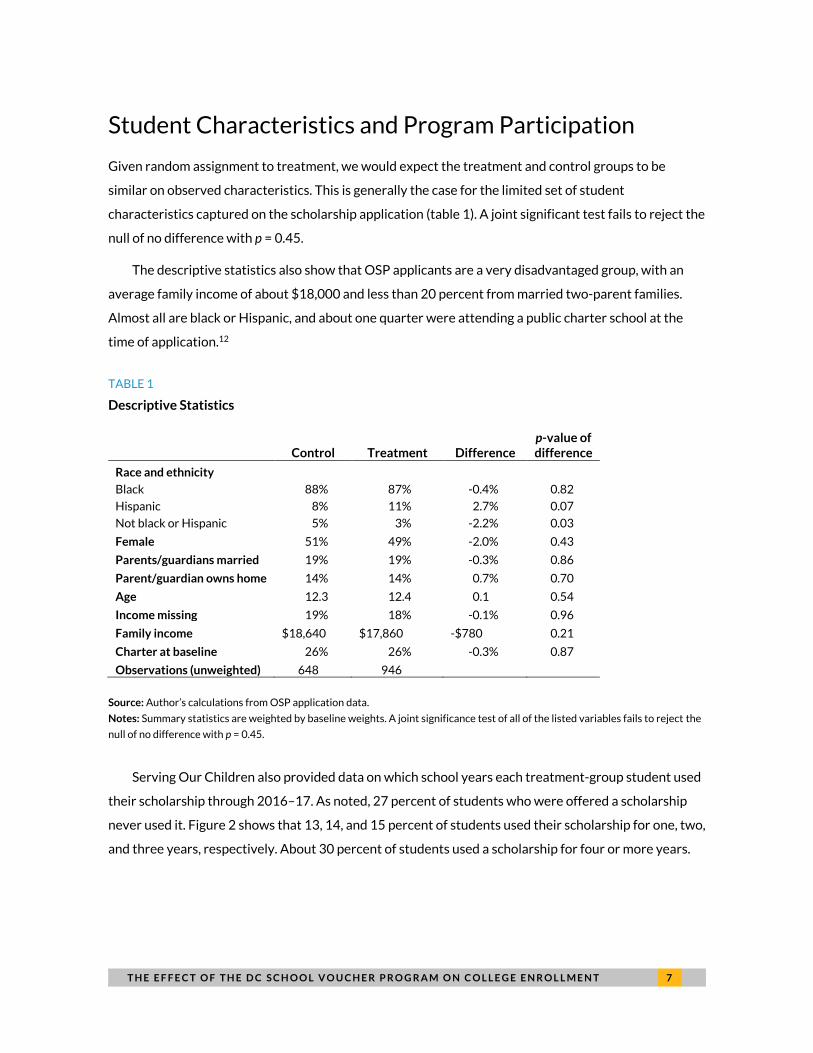
Given random assignment to treatment, we would expect the treatment and control groups to be
similar on observed characteristics. This is generally the case for the limited set of student
characteristics captured on the scholarship application (table 1). A joint significant test fails to reject the
null of no difference with p = 0.45.
The descriptive statistics also show that OSP applicants are a very disadvantaged group, with an
average family income of about $18,000 and less than 20 percent from married two-parent families.
Almost all are black or Hispanic, and about one quarter were attending a public charter school at the
time of application.12
TABLE 1
Descriptive Statistics
Control Treatment Difference p-value of difference
Race and ethnicity Black 88% 87% -0.4% 0.82
Hispanic 8% 11% 2.7% 0.07
Not black or Hispanic 5% 3% -2.2% 0.03
Female 51% 49% -2.0% 0.43
Parents/guardians married 19% 19% -0.3% 0.86
Parent/guardian owns home 14% 14% 0.7% 0.70
Age 12.3 12.4 0.1 0.54
Income missing 19% 18% -0.1% 0.96
Family income $18,640 $17,860 -$780 0.21
Charter at baseline 26% 26% -0.3% 0.87
Observations (unweighted) 648 946
Source: Author’s calculations from OSP application data.
Notes: Summary statistics are weighted by baseline weights. A joint significance test of all of the listed variables fails to reject the
null of no difference with p = 0.45.
Serving Our Children also provided data on which school years each treatment-group student used
their scholarship through 2016–17. As noted, 27 percent of students who were offered a scholarship
never used it. Figure 2 shows that 13, 14, and 15 percent of students used their scholarship for one, two,
and three years, respectively. About 30 percent of students used a scholarship for four or more years.

8 T H E E F F E C T O F T H E D C S C H O O L V O U C H E R P R O G R A M O N C O L L E G E E N R O L L M E N T
FIGURE 2
Years of Participation in OSP
URBAN INSTITUTE
Source: Author’s calculations from OSP administrative data.
Students who entered the OSP in later grades had fewer remaining years in school in which they
could have participated in the program. The average lottery winner used the scholarship for 39 percent
of their remaining years in K–12 schools. The corresponding percentage for students who used a
scholarship for at least one year is 55 percent.13
Wolf and colleagues (2010) list several reasons students did not use their scholarship or stopped
participating, including a lack of space at a desired private school, a lack of services for students with
special needs, admission to a preferred charter school, a child’s private school being converted into a
public charter school, or losing eligibility through a rise in family income or moving out of DC.
Results
My main findings are reported in figure 3 and detailed regression results are provided in table A.1.
Overall, students offered a scholarship were somewhat less likely to enroll in college within two years
of expected graduation from high school: 42 percent did compared with 46 percent of applicants who
27%
13%14%
15%
10%8%
5%
2%2% 2% 1%
0%
1 2 3 4 5 6 7 8 9 10 11 12
Years of OSP participation
Treatment-group students
0

T H E E F F E C T O F T H E D C S C H O O L V O U C H E R P R O G R A M O N C O L L E G E E N R O L L M E N T 9
lost the lottery. None of these differences are statistically distinguishable from zero at conventional
levels.
This pattern holds for both two- and four-year colleges and for four-year public and four-year
private colleges (table A.1). Adding control variables has little impact on the results, as would be
expected given random assignment.
FIGURE 3
Effect of OSP Voucher Offer on College Enrollment within Two Years of Expected
High School Graduation
URBAN INSTITUTE
Source: Author’s calculations from linked OSP and NSC data.
Note: For detailed regression results, see table A.1.
I observe a subset of students for more than two years after expected high school graduation, with
fewer students observed for longer periods of time. Figure 4 reports the effect of winning the OSP
lottery on college enrollment within two, three, four, and five years of expected high school graduation.
None of the estimates are statistically distinguishable from zero, but the modest negative estimate for
the full sample becomes a small positive estimate for those observed for at least five years.
46%
14%
35%
46%
14%
35%
42%
13%
33%
43%
13%
33%
Any college Two-year college Four-year college Any college Two-year college Four-year college
No controls With controls
Not offered voucher Offered voucher

1 0 T H E E F F E C T O F T H E D C S C H O O L V O U C H E R P R O G R A M O N C O L L E G E E N R O L L M E N T
This result suggests that the negative estimate in the short run merely reflects a delay in when
some students enter college, perhaps because private schools are more likely to hold them back for
multiple grades or their entrance into college is more likely to be delayed for other reasons.
The change in results may also be in part because of the change in the sample of students examined.
I find slightly less negative two-year impacts for students observed for three through five years than for
students observed for two years, mostly because of differences in the control group’s enrollment rate
(table A.2).14
FIGURE 4
Effect of OSP Voucher Offer on College Enrollment within 1–5 Years of High School Graduation
URBAN INSTITUTE
Source: Author’s calculations from linked OSP and NSC data.
Note: For detailed regression results, see table A.2 specifications with maximum possible sample size for each outcome.
It is important to interpret these results in light of the imprecision of the estimates. For example,
the three-year result reported in figure 4 cannot rule out a zero effect at the 95 percent confidence
level, but it also cannot rule out a negative effect of 5 percentage points or a positive effect of 6
percentage points. Such effects would roughly correspond to 10 percent changes relative to the control
group’s college enrollment rate of 46 percent.
-0.12
-0.10
-0.08
-0.06
-0.04
-0.02
0.00
0.02
0.04
0.06
0.08
0.10
0 1 2 3 4 5
Enrollment within X years of expected high school graduation
Effect of scholarship offer (with 95 percent confidence intervals)

T H E E F F E C T O F T H E D C S C H O O L V O U C H E R P R O G R A M O N C O L L E G E E N R O L L M E N T 1 1
These results reflect the outcomes of everyone in the treatment group, regardless of how long they
used a scholarship to attend private school or if they used it at all. This is necessary in the context of a
randomized experiment with limited baseline data, as it is not possible to randomize whether a student
uses a scholarship that is offered to them and how long they use it. Controlling for a rich set of baseline
data on student characteristics (including test scores), the association between scholarship usage and
college enrollment can be informative (see, e.g., Chingos and Kuehn 2017). But this is not the case in this
context given the limited data available from the application.15
Finally, I estimate the effect of winning a scholarship for subgroups of students, defined based on
demographic characteristics and the types of schools they attended at the time of application. There is
no compelling evidence of effect heterogeneity, although the effects are often imprecisely estimated
given the reduced sample size (table A.3). None of the estimated effects are significantly different from
zero. For example, I find no evidence of more positive effects among students from SINI public schools
than students from other schools.
Conclusions
This study provides the first experimental evidence on the effect of a publicly funded private school
choice program on college enrollment. I find that students who won a scholarship to attend a private
school in Washington, DC, enrolled in similar types of colleges at similar rates as students who were not
offered a private school voucher.
No significant difference between scholarship winners and losers still suggests a possible
productivity benefit of the private sector, as the maximum voucher amount ($9,700 in 2017 dollars)
was less than half of average per-pupil spending in public schools (roughly $20,000 in 2017 dollars in
2004–05, and more in later years).16 Additionally, some studies find that competition from private
school choice programs boosts outcomes in public schools (e.g., Figlio and Hart 2014), but this was
unlikely in the DC context because of the small size of the program (Wolf et al. 2010).17
The lack of a positive impact on college enrollment may be surprising in light of prior evidence
indicating a large positive effect of the program on high school graduation rates (Wolf et al. 2010). One
possible explanation is that the earlier study only included students who would have graduated by
2008–09, but when I limit the sample to approximately the same group of students I find similarly
insignificant effects on college enrollment.18

1 2 T H E E F F E C T O F T H E D C S C H O O L V O U C H E R P R O G R A M O N C O L L E G E E N R O L L M E N T
I am not able to test other possible explanations for the divergence in findings, such as differential
graduation standards in public versus private high schools or bias resulting from survey nonresponse.19
And both findings are somewhat imprecisely estimated.
This study has a number of limitations besides imprecision in the estimates. A necessary drawback
of examining longer-term outcomes is that they reflect the experiences of earlier cohorts of students.
Results for more-recent participants (which will not be measurable for many years) may differ because
of changes in the voucher program or changes in the public-school system. For example, the
performance of DC’s public school system on the National Assessment of Educational Progress has
increased markedly in recent years (even controlling for changes in demographics).20 This may be why
earlier evaluations of OSP found positive impacts on test scores (Wolf et al. 2013) but a more recent
evaluation found negative one-year effects (Dynarski et al. 2017).
The large and growing charter sector also complicates the interpretation of the results, as there are
many students in both the treatment and control groups who attend public schools of choice. The share
of DC public school students enrolled in charters has grown from less than 20 percent when OSP was
launched to more than 40 percent today.21 In the most recent OSP evaluation, 42 percent of the control
group was enrolled in a charter school compared with 15 percent of the treatment group (Dynarski et
al. 2017).
These limitations aside, this study shows that students who won private-school scholarships from
the nation’s only federally funded school voucher program were not significantly more or less likely to
enroll in college than students who did not win a scholarship. But given the significant changes to the
DC education system over the period since the students in this study applied for scholarships in 2004
and 2005, it will be important to continue to track the outcomes of more recent program participants in
K–12 schools and beyond.

A P P E N D I X 1 3
Appendix TABLE A.1
Effect of Scholarship Offer on College Enrollment within Two Years of Expected
High School Graduation
Any
college Four-year
college Two-year
college Full-time
enrollment
Four-year public
college
Four-year private college
Without controls -0.034 -0.025 -0.012 -0.030 -0.026 -0.013
(0.028) (0.026) (0.019) (0.027) (0.024) (0.019)
With controls -0.029 -0.022 -0.010 -0.023 -0.022 -0.012
(0.028) (0.026) (0.019) (0.027) (0.023) (0.018)
Control mean 0.458 0.353 0.142 0.353 0.249 0.133
Observations 1,594 1,594 1,594 1,594 1,594 1,594
Notes: Robust standard errors adjusted for clustering on family appear in parentheses. Treatment estimates are marginal effects
from probit regressions. Controls include race and ethnicity (black, Hispanic, with neither or missing as omitted category), gender,
whether parents of guardians were married, whether parents or guardians owned home, age, natural log of family income (with
missing coded as zero), and whether income was missing. All models are weighted using baseline weights.
** p < 0.01, * p < 0.05, + p < 0.1.
TABLE A.2
Effect of Scholarship Offer on College Enrollment within One to Five Years of Expected
High School Graduation
Enrollment at any colleges within
1 year 2 years 3 years 4 years 5 years
Expected high school graduation 2005–15 (N = 1,594)
-0.040 -0.029
(0.027) (0.028)
0.395 0.458
Expected high school graduation 2005–14 (N = 1,421)
-0.022 -0.015 0.007
(0.028) (0.030) (0.030)
0.371 0.436 0.46
Expected high school graduation 2005–13 (N = 1,243)
-0.022 -0.011 0.008 0.013 (0.031) (0.032) (0.032) (0.032) 0.381 0.441 0.469 0.484
Expected high school graduation 2005–12 (N = 1,105)
-0.017 -0.012 0.006 0.012 0.015
(0.032) (0.034) (0.034) (0.034) (0.034)
0.366 0.433 0.463 0.478 0.492
Notes: For each regression, I report the coefficient (marginal effect from probit regression), standard error (adjusted for
clustering on family), and control mean. All models include controls listed in notes to table A.1 and are weighted using baseline
weights.
** p < 0.01, * p < 0.05, + p < 0.1.

1 4 A P P E N D I X
TABLE A.3
Subgroup Analysis, Effect of Scholarship Offer on Enrollment at Any College within Two Years of
Expected High School Graduation
No controls With controls
Estimate Std error Estimate Std error C mean Obs.
Black -0.044 (0.030) -0.038 (0.030) 0.460 1,393
Hispanic -0.004 (0.088) -0.012 (0.093) 0.420 160
Not black or Hispanic 0.164 (0.146) 0.092 (0.164) 0.483 60
Female -0.034 (0.040) -0.037 (0.040) 0.508 789
Male -0.030 (0.038) -0.027 (0.038) 0.407 805
School ever SINI -0.055 (0.039) -0.038 (0.039) 0.479 852
School never SINI -0.012 (0.039) -0.017 (0.039) 0.437 742
Entering grades 3–5 -0.080 (0.049) -0.070 (0.050) 0.517 489
Entering grades 6–8 0.015 (0.043) 0.019 (0.043) 0.420 700
Entering grades 9–12 -0.065 (0.053) -0.065 (0.054) 0.455 405
Charter at baseline -0.033 (0.057) -0.045 (0.058) 0.529 405
Not charter at baseline -0.034 (0.032) -0.028 (0.033) 0.434 1,189
Notes: Robust standard errors adjusted for clustering by family appear in parentheses. Controls include those listed in table A.1.
All models are weighted using baseline weights.
** p < 0.01, * p < 0.05, + p < 0.1.

N O T E S 1 5
Notes 1. DC Parental Choice Incentive Act of 2003, H.R. 2556, 108th Cong. (2003).
2. Chingos and Kuehn (2017) discusses this literature in more detail.
3. Wolf et al. (2005) and Serving Our Children, http://servingourchildrendc.org/.
4. Author’s calculations from Common Core of Data Public School Universe.
5. Of the $15 million annual appropriation, about $12 million is for scholarships (the remaining $3 million is for
program administration and evaluation), which averages roughly $10,000 per student.
6. In the 2004 lottery, only the 492 students from non-SINI schools entering grades 6–8 could be included in the
lottery. There were enough scholarships to accommodate all applicants entering grades K–5 and those
currently attending SINI schools. In the 2005 lottery, all students applying from public schools were subject to
the lottery and thus included in the evaluation.
7. I impute grade entering for seven students using their date of birth. The SINI status of the school attended at
baseline is measured using the name of the baseline school reported on the application and lists of SINI schools
provided by Serving Our Children. (SINI statuses for a given school year were not released until after the
lottery was completed, so we use the status that was available at the time of the lottery and thus would have
been used to grant priority in the lottery: 2003 SINI status in the 2004 lottery and 2004 SINI status in the
2005 lottery.) I also measure whether the baseline school was ever SINI between 2003 and 2005, which I use
in the subgroup analysis but not to construct the randomization strata or base weights.
8. “NSC Enrollment Percentages,” April 11, 2012, https://nscresearchcenter.org/wp-
content/uploads/NSC_COVERAGE.xlsx. Coverage rates are also high in Washington, DC, and the surrounding
states (Maryland and Virginia). In fall 2016 (2006), coverage rates were 99.1 percent (94.8 percent) in DC, 97.6
percent (91.0 percent) in Maryland, and 97.4 percent (94.7 percent) in Virginia.
9. These outcomes variables are binary variables that indicate whether a student ever enrolled in a college of a
given type within the specified window (i.e., they are not mutually exclusive across college types).
10. This statistic is weighted using the base weights. The unweighted share of lottery winners who ever used a
scholarship is 73 percent.
11. This Bloom adjustment requires the assumption that winning the lottery had no impact on students who did
not ever use a scholarship.
12. Students with missing race and ethnicity data are included in the “not black or Hispanic” grouping.
13. These calculations assume that students progress on time through 12th grade, when in reality at least some
repeat grades. The statistics in the text are weighted by the base weights; unweighted statistics are similar (39
and 53 percent).
14. This could reflect improvements in the DC public school system, which younger cohorts (those observed for
fewer years after expected high school graduation) potentially attended for a greater number of more-recent
years. But below I find no consistent evidence of differential effects for students who entered the program in
earlier versus later grades.
15. For example, I find that students who were offered a scholarship but did not use it enrolled in college at
significantly lower rates than the control group. This relationship attenuates only slightly when controls are
included, suggesting a strong bias from unmeasured characteristics given that it is unlikely that winning the
lottery has a negative effect on students among students who never use the scholarship. These results are
available from the author upon request.

1 6 N O T E S
16. National Center for Education Statistics, Digest of Education Statistics, table 236.70,
https://nces.ed.gov/programs/digest/d16/tables/dt16_236.70.asp?current=yes. Fourteen percent of
treatment-group students attended a private school that charged more for tuition than the scholarship
amount (Wolf et al. 2010, table ES-1). Private schools may spend more than they receive in tuition because of
other revenue sources (e.g., the Catholic church), and public schools face costs (e.g., special education and
district administration) that private schools do not. But previous attempts to adjust for these differences find
that they narrow the estimated cost differences between sectors but do not eliminate them (Howell and
Peterson 2002).
17. I do not consider the effects of the additional funding provided to public schools as part of the legislation
authorizing the OSP. Thirty million dollars works out to roughly $441 per student enrolled in a DC public
school in 2014–15.
18. These results are available from the author upon request.
19. Wolf et al. (2010, table C-2) report that the treatment impact for nonrespondents would have to be -21
percentage points to explain the entire positive impact they report.
20. Kristin Blagg and Matthew M. Chingos, “Does Gentrification Explain Rising Student Scores in Washington,
DC?” UrbanWire (blog), Urban Institute, May 24, 2016, https://www.urban.org/urban-wire/does-
gentrification-explain-rising-student-scores-washington-dc.
21. Author’s calculations from Common Core of Data Public School Universe.
R E F E R E N C E S 1 7
References Chingos, Matthew M., and Daniel Kuehn. 2017. The Effects of Statewide Private School Choice on College Enrollment
and Graduation: Evidence from the Florida Tax Credit Scholarship Program. Washington, DC: Urban Institute.
Chingos, Matthew M., and Paul E. Peterson. 2015. “Experimentally Estimated Impacts of School Vouchers on
College Enrollment and Degree Attainment.” Journal of Public Economics 122:1–12.
Cowen, Joshua M., David J. Fleming, John F. Witte, Patrick J. Wolf, and Brian Kisida. 2013. “School Vouchers and
Student Attainment: Evidence from a State‐Mandated Study of Milwaukee’s Parental Choice Program.” Policy
Studies Journal 41 (1): 147–68.
Dynarski, Mark, Ning Rui, Ann Webber, and Babette Gutmann. 2017. Evaluation of the DC Opportunity Scholarship
Program: Impacts after One Year. Washington, DC: US Department of Education, Institute of Education Sciences,
National Center for Education Evaluation and Regional Assistance.
Dynarski, Susan M., Steven W. Hemelt, and Joshua M. Hyman. 2015. “The Missing Manual Using National Student
Clearinghouse Data to Track Postsecondary Outcomes.” Education Evaluation and Policy Analysis 37 (1): 53S–
79S.
EdChoice. 2017. The ABCs of School Choice: The Comprehensive Guide to Every Private School Choice Program in
America. 2017 ed. Indianapolis: EdChoice
Figlio, David, and Cassandra M. D. Hart. 2014. “Competitive Effects of Means-Tested School Vouchers.” American
Economic Journal: Applied Economics 6 (1): 133–56.
Howell, William G., and Paul E. Peterson. 2002. The Education Gap: Vouchers and Urban Schools. Washington, DC:
Brookings Institution Press.
Hsu, Spencer S. 2004. “How Vouchers Came to DC.” Education Next 4 (4): 44–50.
Kisida, Brian, and Patrick J. Wolf. 2015. “Customer Satisfaction and Educational Outcomes: Experimental Impacts
of the Market-Based Delivery of Public Education.” International Public Management Journal 18 (2): 265–85.
Wolf, Patrick J., Babette Gutmann, Nada Eissa, and Michael Puma. 2005. Evaluation of the DC Opportunity
Scholarship Program: First Year Report on Participation. Washington, DC: US Department of Education, Institute
for Education Studies, National Center for Education Evaluation and Regional Assistance.
Wolf, Patrick J., Babette Gutmann, Michael Puma, Brian Kisida, Lou Rizzo, Nada Eissa, and Matthew Carr. 2010.
Evaluation of the DC Opportunity Scholarship Program: Final Report. Washington, DC: US Department of
Education, Institute for Education Studies, National Center for Education Evaluation and Regional Assistance.
Wolf, Patrick J., Brian Kisida, Babette Gutmann, Michael Puma, Nada Eissa, and Lou Rizzo. 2013. “School Vouchers
and Student Outcomes: Experimental Evidence from Washington, DC.” Journal of Policy Analysis and
Management 32 (2): 246–70.

1 8 A B O U T T H E A U T H O R
About the Author Matthew M. Chingos is director of the Urban Institute’s Education Policy Program,
which undertakes policy-relevant research on issues from prekindergarten through
postsecondary education. Current research projects examine universal
prekindergarten programs, school choice, student transportation, school funding,
college affordability, student loan debt, and personalized learning.

S T A T E M E N T O F I N D E P E N D E N C E
The Urban Institute strives to meet the highest standards of integrity and quality in its research and analyses and in
the evidence-based policy recommendations offered by its researchers and experts. We believe that operating
consistent with the values of independence, rigor, and transparency is essential to maintaining those standards. As
an organization, the Urban Institute does not take positions on issues, but it does empower and support its experts
in sharing their own evidence-based views and policy recommendations that have been shaped by scholarship.
Funders do not determine our research findings or the insights and recommendations of our experts. Urban
scholars and experts are expected to be objective and follow the evidence wherever it may lead.

2100 M Street NW
Washington, DC 20037
www.urban.org