THE EFFECT OF STRESS PATH ON LONDON CLAY Volume I A …
443
THE EFFECT OF STRESS PATH ON THE DEFORMATION AND CONSOLIDATION OF LONDON CLAY Volume I A Thesis Submitted to the University of London (Imperial College of Science and Technology) fbr the degree of Doctor of Philosophy in the Faculty of Engineering by Nitindra=Nath Som, B.C.E., D.I.C. Imperial College September 1968
Transcript of THE EFFECT OF STRESS PATH ON LONDON CLAY Volume I A …
THE EFFECT OF STRESS PATH ON
THE DEFORMATION AND CONSOLIDATION OF
LONDON CLAY
Volume I
A Thesis Submitted to the
University of London
(Imperial College of Science and Technology)
fbr the degree of
Doctor of Philosophy in the Faculty of Engineering
by
Nitindra=Nath Som, B.C.E., D.I.C.
Imperial College September 1968
u nothing takes place without sufficient reason, that is to say, nothing happens without its being possible for one who knows things sufficiently, to give a reason which is sufficient to determine why things are so and not otherwise"
Gottfried Wilhelm Leibniz (1646-1716)
1.
ABSTRACT
Theoretical and experimental investigations have been carried
out to study the influence of stress path on the deformation and con-
solidation of over-consolidated clays - with particular emphasis on
London clay - in relation to settlement of structures. It is shown
that for a proper understanding of the deformation of a soil beneath
a foundation the soil should be tested in the laboratory under the
same set of effective stresses that it will undergo in the field and
that the influence of lateral stresses carrot be ignored.
The stresses and displacements in non-homogeneous soil media,
beneath circular and strip footings, have been calculated from
Gibson's analytical solutions. A numerical method is suggested for
determining the "immediate" (elastic) settlement of structures founded
on a medium whose modulus of elasticity varies with depth.
The influence of lateral stressesonthe deformation charact-
eristics of undisturbed London clay has been studied from both oedo-
meter and triaxial tests while the stress path for one-dimensional
compression is determined from specially designed oedometers. The
effect of small pressure increments on the compressibility of London
clay is also studied in the oedometer.
The experimental results are examined in the light of their
influence on the settlement of structures and a method of settle-
ment analysis is proposed that takes into account the stress path
2.
of the elements of soil beneath a foundation: comparisons are made
with the existing methods of analysis.
The pre-consolidation pressures of London clay are determined
from the stress deformation characteristics of samples loaded to
high effective stresses.
3.
ACKNOWLEDGEMENTS
The work described in this thesis was carried out in the
Soil Mechanics section of the Department of Civil Engineering,
Imperial College of Science and Technology, University of London,
under the general supervision of Professor A. W. Bishop, whose in-
terest and help throughout the work is gratefully acknowledged.
The author expresses his deep gratitude to Dr. N. E. Simons
who directed the research programme and gave active help and en-
couragement not only in all aspects of the work but also in overcoming
many problems the author encountered throughout the course of the
work.
Sincere thanks are extended to Professor R. E. Gibson of
King's College, London, for his invaluable assistance in connection
with the theoretical work on stress distribution described in Chapter
6. The author is grateful to Mr. A. E. Skinner and Mr. G. E.
Green for their help in surmounting numerous practical difficulties
which inevitably arose during the experimental work and to Dr. N.
R. Morgenstern for taking part in many instructive discussions.
The author wishes to thank his colleagues, in particular
Mr. H. T. Lovenbury, Dr. S. K. Sarma, Dr, P. L. T. Phukan and Mr.
I. C. Pyrah who assisted in various ways during the course of the
work and with whom many fruitful discussions were held. Sincere
4.
appreciation is also expressed to Messrs. D. T. Evans, L. F. Spall,
E. W. Harris and F. D. Evans for their active help with the laboratory
work and for their sympathy and understanding in general.
The author is further thankful to Dr. and Mrs. N. E. Simons
for their affectionate hospitality on the occasions he had the
opportunity to visit them at their home.
The arduous task of typing the often unreadable manuscript
was undertaken by Miss E. Hamilton and the author can only express
his admiration for the patience she has shown throughout.
The work was made possible by a generous grant from the
Construction Industries Research and Information Association to whom
the author is grateful.
TABLE OF CONTENTS Page
ABSTRACT 1
ACKNOWLEDGEMENTS 3
TABLE OF CONTENTS 5
CHAPTER 1 - INTRODUCTION 9
CHAPTER 2 - BRIEF REVIEW OF PAST WORK 17
2.1 Influence of Stress Path on the Deformation of Saturated Clays 17
2.2 Methods of Settlement Analysis 25
CHAPTER 3 - A STUDY OF CASE RECORDS OF SETTLEMENT OF STRUCTURES ON CLAY 35
3.1 General Definitions 35
3.2 Structures on Over-Consolidated Clays 37
3.3 Structures on Normally-Consolidated Clays 42
3.4 Summary and Discussion 46
CHAPTER 4 - LONDON CLAY - GEOLOGY AND STRESS HISTORY 54
4.1 Geology of the London Basin 54
4.2 Previous Work on London Clay 57
4.3 Index Properties 59
4.4 States of Stress In-situ 60
CHAPTER 5 - STRESS PATH 66
5.1 The Concept of Stress Path 66
5.2 Definitions 67
5.3 Stress Paths in Laboratory Triaxial Tests 67
5.4 Stress Path in the Field due to Foundation Loading 69
5.5 Stages of an "Ideal" Experimental Programme for Settlement Analysis 73
5.6 Methods of Settlement Analysis 74
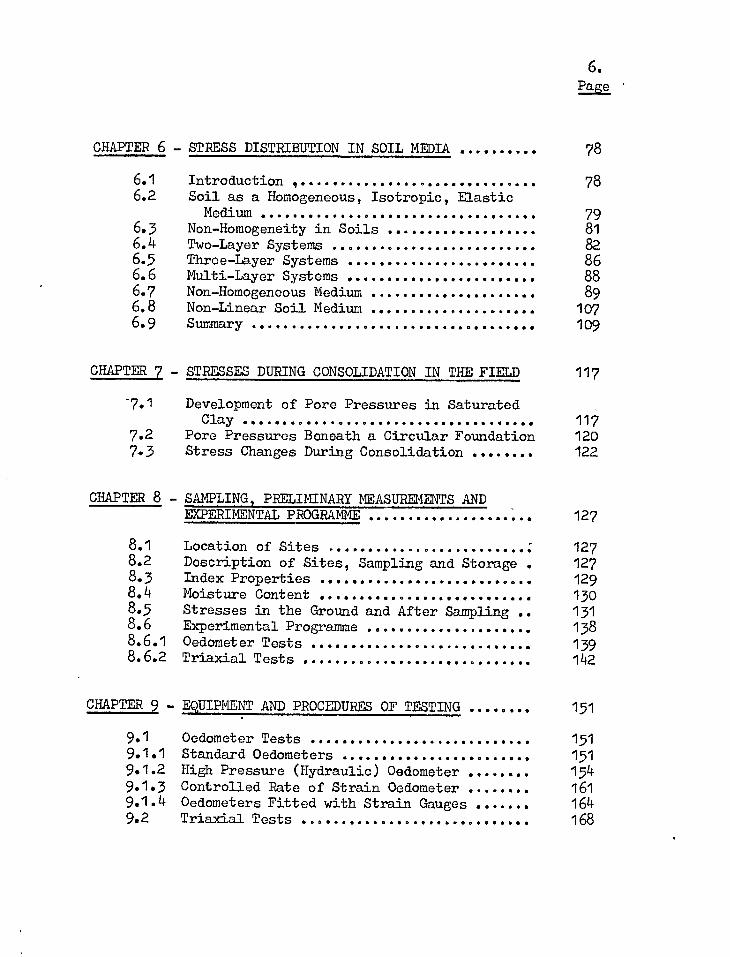
6. Page
CHAPTER 6 - STRESS DISTRIBUTION IN SOIL MEDIA 78
Soil as a Homogeneous, Isotropic, Elastic Medium 79
6.3 Non-Homogeneity in Soils 81
6.4 Two-Layer Systems 82
6.5 Three-Layer Systems 86
6.6 Multi-Layer Systems 88
6.7 Non-Homogeneous Medium 89
6.8 Non-Linear Soil Medium 107
6.9 Summary 109
CHAPTER 7 - STRESSES DURING CONSOLIDATION IN THE FIELD
117
-7.1 Development of Pore Pressures in Saturated Clay
117
7.2 Pore Pressures Beneath a Circular Foundation 120 Stress Changes During Consolidation
122
CHAPTER 8 - SAMPLING, PRELIMINARY MEASUREMENTS AND EXPERIMENTAL PROGRAMME 127
8.1 Location of Sites 127 8.2 Description of Sites, Sampling and Storage 127 8.3 Index Properties 129 8.4 Moisture Content 130 8.5 Stresses in the Ground and After Sampling 131 8.6 Experimental Programme 138 8.6.1 Oedometer Tests 139 8.6.2 Triaxial Tests 142
CHAPTER 9 - EQUIPMENT AND PROCEDURES OF TESTING 151
9.1 Oedometer Tests 151 9.1.1 Standard Oedometers 151 9.1.2 High Pressure (Hydraulic) Oodometer 154 9.1.3 Controlled Rate of Strain Oedometer 161 9.1.4 Oedometers Fitted with Strain Gauges 164 9,2 Triaxial Tests 168
6.1 Introduction , 6.2
78
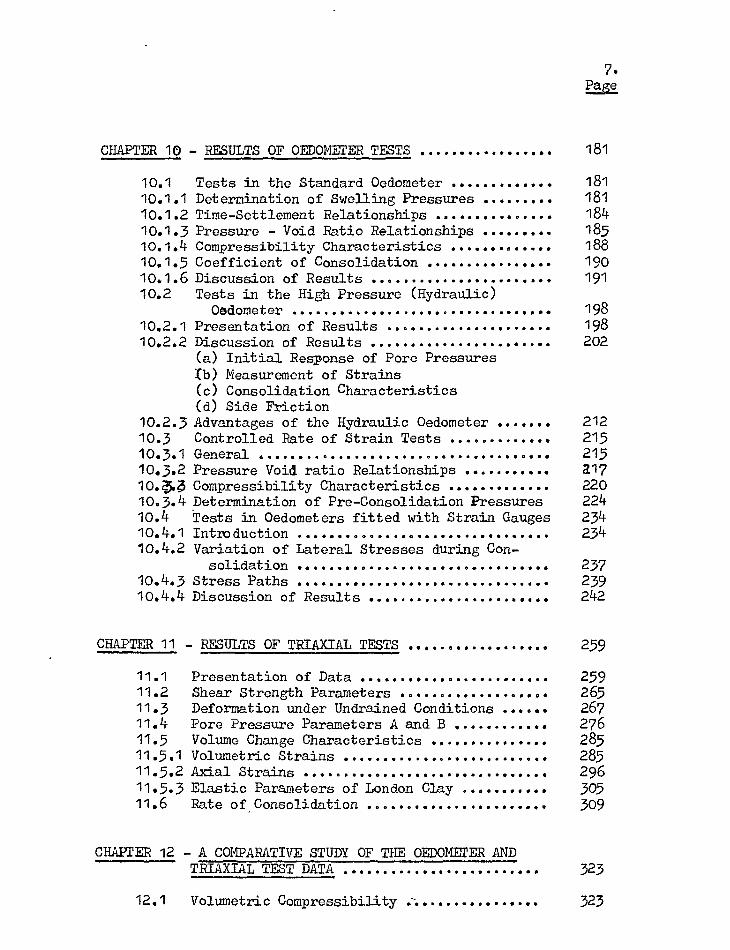
7. Page
CHAPTER 10
10.1 10.1.1 10.1.2 10.1.3 10.1.4 10.1.3 10.1.6 10.2
10.2.1 10.2.2
10.2.3 10.3 10.3.1 10.3.2 10.3.3 10.3.4 10.4 10.4.1 10.4.2
10.4.3 10.4.4
- RESULTS OF OEDOMETER TESTS 181
Tests in the Standard Oedometer 181 Determination of Swelling Pressures 181 Time-Settlement Relationships 184 Pressure - Void Ratio Relationships 185 Compressibility Characteristics 188 Coefficient of Consolidation 190 Discussion of Results 191 Tests in the High Pressure (Hydraulic)
Oedometer 198 Presentation of Results 198 Discussion of Results 202 (a) Initial Response of Pore Pressures :(b) Measurement of Strains (o) Consolidation Characteristics (d) Side Friction Advantages of the Hydraulic Oedometer 212 Controlled Rate of Strain Tests 215 General 215 Pressure Void. ratio Relationships a17 Compressibility Characteristics 220 Determination of Pre-Consolidation Pressures 224 Tests in Oedometers fitted with Strain Gauges 234 Introduction 234 Variation of Lateral Stresses during Con- solidation 237
Stress Paths 239 Discussion of Results 242
CHAPTER 11 - RESULTS OF TRIAXIAL TESTS 259
Presentation of Data 259 Shear Strength Parameters 265 Deformation under Undrained Conditions 267 Pore Pressure Parameters A and B 276 Volume Change Characteristics 285 Volumetric Strains 285 Axial Strains 296 Elastic Parameters of London Clay 305 Rate of Consolidation 309
CHAPTER 12 - A COMPARATIVE STUDY OF THE OEDOMETER AND TRIAXIAL TEST DATA 323
12.1 Volumetric Compressibility 323
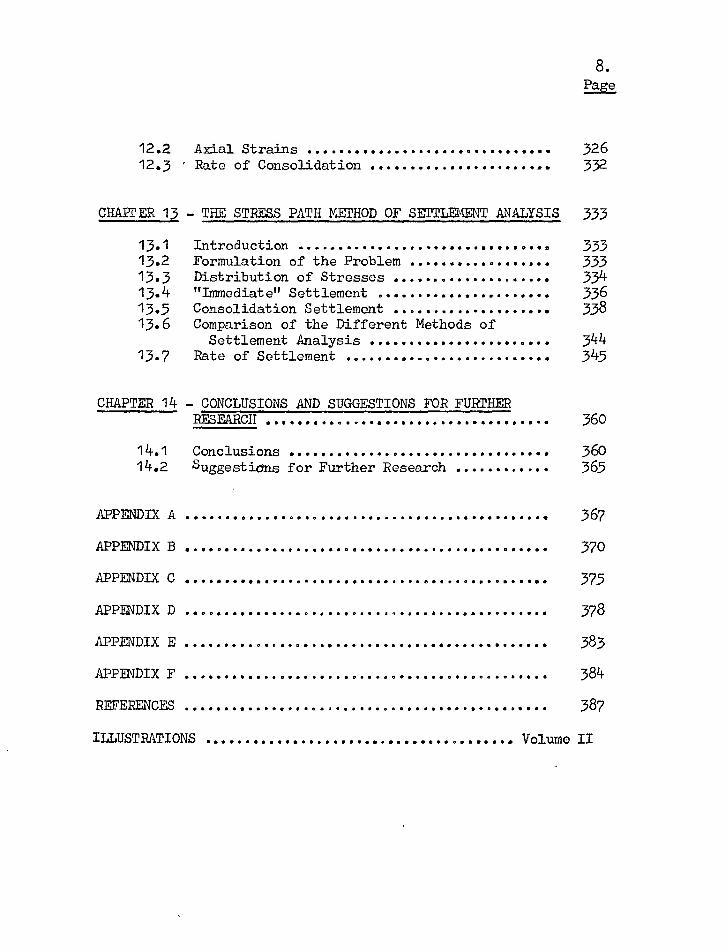
8. Page
12.2 Axial Strains 326 12.3 Rate of Consolidation 332
CHAIT ER 13 - THE STRESS PATH METHOD OF SETTLEMENT ANALYSIS 333
13.1 Introduction 333 13.2 Formulation of the Problem 333 13.3 Distribution of Stresses 334 13.4 "Immediate" Settlement 336 13.5 Consolidation Settlement 338 13.6 Comparison of the Different Methods of
Settlement Analysis 344 13.7 Rate of Settlement 345
CHAPTER 14 - CONCLUSIONS AND SUGGESTIONS FOR FURTHER RESEARCH 360
14.1 Conclusions 360 14.2 Suggestions for Further Research 365
APPENDIX A 367
APPENDIX B 370
APPENDIX C 375
APPENDIX D 378
APPENDIX E 383
APPENDIX F 384
REFERENCFq 387
ILLUSTRATIONS Volume II
9•
CHAPTER 1
INTRODUCTION
Settlement analysis of engineering structures has become
an integral part of Civil Engineering practice for many years but
the method of systematic analysis has undergone but little change
since its inception over forty years ago following Terzaghi's
classic work on the theory of consolidation. The soundness of the
basic principle (i.e. the principle of effective stress) cannot, of
course, be doubted and in many cases, the method has proved adequate
in predicting, at least for practical purposes, the settlement of
structures on a wide variety of clays. Nevertheless, conditions in
the field often differ from the simplified assumptions that have to
be made for the analysis (e.g. one-dimensional strain) which some-
times result in the over-estimation of the magnitude of settlement
and under-estimation of the rate of settlement. This is particularly
true of structures on over-consolidated clays, a phenomenon which was
recognised by Terzaghi as far back as 1936 when he stated, in opening
the discussion on settlement of structures at the First International
Conference on Soil Mechanics, "it appears that the important differ-
ences between theory and reality are limited to those cases in which
the loaded material was intensely pre-compressed at some stage of
its geological history" (Terzaghi 1936a). It was not until Skempton
and Bjerrum's important contribution in 1957 that some improvement
10.
was achieved (Skempton and Bjerrum 1957).
While the Skempton and Bjerrum approach to settlement
analysis is certainly a step in the right direction - it recognises
that the foundation soil undergoes lateral deformation during load
application and that the subsequent consolidation is a function of
the excess pore pressures set up in the clay - it still assumes that
during consolidation the clay is laterally restrained. Although
this condition is approximately true in certain problems, such as
that of a thin layer of clay lying between beds of sand, it is more
often than not that lateral deformations can occur in the field -
consider, for example, the case of a structure founded on a thick
bed of clay. Whether such lateral strains will influence the settle-
ment to any great extent depends on the stress changes during con-
solidation and their influence on the deformation properties of the
soil. Therefore, to make successful use of laboratory data to pre-
dict the deformation of a soil under a given set of stresses it is
necessary to test the soil, applying, as closely as possible, the
same stress changes as those to which the material will be subjected
in nature. Moreover, the behaviour of soils being essentially non-
linear the deformation properties, such as the Young's modulus,
Poisson's ratio and compressibility, will vary with stress level, and,
for this reason, it is also desirable that the soil after sampling
be first brought back to the stresses prevailing in the ground before
subjecting it to the stress changes it is likely to undergo on load-
11.
ing (see Moretto 1965). Thus the concept of stress path logically
comes into the picture of soil deformation in the field and it is
this aspect of the behaviour of over-consolidated clays that is
studied in this thesis. The experimental work has been carried out
on undisturbed London clay from two sites - Oxford Circus in Central
London and Ongar in Essex.
The thesis begins, after a brief review of past work, with
a study of case records of settlement of structures on both normally
consolidated and over-consolidated clays, from which certain differ-
ences in the respective behaviour of the two types of clay become
immediately apparent. The remainder of the thesis is devoted to
examining in detail the deformation characteristics of over-
consolidated clays in the light of the influence of stress paths,
with particular emphasis given to the behaviour of London clay.
It is recognised that a knowledge of the geology and stress
history of a soil is essential in the understanding of its properties
and Chapter 4, therefore, gives a brief summary of the previous
history of London clay and its relevance to foundation problems.
Chapter 5 seeks to explain the stress path of an element of soil
beneath a foundation both during load application and subsequent
consolidation. When this is compared with the stress paths implied
in the existing methods of settlement analysis some of the causes of
the discrepancy between calculated and observed settlements become
apparent.
12.
A major requirement of settlement analysis is the calcula-
tion of stresses in the soil medium due to the applied foundation
pressure. This is required not only to calculate the "immediate"
(i.e. the end of construction) settlement but also to determine the
distribution of initial excess pore pressures which subsequently
dissipate to cause the time - dependent consolidation settlement.
It is customary to use the Boussinesq analysis for an isotropic,
homogeneous, elastic medium for the purpose, but a real soil is
neither elastic nor homogeneous. Even considering small strains
within which linearity of stress - strain relationships can be
assumed to be valid, the modulus of elasticity in general varies
with depth either as a consequence of increasing effective stresses
with depth or due to the presence of different geological formations
possessing unlike engineering properties. In Chapter 6, a survey
is made of the available data of the distribution of stresses in
layered elastic media, while Gibson's analytical solution (Gibson
1967) for non-homogeneous elastic medium has been used to calculate
numerical results for circular and strip footings. A short section
is also devoted to study the effect of non-linearity of stress -
strain relationships on the distribution of stresses. Chapter 7
is concerned with the development of pore pressure in a soil medium
and the changes of effective stresses during consolidation which
have an important bearing on the settlement.
When an undisturbed sample is removed from the ground for
testing in the laboratory there exists in the sample a state of
stress which is completely different from that to which it was
subjected before sampling. An analysis of this has been made in
Chapter 8, following Skempton and Sowa (1963). The importance is
pointed out of recognising this state of stress when determining
the stress path that should be followed to reproduce, as closely
as possible, the stress path the element is likely to undergo in
the field. Chapter 8 also contains a full description of the
experimental programme.
A number of new instruments were built to study the re-
levant properties of London clay. These and all the other equip-
ment that have been used in connection with the experimental work
are described in Chapter 9.
The results of the different series of oedometer tests
are presented in Chapter 10, the main body of which can be divided
into four parts:
(a) The effect of rest period and the magnitude of load in-
crements on compressibility was studied in the standard Bishop type
oedometer. It is easily understood that the stress increases
caused by a building load decreases with increasing depth beneath
the base of the foundation. Yet it is common practice to test
samples in the laboratory using the pressure increment ratio of 1,
the results of which may not be directly applicable for small load
increments in the field. Moreover, the inevitable disturbance and
13.
ik.
the release of pressures caused by sampling may result in a break-
down of the original structure of the clay which may not be regained
when large pressure increments are applied at short intervals. In
order to study these effects specimens were allowed to rest at the
in-situ overburden pressure for up to 90 days and then subjected to
load increments of different magnitudes.
(b) The influence of controlled rate of strain as opposed to
the conventional step loading, on the compressibility of London clay
was studied in a specially designed oedometer. The opportunity was
also taken to study the deformation of London clay at effective
stresses of up to 7,000 lbs/in2 from which it has been possible to
estimate the pre-consolidation pressure of London clay at Ongar,
Essex, and Wraysbury, Middlesex.
(c) A newly built high pressure oedometer was used to study
some consolidation characteristics of undisturbed London clay. In
this apparatus, the specimens were loaded by hydraulic pressure and
settlement and pore pressure were measured over a small part of the
surface thus keeping the influence of side friction on this measure-
ment to a minimum.
(d) The stress path during one-dimensional consolidation of
undisturbed London clay was determined in three specially built
oedometers which were fitted with strain gauges on the outside to
measure the lateral stress.
The programme of triaxial testing was devised firstly, to
15.
determine the stress - strain modulus and the pore pressure para-
meters for the range of stresses normally encountered in practice.
For this, specimens were first brought back to the estimated in-
situ state of stress and then subjected to stress increments under
undrained conditions. The influence of stress path on the axial
and volumetric strains during consolidation have been studied from
triaxial consolidation tests. Although drainage was permitted only
in one direction the specimens were allowed to deform laterally as
well as vertically thus removing the lateral restraint which is
characteristic of oedometer tests. It has thus been possible to
investigate the possible effects of the lateral stresses on the
deformation of the clay during consolidation. The data are given
Chapter 11.
A comparative study of the oedometer and triaxial test
data reveal some important deficiencies of the existing methods of
settlement analysis in which the influence of the lateral stresses
is completely ignored. It is seen that the consolidation settle-
ment is largely dependent on the stress path which, in the field,
may differ considerably from that for laboratory oedometer tests.
Direct application of the oedometer test results may, therefore,
give an incorrect estimate of the settlement of a structure in the
field.
In Chapter 13 a method of settlement analysis, which takes
account of the influence of stress path, is developed on the basis
16.
of the experimental evidence obtained. This method which may be
called the "Stress Path Method" (Lambe 1964, 1967) is found to give
estimates of settlement which are very different from those given
by existing methods of analysis. On the subject of the rate of
settlement, one-dimensional theory of consolidation, as is well
known, is again found to be grossly inadequate. Although
mathematical treatment of three-dimensional consolidation did not
form a part of this thesis some available results, obtained from
approximate numerical analyses, have been used to calculate the
rate of settlement under three-dimensional conditions.
17. CHAPTER 2
BRIEF REVIEW OF PAST '1ORK
The stress - deformation characteristics of soils have
been the subject of many investigations, but in this brief review
it will be possible to consider only those which are of direct
relevance to the work described later in the thesis. Attention
will, therefore, be directed, firstly to the contributions that
relate deformation and pore pressures in saturated clay to stress
changes under drained and undrained conditions and, secondly, to
the methods of settlement analysis that are in use at the present
time.
2.1 Influence of stress ath on the deformation of saturated
clays.
Most of the work reported in the literature on this subject
are parts of wider studies on the shear strength of soils. Our
consideration will primarily be restricted, however, to the stress
- deformation behaviour of saturated clays when subjected to ex-
ternal pressures under drained and undrained conditions.
Modern studies on the deformation of soils began more than
forty years ago with Terzaghi's class work on the consolidation of
clays (Terzaghi 1923) and are based on the by now well established -
18.
principle of effective stress! (For a summary of Terzaghits early
work between 1921 and 1925, see Skempton 1960b). Rendulic (1936,
1937) considered the general problem of the void ratio - effective
stress relationships of "isotropic" clay and came to the conclusion
that, for a given clay with a given initial condition, void ratio
was an exclusive function of the three principal effective stresses.
He carried out a series of drained and consolidated undrained tri-
axial tests on remoulded Wiener Tegel and showed that there existed
a unique relationship between water content and effective stresses
from which it was possible to predict the effective stress and hence
the pore pressure at any point in an undrained test. Later work by
Henkel (1958, 1960, 1960a) has demonstrated the soundness of Ren-
dulicfs conclusion. From an extensive study of drained and un-
drained tests on remoulded Weald clay Henkel was able to show that
the behaviour of clays during shear could be represented by a series
of stress paths, each associated with a particular water content, on
the principal stress space.
Rutledge, in the Triaxial Shear Report (1947), presented
what has since been known as the American Hypothesis. From results
-of triaxial and oedometer tests on undisturbed samples of clay it
was concluded that the water content of saturated clay was primarily
a function of the major principal stress and essentially independent
Theoretical considerations of the principle of effective stress are discussed by Bishop (1959) and Skempton (1960a).
19.
of the other stresses. Although later works of Bjerrum (1954),
De Wet (1962), Broth.. and Ratnam (1963), Raymond (1965), Lee and
Farhoomand (1967) have shown that the hypothesis describes the
behaviour of many soils reasonably accurately its validity has not
been found to be general (see below). Moreover, as shown by
Henkel (1958), the hypothesis implies a certain shape of the water
content contours for undrained tests in the principal stress space
which are not supported by experimental evidence. We shall come
back to the American Hypothesis later in the thesis.
In order to predict the behaviour of clay under undrained
conditions it is necessary to have some knowledge of the pore
pressure set up by the application of external load. Skempton
(1948) introduced the 7. theory which was the first of a series
of attempts to relate the pore pressure and the applied stresses
in an undrained test. In terms of the compressibility Cc and
the expansibility Cs, the development of excess pore pressure
was found to be govenned by the equation
Au. C + 1 ( cr — i (173) r.; - + 2
(2.1.1)
where X = Cs/Cc and AT 1 and .d g.3 are the increases of
major and principal stresses. Apart from the assumption of the
validity of elastic theory Skempton also assumed that the Cc and
Cs determined from all round consolidation and swelling tests were
20.
applicable to cases where shear stresses were present. Using the
experimental data, obtained by Hvorslev (1937) and Taylor (1948) on
Weiner Tegel and Boston Blue clay Skempton showed that equation
(2.1) predicted the pore pressure in undrained tests reasonably
accurately. Odenstad (1949) extended Skempton's X theory to
take account of the effect of dilatancy associated with the applicau
tion of shear stresses but made no quantitative check on his theory.
Bjerrum (1954) suggested that the pore pressure in undrained tests
could be related to volume changes in drained tests, on the basis
that the application of axial stress in the undrained test was
identical, with respect to effective stresses, to a drained test
where the axial stress increase was accompanied by a decrease of
cell pressure such that the volume of the sample remained constant.
Thus Bjerrum got the following expression for the excess pore
pressure in terms of the applied stresses,
Au = L1 0-3 + 1
C ( cr - XT s2
ccl
(2.1.2)
where Cc1
and Cs2
are the compressibility corresponding to
axial compression and the expansibility corresponding to decrease
of radial stresses respectively. Although equation (2.2) is
apparently similar to equation (2.1) Bjerrum's approach had the
advantage over the A theory that Gel and Cs2
were the para-
meters determined from relevant drained tests and the need for the
21.
application of Cc and Cs data obtained from all round tests to
the individual stress changes in the shear stage was no longer there.
The next major step forward in this field was the intro-
duction by Skempton (1954) of the pore pressure parameters A and
B, the application of which to stability problems was immediately
demonstrated by Bishop (1954). Although the basic analysis was
done within the framework of the theory of elasticity the final
equation for expess pore pressure,
u= f 6'3 + A( 1 - d 03) J
(2.1.3)
was expressed in terms of parameters which could be readily deter-
mined from triaxial tests. Equation C2;1:3)is extensively used to-
day in the effective stress analysis of Soil Mechanics problems.
Its application in settlement analysis has been demonstrated by
Skempton and Bjerrum (1957). A more general expression for the
excess pore pressure, in terms of the octahedral normal stress and
the octahedral shear stress, has since been proposed (Skempton
1960, Henkel 1960) to take account of the intermediate principal
stress, but its validity has still to be established.
The experimental work to examine the influence of stress
path on the volume change soils has, in general formed part of
shear strength studies, mostly of sands and remoulded clays. The
data on the behaviour of undisturbed clays for small stress changes
22.
are limited. Henkel (1958) observed from tests on remoulded clays
that unique relationships existed between the average principal
effective stress and water content at failure and that the latter
was always lower than the water content at the corresponding
effective stress for all round consolidation. Roscoe, Schoffield
and Wroth (1958) used the concept of critical void ratio to describe
the behaviour of soils at failure, according to which the water
contents at the "end" points of all triaxial tests, when plotted
against the average principal effective stress, lie on a unique
straight line, at which further increase of axial strain causes no
more volume change in the drained test or pore pressure change in
the undrained test (i.e. the soil then continues to deform at con-
stant stress and constant void ratio). From a series of triaxial
and plane strain tests in which specimens were consolidated iso-
tropically as well as under Ko
conditions, Sowa (1963) and Wade
(1963) found that the water content during consolidation of re-
moulded Weald clay was controlled by the average principal effective
stress (see Henkel and Sowa 1963).
On the other hand many research workers have found that
the volume change of soils is governed primarily by the major
principal effective stress, the other stresses exerting little or
no influence; (Triaxial Shear Report 4.947, Bjerrum 1954, De Wet
This point will be described in greater detail in Chapter 11.
23.
1962, Broms and Ratiam 1963, Raymond 1965). Yet again, Akai and
Adachi (1965) found that the volume change of a remoulded Japanese
clay in one-dimensional consolidation was larger than that caused
during isotropic consolidation for the same average effective stress
- a phenomenon which the authors attributed to an extra volume
change caused by the shear stress.
Different hypotheses are, therefore, available to des-
cribe the same phenomenon of soil deformation. All that can be
said, at this point, is that there is no generally applicable
hypothesis and the one that should apply to a particular soil has
to be determined experimentally. An important point to note here
is that, absent from most of the above investigations (a notable
exception is the Triaxial Shear Report) are tests on undisturbed
clays. The applicability of any hypothesis to practical problems,
therefore, still remains to be studied.
The works referred to in the preceding paragraphs des-
cribe the behaviour of soils under axi-symmetric stress conditions
(i.e. two of the principal stresses are equal). In recent years
many investigations have been carried out to study the influence of
the intermediate principal stress on the shear strength of soils.
Herd again not much data are available of the deformation of clays
under small stress changes.
The early works in this field consisted of the plane
strain tests in which the strain along the longitudinal axes of
24.
prismatic samples was kept zero, (Wood 1958, Wade 1963, Cornforth
1964, Henkel and Wade 1967). Other investigators have used hollow
cylindrical specimens where the intermediate principal stress could
be varied by applying different pressures at the inside and outside
of the specimens (Kirkpatrick 1957, Haythornthwaite 1960, Broms and
Ratnam 1963, Wu, Loh and Malvern 1963). Attempts have also been
made to use cubical test specimens and control the three principal
stresses independently (Kjellman 1936, Jakohson 1957, Shibata and
K:rube1965, Ko and Scott 1967).
Only a few of the works mentioned above, however, refer
to the behaviour of clays, the experimental work being conducted
mostly on sands. Moreover, as has been said earlier, it was the
shear strength of soils that was the primary concern of the in-
vestigators. (For a detailed discussion of the failure criteria
of soils and the influence of the intermediate principal stress on
the shear strength of soils, see Bishop 1966). Very little informa-
tion can, therefore, be obtained of the influence of the intermediate
principal stress on the deformation of clays. From undrained tests
on remoulded clays, both Shibata and KarUbe(1965) and Henkel and
Wade (1966) have shown that when the intermediate principal stress
lies between the major and minor principal stresses common stress
paths are obtained if the data are plotted on the octahedral normal
stress - octahedral shear stress space. Their test data, as well
as those of Wu, Loh and Malvern (1963), indicate that the pore
25.
pressure set up under undrained conditions can also be expressed in
terms of the octahedral normal stress and the octahedral shear
stress. The data on the consolidation of clays under independently
controlled stresses are even more scarce. Broms and Ratnamts
study with hollow cylindrical specimens shows that the water content
of remoulded Kaoline is a function of the major principal stress
and independent of the minor and intermediate principal stresses
(Broms and Ratnam 1963).
2.2 Methods of settlement analysis
(A) Determination of the magnitude of settlement
The principl& of effective stress and Terzaghi's theory
of one-dimensional consolidation have been the essential basis for
all settlement analyses of structures founded on clay. The
earliest method of analysis, expressed by the equation
Pc my .
(3"Z . d z
(2.2.1)
where mv is the compressibility determined from oedometer test
64zis the increase of vertical stress at a depth z and
z is the total thickness of the clay stratum,
was propsed by Terzaghi (1929) for calculating the consolidation
settlement of a layer of clay subjected to lateral confinement,
i.e. where all settlement was due to one-dimensional compression
26.
of the clay stratum. Although this method, which has been called
the "conventional" method by Skempton, Peck and McDonald (1955), is
valid only in cases where the condition of no lateral strain is at
least approximately true (see Skempton and Bjerrum 1957) it has
been extended to cases in the field where the foundation rests on
a deep bed of clay (Taylor 1948). In such cases there are lateral
deformations during load application which give rise to what is
known as the "immediate" settlement. Therefore, although the
"conventional" method has in many instances, given reasonably good
predictions of the total settlement - particularly for structures
on normally consolidated clays (see Terzaghi 1936a) - it is
physically inadequate to describe completely the behaviour of a
clay that undergoes important lateral deformations.
It has been common practice for many years to calculate
the "immediate" settlement, i.e. the settlement that takes place
under the condition of no volume change and is a result of the
shear deformation of the clay, from the standard equations of the
theory of elasticity (Terzaghi 1943, see also Scott 1963 and Harr
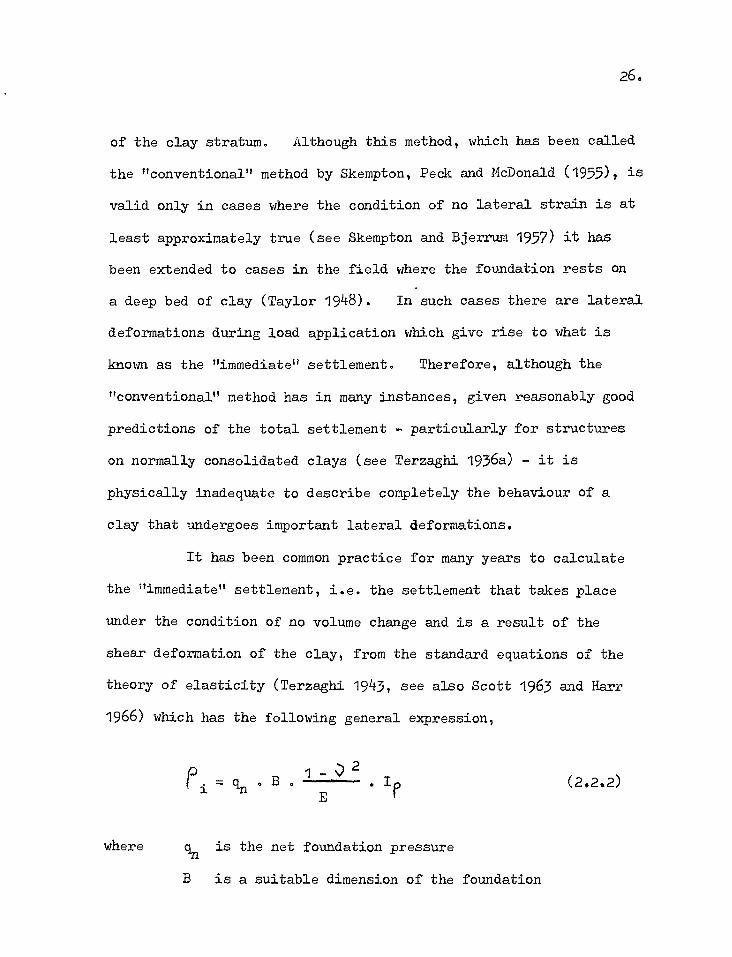
1966) which has the following general expression,
qn . B I Q 2 I
E (2.2.2)
where qn is the net foundation pressure
B is a suitable dimension of the foundation
27.
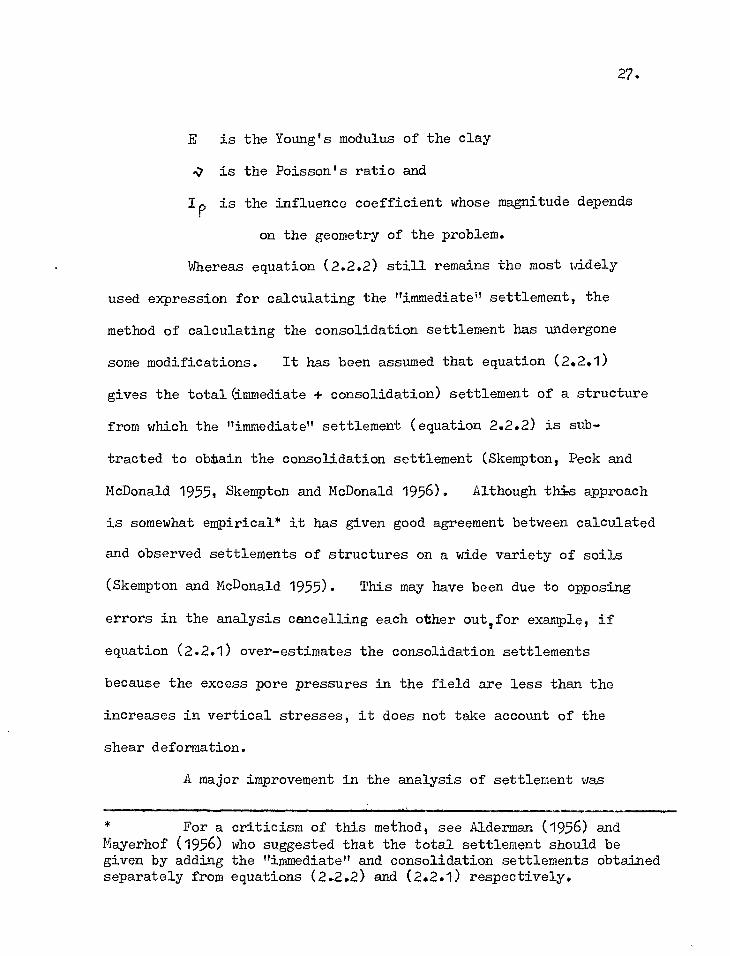
E is the Young's modulus of the clay
") is the Poisson's ratio and
Ip is the influence coefficient whose magnitude depends
on the geometry of the problem.
Whereas equation (2.2.2) still remains the most widely
used expression for calculating the "immediate" settlement, the
method of calculating the consolidation settlement has undergone
some modifications. It has been assumed that equation (2.2.1)
gives the total (immediate + consolidation) settlement of a structure
from which the "immediate" settlement (equation 2.2.2) is sub-
tracted to obtain the consolidation settlement (Skempton, Peck and
McDonald 1955, Skempton and McDonald 1956). Although this approach
is somewhat empirical* it has given good agreement between calculated
and observed settlements of structures on a wide variety of soils
(Skempton and McDonald 1955). This may have been due to opposing
errors in the analysis cancelling each other out,for example, if
equation (2.2.1) over-estimates the consolidation settlements
because the excess pore pressures in the field are less than the
increases in vertical stresses, it does not take account of the
shear deformation.
A major improvement in the analysis of settlement was
For a criticism of this method, see Alderman (1956) and Mayerhof (1956) who suggested that the total settlement should be given by adding the "immediate" and consolidation settlements obtained separately from equations (2.2.2) and (2.2.1) respectively.
28.
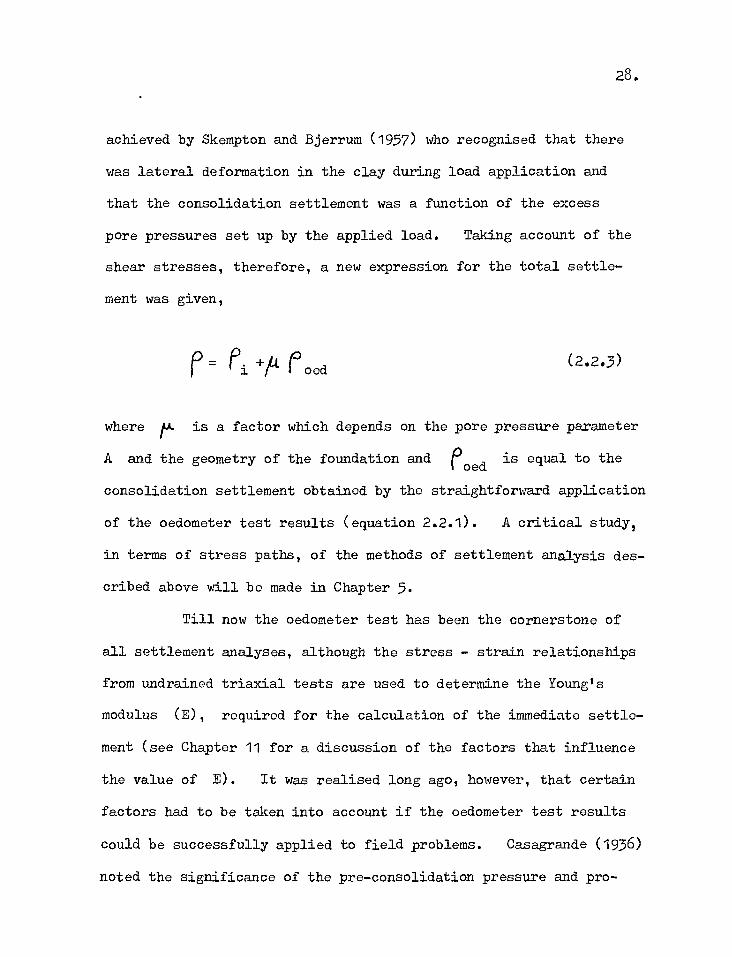
achieved by Skempton and Bjerrum (1957) who recognised that there
was lateral deformation in the clay during load application and
that the consolidation settlement was a function of the excess
pore pressures set up by the applied load. Taking account of the
shear stresses, therefore, a new expression for the total settle-
ment was given,
/f= P-
I J oed (2.2.3)
where fk is a factor which depends on the pore pressure parameter
A and the geometry of the foundation and coed is equal to the
consolidation settlement obtained by the straightforward application
of the oedometer test results (equation 2.2.1). A critical study,
in terms of stress paths, of the methods of settlement analysis des-
cribed above will be made in Chapter 5.
Till now the oedometer test has been the cornerstone of
all settlement analyses, although the stress - strain relationships
from undrained triaxial tests are used to determine the Young1s
modulus (E), required for the calculation of the immediate settle-
ment (see Chapter 11 for a discussion of the factors that influence
the value of E). It was realised long ago, however, that certain
factors had to be taken into account if the oedometer test results
could be successfully applied to field problems. Casagrande (1936)
noted the significance of the pre-consolidation pressure and pro-
29.
posed an approximate method of determining this from laboratory
tests. This work was an important step in improving the relation-
ship between laboratory data and field behaviour. Further pro-
gress along this line was achieved by Schmertmann (1953) who
suggested an empirical method of determining the in-situ consolida-
tion behaviour of clays, from laboratory tests on samples with
various degrees of disturbance. Other factors that influence the
consolidation behaviour of clays, such as the rate of loading and
the magnitude of pressure increment have been pointed out by
Langer (1936), Terzaghi (1941), Leonard and Ramiah (1959), Crawford
(1964), Leonard and Altschaeffl (1964) and others - for a more
detailed account see Chapter 10 - but these factors have not
generally been taken into consideration in settlement analysis.
It has been mentioned already that the oedometer test
results are almost universally used today for all settlement
analyses; little use has so far been made of the triaxial test.
Of course, in situations where volume change of the clay during
consolidation results in one-dimensional strain direct use of the
oedometer test data will give satisfactory. But stress changes
during consolidation in the field are often such that the volume
change of the clay is accompanied by significant lateral strain,
in which case the assumption of one-dimensional strain would be
erroneous: To take this into consideration T. W. Lambe, in a
An early laboratory study of the influence of lateral stresses on the consolidation settlement was made by Hruban (1948).
30.
series of important contributions (Lambe 1964, 1965, 1965a, 1967)
has put forward the "Stress Path Method" of settlement analysis.
According to this, an "average element" beneath a foundation is
first located from a preliminary investigation. This "average
element" is then sampled and a number of laboratory triaxial tests
are performed, duplicating the effective stress path the element
is likely to undergo in the field during loading and consolidation.
The measured axial strain from the laboratory tests, multiplied by
the thickness of the clay layer, then gives the total settlement
which can, of course, be separated, if desired, into the "immediate"
and consolidation settlements. In this way the actual deformations
caused by the appropriate stresses beneath a foundation can be
evaluated. Although the assumption is made that the stresses re-
main unchanged during consolidation* (see Chapter 5) and there may
be practical difficulties in selecting the "average element", it is
the present author's view that Lambe's approach is a significant
advance in Civil Engineering analysis - it certainly gives a better
insight into the mechanics of soil deformation in the field.
Davis and Poulos (1963, 1966, 1968), in a series of
papers, have proposed a similar method of settlement analysis, based
on the triaxial test and elastic stress distribution. Essentially,
it consists of determining the Poisson's ratio (required for stress
This, of course, is to simplify the theoretical and experimental work involved, and not an inherent fault in the method.
31.
analysis) of the clay from triaxial tests - for the appropriate
stress range - and then subjecting representative samples from
various depths to stress changes, in the triaxial apparatus, that
they are likely to undergo in the field. The measured axial
strain multiplied by the thickness of the corresponding layer gives
the settlement and the sum of the settlements for each layer, then
gives the total settlement. A very similar procedure has also
been proposed by Kerisel and Quatre (1968)*. These methods are
more rigorous than Lambe's method in the sense that the stress path
of a number of elements beneath a foundation can be considered.
The difficulty of selecting the "average element" is thus avoided.
Although neither Davis and Poulos nor Kerisel and Quatre take into
account the stress changes that occur in the field during consolida-
tion they have claarly demonstrated the advantages of using the
triaxial test in settlement analyses, both from theoretical and
practical standpoints.
(B) Determination of the rate of settlement
The prediction of the rate of settlement has always been
the most uncertain part of a settlement analysis. Although settle-
ment in the field almost always occurs under three-dimensional con-
ditions, Terzaghi's theory of one-dimensional consolidation (Terzacshi.
Kerisel and Quatre (1968) also give charts for the cal-culation of vertical and horizontal stresses for different shapes (circular, square or rectangular) of rigid•and flexible footings, for all values of Poisson's ratio.
32.
1929) still remains the basis for the analysis of the rate of settle-
ment, and this often leads to considerable error. Theoretical
study of the rate of settlement has not been undertaken in the work
presented here. Only a brief review will, therefore, be presented
of the major advances that have been achieved in recent years in
studies on consolidation. The theories concerning secondary con-
solidation and creep will be excluded from this review.
The solution of Terzaghi's theory of one-dimensional con-
solidation for a wide range of the initial distribution of pore
pressures and boundary conditions have been given by Terzaghi and
Frftlich (1936) (also Terzaghi 1943). Gray (1945) solved the problem
of consolidation of contiguous clay layers having unlike compressi-
bilities and Gibson (1958) analysed the case. of clay layers varying
in tbickness with time. The variation of permeability and time -
dependent loading were considered by Schiffman (1958) while Abbott
(1960) studied the one-dimensional consolidation of multi-layered
soils. Schiffman and Gibson (1964) presented general solutions for
the one-dimensional consolidation of non-homogeneous clay layers
(i.e. compressibility and permeability varying with depth) and
showed that for structures founded on the upper part of London clay
non-homogeneity alone would cause the rate of settlement to be faster
than that predicted by the Terzaghi theory, even if consolidation
was one-dimensional. Davis and Raymond (1965) modified the theory
of consolidation for non-linear pressure void ratio relationships
33.
while Barden (1965) formulated a new theory to take the variatidos
of both compressibility and permeability during consolidation into
account. (see also Chapter 10). Gibson, England and Hussey
(1967) derived the general theory of one-dimensional consolidation
for a saturated clay layer undergoing large strains, using a form
of Darcy's law in which the relative velocity of the pore water and
the soil skeleton is assumed to be proportional to the excess
hydraulic gradient.
Although the above works constitute major improvements
on the original Terzaghi theory of one-dimensional consolidation,
in practical problems with deep beds of stiff clays where strains
as well as pressure increment ratios are small, they do not improve
the prediction of the field rate of settlement to any great extent,
(except the non-homogeneous solution of Gibson and Schiffman 1964).
For this we have to turn to the theories of three-dimensional con-
solidation.
The general theory of three-dimensional consolidation of
an isotropic, elastic medium was formulated by Biot (1941))who
showed that the problem of consolidation in the field was :intimately
linked with the problem of stress distribution. In a series of
papers Biot also analysed the particular case of a soil having a
Poisson's ratio = 0 and loaded uniformly over an infinite strip
(Biot 1941a, Biot and Clingan 1941). Later he extended the theory
to cover the more general case of the porous anisotropic medium
34.
(Biot 1955) and gave physical interpretations to the elastic co-
efficients involved (Biot 1957). A number of solutions to pro-
blems of three-dimensional consolidation have been developed in
the context of the radial flow of water to sand drains (Rendulic
1935, Barron 1948, Richart 1957, Hansbo 1960) but the solution of
foundation problems was nor forthcoming until Gibson and Lumb
(1953) obtained numerical solutions to a simplified form of the
consolidation equation (see Chapter 13) for a few specific cases
which, at once, showed the inadequacy of the Terzaghi theory in
predicting the rate of settlement in the field. In a series of
subsequent papers Gibson and McNamee (1957, 1960, 1963) derived
rigorous analytical solutions to the consolidation of various
foundation problems - the case of the circular fdoting was also
considered by Josselyn de Jong (1957) - but numerical evaluations
for a wide range of soil properties are not yet available. Rowe
(1964) developed a theory of consolidation for the flow of water
to a lateral boundary in a stratified medium. Recently Davis
and Poulos (1966) have suggested an approximate method for solving
the three-dimensional consolidation equations and produced a number
of charts which can be used to predict the rate of settlement of
circular and strip footings founded on layers of finite depth.
This will be considered in greater detail in Chapter 13.
35.
CHAPTER 3
A STUDY OF CASE RECORDS OF
SETTUMENT OF STRUCTURES ON CLAY
General definitions
An idealised time-settlement curve for a structure founded
on saturated clay is shown in Fig. 3.1. Prior to the application of
the structural load a depth of soil is excavated to foundation level
during which the soil heaves upwards as a result of the release of over-
burden pressure. During subsequent construction as the pressure on
the foundation increases the soil begins to settle until the net
pressure on the foundation is zero and the settlement is approximately
equal to the heave that occurred during excavation. As construction
proceeds the net pressure on the soil increases and the structure
continues to settle. By the time construction is complete and the
full load is applied the structure has undergone what is commonly
known as the "immediate" settlement (p.). If construction is I
sufficiently rapid this settlement takes place essentially under
condition of no volume change and is primarily due to shear deforma-
tion of the clay.
The application of the structural load, however, causes
excess pressures to develop in the ground water which then begin to
dissipate. The process of consolidation is associated with a change
36.
of volume of the subsoil and the structure undergoes further settle-
ment. This "consolidation" settlement (pc) increases with time
at a rate depending on the coefficient of consolidation of the clay
as well as drainage conditions. The total amount by which the
structure has settled when the excess pore-pressures have fully
dissipated is called the total primary settlement (Pp) and is
comprised of the "immediate" and the "consolidation" settlements.
For some clays, however, the settlement does not cease with
the end of primary consolidation. The long term settlement which
occurs due to creep at esentially constant effective stress and is
known as the "secondary" settlement may continue for many years,
even decades.
In the following sections of this chapter a number of case
records are studied of settlement of structures on both over-
consolidated and normally consolidated clays. It will be noticed
that for most structures measurements of heave that occurs during
excavation are not available mainly because the first observation
of settlement is not made until construction has progressed to a
certain extent. It is, therefore, assumed that the heave and the
subsequent settlement that takes place on restoration of the ex-
cavation load are small compared to the total settlement. This
assumption is justified at least in cases where the net foundation
pressures are relatively large and where the excavations are not
left open for too long a period. Therefore, for the structures
studied, where both the above conditions are satisfied, only the
immediate and consolidation settlements under the net foundation
load are considered.
3.2 Structures on over-consolidated clays
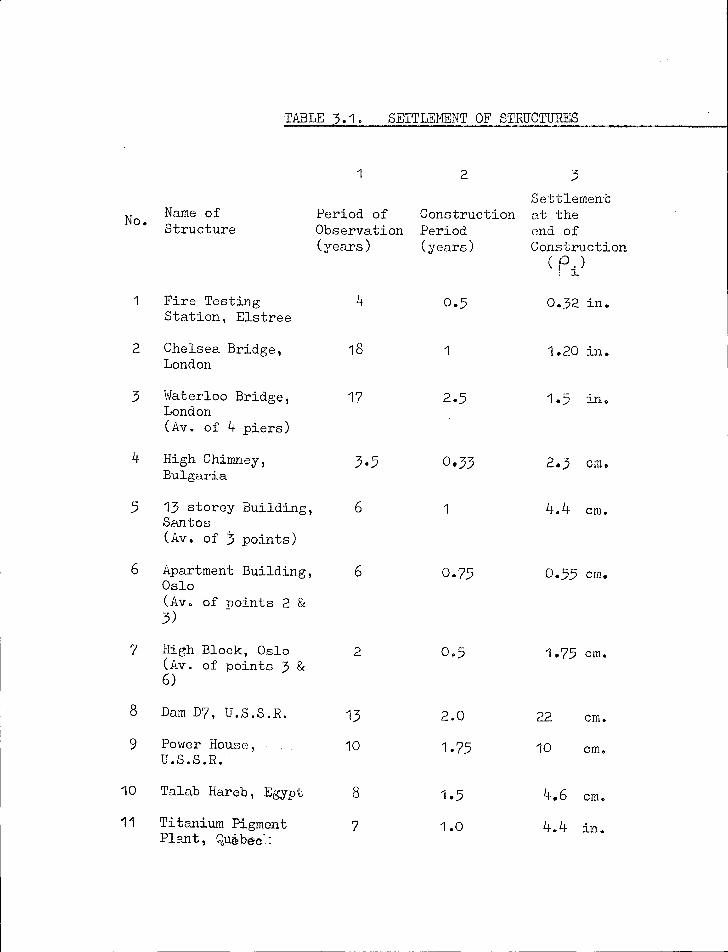
(i) Fire Testing Station, Elstree, London (Skempton, Peck and McDonald 1955)
The Fire Testing Station near Elstree, North London, is a
a reinforced concrete structure 138 ft. x 36 ft. in plan and was
built between April and August 1935. The building is supported on
5 ft. x 10 ft. x 6 ft. deep mass concrete footings situated at a
depth of 7 ft. into the Brown London Clay overlying the stiffer
blue London Clay.
Settlements were observed for 4 years during and after
construction by the Building Research Station. The average time/
settlement curve for seven footings shows that the net settlement
at the end of construction was 0.32" and the structure was still
settling after 4 years.
(ii) Chelsea Bridge, London (Buckton and Fereday 1938) (Skempton, Peck and McDonald 1955)
The new Chelsea Bridge over the River Thames which re-
placed the old bridge in 1937 is a self-anchored suspension type
with two mass concrete supporting piers 28 ft. x 106 ft. in area
founded at a depth of 31 ft. below the river bed in the blue London
37.
Clay.
The settlements of the two piers have been observed for
18 years after construction by which time settlement virtually
stopped (Fig. 3.2).
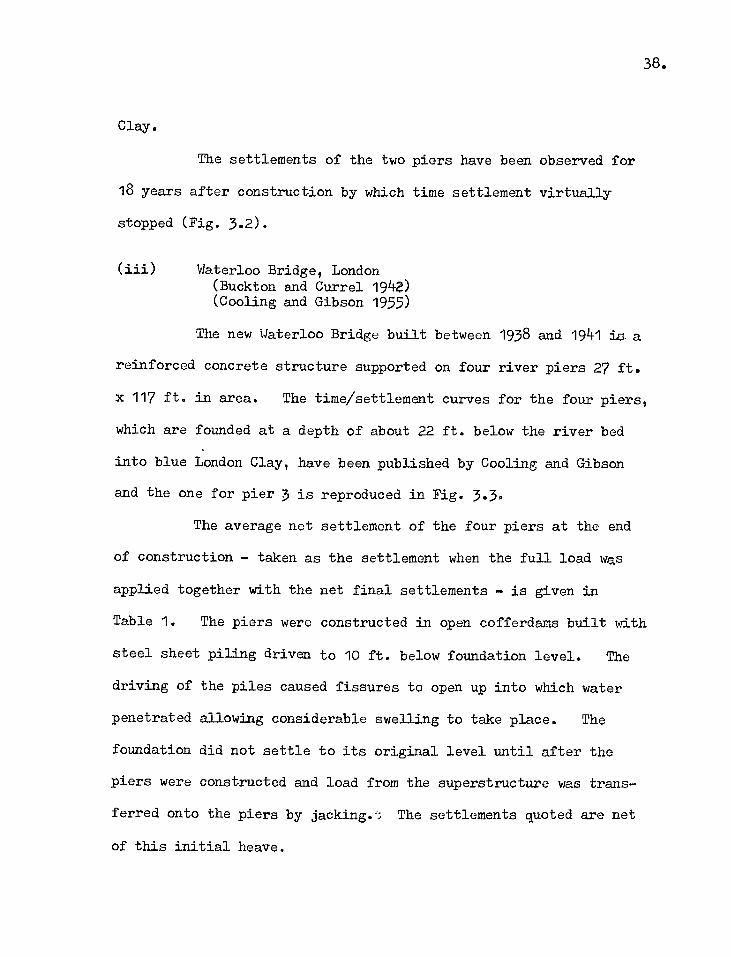
(iii) Waterloo Bridge, London (Buckton and Currel 1942) (Cooling and Gibson 1955)
The new Waterloo Bridge built between 1938 and 1941 iu a
reinforced concrete structure supported on four river piers 27 ft.
x 117 ft. in area. The time/settlement curves for the four piers,
which are founded at a depth of about 22 ft. below the river bed
into blue London Clay, have been published by Cooling and Gibson
and the one for pier 3 is reproduced in Fig. 3.3.
The average net settlement of the four piers at the end
of construction - taken as the settlement when the full load was
applied together with the net final settlements - is given in
Table 1. The piers were constructed in open cofferdams built with
steel sheet piling driven to 10 ft. below foundation level. The
driving of the piles caused fissures to open up into which water
penetrated allowing considerable swelling to take place. The
foundation did not settle to its original level until after the
piers were constructed and load from the superstructure was trans-
ferred onto the piers by jacking.t. The settlements quoted are net
of this initial heave.
38.
(iv) High Chimney, Bulgaria (Stefanoff et al 1965)
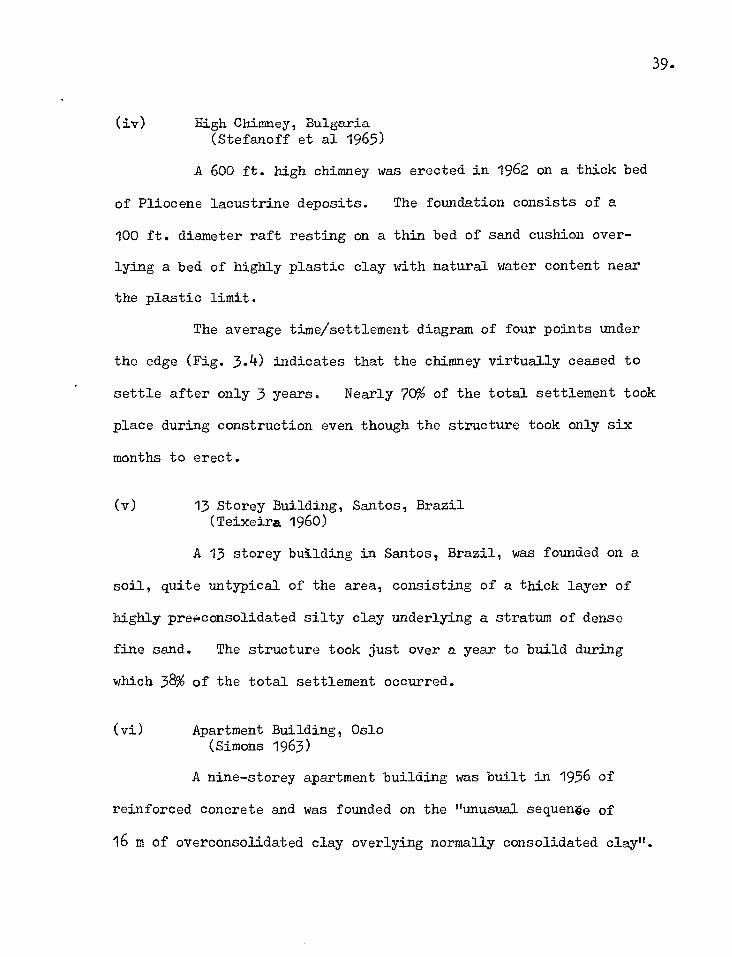
A 600 ft. high chimney was erected in 1962 on a thick bed
of Pliocene lacustrine deposits. The foundation consists of a
100 ft. diameter raft resting on a thin bed of sand cushion over-
lying a bed of highly plastic clay with natural water content near
the plastic limit.
The average time/settlement diagram of four points under
the edge (Fig. 3.4) indicates that the chimney virtually ceased to
settle after only 3 years. Nearly 70% of the total settlement took
place during construction even though the structure took only six
months to erect.
(v) 13 Storey Building, Santos, Brazil (Teixeira 1960)
A 13 storey building in Santos, Brazil, was founded on a
soil, quite untypical of the area, consisting of a thick layer of
highly preeconsolidated silty clay underlying a stratum of dense
fine sand. The structure took just over a year to build during
which 38% of the total settlement occurred.
(vi) Apartment Building, Oslo (Simons 1963)
A nine-storey apartment building was built in 1956 of
reinforced concrete and was founded on the "unusual sequenbe of
16 m of overconsolidated clay overlying normally consolidated clay".
39.
40.
Settlement observations (Fig. 3.5) show that maximum settlement was
reached 33 years after construction and since then no further settle-
ment has occurred.
(vii) High Block, Oslo (Bjerrum 1964)
A 12-storey building 12.5 m x 71.4 m in plan with continuous
strip footings was supported on a layer of very stiff weathered clay
overlying stiff silty clay followed by a soft layered clay resting
on morraine. The thickness of the different layers varied along
the length of the building which has almost ceased to settle after
only two years. Nearly 60% of the total settlement occurred during
6 months of construction.
(viii and Dam D7, and Powerhouse, U.S.S.R. ix) (Nitchiporovich 1957)
Settlement observations on a large number of hydraulic
structures in the U.S.S.R. indicate that most of these structures
have ceased to settle after 10-20 years and that "principal settle-
ment (65 to 85 percent of the total) takes place at the end of con-
struction". All the structures are built of mass ..oz reinforced
concrete with total height ranging from 20-30 m and base width of
14-20 m. The foundation consists of alluvial and glacial clayey
soils and Jurassic, Permotriassic and Devonian clays with moisture
content somewhat lower than plastic limit. Settlements of two
such structures, Dam D7 and Powerhouse PH3, built on 100 m of
Permotriassic clays are given in Table 1.
(x) Talab-Hareb Building, Egypt (Banhet 1953)
This building was built on a site consisting of a layer
of very stiff clay underlain by alternate layers of silty clay and
clayey silt overlying fine sand. The building settled 48 mm during
2i years of construction and the total settlement was no more than
56 mm after 8 years.
(xi) Titanium Pigment Plant, Vareness, P.Q., Canada (Casagrande, L., et al 1965)
A large industrial plant in Vareness, P.Q. was built in
1957 on mat foundation on a site consisting of 90 ft. of stratified
clay underlain by 50 ft. or more of organic clay with no visible
stratification. The clay is lightly overconsolidated but the net
pressure increase due to the structure plus the initial effective
overburden pressure is less than the maximum pre-consolidation
pressure. The structure was built in one year during which more
than 65% of the total settlement occurred (Fig. 3.6).
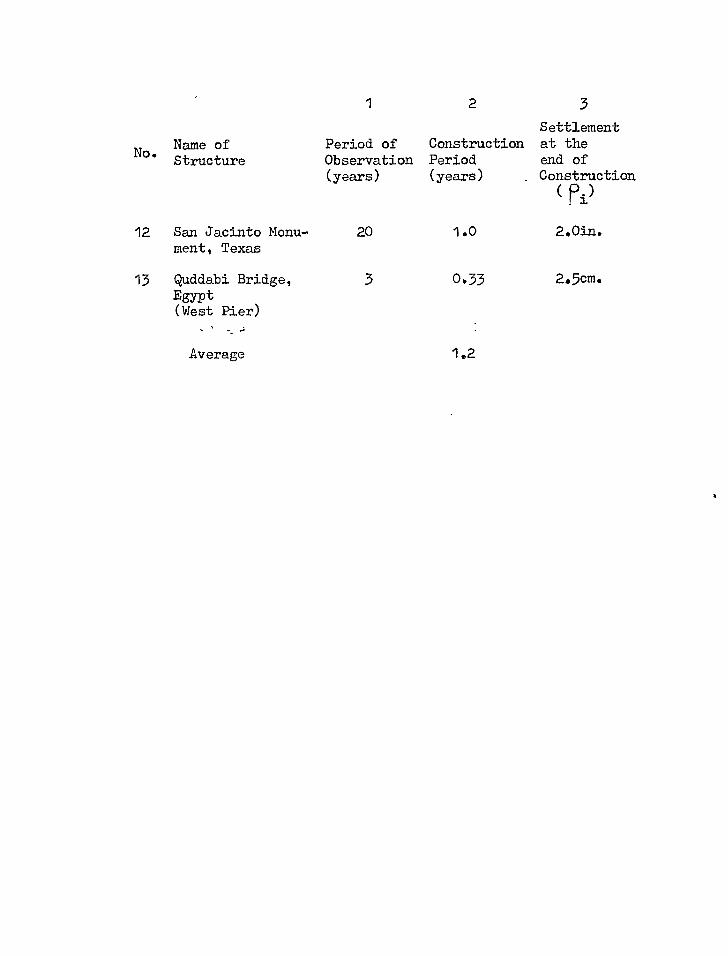
(xii) San Jacinto Monument, Texas (Dawson 1940) (Dawson and Simpson 1948) (Bjerrum 1964b)
The 570 ft. high Monument on the San Jacinto River in
Texas was erected in 1937 to commemorate the victory of General
Sam Houston in the Mexican War of 1836. The structure is founded
41.
42.
on a monolithic concrete base 124 ft. square resting on 120 ft. of
stiff-fissured Beaumont clay overlying a bed of sand. Settlement
records have been kept since 1936 to the present day (Fig. 5.7).
It can be seen that after about 3 years when the settlement tended
to reach a steady value the building has settled another 5 in. and
is still doing so after 20 years. From a study of the irregularities
of the time/settlement curve Dawson (1948) has correlated them with
occurrence of high wind velocities and concluded that the abnormally
high secondary settlement was a result of this intermittantly applied
wind load. The total primary settlement of the structure has been
estimated as 3.5 in.
(xiii) Quddabi Bridge, Egypt) (Hanna 1950)
This is a 3-span cantelever bridge on two abutments and
two concrete piers which rest on a hard plastic brown clay underlain
successively by silty clay and clayey silt. The structure settled
extremely fast and virtually came to equilibrium after only 2 years.
3.3 Structures on normally-consolidated clays
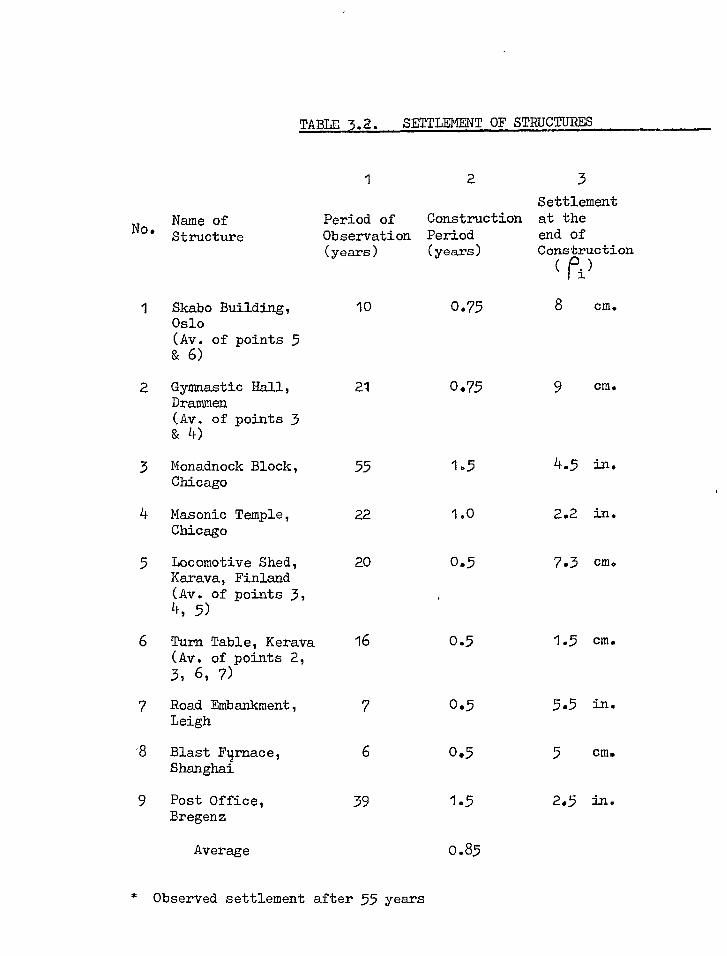
(i) Skabo Building, Oslo (Simons 1957)
This office building approximately 27 m x 15 m in plan was
constructed of reinforced concrete in 1948. The foundation consists
of strip and rectangular footings founded on a weathered crust over-
43e
lying 20 m of scft blue clay followed by a layer of permeable sandy
clay with gravel.Settlement observations were made at six points of
the building. The final primary settlement was obtained by extend-
ing the straight line portion of the settlement vs. log time plot to
25 years. The construction period was only 9 months during which
the points settled 8-10 cms.
(ii) Gymnasium Hall, Drammen (Simons 1957)
This structure, consisting of a heavier and a lighter section,
approximately 44 m x 20 m, is a reinforced concrete framed building
supported on strip and raft foundations. The soil under the heavier
section which is supported on a raft consists of a thin layer of fine
sand underlain successively by soft silty clay, soft clay and silty
varved clay which overlies fine sand at a depth of 27 m. Settle-
ments were observed for nearly 18 years and an average of points 3
and 4 under the heavier wing are shown in Fig. 3.8. Plotting
observed settlement against log time the settlement at the end of
primary consolidation was found to be 53.5 cm while that at the end
of construction was only 9 cm.
(iii) Monadnock Block, Chicago (Peck and Uyanik 1955) (Skempton, Peck and McDonald 1955)
The Monadnock Block is a 16 storey wall-bearing Masonry
building built in 1891/92. The foundation consists of steel
44.
grillage footings resting at a depth of 12.5 ft. below ground surface
on a crust of stiff clay overlying the soft and medium soft Chicago
clay. Settlement records have been kept regularly for almost 60
years from which it is found that the structure settled 4.5 in.
during 2 years of construction while the total settlement after 6o
years was 22in.
(iv) Masonic Temple, Chicago (Peck and Uyanik 1955) (Skempton, Peck and McDonald 1955)
The Masonic Temple is a 20 storey steel-frame structure
113 ft. x 165 ft. in plan and 302 ft. high and was erected between
November 1890 and November 1891. It is supported on spread footings
founded 14 feet below ground surface on a thin crust of stiff clay
underlain by soft glacial clay. The average time/settlement diagram
for the four corners of the building is shown in Fig. 3.9. The
settlement at the end of construction was 2.2 in. and the structure
virtually ceased to settle after 20 years when the settlement amounted
to 9.8 in.
(v) and Locomotive Shed and Turn Table, Kerava, Finland (vi) (Helenelund 1953)
The Locomotive Shed and the Turn Table at Kerava railway
station 29 km. north of Helsinki were built in the Spring of 1933.
The buildings are supported on reinforced concrete rafts founded on
a layer of gravel fill which rests upon a soft clay deposit underlain
45.
by dense moraine and rock. Considerable settlements have occurred
in 16-20 years (37 cm. for the Locomotive Shed and 16.5 cm. for the
Turn Table) though not more than 17% took place during construction.
(vii) Road Embankment, Leigh (Lewis 1963)
As part of an investigation to assess the value of vertical
sand drains in accelerating the settlement of a foundation, an embank-
ment was constructed on a post glacial clay marsh of the Thames
estuary. Settlement gauges were installed in a 200 ft. length of
the embankment, half of which was built with sand drains. Results
of observations in the area without sand drains are shown in Fig.
3.10. The two-stage loading makes it difficult to determine precisely
the immediate settlement, and this has been estimated as 5.5 in.
The total settlement after 7 years has been 22.5 in. A significant
part of the consolidation settlement must have taken place during
construction because of the small thickness of the clay layer.
(viii) Blast Furnace, Shanghai (Yu, Shu and Tong 1965)
Settlement records of a 30 m tall Blast Furnace, supported
on piles penetrating 20 m into the highly compressible alluvial
deposits of the Lower Yangtze Valley (Fig. 3.11) show that during
6 months of construction the structure settled 5 cm. while the net
settlement at the end of primary consolidation was 25 cm.
46.
(ix) Post Office, Bregenz, Austria (Terzaghi 1933) (Skempton and McDonald 1955)
The Post Office, built in 1893, rests on continuous footings
supported on a layer of sand and gravel overlying a stratum of soft
clay 50 ft. thick. Complete settlement records are available of
eight points of the building covering a period of over 30 years.
The average time/settlement curve of four corners is plotted in Fig.
3.12. The building took 11 years to build during which only 16%
of the total primary settlement, complete in 10 years, occurred.
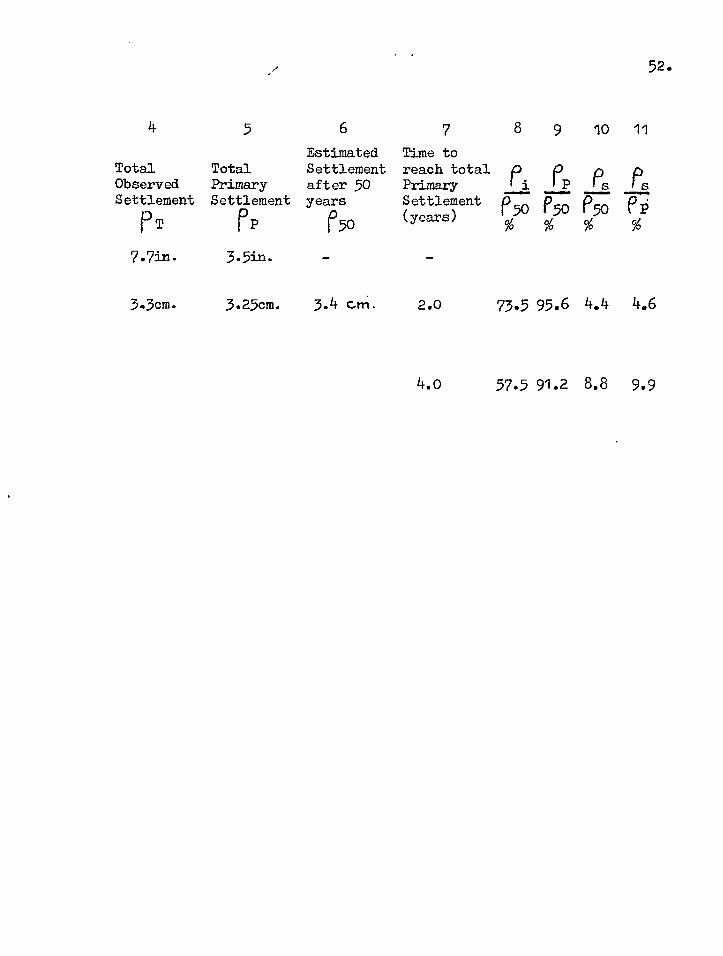
3.4 Summary and discussion
The observed settlement data of all the structures described
above are summarised in Tables 3.1 and 3.2. The immediate settle-
ment ( f)1), the total primary settlement (1°1)) and the secondary
settlement (fs) have been expressed as percentages of the estimated
total settlement after 50 years (P50) - in columns 8, 9 and 10
respectively. In order to obtain f)50 the settlements were plotted
against log time and the final straight line of each curve was ex-
tended to 50 years as shown in Fig. 3.13 in which the methods of
obtaining the total primary settlement and the time to reach the end
of primary consolidation are also demonstrated.
It can be readily seen from Fig. 3.15 that
F 50= Pp ± (0. or
PP +Ps = 1 (3.40)
50 50
47.
It is possible, from an analysis of the data presented in
Tables 3.1 and 3.2, to make some general observations concerning the
respective behaviours of overconsolidated (0.0.) and . .ormally con-
solidated (N.C.) clays.
1. Structures on O.C. clays, in general, settle much less than
those on N.C. clays. This is only to be expected because one of
the main effects of over-consolidation is to reduce the compressibility
of the clay. One further reason may be that the excess pore-pressure
developed in O.C. clays are usually less than those in N.C. clays
for the same total stress changes, resulting in correspondingly
smaller consolidation settlement.
2. The most striking difference in behaviour of the two types
of clays can be found in the proportions of the total settlement
that takes place by the end of construction. On average, for 0.C.
clays as much as 57.5% of the total settlement occurs during con-
struction compaied to only 15.5% for normally consolidated clays.
A direct comparison of this difference is hard to make because the
immediate settlement (i.e. the settlement at the end of construction)
depends on many factors such as the thickness of the clay layer
relative to the size of foundation, the presence of any sand stratum
and length of the construction period. While individual variations
of the first two factors are difficult to take into account, it can
be seen that the average construction periods in both groups are
similar, being 1.2 years for structures on 0.C. clays and 0.85 year
48.
for those on N.C. clays. Also the settlement at the end of con-
struction must include a part of the consolidation settlement which,
however, is believed to be small for the construction periods con-
sidered. Even taking these uncertainties into consideration,
therefore; the big difference in the proportion of the total settle-
ment that occurs during construction on over-consolidated and
normally consolidated clays may be taken as a characteristic of the
difference in behaviour of the two types of clays.
To find a possible reason for this one has to look once
again into the development of excess pore-pressures in N.C. and 0.C.
clays when they are subjected to increase in total stresses. It
is known that the pore-pressure parameter A for N.Ct clays is, in
general, nearer 1 while for 0.C. clays it is considerably less
(Bishop and Henkel 1962). For identical total stress changes
beneath two foundations, therefore, the excess pore-pressures in
the N.C. clay will be higher than in the 0.C. clay. The effect of
this difference on the settlement of structures is two-folds Not
only will the increase in effective stresses during undrained loading
be greater in 0.C. clays producing proportionately more immediate
settlement, but also the consolidation settlement, which is a
function of the effective stress changes caused by the dissipation
of excess pore-pressures, will be correspondingly smaller.
3. The progress of consolidation settlement is comparatively
faster for 0.C. clays than for N.C. clays. In fact, the secondary
49.
phase in O.C. clays is reached between 1.5 and 7.5 years while the
corresponding period in N.C. clays is between 4 and 25 years.
There is, obviously, considerable variation as one would expect.
Nevertheless, on average, the structures on O.C. clay reach their
full primary settlement only 3 years after construction while for
N.C. clays the figure is 9 years. It is possible that the overall
permeability of overconsolidated clays in-situ may be greater
because of the presence of fissures and joints giving rise to a
higher coefficient of consolidation and hence a faster rate of
dissipation. Further, it would, in general, be expected that
O.C. clays should have higher values of cv than similar N.C. clays,
simply because of the very much smaller compressibility of 0.0.
clays.
Another reason which is considered likely is that the
effective depth of clay beneath a foundation (i.e. the depth within
which the ratio of the increase in effective stresses during con-
solidation to the stresses prior to it is significantly large) may
'only be small compared to the thickness of the clay layer. Terzaghi
(1941) found that at some point beneath the Charity Hospital in
New Orleans the settlement was zero in spite of the fact that there
was some increase in vertical stress at the point. It is possible,
therefore, that there exists a threshold value which must be ex-
ceeded before any significant settlement will occur. If the
effective depth within which this threshold is exceeded and which,
50.
of course, will depend on the dimensions of the loaded area, is
small, the drainage path will also be correspondingly small allowing
dissipation to proceed rapidly.
4. The secondary settlement of structures on O.C. clays is
smaller (average 8.8% of the 50 year settlement) than those on N.C.
clays (21.6%). In fact, the average secondary settlement is as
high as 29.2% of the total primary settlement for N.C. clays compared
to only 9.9% for 0.C. clays. It is well recognised that soft
normally consolidated deposits undergo large secondary deformation
when all the excess pore-pressures have dissipated. Indeed in some
clays like Drammen (Bjerrum 1967) and Mexico City Clay (Zeevaert
1958) this long term settlement may constitute the major part of the
total settlement. Over-consolidated clays, however, have been
subjected to higher pressures in their geological history and any
structural loads that are now applied cause them only to recompress.
In such cases secondary deformation is not likely to be significant.
No.
1
Name of Structure
Fire Testing Station, Elstree
2 Chelsea Bridge, London
3 Waterloo Bridge, London (Av. of 4 piers)
4 High Chinmey, Bulgaria
5 13 storey Building, Santos (Av. of 3 points)
6 Apartment Building, Oslo (Avo of points 2 & 3)
7 High Block, Oslo (Av. of points 3 & 6)
8 Dam D7, U.S.S.Ro
9 Power House, U.S.S.R.
10 Talab Hareb, Egypt
11 Titanium Pigment Plant, Q~bec·.:
SETTLEMENT OF STRUCTURE_S _______ ......
1
Period of Observation (years)
4
18
17
6
6
2
13
10
8
7
2
Construction Period (years)
1
1
0.75
2.0
1.75
1.0
3
Settlement at the end of Construction
( p.) ! ~
0.32 in.
1.20 in.
4 .. 4 em.
0.55 cm.
1.75 cmc
22 cm ..
10 emo
4.6 effio
4.4 in.
Total Observed Settlement
) T
7 Time to reach total Primary Settlement (years)
8 9 10 11
Pi -Pp es Ps F5o ('50 e50 ep % % %
5 6 Estimated
Total Settlement Primary after 50 Settlement years
FP 150
0.58 in. 0.56 in.. 0.59 in.
2.0 in. 1.8 in. 2.05 in.
3.7 in. 3.4 in. 4.0 in.
5.o
3.5
7.5
1.5 3.3 cm. 3.2 cm. 3.5 cm.
10.0 cm. 11.6 cm. 4.0 10.6 cm.
1.75 cm. 1.8 cm. 4.5 1.8 cm.
2.8 cm. 2.7 cm. 3.0 cm. 2.0
ON OVERCONSOLIDATED CLAYS
54.o 95.o 5.0 5.3
58.5 87.8 12.2 13.9
37.5 85.o 15.o 17.6
65.7 91.4 8.6 9.4
38.o 86.2 13.8 16.0
31.5 97.2 2.8 3.0
58.5 90.0 10.0 11.0
64.7 91.2 8.8 9.6
60.6 87.9 12.1 13.8
80.7 94.7 5.3 5.6
66.7 91.0 9.0 9.9
-
(Continued)
51.
33 cm. 31 cm. 34 cm. 5.5
17 cm. 14.5 cm. 16.5 cm. 4.0
5.6 cm. 5.4 cm. 5.7 cm. 4.0
6 in. 6.0 cm. 6.6 cm. 5.0
1 2 3
Settlement No. Name of Period of Construction at the
Structure Observation Period end of (years) (years) Construction
( fl)
12 San Jacinto Monu- 20 1.0 2.0in. ment, Texas
13 Quddabi Bridge, 3 0.33 2.5cm. Egypt (West Pier)
Average 1.2
52.
7 8 9 10 11
Total Observed Settlement
pT
5
Total Primary Settlement
131)
6 Estimated Settlement after 50 years
150
Time to reach total Primary Settlement (years)
li Lip P, 1050 p50 p,o PPP % % %
7.7in- 3-51n.
3.5cm. 3.25cm. 3.4 cm. 2.0 73.5 95.6 4.4 4.6
4.0 57.5 91.2 8.8 9.9
No.
TABLE 3.2. SETTLEMENT OF STRUCTURES
Name of Structure
1
Period of Observation (years)
2
Construction Period (years)
3 Settlement at the end of Construction (
1 Skabo Building, Oslo
10 0.75 8 cm.
(Av. of points 5 & 6)
2 Gymnastic Hall, Drammen
21 0.75 9 cm.
(Av. of points 3 & 4)
3 Monadnock Block, Chicago
55 1.5 4.5 in,
4 Masonic Temple, Chicago
22 1.0 2.2 in.
5 Locomotive Shed, Karava, Finland
20 0.5 7.3 cm.
(Av. of points 3, 4, 5)
6 Turn Table, Kerava 16 0.5 1.5 cm. (Av. of points 2, 3, 6, 7)
7 Road Embankment, Leigh
7 0.5 5.5 in.
8 Blast Firnace, Shanghai
6 0.5 5 cm.
9 Post Office, Bregenz
39 1.5 2.5 in.
Average 0.85
* Observed settlement after 55 years
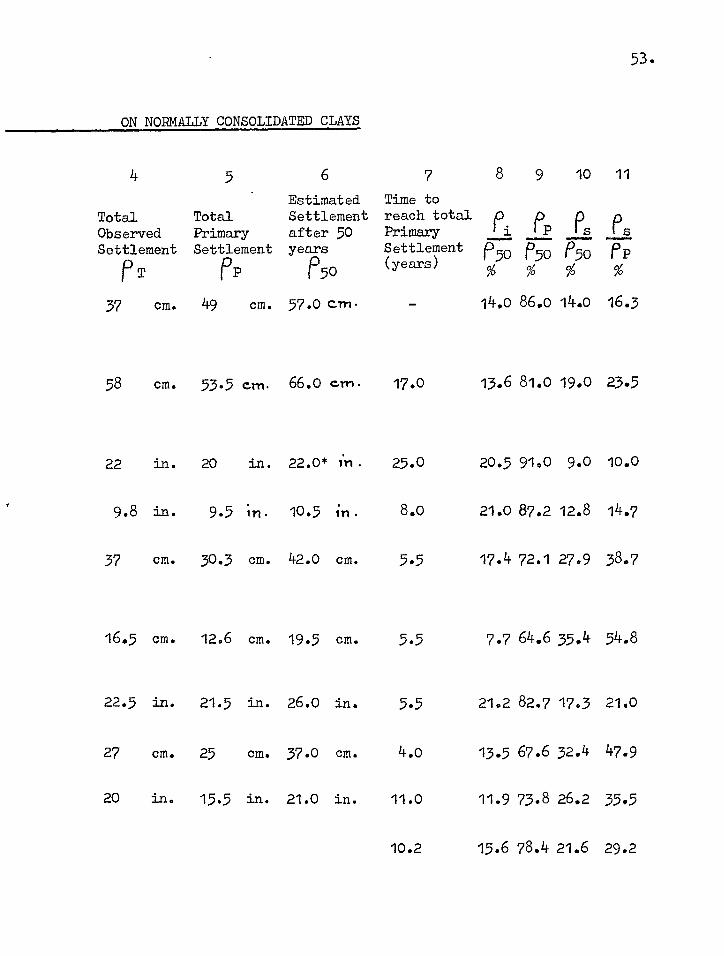
ON NORMALLY CONSOLIDATED CLAYS
53.
4
5 6
Estimated Total
Total
Settlement Observed
Primary after 50 Settlement Settlement years
PP
P50
37 cm. 49 cm. 57.0 crn.
58 cm. 53.5 cm. 66.0 crn.
22 in. 20 in. 22.0* in.
9.8 in. 9.5 in. 10.5 in.
37 cm. 30.3 cm. 42.0 cm.
16.5 cm. 12.6 cm. 19.5 cm.
22.5 in. 21.5 in. 26.0 in.
27 cm. 25 cm. 37.0 cm.
20 in. 15.5 in. 21.0 in.
7 8 9 10 11 Time to reach total p Primary i Pp Ps Settlement 0 5o P.5o P50 PP (years) % % %
14.o 86.0 14.o 16.3
17.o 13.6 81.0 19.0 23.5
25.0 20.5 9100 9.0 10.0
8.0 21.0 87.2 12.8 14.7
5.5 17.4 72.1 27.9 38.7
5.5 7.7 64.6 35.4 54.8
5.5 21.2 82.7 17.3 21.0
4.o 13.5 67.6 32.4 47.9
11.0 11.9 73.8 26.2 35.5
10.2 15.6 78.4 21.6 29.2
CHAPTER 4
LONDON CLAY - GEOLOGY AND STRESS HISTORY
4.1 Geology of the London Basin
The geology of the area consisting of Greater London and
parts of the neighbouring counties of Essex, Hertfordshire, Bucking-
hamshire, Berkshire, Surrey and Kent has been the subject of ex-
tensive study for more than 100 years. Details of these studies
have been published by various authorities, the more comprehencve
works being Woodward (1922), Buchan (1938), Wooldrich and Lynton
(1955), and Sherlock (1962). The following is a short account of
the various geological materials that occur in the area and are of
interest to engineers.
Figure 4.1 shows the solid geology of the sedimentary
formation in the London basin. The Palaeozoic rocks, the nearest
outcrop of which is 100 miles north and west of London, are the
deepest known formation in the area. Under London itself the rocks
which are struck at about 1,000 ft. below sea-level (Clayton 1964)
form a "Platform" over which the late Mesozoic Strata (Jurassic and
Cretaceous) were deposited. The Jurassic rocks, which come to the
surface in Wiltshire, Oxfordshire and a narrow strip of Berkshire,
are, however, absent all over the London area and the succeeding
formation, the Cretaceous, lies directly over the Palaeozoic rocks.
54-
55.
The freshwater deposits of the Lower Cretaceous - the so -cal)ed
Hastings Beds containing beds of sandstone separated by layers of
clay and the later Weald Clay - can be seen in Kent and Sussex.
The Lower Greensand, which is probably of marine origin, occurs in
a narrow band, and was deposited towards the end of this period.
The Gault Clay was the first of the Upper Cretaceous forma-
tions to be deposited on the Palaeozoic rocks across the London
Platform. This clay and its sandy equivalent, the Upper Greensand,
are exposed in the south and the north-west of the area.
The thick bed of Chalk, most of which is very pure lime-
stone; overlies the Gault and underlies all the Tertiary sediments
occupying the London area. It is possible the Chalk attained a
thickness of up to 800 ft., but subsequent erosion appears to have
removed about 200 ft. in places. Between the outcrops in the
north-west and in the south the Chalk forms a shallow trough
commonly known as the London Basin over which the Eocene Beds were
deposited (Fig. 4.2). The Chalk has, for long, been the chief
source of water supply in the London area having acted as a collector
of the rain falling on the Chiltern Hills and North Downs (see fig.
3.2) (Wilson and Grace 1942).
The early Eocene deposits were the Thanet Sands and the
Woolwich and Reading Beds, collectively known as the Lower London
Tertiaries. The former consist of fine grained sands and silts
and exists in thicknesses of up to 70 ft. thinning down to only
56.
15 ft. in the most westerly exposure. The latter are a variable
group of sands, clays and pebble-beds, occasionally cemented, with
average thickness of about 70 ft.
The most important Eocene formation in the area is the
London Clay which appears today as a very stiff dark-grey or bluish-
grey material. Over much of the area where it is exposed the Clay
has turned brown due to the oxidation of its iron salts by weather-
ing.
The London Clay is considered to have been formed by mud
brought down by a large river and deposited under marine and
estuarine conditions. Further middle and late Tertiary deposits
are thought to have been laid down but these were subsequently re-
moved by erosion. The Clay was later covered by the Quaternary
deposits and in certain areas by the successive glaciations, the
pressures from which consolidated it into a very stiff and compact
clay. The overlying sediments and a considerable thickness of
the clay itself have, in many places, subsequently been eroded
leaving the London Clay today under pressures considerably smaller
than they have been subjected to in the past.
In the vicinity of London, the London Clay is sometimes
covered by sandy Claygate Beds, also Eocene, but in other places,
these are missing and the Clay is covered abruptly by another
Eocene formation, the Bagshot Sands. There are several places
today where the full thickness of the London Clay is present, as
57.
indicated by the overlying Claygate Beds, such as Wimbledon (430 ft.),
Hampstead (400 ft.), Ingatestone (532 ft.) and Sheppey (518 ft.).
Over much of the area, however, erosion has removed a great deal of
the Clay leaving, for example, only between 60 ft. and 130 ft. in
Central London.
The post-Tertiary formations of the London Basin consisting
of the Pleistocene and recent deposits covered much of the solid
formations of the area before they were removed by widespread erosion.
Though at the present time a few high hills carry the early deposits
known as the pebble-gravels, the most significant of the Pleistocene
activities was the advance of the successive ice-sheets into the
North of the area which diverted the Thames to its present course
from a position far to the north where it then flowed. The deposits
of gravel and Boulder Clay associated with the ice sheets can be
found over wide areas in the North-west and Essex. The Quaternary
river deposits on the other hand, which consist mostly of gravel,
sand and silts - for example the Boyn Hill, Taplow or Flood Plain
Terraces - predominate the lower Thames valley.
The Drift Geology of the area has been completed by the
recent deposits of alluvium and peat which form the flat meadow and
marsh lands bordering the river and its tributaries.
4.2 Previous. Work on London Clay
London Clay is the most widespread foundation material in
58.
the London Basin and supports a high density of buildings which have
in recent years been built to considerable heights, e.g. the Shell
Tower, 351 ft. (Measor and Williams, 1962), Portland House, 330 ft.
(Frost and Mason, 1963), the Post Office Tower, 600 ft. (Creasey,
Adams and Laurpitt, 1965) and the Commercial Union Building, 387 ft.
(Williams and Rutter, 1967).
As mentioned in the previous section, uplift and erosion
have removed much of the overlying deposits and, in places, a con-
siderable thickness of the Clay itself, which means that London Clay
as it exists today is heavily over-consolidated. Major structural
features in the Clay are the slight laminations (Cooling and Skempton
1942, Bishop 1947), joints, shear zones and a high degree of
fissuring, the importance of which in determining the undrained
strength of the Clay is now well recognised (Bishop 1966, Bishop and
Little 1967, Hooper and Butler 1967).
The engineering properties of London Clay have been the
subject of many investigations. Cooling and Skempton (1942) con-
ducted one of the earliest studies in connection with the foundations
of the Waterloo Bridge. Skempton and Henkel (1957) published results
of tests made on samples taken from deep borings at three other sites
in Central London - Paddington, Victoria and the South Bank. Soon
afterwards a most extensive study was initiated at the Building Research
Station and at Imperial College primarily on the shear strength
properties of the Clay. Samples were tested from five different
59.
depths of the Ashford Common shaft and from a nearby tunnel. The
results are well documented (Ward, Samuels and Butler 1959, Bishop,
Lewin and Webb 1965, Webb 1966, Ward, Marsland and Samuels 1966).
The influence on strength of anisotropy and sample size have been
investigated by Bishop (1966), and Bishop and Little (1967) while
Agarwal (1967) conducted a thorough investigation on the Clay from
Wraysbury. A comprehensive study of the undrained strength of
London Clay has been made by Hooper and Butler (1967). Residual
strength of London Clay was the subject of Professor Skempton's 4th
Rankine Lecture (Skempton 1964). More recently the author's colleague
Mr. H. T. Lovenbury, has been studying the long-term creep properties
of the Clay from Hendon, (Lovenbury 1968).
4.3 Index Properties
From a study of the published work on London Clay it is
possible to list the range and variation of its index properties.
Table 4.1 summarises the results from 11 different sites spread along
the London Basin. The properties of the Clay from Oxford Circus and
Ongar which were used in the present research programme (for details
see Chapter 8) lie within the usual scatter (Fig. 4.3). There
appears to be a general, though not particularly well-defined, trend
towards lower liquid limit and lower plasticity index in moving from
east to west along the Basin, (Bishop et al 1965).
The mineralogical composition of the Clay as determined by
6o.
X-ray diffraction tests is as follows (Brooker and Ireland 1965):
Quartz 15%
Chlorite and Kaolinite 35%
Illite 35%
Montmorillonite 15%
4.4 States of Stress in-situ
The importance of stress history on the strength and deforma-
tion of soils has long been recognised. Very little is known, however,
of the complete states of stress in the natural London Clay in-situ.
While it is often possible to determine the vertical effective
stresses at a site from a knowledge of the soil profile and ground
wat6r conditions there is no direct way of determining the horizontal
effective stress. It is only in recent years that attempts have
been made to estimate the in-situ horizontal stresses in London Clay
(Skempton 1961, Bishop, Webb and Lewin 1965).
Like many other heavily over-consolidated clay and clay-
shales, e.g. Little Belt Clay (Hvorslev 1960, Brinch Hansen 1961),
BearpaeClay shale (Peterson 1954, 1958, Terzaghi 1962) and Fort Union
Clay shale (Smith and Redlinger 1953), London Clay has undergone a
number of distinct phases of deformation and stress changes during
its geological history. An element of the Clay as deposited by a
large river in marine conditions is represented by point A in Fig.
4.4a. As more deposition followed the vertical pressure on the
61.
element gradually increased and the Clay consolidated to point B
-4en the maximum over-burden pressure was reached. At the same time
horizontal pressures were also developing in the Clay, the magnitude
of which depended on its shear and deformation properties, as shown
by the curve ab in Fig. 4.4b.
After consolidation the Clay was left for a considerable
period of time with little or no change of load. During this period
of sustained loading many physical and chemical changes are thought
to have taken place in the Clay. The process described by Bjerrum
(1965) as diagenesis, enabled the Clay particles'physically to con-
form' to each other and develop a certain amount of adhesion and
cementation, called the 'diagenetic bond'.
In a later geological period the pressure on the Clay was
reduced as a consequence of the removal of over-burden by erosion,
and the Clay tended to swell. The amount by which it was able to
expand during the process depended on the recoverable part of the
strain energy that was absorbed during consolidation (Bishop et al,
1965). According to the hypothesis of Bjerrum (op. cit.) this re-
coverable strain energy depended on,
(i) the elastic deformation of the flexible flake-shaped clay
particles. (Provided the particles were not strained beyond their
elastic limit the stored energy would be released on unloading).
(ii) the extent of the diagenetic bond. (Bjerrum describes
three types of bond - weak, medium and strong - in descending order
62.
of recoverability).
Following the above hypothesis, it is believed that London
Clay, after deposition had developed sufficient digenetic bonds so
that on unloading it rebounded along the curve BD and not along BC
which would have been the case had only a weak bond developed. The
Clay near the surface, however, may subsequently have expanded more
owing to the release of the locked-in energy caused by breakdown of
the bond due to weathering.
Now, during rebound the clay had freedom to expand in the
vertical direction, but was restrained in the horizontal direction.
As a result the effective vertical stress decreased relatively more
than the effective horizontal stress (curve bd) . The latter was
always greater than that corresponding to the same vertical stress
during deposition. With increasing over-consolidation the ratio
Ko of the effective horizontal stress to the effective vertical
stress gradually increased and beyond some point (X) the horizontal
stress exceeded the vertical (K0 ) 1). Had only a weak bond developed
the horizontal stress would be even higher because the Clay would
then try to expand more, yet being restrained in the horizontal
direction.
At the present time (1968) no method is available of
measuring the in-situ stresses in London Clay. It has already been
mentioned that where there are no artificial complications due to
tunnelling etc., the effective vertical stresses can be calculated
63.
reasonably accurately from a knowledge of the soil profile, ground
water conditions and unit weight of the materials. Skempton (1961)
and Bishop et al (1965) have estimated the in-situ horizontal stresses
of London Clay and Bradwell and Ashford Common from measurements of
initial suction in undisturbed samples (see Chapter 8). These two
sites, situated, as they are, at the two ends of the London Basin,
have been subjected to estimated vertical pre-consolidation pressures
of 220 and 600 lbs./in2 respectively.
The stresses that may have developed during deposition of
London Clay can be determined from laboratory Ko tests on remoulded
samples. Jaky's expression Ko = 1 Sin 0', though originally
obtained from tests on granular material is found to give satisfactory
results on Clay (Bishop 1958, Simons 1958), though the expression
Ko = 0.95 - Sin 0' has been found to be closer to cohesive soils
(Brooker and Ireland 1965).
The only Ko tests on remoulded London Clay loaded to as
high a pressure as 2,000 lbs./in2 (well above the maximum pre-
consolidation pressure) have been reported by Brooker and Ireland
(1965) who obtained a constant value of Ko = 0.64 for the entire
stress range (the expression Ko = 0.95 - Sin 0' (0' = 17.50) gives
the value of 0.65). Their results are replotted in Fig. 4.5 and
assuming that the same stress changes occurred when London Clay was
deposited, the complete stress histories of the Clay at Bradwell and
Ashford Common have been reconstructed. (Fig. 4.5).
64.
During deposition the stresses increased along the curves
oa and od, a and d being the maximum pressures to which the
Clay had been subjected, at the two sites. On subsequent removal
of the over-burden pressures by erosion the stresses followed the
curves abc and def, the sections be and of indicating the
estimated in-situ stresses today at various depths of the two sites.
The stresses c and f represent points nearer the surface while
b and e are for the deepest points for which data are available.
The decrease of Ko with depth reflecting the influence of over-
consolidation ratio can be easily established from the curves cb
and fe . (A detailed discussion of this will be presented in
Chapter 10).
It is appreciated that the general picture presented herein
is only an approximation and even somewhat idealised because it is
probable that some minor cycles of loading and unloading have not
been taken into account. Yet it is believed that until a more
accurate method of measuring the insitu stresses evolve, the above
gives a reasonably correct assessment of the stress history of
London Clay, (Skempton 1961).
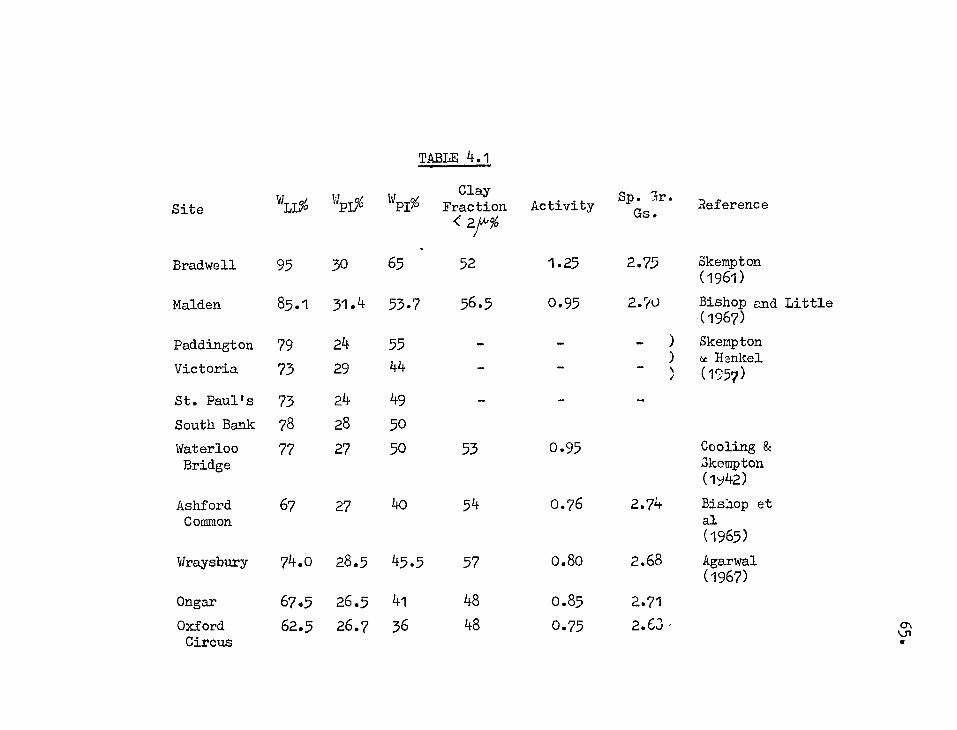
Site Liao
TABLE 4.1
Activity Sp. Ir. Gs. Reference WPI%
Clay Fraction
< 21116
Bradwell 95 30 65 52 1.25 2.75 Skempton (1961)
Malden 85.1 31.4 53.7 56.5 0.95 2.70 Bishop and Little (1967)
Paddington 79 24 55 Skempton
Victoria 73 29 44 ) ac Hankel (1957)
St. Paul's 73 24 49
South Bank 78 28 50
Waterloo 77 27 50 53 0.95 Cooling & Bridge 3kompton
(1942)
Ashford Common
67 27 40 54 0.76 2.74 Bisliop et al (1965)
Wraysbury 74.0 28.5 45.5 57 0.80 2.68 Agarwal (1967)
Ongar 67.5 26.5 41 48 0.85 2.71
Oxford 62.5 26.7 36 48 0.75 2.63 Circus
66.
CHAPTER 5
STRESS-PATH
The Concept of Stress-Path
A basic proposition examined in this thesis is that the
deformation of an element of soil is a function not only of magnitudes
of the applied stresses but also of the manner of their application.
In other words, a knowledge of the magnitudes of stress increase is
not, in itself, sufficient to indicate precisely how a soil element
is going to deform. To obtain a more complete picture we have to
consider also how the applied stresses change, at what rate and in
what relation to one another.
A stress-path is essentially a line drawn through points on
a plot of stress changes. It shows the relationship between the
components of stresses at various stages in moving from one stress
point to another. In the present thesis, however, consideration is
given only to cases where by virtue of symmetry the intermediate and
minor principal stresses are equal and where the vertical and hori-
zontal stresses are the principal stresses, e.g. in the laboratory
triaxial test or along the centre line beneath a loaded circular area.
There are, of course, many ways of plotting stress-paths, the one most
widely used in the study of shear strength of soils being a plot of
shear stress vs. normal stress. But in studying the deformation of
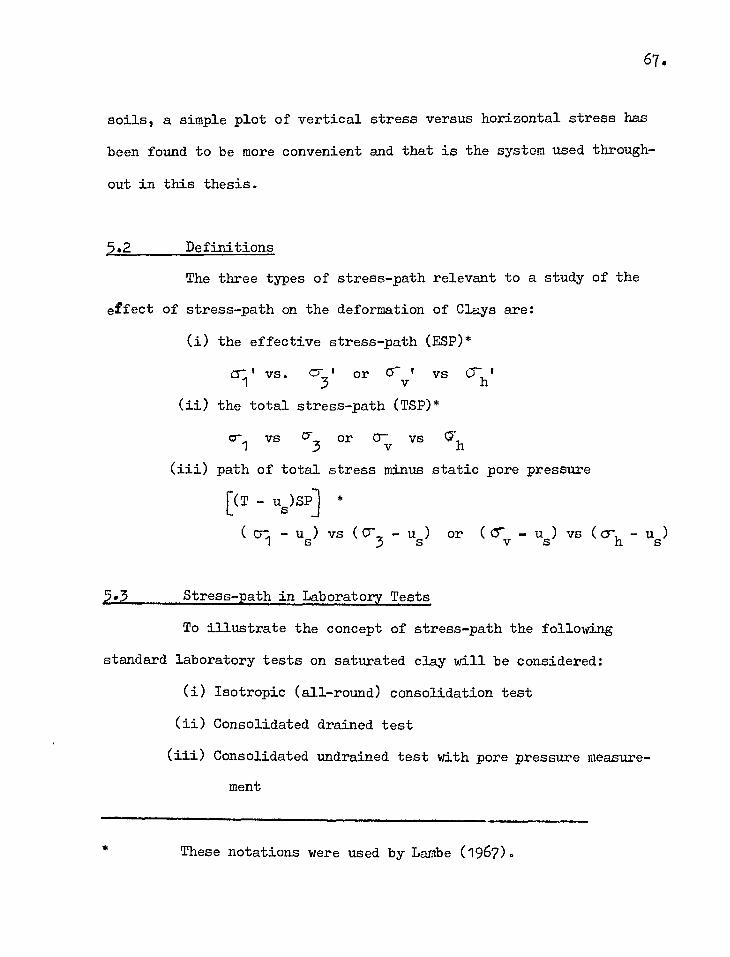
67.
soils, a simple plot of vertical stress versus horizontal stress has
been found to be more convenient and that is the system used through-
out in this thesis.
Definitions
The three types of stress-path relevant to a study of the
effect of stress-path on the deformation of Clays are:
(i) the effective stress-path (ESP)*
0-1 vs. (7 I or v/ vs (T
1 3 (ii) the total stress-path (SSP)*
or1 vs 0
3 or 0- vs h
(iii) path of total stress minus static pore pressure
[(T - us)SP] *
( 0- - us) vs (Cr3 - us) or (Cr us) vs (6'h - us) 1 v
5.3 Stress-path in Laboratory Tests
To illustrate the concept of stress-path the following
standard laboratory tests on saturated clay will be considered:
(i) Isotropic (all-round) consolidation test
(ii) Consolidated drained test
(iii) Consolidated undrained test with pore pressure measure-
ment
These notations were used by Lambe (1967).
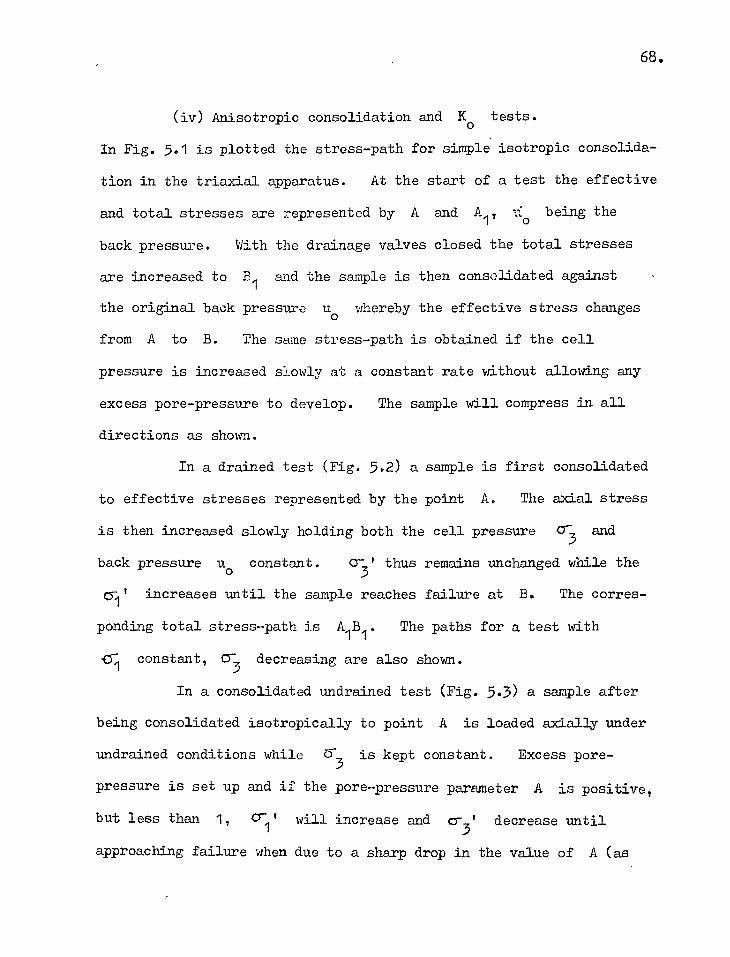
68.
(iv) Anisotropic consolidation and Ko tests.
In Fig. 5.1 is plotted the stress-path for simple isotropic consolida-
tion in the triaxial apparatus. At the start of a test the effective
and total stresses are represented by A and A1, ,1`o being the
back pressure. With the drainage valves closed the total stresses
are increased to B1 and the sample is then consolidated against
the original back pressure uo whereby the effective stress changes
from A to B. The same stress-path is obtained if the cell
pressure is increased slowly at a constant rate without allowing any
excess pore-pressure to develop. The sample will compress in all
directions as shown.
In a drained test (Fig. 5.2) a sample is first consolidated
to effective stresses represented by the point A. The axial stress
is then increased slowly holding both the cell pressure cr and 3 back pressure uo constant. cr-
3' thus remains unchanged while the
0- 1 increases until the sample reaches failure at B. The corres-1
ponding total stress-path is A1B1. The paths for a test with
cri constant, cr3 decreasing are also shown.
In a consolidated undrained test (Fig. 5.3) a sample after
being consolidated isotropically to point A is loaded axially under
undrained conditions while (53 is kept constant. Excess pore-
pressure is set up and if the pore-pressure parameter A is positive,
but less than 1, ' will increase and cr3' decrease until Cr
1
approaching failure when due to a sharp drop in the value of A (as
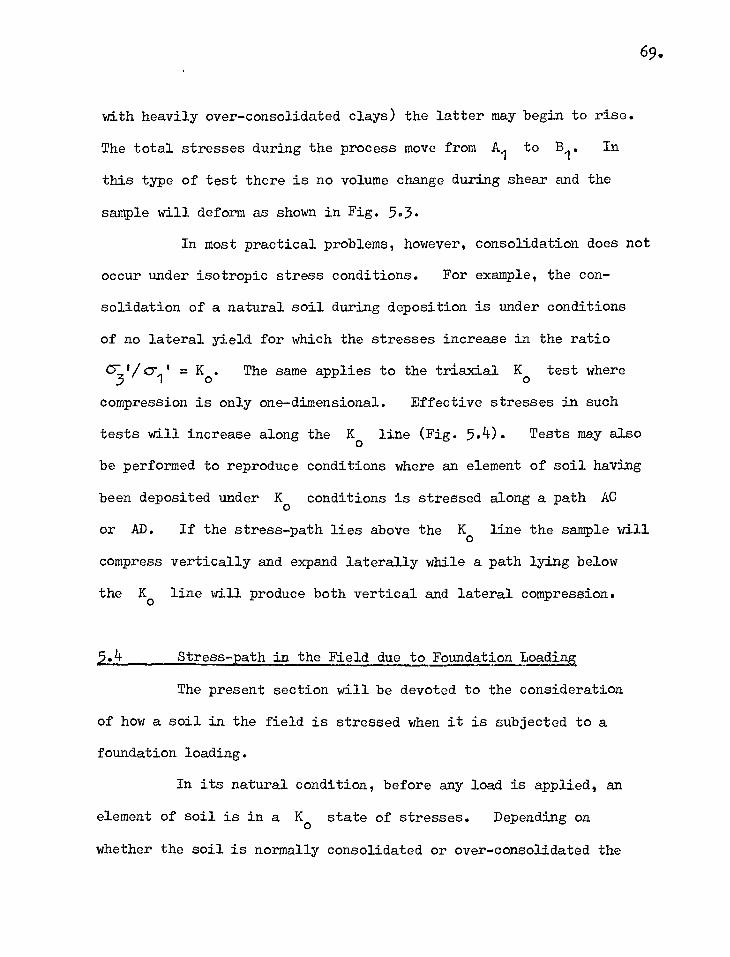
69.
with heavily over-consolidated clays) the latter may begin to rise.
The total stresses during the process move from Al to B1. In
this type of test there is no volume change during shear and the
sample will deform as shown in Fig. 5.3.
In most practical problems, however, consolidation does not
occur under isotropic stress conditions. For example, the con-
solidation of a natural soil during deposition is under conditions
of no lateral yield for which the stresses increase in the ratio
C71/(7 = Ko. The same applies to the triaxial Ko test where 3
compression is only one-dimensional. Effective stresses in such
tests will increase along the Ko
line (Fig. 5.4). Tests may also
be performed to reproduce conditions where an element of soil having
been deposited under Ko
conditions is stressed along a path AC
or AD. If the stress-path lies above the Ko line the sample will
compress vertically and expand laterally while a path lying below
the Ko line will produce both vertical and lateral compression.
5.4 Stress-path in the Field due to Foundation Loading
The present section will be devoted to the consideration
of how a soil in the field is stressed when it is subjected to a
foundation loading.
In its natural condition, before any load is applied, an
element of soil is in a Ko state of stresses. Depending on
whether the soil is normally consolidated or over-consolidated the
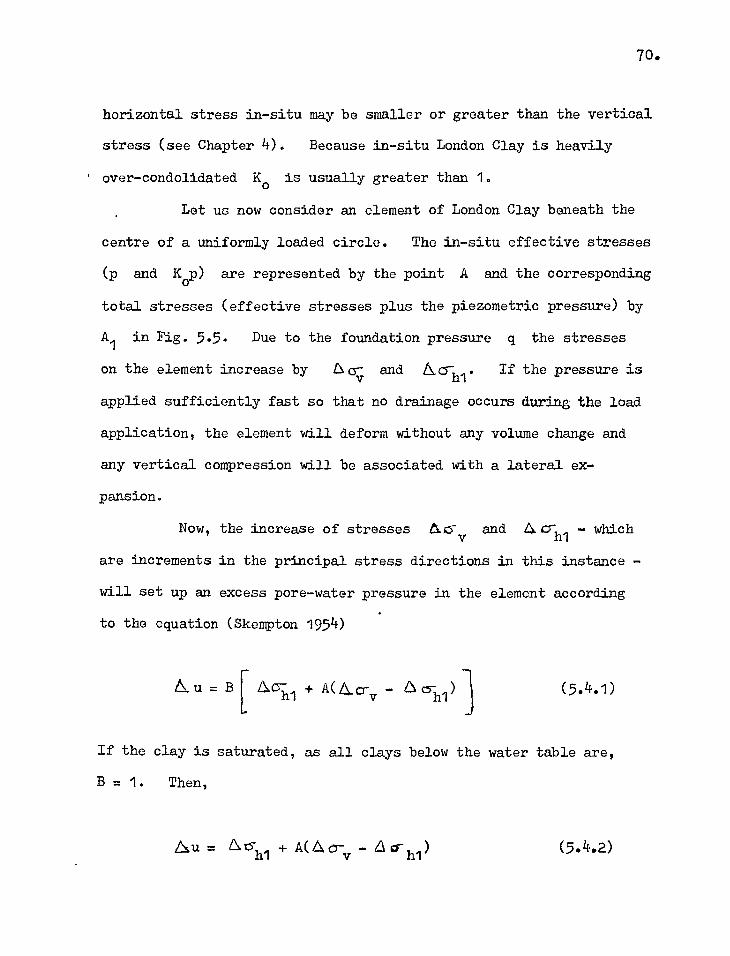
70.
horizontal stress in-situ may be smaller or greater than the vertical
stress (see Chapter 4). Because in-situ London Clay is heavily
over-condolidated Ko is usually greater than 1.
Let us now consider an element of London Clay beneath the
centre of a uniformly loaded circle. The in-situ effective stresses
(p and Kop) are represented by the point A and the corresponding
total stresses (effective stresses plus the piezometric pressure) by
Al
in Fig. 5.5. Due to the foundation pressure q the stresses
on the element increase by Aar and A.6h1
. If the pressure is
applied sufficiently fast so that no drainage occurs during the load
application, the element will deform without any volume change and
any vertical compression will be associated with a lateral ex-
pansion.
Now, the increase of stresses Ckciv and 4011 - which
are increments in the principal stress directions in this instance
will set up an excess pore-water pressure in the element according
to the equation (Skempton 1954)
Li u = B Q.c5- + A( &cry ) hi hi (5.4.1)
If the clay is saturated, as all clays below the water table are,
B = 1. Then,
,Lu = LK)"hi + A(O.crv 6o- hl) (5.4.2)
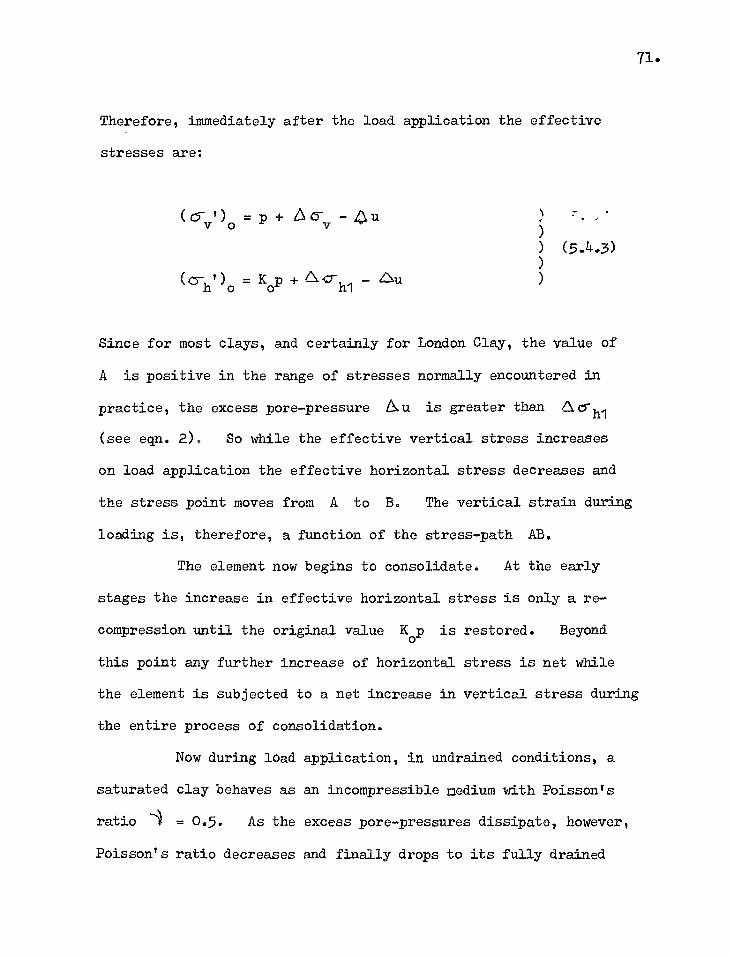
Therefore, immediately after the load application the effective
stresses are:
(v' )o = p + tsv - u
h1)o = K
op CS.(7-
111 - 4Nu
Since for most clays, and certainly for London Clay, the value of
A is positive in the range of stresses normally encountered in
practice, the excess pore-pressure Qu is greater than cr h1
(see eqn. 2). So while the effective vertical stress increases
on load application the effective horizontal stress decreases and
the stress point moves from A to B. The vertical strain during
loading is, therefore, a function of the stress-path AB.
The element now begins to consolidate. At the early
stages the increase in effective horizontal stress is only a re-
compression until the original value Kop is restored. Beyond
this point any further increase of horizontal stress is net while
the element is subjected to a net increase in vertical stress during
the entire process of consolidation.
Now during load application, in undrained conditions, a
saturated clay behaves as an incompressible medium with Poisson's
ratio 1 = 0.5. As the excess pore-pressures dissipate, however,
Poisson's ratio decreases and finally drops to its fully drained
71.
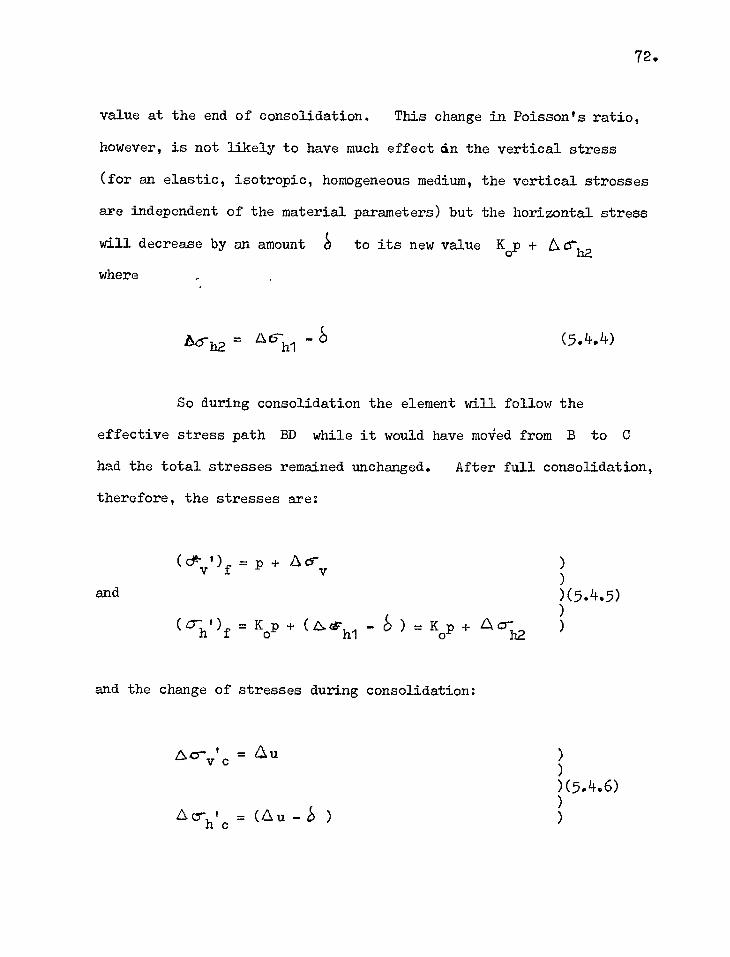
72.
value at the end of consolidation. This change in Poisson's ratio,
however, is not likely to have much effect an the vertical stress
(for an elastic, isotropic, homogeneous medium, the vertical stresses
are independent of the material parameters) but the horizontal stress
will decrease by an amount to its new value Kop + 6crh2
where
46-12 6.611 (5.4.4)
So during consolidation the element will follow the
effective stress path BD while it would have moved from B to C
had the total stresses remained unchanged. After full consolidation,
therefore, the stresses are:
and
( cg"Of = p + A crv
(6'h') f ') = K o h1 p + (dtgr - ) = K p A
h2
and the change of stresses during consolidation:
A-crv c 1 = au ) ) )(5.4.6) )
crh'c = (L1u - ) )
73.
5-5 Stages of an "ideal" Experimental Programme for Settle-
ment Analysis
An ideal settlement analysis should take into account the
complete pattern of stresses an element of soil will be subjected to
in the field. In order to determine the relevant vertical strains
laboratory tests should be performed under identical stress con-
ditions and an integration of all such vertical strains beneath a
loaded area would give the settlement of the structure.
Fig. 5.4 shows the stages of experimental programme that
should ideally be followed in the laboratory. When a sample is
removed from the ground without mechanical disturbance or change in
water content the total stresses are reduced to zero and a negative
pore-pressure is set up (Skempton and Sowa 1963). (A detailed study
of the state of stress after sampling is presented in Chapter 8.)
In the first stage, therefore, the in-situ stresses will be restored
so as to get back to the condition before sampling. Next a set of
stresses, identical to those the sample will be subjected to due to
the foundation load, will be applied under undrained conditions.
Both the vertical strain and the pore-water pressure will be measured.
The sample will then be consolidated against a back pressure equal to
the original pore-water pressure uo while at the same time the
horizontal stress will be decreased to its final value. The vertical
strain in this last stage together with that during undrained loading
will give the total strain of the element in the field. The
74.
settlement will then be obtained by integrating the vertical strains
thus obtained of all the elements beneath the loaded area.
5.6 Methods of Settlement Analysis
The ideal method of settlement analysis postulated in the
preceding section, although making use of the true pattern of stresses
and strains, has never been used in practice. First, the ex-
perimental programme is rather complicated and secondly, a number of
samples from various depths should be tested in order to obtain the
actual variation of strain with depth before any meaningful in-
tegration can be made. Lambe (1964, 1967) proposed the selection
of an "average" element at some depth below the loaded area on
which a limited number of triaxial stress-path tests could be per-
formed and the strain thus obtained assumed constant throughout the
depth of the clay stratum.
The methods most widely used in practice, however, are the
ones based on the oedometer test. Table 5.1 summarises all these
methods and in Fig. 5.5 are shown the effective stress-paths
associated with each of them. In plotting the stress-path AG in
Fig. 5.5 it has been assumed that an undisturbed sample when sub-
jected to the in-situ vertical stress also restores the in-situ
horizontal stress so that subsequent stress-path for loading starts
from the point A. How far this assumption is valid will be dis-
cussed in Chapter 10.
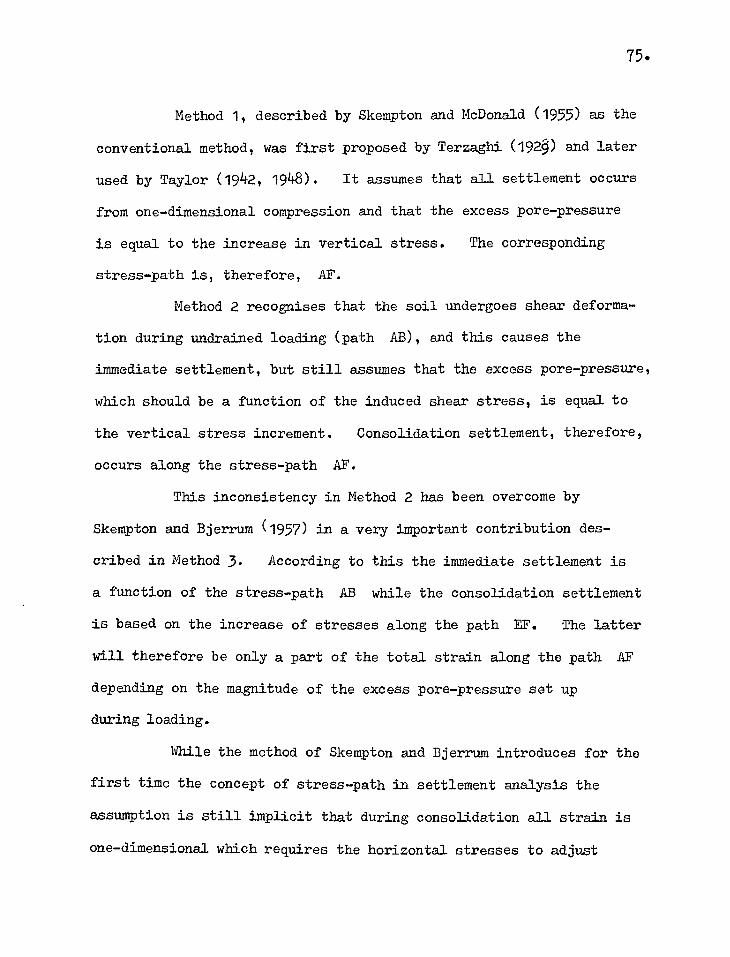
75.
Method 1, described by Skempton and McDonald (1955) as the
conventional method, was first proposed by Terzaghi (194) and later
used by Taylor (1942, 1948). It assumes that all settlement occurs
from one-dimensional compression and that the excess pore-pressure
is equal to the increase in vertical stress. The corresponding
stress-path is, therefore, AF.
Method 2 recognises that the soil undergoes shear deforma-
tion during undrained loading (path AB), and this causes the
immediate settlement, but still assumes that the excess pore-pressure,
which should be a function of the induced shear stress, is equal to
the vertical stress increment. Consolidation settlement, therefore,
occurs along the stress-path AF.
This inconsistency in Method 2 has been overcome by
Skempton and Bjerrum (1957) in a very important contribution des-
cribed in Method 3. According to this the immediate settlement is
a function of the stress-path AB while the consolidation settlement
is based on the increase of stresses along the path EF. The latter
will therefore be only a part of the total strain along the path AF
depending on the magnitude of the excess pore-pressure set up
during loading.
While the method of Skempton and Bjerrum introduces for the
first time the concept of stress-path in settlement analysis the
assumption is still implicit that during consolidation all strain is
one-dimensional which requires the horizontal stresses to adjust
accordingly. There is, therefore, a discrepancy between the field
stress-path BD and the path EF used in the analysis. The con-
dition of no lateral strain may be approximately true in cases like
that of a loaded area which is very large compared to the thickness
of the clay layer. But in the majority of field problems the above
condition may be far from true. Moreover, while computing the
immediately settlement method 3 obviously accepts that the clay
undergoes lateral deformation during loading (with constant volume,
there would be no settlement, otherwise) but this is neglected in
estimating the consolidation settlement. Consequently, of course,
the effect of the horizontal stress is completely ignored except in
determining the excess pore-water pressure.
The experimental work reported in this thesis has been
directed towards investigating the effect of different stress-paths
on the axial and volumetric strains of London Clay and the results
so obtained have been compared with those from a parallel series of
oedometer tests.
AF Pc
Cc =roed Terzaghi (194) Taylor (1948)
..„1 mvAcr2.dz
= roed From Skempton and
= 0-2.dz
Cc =14- Foed Skempton and Bjerrum (1957)
f----SmvAu.dz
f(Bu)
Bjerrum (1957)
TABLE 5.1. METHODS OF SETTLEMENT ANALYSIS
Immediate Settlement
Consolidation Settlement
Method Stress-Path (See Fig.5.7)
Amount
Excess Pore
'Stress-
Pressure c Path (See Fig.5.5)
Amount
Reference
2
3
4 (Field stress path)
AB
AB
AB
•••
P• = c1B°-ID
_ B 1*
f(AB)
Au = Arrir
6u .74 cs- v
A u is + A(Acr -AO")
v h
Au =
ga Cr cs
v h
AF
EF
BD
78.
CHAPTER 6
STRESS-DISTRIBUTION IN SOIL MEDIA
6.1 Introduction
An essential step in settlement analysis is the determina-
tion of the magnitude and distribution of stresses that are
developed in the soil due to the application of the structural load.
It is these stresses which cause not only the initial, elastic
settlement but also the consolidation settlement, which is a con-
sequence of the dissipation of the excess pore-water pressures.
The stresses and strains in a mass of soil depend on the
stress-deformation characteristics, anisotropy and non-homogeneity
of the medium, and also on the boundary conditions. But the task
of analysing stresses taking all these factors into consideration is
extremely complex and, therefore, the attempts that have been made
to date are based on certain simplifying assumptions. The most
widely used of these is the case of the homogeneous, isotropic
elastic medium,
It is well understood that the assumption of linearity of
the stress-strain relationship is a questionable simplification
because soils in their behaviour are essentially non-linear. But
no other theories have yet been developed to describe the response
of soils to stress changes, and within the comparatively small range
79.
of stresses that are normally imposed by structural loads, the
assumption of linearity, for most soils, may be considered to be
reasonably valid. Also, limited field evidence reported by
Plantema (1953) and Turnbull et al (1961) show that measured stresses
correspond fairly well with those predicted on an elastic basis.
Therefore, refinement of the methods of stress analysis based on
the theory of elasticity - still assuming the validity of the
linearity of stress-strain relationship, but taking into considera-
tion the variations of properties within the soil mass - seem to be
justified. In this chapter a detailed study is reported of the
stresses and displacements in non-homogeneous elastic soil media.
A short section on the effect of non-linearity of stress-strain
relationship on the distribution of stresses is also included.
6.2 Soil as a homogeneous, isotropic, elastic medium
The assumption that is most widely made of soils in
determining the stresses beneath a foundation is that of an elastic
medium (i.e. linear stress-strain relationship) with uniform pro-
i perties at all points and in all directions.athouGh/pr
n actice a real
soil can hardly be even approximated to such an ideal medium,
the mathematical solution to this problem was the only one available
to engineers for a very long time. Boussinesq (1885) (see Terzaghi
19'+3) was the first to obtain expressions for the components of
stresses and strains within a semi-infinite homogeneous elastic
80.
medium due to a point load acting on the surface and perpendicular
to it. Since the principle of superposition holds for such a
medium it has been possible to use these expressions to determine
the stresses and deflections caused by loads applied over finite
areas on the surface. Love (1923) gave equations for stresses and
deflections caused by a loaded circular rigid plate and Newmark
(1942), by integrating Boussinesq's equation for vertical stresses,
derived the expression for the stresses under the corner of a
uniformly loaded rectangular area. The tables and charts prepared
by Newmark and later by Fadum 948) are now almost universally used
to calculate the vertical stresses beneath a foundation. The case
of a uniformly loaded strip was solved by Carothers (1920) and
JArgenson (1934) and Bishop (1952) used stress functions and re-
laxation technique to calculate the stresses in and underneath a
triangular dam. The most complete pattern of stresses, strains and
deflections beneath a uniform circular load on a homogeneous half-
space can be obtained from tables prepared by Ah73an and Ulery (1962).
From all these results it can be seen that the vertical stresses in
a homogeneous, isotropic elastic body is a function only of the
dimensions of the loaded area and independent of the elastic pro-
perties of the soil. This is not true, however, of the lateral
stresses and displacements.
81.
6.3 Non-homogeneity in soils
It has been mentioned above that engineering properties of
a soil are not normally uniform throughout its mass. This non-
uniformity may manifest itself in both spatial (non-homogeneous)
and directional (anisotropic) variations of the modulus of deforma-
tion. Consideration will be restricted in this chapter to isotropic
non-homogeneity i.e. to cases where elastic parameters of the soil
are not uniform with depth.
The variation of soil properties with depth may be due to
many factors. Often the subsoil consists of different geological
formations with very different characteristics e.g. a clay deposit
underlain by sand or rock. If the underlying stratum is well below
the surface of the clay relative to the size of the loaded area, its
influence may only be marginal. On the other hand, even in a deep
layer of apparently homogeneous material, the rigidity of the soil
generally increases with depth due to the increase in effective over-
burden pressure.
In dealing with the first type of non-homogeneity mentioned
above, a subsoil is often considered as a layered system. Much work
has been done on this subject in recent years, particularly in con-
nection with the design of pavements and runways and in the follow-
ing section of this chapter a review is presented of the available
results.
In the case of continuous variation of elastic parameters
82.
with depth Gibson's analysis (Gibson 1967, 1968) has been used to
compute stresses and deflections beneath circular and strip footings.
6.4 Two-layer systems
A simple two-layer system (Fig. 6.1) may consist of either
1) two elastic layers with different engineering properties
or 2) a single elastic layer on a rigid base.
6.4.1 Two layers with different elastic parameters
This situation is often encountered in the case of pavements
where a stiffer surfacing is placed on a less stiff subgrade. In the
case of foundations, however, the situation is often reversed and one
may encounter a layer of soft material overlying a stronger deposit.
Biot (1935) and Picketts (1938) were among the first to
attempt to solve the problem of stress distribution in the two-
layer rigid base system, fig. 6.1b. Their results could only be
used, however, to determine the stresses at the surface of the base
layer. In a series of papers in 1943 and 1945 Burmister (Burmister
1943, 1945a, b, c) presented the general theory of stresses and
displacements in layered soils from which exact solutions could be
obtained for axi-symmetric loading. Using Burmister's analysis
Fox (1948) published tabulated values of stresses due to a uniform
circular loading with or without friction at the interface for the
case of Poisson's ratio "Z) = -. The case of the line or strip
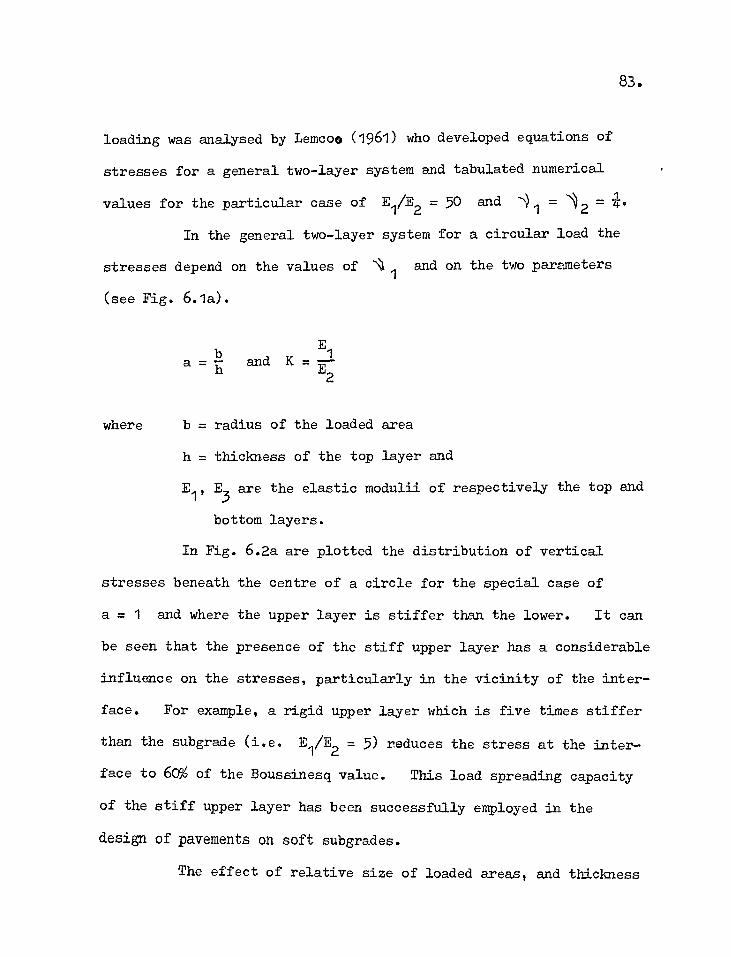
83.
loading was analysed by Lemcoe (1961) who developed equations of
stresses for a general two-layer system and tabulated numerical
values for the particular case of E1/E2 = 50 and "")1 = v = 4.
In the general two-layer system for a circular load the
stresses depend on the values of11 1 and on the two parameters
(see Fig. 6.1a).
a = ri and K = E1
2
where b = radius of the loaded area
h = thickness of the top layer and
E E3
are the elastic modulii of respectively the top and
bottom layers.
In Fig. 6.2a are plotted the distribution of vertical
stresses beneath the centre of a circle for the special case of
a = 1 and where the upper layer is stiffer than the lower. It can
be seen that the presence of the stiff upper layer has a considerable
influence on the stresses, particularly in the vicinity of the inter-
face. For example, a rigid upper layer which is five times stiffer
than the subgrade (i.e. E1/E2 = 5) reduces the stress at the inter-
face to 60% of the Boussinesq value. This load spreading capacity
of the stiff upper layer has been successfully employed in the
design of pavements on soft subgrades.
The effect of relative size of loaded areas, and thickness
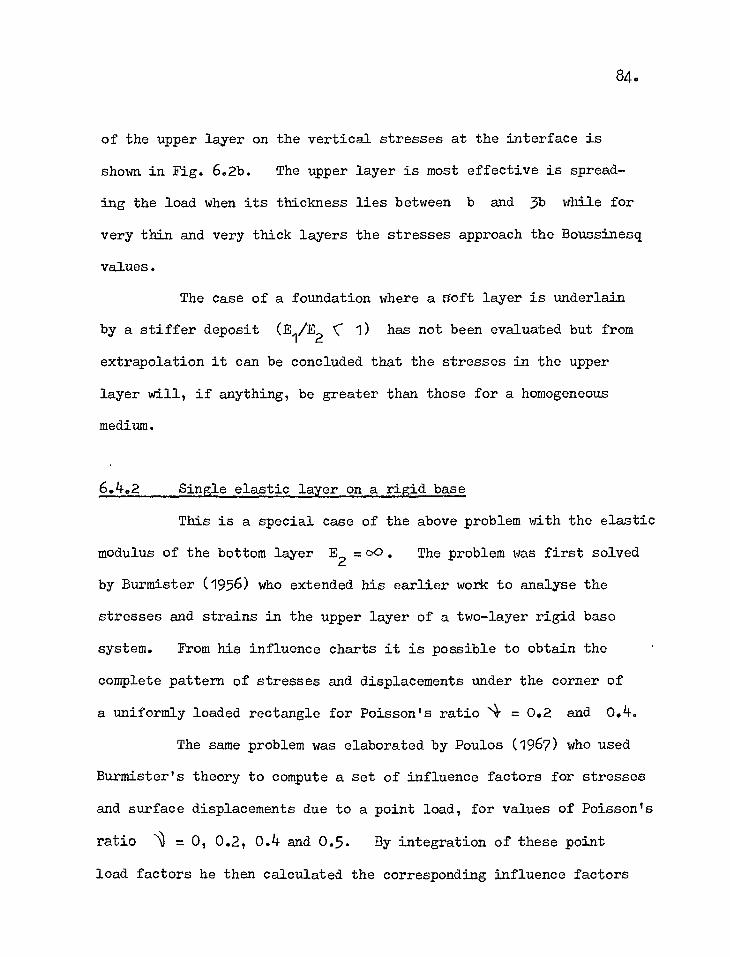
84.
of the upper layer on the vertical stresses at the interface is
shown in Fig. 6.2b. The upper layer is most effective is spread-
ing the load when its thickness lies between b and 3b while for
very thin and very thick layers the stresses approach the Boussinesq
values.
The case of a foundation where a Ooft layer is underlain
by a stiffer deposit (E1/E2 s 1) has not been evaluated but from
extrapolation it can be concluded that the stresses in the upper
layer will, if anything, be greater than those for a homogeneous
medium.
6.4.2 Single elastic layer on a rigid base
This is a special case of the above problem with the elastic
modulus of the bottom layer E2
=c).9. The problem was first solved
by Burmister (1956) who extended his earlier work to analyse the
stresses and strains in the upper layer of a two-layer rigid base
system. From his influence charts it is possible to obtain the
complete pattern of stresses and displacements under the corner of
a uniformly loaded rectangle for Poisson's ratio s"4- = 0.2 and 0.4.
The same problem was elaborated by Poulos (1967) who used
Burmister's theory to compute a set of influence factors for stresses
and surface displacements due to a point load, for values of Poisson's
ratio = 0, 0.2, 0.4 and 0.5. By integration of these point
load factors he then calculated the corresponding influence factors
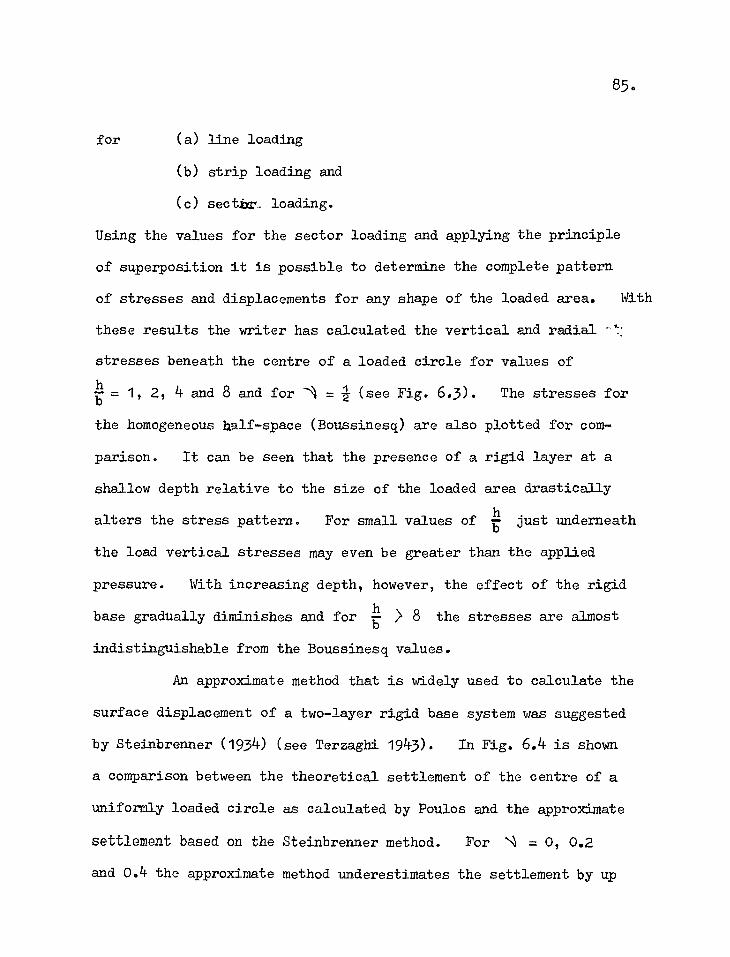
85.
for (a) line loading
(b) strip loading and
(c) sectirr. loading.
Using the values for the sector loading and applying the principle
of superposition it is possible to determine the complete pattern
of stresses and displacements for any shape of the loaded area. With
these results the writer has calculated the vertical and radial
stresses beneath the centre of a loaded circle for values of
= 1, 2, 4 and 8 and for = -2- (see Fig. 6.3). The stresses for
the homogeneous half-space (Boussinesq) are also plotted for com-
parison. It can be seen that the presence of a rigid layer at a
shallow depth relative to the size of the loaded area drastically
alters the stress pattern. For small values of Ili just underneath
the load vertical stresses may even be greater than the applied
pressure. With increasing depth, however, the effect of the rigid
base gradually diminishes and for To- > 8 the stresses are almost
indistinguishable from the Boussinesq values.
An approximate method that is widely used to calculate the
surface displacement of a two-layer rigid base system was suggested
by Steinbrenner (1934) (see Terzaghi 1943). In Fig. 6.4 is shown
a comparison between the theoretical settlement of the centre of a
uniformly loaded circle as calculated by Poulos and the approximate
settlement based on the Steinbrenner method. For 11 = 0, 0.2
and 0.4 the approximate method underestimates the settlement by up
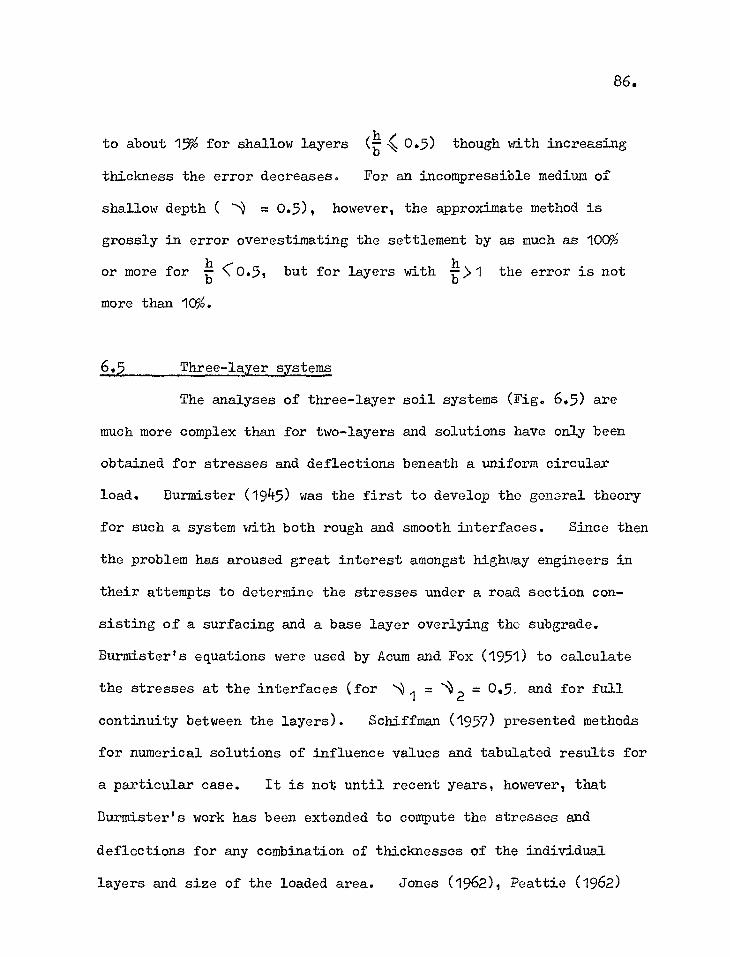
86.
/ to about 15% for shallow layers (—
h \ 0.5) though with increasing b
thickness the error decreases. For an incompressible medium of
shallow depth ( = 0.5), however, the approximate method is
grossly in error overestimating the settlement by as much as 100%
or more for h —< 0.5, but for layers with —,>1 the error is not
more than 10%.
6.5 Three-layer systems
The analyses of three-layer soil systems (Fig. 6.5) are
much more complex than for two-layers and solutions have only been
obtained for stresses and deflections beneath a uniform circular
load. Burmister (1945) was the first to develop the general theory
for such a system with both rough and smooth interfaces. Since then
the problem has aroused great interest amongst highway engineers in
their attempts to determine the stresses under a road section con-
sisting of a surfacing and a base layer overlying the subgrade.
Burmister's equations were used by Acum and Fox (1951) to calculate
the stresses at the interfaces (for "., 1 = = 0.5, and for full
continuity between the layers). Schiffman (1957) presented methods
for numerical solutions of influence values and tabulated results for
a particular case. It is not until recent years, however, that
Burmister's work has been extended to compute the stresses and
deflections for any combination of thicknesses of the individual
layers and size of the loaded area. Jones (1962), Peattie (1962)
87.
and Kirk (1966) have published charts and tables giving the stress
factors for any combination of three-layer systems while De Barros
(1966) and Uneshita and Meyerhof (1967) have published those for
deflection factors.
The stresses and strains in a three-layer medium (Fig. 6.5)
are governed by the following non-dimensional parameters:
h 2
H = k1 =
E
E b a = and k = — 2 h2
h2 E2
E3
where b is radius of the loaded circle
h1 and h
2 are thicknesses respectively of the first and
second layers. (The bottom layer is semi-infinite).
E1, E2, E3
are the Elastic modulii of the 1st, 2nd and
the 3rd layers respectively.
Fig. 6.6 shows the effect of the relative thicknesses of the two
stiffer upper layers on the stresses and deflections beneath the
centre of a loaded circular area, for the particular case of
h1 h2 = 2b. For the purpose of comparison the Boussinesq stresses
and the deflections calculated on the basis of Boussinesq stress
distribution are also plotted. It can be seen that the actual,
values are lower than those given by Boussinesq although the maximum
discrepancy in deflection is no more than 25%.
For the situation where the layers become successively
stiffer with depth (k1 = .2, k2 = .2) (Fig. 6.7), the assumption
88.
of homogeneity will underestimate the stresses by up to 30% for h1
h1
h2
while for smaller relative thicknesses of the top
layer the error is considerably less.
6.6 Multi-layer systems
The problems of multi-layer systems involve immense
complexity and to date no analytical solution is available for any-
thing consisting of more than three layers. Vesic (1963) has
suggested an approximate method of calculating the surface settle-
ment of a foundation on a multi-layered medium assuming Boussinesq
stress distribution but using the proper elastic modulus for the
respective layers. His charts and method of calculation are shown
in Fig. 6.8. Vesic observed that in three-layered systems the
shape of the deflected surface computed by this approximate technique
agrees better with measured deflections of pavements than the more
rigorous analyses.
De Barros (1966) proposed an approximate method of
reducing a multi-layer system to a three-layer one, keeping the
subgrade unaltered, by successively attributing to the two adjacent
layers an "equivalent modulus" according to the equation
h 2)35 3 E2 3 - ,
1 + h2- 2 El' 2
_ h1 + h2
He found that using this technique and reducing a three-layer system
89.
to an equivalent two-layer one the approximate method is correct to
within 10% for 21>-1 and 15% for -1110, 2.
An analogous expression was first proposed by Palmer and
Barber (1940) to reduce a two-layer system to an equivalent homo-
geneous medium which yielded deflections very close to Durmister's
two-layer analysis.
6.7 Non-homogeneous medium
The problem of the non-homogeneous soil medium whose
modulus of elasticity varies as a continuous function of depth has
received only limited attention so far. Korenev (1957), Sherman
(1959), Golecki (1959), Cuban (1959), Lekhnitskii (1962) have
studied particular problems of non-homogeneity, but no comprehensive
theory had been presented until Gibson developed the theory (Gibson
1967, 1968) of stresses and displacements in a non-homogeneous,
isotropic elastic half-space subjected to strip or axially symmetric
loading normal to its plane boundary.
6.7.1 Formulation of theory
Let us consider the problem of plane strain as shown in
Fig. 6.9. The modulus of elasticity (E) of the medium varies as
some function of depth, E = E(z), but the assumption is made that
the other elastic parameter, the Poisson's ratio remains
constant.
Cr- - xx YY zz )
cr ( cr fix) zz
) (6.2a) ) ) ) ) (6.2b) ) ) ) ) (6.2c) )
= xx E(z)
( = = YY E(z)
zz =
E(z) zz - ( + ) xx yy
( 1 - V ) crxx - z z
1 t )zz= zz xx 2G(z)
xx 2G(z)
The equilibrium equations at any point, in the absence
of any change in body forces, are given by
90.
#2) 6—xx -b cr. xz
x -se z
b(7- zz .c-xz z x
-- 0
_ o
The relationships between stresses and strains are:
From (6.2c):
6- = ( 4- ) YY xx zz (6.2d)
Substituting (6.2d) in (6.2a) and (6.2b),
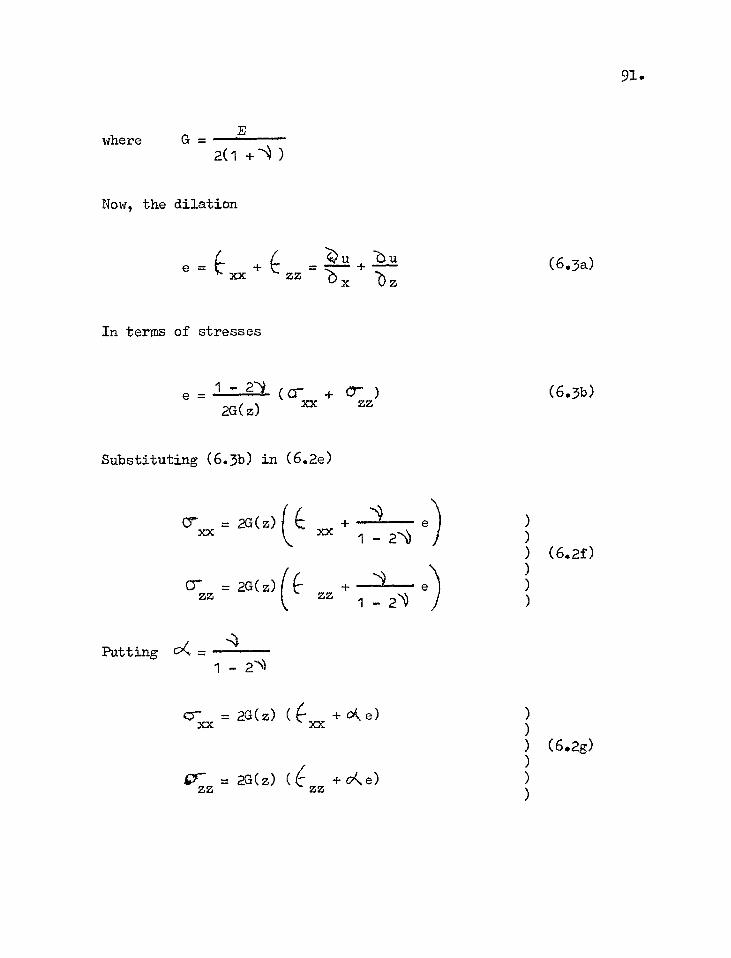
where G -
93..
2(1 + )
Now, the dilation
e = = Z) U " U XX 22 x z (6.3a)
In terms of stresses
e - 1 - 2"1 (Qr C"J"'C"J"') xx zz 2G(z)
(6.3b)
Substituting (6.3b) in (6.2e)
Crxx = 2G(z)( xx 1 e) )
- ) ) (6.2f)
cr zz = 2G( z) ) (6" zz 1 -
)
)
Putting 04 _ 1- 2
Cr xx = 2G(z) ((+ coLe) ) xx ) ) (6.2g) )
0-z = 2G(z) (6 zz +04,e) ) z )
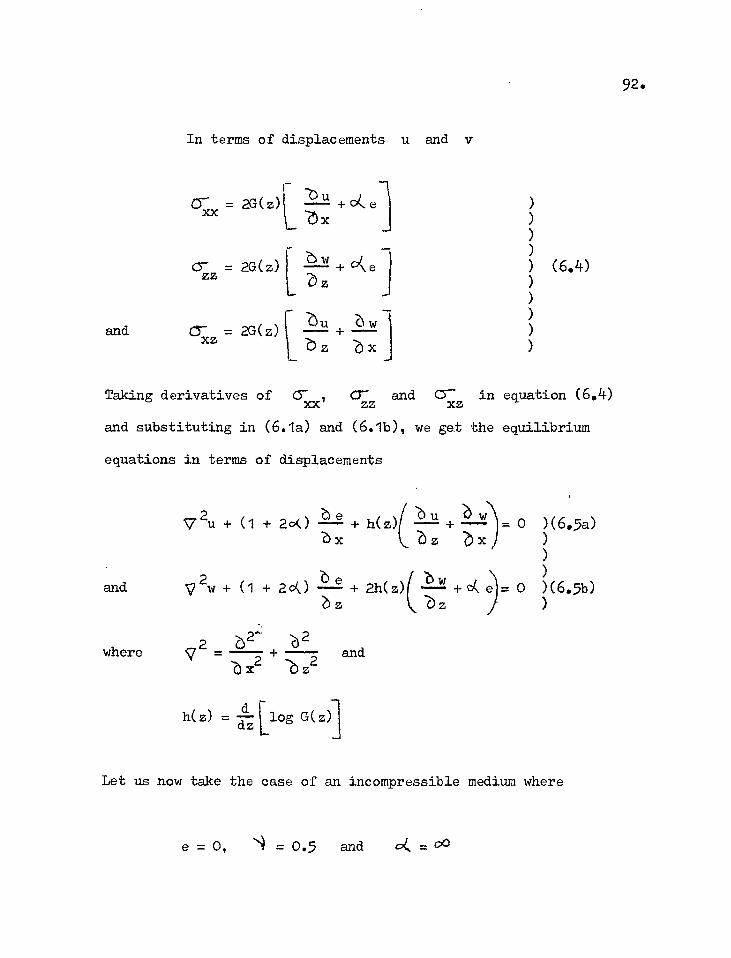
F coc = 2G(Z)L
[ crz = 2G(z) z
and cr z = 2G(z) x
au
w
w z a x
, e . V w + 200 2h(z) w (—
z and ÷ (4\ e = 0
I
V2u (1 + 20) h(z)(ax z
+ aw = o x
e
In terms of displacements u and v
92.
Taking derivatives of CY;x, cr-z and Y in equation (6.4) zz
and substituting in (6.1a) and (6.1b), we get the equilibrium
equations in terms of displacements
where ,c72 62- b2 = and .2 e) z2
h(z) = d [log G(z)-.1 dz
Let us now take the case of an incompressible medium where
e = o, 14 = 0.5 and 04. = 00
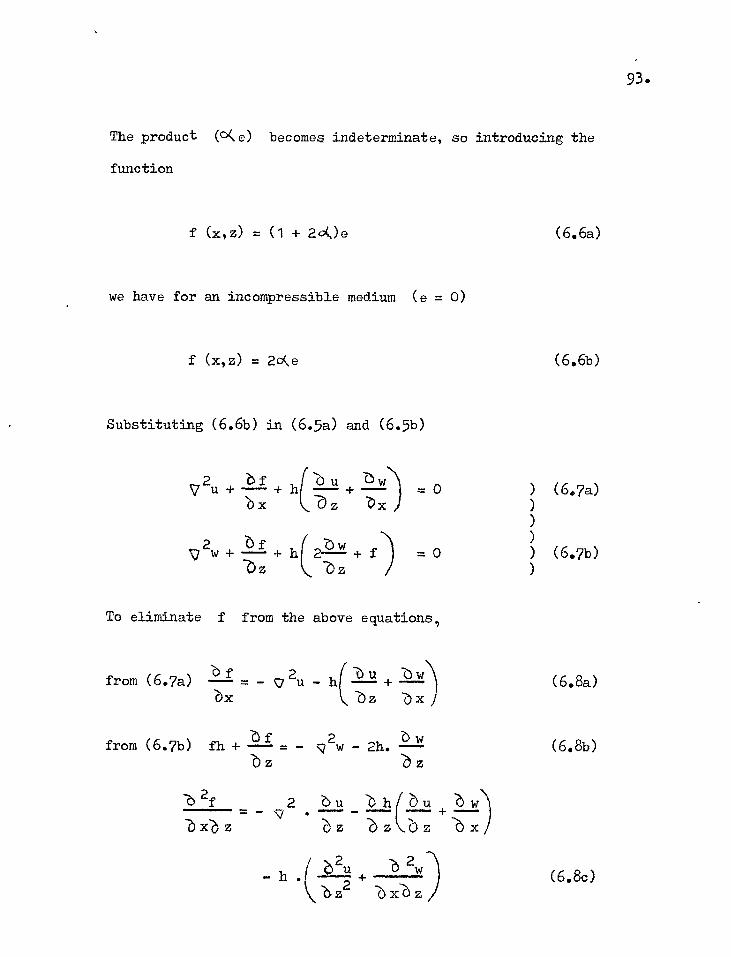
2 u+ -f +h ?)w) ax 7Cz ax
=0
+ bf + h(232.11 + f 's) = 0 az Oz
2w
v 2u - h(:11-1+ aw bz
from (6.7b) fh + f w = 2w 2h.
z z
from (6.7a) b f bx
(6.8a)
(6.8b)
The product (0(e) becomes indeterminate, so introducing the
function
f (x,z) = (1 + 20)e (6.6a)
we have for an incompressible medium (e = 0)
f (x,z) = 2cke (6.6b)
Substituting (6.6b) in (6.5a) and (6.5b)
93.
To eliminate f from the above equations,
-e5 2f 2 = ;7,7 -2) x-2) z
Ou tifou ZiwN • —+_ "oz\.oz .bx/
h X22
4. -6 2w) (6.8c)
2>z axuz
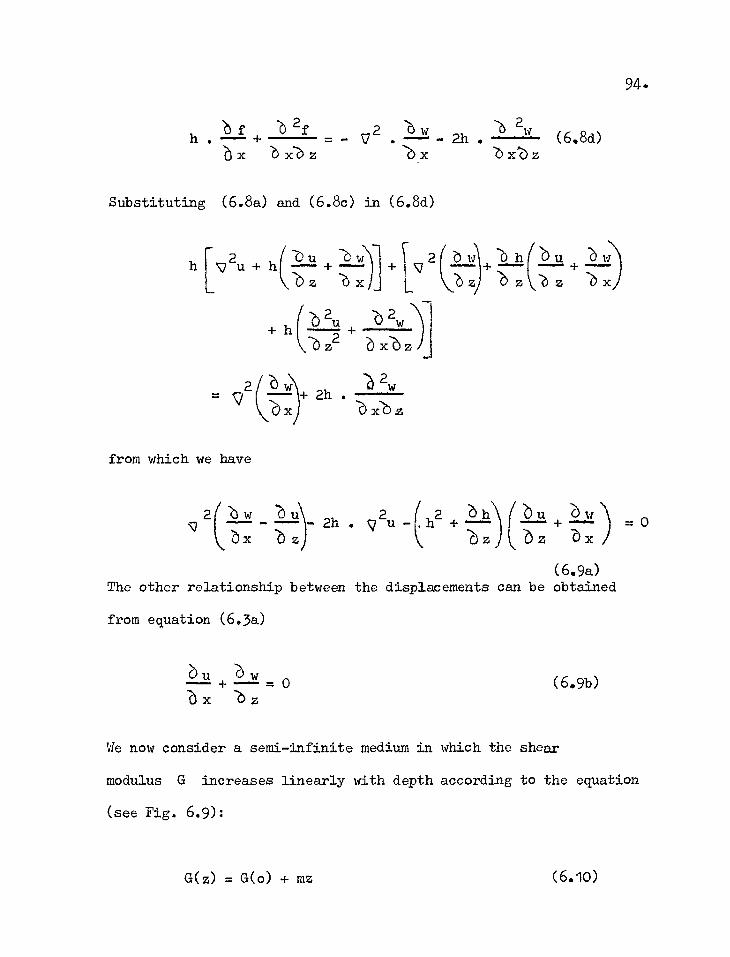
f 2f 2 '6 w h . + - - . 2h . tit (6.8d)
ax .bx-bz "ex -t) x"6 z
Substituting (6.8a) and (6.8c) in (6.8d)
h 2u+h(1211 + 26Y)+ - p2 z x L
bu + bir;) z x
h (b21, a2w
z2 a xaz
2(b - 2w + 2h .
xi x.b.z
from which we have
94.
(6.9a) The other relationship between the displacements can be obtained
from equation (6.3a)
.)14 +—.o d x z
(6.9b)
We now consider a semi-infinite medium in which the shear
modulus G increases linearly with depth according to the equation
(see Fig. 6.9):
G(z) = G(o) + mz (6.10)
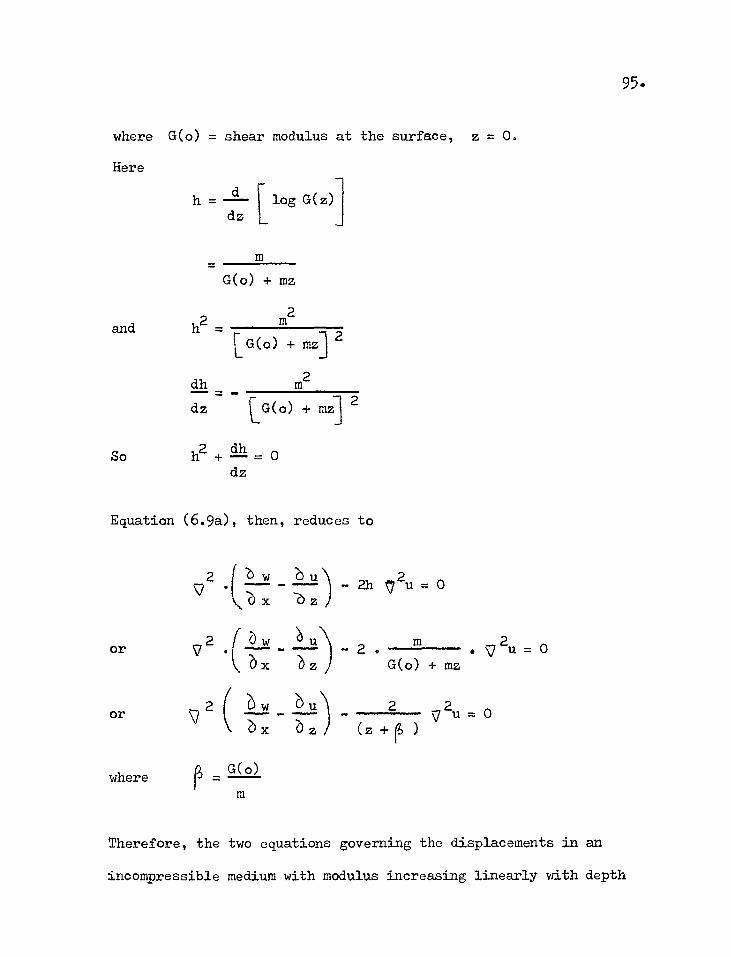
where G(o) = shear modulus at the surface, z = 0.
Here
h = [ log G(z) dz
m
G(o) + mz
and h2 - m2
[G(o) + mz] 2
dh m2 = dz LG(o) + mz] 2
2 dh So h + = 0 dz
Equation (6.9a), then, reduces to
or
or
where
2
!wx 2h ,72u = 0
2 .Id ,uz) 2 . 2u = 0
0 x G(o) + mz
(2 ow _ Ou) _ 2 2u = o ax az (z+i;
A . G(o) m
Therefore, the two equations governing the displacements in an
incompressible medium with modulus increasing linearly with depth
95.
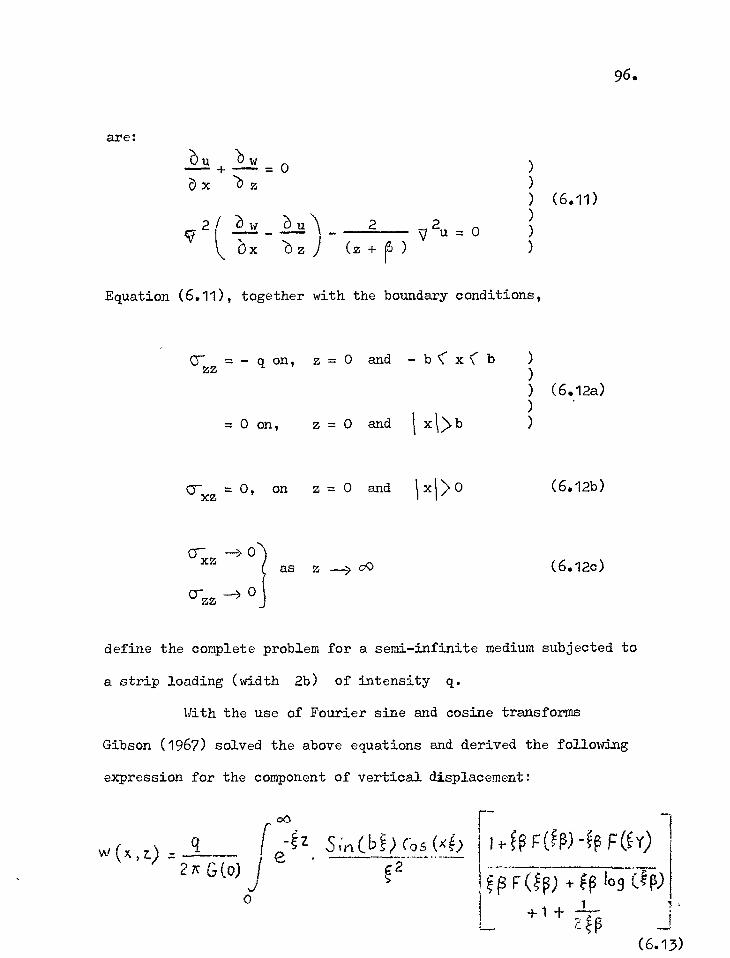
are: u w + 0 ) x z )
) (6.11) 21 w 2) v 2u = 0 )
ox az (z+ ) )
Equation (6.11), together with the boundary conditions,
C7 =- q on, z = 0 and - b b ) zz )
) (6.12a) )
= 0 on, z = 0 and xt>b )
Cr =0, on z = 0 and \xl>0 (6.12b) xz
96.
as z —) 00 (6.12c)
define the complete problem for a semi-infinite medium subjected to
a strip loading (width 2b) of intensity q.
With the use of Fourier sine and cosine transforms
Gibson (1967) solved the above equations and derived the following
expression for the component of vertical displacement:
00
W (x , q e4z il,(bi) CO (PCb
2,c G(o)
q2 J
0
1i-4 FM 4p p(cy)
F(4) ff3 109 (4) +1+
z9 — (6.13)
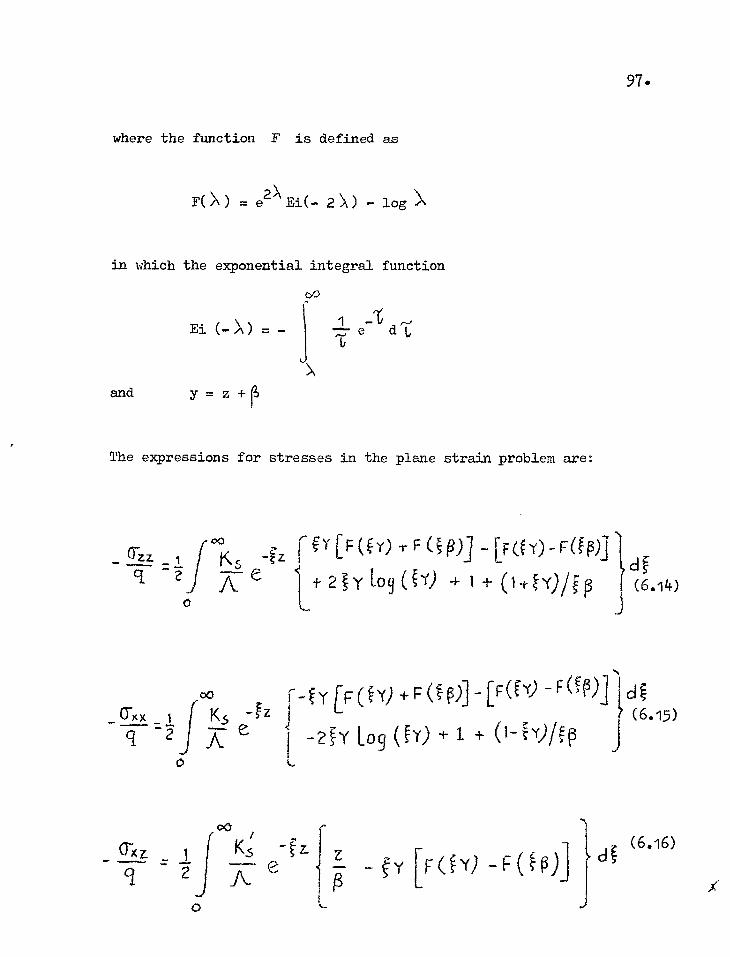
97.
where the function F is defined as
F( = e2 Ei( 2 - log
in which the exponential integral function
oo
Ei =
Ja
1 -6 e d
and = z -F13
The expressions for stresses in the plane strain problem are:
00 -Ez FfY [F( y) F (4)] -[F(0)-qfp).}
t+ 2Iy Lo9 ( 'f) + + Ci-iJY)/fp cif (6.143
00 -tz
r-fY +F ()] -EF(Y) -Ffq dc
(6.15) 1, 2 Lo9 (he) + 1 + (1-1yrn p
0*-Kz. K.; A
-C1 z e 1 fY [F(cY) -FM)]
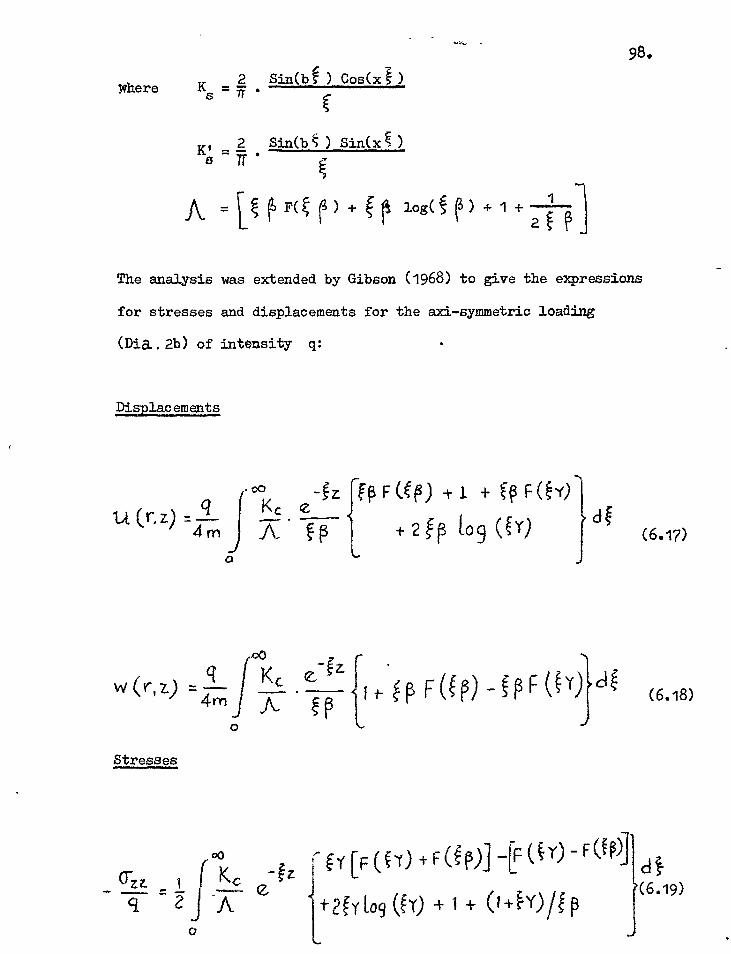
0
98. Where K 2 Sinth ) cos(xl)
s = —
K' = 2 Sin(b ) Sin(x ) — s Tr
= F( () + f log(§ () + 1 + I 1 2 f
The analysis was extended by Gibson (1968) to give the expressions
for stresses and displacements for the axi-symmetric loading
(Dia..2b) of intensity q:
Displacements
1). (r, z) -f z f(3 F (pi) +1 + fp F.(ty)'
+ 2 ff3 [09 0.10 (6.17)
w 7-) F(fp) I (fyicif (6.18)
0
fY [F (C-r) + F(49] —EF (cY) - FU(3)] 8 1
(6.19)
Stresses
i- 2fy1.09 (fy) + 1 + (7 -1-FY)/f p
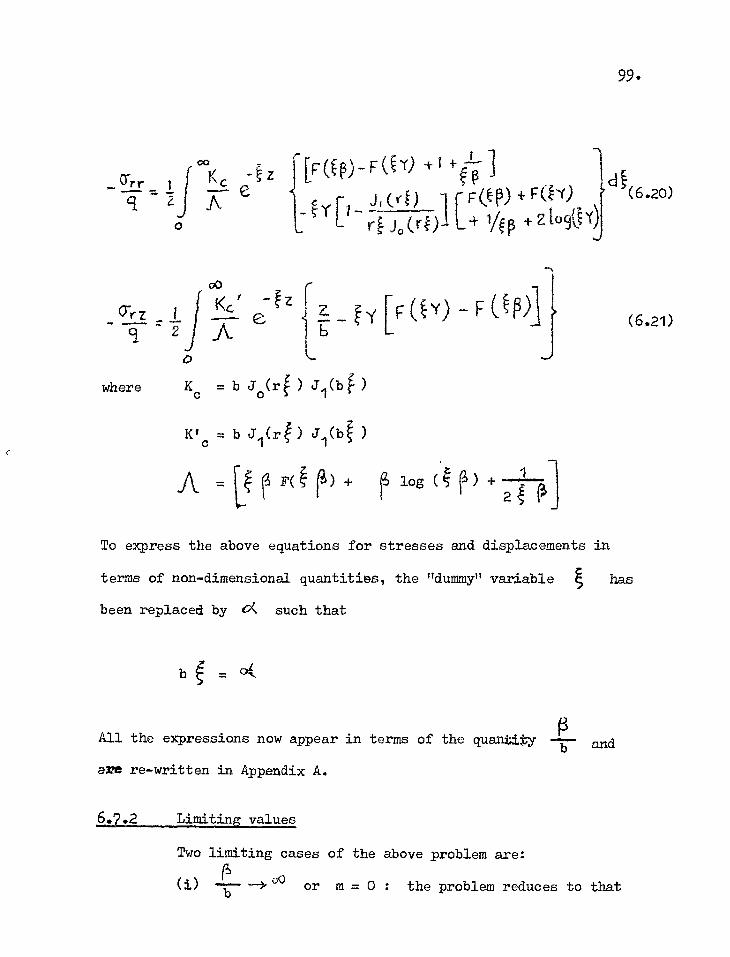
99.
Crrr li[F( i3)-F(i) 1 +4] 4.1 Ji(rt) 1 iF(q3)+F(t-y)
.J1 L r0-1 L-4- yip +zi_09(3y
(6.2o)
where Kc
z ta_ y[F(&Y)-0011
LT; = b Jo(rf ) Ji(bt )
oo Kc ' cr rz A
(6.21)
= b J1(rf ) J1(14 )
log (q (3) + 2 t
To express the above equations for stresses and displacements in
terms of non-dimensional quantities, the "dummy" variable
been replaced by Q such that
b =(34,
All the expressions now appear in terms of the quantity — b
are re-written in Appendix A.
6.7.2 Limiting values
Two limiting cases of the above problem are:
o0 -- ---> or m = 0 : the problem reduces to that
=
has
and
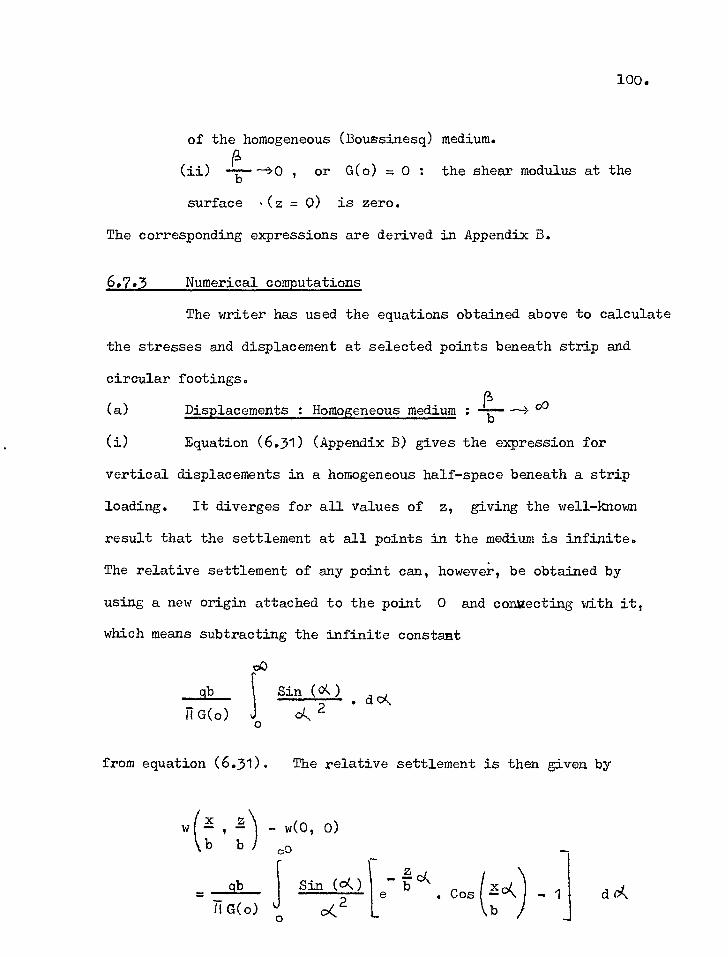
100.
of the homogeneous (Boussinesq) medium.
(ii) , or G(o) = 0 : the shear modulus at the
surface ,(z = 0) is zero.
The corresponding expressions are derived in Appendix B.
6.7.3 Numerical computations
The writer has used the equations obtained above to calculate
the stresses and displacement at selected points beneath strip and
circular footings.
(a) 00 Displacements : Homogeneous medium :
(i) Equation (6.31) (Appendix B) gives the expression for
vertical displacements in a homogeneous half-space beneath a strip
loading. It diverges for all values of z, giving the well-known
result that the settlement at all points in the medium is infinite.
The relative settlement of any point can, however, be obtained by
using a new origin attached to the point 0 and connecting with it,
which means subtracting the infinite constant
o0
--2h-- Sin (0C)
II G(0) o , 2
from equation (6.31). The relative settlement is then given by
w(2c- 1 21) - w(0, 0) b b 0.0
= __at__ Ti
. cos (zok G(0)
Sin co() o(2
b do(
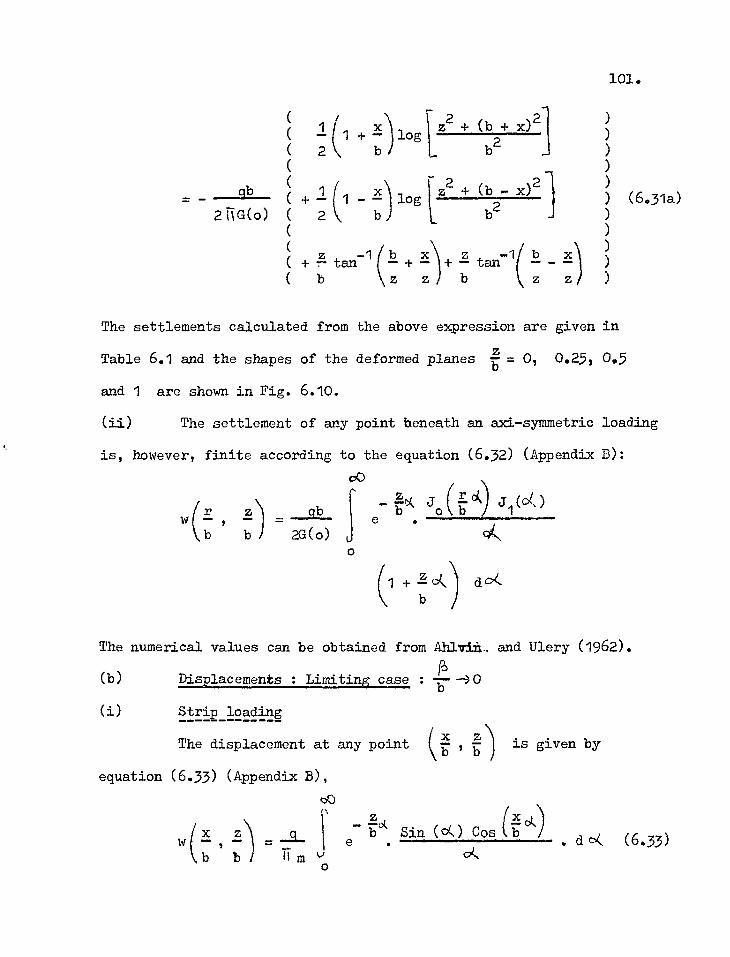
101.
At
( ( ( ( ( ( ( ( (
x log z2 (b x)2 1 +
) )
) ) )
- x) ) z ) ,
(6.31a) =)
2 b b2
_ z2 4- (b2- x)2
4. 1 i _ a log
211.G(0) 2 b b -
+ 4 tan-1 (1) + -x)+ -z tan-1( -b b z z b z
The settlements calculated from the above expression are given in
Table 6.1 and the shapes of the deformed planes - = 0, 0.25, 0.5
and 1 are shown in Fig. 6.10.
(ii) The settlement of any point beneath an axi-symmetric loading
is, however, finite according to the equation (6.32) (Appendix B):
qb w(- b b 2G(o)
- b o 1 s J ( b c9 J (01 ) e .
c"--\ 0
(.1 + zoc) dcd,
The numerical values can be obtained from Ahlvin_ and Ulery (1962).
(b) Displacements : Limiting case : b --)o
(i) S-triE loading
x z 17 ) The displacement at any point '13 is given by
equation (6.33) (Appendix B),
w 2) = -l- b b m
- -13'4 . Sin ((DC) Cos tli °L) e ok . d 0( (6.33)
0
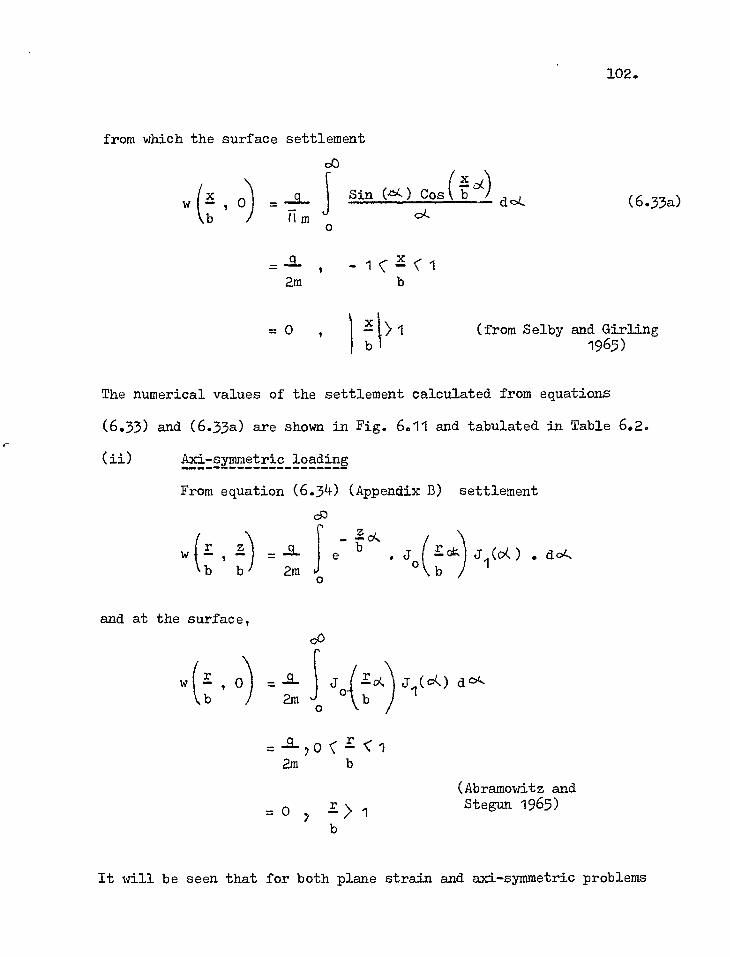
cZ
w (— .Jo rJ (cA ) . doz.,
b
r
0
—S. b 2m
04, b e
from which the surface settlement
00
102.
0) = —g- Sin (-b.() Cos(Sb 04.
(6.33a)
-a- , - 1 C C 1 2m
b
= 0 , 1-1>1 b
(from Selby and Girling 1965)
The numerical values of the settlement calculated from equations
(6.33) and (6.33a) are shown in Fig. 6.11 and tabulated in Table 6.2.
(ii) Axi -symmetric loading
From equation (6.34) (Appendix B) settlement
and at the surface,
w 0) = 2m 0 ,(
.1:0( (0C) do``0 1 b
= 0 c -11 1 2m
= 0 r> 1 b
(Abramowitz and Stegun 1965)
It will be seen that for both plane strain and axi-symmetric problems
103.
in the special case when G or E of the medium increase linearly
with depth according to the equation
G(z) = mz
the settlement of the surface is given by
w(x , 0 = , within the loaded area ) 2m
) = 0 , outside the loaded area )
Since the principle of superposition holds this result will also
apply to a uniformly loaded area of any shape.
The above relationship that settlement at the surface is
directly proportional to the load intensity and independent of the
dimensions of the loaded area is also identical with the behaviour
of the Winkler spring model (Winkler 1867, Gibson 1967). The concept
of the coefficient of subgrade reaction (Terzaghi 1955) defined as
k = w 0
and used in many foundation problems has thus a theoretical basis.
It is applicable, however, only to a medium which is incompressible
= 1) and whose modulus of elasticity E increases linearly 2
104.
with depth from zero at the surface according to the equation
E(z) = 3mz
The coefficient will, then, have a value equal to 2m.
(c) Displacements : 0<
The vertical displacements of any point in a non-homogeneous
medium subjected to strip or axi-symmetric loading are given by
equations (6.22) and (6.26) (Appendix A). The settlement of the
surface can be obtained by putting i73- = 0 :
= Sin (04.) Cos( Stri w 21 d °I\
( 1 ) ( p: 211G(0) 0 04, 2 A
ok) Circle: w (7- , = qb fr4) ji
b 4G(0)
(1) d c A
L.( v- ... log —a. +1 + b \ b 04, \ b 2 1-7-
where A
The settlements calculated from the above equations are tabulated
in Tables 6.3 and 6.4 for — = 0.1, 0.5, 1.0, 5.0, 10.0. The
shapes of the deformed surface are shown in Fig. 6.12 and 6.13.
(d) Stresses : 0
It has already been mentioned that in the limits -s- 0
and 0.0 all the stresses for both strip and circular loadings have
identical values (see Appendix B). The stresses for intermediate
105.
values of — (0 K C-- ) can be obtained from equations (6.23)
-(6.25), (6.28) - (6.30) (Appendix A).
Tables 6.5 - 6.8 give the components of vertical and
lateral stresses calculated from equations (6.23), (6.24), (6.28)
and (6.29) beneath the centre and edge of strip and axi-symmetric
loadings for the values of .14- = 0.1, 0.5, 1.0, 5.0 and 10.0. The
results are plotted in Figs. (6.14) - (6.18) and the variation of
stresses with the parameter b shown in Figs. (6.19) and (6.20).
Some notes on the method of calculation can be found in Appendix C.
6.764 Discussion of results
From the numerical values of stresses and displacements
presented in the previous section a number of important results
emerge.
(1) As mentioned already, a semi-infinite incompressible medium
whose modulus of elasticity increases linearly with depth from zero
at the surface (i.e. () = 0) behaves as a Winkler spring model. In
other words, the surface settlement of a uniformly loaded area on
such a medium is directly proportional to the applied pressure and
independent of the dimensions of the load.
(2) The distribution of stresses in a semi-infinite medium
is not significantly affected by the type of non-homogeneity considered
the analysis. Indeed, the two limiting cases, = 0 and
7 = oo provide exactly the same stresses, while in the intermediate
106.
range 0 C --b- C-00 , both the vertical and horizontal stresses tend
to be a little higher* than the corresponding stresses for the homo-
geneous medium, though the difference is never greater than 10%.
Over most of the range, however, (0 < <7 0.5 and 5; )
the discrepancy is less than 5%. This observation is true of
vertical and horizontal stresses due to both axi-symmetricand strip
loadings.
Extensive field measurements of stresses reported by
Plantema (1953), Turnbull et al (1961) and the Waterways Experimental
Station (1953, 1954) have shown very close agreement with the pre-
dictions based on Boussinesq analysis even though the soil media
varied from non-homogeneous deposits (Plantema) to fairly homogeneous
test sections of clayey silt and sand (Turnbull et al). This is
certainly in agreement with the theoretical results presented here.
(3) If the foregoing conclusions are correct, the settlement
of a foundation on a non-homogeneous medium may be calculated
reasonably accurately by assuming that the stress distribution could
be obtained by Boussinesq analysis. Fig. 6.21 shows a comparison
between the actual settlements of the centre of a uniformly loaded
circle obtained from rigorous computation and the approximate settle-
ments calculated from Boussinesq stress distribution. The latter
* Except the horizontal stresses beneath strip loadings for high values of
107.
underestimates the settlement for all values of though the
maximum error (in the range 0.5 C IT. < 1.5) is no more than 10%.
(4) In order to obtain some indication of the effective depth
that contributes towards most of the settlement beneath a loaded
circle, Fig. 6.22 has been constructed by successively integrating
the vertical strains for various depths, using Boussinesq stress
distribution. It is observed that 80% of the total settlement is
contributed by a depth of only 1.5b for = 0.1 and 5b for
= dJ
b
6.8 Non-linear soil medium
The problem of stress - analysis in a soil medium with a
non-linear stress - strain relationship is immensely complex and
no analytical solution is yet available. Only a few attempts have
been made to use numerical methods to calculate the stresses and
displacements in such media.
Phukan (1968) while investigating the non-linear deformation
of rocks used the finite element method to analyse the stresses and
displacements beneath a strip loading for two particular types of
non-linearity. His results are shown in Figs. 6.23 and 6.24.
while a depth of 8b accounts for as much as 90% for
0 all values of -T. This is consistent with the stress-distribution
in a two-layer rigid base system (see section 6.4.2) where, it has
been shown, the presence of a rigid layer at a depth of 8b does
not significantly affect the stresses.
108.
Phukan found that the two different models produce almost identical
vertical stresses which agree remarkably well with the homogeneous
elastic (Boussinesq) solution while there is a difference of about
10% in the corresponding horizontal stresses and 5% in the shear
stresses. The settlements, however, are no longer proportional
to the applied pressure (Fig. 6.24).
Huang (1968) presented a method of analysing stresses and
displacements beneath a circular load in a non-linear soil medium
whose modulus of elasticity is a function of the stresses:
E = Eo [ + C (Crz (Zrr 0-0 + C )S . LE)]
where (the non-linear coefficient) and C (the body force
coefficient) are material parameters. He divided the semi-infinite
medium into a multi-layer system assuming a rigid base at a depth
of 100b (see Fig. 6.25) and assigned to each layer a modulus
corresponding to the stresses at the mid-point. Employing Burmister's
boundary and continuity conditions (Burmister 1943, 1945) and using
thegiethod of successive approximations Huang calculated the stresses
and displacements until two consecutive iterations gave the same
modulus. His results are shown in Figs. 6.25 and 6.26. Again a
close agreement with the Boussinesq stress distribution is noted.
A comparison between the actual settlements calculated rigorously
by Huang and the approximate settlements calculated by the witet
109.
on the basis of Boussinesq stress distribution but using the proper
variation of E with depth (Fig. 6.26) shows that the two methods
do not differ by more than 10%.
The assumption made by Huang, however, that each layer has
uniform modulus means that the problem is, in effect, reduced to a
multi-layer Burmister Problem with the elastic modulii determined
by the stresses in the centre of the individual layers as shown in
Fig. 6.26.
6.9 Summary
From a study of the distribution of stresses in soil media
presented in this chapter the following general conclusions can be
drawn:
(1) The presence of a rigid layer at a depth which is relatively
shallow compared to the dimensions of the loaded area drastically
alters the stress - pattern, particularly the lateral stresses.
With increasing depth, however, the effect decreases and if the
rigid layer is at a depth greater than 4 x diameter (for a circular
footing) the soil will behave as a semi-infinite medium in respect
to stress distribution.
*(2) From the practical point of view the most important result
to emerge is that, for a non-homogeneous, incompressible medium whose
modulus of elasticity increases linearly with depth, the stresses due
to a boundary load do not differ significantly from those given by the
110.
classical Boussinesq analysis. The same conclusion has been reached
by Phukan and Huang for cettain types of non-linearity of stress -
strain relationships described in the preceding section.
It appears, therefore, that any deviation from the classical
problem of homogeneous elasticity, either in terms of non-linearity
of stress - strain relationship or in terms of non-homogeneity of the
medium will only have a marginal effect on the stress distribution so
long as the medium is subjected to certain boundary stresses.
The displacements will, of course, be significantly affected but
from the foregoing conclusion it can be deduced that the settlements
can be approximately obtained numerically by-assuming the Boussinesq
stress - distribution and taking account of the proper stress -
strain relationship and/or non-homogeneity in calculating the
strains. Calculations carried out by the writer, presented pre-
viously, confirm this deduction.
Finally, the above study is by no means complete. A
number of important factors have not been considered which may yet
have a significant effect on the distribution of stresses in soil
media e.g. anisotropy, Poisson's ratio other than 0.5( i.e. com-
pressible medium) and the rigidity of the foundation. Analysis of
a problem taking any or all of these into account is complex but
could, perhaps, be performed numerically.
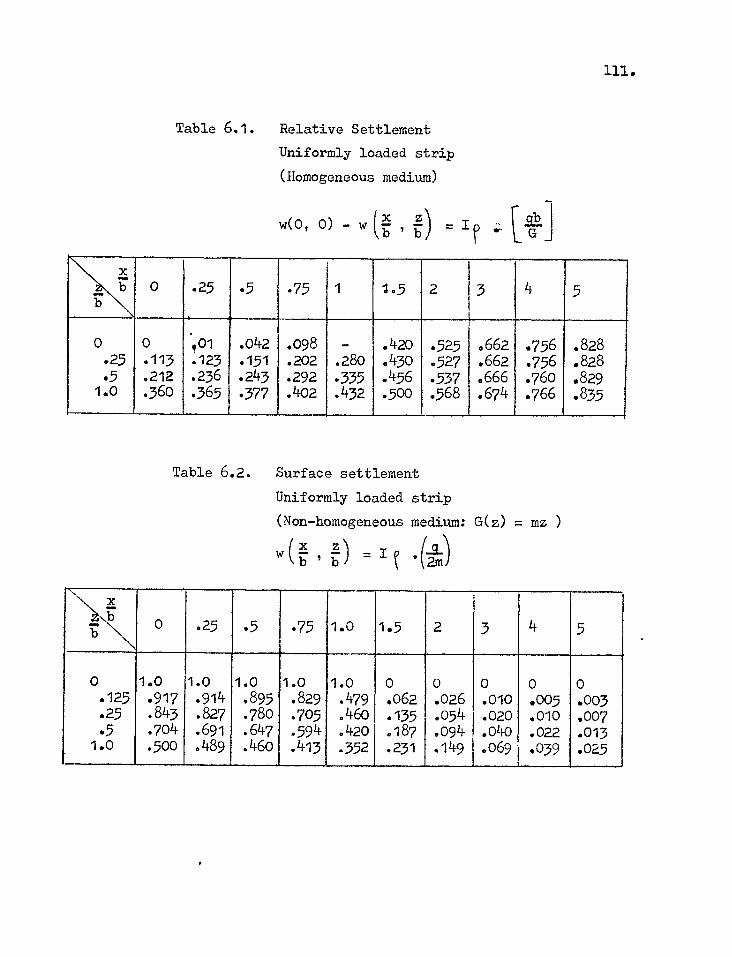
Table 6.1. Relative Settlement Uniformly loaded strip (Homogeneous medium)
w(0, 0) -w U-DC , 17) I cp
)1i 0 .25 .5 .75 1 1.5 2 3 4 5 ii
. ,
0 0 401 .042 .098 - .420 .525 .662 .756 .828 .25 .113 .123 .151 .202 .280 .430 .527 .662 .756 .828 .5 .212 .236 .243 .292 .335 .456 .537 .666 .760 4829 1.0 .360 .365 .377 .402 .432 .500 .568 .674 .766 .835
Table 6.2. Surface settlement Uniformly loaded (Non-homogeneous x z w b , 13) = I
strip
medium: G(z) = mz )
(a.) ° 2m
N x
TO. 0 .25 .5 .75 1.0 1.5 2 3 4 5
0 1.0 1.0 1.0 1.0 1.0 0 0 0 0 0 .125 .917 .914 .895 .829 .479 .062 .026 .010 .005 .003 .25 .843 .827 .780 .705 .460 .135 .054 .020 .010 .007 .5 .704 .691 .647 .594 .420 .187 .094 .040 .022 .013 1.0 .500 .489 .460 .413 .352 .231 .149 .069 .039 .025
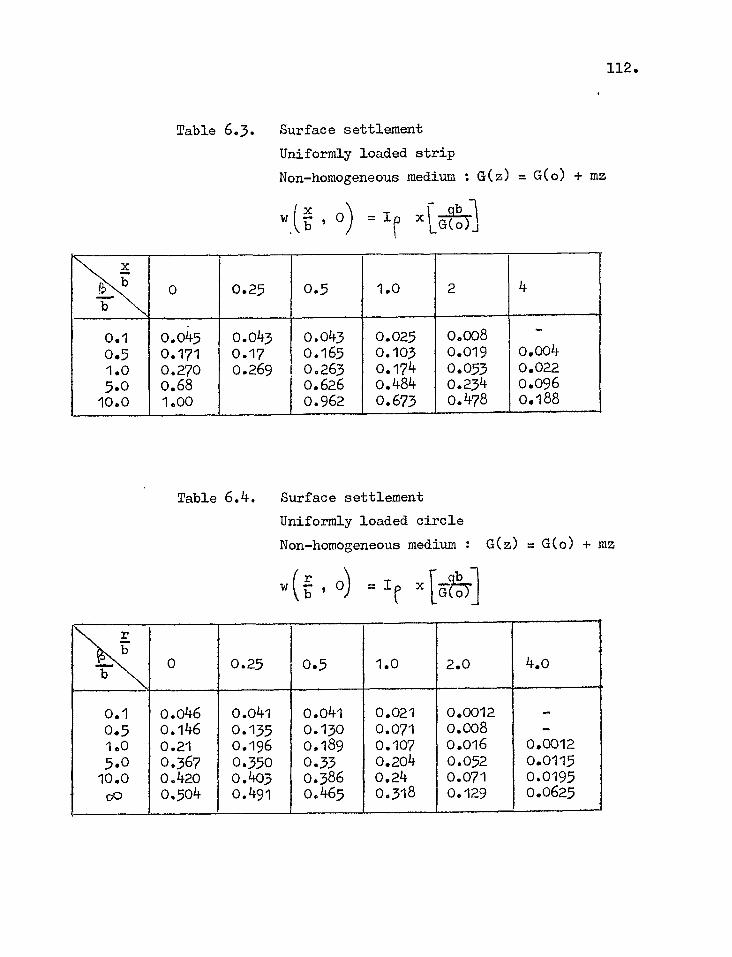
112.
Table 6.3. Surface settlement Uniformly loaded strip Non-homogeneous medium : G(z) = G(o) + mz
W(ig o) -'r
X b o 0.25 0.5 1.0 2 4
b
0.1 0.045 0.043 0.043 0.025 0.008 _
0.5 0.171 0.17 0.165 0.103 0.019 0.004 1.0 0.270 0.269 0.263 0.174 0.053 0.022 5.0 0.68 0.626 0.484 0.234 0.096 lox 1.00 0.962 0.673 0.478 0.188
Table 6.4. Surface settlement Uniformly loaded circle Non-homogeneous medium : G(z) = G(o) + mz
r w , = I x {do)
\\\N ,;.N
0 0.25 0.5 1.0 2.0 4.0 b
0.1 0.046 0.041 0.041 0.021 0.0012 - 0.5 0.146 0.135 0.130 0.071 0.008 - 1.0 0.21 0.196 0.189 0.107 0.016 0.0012 5.0 0.367 0.350 0.33 0.204 0.052 0.0115 10.0 0.420 0.403 0.386 0.24 0.071 0.0195 op 0.504 0.491 0.465 0.318 0.129 0.0625
G(o)
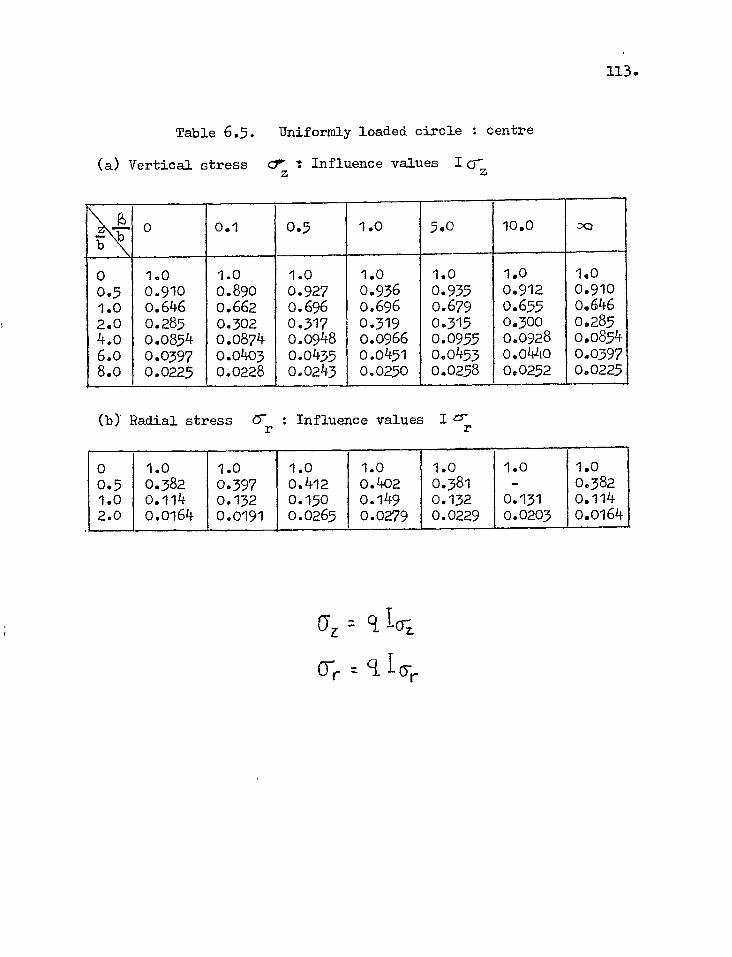
Table 6.5. Uniformly loaded circle : centre
(a) Vertical stress c:r 1 Influence values I o z
\',\\ 1)- b 0 0.1 0.5 1.0 5.o 10.0 x)
0 1.0 1.0 1.0 1.0 1.0 1.0 1.0 0.5 0.910 0.890 0.927 0.936 0.935 0.912 0.910 1.0 o.646 0.662 0.696 0.696 0.679 0.655 0.646 2.0 0.285 0.302 0.317 0.319 0.315 0.300 0.285 4.o 0.0854 0.0874 0.0948 0.0966 0.0955 0.0928 0.0854 6.o 0.0397 0.0403 0.0435 0.0451 0.0453 0.011110 0.0397 8.o 0.0225 0.0228 0.0243 0.0250 0.0258 0.0252 0.0225
(b) Radial stress Cr : Influence values I zr r r
0 1.0 1.0 1.0 1.0 1.0 1.0 1.0 0.5 0.382 0.397 0.412 0.402 0.381 0.382 1.0 0.114 0.132 0.150 0.149 0.132 0.131 0.114 2.0 0.0164 0.0191 0.0265 0.0279 0.0229 0.0203 0.0164
113.
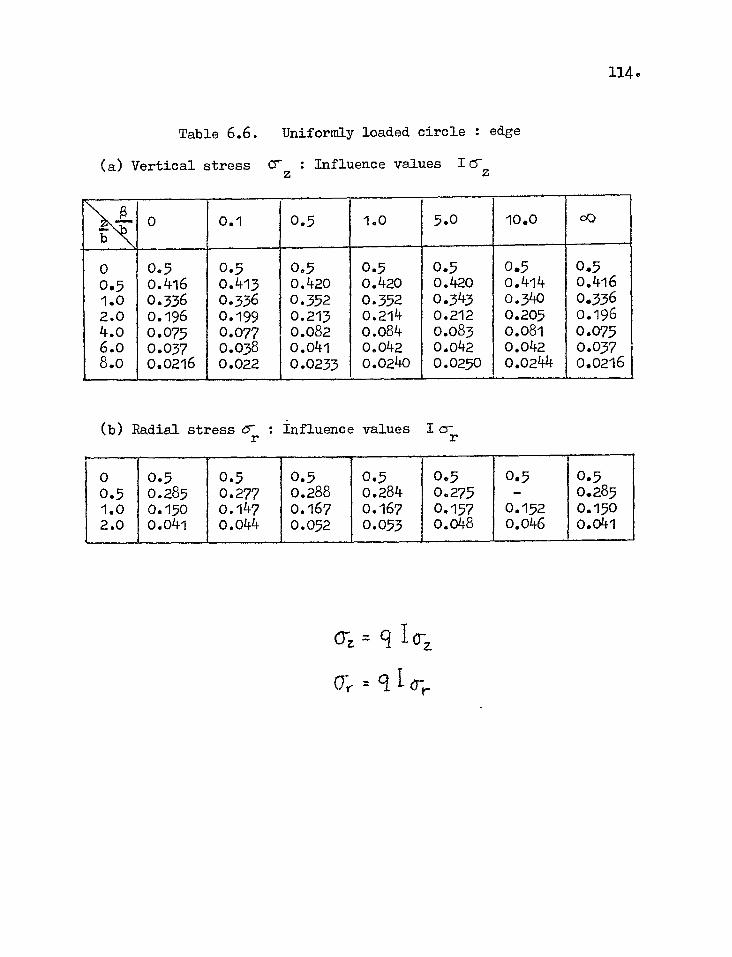
114.
Table 6.6. Uniformly loaded circle : edge
(a) Vertical stress C-z : Influence values Ic5-z
.\\\
- 73
0 0.1 0.5 1.0 5.0 10.0 op
0 0.5 0.5 0.5 0.5 0.5 0.5 0.5 0.5 0.416 0.413 0.420 0.420 0.420 0.414 0.416 1.0 0.336 0.336 0.352 0.352 0.343 0.340 0.336 2.0 0.196 0.199 0.213 0.214 0.212 0.205 0.196 4.0 0.075 0.077 0.082 0.084 0.083 0.081 0.075 6.0 0.037 0.038 0.041 0.042 0.042 0.042 0.037 8.0 0.0216 0.022 0.0233 0.0240 0.0250 0.0244 0.0216
(b) Radial stress Cr : Influence values I 0
' - 0 0.5 0.5 0.5 0.5 0.5 0.5 0.5 0.5 0.285 0.277 0.288 0.284 0.275 - 0.285 1.0 0.150 0.147 0.167 0.167 0.157 0.152 0.150 2.0 0.041 0.044 0.052 0.053 0.048 0.046 0.041
01 = q I crz
o-, = q I Tr.
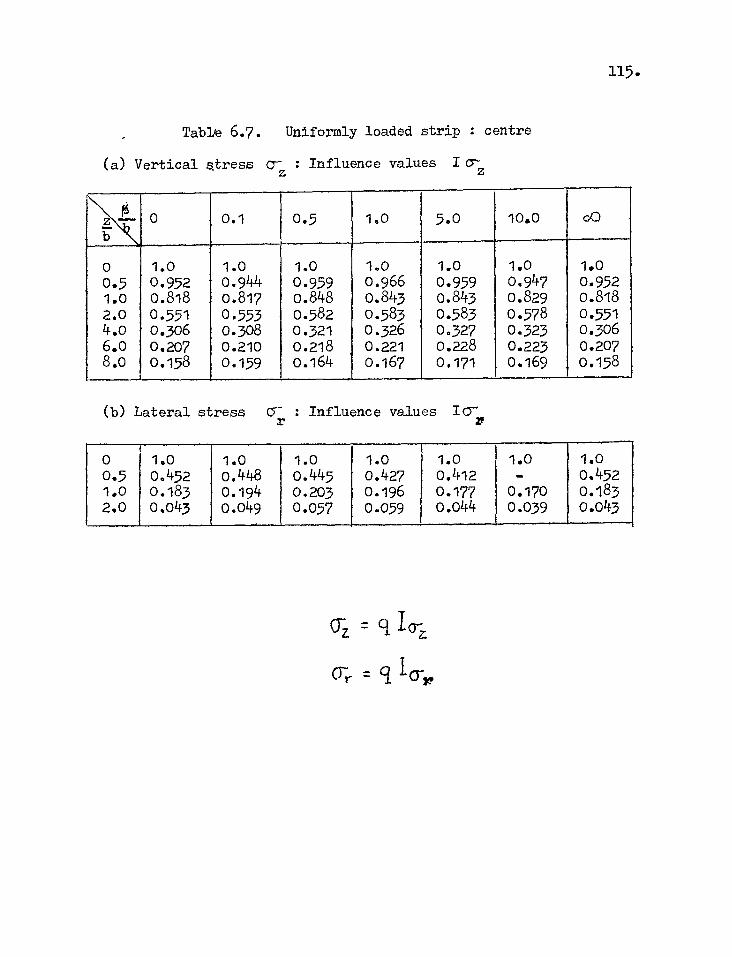
Table 6.7. Uniformly loaded strip : centre
(a) Vertical stress crz : Influence values I 0
0 0.1 0.5 1.0 5.0 10.0 oo
co O.
o o
OO
OO
OIn
n 1.0 1.0 1.0 1.0 1.0 1.0 1.0 0.952 0.944 0.959 0.966 0.959 0.947 0.952 0.818 0.817 0.848 0.843 0.845 0.829 0.818 0.551 0.553 0.582 0.583 0.583 0.578 0.551 0.306 0.308 0.321 0.326 0.327 0.323 0.306 0.207 0.210 0.218 0.221 0.228 0.223 0.207 0.158 0.159 0.164 0.167 0.171 0.169 0.158
(b) Lateral stress 07 : Influence values icr
0 1.0 1.0 1.0 1.0 1.0 1.0 1.0 0.5 0.452 0.448 0.445 0.427 0.412 - 0.452 1.0 0.183 0.194 0.203 0.196 0.177 0.170 0.183 2.0 0.043 0.049 0.057 0.059 0.044 0.039 0.043
q I CrZ
CI 1 Crr
115.
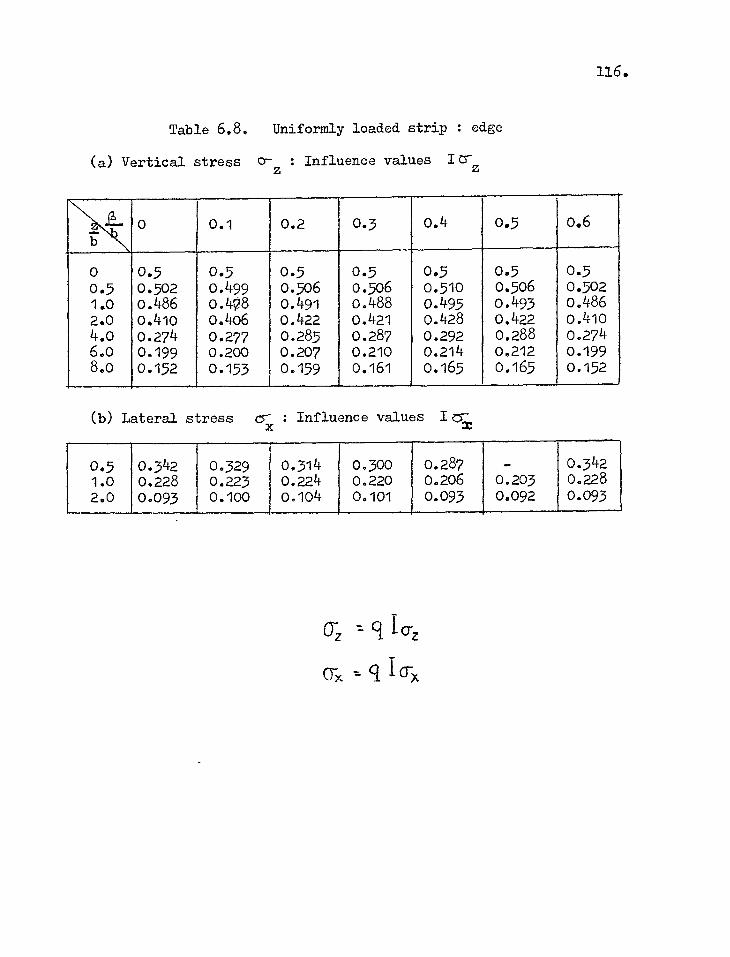
Table 6.8. Uniformly loaded strip : edge
(a) Vertical stress 0-z : Influence values 10-z
,* 0 0.1 0.2 0.3 0.4 0.5 0.6 Ta-
Lf1 0
0 0
0 0
••
••..
0 0
r- N —I- %.0
c0
1
0.5 0.5 0.5 0.5 0.5 0.5 0.5 0.502 0.499 0.506 0.506 0.510 0.506 0.502 0.486 0./48 0.491 0.488 0.495 0.493 o.486 0.410 0.406 0.422 0.421 0.428 0.422 0.410 0.274 0.277 0.285 0.287 0.292 0.288 0.274 0.199 0.200 0.207 0.210 0.214 0.212 0.199 0.152 0.153 0.159 0.161 0.165 0.165 0.152
,
(b) Lateral stress cr : Influence values I 0-
0.5 0.342 0.329 0.314 0.300 0.287 0.342 1.0 0.228 0.223 0.224 0.220 0.206 0.203 0.228 2.0 0.093 0.100 0.104 0.101 0.093 0.092 0.093
az
(r q (Tx
116.
117.
CHAPTER 7
STRESSES DURING CONSOLIDATION IN THE FIELD
7.1 Development of pore pressures in saturated clay
The application of a structural load causes the total
stresses in the ground to increase, the magnitudes of which can be
determined by methods described in Chapter 6. If the subsoil
consists of clay of low permeability and construction is sufficiently
rapid, these changes in total stresses occur under conditions of
no volume change and are associated with simultaneous development
of excess pore water pressures which subsequently dissipate with
the passage of time.
Skempton (1954) developed the expression for pore pressure
change within an element of soil in undrained conditions, for axially
symmetric stresses ( A cs---2 0-- = A ) in terms of the pore pressure 3 coefficients A and B,
u = B [Q AO-3 + A(A C5-1 - O cr (7.1.1)
where Lc'1 and ti.0'3
are respectively changes in the total
major and minor principal stresses.
For saturated clays, B = 1. Equation (7.1.1) then,
reduces to
!em u= A 3 + A(.6 - 1 3) (7.1.2)
Au=B[Acr1 - (1 - A)(Acr1 - 3
1 - (1 - A) - -L-1-2)- \L
or u = = B 6(5-
118.
This relationship between total stresses and excess pore
pressure does not take into account the value of the intermediate
principal stress Lcr2 and is strictly applicable only to cases
where A.0-2 = LIcr-3, and the stress increments are in the prindipal
stress directions. The validity of this relationship in the field,
where such conditions are satisfied, e.g. beneath the centre of a
uniformly loaded circle, has been demonstrated by Gibson and
Marsland (1960) and Lambe (1962)* who found that the in-situ
measurements of pore water pressures agree well with the predictions
based on the laboratory determination of the parameter A.
For problems of earth dams, Eqn. (7.1.1) is more con-
veniently expressed as
The "overall" coefficient E which expresses the excess pore
pressure in terms of the major principal stress is useful in the
stability analysis of earth dams, particularly in conditions of
rapid draw-down (Bishop 1954, 1957). The prediction of pore
Lambe investigated the case of a preload of the shape of a truncated cone.
119.
pressures according to equations (7.1.3a) and (7.1.3b) and based
on laboratory determination of B has been found to be in good
agreement with many field measurements (Sheppard and Aylen 1957,
Nonveiller 1957, Bishop and Vaughan 1962, Delory, Gass and Wong
1965, Rivard and Kohuska 1965).
It will be evident from equation (7.1.5b) that the
magnitude of excess pore water pressure is, in general, influenced
6 °---3 -,by the stress increment ratio . In certain conditions, 1
however, such as for a saturated normally consolidated clay, all
the quantities A, B and B approach unity and the ratio cr. has no,: more than a marginal influence. The pore pressure developed
is, then, approximately equal to the increase in the major principal
stress etoung and Osler 1965).
The basic pore pressure equation (Eqn. 7.1.2) for a
saturated clay under axi-symmetric stress conditions can also be
expressed in terms more comparable to the theory of elasticity
/:111 = 1.(e_Scr1 3 + 260-3) + (A - 1.)(6c 1 - acr3
) (7.1.4) 3
1 For a perfectly elastic material (A = 3 ' the change in pore
pressure is equal to the average increase in the principal stresses.
In practice, however, the condition of axial-symmetry is
not often satiefied, i.e. ac--2 6. 0-3. For such cases, to take
account of the influence of the intermediate principal stress, a
120.
more general relationship, in terms of the stress invariants has
been proposed (Skempton 1960, Henkel 1960):
u 21-3(zI cr1 2 3 +Lao- + au-)
+01. -Ac72)2 + (40-
2 3 -A 3)2 + (6cr3 -6.05-)2
(7.1.5)
It can be readily seen that, for the particular case of axial
symmetry (a d'2 Acr3 cr or A -1 6cr2). Equation (7.1.5)
reduces to
:317(6(7-1 + 60-2 Acr-3) +cK A/2 (acr-1 -6a- 3)
(7.1.6)
Although it is evident that equation (7.1.5) is of more
general validity than equation (7.1.1), (Hvorslev 1960), experimental
evidence is, so far, too limited (WU et al 1963, Shibata and Karube
1965) to demonstrate its applicability to all types of soil.
7.2 Pore prqssures beneath a circular foundation
Let us now restrict our consideration to the elements
of a saturated soil beneath the centre of a uniformly loaded circle.
Here, by virtue of axial symmetry, the vertical and horizontal
(radial) stresses are the principal stresses. Equation (7.1.6)
can then be written as:
121.
= Acr + A(&cr _ Lcr ) (7.1.9)
where tS0-v
increase in vertical stress
A.0-h = increase in horizontal strew
For over-consolidated clays where the in-situ horizontal stresses
prior to load application may be the major principal stresses,
equation (7.2.1) still holds in so far as only stress increments are
concerned.
The distribution of 460-v and 4crh
in a homogeneous
or a non-homogeneous elastic medium can be obtained by the various
methods of analyses described in Chapter 6. It has been shown
that the distribution of stresses in a iron-homogeneous half-space
is not significantly different from the Boussinesq stresses for a
homogeneous medium. We shall, therefore, use the latter in the
analysis that follows.
Fig. 7.1 shows the distribution of pore pressures in an
incompressible medium - Poisson's ratio = z - beneath the
centre of a uniform circular load, for different values of the
parameter A. It is interesting to note that for the two cases
A = 0 and A = 1 the changes in pore pressures are respectively
equal to the changes in horizontal and vertical total stresses.
If the parameter A changes with depth it is possible to determine
the distribution of A u by taking the variation of A with
depth inco account.
122.
7.3 Stress changes during consolidation
It has been described in Chapter 5.4 that during load
application most of the deformation takes place under conditions
of no volume change, implying a value of Poisson's ratio throughout
the medium equal to 0.5. As the excess pore pressures dissipate,
s'\) decreases and finally drops to its fully drained value
at the end of consolidation. It is well known that for an isotropic
homogeneous elastic medium the vertical stresses are independent of
the elastic parameters and are, therefore, unlikely to be significantly
affected by this decrease in On the other hand Poissonts
ratio has a considerable influence on the horizontal stresses as
can be seen from Fig. 7.2 where radial stresses are plotted as a
function of for the Boussinesq case beneath the centre of a
uniform circular load.
It is clear, therefore, that the problem of consolidation
in the field is very much interlinked with the problem of stress
distribution, a rigorous analytical treatment of which is extremely
complex and only a few specific solutions have so far been obtained
(Gibson and McNamee 1957, 1963, de Josselyn De Jong 1957, McNamee
and Gibson 1960). One of the purposes of the present investigation
is to study the influence of the horizontal stresses on the process
of consolidation and for this an approximate analysis will be made
on the assumption that the horizontal stress at the end of con-
solidation will be the same as the Boussinesq stresses for the

appropriate value of 11 =
With this in mind, let us now consider an element of
clay at a certain depth where, during load application,
A‘r-v increase in vertical stress ) for
At-7-111 increase in horizontal stress
The corresponding change in pore pressure will be
u = cr-h1 A("-v c5-h1)
(7.3.1)
At the end of consolidation, the vertical stress increment will
remain unchanged and the horizontal stress will have decreased by
an amount
_ (.3-h2 h1 (7.3.2)
where Cr = increase in horizontal stress for -) =
So, the changes in effective stress during consolidation will be
vertical: Acr =Au v c horizontal: A(5)
rc = L.12 S
) (7.3.3)
The ratio of the effective stress changes (K') is then given by
6_cr I K' = h c - 1 -
A c>" Au v c (7.3.4)
123.
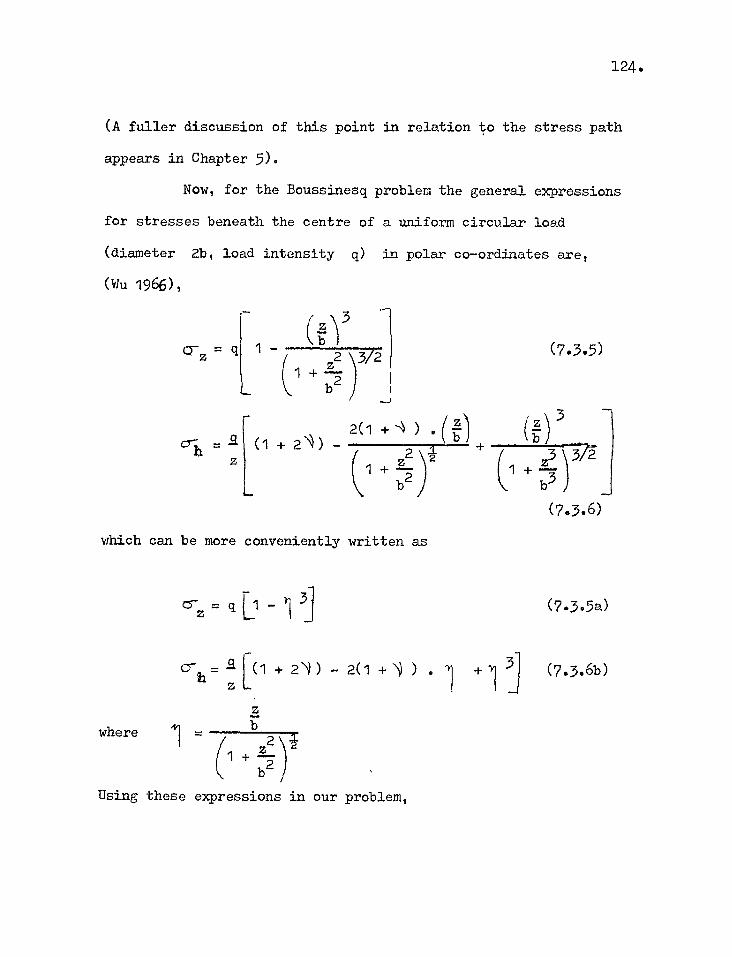
(1 + 2 ) (17z ) 3 —
z3 b3 (7.3.6)
3 1
L.
-z-b z2 )3/2
1 +b
(7.3.5) 0- = q
124.
(A fuller discussion of this point in relation to the stress path
appears in Chapter 5).
Now, for the Boussinesq problem the general expressions
for stresses beneath the centre of a uniform circular load
(diameter 2b, load intensity q) in polar co-ordinates are,
(Wu 1966),
which can be more conveniently written as
Ciz = q [1 - 1 1 (7.3.5a)
cril = [(1 + 211) - 2(1 +\) ) + 11 3 (7.3.6b)
where 1 z b
(1 + b2
Using these expressions in our problem,
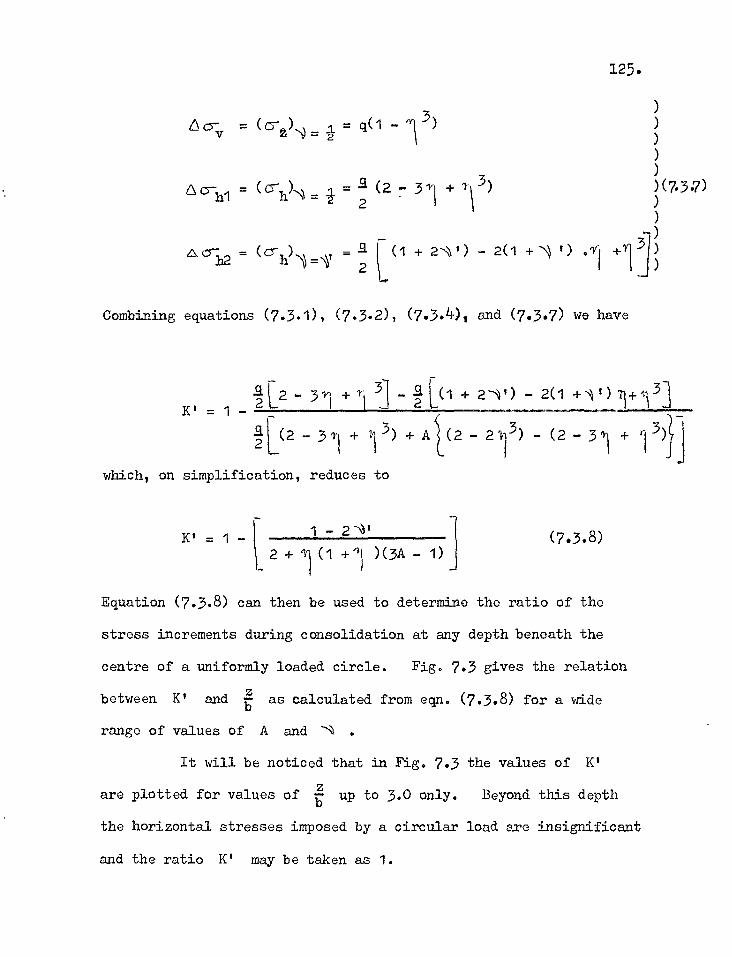
125.
)
6o-v = (c5 2). = = q(1 - '13) ) ) ) )
La-h1 = (611-1 )- = = •g• (2 - 31I 1 + 1 \ 3) ))(7.3.7) i 2 • ) )
(fr-h2 = ( a- )1= 2 1 L(1 + ' - 2(1 + ') .1 +11)
h V )
Combining equations (7.3.1), (7.3.2), (7.3.4), and (7.3.7) we have
K' = 1 - 3 + [(1 + 2-N)I) - 2(1
2 [(2 - 311 + 13) ± 4(2 - 3 ) (2 - + 3 )
which, on simplification, reduces to
(7.3.8) + ) (3A - 1)
Equation (7.3.8) can then be used to determine the ratio of the
stress increments during consolidation at any depth beneath the
centre of a uniformly loaded circle. Fig. 7.3 gives the relation
between K' and - as calculated from eqn. (7.3.8) for a wide
range of values of A and 11 .
It will be noticed that in Fig. 7.3 the values of K'
are plotted for values of up to 3.0 only. Beyond this depth
the horizontal stresses imposed by a circular load are insignificant
and the ratio K' may be taken as 1.
K' =1 - 1
126.
The values of K' plotted in fig. 7.3 will be used to
study the experimental data and in settlement computations later
in the thesis.
127.
CHAPTER 8
SAMPLING, PRELIMINARY MEASUREMENTS AND
EXPERIMENTAL PROGRAMME
8.1 Location of sites
All the experimental work reported in this thesis was
conducted on undisturbed samples of London clay from two different
sites - Oxford Circus and High Ongar, Essex, (see Fig. 4.1). Two
block samples were obtained from the Victoria Line underground
tunnel at Oxford Circus in March 1965 and the first series of tests
were performed during the next nine months. Because of complica-
tions with the tunnelling operations it was not possible to return
to Oxford Circus for more samples and the second site in Ongar,
Essex, was chosen. Three block samples were obtained from this
site in March 1966 on which the second series of tests were con-
ducted until the completion of the experimental programme in Nov-
ember 1967.
8.2 Description of sites, sampling and storage
(i) Oxford Circus
The geological section of the site (obtained from Sir
William Halcrow and Partners, Consulting Engineers) is shown in
Fig. 8.1a. The London clay is overlain by 41.1 ft. of gravel, the
water level being 9.6 ft. above the top of the clay. The samples
128.
were obtained from a depth of 83.6 ft. below ground level l , i.e.
42.5 ft. into the London clay.
9 in. x 9 in. x 9 in. samples were trimmed with sharp
spades from approximately 3 ft. cube blocks detached from the face
of the tunnel by drills and a portable chain saw. The samples,
which were marked previously for cbrientation, were covered with
polythene bags and sealed in suitable size tins with Scotch tape
before they were transported to the laboratory.
(ii) High Ongar
The site in Ongar, used by Messrs. W. F. French Ltd. for
the manufacture of aggregate from burnt clay, consists of a pit of
London clay overlain by various mixtures of gravel, ballast and
brick earth (Fig. 8.1b). The samples were obtained from the
bottom of a cutting 27.5 ft. below the top of the clay. The upper
part of the soil profile is somewhat approximate in that it had to
be extrapolated from a series of borings made by W. F. French Ltd.
in the surrounding area a few years earlier.
Three columns of clay approximately 18" x 18" x 12 ft.
high were first isolated from the mass of clay with picks and
trenching tools and left attached to the base of the pit. These
were trimmed carefully by hand with sharp spades and knives to
approximately 9 in. square x 1 ft. high, after which the blocks
were covered with tinfoil and polythene bags, and suitable size
boxes were slid over from the top. The samples were then separated
129.
from the base by a wire cutter, sealed with Scotch tape and trans-
ported to the laboratory. The whole operation took the best part
oT a day.
Storage
Immediately on arrival in the laboratory the samples were
taken out of the boxes and given a thick and thorough coating of
wax and petroleum jelly mixture. These were then covered in poly-
thene bags and sealed, put into the boxes and lids replaced. The
blocks which were to remain untouched for a long time (no. 2 from
Oxford Circus and nos. 2 and 3 from Ongar) were covered with an
additional layer of wax poured on top of the sealed samples before
the lids were placed.
When specimens were needed for testing, small prisms
(2" x 2" x 4" for triaxial samples and 4" x 4" x 1-i" for conventional
oedometer samples) were cut out with thin wire cutters and the rest
of the block was re-coated with wax and stored, as described above.
8.3 Index properties
The Atterberg limits, the specific gravity of the solid
particles and the clay-fraction were determined for a number of
samples following procedures given in B.S.1377(1961). Table 8.1
summarises the average data for each block. It may be noted that
the clay fractions for both Oxford Circus and Ongar were substantially
the same, yet the Ongar clay was more active because of its higher
130.
plasticity.
A comparison of these values has been made in Fig. 4.3
with the corresponding properties of London clay from a number of
other sites.
8.4 Moisture content
The natural moisture contents have been determined from
initial measurements made on pairings taken during preparation of
individual triaxial and oedometer specimens. In Fig. 8.2 these
values are plotted against time after sampling. It will be seen
that the scatter is large, but not untypical of London Clay (Ward,
Marsland and Samuels, 1965). There is, however, no systematic
decrease of water content with time, as would be the case if there
was loss of water by evaporation due to poor sealing and storage
over such a long period of time (up to 600 days).
Also shown in Fig. 8.2 are the field moisture contents
determined from bulk samples transported to the laboratory in air-
tight bottles. These show no significant difference from the
laboratory moisture contents and lie within the range of scatter,
although being a little above (0.5%) the average.
The inital degree of saturation of n11 the triaxial and
oedometer specimens calculated from their weight and dimensions,
is shown in Tables 8.2 and 8.3. The samples from the Oxford Circus
blocks indicate almost 100% saturation while the later triaxial
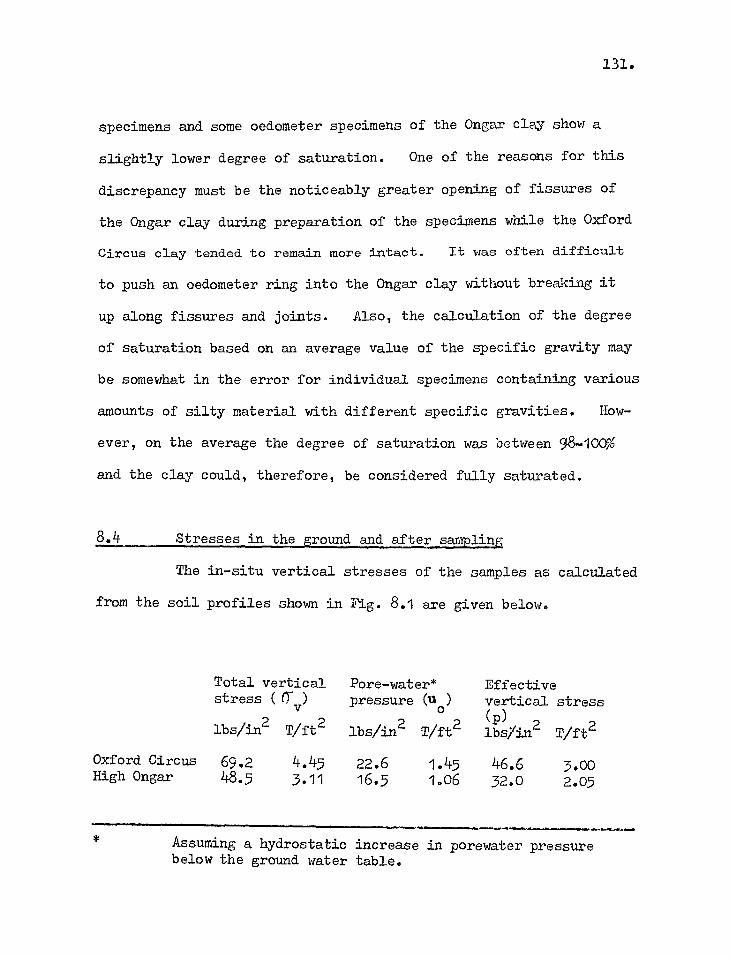
131.
specimens and some oedometer specimens of the Ongar clay show a
slightly lower degree of saturation. One of the reasons for this
discrepancy must be the noticeably greater opening of fissures of
the Ongar clay during preparation of the specimens while the Oxford
Circus clay tended to remain more intact. It was often difficult
to push an oedometer ring into the Ongar clay without breaking it
up along fissures and joints. Also, the calculation of the degree
of saturation based on an average value of the specific gravity may
be somewhat in the error for individual specimens containing various
amounts of silty material with different specific gravities. How-
ever, on the average the degree of saturation was between 98-100%
and the clay could, therefore, be considered fully saturated.
8.4 Stresses in the ground and after samplinE
The in-situ vertical stresses of the samples as calculated
from the soil profiles shown in Fig. 8.1 are given below.
Total vertical stress ( cr,)
lbs/in2 T/ft2
Pore-water* pressure (u
o)
lbs/in 2 T/ft2
Effective vertical stress
(p) 2 lbs/in T/ft2
Oxford Circus 69.2 4.45 22.6 1.45 46.6 3.00 High Ongar 48.5 3.11 16.5 1.06 32.0 2.05
Assuming a hydrostatic increase in porewater pressure below the ground water table.
132.
The expression for the state of stress in a soil after
sampling has been derived by Skempton and Sowa (1963).
Let us consider an element of saturated clay in the ground
under a total vertical stress rr and two equal horizontal stresses - v
h If the pore pressure is V
o the vertical and horizontal
effective stresses are, respectively,
p= Tv - uo
K p = - u 0 - h o
) (8.4.1)
where Ko is the coefficient of earth pressure at rest, in terms of
effective stresses.
When this element is removed from the ground, as a sample,
without any change in water content, it is relieved of its total
stresses and a negative pore pressure uk is set up. Since the
total stresses at this stage are equal to zero, the sample must be
under an all-round effective stress pk numerically equal to uk.
From equation (7.1.4) in chapter 7.1 the change in pore
pressure due to sampling can be expressed as
uo = (C7v crh) (As - 31)( Cry
= - Fp . 1 + 2K
o
3 1 + u0 + (A 3 s - —)(1 o)p
or pk=p K
0 -A s (K0 1)
=K - A (K -1) o s o
and
K
(8.4.3)
(8.4.4)
(8.4.5)
Pk or
p
133.
uk = - P
1 + 2:o (As - i)(1 Ko) I
(8.4.2)
or
3
where As is the pore pressure parameter corresponding to the re-
moval of shear stresses.
Therefore,
Pk = uk = [ i 3 0 (As
1 - Ko)
1 + 2K
Pk Fig. 8.3 shows the relation between Ko and — for different
values of A. It may be noted that for normally consolidated clays
(K0 1), pk is less than 1, i.e. the effective stress after
sampling is less than the in-situ vertical effective stress. For
heaving over- consolidated clays, however, (K0 > 1) pk will be
greater than p for all values of As (See also Noorany and
Seed 1965).
It is also of interest to note that for a material that
1 behaves elastically As 3 = - and therefore,
P
Pk = 1 3, 2K) (8.4.6)
134.
i.e. the effective stress in an undistrubed sample of such a soil
is equal to the average of the in-situ effective stresses.
The above analysis assumes "perfect" sampling which means
that the eleme-it has neither undergone any change in water content
nor has it sufered any mechanical disturbance during the process
of removal fro;: the ground. In actual samples, however, varying
degrees of disturbance may result in effective stresses which could
be different from those in "perfect" samples.
Measurement ofpk
The direct measurement of the initial suction (which
is numerically equal to the effective stress P of an undisturbed
sample is difficult unless it is less than one atmosphere. Lambe
(1961) has described several methods for measuring such small values
of u. But for deeper samples of London clay which have been under
very high in-situ effective stresses the negative pore pressures
may be too high to measure directly. For such cases of saturated
samples S,:empton (1961) LaL; suggested four methods for the determina-
tion of u,
(i) F,:.cm -no consojdation stage of drained or consolidated
undradned triaxial tests
The cell. press) re at which a sample neither swells nor
consolidates gives ',he value of u . This can be obtained by
plotting cell pressure against volumetric strain for individual
samples and inLerr:;lating the pressure corresponding to zero volume
135.
change. This method has been used by Bishop, Webb and Lewin (1965).
(ii) From oedometer tests
The so-called "swelling" pressure measured in the oedometer
by finding the load which prevents any volume change of a specimen
submerged in water is sometimes considered to give the initial suction.
However, as will be shown later this method has certain drawbacks
and is less accurate.
(iii) From undrained test with pore pressure measurement
A specimen is subjected to an all-round pressure n7 3
which is higher than the initial suction. If the pore pressure
measured under undrained conditions is u, then the effective
stress in the sample will be given by pk = (13 - u (since B = 1)
(iv) The initial suction can also be deduced from the un-
drained strength determined from conventional quick trig dal tests.
A knowledge of c', 0' and the pore pressure parameter Af at
failure is necessary.
London Clay from Oxford Circus and Ongar
The initial suctions of the Oxford Circus and Ongar clays
were determined by method (iii) mentioned above. Each triaxial
specimen was set up under undrained condition and a cell pressure
higher than the estimated suction was applied. The pore pressure
was measured over a period of 24 hours or more, until equilibrium
was reached. The effective stress (pk) in the specimen was then
given by the difference between the cell pressure and the pore
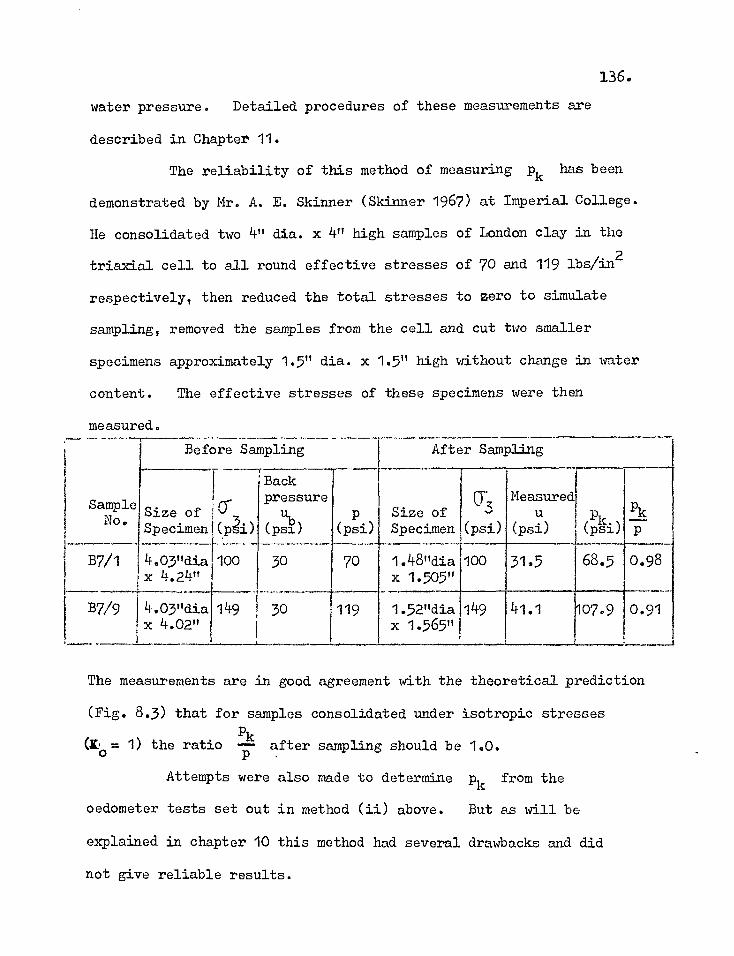
136. water pressure. Detailed procedures of these measurements are
described in Chapter 11.
The reliability of this method of measuring pk has been
demonstrated by Mr. A. E. Skinner (Skinner 1967) at Imperial College.
He consolidated two 4" dia. x 4" high samples of London clay in the
triaxial cell to all round effective stresses of 70 and 119 lbs/in2
respectively, then reduced the total stresses to zero to simulate
sampling, removed the samples from the cell and cut two smaller
specimens approximately 1.5" dia. x 1.5" high without change in water
content. The effective stresses of these specimens were then
measured.
Sample No.
Before Sampling After Sampling
Sample -
Specimenjai) Size of
Back pressure
ub (psi) p
(psi) Size of Specimen
Cy' 3
(psi)
Measured u
(psi) p,
(psi) P k p
B7/1 4.03"dia x 4.24"
100 30 70 1.48"dia x 1.505"
100 31.5 68.5 0.98
B7/9 4.03"dia x 4.02"
149 30 119 1.52"dia x 1.565"
149 41.1 107.9 0.91
The measurements are in good agreement with the theoretical prediction
(Fig. 8.3) that for samples consolidated under isotropic stresses
Pk (C0 = 1) the ratio — after sampling should be 1.0. P •
Attempts were also made to determine pk from the
oedometer tests set out in method (ii) above. But as will be
explained in chapter 10 this method had several drawbacks and did
not give reliable results.
137.
Fig. 8.4 and Table 8.3 show the measured values of pk
from all the triaxial specimens. Because of a limited supply of
samples only 8 tests were possible on the Oxford Circus clay. On the other hand a total of 36 tests were performed on the Ongar clay
over a period of about 600 days. The average values and the
standard deviations are also shown in Fig. 8.4. It may be seen
that there is no significant change in the value of pk with time,
again confirming that there has been no loss of water by evaporation
during storage. Table 8.4 summarises the results and shows that
pk is considerably higher than the vertical effective stress p
supporting the findings on the London clay from Bradwell (Skempton
1961) and Ashford Common (Bishop, Webb and Lewin 1965). Measure-
ments on normally consolidated Kawasaki clay and lightly over-
consolidated Boston Blue clay at M.I.T. (Ladd and Lambe 1963) have
shown that excessive sample disturbance may lower the measured value
of pk to 30% of the theoretical value for perfect sampling.
However, block samples are thought to suffer considerably less
disturbance than ordinary piston samples.
It is now possible, using equation 5, to determine the
in-situ horizontal stresses of the samples from Oxford Circus and
Ongar. A value of As = 0.4 corresponding to unloading tests
(reported in chapter 11) was used in the calculations. The
results are given in Table 8.4 which also includes for comparison
some results from Ashford Common and Bradwell.
138.
It has already been noted (Fig. 8.3) that pk is highly
dependent on Ho. For a heavily over-consolidated clay, like
London clay, Ko is essentially a function of the overconsolidation
ratio (O.C.R.). The higher the O.C.R., the greater is the value
Pk of Ko (Brooker and Ireland 1965) and also of the ratio — . This
Pk is clearly shown in Fig. 8.5a where — has been plotted against the
O.C.R. on a log scale for both Bradwell and Ashford Common. There
is good agreement between the two sites, i.e. Bradwell and Ashford
Common, and the value for Ongar lies close to the average line.
Substantially the same data are plotted in Fig. 8.5b which shows the
Pk decrease of — with the vertical effective stress p. Here, of
course, two separate lines are obtained reflecting the difference in
the maximum past overburden pressures at the two sites.
A more complete account of the in-situ to of London Clay
will be found in chapter 10 where the results of laboratory determina-
tions of Ko are presented.
8.6 Experimental programme
The main purpose of the laboratory investigation reported
in this thesis was to study the compressibility of London clay under
different conditions of time - dependent loading and of stress-path
bearing in mind, particularly, the conditions beneath a foundation
in the field. Accordingly the experimental programme was divided
into two distinct parts:
139
1. Oedometer tests
2. Triaxial tests.
8.6.1 Oedometer tests
The main series of oedometer tests was pefformed to study
the effect of (a) rest period and (b) the rate of loading on the
compressibility of London clay. It is well recognised that a con-
ventional oedometer test with 1-day load duration and a pressure in-
crement ratio of 1 does not reproduce the field condition where often
small load increments ( 21.t. 1) are slowly applied. Moreover, P
the inevitable structural disturbance that takes place due to the
release of stresses by sampling may have some effect on the com-
pressibility obtained from conventional tests. A number of samples
were allowed to rest for various periods of time at the in-situ
overburden pressure (2 T/ft2 for Ungar and 3 T/ft2 for Oxford Circus)
before any further loads were applied in order to determine whether
such sustained loading influenced the subsequent compressibility.
In addition, special oedometers were built for the follow-
ing investigations:
(1) Consolidation characteristics of the clay were studied in
the high pressure oedometer, in which specimens were loaded by
hydraulic pressure instead of dead weights, (11100 tests)* Settle-
ment, volume change and pore pressures were measured during con-
solidation.
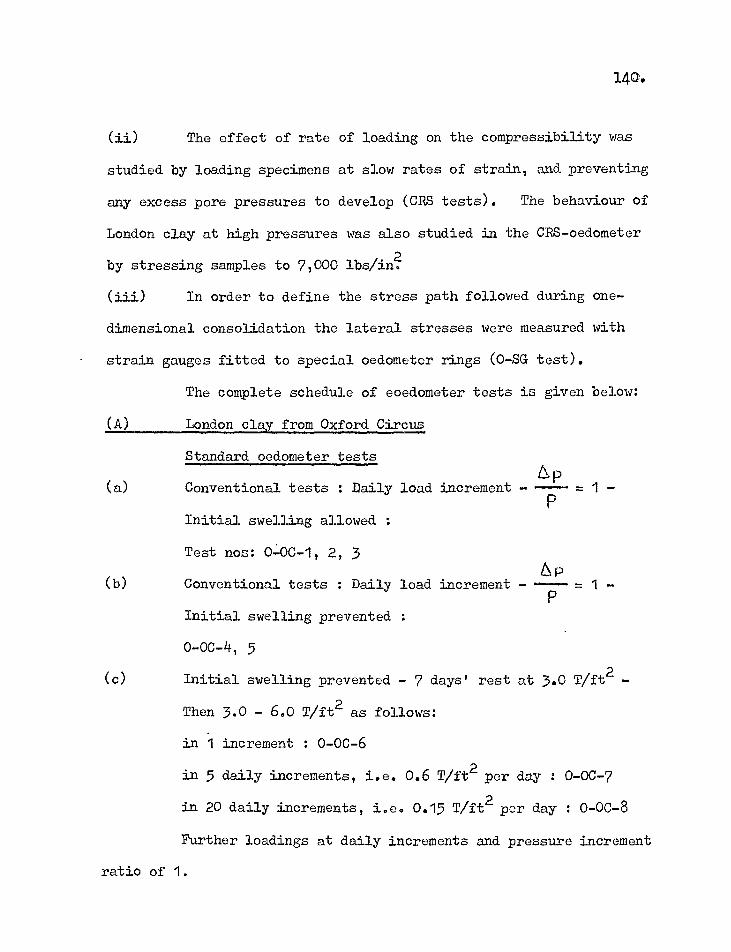
140).
(ii) The effect of rate of loading on the compressibility was
studied by loading specimens at slow rates of strain, and preventing
any excess pore pressures to develop (CRS tests). The behaviour of
London clay at high pressures was also studied in the CRS-oedometer
by stressing samples to 7,000 lbs/in2
(iii) In order to define the stress path followed during one-
dimensional consolidation the lateral stresses were measured with
strain gauges fitted to special oedometer rings (0-SG test).
The complete schedule of eoedometer tests is given below:
(A) London clay from Oxford Circus
Standard oedometer tests
(a) Conventional tests : Daily load increment = 1
Initial swelling allowed :
Test nos: 0LOC-1, 2, 3 tSID
Conventional tests : Daily load increment - P
Initial swelling prevented :
0-00-4, 5
(c) Initial swelling prevented - 7 days' rest at 3.0 T/ft2 -
Then 3.0 - 6.0 T/ft2 as follows:
in 1 increment : 0-0C-6
in 5 daily increments, i.e. 0.6 T/ft2 per day : 0-0C-7
in 20 daily increments, i.e. 0.15 T/ft2 per day : 0-0C-8
Further loadings at daily increments and pressure increment
ratio of 1.
(b)
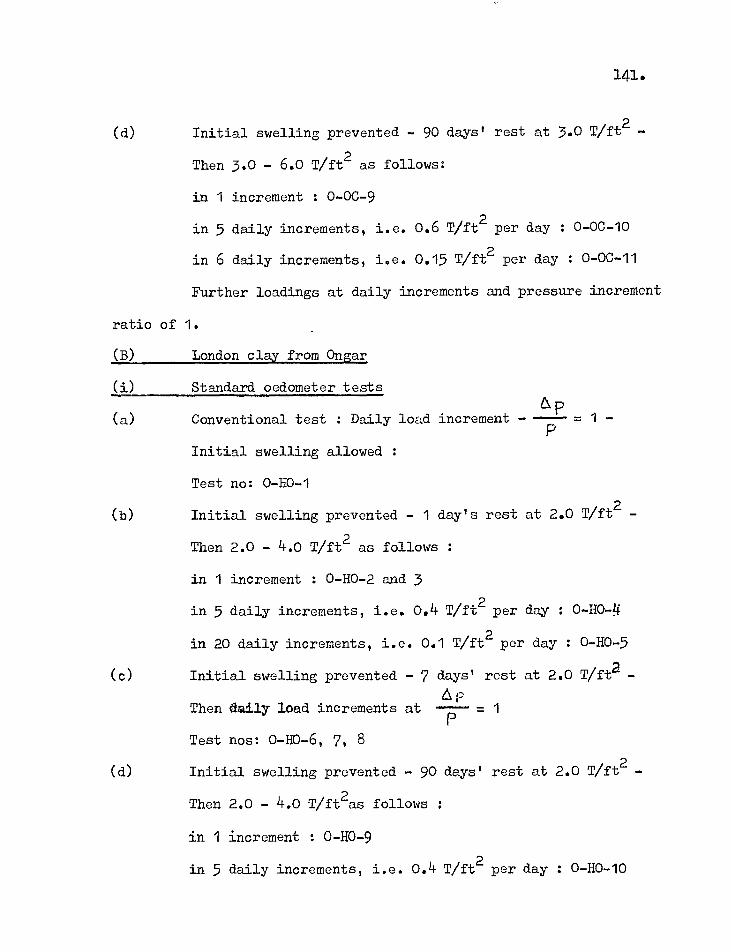
141.
(d) Initial swelling prevented - 90 days' rest at 3.0 T/ft2 -
Then 3.0 - 6.0 T/ft2 as follows:
in 1 increment : 0-0C-9
in 5 daily increments, i.e. 0.6 T/ft2 per day : 0-0C-10
in 6 daily increments, i.e. 0.15 T/ft2 per day : 0-0C-11
Further loadings at daily increments and pressure increment
ratio of 1.
(B) London clay from Ongar
(i) Standard oedometer tests
(a) Conventional test : Daily load increment - - p P 1
Initial swelling allowed :
Test no: 0-H0-1
(b) Initial swelling prevented - 1 day's rest at 2.0 T/ft2 -
Then 2.0 - 4.0 T/ft2 as follows :
in 1 increment : 0-H0-2 and 3
in 5 daily increments, i.e. 0.4 T/ft2 per day : 0-H0-1
in 20 daily increments, i.e. 0.1 T/ft2 per day : 0-H0-5
(c) Initial swelling prevented - 7 days' rest at 2.0 T/fta - Ap
Then daily load increments at ---- =
Test nos: 0-H0-6, 7, 8
(a) Initial swelling prevented - 90 days' rest at 2.0 T/ft2 -
Then 2.0 - 4.0 T/ft2as follows :
in 1 increment : 0-H0-9
in 5 daily increments, i.e. 0.4 T/ft2 per day : 0-H0-10
1
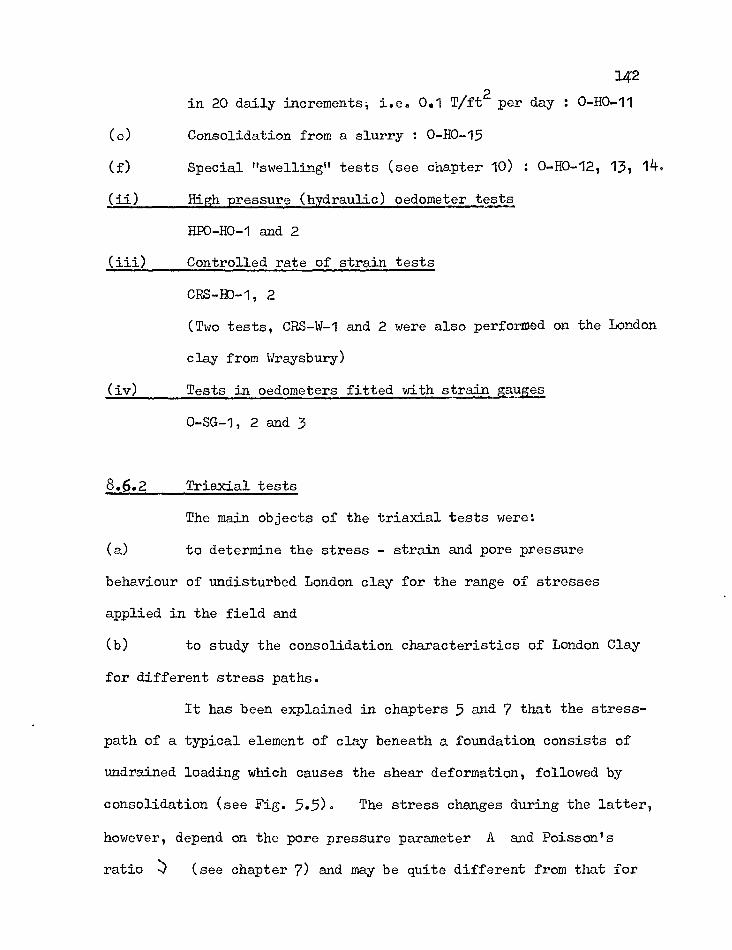
142
in 20 daily increments, i.e. 0.1 T/ft2 per day : 0-H0-11
(e) Consolidation from a slurry : 0-H0-15
(f) Special "swelling" tests (see chapter 10) : 0-H0-121 13, 14.
(ii) High pressure (hydraulic) oedometer tests
HPO-H0-1 and 2
(iii) Controlled rate of strain tests
CRS-H0-1, 2
(Two tests, CRS-W-1 and 2 were also performed on the London
clay from Wraysbury)
(iv) Tests in oedometers fitted with strain _gauges
0-SG-1, 2 and 3
8.6.2 Triaxial tests
The main objects of the triaxial tests were:
to determine the stress - strain and pore pressure (a)
behaviour of undisturbed London clay for the range of stresses
applied in the field and
(b) to study the consolidation characteristics of London Clay
for different stress paths.
It has been explained in chapters 5 and 7 that the stress-
path of a typical element of clay beneath a foundation consists of
undrained loading which causes the shear deformation, followed by
consolidation (see Fig. 5.5). The stress changes during the latter,
however, depend on the pore pressure parameter A and Poisson's
ratio J (see chapter 7) and may be quite different from that for
143.
one-dimensional consolidation in the oedometer. The best procedure
for a settlement analysis would, obviously, be to apply to a specimen
the same set of stresses that will be applied in the field and to
measure the corresponding deformations. This means that the
sample must first be brought back to the state of stress that pre-
vailed in the ground and then subjected to the stresses that will be
applied on loading in the field.
It has been shown in the previous section that the effective
stress in an undisturbed sample of London clay is greater than the
in-situ vertical effective stress. Therefore, after placing a
specimen (axis vertical) in the triaxial apparatus under an all-
round pressure the axial stress should be reduced without change in
water content until the effective stresses are what they were in the
ground. Then the stress path corresponding to that in the field
should be followed.
It was the purpose of the triaxial tests to study the
effect of stress paths, such as described above, on the deformation
Of London clay and also to determine the effect of isotropic and
anisotropic stress changes on the axial and volumetric strains
during consolidation.
The different types of triaxial tests carried out in the
investigation are described below. The graphical representation
of the stress path associated with each type is shown in Fig. 8.6.
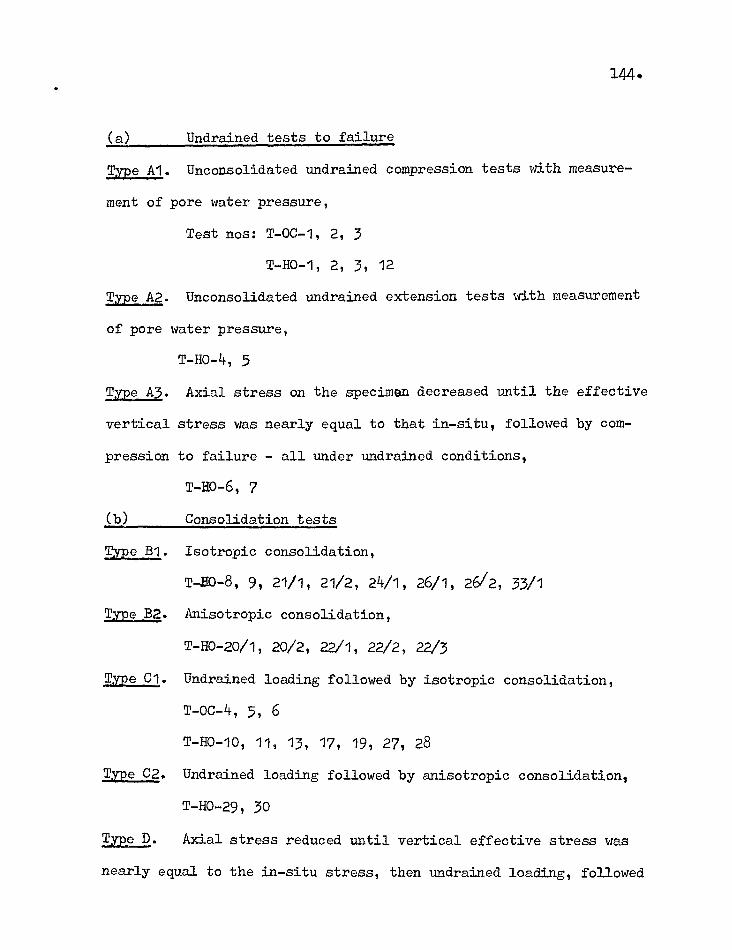
144.
(a) Undrained tests to failure
Type Al. Unconsolidated undrained compression tests with measure-
ment of pore water pressure,
Test nos: T-0C-1, 2, 3
T-H0-1, 2, 3, 12
Type A2. Unconsolidated undrained extension tests with measurement
of pore water pressure,
T-H0-4, 5
Type A3. Axial stress on the specimen decreased until the effective
vertical stress was nearly equal to that in-situ, followed by com-
pression to failure - all under undrained conditions,
T-H0-6, 7
(b) Consolidation tests
Type Bl. Isotropic consolidation,
T-H0-8, 9, 21/1, 21/2, 24/1, 26/1, 26/2, 33/1
Type B2. Anisotropic consolidation,
T-H0-20/1, 20/2, 22/1, 22/2, 22/3
Type Cl. Undrained loading followed by isotropic consolidation,
T-OC-4, 5, 6
T-H0-10, 11, 13, 17, 19, 27, 28
Type C2. Undrained loading followed by anisotropic consolidation,
T-110-29, 30
Type D. Axial stress reduced until vertical effective stress was
nearly equal to the in-situ stress, then undrained loading, followed
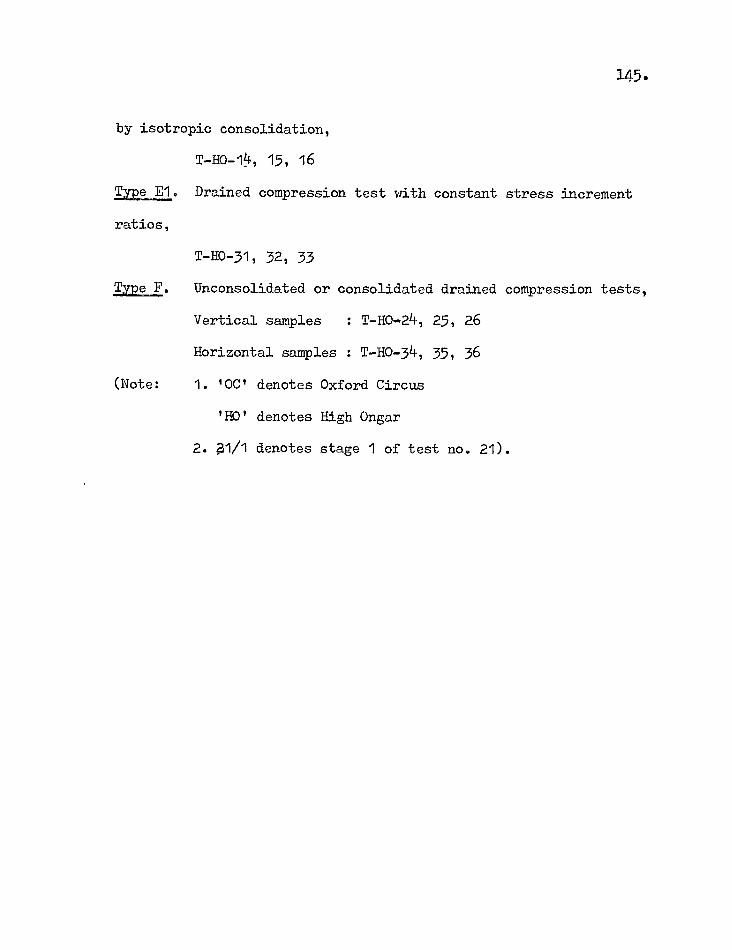
145-
by isotropic consolidation,
T-HO-11F, 15, 16
Type El. Drained compression test with constant stress increment
ratios,
T-HO-31, 32, 33
Type F. Unconsolidated or consolidated drained compression tests,
Vertical samples : T-HO-24, 25, 26
Horizontal samples : T-H0-34, 35, 36
(Note: 1. 'OC' denotes Oxford Circus
'HO' denotes High Ungar
2. avi denotes stage 1 of test no. 21).
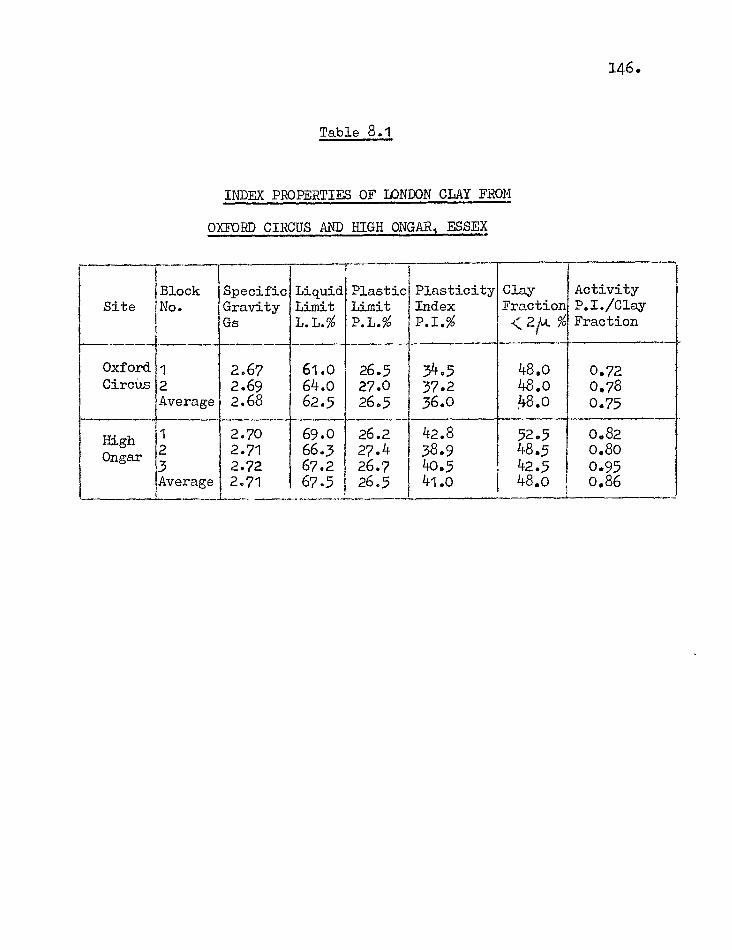
146.
Table 8.1
INDEX PROPERTIES OF LONDON CLAY FROM
OXFORD CIRCUS AND HIGH ONGAR, ESSEX
Site Block No.
Specific Gravity Gs
Liquid Limit L.L.%
Plastic Limit P.L.%
Plasticity Index P.I.%
Clay Fraction < 2/1.t. %
Activity P.I./Clay Fraction
oxford 1 2.67 61.0 26.5 34.5 48.0 0.72 Circus 2 2.69 64.0 27.0 37.2 48.0 0,78
Average 2.68 62.5 26.5 36.0 ;48.0 0.75
High 1 2.70 69.0 26.2 42.8 52.5 0.82 Ongar 2 2.71 66.3 27.4 38.9 48.5 0.80
3 2.72 67.2 26.7 40.5 42.5 0.95 Average 2.71 67.5 26.5 41.0 48.0 0.86
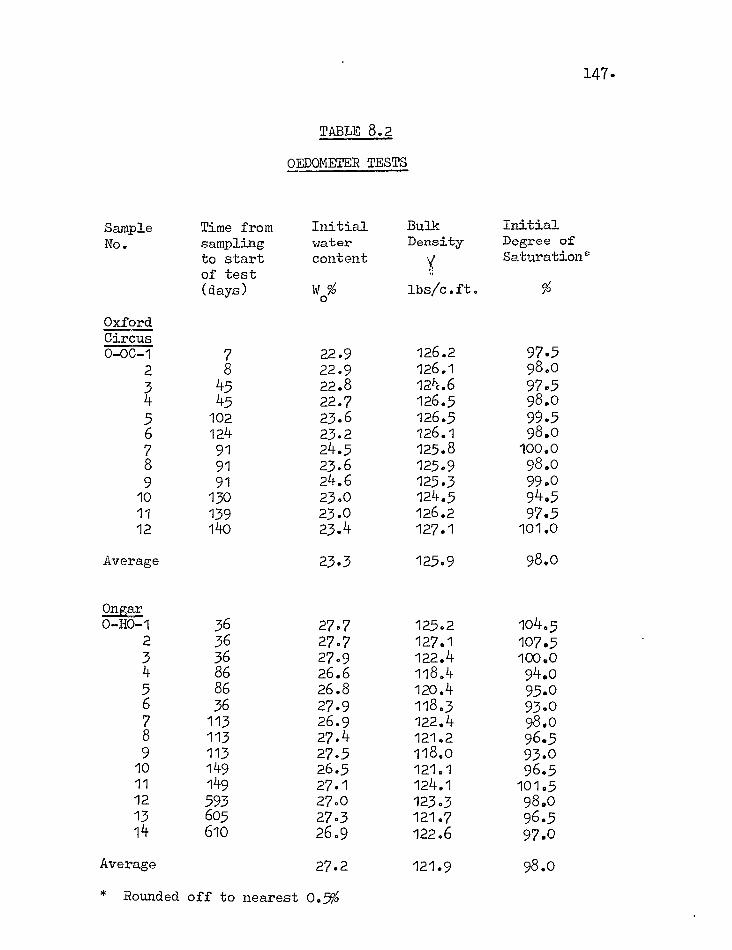
TABTN, 8.2
OEDOMETER TESTS
Sample Time from Initial Bulk Initial No. sampling water Density Degree of
to start content X
Saturation* of test (days) Wo% lbs/c.ft. %
Oxford Circus o-oc-1 7 22.9 126.2 97.5
2 8 22.9 126.1 98.o 3 45 22.8 124.6 97.5 4 45 22.7 126.5 98.o 5 102 23.6 126.5 99.5 6 124 23.2 126.1 98.o 7 91 24.5 125.8 100.0 8 91 23.6 125.9 98.o 9 91 24.6 125.3 99.o 10 13o 23.o 124.5 94.5 11 139 23.o 126.2 97.5 12 140 23.4 127.1 101.0
Average 23.3 125.9 98.0
Ongar 0-H0-1 36 27.7 125.2 104.5
2 36 27.7 127.1 107.5 3 36 27.9 122.4 100.0 4 86 26.6 118.4 94.o 5 86 26.8 120.4 95.o 6 36 27.9 118.3 93.0 7 113 26.9 122.4 98.o 8 113 27.4 121.2 96.5 9 113 27.5 118.0 93.0 10 149 26.5 121.1 96.5 11 149 27.1 124.1 101.5 12 593 27.o 123.3 98.o 13 6o5 27.3 121.7 96.5 14 610 26.9 122.6 97.o
Average 27.2 121.9 98.0
* Rounded off to nearest 0.5%
147.
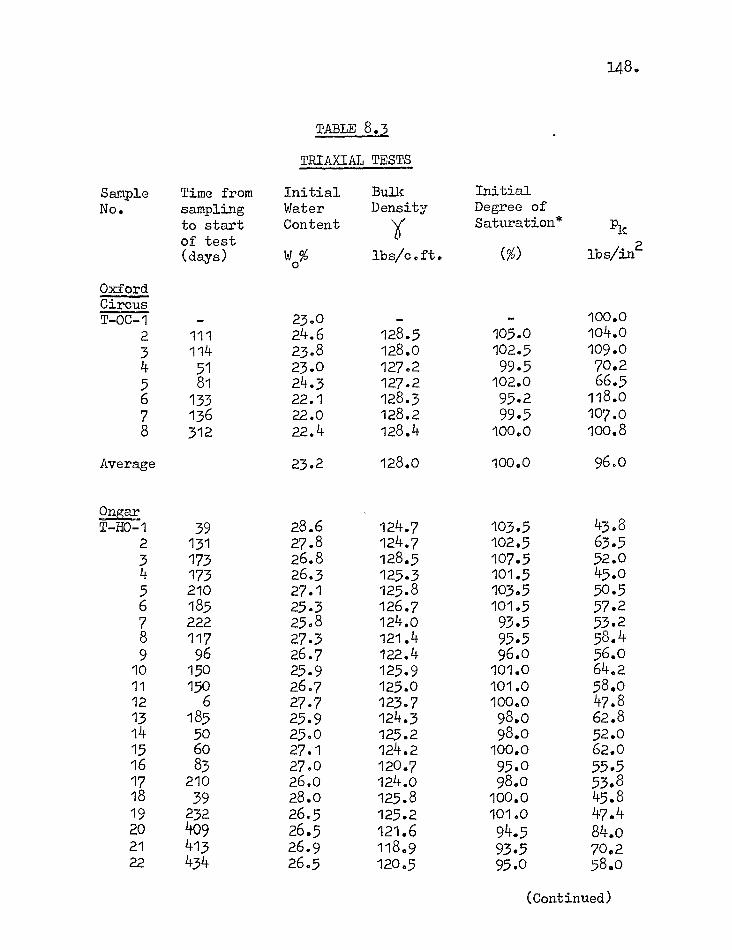
148.
TABLE 8.3
TRIAXIAL TESTS
Sample No.
Time from sampling to start of test (days)
Initial Water Content
Wo%
Bulk Density
i lbs/cat.
Initial Degree of Saturation*
(%)
Pk
lbs/in2
Oxford Circus T-OC-1 - 23.0 - 100.0
2 111 24.6 128.5 105.0 104.0 3 114 23.8 128.0 102.5 109.0 4 51 23.o 127.2 99.5 70.2 5 81 24.3 127.2 102.0 66.5 6 133 22.1 128.3 95.2 118.0 7 136 22.0 128.2 99.5 107.0 8 312 22.4 128.4 100.0 100.8
Average 23.2 128.0 100.0 96.0
Ongar T-H0-1 39 28.6 124.7 103.5 43.8
2 131 27.8 124.7 102.5 63.5 3 173 26.8 128.5 107.5 52.0 4 173 26.3 125.3 101.5 45.o 5 210 27.1 125.8 103.5 50.5 6 185 25.3 126.7 101.5 57.2 7 222 25.8 124.0 93.5 53.2 8 117 27.3 121.4 95.5 58.4 9 96 26.7 122.4 96.o 56.0 10 150 25.9 125.9 101.0 64.2 11 15o 26.7 125.0 101.0 58.o 12 6 27.7 123.7 100.0 47.8 13 185 25.9 124.3 98.0 62.8 14 5o 25.o 125.2 98.o 52.0 15 6o 27.1 124.2 100.o 62.o 16 83 27.o 120.7 95.o 55.5 17 210 26.0 124.0 98.o 53.8 18 39 28.o 125.8 100.0 45.8 19 232 26.5 125.2 101.0 47.4 20 409 26.5 121.6 94.5 84.o 21 413 26.9 118.9 93.5 70.2 22 434 26.5 120.5 95.0 58.o
(Continued)
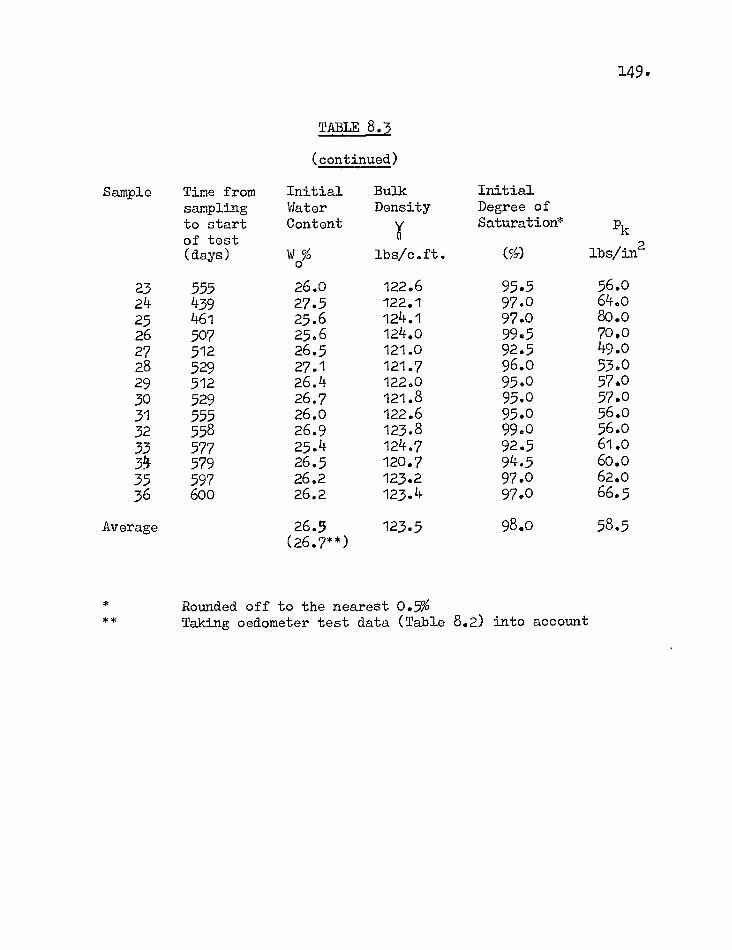
Sample Time from sampling to start of test (days)
TABLE 8.3
(continued)
Initial Bulk Water Density Content
" lbs/c.ft.
Initial Degree of Saturation*
(c/O lbs/in2
149.
Pk
23 555 26.o 122.6 95.5 56.o 24 439 27.5 122.1 97.0 64.o 25 461 25.6 124.1 97.o 80.0 26 507 25.6 124.0 99.5 70.0 27 512 26.5 121.0 92.5 49.o 28 529 27.1 121.7 96.0 53.0 29 512 26.4 122.0 95.0 57.o 3o 529 26.7 121.8 95.o 57.o 31 555 26.o 122.6 95.0 56.o 32 558 26.9 123.8 99.0 56.o 33 577 25.4 124.7 92.5 61.0 34 579 26.5 120.7 94.5 60.0 35 597 26.2 123.2 97.o 62.o 36 600 26.2 123.4 97.o 66.5
Average 26.5 123.5 98.0 58.5 (26.7**)
* Rounded off to the nearest 0.5% ** Taking oedometer test data (Table 8.2) into account
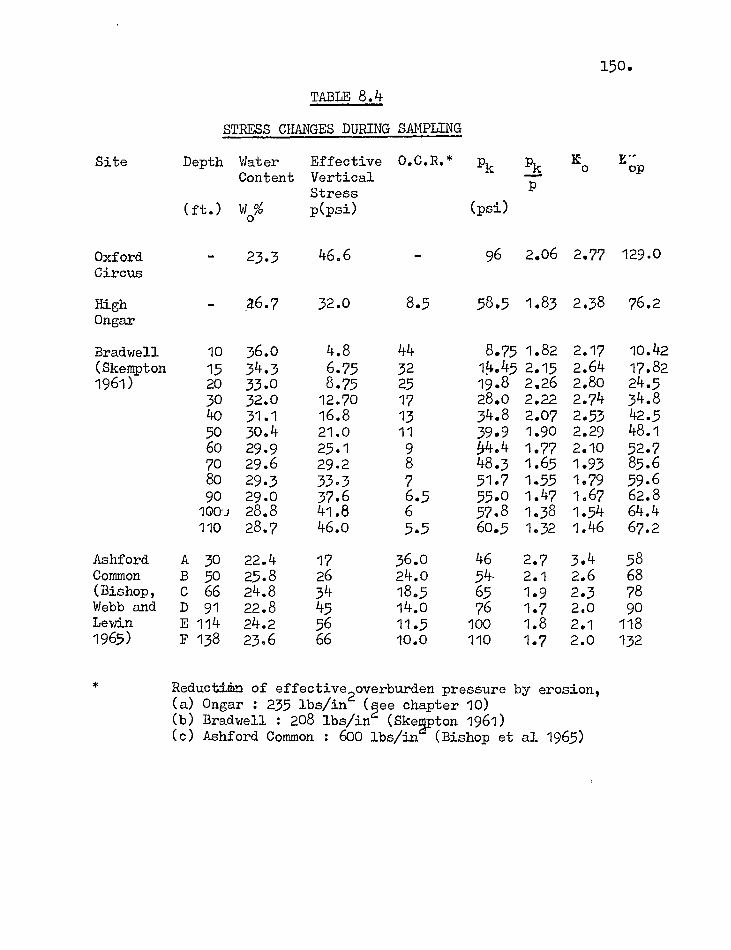
150. TABLE 8.4
STRESS CHANGES DURING SAMPLING
Site Depth Water Effective 0.C.R.* pk K- E Pk o op
Content Vertical Stress
(ft.) Wo% p(psi) (psi)
Oxford 23.3 46.6 96 2.06 2.77 129.0 Circus
High - a6.7 32.o 8.5 58.5 1.83 2.38 76.2 Ongar
Bradwell 10 36.0 4.8 44 8.75 1.82 2.17 10.42 (Skempton 15 34.3 6.75 32 14.45 2.15 2.64 17.82 1961) 20 33.0 8.75 25 19.8 2.26 2.80 24.5
30 32.0 12.70 17 2.22 2.74 34.8 40 31.1 16.8 1334.880 2.07 2.53 42.5 50 30.4 21.0 11 2.29 39.9
4 48.1
60 29.9 25.1 9 1.901 2.10 52.7
70 29.6 29.2 8 48.3 1.65 1.93 85.6 8o 29.3 33.3 7 51.7 1.55 1.79 59.6 90 29.o 37.6 6.5 55.o 1.47 1.67 62.8 100i 28.8 41.8 6 57.8 1.38 1.54 64.4 110 28.7 46.o 5.5 6o.5 1.32 1.46 67.2
Ashford A 30 22.4 17 36.0 46 2.7 3.4 58 Common B 50 25.8 26 24.0 54 2.1 2.6 68 (Bishop, C 66 24.8 34 18.5 65 1.9 2.3 78 Webb and D 91 22.8 45 14.0 76 1.7 2.0 90 Lewin E 114 24.2 56 11.5 100 1.8 2.1 118 1965) F 138 23.6 66 10.o 110 1.7 2.0 132
Reductithn of effective overburdenpressure by erosion, (a) Ongar : 235 lbs/in (ee chapter 10) (b) Bradwell : 208 lbs/in (Skepton 1961) (c) Ashford Common : 600 lbs/in (Bishop et al 1965)
*
151.
CHAPTER 9
EQUIPMENT AND PROCEDURES OF TESTING
9.1 Oedometer tests
9.1.1 Standard oedometer
The main series of one-dimensional consolidation tests,
were performed in standard 3" Bishop-type fiaped ring oedometers
(Fig. 9.1) which have been in use at Imperial College for more than
a decade. A specimen, 3" dia. x ,-.1" thick is held in a brass ring
between two porous stones and the pressure is applied to the upper
stone by placing dead weights on the hanger at the end of a lever-
arm. The settlement is measured relative to the base of the cell
- there is no lateral deformation - by a micrometer dial gauge.
The cutting edge of the ring itself was used to "push"
a specimen into the ring. A small block of the clay approximately
4" x 4" x 11." thick was cut out of the main sample with wire cutters.
The inside of the ring, which was greased with vaseline to reduce
side friction, was then placed on the block with its cutting edge
facing down and, using it as a guide, the clay was trimmed with a
sharp knife until it was just over 3" in diameter. The ring was
then gently and evenly pushed into the sample, the excess clay
being automatically trimmed by the cutting edge. Finally the
specimen was cut on both sides of the ring to its proper thick-
152.
ness.*
The specimen thus obtained was placed in the cell between
the lower and upper porous discs - this latter was fixed to the
loading plate - which were pre-saturated by soaking in water. Two
Whatman's No. 54 filter papers were placed between the sample and
the discs to prevent clogging of the clay into the porous stones.
The cell was then mounted into the loading frame and the lever-arm
balanced with the fine adjustment weight. The reading on the dial
gauge was noted.
A small pressure, usually 0.05 - 0.1 T/ft2 was applied and
the cell filled with water. Soon the sample started to swell. In
tests where this initial swelling was allowed, the sample was left
overnight to complete the process. The next and nominally each
subsequent day the pressure was raised in the sequence 0.1 -->0.5
-->1.0--2.0 (and to3..0T/ft2 for Oxford Circus only) allowing the
sample to consolidate under each load. The dial gauge was read
on the usual d t basis.
For the majority of the tests, however, the initial swell-
ing was prevented by successively adding small weights to allow no
Breaking up of the clay along fissures and joints during trimming and pushing of the ring was an ever recurring problem. Though every care was taken to keep this to a minimum and badly disintegrating samples were always discarded, it may not have been possible to eliminate completely the possibility of incomplete saturation in some cases.
153.
change in the dial gauge reading until equilibrium was reached. The
sample was left overnight under this "swelling" pressure (average
2 T/ft2 for Oxford Circus and 0.5 T/ft2 for Ongar). The following
day the Oxford Circus clay was raised straight from 2.0 --5.0 T/ft2
and the Ongar clay from 0.5---'fr1.0 p2.0 T/ft2 in two days:
The different periods of rest were then allowed according
to the Schedule given in Chapter 8. For long duration tests,
readings were taken daily during the first week, thereafter once
every week till the end of the rest period. After this the loads
were doubled every day until the full capacity of the machine was
reached. Cycles of unloading and loading then followed - all at
the usual pressure increment ratio of 1 or pressure reduction ratio
of i applied daily:* At the end of all tests, when the specimens
had completed the final swelling at zero pressure, they were re-
moved and their moisture contents were determined.
In test nos. 0-H0-12, 13 and 14 the "swelling" pressures
were obtained in the same way as described above, but instead of
loading the samples any further they were quickly removed from the
press. The water was first siphoned out of the cell, the pressure
released and the samples pushed out of the rings. Their water
contents were then measured.
*
pressures **
16 T/ft2.
3 T/ft2 and 2 T/ft2 being the in-situ effective overburden of the Oxford Circus and Ongar samples respectively.
First unloading in some tests was commenced at 12 or
154.
The slurry tests were performed on remoulded samples of
Ongar clay prepared from the air dried material mixed thoroughly
with freshly boiled distilled water to a consistency well above the
liquid limit.
9.1.2 High pressure (hydraulic) oedometer
(a) Description of the apparatus (Fig. 9.2)
The high pressure oedometer was designed to apply pressures
of up to 10,000 lbs/in2 on 4,1 dia. x 1" high soil.samples for one-
dimensional consolidation, though in the present investigation the
maximum pressure used was only 500 .
The oedometer essentially consists of a 6" I.D. x al"
thick x 1" deep mile steel annular ring sandwiched between a top
cap and a base, also made of mild steel. The sample is contained
in a stainless steel internal cell, 4" I.D. x 1" thick, which is
locked to the outer ring- by a circular key at the base. The cell
and the sample rest on a 6" dia. x 5" deep stainless steel "insert"
fitted into the mild steel base. There is a recess for a 4" dia.
xi" thick porous stone beneath the sample which communicates to
two drainage holes leading down to the bottom of the insert. The
volume change is measured by connecting one of these leads to a
5 c.c. reversible type volume gauge (Bishop and Donald 1961) in
conjunction with the self compensating mercury control to maintain
constant back pressure.
155.
The chamber inside the top cap serves to contain the
equipment and connections for measuring the pore water pressure and
deformation of the sample (see below). It is filled with water or
oil to transmit the pressure onto the sample through a membrane
which is sealed at the outer edge by pressing an 0-ring from a
stainless steel flange clamped to the top of the cell. The top
cap is held down to the base by 12 no. dia. holding-down bolts.
Pressures of up to 500 lbs/in2 have been applied through
a Klinger valve connected to the bottom of the top cap. Constant
pressures during consolidation were maintained with the extended
range self-compensating mercury control (Bishop and Henkel 1962).
(b) Equipment for measuring deformation
The settlement of the sample is measured over only a part
of its area. If, as is likely, the effect of friction between the
sample and the confining:xing is restricted to a zone near the
surface of contact, measurement over a small area at the centre
will be relatively free of this effect.
The settlement is given by the vertical displacement of
a 3" dia. stainless steel disc* which has a spigot at the centre.
The membrane with a hole in the middle is slid over from the top
and sealing is effected with an 0-ring pressed by a sleeve which is
clamped by screwing a nut to the spigot. Both the disc and the
Originally a 2" dia. disc was used to test the apparatus but later a 3" dia. disc was chosen to gain more room for the pore pressure connections.
156.
sleeve are sloped at the edge for smooth fitting of the membrane.
The settlement is measured by an inductive displacement
transducer type F.52 supplied by Boulton Paul Aircraft (Electronics)
Ltd. The armature of a transducer is screwed to the top of a
small column fitted at the centre of the spigot and is engaged into
the core which is held in a central position by means of a brass
"spider". The latter, in fact, is a three arm cross-head secured
at the ends on top of three studs screwed firmly into the insert.
At the centre of the "spider" is an adjustable transducer-holder to
which is screwed the core which can thus be held in a fixed position
relative to the movement of the disc and the armature.
The four connecting wires which are soldered to the core
of the transducer are led out of the top cap through a 5" long x
-" O.D. steel tube into which they are sealed by loctitet The tube
itself is fixed to the top cap by an i" Ermeto stud coupling.
The actual settlement readings are taken by connecting
the transducer leads through a Plessey Mk.IV 6-way plug to a B.P.A.
transducer meter type C.61. This is a 5-decade null balance in-
strument which enables the output of an A.C-energized bridge to be
measured. The meter has a normal bridge energising supply of 5v,
200 mA at 1 Kc/s and the decade switches, when adjusted for zero
meter deflectionm indicate the magnitude of the out of balance
All+•••-•••1ill
This is done by passing the leads through the tubing placed in a horizontal position and filling it with loctite.
157.
signal. At the high sensitivity range a minimum armature dis-
placement of 1 x 106 in. can be measured. For overnight record-
ing a speedometer H Automatic Recorder connected to the C.61
meter has been used.
The calibration of the transducer type F.52, serial no.
229, used in the present series of experiments was supplied by
Boulton Paul Aircraft Ltd. At a scale factor setting 100/0.0.0.
the meter reading directly gave the displacement in micro-inches.
(c) Measurement of pore water pressure
The dissipation of pore water pressure during consolida-
tion is measured at the top of the sample as shown in fig. 9.2.
The small porous stone, i" dia. x i" thick, recessed into the
bottom of the settlement - measuring disc communicates to an
0.D. copper tubing extending over the entire hole in the spigot
where it is sealed with loctite. A straight coupling connects
the other end of the double bend to an ill saran which is made into
a spiral inside the chamber to allow free movement of the disc
with settlement of the sample. The saran tubing is taken out of
the top cap through another hole and a drilled stud coupling pro-
vides the sealing. Outside the oedometer a standard null indicator
is connected to the saran through a Klinger valve.
(d) Procedure of testing
With the oedometer dissembled, the drainage connections
at the base were de-aired by flushing water and a porous stone,
158•
previously saturated with boiling water, was placed in position.
The measuring disc which had already been fitted with the copper
tube and a porous stone at its base was then assembled with the
membrane and connected to the saran while the top cap was sus-
pended from the lifting crane. Water was then flushed through
the tubing and the porous stone until all the air was driven out
of the system.
To place an undisturbed sample into the cell, a specimen
was first trimmed into a cutting ring, 4" I.D. x li" high, in ex-
actly the same way as described in the previous section for the 3"
standard oedometer, and then pushed into the cell with the aid of
two perspex guide discs as shown in Fig. 9.3. It was finally
made flush with the top and bottom of the cell.
The ring and the cell containing the sample were placed
on the base of the oedometer, with a saturated Whatman's no. 54
filter paper separating the soil from the porous stone, and screwed
in position with six Allen keys. The measuring disc was then
placed on top of the sample and the spider with the central trans-
ducer core, previously adjusted to give suitable meter readings to
allow for maximum settlement of the sample; was engaged to the arm-
ature of the transducer and finally secured on top of the studs.
This automatically ensured a central position for the measuring disc.
This was done by having a trial run with a steel "dummy" sample which was, in any case, necessary to check the electrical connections.
159.
The space between the membrane and the sample was then de-aired
by flushing a little water through the porous stone and spreading
it outwards. The flange was lowered in position and sealing was
effected by clamping it to the cell with six screws. Final ad-
justment of the meter reading was made by adjusting the transducer-
holder.
The top cap was slowly lowered with the help of three
guide pins bolted into the base of the oedometer. When it was in
position the guide pins were removed and the cap was secured to the
base by the holding down bolts. A complete layout of the apparatus
is shown in Fig. 9.4.
The chamber was then filled with water through connection
at the side, at the same time keeping a check on the transducer
reading so it did not show any undue fluctuations. After sealing
the bleeding valve a pressure of 15 lbs/in2 was applied keeping both
the drainage valve and the pore pressure connection closed. The
sample was left under this pressure overnight, during which a small
deformation occurred, possibly due to the solution of any air that
might still be present.
The following morning the pressure was raised to 30 lbs/in2
and a back pressure of 15 lbs/in2 applied. After the sample had
fully consolidated the effective stresses were increased, in steps,
to their maximum values and then reduced, according to the schedule
given below:
160.
Test No. Loading Schedule (lbs/in2)
HEO/H0/1 ) 15 - 30 - 60 - 120 - 240 - 360 - 485 - & )
HP0/H0/2 ) 360 - 240 - 120 - 60 - 30 - 15 - 0
(Back pressure during consolidation was always 15 lbs/in2)
The following procedure was adopted for each loading
stage:
When consolidation was complete under any effective
stress, indicated by the measured pore pressure of 15 lbs/in2, both
the drainage and pore pressure connections were closed and the cell
pressure was raised to the desired value (i.e. the pressure in-
dicated above plus 15 lbs/in2). Usually it took considerable
time for the pore pressure to reach its peak and at least 12 hours,
often more, had to be allowed for equalisation, before a response
of 90 - 100% could be achi:eved! Very little deformation occurred
during this operation.
Consolidation was begun by opening the drainage valve to
the volume gauge. During the early stages when consolidation pro-
gressed rapidly, readings of pore pressure and volume gauge were
taken on a t basis while the settlement was recorded automatically
on the speedometer H recorder. The latter was afterwards dis-
connected and the transducer read directly on the C.61 meter.
--------- * For a detailed discussion on the response time of the pore pressure measuring device, see Chapter 10.
161.
It took normally between 24 and 48 hours for full con-
solidation to take place. The samples were left at least until
the pore pressure .equalled the back pressure before the next in-
crement was applied.
At the end of each test when the specimen had finally
swelled under zero effective stress the chamber was emptied, the
top cap lifted, the water arm m rcury siphoned out, the flange
unscrewed and the measuring disc removed. The sample was then
pushed out of the ring and its final moisture content determined.
9.1.3 Controlled rate of strain oedometer
This oedometer has been used to study the compressibility
of London Clay at slow (strain-controlled) rates of loading and its
behaviour under very high effective stresses.
(a) Description
The oedometer (Fig. 9.5) is built almost entirely of
brass and is designed to withstand pressures of up to 10,000 lbs/i2
The sample, 3" dia. x i" high is confined in a stainless steel ring
1" thick* and rests on a brass base with an arrangement for measur-
ing pore water pressure. The ring is clamped to the base by means
of a brass flange and six studs, and sealed at both top and bottom
by 0-rings. The load is applied through a thick top cap at the
After the first two tests the inside of the ring was found to be slightly scored by the soil and was replaced by a thin brass inner ring inserted into the outer stainless steel.
162.
base of which is recessed a a" porous stone communicated through
drainage channels to the outside water, thus keeping the sample
submerged. Two dial gauges screwed diametrically opposite to an
annular plate sitting on the top cap measure the settlement. The
entire assembly sits on the pedestal of the 50 T loading machine
which can be selected to apply the load at a predetermined rate of
strain. The load on the sample is measured by a 25 T load cell
placed between the head of the machine and a steel spacer sitting
on the top cap.
(b) Calibration of load cell
The load cell was an N.C.B./M.R.E. Type supplied by
W. H. Mayes & Sons (Windsor) Ltd. A total of 16 electrical res-
istance strain gauges incorporated within the cell are connected
through a Plessey Mk.IV 6-way plug to a C.61 transducer meter
(described in section 9.1.2(b)) to measure the strain of a loaded
cylinder.
The load cell was calibrated in an Amsler 35 T Universal
testing machine. A number of loading and unloading cycles showed
negligible zero shift and little hysteresis. A sensibly linear
relationship between load and meter reading was obtained (Fig. 9.6)
(c) Procedure of testing
Two Klinger valves were connected to the outlets from
the base of the oedometer, to one of which was attached a standard
null indicator. De-aired water was flushed through the system and
163.
after closing the flushing valve, a saturated porous stone, li"
dia. x thick, was placed in the recess provided in the base.
The method of preparing a sample was similar to that for
the High Pressure oedometer described above (see Fig. 9.3). A
specimen was first trimmed into a cutting ring (3" I.D) and then
pushed into the testing ring with the help of perspex guides. Two
saturated Whatman's No. 54 filter papers were placed on top and
bottom of the sample which was then placed in position on the base
and clamped with the flange and studs. The centering of the
sample was thus automatically achieved. The top cap containing
the saturated drainage stone was lowered onto the sample and the
annular plate with the dial gauges was positioned from the top.
The spacerand the load cell were located and the pedestal of the
machine was raised to bring the assembly into contact with the head
of the machine. After adjusting the gear boxes to give the des-
ired rate of loading the test was started. Soon after, water was
poured to submerge the sample. A photograph of a test in progress
is shown in Fig. 9.7.
The rate of strain was so chosen as to produce negligible
pore pressure at the base of the sample which was measured through-
out each test to ensure that this was in fact the case. However,
this had to be achieved by trial and error. At the start of the
first test (CRO/H0/1) a rate of movement of the pedestal of
0.00004 in/min was selected, giving a rate of strain of .0045% per
164.
minute. A maximum pore pressure of 3% of the total vertical
stress was recorded after two days as a result of which the rate
was successively reduced to 0.000025 and .00001 in. per min. giving
a final rate of strain of approximately 0.0012% per min. at which
the maximum pore pressure was 1.5% of the vertical stress. For
subsequent tests a constant pedestal velocity of 0.00002 in/min
was found satisfactory, giving a rate of strain of approximately
0.0025% min. At this rate the pore pressure at the base never
exceeded 2% of the vertical stress* which was accepted as the upper
limit.
In all, 4 tests were performed on the London Clay, two
from Ongar and two from Wraysbury!* Except for the second Ongar
test (CRA/H0/2) all the others were loaded to maximum stresses of
about 450 T/ft2 (7,000 lbs/in2) followed by unloading at the same
rate. Test No. CRA/H0/2 had two cycles of loading and unloading,
the first one to a pressure of 160 T/ft2 (3,000 lbs/in2) and the
, second one to the maximum of 450 T/ft2 (7,000 lbs/in2 ).
9.1.4 Oedometers fitted with strain gauges
In order to determine the complete stress-paths for
standard oedometer consolidation special tests were performed on
Over most of the * * A detailed study bury clay has been made by
range, however, it was considerably less.
of the undrained strength of the Wrays-Agarwal (1967).
165.
the Ongar clay in oedometer rings (3" dia. x 1" high) with strain
gauges fitted on the outside. Three different ring thicknesses
1 1' and $") were adopted ( d Tr) and one test was performed with each. '32llt 16
(a) Description
The rings were all made of brass and cut out of 3" I.D.
tubes. The thicknesses were uniform and there was not cutting
edge.
The strain gauges used were of the type PLS -10 supplied
by Tokyo Sokki Kenkyujo Co. Ltd. Each gauge consisted of a grid of
resistance wire supported on a base impregnated with polyester resin
and was of nominal gauge length 10 mm,-nominal gauge width 1.5 mm,
nominal resistance 120 - 0.3 gauge factor 2.07 and base
dimension 25 x 4 mm. The gauge factor was checked by Phukan (1968)
and was found to be sensibly constant at the manufacturer's value
of 2.07.
Each ring was mounted with four transverse gauges, as
shown in Fig. 9.8. A full bridge circuit was completed with four
auxiliary gauges mounted on a "dummy" ring to compensate for
variations of temperature. The four leads from the circuit were
connected to a Plessey Mk. IV 6-way plug and readings were taken on
a transducer meter Type C.61 described in section 9.1.2(b).
The mounting of the gauges needed particular care. The
location for a gauge on the ring was first polished with emery
paper and cleaned with acetone. A thin coat of a mixture of P-2
166.
and PS adhesives was applied to the face of the gauge and to the
ring. The gauge was then placed and covered with sheet teflon and
a uniform clamping pressure was applied by suspending a small weight
at the end of a ring of polythene sheet covering the gauge. The
adhesive was allowed to cure for at least 2 hours. Waterproofing
was achieved by applying Gagekote 4%5, a two-component rubber line
epoxy resin, supplied by Welwyn Electric Ltd., on the gauges and
their connections. As an extra precaution, when all the connections
were made, the entire ring was covered with "Glasticord" waterproof-
ing tape, supplied by Kelseal Ltd.
To check the effectiveness of the waterproofing both the
test and the compensating rings were immersed in water and readings
were taken over a period of 3 - 1+ days. Practically no fluctuations
were noticed.
(b) Calibration of oedometers
Each oedometer ring, connected in full bridge circuit, was
calibrated with water pressure as shown in Fig. 9,9. Essentially,
the ring was sealed at both ends by 0-rings fitted on two end plates
which were bolted together. The pressure was applied from a
Budenberg dead-weight calibrator, in steps, to a maximum of 500
lbs/in2 and the corresponding readings were taken on the meter. A
number of loading and unloading cycles were performed. Each time
the difference between the initial and final zero readings was small
and there was little hysteresis. The average calibration data for
167.
all the rings are shown in Figs. 9.10, 9.12 and 9.13. It can be
seen that linear relationships existed between pressure and the
meter readings.
At the end of each test the ring was re-calibrated. As
the charts show there was no significant difference between the
before- and after-test calibrations for any ring,
(c) Procedure of testing
At the beginning of each test a reading on the meter was
taken with both the active and compensating rings under water and
this was taken as the zero reading. They were then temporarily
removed to place the specimen into the test ring.
The sample was prepared in exactly the same way as des-
cribed for the controlled rate of strain tests. The specimen was
mounted on the standard 3" Bishop type oedometer press and a small
load was applied. Both the test ring and the compensating ring
were then submerged in water, the latter in a separate bowl, and
the sample was prevented from swelling by successively adding small
weights. When equilibrium was reached the meter was recorded and
the sample was left overnight, during which little change occurred.
Subsequently the procedure for a standard oedometer test was
followed, doubling the pressure every day as described in section
9.1.1. Both the settlement and meter readings were taken on the
JT basis. Records of temperature were kept throughout each test
which showed a normal variation between 18°C and 21°C and there was
168.
usually i.°C difference between the test and the compensating rings.
The final zero reading at the end of each test, when the sample was
taken out of the ring, was compared with the initial readings and
the difference was found to be small.
9.2 Triaxial tests
(a) General
All the triaxial tests were performed in a new batch of
1.1" standard triaxial cells, described by Bishop and Henkel (1962).
The cells were all fitted with rotating bushings to minimise ram
friction and there were arrangements in the base for outlet of the
leads from drainage connection to the top of samples. Constant
cell pressure was maintained with self-compensating mercury control
(range 0 - 150 lbs/in) and the axial stress was applied at controlled
rate of strain by a loading system consisting of a screw jack
operated by an electric motor and gear box which could be adjusted
to give a wide range of strain rates. The load was measured by
7" O.D. high tensile steel proving rings (capacity 300 lbs) which
were calibrated from time to.time with the Budenburg dead-weight
calibrator.
(b) Measurement of pore water pressures
The pore pressures of all samples were measured at the
base by the standard Perspex null indicators (Bishop and Henkel,
(1962)). When properly de-aired these null indicators have a low
169.
volume factor (1.0 x 10⁻⁶ cu.in per lb/in
2 ). The null balance of
the water mercury surface was observed with a low - power cathe-
tometer.
(c) Measurement of volume change
One of the features of the triaxial testing on undisturbed
specimens of Lohdon clay was the measurement of small volume changes
during consolidation or drained compression. Often total volume
changes of the order of 1 c.c. had to be measured over a number of
days. The correct determination of the consolidation properties
from time vs. volumetric strain characteristics, therefore, called
for the accurate measurement of the volume of water expelled by a
specimen. The standard 5 c.c. volume gauges used for the early
tests on the Oxford Circus clay were not found satisfactory and the
following method was used for the Ongar tests.
In essence, the volume gauge was replaced by an in O.D.
Saran tubing connected between the sample and the back pressure
control and clamped horizontally on the bench against a yard scale
(Fig. 9.13). A length of air bubble was introduced in the other-
wise water-filled tubing and its movement gave a measure of the .
amount of water coming out of a specimen. The tubing was calibrated
in two ways:
(i) connecting the saran to a 5 c.c. volume gauge and measur-
ing the displacements of the air bubble for known changes of volume
and
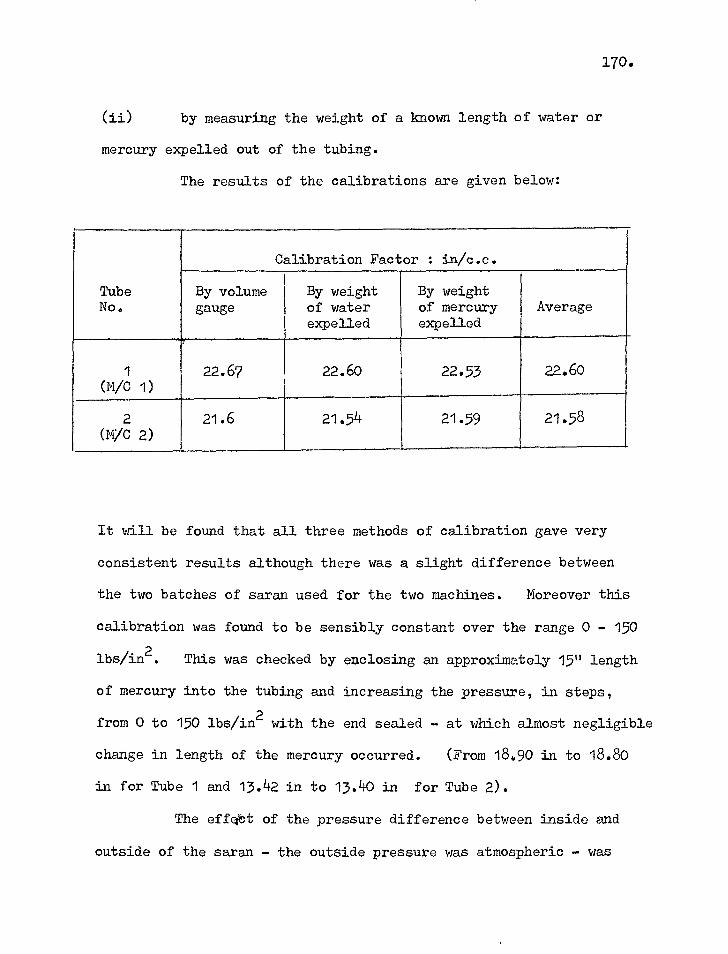
170.
(ii) by measuring the weight of a known length of water or
mercury expelled out of the tubing.
The results of the calibrations are given below:
Tube No.
Calibration Factor : in/c.c.
By volume gauge
By weight of water expelled
By weight of mercury expelled
Average
1 (M/C 1)
22.67 22.60 22.53 22.60
2 (M/C 2)
21.6 21.54 21.59 21.58
It will be found that all three methods of calibration gave very
consistent results although there was a slight difference between
the two batches of saran used for the two machines. Moreover this
calibration was found to be sensibly constant over the range 0 - 150
lbs/in2. This was checked by enclosing an approximately 15" length
of mercury into the tubing and increasing the pressure, in steps,
from 0 to 150 lbs/in2 with the end sealed - at which almost negligible
change in length of the mercury occurred. (From 18.90 in to 18.80
in for Tube 1 and 13.42 in to 13.40 in for Tube 2).
The effett of the pressure difference between inside and
outside of the saran - the outside pressure was atmospheric - was
171.
considered insignificant because of the above observation. Also,
the back pressure being typically as low as between 15 and 30
lbs/in2 the pressure gradient was never too great to cause any
significant loss of water by diffusion.
By adopting the system of measuring volume change as
described above a high degree of accuracy - a displacement of 0.02
in of the air bubble was equivalent to volume change of only 1 mm3
- was achieved.
(d) Application of extension load
The triaxial tests of Types A2, A3 and D necessitated
the application of upward forces to the top caps. A loading frame,
consisting of two beams and tie rods was used to pill the ram, the
load being measured by the compression proving ring placed on top
of the testing machine as shown in Fig. 9.14. The ram was passed
through a hole at the centre of the lower beam, the upward force
being applied to the dial gauge holder pinned to the top of the
ram.
Inside the cell, a special stainless steel rod with a
horizontal pin was screwed to the other end of the ram. The top
cap had a vertical slot to receive the pin and two diametrically
opposite horizontal grooves into which the pin was engaged by
rotating the ram through 900 before an extension test was due to
start.
172.
(e) Drainage connections
In the early consolidation tests the specimens were
drained from the base only but later, to minimise the duration of
a test, drainage from both ends was effected. The top drainage
lead, sealed to the loading cap by loctite, was made into a spiral
round the sample. Outside the cell this was connected, together
with the base drainage lead, to the saran volume gauge through two
Klinger valves and a T-joint, thus allowing both the top and bottom
of the sample to be maintained at the same back pressure.
(f) Leakage
The average duration of a test being of the order of 3
weeks, it was necessary to ensure that leakage of water into the
sample through the rubber membrane would not cause any appreciable
change in effective stresses. Also if there was excessive leakage
through valves and connections measurements of volume change would
be in error. Poulos (1964) made an extensive investigation into
the problems -of leakage in triaxial tests and concluded that for
long duration tests special precautions might be necessary.
Leakage of cell water through rubber membranes may occur
due to
(i) the hydraulic pressure gradient between two sides of a
membrane and
(ii) the osmotic pressure difference caused by the different
salt concentrations of the water in the cell and in the sample.
173.
No direct investigation was carried out to determine the
extent of leakage due to each of the above causes. However, in
order to estimate the amount of leakage that would cause appreciable
changes in effective stresses the initial swelling ratio of the
Ongar clay, as defined by Poulos (1964), was determined, (For
details see Appendix D). The results showed that for a typical
test lasting 30 days, in order that the change of effective stresses
was not to exceed 2%, the maximum permissible rate of leakage would
be 5.3 mm3/day while a rough estimate of leakage through a 0.016"
thick Membrane .(used in the present series of tests), based on
Poulos' results, yielded a rate of only 1.67 mm3/day (see Appendix
D). So a membrane which was properly checked for holes and
punctures prior to a test would be capable of preventing excessive
leakage.
Another possible source of error in the measurement of
) volume change was leakage through connections and creep of the
saran tubing. To determine the magnitude of this error a special
test was run which showed that the maximum error from these sources
alone would be no more than 2% of the measured volume change (see
Appendix D). Since it was not possible to eliminate entirely these
leakages an error of 2% was considered an acceptable upper limit.
The measured volume changes of all the consolidation and
drained triaxial tests were checked with the changes in weight of
the samples determined at the end of each test. The results are
174.
summarised in 74. 9.17. It can be seen that the average ratio of
the two measurements in 0.96 which can be considered satisfactory.
(g) Procedure of testing
All specimens were prepared in the N.G.I. type soil lathe.
A prism, approximately 2" x 2" x 4" in size was cut out of a main
block and clamped in the lathe between two end plattens which could
be rotated while a series of thin slices were trimmed with a fine
wire saw, the two walls of the frame acting as guides to give the
sample its final diameter of 14". Initial moisture contents were
determined on pairings. The specimen was then reduced to its
nominal length by holding it in a q" I.D. x 3" long split mould
and trimming the ends. The weight and final dimensions of the
specimen were recorded.
Prior to preparation of a sample, all connections to the
triaxial cell were thoroughly de-aired. Flushing air-free water
was usually enough and when properly de-aired a null indicator would
show only a slight movement under a pressure of 150 lbs/in2. All
drainage connections were also de-aired and an air bubble introduced
into the saran volume gauge!
A little water was allowed to flow to the top of the
pedestal by driving the air bubble to near the drainage valve thus
giving it the maximum travel. A saturated porous disc was slid on
In fact, a bubble once introduced into the saran could be used for a'number of successive tests.
175.
the top of the pedestal and covered by a Whatman's no. 54 filter
paper. The bottom of the sample was smeared with a drop of water
and placed on the porous disc. Another filter paper and a porous
stone were placed on top of the sample, which had also been smeared
with a drop of water. A rubber membrane, previously checked for
holes and punctures, was placed to cover the sample, and the top
loading cap brought into position: The membrane was sealed to the
pedestal with 2 or 3 0-rings. To remove air from between the
sample and the membrane, the latter was gently stroked upwards, and
finally sealed to the top cap with 2 or 3 more 0-rings.
The cell was assembled and filled with de-aired water with
about 1" of castor oil on top. The proving ring was placed in
position. A cell pressure higher than the initial suction was then
applied (60 or 70 lbs/in2 for Ongar) keeping ali-drainage valves
closed.
Initially a fairly high pore pressure (20 - 30 lbs/in2)
was measured (because the base of the specimen was already smeared)
but it soon began to drop until equilibrium was reached. This
usually took about 24 hours but often 48 hours or more were allowed.
The effective stresses of the samples (cell pressure minus the
equilibrium pore pressure) at the end of this stage were taken as
the post-sampling effective stresses pk (Chapter 8).
A3 and D. Special extension caps were used for test types A2,
176.
The cell pressures were then increased in small steps to
the desired value (each step lasting one or two days) allowing the
pore pressure to come to equilibrium under each increment.
values of almost 1.0 were usually measured which indicated that the
samples were fully saturated. The build-up of pore pressures with
increase of cell pressure in test nos. qTAH10-18.J and 9 are shown in
Figs. 9.17 and 9.18.
The following procedures were then followed for the
different types of tests.
Type Al
The specimen was loaded axially, undrained, until failure.
For accurate measurement of pore pressure during shear very slow rates
of strain (approximately 0.0004% per minute) were chosen (Bishop
and Henkel 1962) such that failure was reached in 8 - 10 days.
Pore pressures were measured throughout each test.
Type A2
Axial extension was applied, undrained, until failure was
reached. The loading frame was assembled as shown in Fig. 9.14.
The base of the cell was clamped to the screw jack which was then
set to travel downward at a rate of strain of about 0.0004% per
minute, giving a time to failure of about 8 - 10 days. Pore
pressures were measured throughout, about 3 or 4 times a day.
Zree_i_12
Early stages of these tests were similar to the A2 tests
177.
except that the extension was stopped at some desired effective
stress ratio (= c 0.55) and reloading then followed. This (711
was done simply by reversing the direction of travel of the screw
jack. When isotropic stress conditions were re-established, the
extension frame was dismantled leaving the lower beam on top of the
cell and the proving ring was brought back to its usual position.
Axial compression was then applied until failure, as in the Al tests.
Pore pressure was measured throughout.
Type B1
The consolidation tests of the types B1 and B2 did not
involve any axial compression. Once the pre-determined cell
pressure was reached and the equilibrium pore pressure measured the
samples were consolidated against a back pressure. Before opening
the drainage valve, however, the air bubble in the saran volume
gauge was allowed to come to equilibrium under the back pressure
for at least 30 minutes. The top cap was brought into contact
with the ram and drainage was started by opening the drainage valves.
The displacement of the air bubble was measured by the attached yard
scale while axial deformation was measured by the dial gauge. As
the sample consolidated the loading platform was raised by turning
the handwheel to maintain a constant reading on the proving ring
- at a value slightly higher then the initial reading in order to
ensure that the ram was always in contact with the sample. By the
evening, the rate of consolidation was sufficiently slow, and a smsll
178.
extra axial load was applied by raising the screw jack to ensure
that with overnight deformation the sample would remain in contact
with the ram. During the following days only occasional adjust-
ment was necessary.
Type B2
Exactly the same procedure as the B1 tests was followed
except that the cell pressure was also reduced at a steady rate to
simulate conditions in the field where the lateral pressure during
consolidation decreases due to the drop in Poisson's ratio. The
steady decrease of cell pressure was achieved by continuously
lowering the upper mercuty pot of the self-compensating mercury
control with the help of a motor and gear arrangement which could
be selected to give various rates of decrease. For a typical test
lasting 4 - 5 days, the cell pressure was decreased during the
first two days only - at a faster rate during the first few hours
of consolidation followed by a slower rate - and held constant
afterwardst To compensate for the loss of axial stress due to
the reduction of cell pressure the screw jack was regularly ad-
justed and the corresponding axial load was applied through the
proving ring.
Type C1
Both the cell pressure and the axial stress were in-
* To reproduce field conditions properly the rate of de-crease should strictly follow the average rate of consolidation.
179.
creased under undrained conditions, the latter at a rate of strain
of 0.0004% per minute, as in the Al tests and pore water pressures
were measured. When the desired effective stress ratio was
reached, loading was stopped and the sample was consolidated against
a back pressure (usually between 15 - 25 lbs/in2). Both the axial
and volumetric strains were measured, the constant axial stress
being maintained in the same way as described for the B1 tests.
Type C2
The undrained loading stage was similar to the Cl tests
while during consolidation the lateral stress was decreased as
described for the B2 tests. Both the axial and volumetric strains
were measured during consolidation, which took place against a
back pressure.
Type D
The initial undrained extension and compression stages
were followed in the same way as described for the A3 tests except
that the loading was stopped at some pre-determined stress-ratio,
before failure was reached. The specimen was then consolidated
against a back pressure, as for the Cl tests, during which both
axial and volumetric strains were measured.
Type E
After a sample was set up with all drainage valves closed,
the cell pressures applied and the equilibrium pore pressures
measured, both the cell pressure and axial stresses were increased
180.
under fully drained conditions at very slow rates such that no ex-
cess pore pressures developed. The rate of increase of the cell
pressure was so chosen as to give a constant stress increment ratio.
Test no. T-H0-31 had three stages with three different stress in-
crement ratios before, in the fourth and final stage, it was loaded
to failure as a conventional drained test. Test no. T-110-32 had
only one stage with constant stress increment ratio before it was
sheared to failure by axial compression. Test no. T-H0-33 was
similar to T-HO-32 except that the shearing stages were preceded
by isotropic consolidation against a back pressure.
Type F
These were conventional unconsolidated or consolidated
drained compression tests against back pressures. The rates'of
axial strain were so chosen (0.0004% per minute) as to produce
negligible excess pore water pressuring during shearing. A
typical sample failed in 8 - 10 days.
At the end of each test the specimen was removed as
quickly as possible from the triaxial cell and its final weight
measured. The difference between the initial and final weights
was then compared with the measured volume change. It can be seen
from Fie4.907that the agreement was, on the whole, good with the
average ratio of the two measurements equal to 0.96.
181.
CHAPTER 10
RESULTS OF OEDOMETER TESTS
10.1 Tests in the standard oedometer
10.1.1 Determination of swelling -pressure with standard oedometers
The swelling pressures: of the London clay from Oxford Circus
and Ongar, as determined from the initial stages of the standard
oedometer tests, were approximately 2.0 T/ft2 and 0.5 Tifft2
respectively. It was, however, difficult to maintain the dial
gauge readings absolutely constant during the determination of the
swelling pressures and deformations of between - 0.0002 in and
- 0.0014 in were observed. To get a more accurate measure of the
swelling pressure, therefore, the dial readings have been plotted
against vertical stresses in the vicinity of the swelling pressure
for all tests including those where swelling was permitted (curves
1 in Figs. 10.1 and 10.2) from which the swelling pressures corres-
ponding to zero change of height have been interpolated. The values
of swelling pressure thus obtained•for Oxford Circus and Ongar are
1.7 T/ft2 (26.5 p.s.i.) and 0.45 T/ft2 (74.s.i.) respectively. In
table 10.1 these values are compared with the initial suction
measured in triaxial tests and reported in chapter 8. It can be
seen that the swelling pressures measured in the standard oedometer
are too low, being only —288(.12 of the corresponding suctions
measured in the triaxial tests.
182.
In order to find an explanation for such discrepancies
three special tests (Nos. T-HO -12, 13 and 14) were performed where
the samples were removed from the oedometer press at the and of the
"swelling" tests and their height, weight and water contents deter,-
mined. These results are summarised in Table 10.2. It can be
seen that even though the dial gauges showed an average settlement
of 0.0005 in.the specimens had, in fact, swelled 0.0180 in and
gained 2.28 gms. in weight resulting in an increase in water content
from 27.1% to 29.4%. So, far from remaining at constant volume the
samples actually sucked in water thus giving considerably smaller
values of the swelling pressure.
Possible reasons for this could be:
(a) degree of saturation of the specimens less than 100%
(b) deformation of the loading platform and
(c) bedding error at points of contact between the sample and
the porous stones and between different parts of the apparatus itself.
It is true that the average degree of saturation of the
specimens before test was 97.5% which rose to almost 100% after the
tests were complete. This would account for an increase in weight
of less than 1 gm and no change in height. So the actual increase
in weight of 2.28 gm and considerable increase in thickness must be
attributed to causes (b) and (c) above.
Toms (1966) observed from loading tests with steel
"samples" that the oedometers used in the Chief Engineer's laboratory
183.
of the Southern Railways showed considerable elastic and inelastic
deformation. In order to determine the magnitude of such deforma-
tion of the oedometers used in the present investigation, these were
calibrated with steel "dummy" samples set up in exactly the same way
as in actual tests. The results are shown in Fig. 10.3.
Large inelastic deformations and hysteresis are observed
for all three frames. The measured deformations consist of the
elastic deflection of the loading platform which supports the con-
solidation cell and is held by two nuts screwed to the tie rods at
the end and bedding error at points of contact between different
parts of the apparatus. This latter error which is not wholly
recoverable is, perhaps, the cause of the hysteresis.
An approximate calculation* showed that the elastic de-
flection of the loading plate alone could be 0.0030 in.for the
maximum pressure of 32 T/ft2 i.e. 0.0001 in.per T/ft2. But the
total deformation of each frame was 0.0130 in. indicating that the
remaining 0.0100 in must have been due to inadequate bedding at the
various contant points, e.g. between the screw jack and the re-
action, between the plunger and the nose of the loading cap, and
between the "sample" and the porous stones.
However, even applying all these corrections for the
corresponding stresses, from Fig. 10.3, the swelling pressures as
Assuming that the plate behaved as an elastic beam, simply supported at its ends.
184.
determined from curves 2 in Figs. 10.1 and 10.2 are 2.4 T/ft2 and
0.5 T/ft2 for Oxford Circus and Ongar respectively which are still
considerably lower than the triaxial measurements. These dis-
crepancies which are due to increase in height of the samples un-
accounted for by the deformation of the apparatus must be the con-
sequence of inadequate contact between the sample and the porous
stones and perhaps between the sample and the confining ring.
This increase in height of a sample during the determina-
tion of the swelling pressure has a marked influence on the later
consolidation characteristics as will be subsequently demonstrated.
10.1.2 Time - settlement relationships
The time - settlement diagrams for some of the consolida-
tion stages with pressure increment ratio of 1 are given in Appendix
E. It will be seen that the initial deformations just after load
application are quite large. For each curve three values of zero
reading are shown, obtained as follows:
(a) Initial reading on the dial gauge before pressure incre-
ment
(b) Zero reading corrected only for apparatus deformation -
as from Fig. 10.3, and
(c) Zero reading obtained by Casagrande construction (Taylor
1948), from the shape of the early portion of the curve.
It is obvious that for most curves the corrected readings
185.
(b) and (c) do not coincide. This indicates that deformation of
the apparatus alone cannot account for the large initial deforma-
tion and that inaccurate bedding and, perhaps, the effect of the
shock loading may be important. The amount of discrepancy
between the two readings may be judged from Figs. 10.4 and 10.5 in
which the ratio of the settlements calculated on the basis of the
two zero readings (b) and (c), (hereafter referred to as Method 1
and Method 2 respectively), are plotted against pressure. It is
clear that on first loading the difference between the two methods
is considerable at lower pressure (40% at 2T/ft) but decreases at
higher pressures (10% at 32 T/ft2). On reloading, however, method
1 is, on average, only 5% greater than method 2 over the entire
stress range. This shows that inadequate bedding, is primarily
responsible for the initial deformation. At higher pressures on
first loading and during the second loading when the bedding error
has largely been eliminated the two methods give almost the same
settlement.
10.1.3 Pressure - void ratio relationships
The pressure - void ratio relationships for all the
standard oedometer tests have been calculated from settlements
obtained by methods 1 and 2 described above, but for reasons stated
in the preceding section, method 1 is not believed to give the true
consolidation settlement and, therefore, the e vs log p diagrams
186.
obtained by method 2 only are shown in Figs. 10.6 - 10.14. For all
tests, the void ratios have been calculated, working backwards, from
the final void ratio determined at the end of the tests. For com-
parison, the initial void ratio of each specimen calculated from
the initial moisture content is also shown with an open circle.
Oxford Circus
Fig. 10.6 shows the e vs log p diagrams for test nos.
0-0C-1, 2 and 3 in which the specimens were allowed to swell under
pressures of 0.4, 0.25 and 1.0 T/ft2 respectively before further
load increments were applied. It will be noticed that the magnitude
of the pressure increment has no significant effect on the slope of
the curves.
In Fig. 10.7 are plotted the pressure - void ratio re-
lationships for test nos. 0-00-4 and 5. These were conventional
oedometer tests in which initial swelling was apparently prevented.
A comparison between the actual void ratio determined from the
initial water content and that calculated from the final measurements
shows that considerable swelling had, in fact, taken place.
The results of the tests in which the samples were nilowed
to rest for 7 days (0-00-6, 7, 8) at the in-situ effective over-
burden pressure of 3.0 T/ft2 are shown in Fig. 10.8. It may be
noticed that the magnitude of the pressure increments subsequent to
this rest period does not significantly affect the e vs log p
diagrams.
187.
In contrast, longer rest periods of 90 days (0-0C-97 10,
11 : Fig. 10.9) show some influence on the shape of the pressure
void ratio diagram in the subsequent range 3 - 6 T/ft2. The
specimens have all undergone some secondary consolidation (see
enlarged detail in Fig. 10.15b) during the long rest periods and
have developed marked resistance to further compression, as can be
seen from the very flat shape of the curves for small pressure in-
crements.
Ongar
Fig. 10.10 shows the e vs log p relationship for test
no. 0-H0-1 where the specimen was allowed to swell under a small
pressure of 0.1 T/ft2 before it was loaded conventionally and in
Fig. 10.11 are plotted the pressure - void ratio relationships for
conventional tests (0-H0-2 and 3) where swelling was apparently pre-
vented but had in fact taken place. The effect 02 rate of loading
after the conventional rest period of 1 day at 2.0 T/ft2 (0-H0-4
and 5) is shown in Fig. 10.12.
The results of the three tests (0-H0-6, 7 and 8) in which
the specimens were allowed to rest 7 days at the in-situ vertical
effective stress of 2.0 T/ft2 but otherwise loaded in the conven.1,.
tional manner are plotted in Fig. 10.13.
Finally, Fig. 10.14 shows the e vs log p diagrams for
test nos. 0-H0-9, 10 and 11 in which rest periods of 93 days were
allowed at 2.0 T/ft2 before the samples were subjected to further
188.
load increments - at different rates. Again, the main effect of
the prolonged rest period is found to,ghe greatly increased res-
istance to compression for subsequent small pressure increments
(see Fig. 10.15a).
The pressure - void ratio relationship of the Ongar sample
no. H0-15 which was consolidated from a slurry (initial moisture
content 89.6%) is shown in Fig. 10.16. Here the correlation
between the initial void ratio and that calculated backwards from
final measurements is quite satisfactory which indicates that if
settlement is large the effect of inadequate bedding and the
apparatus deformation is not significant.
10.1.4 Compressibility characteristics
The coefficient of volume compressibility (mv) at a
pressure po is defined as
m = v A
Lip 1 eo
where eo is the void ratio corresponding to the pressure po and
e is the change of void ratio due to a pressure increase from
po to (po +.6 p).
In Figs. 10.17 - 10.20 are plotted the relationship
between compressibility and effective stress for the normal pressure
increment ratio of 1 (i.e. --211 = on both first and second
Po
A e 1
189.
loadings. For each case the range of scatter is indicated by the
shaded areas.
In the case of Oxford Circus, samples 0-0C-1, 2 and 3
which were allowed to swell initially under small pressures, ex-
hibited consistently higher compressibility than the others over the
entire stress range (Fig. 10.19). Only one corresponding test was
performed on the Ongar clay (0-H0-1) the results of which fell within
the range of scatter for the other tests. As is usually found with
clays, the compressibility on reloading is considerably lower than
on first loading particularly in the low stress range. In fact,
in the vicinity of the pressure at which reloading is started the
compressibility is initially very low as indicated by the very flat
slope of the e vs log p diagrams. It then increases slightly
before starting to decrease with increasing pressure.
The magnitude of pressure increment after rest periods'
of 1 day and 7 days at 2.0 T/ft2 (Ongar) and 3.0 T/ft2 (Oxford
Circus) did not have any significant influence on the compressibility.
The results fall within the range of scatter shown in Figs. 10.17,
10.18 and 10.20. On the other hand the rest period of 90 days and
the magnitude of subsequent loading have very marked effect on the
compressibility as shown in Figs. 10.21 and 10.22. It has already
been shown in Fig. 10.15 that these samples had undergone some
secondary consolidation during this prolonged rest period and at the
same time developed marked resistance to further deformation. As a
190.
result, the compressibility is very low for small pressure changes
but increases as —EA increases. Yet a pressure increment ratio
of 1 (test nos. 0-H0-9 and 0-0C-9), after these rest periods, pro-
duces a compressibility which is very close to the average for the
standard tests. This shows that a large increment of pressure
completely destroys the extra resistance the clay may develop after
a period of sustained loading, which can, therefore, only be de-
tected by small pressure increments.
10.1.5 Coefficient of consolidation
The coefficient of consolidation (cv) for each loading
stage has been calculated for t50, obtained in the usual way from
the settlement vs log time plot (Appendix E). In Figs. 10.23 and
10.24 are shown the variation of cif with effective stress, cv
being plotted against the average pressure for the corresponding
consolidation stage. In general, cv decreases with pressure on
first loading though the scatter is usually large. On second
loading, however, cv is considerably lower than on the first and
increases slightly with pressure until the stress from which un-
loading started is reached, beyond which it again decreases mith
pressure.
That the lower values of cv on second loading are pre-
marily due to lower void ratios are demonstrated in Fig. 10.25
where the coefficient of consolidation is plotted against void •
191.
ratio. The results for both first and second loading lie within
the same range and approximately unique relationships between cv
and e are obtained. It can also be seen that at smaller void
ratios cv remains virtually constant indicating that both the
permeability (k) and the compressibility (mv) decrease in such
a way that their ratio remains constant. This is shown in Figs.
10.26 and 10.27 where my and k* are plotted against void ratio.
For e less than 0.65 both log k and log my increase linearly
with e and at the same rate resulting in a constant value of cv.
For e greater than 0.65, however, k increases much faster than
my as a result of which c
v also increases more rapidly (see Fig.
10.25).
The effect of the magnitude of pressure increment on cv
is shown in Fig. 10.28 and 10.29. For small pressure increment
ratios (0.1 <--". <0.2) the coefficient of consolidation is con-
siderably lower for the standard increment ratio of 1. The two
rest periods of 7 days and 94 days show similar values of cv.
10.1.6 Discussion of results
The method of determining the swelling pressures of un-
disturbed samples of London clay, with high initial suctions, in the
standard oedometer, is open to criticism, mainly on two grounds.
Firstly, and more important, unless specimens can be prepared which
Calculated from cv and m
v.
192.
are 100% saturated, and bedding error is completely eliminated therp
may be considerable volume increases of the samples, even if the
dial reading is held constant during the performance of the swelling
test. This migration of water into a sample reduces the suction
resulting in a measurement of the swelling pressure which is con-
siderably smaller than the initial suction.
Secondly, the stress changes that occur in a sample during
a swelling test are difficult to ascertain. It is true that, if
the condition of no volume change can strictly be maintained, a
saturated specimen in the oedometer will be acted upon by isotropic
stresses. In practice, however, due to swelling, the horizontal
stresses tend to increase considerably as a consequence of lateral
confinement and may be much higher than the vertical stress at the
end of a swelling test:
It must be mentioned, however, in this connection, that
Skempton (1961) and Ward, Samuels and Butler (1959) have obtained
reasonably correct indications of initial suction of undisturbed
samples of London clay from swelling tests. It is, therefore,
believed that provided fully saturated samples can be prepared and
bedding errors completely eliminated swelling tests may give
satisfactory results.
The initial swelling mentioned above has an important
bearing on the deformation of the clay during subsequent loading.
Numerical values are presented in Section 10.4.
193.
Firstly, the void ratio of a sample before test, calculated backwards
from the final measurements and changes of height, does not accurately
correspond with the void ratio determined from the initial moisture
content. The former is always higher, althouth applying the
corrections for apparatus deformation, a better correspondence is
achieved.
The initial swelling also affects the compressibility of
the clay in a significant way. This is shown in Fig. 10.30 where
the average e - log p relationship of the Ongar clay, obtained
from all the tests reported previously, is plotted. It will be
noticed that the curve starts at a void ratio which is higher than
the in-situ value and has, therefore, a greater slope than a field
consolidation curve at low stresses. This is easily understood
from a comparison with the e vs log p relationship for the con-
trolled rate of strain tests in which there was little scope for
initial swelling! The compressibility data for first loading pre-
sented in Figs. 10.17 - 10.20 are, therefore, likely to be higher
than the corresponding values in the field. It is noted, however,
that when the in-situ vertical effective stress (2.0 T/ft2) is re-
established the in-situ void ratio is also restored.
In many settlement analyses of structures on over-con-
solidated clays the use of the second loading curve has been pre-
ferred on the ground that sampling disturbances give higher com-
pressibility or first loading (Burmister 1952, Hansen and Nisi 1961).
For details see section 10.3.
194.
It may now be added that the initial swelling is another reason why
the use of the first loading curve may result in the settlement
being overestimated.
The pressure - void ratio relationships are not significantly
affected by rest periods at the in-situ effective stress of 1 or 7
days nor does the magnitude of load increment subsequent to these
rest periods alter noticeably the shape of the curves which are
obtained from standard tests, i.e. doubling the load (i.e. AD
= 1)
every day. This result is in accordance with the findings of
Lewis (1950), Northey (1956), Leondrdd and Ramiah (1959), Simons
(1965) on normally consolidated clays. Lewis used pressure in-
crement duration of 24 hours and 48 hours, Northey 20 minutes and
24 hours, Lennards and Ramiah 4 hours, 1 day and 1 week and Simons
5 hours, 1 day and 1 week. They all came to the conclusion that
the effect of load duration on the pressure.- void ratio relation-
ship was insignificant.
The picture changes considerably with the longer rest
period of 90 days at the effective overburden pressure. During
this period of sustained loading the samples exhibited some second-
ary consolidation but, perhaps of more importance, also developed
marked resistance to further compression. The use of slow rate of
loading in the range 2-4 T/ft2 for Ongar and 3.6 T/ft2 for-OxfOrd
Circus (at 0.4 T/ft2 per day and 0.1 T/ft2 per day for Ongar and
0.6 T/ft2 per day and 0.15 T/ft2 per day for Oxford Circus) showed
195.
that the compression was very small for pressure increase of up to
20%, but increased rapidly beyond this point. However, a pressure
increment ratio of 1 tended to conceal this effect. This phenomena
which has often .been observed in soft normally consolidated clays
(Leonard and Ramiah 1959, Bjerrum 1967) is attributed to the develop-
ment of a rigid bond after a long period of rest (Terzaghi 1941)
which is susceptible to sudden breakdown when a "critical pressure"
or ailluasi-preconsolidation" pressure is exceeded: A similar
argument may conceivably be extended to an undisturbed sample of
clay. While in-situ, this clay has been under the effective over-
burden pressure for many years during which the particles have
developed a certain structural arrangement. On sampling, the over-
burden pressures are removed and, even if there have been no
mechanical disturbances, this release of stress alone will cause
some alteration of the original structure of the clay. When this
sample is reloaded in the laboratory following the normal procedure
of daily load increments, the clay particles may not have the
opportunity to recover their original structural arrangement. This
will be particularly so if the sample undergoes considerable swelling
during the initial stages of a test. When the in-situ vertical
It is interesting to note in this connection that the presence of a threshold gradient has been observed by Raymond and Low (1963) for flow of water in clays. This threshold gradient, which is the hydraulic gradient below which no flow occurs, decreases with decreasing clay concentration and increasing temperature.
196.
effective stress is restored,and the sample allowed to rest for a
long period of time the clay particles may then readjust themselves
to a more stable structure, which may not be effectively broken until
the pressure exceeds a certain value. This phenomena for stiff
clays was first observed by Langer(1936) who found that for small
pressure increments there existed a "threshold" value beyond which
appreciable volume change first occurred. The only field evidence
to support this was reported by Terzaghi (1941) who observed that a
point situated at a depth of /00 ft. below the Charity Hospital,
New Orleans did not settle at all even though the pressure at the
point had certainly increased due to the loading. It is, therefore,
believed that for London clay also a threshold value may exist which
must be exceeded before any appreciable settlement may occur and
from the data presented for Oxford Circus and Ongar a tentative
suggestion of 10% of the in-situ vertical effective stress is made.
The permeability (k) and the coefficient of consolida-
tion (cv) are found to be functions of void ratio and for both
first and second loadings unique relationships are obtained. In
fig. 10.31 the cv data from some other sites in London have been
compared with the results from Oxford Circus and Ongar. The close
correspondence between the latter two is perhaps fortuitious, but
it is nevertheless, believed that at lower void ratios, i.e. higher
effective stresses, the variation between the different sites would
diminish. At void ratios near the in-situ values, however,
197.
different patterns of joints and fissures give rise to different
coefficients of consolidation and it is not until higher pressures
are applied that these fissures close to allow the various samples
to approach uniformity.
198.
10.2 Tests in the high pressure (hydraulic)oedometer
10.2.1 Presentation of results
The procedure of these tests has been described in Chapter
9. Two tests were performed on the Ongar clay, but only one was
successfully completed, the other having to be terminated due to a
leakage in the membrane when consolidation was progressing in the
range 240 - 360 lbs/iZ
The maximum pore pressures recorded on stress increments
under undrained condition before consolidation commenced, are given
in Table 10.3. At low effective stresses pore pressure response of
100% was achieved, which immediately indicated that the samples were
fully saturated. With increasing effective stresses, however, the
maximum pore pressure response steadily decreased. No systematic
record of the build-up of pore pressure with time was kept, but it
normally took a few hours for the pore pressure to reach its peak at
high effective stresses, while at low stresses the response time was
considerably smaller. However, at least 12 hours was allowed for
the pore pressure to equalise before consolidation was started:-
The time/settlement, time/volume change and time/pore
pressure diagrams during consolidation are given in Figures 10.32
- 10.41. The results are presented in the form of time vs. degree
of consolidation and time vs. dissipation of maximum pore pressure
curves for each pressure increment, the back'pgessure during con-
solidation being always 15 lbs/inZ Each pressure was maintained for
199.
top 24 hours or until the measured pore pressure at the/equalled the back
pressure, whichever time was greater, except for the increment
60 - 120 lbs/in2 of test no. HMO/H0/2 which was kept for a period of
5 weeks (Fig. 10.42). For each pressure increment the degree of
consolidation has been expressed in terms of total settlement or
total volume change occurring at the end of the consolidation stage.
In Tables 10.4 and 10.5 are summarised the results of the
two tests. It will be noticed that for both tests the measured
volumetric strains were generally higher than the corresponding
axial strains. In Fig. 10.43 are plotted the ratio of these
strains against time for all the consolidation stages and in Fig.
10.44 substantially the same data are plotted as a relationship
between axial and volumetric strains for different periods of time.
It will be noticed that over most of the range an almost linear re-
lationship between the strains (i.e. a constant strain ratio) is
obtained and no consistent variation with time can be discerned.
The amount of volume change causing this difference between the
axial and volumetric strains is plotted against time in Fig. 10.44.
It is clear that although there is a slight variation with time much
of the discrepancy arises due to the difference in strains during
the first 100 minutes of consolidation. For test no. HPO-H0-2 the
difference between the two strains was even greater. That leakage
and diffusion through the membrane were to a large extent responsible
for this at least in the latter test is clear from Fig. 10.42 where
200.
the plots of both axial and volumetric strains with time follow
substantially the same curve up to about 90 minutes, after which
they diverge giving higher values of the volumetric strain. It
has been mentioned already that this test had to be terminated when
consolidation was in progress in the pressure range 240 - 360
lbs/in2 due to a leakage in the membrane.
The values of the coefficient of compressibility (mv),
calculated from both axial and volumetric strains, and tabulated in
Tables 10A and 10.5, also reflect the discrepancies mentioned above.
In contrast, however, the coefficient of consolidation cv, all
calculated from t50, for axial strain, volumetric strain and
dissipation of maximum pore water pressure; do not show any sig-
nificant difference.
The theoretical curves for Terzaghi one-dimensional con-
solidation, all fitted at t50, have also been plotted in Figures
10.32 - 10.41. Because the cv values obtained from /ill and
by were similar, the corresponding theoretical curves for the
degree of consolidation were almost identical and for simplicity
only those for L\ II are shownT* The theoretical dissipation curves
have been obtained by fitting them at points where half the excess
pore pressures at the impermeable boundary had dissipated.
For 11100-110-2 cv values have been calculated for only
6H and Av. ** There were some differences in the case of HFO-H0-2.
201.
It can be seen that the Terzaghi theory predicts the rate
of settlement accurately for the degrees of consolidation (U) of
up to about 70%, beyond which due mainly to the influence of second-
ary and creep effects, the measured rate of settlement becomes slower.
The dissipation of maximum pore water pressure, on the other hand,
proceeds somewhat faster than predicted for U < 50% and slower
than predicted for U > 50%. The pressure void ratio relationships for the two tests
are shown in Fig. 10.46. While for HPO-H0-1 the void ratios have
been calculated backwards from the water content of the sample
measured at the end of the test, those for HPO-H0-2 have been cal-
culated from the initial measurements. It will be seen that for
the first test the initial void ratio, calculated from changes of
height corresponds favourably with that determined from initial
moisture content of the sample - the small swelling may have been
due to water being sucked in from the porous stone before the start
of the test and while water was flushed from the top to drive out
any air from between the membrane and the sample. On the other hand,
the correspondence of the initial void ratio with that obtained from
volume changes is less satisfactory reflecting the lack of agreement
between the water content of the sample measured at the end of the
test and that calculated from initial moisture content.and volume
changes! This is added evidence to suggest that measurements of
From measurements of volume change during consolidation and swelling the moisture content of the sample should have decreased from the initial 27% while, in fact, it was 27.5% which was in agreement with that obtained from change of height.
202.
volume change were somewhat in error.
10.2.2 Discussion of results
(a) Initial response of pore pressure
The initial response of pore pressure due to loading under
undrained conditions depends to a considerable extent on the flexi-
bility of the measuring system, which gives rise to a number of
important effects. First, even though all drainage connections
may be closed during a pressure increment some water must flow from
the sample into the connecting leads and to the null indicator it-
self - the two form a system which is not absolutely rigid - due to
the difference in pressures in the measuring system and in the pore
water at the instant of load application. This means, in effect,
that some "drainage" takes place before the equilibrium pressure
is attained and this is different from that set up in the specimen
when the pressure is applied. Secondly, there is often a con-
siderable time lag before equilibrium is reached. With high system
flexibility this response time may be very large. Thirdly, ex-
cessive flexibility of the measuring system may change the overall
compressibility of the pore phase thus altering the stress dis-
tribution between the soil skeleton and the pore phase.
Whitman et al (1961), Bishop and Henkel (1962) and Gibson
(1963) have analysed the effect of system flexibility on the pore
pressure response of clay specimens under undrained conditions.
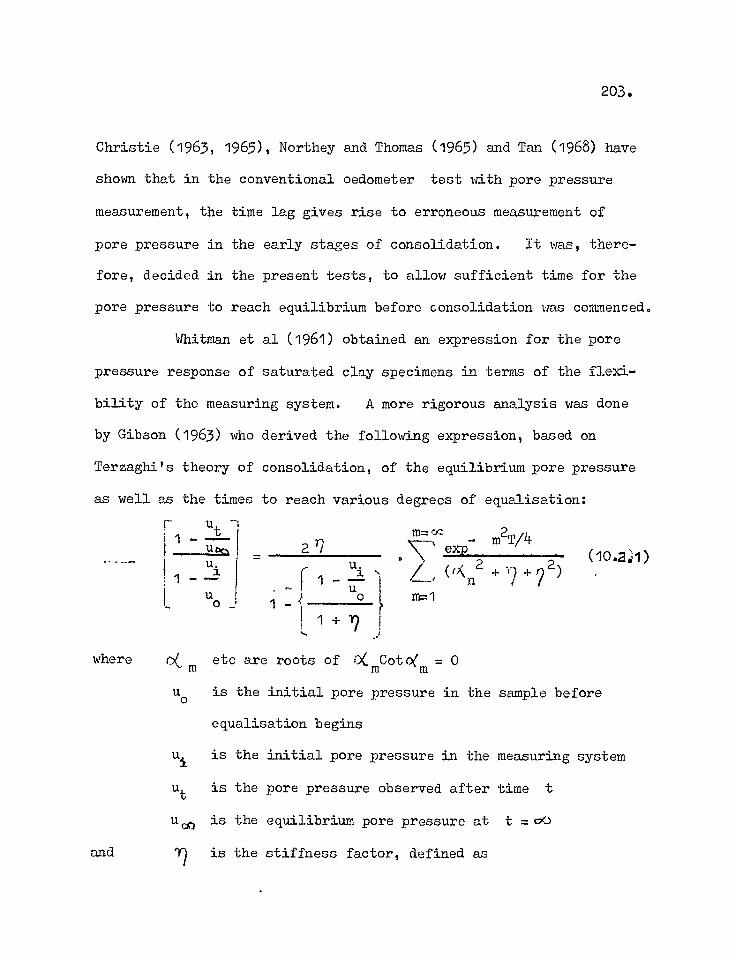
-m2T/4 m= cc
2 7 '\ eXP U.
uo 1 1 ÷
(lo.a.)1) L, =,c,2 ± 7 + 9 2 ) m=1
203.
Christie (1963, 1965), Northey and Thomas (1965) and Tan (1968) have
shown that in the conventional oedometer test with pore pressure
measurement, the time lag gives rise to erroneous measurement of
pore pressure in the early stages of consolidation. It was, there-
fore, decided in the present tests, to allow sufficient time for the
pore pressure to reach equilibrium before consolidation was commenced.
Whitman et al (1961) obtained an expression for the pore
pressure response of saturated clay specimens in terms of the flexi-
bility of the measuring system. A more rigorous analysis was done
by Gibson (1963) who derived the following expression, based on
Terzaghi's theory of consolidation, of the equilibrium pore pressure
as well as the times to reach various degrees of equalisation:
where m etc are roots of 0(mCoto(
m = 0
and
uo is the initial pore pressure in the
equalisation begins
u
is the initial pore pressure in the
ut is the pore pressure observed after
uoo is the equilibrium pore pressure at
1") is the stiffness factor, defined as
sample before
measuring system
time t
t = oe-)
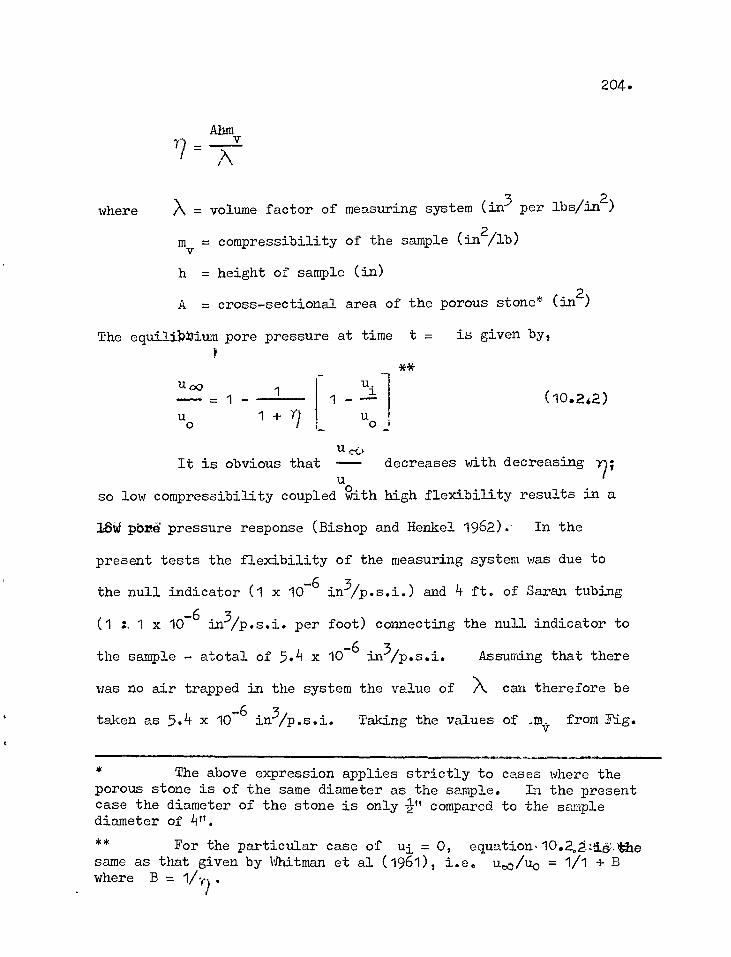
204.
Ahm =
where = volume factor of measuring system (in3 per lbs/in2)
my = compressibility of the sample (in2/lb)
h = height of sample (in)
\ A = cross-sectional area of the porous stone* (in
2 )
The equiliktium pore pressure at time t = is given by,
** U co
uo 1 -
u.
uo (10.242)
U cO.
It is obvious that — decreases with decreasing "7 o ' u so low compressibility coupled with high flexibility results in a
106W pbrd pressure response (Bishop and Henkel 1962).' In the
present tests the flexibility of the measuring system was due to
the null indicator (1 x 10 6 in3/p.s.i.) and 4 ft. of Saran tubing
(1 1 x 10⁻⁶
in3/p.s.i. per foot) connecting the null indicator to
the sample - atotal of 5.4 x 10⁻⁶ in3/p.s.i. Assuming that there
was no air trapped in the system the value of X can therefore be
taken as 5.4 x 10⁻⁶ in3/p.s.i. Taking the values of .Mv from Fig.
The above expression applies strictly to cases where the porous stone is of the same diameter as the sample. In the present case the diameter of the stone is only i" compared to the sample diameter of 4". ** For the particular case of ui = 0, equation•10.2,,j,...167.the same as that given by Whitman et al (1961), i.e. u,o/uo = 1/1 + B where B = 1/-9.
205.
10.48, the peak pore pressure response for each pressure increment
has been calculated and shown in Table 10.3. It will be seen that,
theoretically, the maximum response should decrease from 98% at the
effective stress of 15 p.s.i. to 84.3% at 360 p.s.i. while the
measured values show a decrease from 100% to 88% (see Fig. 10.47).
The agreement is, therefore, satisfactory.
The theoretical response times have also been determined
from charts given by Gibson (1963). For 98% equalisation (i.e. 1 - ut/u00
equalisation factor = 0.02) the times (see Table 10.3) 1 - u./u
vary from 15 minutes at loW aresses to 6.7 hours at high stresses.
No systematic record of pore pressure vs. time was kept, but, as has
been said earlier, at least 12 hours were allowed to achieve equili-
brium before consolidation was begun.
(b) Measurement of strains
The discrepancies between the axial and volumetric strains
during consolidation are difficult to explain. While for EEO-H0-2
much of these can be attributed to leakage and diffusion of water
through the membrane the same cannot be confidently said of HPO-H0-1.
As shown in Fig. 10.43 axial strains were smaller throughout the
process of consolidation. In a perfect oedometer test on saturated
clay with lateral restraint, the axial strain must equal the
volumetric strain. In practice, however, a number of factors may
influence the strains during consolidation:
(a) incomplete saturation of the specimen
206.
(b) inadequate bedding
(c) lateral deformation due to expansion of the ring
(d) side friction
It has been shown above that almost 100% response of pore pressure
was achieved during the early load increments under undrained con-
ditions. Also for higher stresses the response was close to the
theoretical prediction for saturated samples. This indicates that
the degree of saturation, for all intents and purposes, was almost
100% and could not account for the difference in strains.
Any inadequate bedding would result in a relatively
greater axial strain and would also cause an initial settlement to
be recorded, none of which were noted in the actual tests.
Lateral deformation of the confining ring could be
neglected because a 3i in thick annular ring could hardly be ex-
pected to undergo substantial expansion at maximum pressures of
500 lbs/in
One of the major advantages of the hydraulic loading system
and a flexible membrane is to minimise the effect of side friction
on measurements of axial strain if the latter is made over a central
area of the sample. It is believed that the effect of any side
friction would be restricted to a narrow zone near the periphery
of the sample and a bowl-shaped deformation surface with a flat base
would result. The settlement over much of the central area would
be uniform and greater than that at the edge. This would corres-
207.
pondingly result in higher axial strains at the centre and smaller
volumetric strains. The measurements were, however, to the con-
trary. The discrepancies cannot, therefore, be explained by side
friction.
It has been mentioned before that the final moisture con-
tent of the sample (1110-H0-1) corresponded more closely to the
axial strains during the test. If the measured volume changes
were correct, the moisture content of the sample should have de-
creased from the initial 27.0% to the final 24.5% while it had in
fact gone up to 27.5%. (Calculated from axial strains, it should
have been 27.2%). It is, therefore, believed that the measurements
of volume change were somewhat in the error.
Possible reasons for this could be:
(a) Leakage at various connections
(b) Diffusion of water through the membrane
(c) Flexibility of the tubings connecting the sample to
the volume gauge and/or any air in the system. At
the instant when consolidation is starthd the pressure
in the system drops from the initial equilibrium
pore pressure to the applied back pressure causing
an initial volume change in the system.
(c) Consolidation characteristics
The rate of settlement predicted by the Terzaghi theory,
fitted at t50, is sufficiently accurate for undisturbed samples
208.
of London clay of the size (4" dia. x 1" high) tested in the high
pressure oedometer. In fact, for 1.14( 70% the measured rate of
settlement agrees extremely well with the theory. For U› 70%,
however, the measured rate is slower than that predicted. This is
primarily due to the influence of secondary consolidation. The
dissipation of maximum pore water pressure at the impermeable
boundary on the other hand, is not predicted quite as accurately
over most of the range by the Terzaghi theory. At early stages of
consolidation, dissipation proceeds faster than predicted while at
later stages it is slower.
It is well understood that the Terzaghi theory of con-
solidation is based on the Assumptions that compressibility, (mv),
permeability (k) and the coefficient of consolidation (cv) re-
main constant during the consolidation process. In real soil,
however, not one of these assumptions is strictly correct. In
recent years, many attempts have been made to formulate theories of
consolidation taking, at least, some of the above variabilities into
account. Schiffman (1958) considered the variation of permeability
during consolidation while Hansbo (1960) considered the same problem
for consolidation by sand drains. Davis and Raymond (1965) derived
a theory for non-linear consolidation, assuming the coefficient of
consolidation to be constant and a linear relationship between logarithm
Of pressure and void ratio. Barden (1965) solved the more general
case of the above problem taking the variation of permeability also
209.
into account. Both the above theories, however, strictly apply to
small strains only. Gibson et al (1967) derived equations govern-
ing the one-dimensional consolidation for large strains, taking
variation of compressibility and permeability into account and re-
casting Darcy's law in a form which relates the relative velocity of
the soil skeleton and the pore fluid to the excess pore pressure
gradient. For the London clay from Ongar and Oxford Circus the
change of void ratio during consolidation is small and therefore the
small strain theories can be applied without much error.
Davis and Raymond (1965) have found that if compressibility
does not remain constant during consolidation but varies according
to linear e vs log p relationships, the dissipation of maximum
pore pressure is a function of the pressure increment ratio. But
if cv is constant, which means that both m
y and k decrease in
such a way that their ratio remains the same, the rate of settlement
is independent of the pressure increment ratio and is identical to
that given by the Terzaghi theory. It will be seen from Fig. 10.46
and from the results of the conventional oedometer tests presented
in Figs. 10.4 - 10.14 that for a small stress increment, the e vs
log p relationship is very nearly linear. The coefficient of
consolidation is, however, not constant at lower effective stresses,
though at higher stresses the variation of cv with pressure is not
great (Table 10.4). Over much of the range, therefore, the conditions
of Davis and Raymond's theory are at least approximately satisfied,
210.
and so Terzaghi theory predicts the percentage settlement with
remarkable accuracy for 11( 70%. As the above theories do not
take account of secondary consolidation it is not surprising that
for higher values of U correspondence between measured and pre-
dicted rates of settlement is less satisfactory.
In the case of the dissipation of pore pressure, both
Davis and Raymond's and Barden's work show that the rate of dissipa-
tion is to a great extent influenced by the pressure increment
ratio. For Ap/p = 1 or less, however, the difference between
the above theories and that of Terzaghi is not significant. In
the tests reported here, Lip/p was mostly equal to 1 (except for
the last two increments of HPO-H0-1, where h. p/p were respectively
equal to 0.5 and 0.35). The discrepancy between the theoretical and
observed rates of dissipation cannot, therefore, be fully explained
as being due to the variation of compressibility and/or permeability.
The presence of random fissures within the samples may contribute
towards quicker dissipation in early stages of consolidation because
the water may then have the opportunity to flow along the fissures
having higher permeabilities than the overall sample. This effect
may not predominate at later stages of consolidation when the pore
pressure gradient within the sample is small, and fissures may have
closed up due to the increasing effective stress.
In Figs. 10.48 and 10.49 respectively, the values of mv
and cv obtained from these tests are compared with those from the
211.
conventional tests. For reasons mentioned earlier the mv values
determined from axial strains only are considered. As can be seen
from Fig. 10.48 the hydraulic oedometer gives smaller values of
compressibility than the first loading conventional tests over the
entire stress range, primarily because the specimens had lesser scope
for initial swelling (see section 10.1.6).
The coefficient of consolidation cv from these tests
shows the same type of ,variation with void ratio as from the con-
ventional tests (Fig. 10.49). Also, the cv values calculated
from axial strains, volumetric strain and the dissipation of maxi-
mum pore water pressure do not show any consistent variation and are
similar to those obtained for the conventional tests.
(a) Side friction
It has long been recognised that side friction may have
an important influence on the results of conventional oedometer tests.
This friction arises from the lateral restraint provided by the
oedometer ring during consolidation and acts in opposition to the
applied load thus causing a smaller load to be transmitted to the
sample than actually applied at the boundary.
Taylor (1942), Hansbo (1960), Nakase (1963) have found
that the coefficient of side friction lies generally between 0.15
and 0.30 and that the reduction of the effective consolidation
pressure due to friction in a conventional oedometer depends on the
relative dimensions of the sample and the magnitude of the applied
212.
pressure. For a height to diameter ratio of- this reduction
may be between 2 to 10 percent.
In the hydraulic oedometer both the pore pressure and the
settlement are measured over a central area of the sample where the
effect of side friction may be expected to be very small. That
the measured pore pressures before consolidation were not significant-
ly affected by friction has already been demonstrated. The maximum
response of less than 100% was due to flexibility of the measuring
system and not due to side friction reducing the pressure transmitted
to the sample.
It has Also been shown that any major influence of friction
on the settlement and volume change of a specimen would result in a
smaller volumetric than axial strain being measured. That this was
not so can be considered as added evidence for the insignificant
effect of friction on the process of consolidation in the hydraulic
oedometer. The close correppondence between the compressibility
ddtermined from conventional tests and from the high pressure oedo-
meter tests also suggests that for London clay which undergoes only
small strains during consolidation, side friction plays only a minor
role in influencing the results of the standard oedometer tests.
10.2.3 Advantages of the hydraulic oedometer
The high pressure oedometer and its hydraulic pressure
system have a number of advantages over the conventional oedometer and
213.
its deadload-lever loading arrangement. More important of these
are the following:
(a) Uniform pressure on the sample can be maintained by
applying the pressure on a flexible rubber membrane which allows
the sample to deform freely. In the conventional oedometer, the
load being applied on a rigid plate, uniform displacement does not
ensure uniform pressure.
(b) By measuring the settlement and the pore water pressure
over a central area of the sample, the effect of side friction can,
to a very large extent, be eliminated.
(c) The sample is not subjected to any shock loading which
is inevitable in the dead-load lever system.
(d) The error due to deformation of the apparatus, which may
be significant for stiff samples undergoing small settlement, is
reduced to negligible proportions.
(e) In the conventional oedometer there is little control over
drainage, which begins as soon as the load is applied and, perhpps,
before the pore pressure has had the time to reach its peak. With
the hydraulic oedometer and employing a rigid measuring system, high
pore pressure response can be:achieved after relatively short tithes,
during undrained loading, before consolidation is started. Drainage
can thus be fully controlled.
(f) Consolidation can be carried out against back pressures.
This not only allows tests to be performed under conditions more
214.
similar to those in the field but, for samples not fully saturated,
a sufficiently high back pressure can be applied to Unsure saturation
before consolidation is begun.
(h) By measuring settlement, volume change and the dissipation
of pore water pressure, complete consolidation behaviour of soils
can be studied.
The idea of the hydraulic oedometer is, however, not new.
Lowe et al (1964); Whitman and Miller (1965), Rowe and Barden (1966)
have successfully employed the principle of hydraulic loading system
in the design of consolidation cells which have been satisfactorily
used to study the consolidation characteristics of soils.
cap. Lowe et al applied hydraulic pressure on a rigid loading
215.
10.3 Controlled rate of strain tests
10.3.1 General
The main purpose of these tests, the procedures for which
have been described in Chapter 9.1.3, was to study the compressibility
of London clay when strained continuously in such a way that no excess.
pore pressure could develop. It has been shown in section 10.2, that,
following a long rest period, the rate of loading may significantly
influence the subsequent deformation of London clay. In the field,
the rate of loading is, in general, considerably slower than in the
conventional laboratory tests and in certain conditions - such as
during deposition - the loading rate is too slow to create any ex-
cess pore pressures. Leonards and Altschaeffl (1964) have shown
from experiments on artificially sedimented clays that the rate of
loading has considerable influence on the compressibility of clay
during deposition. It must be emphasized in this connection that
any measurable loading rate that can be produced in the laboratory
is still likely to be several orders of magnitude faster than the
rate at which a clay is deposited in nature. Nevertheless, a com-
parison of results of conventional step-loading tests with those of
controlled rate of strain tests may serve as a useful guide to assess
the difference in behaviour of the clay under different conditions of
loading.
The opportunity was also taken to study the deformation
of London clay at high pressures. Much work has been done in recent
216.
years to study the behaviour of granular materials at high pressures,
but very little data is available of similar work on clay. Terzaghi
and Peck (1948) described the stress - strain relationships for
loose and dense sand at pressures of up to 14,000 lbs/in2 while
similar data were presented for sand and ground quartz by Roberts
and De Souza (1958). De Beer (1963) reported results of compression
and penetration tests on dense sand at pressures of up to 45000
lbs/in2. Vesic and Barksdale (1963) tested samples of dense sand
at 9,000 lbs/in2 and Bishop (1966) presented results of compression
tests on dense and loose sand at cell pressures of up to 4,000
lbs/in2. Recently Vesic and Clough (1968) published results of a
comprehensive series of isotropic compression and triaxial tests on
dense sand at maximum confining pressures of up to 45,000 lbs/in,2
All these works have shown that there is considerable breakdown of
particles at high pressure and that both the Mohr envelope and the
shape of the volume change curves during shear are significantly
affected.
Available data on the behaviour of clay at high pressures
is, on the other hand, limited. Most laboratory oedometer tests on
clay are taken to pressures of about 32 T/ft2 (500 lbs/in2) which is
generally sufficient for purposes of design. Moreover, for normally
consolidated clays, this pressure is usually high enough to define
the virgin part of the pressure - void ratio relationships., For
many over-consolidated clays, on the other hand, this pressure is
217.
often insufficient to define even the pre-consolidation pressure let
alone the virgin consolidation behaviour.
Smith and Redlinger (1953) published a pressure void ratio
relationship for the heavily over-consolidated Fort Union clay shale
for pressures of up to 500 T/ft2 (7,500 lbs/in2) and deduced from it
a pre-consolidation pressure of between 80 - 100 T/ft.2 Similar
high pre-consolidation pressures have been estimated from geological
evidence for the Bearpan shale (Petersen 1954, 1958, Terzaghi 1961),
but no high pressure test has been reported. Brooker and Ireland
(1965) performed a series of one-dimensional consolidation tests on
five remoulded clays, using pressures of up to 2,200 lbs/in2 to
study the relationship between stress history and the coefficients
of earth pressure at rest. Bishop, Webb and Lewin (1965) published
the strength - effective stress relationships of undisturbed London
clay for confining pressures of up to 1,100 lbs/in2 and noticed a
"marked change of slope of the Mohr envelope in passing from low
stress to high stress range".
10.3.2 Pressure - void ratio relationships
The e vs log p relationships of all the controlled rate
of strain tests are shown in Figs. 10.50 and 10.51. As already
mentioned in Chapter 9, two tests were performed on the Ongar clay,
in one of which (ORS-H0-1) the sample was loaded to 386 T/ft2
(6,000 lbs/in2) and then unloaded, while in the other (CRS-H0-2)

218.
the specimen was first loaded to 152 T/ft2 (2,400 lbs/in2), unloaded
to 0.72 T/ft2 (10 lbs/in2) and reloaded to the maximum pressure of
423 T/ft2 (6,600 lbs/in2) before being finally unloaded to zero
pressure. The two Wraysbury tests (CRS-W-1 and 2) were taken
straight to maximum pressures of 435 T/ft2 (6,800 lbs/in2) and 417
T/ft2 (6,500 lbs/in2) respectively and then unloaded.
The first point to note from Figs. 10.50 and 10.51 is that
the final void ratios of the specimens determined from the moisture
contents measured at the end of the tests correspond quite accurately
with those determined from the initial void ratios and the changes of
height* during a test. This indicates that the samples did not
undergo any initial swelling for.whichin any case, they had little
scope, being held between the pedestal and the head of the loading
machine both of which were extremely rigid. This is in contrast
with the results of the conventional oedometer tests reported
earlier in which the considerable initial swelling caused large
discrepancies between the two measurements of the void ratio.
It will be noticed that the early parts of the pressure -
void ratio diagrams are rather flat and when the in-situ effective
overburden pressures are reached only small deformations have taken
place. Thereafter, the relationships follow continuous curvatures
up to pressures of 40 T/ft2 for Ongar and 80 T/ft2 for Wraysbury.
Taken as the average of the two reduced dial gauge readings.
219.
Beyond these points the e vs log p relationships are essentially
straight lines, except for the Ongar specimen CRS-H0-1 which showed
a slight tendency to curve off at pressures greater than 200 T/ft2.
At the end of each loading stage the specimens were left
overnight before unloading was started the following day. During
this period a small settlement was recorded which is believed to be
partly due to the dissipation of excess pore pressures* that developed
during loading and partly due to creep. However, this was only small
and the specimens soon started to swell when unloading began. Each
unloading curve has an initial flat tangent followed by a straight
line which finally ends up in another flat position towards the end
of the unloading stage. The most important thing to notice is that
all the unloading curves are remarkably parallel to one another
although there is a difference in slope between the Ongar and Wrays-
bury clays.
The only reloading curve (CRS-H0-2) indicates the pattern
observed by Schmertman (1953) i.e. a very flat initial position
followed by reloading along a straight line which is almost parallel
to the unloading line, and then continuing into the virgin curve.
The laboratory first loading curves are, in essence, results of
reloading following the geological rebound - but the above phenomena
Maximum pore pressures of up to 14% of the vertical stress was tolerated during loading and the effective stresses were corrected accordingly.
220.
are not so marked for the Ongar clays, although for Wraysbury, a
similar trend can be discerned.
10.3.3 Compressibility characteristics
Fig. 10.52 shows the relationship between effective stress
and volume change for one-dimensional consolidation of undisturbed
London clay for pressures of up to 435 T/ft2 (6,800 lbs/in2). The
volumetric strains have been calculated from the pressure - void
ratio diagrams shown in Figs. 10.50 and 10.51 and using the re-
lationship, 1\ e/1 + eo = AV/Vo for saturated clays.
The first thing to note in Fig. 10.52 is that an almost
unique curve is obtained for the volume change of the clay from
both Ongar and Wraysbury. This may seem surprcising, particularly
if it is considered that the two sites are more than 40 miles apart.
On the other hand the initial moisture contents of all the samples
are virtually the same - as are their index properties (see Table
4.1). Also, compared to the range of stresses considered, the
pre-consolidation pressures are too low (see section 10.3.4) to
significantly influence the deformation characteristics of the clay
at high pressures.
The shape of the volume change curve is similar to those
for dense and loose sand tested in isotropic compression at pressures
eo and Vo have been taken as the void ratio and the sample volume respectively at the beginning of each test.
221.
of up to 600 T/ft2 (Vesic and Clough 1968). The slope of the curve
changes continuously from the very steep initial portion to a flat
section towards the end of the pressure range. This is reflected
in Fig. 10.53 where the compressibility (mv), defined as
mv = 1/1 + e . Ae/Ap and calculated in the usual way from the
pressure - void ratio relationships, is plotted against effective
stress on a log - log scale. For comparison, the compressibilities
determined from conventional and high pressure oedometer tests are
also included. It will be seen that the relationship consists of
a straight line for pressures of up to 80 T/ft2 followed by another
straight line with a steeper slope. It should be noted that the
compressibility decreases 50 times(from 0.01 ft2/Ton to 0.0002 ft2/
Ton) for a pressure increase from 1 to 400 T/ft2 and, while mV is
still decreasing with pressure the rate of decrease is very slow at
the high pressures:
In Fig. 10.54 the variation of compressibility with pressure
has been plotted to natural scale for the stress range 0 - 20 T/ft2,
The results of the conventional and high pressure oedometer tests are
also plotted for comparison. It will be seen that at pressures
greater than about 4 T/ft2 all the methods of testing give essentially
the same compressibilities on first loading. At lower pressures,
however, there is considerable variation in the results, the con-
* The slope on a log - log plot does not give the true rate of decrease.
222.
trolled strain rate tests giving the lowest values of mv. The
reason for this will be clear from the pressure void ratio relation-
ships plotted in Fig. 10.30. Due to initial swelling in the con-
ventional oedometer a specimen consolidates from a void ratio higher
than that in-situ giving a e vs log p relationship which has a
greater slope at small stresses than the controlled strain rate
specimen which, because there has been little initial swelling, has
a much flatter e vs log p curve. Consequently the conventional
tests produce much larger compressibility than the controlled strain
rate tests. The results of the high pressure oedometer tests lie
in between the above two, presumably because these samples swelled
slightly, but certainly less than the conventional test specimens.
At pressures greater than 4 T/ft, however, the effect of initial
swelling is largely overcome and all the methods of testing give
essentially the same results - within the normal range of scatter.
The compressibility on second loading in the conventional oedometer
is, as expected, lower than all the first loading compressibilities
over most of the range except at very low stresses where only the
controlled strain rate tests give slightly lower compressibilities.
From a practical point of view the above results are ex-
tremely important. Beneath a typical foundation, the vertical
effective stress of an element of clay may increase by say
L = 1 (where p is the in-situ effective overburden pressure
before construction). For the Ongar clay under consideration this
223.
would mean an effective stress increase from 2 - 4 T/ft In this
range, the compressibility obtained from the first loading con-
ventional test is as much as 50% higher than that obtained from the
controlled strain rate tests. Therefore, for accurate settlement
prediction it is essential that in any testing programme proper care
be taken to prevent the initial swelling. Lack of this may be one
of the reasons for over-estimating the compressibility of over-
consolidated clays. For soft normally consolidated clays, on the
other hand, the initial swelling is usually small compared to the
total settlement and its effect may, therefore, be proportionally
less significant.
Crawford in a series of interesting papers (Crawford 1964,
1966, Hamilton and Crawford 1963), reported results of a large number
of oedometer tests on undisturbed normally consolidated sensitive
clays. He loaded the specimens both incrementally and at different
rates of strain and found that the pressure - compression relation-
ship was relatively independent of the method of loading, provided
that the average rate of compression was the same From results
presented above the same observation is found to be true for un-
disturbed London clay; except for the low stress range, the com-
pressibility and pressure - void ratio relationships are essentially
the same for both incremental loading and controlled rate of strain
Otherwise, secondary compression plays an important part in the case of sensitive clays.
224.
tests - within the usual range of scatter. The reasons for the
discrepancies at low stresses have already been discussed.
As mentioned earlier, one of the main effects of high
pressure tests on granular materials has been found to be the change
of grading due to particle breakdown. To investigate if similar
trend could be noticed in the case of London clay the grading curves
of the oven dried specimens CRS-H0-1 and 2, at the end of each test,
were determined and compared with that for Block 2, from which these
specimens were obtained. The results are shown in Fig. 10.55. It
is noticeable that both the after-test curves lie a little above the
pre-test grading possibly indicating a small amount of breakdown of
the medium and coarse silt fractions. Too much emphasis need not
be placed on this trend; however, because there was considerable
scatter in the pre-test grading curves of the different blocks.
The identical percentage clay fractions shown by all the curves is
perhaps fortuitious but it is clear that practically no breakdown
has occurred of the fine silt and clay fractions of either specimen.
It is concluded, therefore, that particle breakdown of clay specimens
tested at high pressures does not play a predominant part in their
behaviour.
10.3.4 Determination of pre-consolidation pressures
It has already been mentioned in connection with the
geological study of the London Basin (Chapter 4) that London clay
225.
as it exists today is heavily over-consolidated. Several attempts
have been made in the past to determine the maximum pre-consolidation
pressures of London clay at various sites. Cooling and Skempton
(1942) deduced from a study of oedometer tests on samples from the
site of Waterloo Bridge a pre-consolidation pressure of 20 - 30
T/ft.2 A similar value was proposed for central London by Skempton
and Henkel (1957). A lower pressure of 13.5 T/ft2 was suggested
from geological evidence by Skempton (1961) for Bradwell, to the
east of the London Basin, while Bishop, Webb and Lewin (1965)
obtained a minimum pre-consolidation load of 39 T/ft2 for Ashford
Common, to the west. In none of the above studies were the samples
loaded to sufficiently high pressures to define the virgin consolida-
tion behaviour of the clay and accurate determination of the pre-
consolidation load has, therefore, been difficult.
The significance and a method of determining the pre-
consolidation loads of clay specimens were first suggested by Casa-
grande (1936). The method is based on the observation that a
distinct change of slope of the e vs log p relationships of re-
moulded clay samples occurs in the vicinity of the laboratory pre-
consolidation pressures from which Casagrande suggested an empirical
construction for its determination. The method has been used for a
wide variety of normally consolidated clays. But for heavily over-
consolidated clays the laboratory e vs log p diagrams show con-
tinuous changes of curvature in the normal laboratory stress ranges
226.
(0 - 50 T/ft2) and often no distinct change of slope can be dis-
cerned. This is certainly true of all the oedometer tests on
London clay reported in this thesis which were loaded to maximum
pressures of 32 T/fd In such circumstances the Casagrande method
of determining the pre-consolidation pressure is not satisfactory.
Schmertmann (1953) proposed a method based on an original
suggestion by Rutledge (1942) of determining the pre-consolidation
pressure of over-consolidated clays. It is essentially based on
the assumption that the geologic rebound (i.e. the unloading e vs
log p curve associated with the removal of overburden) is parallel
to the laboratory rebound. However, this method leads to satis-
factory results only if the laboratory rebound is started from a
pressure sufficiently greater than the pre-consolidation load
(Strachan 1960), because at low pressures the rebound curves are not
always parallel (Crisp 1953). In the present thesis Schmertmann's
basic postulate has been used to determine the pre-consolidation
pressure of London clay from Ongar and Wraysbury.
It has already been shown in Figs. 10.50 and 10.51 that
the laboratory unloading curves for the high pressure tests are
remarkably parallel to one another. In Fig. 10.56 the e vs log p
relationship for the Ongar clay has been reproduced as an average
curve for the two tests. In this figure is also plotted the mean
unloading curve for the conventional oedometer tests 0-H0-1 to 11,
reported in section 10.1. The parallel nature of the three sets
227.
of unloading curves is very obvious. From this observation it is
postulated that the geologic rebound also followed a curve which is
parallel to the laboratory rebounds.
The consolidation curve for the slurry sample (initial
water content 89.6%) is also shown in Fig. 10.56. It is noticeable
that this slurry line meets the curve for undisturbed samples almost
as a tangent at a pressure of 40 T/ft. It has already been mentioned
that the undisturbed ellog p curve for the Ongar clay beyond 40
2 T/ft is a straight line and can therefore be considered as the
virgin line. At such high pressures, sampling disturbances may not
have any appreciable effect as can be seen from the remarkable close-
neas of the two curves in Figs. 10.50 and 10.51.
Now the question arises as to the position of the sedimen-
tation curve. In an ideal case this should be an extension of the
virgin line of a truly undisturbed sample. Yet this sedimentation
curve can, perhaps, never be determined accurately from laboratory
slurry tests because any slurry line will depend on the initial
moisture content of the sample. Even for a sedimentation test the
true rate of deposition in the field may be difficult to duplicate
in the laboratory. It is reasonable to believe, however, that
whatever the initial moisture content all slurry lines will tend to
converge at sufficirtly high pressures and ultimately become
tangential to the virgin line. For the Ongar clay, therefore, at
effective stresses greater than 10 T/ft2 the differences between the
228.
possible sedimentation curves will only be small and they will all
tend to converge to the virgin line at 40 T/ft. In the absence of
more information further analysis will be based on the slurry line
shown in Fig. 10.56.
Following the above hypothesis, the determination of the
pre-consolidation pressure becomes a relatively simple matter. In
Fig. 10.56, A represents the in-situ void ratio (e0)* and the
effective overburden pressure (P.) of the Ongar samples. From
A is drawn a curve parallel to the three laboratory rebound curves
to meet the slurry line at the point B. Because of the initial
flat portion of the laboratory unloading curves it is difficult to
define precisely the early part of the geologic rebound. However,
all the initial tangents are parallel to one another and, as shown
in Fig. 10.56, by extending the straight line portion of each re-
bound curve a point of intersection with the initial tangent is
obtained. It has been found that for each rebound curve, if p1
is the pressure corresponding to the point of intersection and p2
is the pre-consolidation pressure, the ratio log p1/log p2 is a
constant and is equal to 0.83. In order to determine the point
B a series of lines are drawn from the slurry line parallel to the
pre-consolidation pressure and the straight line portion of the
geologic rebound is extended. For each point of intersection the
e0 is the average void ratio of all the specimens, oedometer and triaxial, used in the experimental programme.
229.
ratio log p1/log p2 is calculated and where this ratio is 0.83
the corresponding point on the slurry line is taken as the pre-
consolidation pressure Pct. A smooth curve is drawn between B
and the straight line portion of AB to complete the geologic
rebound. Using this method a pre-consolidation pressure of 17
T/ft2 is obtained for the Ongar clay. Since the existing over-
burden pressure at the depth from which samples were taken is 2
T/ft2 erosion seems to have removed a pressure of 15 T/f0
Similar analysis of the Wraysbury test results (see
Fig. 10.57) gives a pre-consolidation pressure of 38 T/ft In
this case no slurry line is available, but the final virgin line
of the undisturbed samples has been extended to construct the
geologic rebound. In the region of high pre-consolidation
pressures such as determined for Wraysbury any deviation of the
slurry line from the one assumed can only be small and consequently
the shift of the point B is not expected to be great.
A comparison with the estimated values of the pre-
consolidation pressure for other sites shows that the pre-
consolidation load of 15 T/ft2 determined for Ongar agrees fairly
well with the value of 13.4 T/ft2 suggested for Bradwell (Skempton
1961), 20 miles east of Ongar. On the other hand, a pre-
consolidation load of 37 T/ft2 for Wraysbury confirms the value
of 39 T/ft2 determined by Bishop et al (1965) for Ashford Common,
230.
only 5 miles south of Wraysbury! These pre-consolidation pressures
correspond to the removal of 550 ft. of submerged sediments at
Ongar and 1,300 ft. at Wraysbury. This seems to substantiate the
suggestion made by Bishop et al (1965) that the thickness of the
eroded sediments may have increased in a westerly direction. On
the other hand geological evidence does not apparently support (or
contradict) the greater thickness determined for the western section
of the London Basin (Fookes 1966). Fookes, working on an early
paper by Wooldridge (1926) showed that the maximum probable thick-
ness of the London clay was approximately 500 ft. in Essex and may
actually have decreased westward. This discrepancy between the
geological evidence and the pre-consolidation pressures determined
from laboratory tests for the western part of the London Basin,
Fookes sought to explain by supposing that the thickness of the
late Eocene formations such as the Barton Beds, may have been
considerably greater in this section before they were removed by
erosion.
The method suggested in this thesis of determining the
pre-consolidation pressures of London clay, may be criticised
mainly on the following grounds:
(a) the position of the sedimentation curve is, to some
extent, uncertain and
For location of all these sites see Fig. 4.1.
231.
(b) how correct is the hypothesis that the geologic rebound
is parallel to the laboratory rebounds.
As already mentioned the sedimentation curve for a
natural clay during deposition is most difficult to determine.
Initial moisture content and/or the rate of loading play important
parts in influencing the deformation of remoulded clays in the
laboratory and unless sedimentation tests can be carried out at
very slow rates of loading and under conditions similar to those
in nature this uncertainty will prevail. But as explained earlier,
at high pressures and near the virgin curve, determined from tests
on undisturbed samples, the discrepancies between the possible
sedimentation curves are likely to be small and it is in this
range that the pre-consolidation pressures of London clay lie.
The phenomena associated with the geologic rebound of
over-consolidated clays have been discussed in Chapter 4. Depend-
ing on the nature of diagenetic bond developed after deposition
(Bjerrum 1965) a clay will have certain unloading characteristics
which may be difficult to reproduce in the laboratory. The only
possible way to verify the correctness of the hypothesis that
geologic rebound is parallel to the laboratory rebound is to check
the latter with the field pressure - void ratio relationships. No
data are available of the water content/depth profile for Ongar or
Wraysbury. However, it is possible to examine the data for Brad-
well and Ashford Common and compare them with the rebound curves
232.
for Ongar and Wraysbury respectively. The results are shown In
Fig. 10.58.
Assuming that erosion has reduced the effective stresses
by 13.4 T/ft2 at Bradwell and 38.5 T/ft2 at Ashform Common a series
of rebound curves* are drawn for various depths of the present soil
profiles. The probable pressure - void ratio relationships are
then plotted for the two sites as shown by the solid dots. From
water content - depth profiles given by Skempton and Bishop et al
the field void - ratio vs effective stress relations are then
plotted - indicated by the open circles. It will be seen that for
Bradwell the field e-log p curve lies somewhat above the labora-
tory prediction, but, except for the points near the surface, they
are remarkably parallel. For Ashford Common, on the other hand,
the field curve lies very close to the laboratory prediction and
is also parallel to the latter. If the pre-consolidation pressures
were accurately determined and the geologic rebound was parallel to
the laboratory rebound the field and laboratory curves would, of
course, have coincided. However, the fact that the field and
laboratory curves are parallel to one another for both sites - in
the range of stresses where direct comparison is possible - indicates
that the hypothesis of the parallel nature of the geologic and
Parallel to the Ongar rebound curves for Bradwell and Wraysbury rebound curves for Ashford Common.
233.
laboratory rebound curves is at least approximately correct. It
appears that for Bradwell the pre-consolidation pressure may have
been a little over-estimated although the possibility is not dis-
counted that the rebound curve at this site had a greater slope
than at Ongar at the higher stress range. For Ashford Common, on
the other hand, the closeness of the field and laboratory curves
suggests that both the pre-consolidation pressure and the rebound
characteristics are correctly determined. In any event, the data
plotted in Fig. 10.58 indicate that the pre-consolidation pressures
for sites to the east of the London Basin are lower than those for
sites to the west.
The field evidence presented here is too limited to allow
any definite conclusions to be reached. Nevertheless, it is clear
that the use of laboratory rebound curves provides a reasonable
means for determining the pre-consolidation pressure of over-
consolidated clays. One major requirement for the success of this
method is that the laboratory rebounds should be started from
pressures sufficiently greater than the pre-consolidation pressure.
Previous studies with Bearpaw shale (Peterson 1958) and Fort Union
clay shale (Smith and Redlinger 1953) have not shown good agreement
between field and laboratory curves. This lack of agreement has
generally been attributed to the large "time rebound" in the field.
It is also possible that this is due to the laboratory rebounds
being carried out from pressures which are too small. Moreover,
234.
softening and weathering may alter the moisture content of the clay
near the surface (Terzaghi 1936, 1961, Skempton 1948 ). To enable
valid comparisons to be made, therefore, water content data from
deeper borings in over-consolidated clays is required, together
with a knowledge of the existing porewater pressure distribution
with depth.
10.4 Tests in oedometers fitted with s:taii-Leages
10.4.1 Introduction
The purpose of these tests was to study the stress path
and to determine the coefficient of earth pressure at rest (Ko)
of undisturbed London clay during one-dimensional consolidation in
the standard oedometer. The equipment and experimental procedures
have been described in Chapter 9.4.
As pointed out by Tschebotarioft (1952) the term coefficient
of earth pressure at rest Ko was originally introduced by Donath
(1891), who defined it as the ratio fo the horizontal to vertical
earth pressure resulting in a soil from the application of vertical
load under condition of zero lateral yield. Initial efforts to
determine the value of Ko were made by Terzaghi (1920, 1925) who,
using the friction tape method obtained typical values of 0.4 to
0.5 for sand and 0.7 for a remoulded marine clay. Kjellman (1936)
found from one-dimensional compression tests on cubical specimens
of sand that the coefficient Ko was a function of the stress
235.
history of the soil. An apparatus for measuring the variation of
lateral pressure during one-dimensional consolidation was developed
by Binnie and Price (1941). Bishop (1958) used the triaxial
apparatus to measure Ko for granular materials. During one-
dimensional compression, he kept the axial and volumetric strains
of a specimen equal - a method also used by Simons (1958). A more
elaborate procedure, using the lateral strain indicator, was
adopted at Imperial College by Fraser (1957) and Sowa (1963).
(See Bishop 1958, Bishop and Henkel 196a). A modified triaxial
apparatus consisting of an inner and an outer cell with mercury
filling the annular space between the sample and the inner cell,
was used for London clay by Webb (1966) (See Bishop, Webb and
Skinner 1965). Kjellman and Jacobsen (1955) tested cylindrical
samples of pebble and crushed rock which were enclosed in a series
of steel rings, the elastic extension of which served to indicate
the magnitude of the lateral stress. The same principle was
adopted by Cebertowicz and Wedzinski (1958) who measured the lateral
deformation of the oedometer ring during one-dimensional compression
of granular materials.
Another method, known as the "cell test', has been used
by Gersevanoff (1936), and Davis and Poulos (1963). This is based
on the principle that, with a loading ram of the same diameter as a
cylindrical sample, the latter could yield laterally during axial
loading only if water was allowed to escape from the cell. The
236.
increase of pressure required to maintain constant volume of the
cell water, therefore, gave a measure of Ko. As pointed out by
Bishop (1958), however, this method would give reliable results if
there was absolutely no leakage, the cell was rigid and the water
in the cell was incompressible and free of all air. Jackson (1964)
tested specimens of clay in the triaxial apparatus using different
stress increment ratios, and interpolated the value of Ko corres-
ponding to E l/cv (the ratio of the axial to volumetric strain)
equal to 1. Hendron (1963) and Brooker and Ireland (1965) used
specially designed oedometer cells to conform to the condition of
zero lateral strain. Hydraulic pressure was applied in a chamber
surrounding the oedometer ring to maintain null balance condition.
All the work mentioned above refer to measurement of K
in the laboratory. Few attempts have so far been made to measure
Ko directly in the field. There is, of course, considerable
difficulty in this because the insertion of a measuring device
inevitably causes disturbances in the soil resulting in a change
of the state of stress! An indirect method of measuring in-situ
he r5.zoritaa stryieses has been proposed by Zeevaert (1953) based on
the determination of the pre-consolidation pressures in horizontal
and vertical directions of undisturbed specimens. A more satis-
* Recently Kenney (1967) has developed a device for ' measuring in-situ stresses in the Norwegian quick clays. It essentially consists of a large open pipe, instrumented with earth pressure gauges, which sinks under its own weight through the quick clay "without displacing the clay outwards".
237.
factory method, also indirect, based on the measurement of effective
stresses in undisturbed samples, has been used by Skempton (1961)
and Bishop et al (1965) to estimate large horizontal stresses in
natural London clay (see Chapter 8).
10.4.2 Variation of lateral stresses during consolidation
The variation of radial stresses during one-dimensional
consolidation in the strain gauge oedometers is shown diagrammati-
cally in Figs. 10.59 - 10.62. The test conditions were similar to
those in a conventional oedometer test. The lateral deformation of
the clay was restricted to the elastic extension of the confining
rings which also served to indicate the magnitude of the lateral
stresses. As already mentioned in Chapter 9.4, three tests were
performed on the Ongar clay, viz. O-SG-1, 2 and 3 in rings 1/32",
1/16" and in thick respectively.
At the end of the "swelling" stages of all tests, lateral
stresses considerably higher than the vertical "swelling" pressures
were measured (see Table 10.6) - the former being, on average, as
much as four times the latter. It has already been shown in Section
10.1 that considerable swelling took place during the performance of
a swelling test. But while a specimen could expand vertically due
to inadequate bedding it was restrained laterally by the confining
ring which caused large horizontal stresses to develop. There was,
however, no systematic increase of the lateral stress with thickness
238.
of the ring, the i" ring giving the minimum value.
As the tests were continued, following the procedures for
a conventional oedometer test, the following phenomena were observed.
At the moment of a load application the radial stress increased by
an amount depending on the vertical pressure increment and then
began to decrease during the progress of consolidation, finally
assuming a constant value at the end of dissipation. The reverse
behaviour was observed during unloading.
The variation of the lateral stress during consolidation
for each load increment of test nos. 0-SG..1 and 2* is shown in
greater detail in Figs. 10.62 - 10.66. It will be noticed that
at small pressures the maximum lateral stress was reached as soon
as the load was applied and then decreased with progress of con-
solidation. At higher pressures the lateral stress increased by
a small amount for a few minutes after the load application before
starting to decrease - a phenomenon which was more noticeable in the
case of the thinnest ring (test no. 0-SG-1). The reason for this
is believed to be the flexibility of the confining ring. A similar
phenomenon has been observed for dissipation of pore pressure in the
standard oedometer tests due to the flexibility of the measuring
system (Christie 1965, Tan 1968).
For 0-SG-3, the ring being j-" thick the variation of strain during consolidation was too small to be measured accurately with time. The initial and final values could, however, be noted correctly.
239.
The development of the maximum radial stress after load
application is shown in Fig. 10.67. It can be seen that except
for the first loading in test 0-SG-1, a maximum response of over
80% was usually achieved. For a perfect test with a completely
rigid system, this response should, of course, be 100%. But in-
complete saturation coupled with the lack of perfect rigidity of
the confining ring allowed a sample to undergo small initial de-
formations resulting in a response which was less than 100%. That
the flexibility of the ring played an important role in this is
indicated by the higher response achieved with the thicker rings.
10.4.3 Stress paths
The relationships between the vertical and radial stresses
measured at the end of consolidation are shown in Figs. 10.68 -
10.70. Except for test no. 0-SG-1 in which the specimen was un-
loaded from a vertical pressure of 250 lbs/in2 and then reloaded to
the maximum pressure of 500 lbs/in all the tests were taken straight
to the maximum vertical stress of 500 lbs/in2 and then unloaded. It
will be noticed that for each test the loading stress path consists
of two distinct sections - an initial flat portion followed by a
steeper straight line relationship between the vertical and radial
stresses. On unloading a familiar curve forming an hysteresis
loop was obtained.
It is necessary, at this stage, to differentiate between
240.
two values of th,"- coefficient of earth pressure at rest for over-
consolidated materials:
(a) Ko
defined as the ratio of the horizontal to vertical
effective stresses, ( 0- 1,/cr ,) and r v
(b) Ko defined as the ratio of the effective stress incre-
ments in the lorizontal and vertical directions required to main-
tain the condition of zero lateral strain, Ko cr t r v
The above distinction is necessary, because, for a
heavily over-onsolidated clay, the ratio of the existing effective
stresses (K ' may be high, depending on the over-consolidation
ratio, but the stress increments necessary to produce consolidation
under condition of zero lateral strain on the reloading cycle may
be quite different.
In Fig. 10.71 are plotted the values of Ko against
vertical effective stress while the variation of the incremental
coefficient Ko with pressure is shown in Fig. 10.72. It can be
seen that Ko
initially is very high but decreases sharply and
attains a steady value for vertical effective stresses greater than
100 lbs/iZ On unloading, Ko is always higher than the corres-
ponding value during loading, reflecting the effect of over-
consolidation. On the other hand, the increase of radial stresses
required to maintain the condition of no lateral strain is small
in the low stress range as indicated by the initial flat portions
of the stress paths shown in Figs. 10.68 - 10.70. Consequently
241.
Ro (see Fig. 10.72) is small for pressures below 100 lbs/in2 but
increases rapidly to attain a fairly constant value, approaching
Ko, over most of the stress range.
Fig. 10.73 shows the variation of Ko with over-consolida-
tion ratio during unloading. For comparison the results of tests
on remoulded London clay (Brooker and Ireland 1965) are also shown.
It will be noticed that Ko
is greater than 1 (i.e. effective
horizontal stresses greater than the vertical) for O.C.R. > 3 and
may be as high as 3.5 for O.C.R. = 40.
Table 10.7 shows the values of Ro obtained from the
three tests described above. Two values are quoted for each test
- one for the initial slope and the other for the final. It is
clear that Ro is small (0.28) for effective vertical stresses
less than 100 p.s.i. although over most of the range (100 ((5"v'
< 500 p.s.i.) a higher value 0.64 is obtained. In Fig. 10.74
these results are compared with the results of tests on remoulded
London clay (Brooker and Ireland 1965) and on undisturbed London
clay from Ashford Common (Webb 1966). It should be emphasised
that Brooker and Ireland performed their tests in a specially
designed oedometer cell where the condition of no lateral strain
was ensured by applying fluid pressure in a chamber surrounding the
oedometer ring to maintain null balance - while Webb performed his
test in the Ko - triaxial cell (Bishop, Webb and Skinner 1965).
In spite of the variations of testing techniques the close agreement
242.
between the results is remarkable. While the test on the remoulded
clay produces a straight line relationship starting from the origin
that on the undisturbed material from Ashford Common* shows a flat
initial portion similar to the ones for Ongar. Over most of the
range, however, all the curves are almost parallel, giving values
of Ro between 0.61 and 0.64.
In Fig. 10.75, the in-situ values of Ko estimated for
London clay at Bradwell (Skempton 1961) and Ashford Common (Bishop
et al 1965) are compared with the results of the laboratory tests
on the clay from Ongar. Although the Bradwell values lie a little
above the laboratory curve, the agreement, on the whole, is con-
sidered satisfactory.
10.4.4 Discussion of results
The principle adopted to measure the lateral stresses
during oedometer consolidation, as reported in this thesis, was
originally used by Kjellman and Jakobson (1955), Jakobson (1958)
and (ebertowicz and Wedzinski (1958). The major criticism of the
method is that the condition of no lateral strain is not strictly
enforced because small lateral deformations must occur to enable
the pressure to be recorded. Lower values of Ko measured for
granular material by Cebertowicz and Wedzinski (op. cit.) was
The initial state of stress in this test was an all round effective stress of 10 lbs/in2 to which the specimen was allowed to tswell before the K
o stage was carried out.
243.
attributed by Rowe (1958) to this lateral deformation.
In the present investigation, three different ring thick-
nesses were used to determine whether the lateral strain influenced
the measured values of the lateral stress in any significant way.
Since the thickness to diameter ratios of all the rings were smnil
(1/24 for the i" ring to 1/96 for the 1/32" ring) their behaviour
could be assumed to be similar to that of thin rings subjected to
uniform radial pressures: For such a ring the lateral strain is
inversely proportional to the thickness (Timoshenko and Goodier
1954) and, therefore, the passage from an -" ring to a 1/32" ring
would mean approximately fourfold increase of the radial strain.
Calculations based on the theory of elasticity and the measured
strains showed that under the maximum vertical pressure of 500 lbs/
in2 the lateral strain would be no more than 1% of the vertical
strain for the 1/32" ring. Thus the deviation from the condition
of no lateral strain, even for the thinnest ring, was very small.
Moreover, the lateral stresses measured at any vertical stress does
not show any significant variation with the thickness of the ring
(see Figs. 10.68 - 10.70) and consequently the values of Ro are
almost the same for all the tests (Fig. 10.72). Also the results
agree well with measurements under strict condition of zero lateral
strain by Brooker and Ireland (1965) and Webb (1966). It is con-
* Assuming, for the moment, that shear stresses due to side friction were absent.
244.
eluded, therefore, that the slight lateral deformation of the
sample caused by the elastic extension of the rings had no measur-.
able effect on the lateral stresses during consolidation.
The other area of uncertainty in the measurement of
lateral stresses with strain gauges fixed to the outside of an
oedometer ring is the influence of the shear stress caused by
friction between the soil specimen and the ring. Three major
effects of side friction may be considered:
(a) The effective stress transmitted to the sample at any
given load is likely to be less than the load applied at the
boundary and consequently the lateral stress set up in the specimen
may be less. However, as discussed in section 10.2.2 this effect
is unlikely to be very significant for London clay over most of
the range except at very low vertical stresses where relatively
high lateral stresses are measured.
(b) The side friction may also affect the measured value of
the lateral stresses because the calibration of the rings was done
with water pressure - i.e. in the absence of any shear stresses.
A rigorous analysis of this error is difficult, but an approximate
analysis can be made (see Appendix F) on the assumption that the
entire side friction can be replaced by a vertical face acting on
top of the inside edge of the oedometer ring. This shows that the
maximum possible error from this source alone would be less than
5%. Since the accuracy of measurement is probably not attainable
245.
to such precision due to such factors as the variations of tempera-
ture and general scatter this error can be neglected.
(c) Perhaps an important effect of side friction is that it
actually changes the distribution of stresses within the sample
thus causing different lateral stresses to be set up at the centre
and towards the edge of the specimen. The effect is likely to be
accentuated by the non-uniform stresses caused by the rigid loading
cap. Little is known on this point, however, but it is believed,
that where side friction does not reduce the average vertical stress
within the sample by any great amount the distribution of lateral
stresses will not be significantly affected.
The variation of the lateral stress during consolidation
(Figs. 10.62 - 10.66) reflects the decrease of Poisson's ratio ( )
with volume change of the clay. It is well known, from the
classical theory of elasticity, that at the moment of load applica-
tion - under undrained conditions - a Poisson's ratio of 0.5 is
implied for a specimen of saturated clay. With dissipation of ex-
cess pore pressures, however, the sample changes in volume which
results in a decrease of ,) until the latter attains its fully
drained value at the end of consolidation. According to the well
known expressiono - , therefore, should decrease
from 1 to its final value, with respect to effective stresses, when
consolidation is complete. The values of calculated from the
final values of Ro (see Table 10.7) show that Poisson's ratio,
246.
under fully drained conditions is small (0.21) in the low stress
range but considerably higher (0.39) in the high effective stress
range. • The influence of stress path on Poisson's ratio is, there-
fore, obvious. (More discussion of this point will be made in
Chapter 11).
The duration of the pressure increments was not long
enough to study the effect, if any, of creep on the value of K.
Some of the increments which were kept for 2 - 3 days, did not
show any variation of lateral stresses after 24 hours suggesting
that Ko does not change significantly with time (see also Bishop
1958a).
The empirical relation between Ko and the angle of
shearing resistance 0' given by Jaky (1944) for normally consolida-
ted soil,
Ko . 1 - Sin 0' (10.4.1)
has been found to give satisfactory results for a wide variety of
sands and clays (Bishop 1958, Simons 1958, 1960b). For normally
consolidated London clay 0' determined from tests on remoulded
samples lies in the range 17o - 20°, giving values of Ro, from
equation (10.4.1), between 0.66 - 0.72 (Bishop, Webb and Skinner
1965). The undisturbed 0ngar clay has 0' equal to 21° (see
Chapter 11), for which the Jaky expression gives R0 = 0.642.
247.
This agrees almost exactly with the value obtained experimentally
for higher pressures, i.e. in the normally consolidated range (see
Fig. 10.74).
Brooker and Ireland (1965) from tests on five widely
different clays concluded that equation (10.4.1) slightly over-
estimates the value of Ko for clays although, for sands, it has
proved satisfactory (Hendron 1963). Based on their results, Brooker
and Ireland found that a slightly modified equation
Ko = 0.95 - Sin 0' (io.4.2)
seemed to fit the test data better than the original Jaky equation.
Using the same results Schmidt (1966) suggested that another re-
lationship
Ko 1 - 1.2 Sin,0' (10.4.3)
was even better both in form and in fit. These modifications of
the Jaky equation may make only small differences in the value of
Ko, but it is perhaps significant that all the clays tested by
Brooker and Ireland show Ko values slightly lower than those
suggested by the Jaky equation - the discrepancy becoming greater
with higher values of the angle of shearing resistance.
The influence of stress history on Ko can be clearly
248.
seen from Fig. 10.73. During rebound, Ko increases steadily with
over-consolidation ratio (O.C.R.) and after the latter has exceeded
a certain value the horizontal effective stress becomes greater than
the vertical. For London clay Ko is greater than 1 when the
O.C.R. exceeds 3 and may be as high as 3.5 for an O.C.R. = 40.
It is believed that the maximum value Ko may attain at
any over-consolidation ratio is the coefficient of passive earth
pressure K which is dependent on the effective stress parameters
of the clay (Terzaghi 1943). Bishop, Webb and Lewin (1965) have
shown that in natural London clay the in-situ stresses may be con-
siderably in excess of the passive pressures based on the residual
strength of the clay but less than those based on the peak strength
parameters.
Recently, Schmidt (1967), from a study of Brooker and
Ireland's data on five clays found that during one-dimensional re-
bound the relationship between Ko and O.C.R. may be expressed by
the following empirical relationship,
K rb K ' 0
0-v'max n
(10.4.5)
Tv '
o where K rb is the coefficient for rebound
Ko' is the coefficient for 0.C.R..1 i.e. at the end of
the loading stage and Tv
' max is the over-consolidation ratio.
249.
According to this equation:: log (Korb) is proportional to log (OCR).
Plotting the average Ko vs O.C.R. relationship for the three Ongar
tests on a log - log basis a straight line is indeed obtained (see
Fig. 10.76) which seems to verify equation (10.4.5). For comparison
the corresponding line for remoulded London clay is also shown.
The only way to check the validity in nature of the re-
lationship between Ko and O.C.R., of the type shown in Fig. 10.73,
is to compare such data with field observations. It has already
been mentioned that direct measurement of horizontal stresses in-situ
presents almost insurmountable difficulties and, therefore, only in-
direct estimates have so far been made. The limited data available
for the sites of Bradwell and Ashford Common (see Fig. 10.75) show
reasonably good agreement with the laboratory results. It is worth
emphasizing, in this connection, that the over-consolidation ratios
of London clay at the two sites were calculated on the basis of
estimated values of the pre-consolidation pressures. The good agree-
ment between the field and laboratory data, therefore, indicates once
again that the pre-consolidation pressures at Bradwell and Ashford
Common have been estimated fairly accurately (see section 10.3).
However, more field data of this type should be collected before any
definite conclusions can be made.
The stress paths shown in Figs. 10.68 - 10.70 and the
variation of Ko
and Ko with pressure, plotted in Figs. 10.71
and 10.72, suggest an important result that may be of great
250.
practical significance. It is easily understood that the con-
solidation of London clay in the laboratory is essentially a re-
loading, following the geologic rebound in the field, until the
pre-consolidation pressure has been reached and this is reflected
in the initial flat portions of the effective stress paths and the
small Ro values measured at the low stress range. Previous work
on sand (Fraser 1957, Bishop 1958) has shown that Ro on re-
loading is considerably less than that on first loading. The
results presented above show a very similar trend. At higher
stresses - that is near the pre-consolidation pressure and beyond
- the clay behaves as a normally consolidated material with respect
to stress changes and consequently the Ro values are almost equal
to those obtained from tests on remoulded clays.
It must be mentioned, of course, that the effective
horizontal stress measured when the in-situ vertical effective
stress of the samples are restored in the oedometer is still con-
siderably smaller than the estimated in-situ horizontal stress (see
Table 8.4), shown by the solid dot in Fig. 10.74. This is thought
to be due to sampling disturbances and the initial volume change
that occurred in the samples during the performance of the swelling
tests. This means that it has not been possible to reproduce in
the laboratory the probable in-situ reloading stress path. Never-
theless, it is believed that the in-situ R0 in the low vertical
stress range will be small but comparable to the values of K0
251.
measured in the laboratory. And it is in this range that the in-
crease of effective stresses beneath a typical foundation problem
will lie.
The use of oedometer test results to calculate settlement
of structures implicitly assumes that the increase of stresses in
the field are similar to those in the oedometer. Taking, for ex-
ample, the points beneath the centre of a uniform circular load,
this means that the horizontal and vertical effective stresses in
the field should increase during consolidation in such a way that
8(Th 1/66vl = Ro = 0.28. It has been shown in Chapter 7 (see
Fig. 7.3) that this ratio of the effective stress changes during
consolidation depends on the pore pressure parameter A and the
Poisson's ratio and over most of the range is considerably
greater then the value of Ro. Therefore the stress paths in the
field and in the oedometer are likely to be quite different and con-
sequently the settlement calculated on the basis of the oedometer
test results, assuming one-dimensional strain, may be far from
correct. (This point has been qualitatively described, in more
detail, in Chapter 5 - see Fig. 5.11).
It follows, of course, that in cases where the ratio
A 0.-- t/Ao-v, in the field is similar to that in the oedometer settlement predictions based on the oedometer test results may be
correct. This is often true of normally consolidated clays having
high values of Ro and may explain the good correlation between
observed and calculated settlements of structures on such clays.
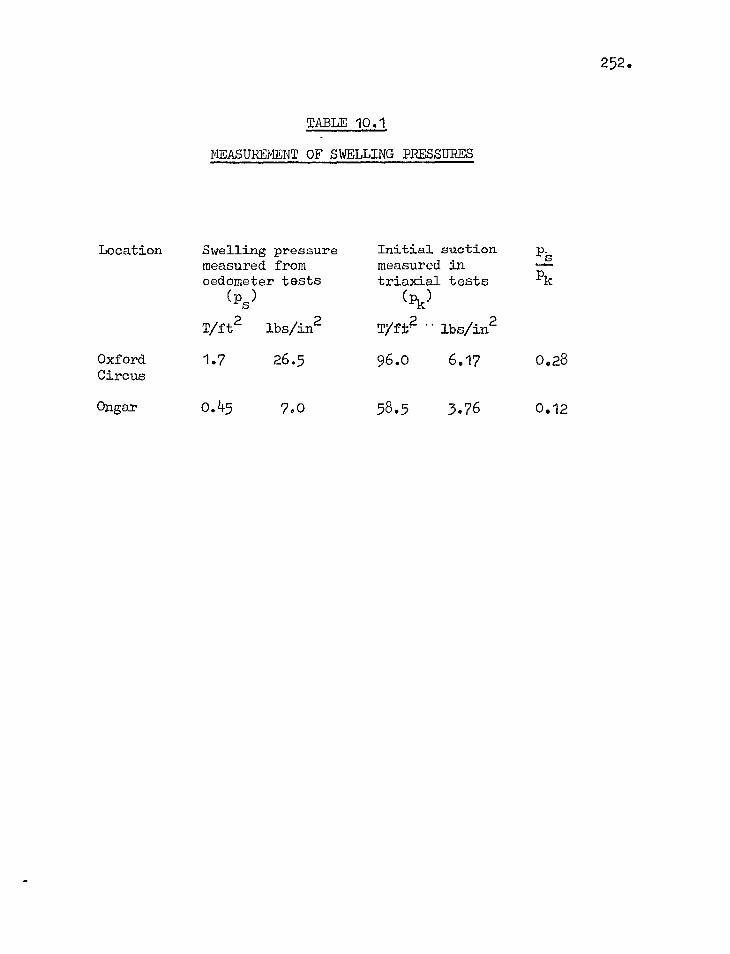
TABLE 10.1
MEASUREMENT OF SWELLING PRESSURES
Location Swelling pressure Initial suction measured from measured in oedometer tests triaxial tests
(ps) (Pk)
T/ft2 lbs/in2 Tift.2 - lbs/in2
Oxford 1.7 26.5 96.0 6.17 0.28 Circus
Ongar 0.45 7.0 58.5 3.76 0.12
252.
P-s Pk
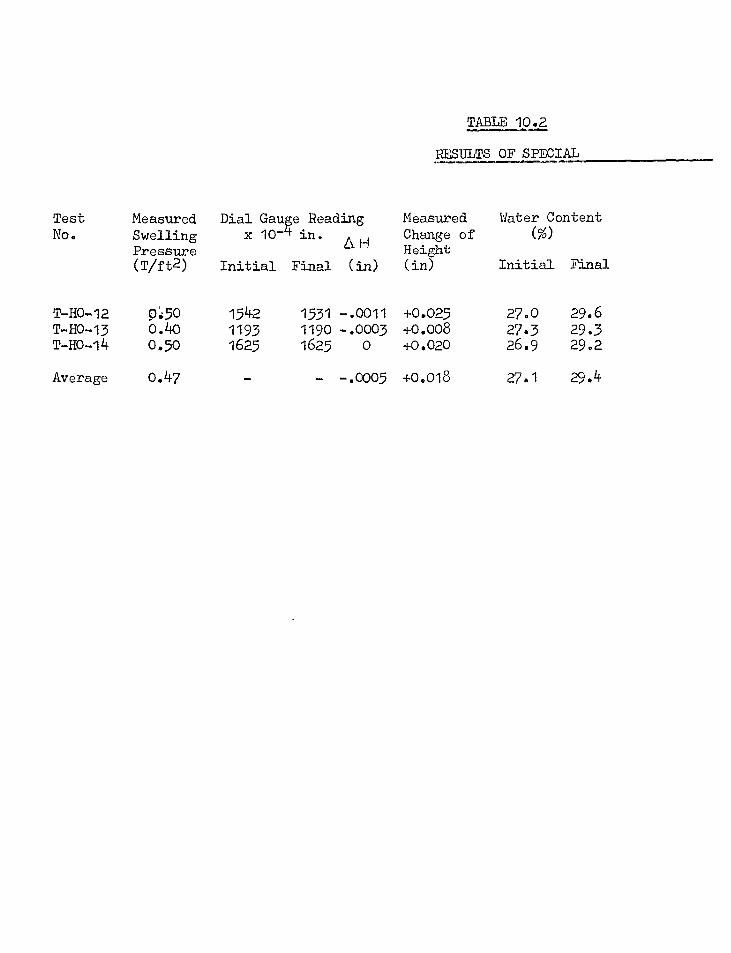
TABLE 10.2
RESULTS OF SPECIAL
Test No.
Measured Dial Gauge Reading Swelling x 10-4 in.
ZS H Pressure (T/ft2) Initial Final (in)
Measured Change of Height (in)
Water Content (%)
Initial Final
T-H0-12 9;50 1542 1531 -.0011 +0.025 27.0 29.6 T-H0-13 0.40 1193 1190 -.0003 +0.008 27.3 29.3 T -HO -14 0.50 1625 1625 0 +0.020 26.9 29.2
Average 0.47 - -.0005 +0.018 27.1 29.4
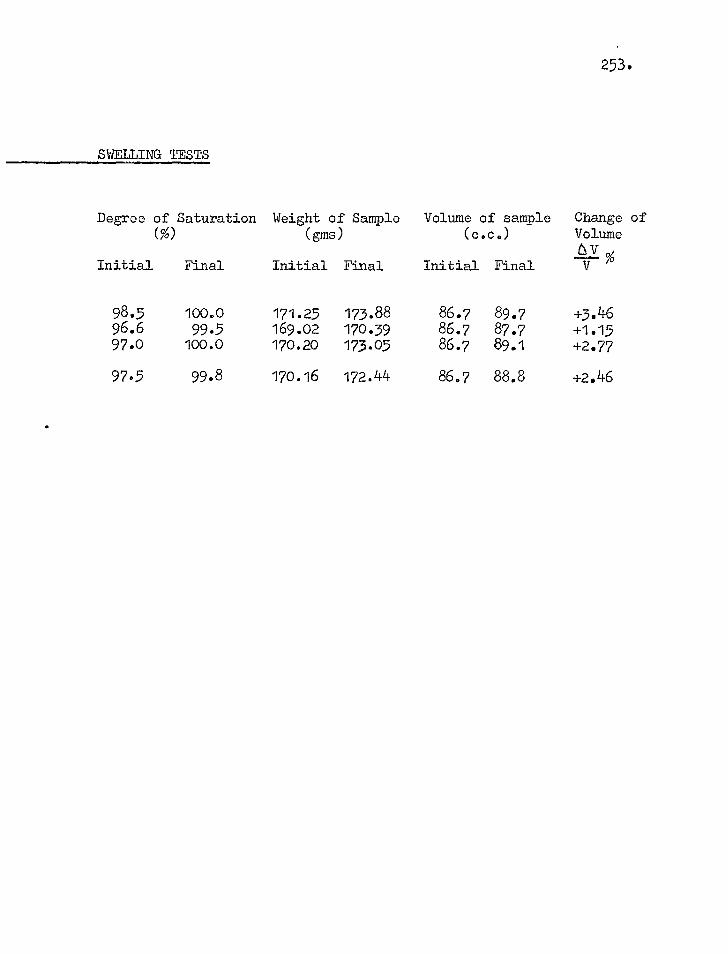
SWELLING ltSTS
Degree of Saturation Weight of Sample Volume of sample Change of (%) (gms)
(c.c.)
Volume 6.1/
Initial Final Initial Final Initial Final
98.5 100.0 171.25 173.88 86.7 89.7 +5.46 96.6 99.5 169.02 170.39 86.7 87.7 +1.15 97.o 100.0 170.20 173.05 86.7 89.1 +2.77
97.5 99.8 170.16 172.44 86.7 88.8 +2.46
253.
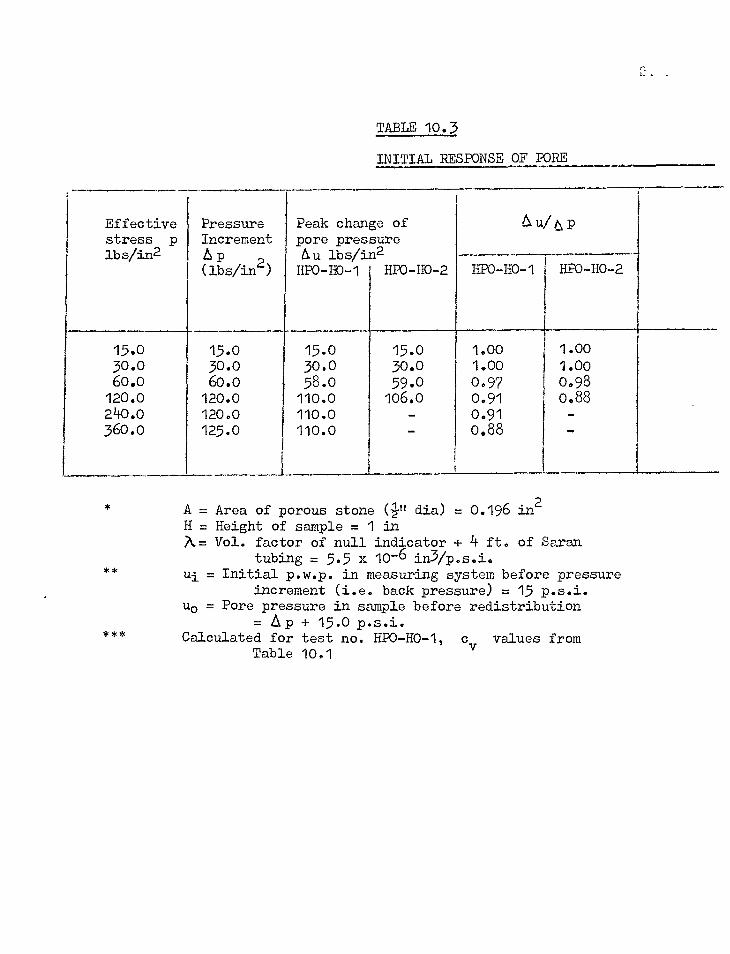
TABLE 10.3
INITIAL RESPONSE OF PORE
Effective Pressure Peak change of ilu/tp stress p Increment pore pressure lbs/in2 LID 2 A.0 lbs/in2
(lbs/in ) HPO-HO-1 HPO-H0-2 HPO-H0-1 HPO-H0-2
15.0 15.0 15.0 15.0 1.00 1.00 30.0 30.0 30.0 30.0 1.00 1.00 60.0 60.0 58.0 59.0 0.97 0.98 120.0 120.0 110.0 106.0 0.91 o.88 240.0 120.0 110.0 - 0.91 - 360.0 125.0 110.0 - 0.88 -
A = Area of porous stone (ill dia) = 0.196 in2 H = Height of sample = 1 in N= Vol. factor of null indicator + 4 ft. of Saran
tubing = 5.5 x 10⁻⁶ in5/p.s.i. * * ui = Initial p.w.p. in measuring system before pressure
increment (i.e. back pressure) = 15 p.s.i. uo = Pore pressure in sample before redistribution
= Alp + 15.0 p.s.i. * * * Calculated for test no. HPO-H0-1, values from
Table 10.1
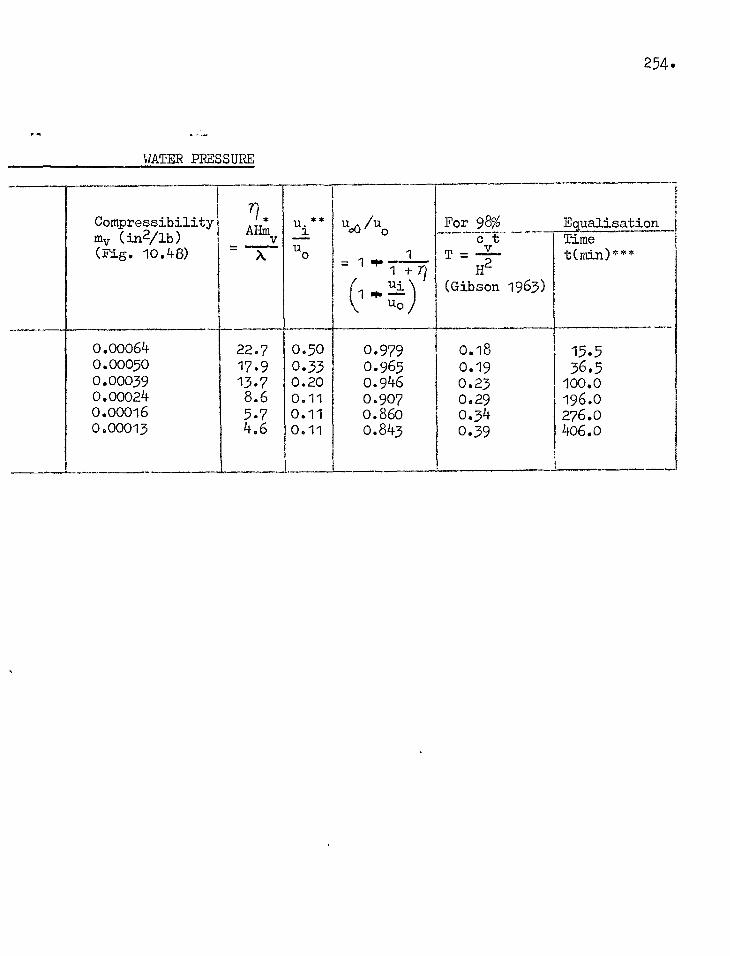
254.
11
WATER PRESSURE
Compressibility my (in2/lb) (Fig. 10.48)
71* Am v ui** -- ct
uo 1 114 /uo For 985 Equalisation
Time t(min)*** — T= X
H 2 = 1 • 7 _17
1 al ( vs \ uo (Gibson 1963)
0.00064 22.7 0.50 0.979 0.18 15.5 0.00050 17.9 0.33 0.965 0.19 36.5 0.00039 13.7 0.20 0.946 0.23 100.0 0.00024 8.6 0.11 0.907 0.29 196.0 0.00016 5.7 0.11 0.860 0.34 276.o 0.00013 4.6 0.11 0.843 0.39 2.106.0
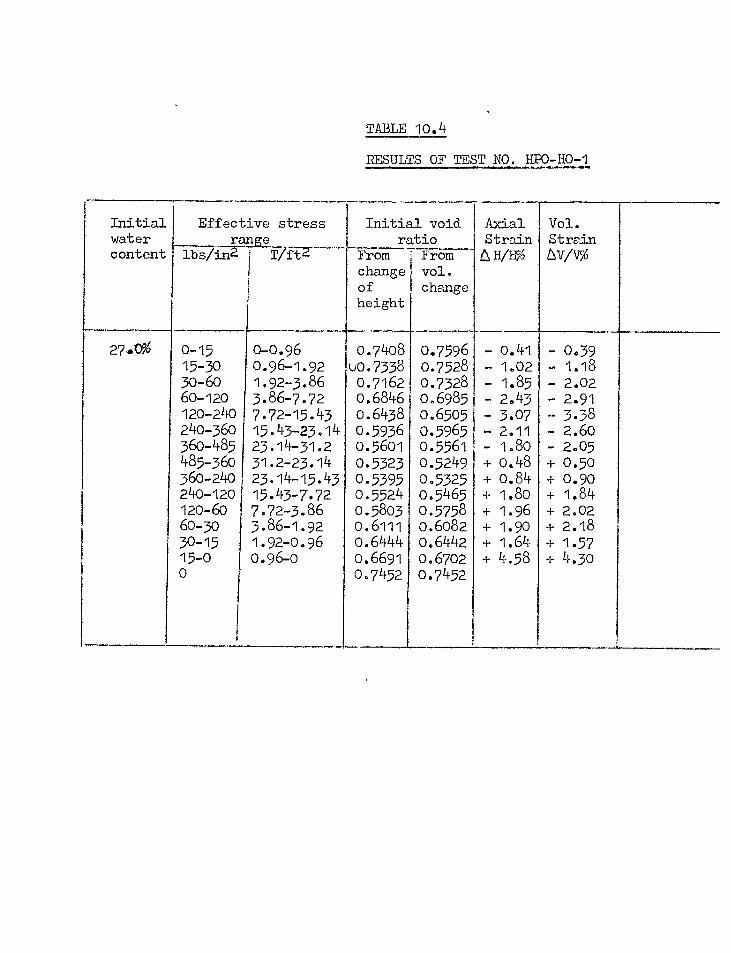
TABLE 10.4
RESULTS OF TEST NO. HPO-H0-1
Initial water content
Effective stress ran:e
Initial void ratio
Axial Strain AH/T4
Vol. Strain Av/v% lbs/in2 I Ilf-TE
Ichange From
of height
From vol. change
27.0% 0-15 0-0.96 0.7408 0.7596 - 0.41 - 0.39 15-30 0.96-1.92 u0.7338 0.7528 - 1.02 - 1.18 30-60 1.92-3.86 0.7162 0.7328 - 1.85 - 2.02 60-120 3.86-7.72 0.6846 0.6985 - 2.43 - 2.91 120-240 7.72-15.43 0.6438 0.6505 - 3.07 - 3.38 240-360 15.43-23.14 0.5936 0.5965 - 2.11 - 2.60 360-485 23.14-31.2 0.5601 0.5561 - 1.80 - 2.05 485-360 31.2-23.14 0.5323 0.5249 + 0.48 + 0.50 360-240 23.14-15.43 0.5395 0.5325 + 0.84 + 0.90 240-120 15.43-7.72 0.5524 0.5465 + 1.80 + 1.84 120-60 7.72-3.86 0.5803 0.5758 + 1.96 + 2.02 60-30 3.86-1.92 0.6111 0.6082 + 1.90 + 2.18 30-15 1.92-0.96 0.6444 0.6442 + 1.64 + 1.57 15-0 0.96-0 0.6691 0.6702 + 4.58 + 4.30 0 0.7452 0.7452
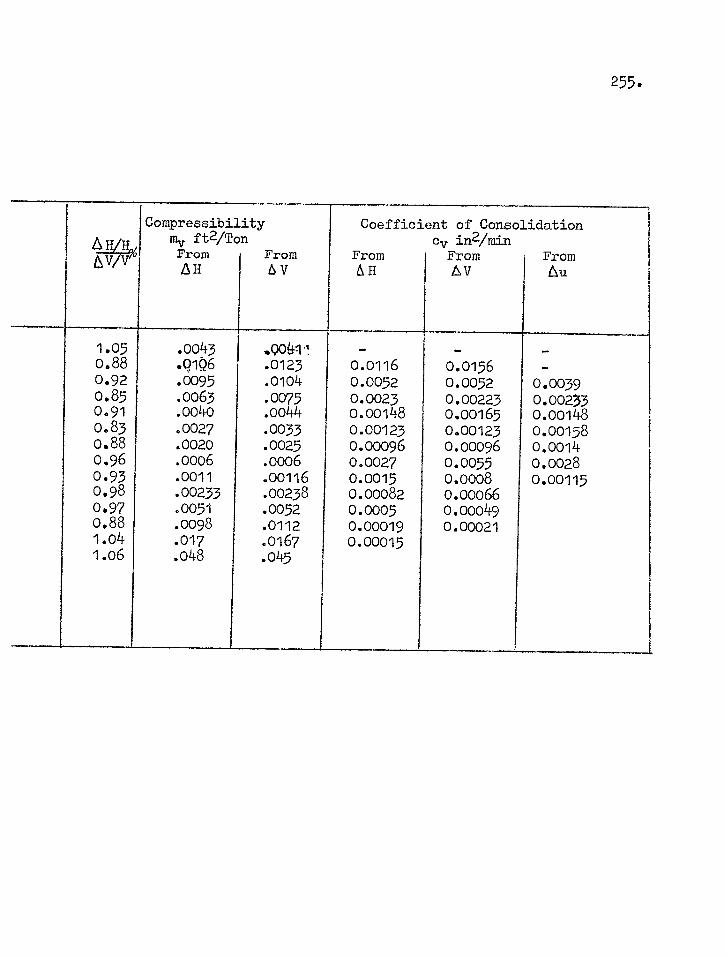
255.
AH
Compressibility my ft2/Ton From LH
From Q V
Coefficient
From 6 H
of Consolidation cy in2/min From AV
From Au
6\T v
1.05 .0043 .006.11. - - - 0.88 .9106 .0123 0.0116 0.0156 - 0.92 .0095 .0104 0.0052 0.0052 0.0039 0.85 .0063 .0075 0.0023 0.00223 0.00233 0.91 .0040 .0044 0.00148 0.00165 0.00148 0.83 .0027 .0033 0.00123 0.00123 0.00158 o.88 .0020 .0025 0.00096 0.00096 0.0014 0.96 .0006 .0006 0.0027 0.0055 0.0028 0.93 .0011 .00116 0.0015 0.0008 0.00115 0.98 .00233 .00238 0.00082 0.00066 0.97 .0051 .0052 0.0005 0.00049 0.88 .0098 .0112 0.00019 0.00021 1.04 .017 .0167 0.00015 1.06 .048 .045
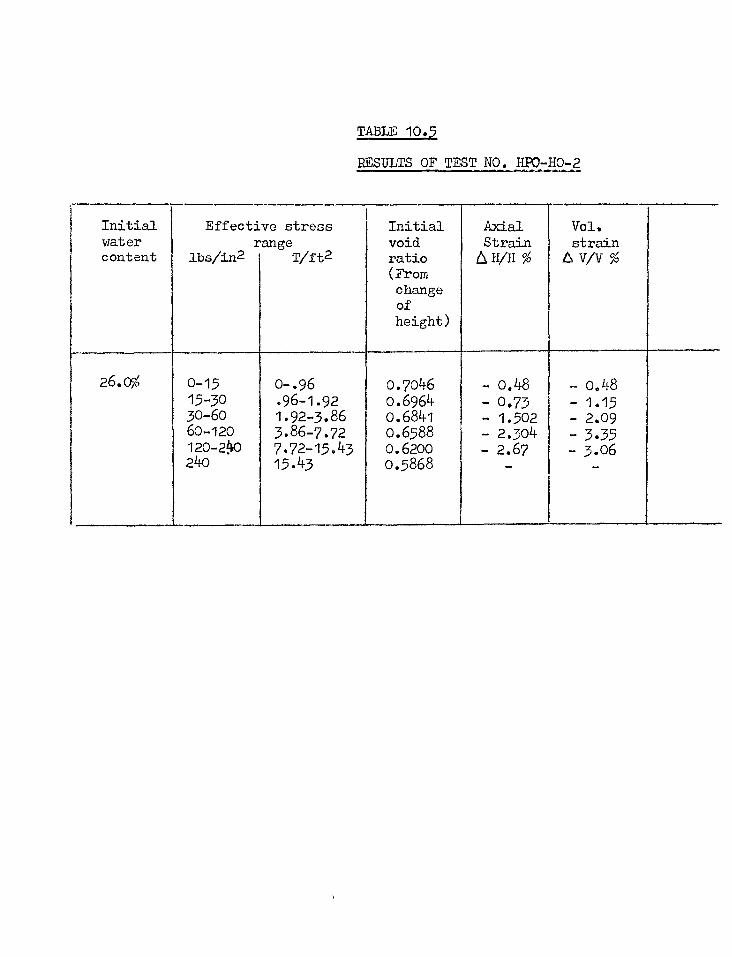
TABLE 10.5
RESULTS OF TEST NO. HPO-H0-2
Initial water
Effective stress range
Initial void
Axial Strain
[ Vol. strain
content lbs/in2 T/ft2 ratio 611/I1 % A V/V % (From change of height)
26.0% 0-15 0-.96 0.7o46 - 0.48 - 0.48 15-30 .96-1.92 0.6964 - 0.73 - 1.15 30-60 1.92-3.86 0.6841 - 1.502 - 2.09 60-120 3.86-7.72 o.6588 - 2.304 - 3.35 120-240 7.72-15.43 0.6200 - 2.67 - 3.06 240 15.43 o.5868 - -
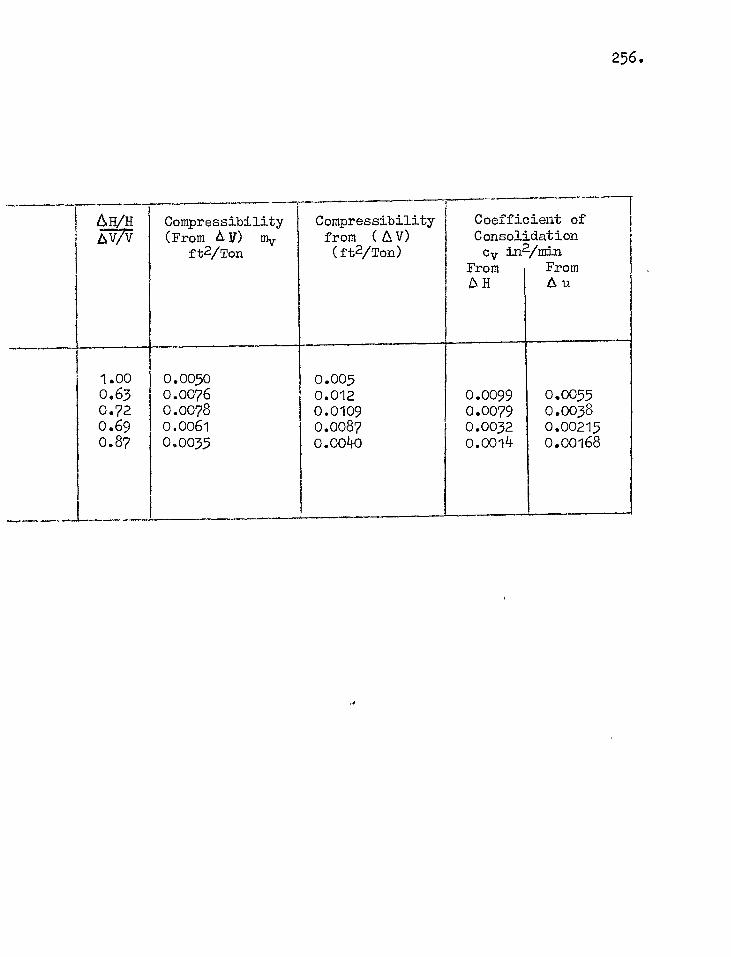
256.
16.H/H Compressibility Compressibility Coefficient of E777 (From E. IT) my from (A V) Consolidation
ft2/Ton (ft2/Ton) cv in2/min From From AH Au
1.00 0.0050 0.005 0.63 0.0076 0.012 0.0099 0.0055 0.72 0.0078 0.0109 0.0079 0.0038 0.69 0.0061 0.0087 0.0032 0.00215 0.87 0.0035 0.0040 o.0014 0.00168
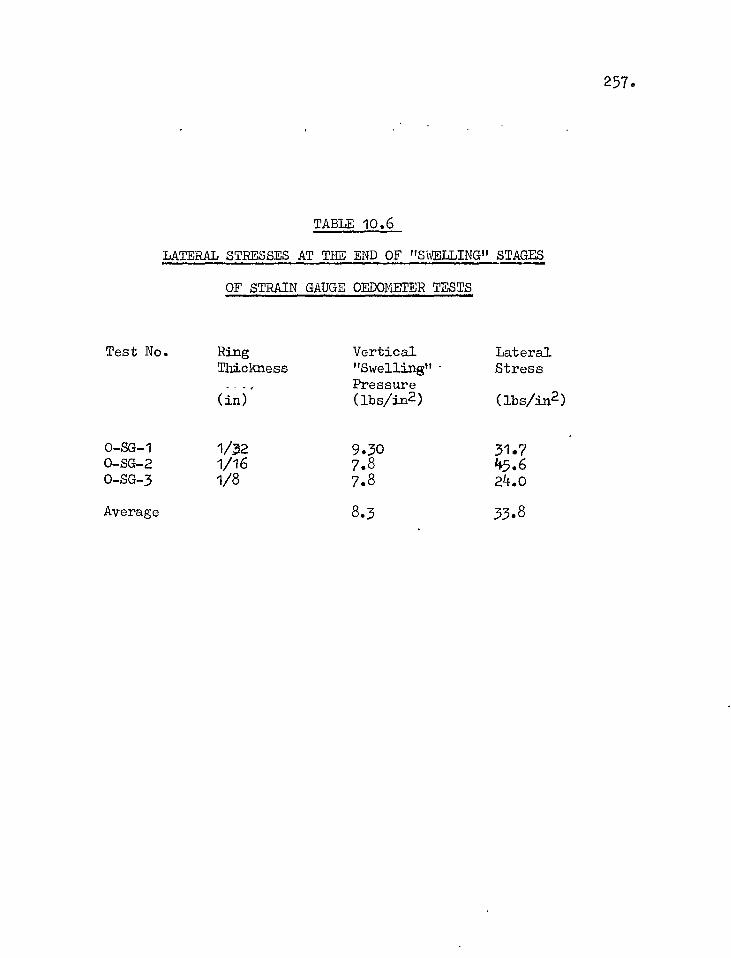
TABLE 10.6
LATERAL STRESSES AT THE END OF "SWELLING" STAGES
OF STRAIN GAUGE OEDOMETER TESTS
Test No. Ring Vertical Lateral Thickness "Swelling" . Stress _ ., Pressure
(in) (lbs/in2) (lbs/in2)
0-SG-1 1/32 9.30 31.7 O-SG-2 1/16 7.8 45.6 O-SG-3 1/8 7.8 24.0
Average 8.3 33.8
257.
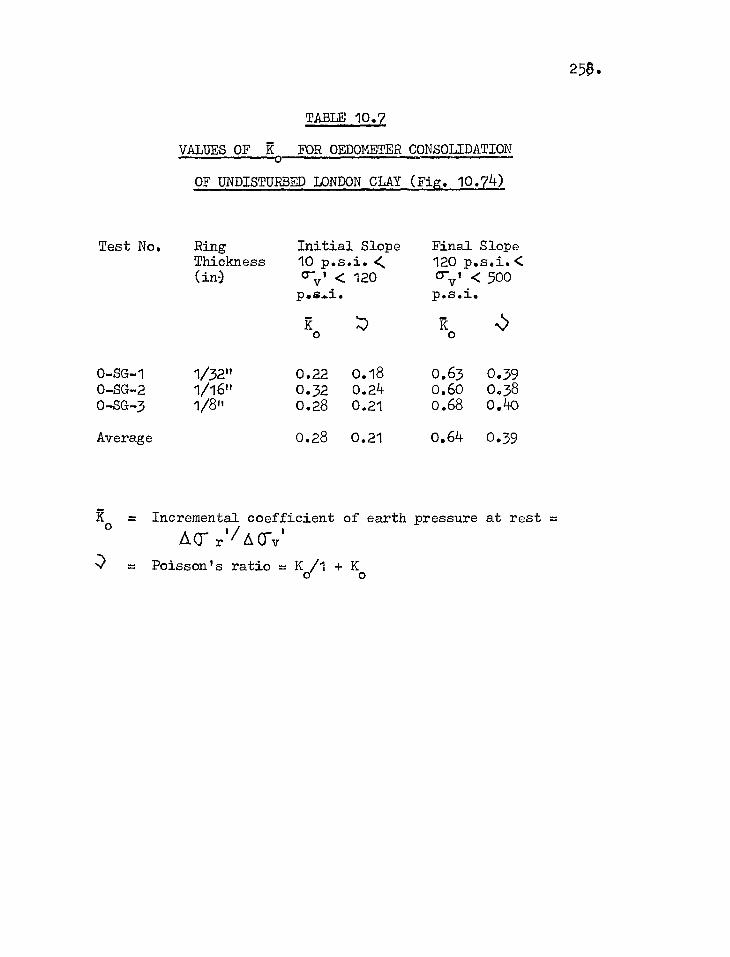
TABLE 10.7
VALUES OF Re FOR OEDOMETER CONSOLIDATION
OF UNDISTURBED LONDON CLAY (Fig. 10.74)
Test No. Ring Initial Slope Final Slope Thickness 10 p.s.i.< 120 p.s.i.< (in) Cy < 500 cry' < 120
p.s.i. p.s.i.
Ro ,,) Ro
0-SG-1 1/32" 0.22 0.18 0.63 0.39 0-SG-2 1/16" 0.32 0.24 0.60 0.38 0-sG-3 1/8" 0.28 0.21 0.68 0.40
Average 0.28 0.21 0.64 0.39
Ro = Incremental coefficient of earth pressure at rest =
AT r1/ CrIT I = Poisson's ratio = K/1 + K 0 o
259
CHAPTER 11
RESULTS OF TRIAXIAL TESTS
11.1 Presentation of data
The different types of triaxial tests performed and their
procedures have been described in Chapters 8 and 9 respectively.
In this section all the basic results will be presented. Analyses
of the data will be made in subsequent sections.
Al Tests
Figs. 11.1 and 11.2 show the stress - strain and pore
water pressure relationships for the unconsolidated undrained com-
pression tests. Each specimen was set up in the triaxial apparatus
and its initial suction measured. The sample was then sheared at
a nominal strain rate of 0.0005% per minute until failure. It
will be seen that for both Oxford Circus and Ongar the specimens
failed at strains of about 2% while the pore pressures reached their
peak a little earlier. Failure was usually of the brittle nature
along one or more shear planes. For each specimen the pre-shear
effective stress g r (i.e. the initial suction) has been given.
A2 Tests
The stress - strain relationships of the two Ongar specimsns
T-HO-4 and T-110-5 which were taken to failure in undrained extension
(cell pressure constant, axial stress decreasing) are shown in
Fig. 11.3. The shape of the stress - strain curves are similar
260.
•
to those for compression reported above, although the change of
pore pressure does not seem to follow the same pattern. It must
be laid, however, that none of these tests were taken to large
enough strains to define the post-failure behaviour of the pore
water pressure
A3 Tests
In Figs. 11.4 and 11.5 are plotted the stress - strain
- pore pressure relationships for Test Nos. T-H0-6 and T-H0-7.
The specimens were first unloaded (cell pressure constant, axial
stress decreasing) until the vertical effective stress was approx-
imately equal to that in-situ, followed by axial compression to
failure - all under undrained conditions. Hysteresis in the stress
- strain relationships is noticeable. Failure occurred at strains
of 3 - 4% which were greater than for the Al tests. The pore
pressure - strain relationships follow the familiar pattern.
Figs. 11.6 and 11.7 show the effective stress paths for
all the tests reported above. From Fig. 11.7 in which the Ongar
test data are plotted the following points may be noted:
(a) The stress paths radiate from the isotropic line at angles
which depend on the pore pressure parameter A. The change of
direction of the individual curves also reflect the variation of
'At during a test.
(b) The estimated in-situ effective stresses are very near to
failure - as indicated by the results of the extension tests. The
261.
effective stresses of the A3 specimens at the end of the unloading
stages were not exactly equal to the in-situ stresses although the
vertical effective stresses were similar.
(c) The stress paths for the A3 tests, corresponding to load-
ing, indicate that the pore pressure parameter 'A' during loading
is higher than during unloading, resulting in lower effective stresses
in a sample when isotropic conditions are restored than at the start.
(d) The shear strength depends on the pre-shear effective
stresses but is generally independent of the type of test - as in-
dicated by the unique failure line (max (T 1 - 0-3) produced by
both Al and A3 tests and the correspondingly similar line for ex-
tension (see section 11.2).
It must be emphasised here that the study of the shear
strength of London clay does not form an important part of this
thesis although from all the tests that were taken to failure it
is possible to determine the peak strength parameters of the Ongar
clay (see section 11.2). The main purpose of the above tests was
to study the deformation of London clay due to stress increase under
undrained conditions, the details of which are presented in section
11.3.
B1 Tests
The results of all the isotropic consolidation tests are
summarised in Table 11.2. No stress paths are shown - they are
along the isotropic line - but all relevant information can be
262.
found in Table 11.2. The variation of axial and volumetric strains
with time are shown in Figs. 11.36 and 11.37.
B2 Tests
Fig. 11.8 shows the stress paths and strains for the two
specimens which were consolidated anisotropically. For these tests
the vertical total stresses were held constant while the cell-
pressure was decreased, thus giving various stress - increment ratios
during consolidation. The results are also summarised in Table
11.3. Fig. 11.39 shows the variation of axial and volumetric strains
with progress of consolidation.
Cl Tests
In Fig. 11.9 are plotted the stress paths for the three
Oxford Circus tests T-00-4, 5 and 6 in which the specimens were
first loaded axially under undrained conditions to various stress
levels and then consolidated isotropically against back pressures.
The corresponding stress paths for the Ongar tests T-HO-10, 11, 13,
17 and 19 are plotted in Fig. 11.10. The first part (undrained)
of these stress paths are, in fact, similar to those for the Al
tests, while during consolidation the stresses increase along lines
parallel to the isotropic line. Table 11.4 gives the measured
strains during consolidation and also summarises all other informa-
tion. The development of axial and volumetric strains with pro-
gress of consolidation are shown in Figs. 11.40 and 11.41.
The stress - strain relationships for undrained loading
263.
for specimens T-H0-27 and 28 are given in Figs..11.9 and 11.10.
These tests were similar to the ones described in the preceding
paragraph except that in the undrained loading stage both the
axial and lateral stresses were increased. Since the samples
were fully saturated the pore pressure parameter B = 1 and it is
possible to separate the component of the excess pore pressure due
to the principal stress difference alone. The loading stages of
these tests were followed by two stages of isotropic consolidation
for which the stress paths are shown in Fig. 11.15. Specimen
T-H0-28 was then subjected to drained compression, increasing both
the axial and lateral stresses but keeping the stress increment ratio
constant, before finally taking it to failure by drained axial com-
pression. The consolidation data are summarised in Table 11.4.
C2 Tests
Figs. 11.14 and 11.15 show the stress - strain relation-
ships for undrained compression - both axial and lateral stresses
increasing - of Test Nos. T-H0-29 and 30. These tests were similar
to T-H0-28 and 29 described above, except that the loae,ing stages
were followed by anisotropic consolidation. The stress paths are
shown in Fig. 11.16 and the consolidation data are presented in
Table 11.5.
The stress - strain relationships for the final stages of
Test Nos. T-H0-28, 29 and 30 - drained axial compression to failure
- are plotted in Fig. 11.17. These data are similar to the stress
264.
- strain relationships for the conventional drained test except that
the pre-shear stress condition was anisotropic.
D Tests
The stress path and strain data for Test Nos. T-H0-14,
15 and 16 are plotted in Figs. 11.18, 11.19 and 11.20. It was in-
tended to bring these specimens to the in-situ stresses, indicated
by crosses in the stress path plots, before subsequent loading,
but, as has been mentioned earlier, the in-situ stresses were too
near failure in extension. Therefore, the unloading stages were
stopped a little short of the in-situ stresses and the specimens
were then loaded undrained to different stress levels, followed by
isotropic consolidation as in the case of the C1 tests. Although
Au shows negative values at the end of each test the pore pressures
were, in fact, positive because of the initially high pore pressure
at the start of each test. The numerical data are presented in
Table 11.5.
E Tests
The stress - strain relationships for Test Nos. T-H0-31,
32 and 33 are shown in Figs. 11.21, 11.22 and 11.23. In these
tests the specimens were loaded under fully drained conditions in-
creasing both the axial and lateral stresses - at various stress in-
crement ratios (K' = (T3'FaNTI ) Test no. T7410-31 had three
stages of different stress increment ratios while the remaining two
specimens T-H0-32 and 33 had only one such stage before all of them
265.
were taken to failure as conventional drained tests. For each test
the ratio of the axial strain to volumetric strain (C31/(;v) are
also shown. To facilitate presentation of data 07 v has been
plotted along the abscissa and rr h, as the ordinates.
F Tests
These were isotropically consolidated drained tests in
which the specimens were first consolidated to different effetive
stresses and then sheared to failure. Fig. 11.24 shows the stress
- strain - volume change relationships for the three vertical
specimens T-HO-24, 25 and 26. Three tests were also performed on
horizontal samples, i.e. the major principal axis in the direction
bedding and the results are shown in Fig. 11.25.
11.2 Shear strength parameters
It has already been mentioned that it is not a major part
of this thesis to study the shear strength characteristics of
London clay. However, from the tests that were taken to failure
it is possible to determine the peak strength parameters of the
clay from Ongar. Fig. 11.26 is a plot of 071, - 0-31Y2 vs
1 + a31/2 at failure for all the different types of test des-
crIbed in the previous section - failure being defined as the point
of maximum stress difference. It will be seen that all the points
lie on a faikly unique straight line giving C' = 3.0 lbs/in2 and
0' = 21° as the peak strength parameters of the Ongar clay. It
266.
appears that neither the type of test, drained or undrained, nor
the manner in which failure is reached has any significant in-
fluence on the shear strength parameters, which are, therefore,
sole functions of the effective stresses at failure. This is in
agreement with the results of tests on normally consolidated
Drammen clay (Simons 1960a) and artificially over-consolidated Oslo
clay (Simons 1960b) as well as undistrubed London clay from the
Ashford Common shaft (Bishop, Webb and Lewin 1965).
It is also of interest to note that the two extension
tests give effective stress parameters which are little different
from those from compression tests, supporting the findings of
Taylor and Clough (1951) and Parry (1956).
In Fig. 11.26 are also plotted, for comparison, the
results of tests on undistrubed London clay from Ashford Common
(Bishop, Webb and Lewin 1965) and Bradwell (Skempton and La
Rochelle 1965). It is noticeable that the Ongar results lie close
to those for Bradwell but well below those for Ashford Common'.
Moreover, the marked change of slope of the envelope for Ashford
Common in passing from low to high pressure range is totally
absent from the Ongar results.
11..5 Deformation under undrained conditions
It has been shown in Chapter 3 that, for structures on over-consolidated clays, the settlement at the end of construction
267.
may be well over half the total settlement and is, therefore, of
considerable importance. For an homogeneous, isotropic, elastic
, medium this immediate settlement (( i), which takes place under
the condition of no volume change (i.e. Poisson's ratio = 0.5),
is given by,
pi-E
_ 221 i (11.3.1)
where q is the foundation pressure, B is some convenient di-
mension of the foundation, E is Young's modulus and I p is the
influence factor given by the elastic displacement theory (Terzaghi
1943). Although it is true that a real soil does not behave as an
ideal homogeneous, elastic medium it has been shown in Chapter 6
that the classical Boussinesq analysis gives stresses beneath a
foundation which are reasonably accurate, even for a non-homogeneous
or a non-linear soil medium. To calculate the settlement from
elastic theory, however, accurate determination of the elastic
modulus E is of the utmost importance.
It has been the common practice for many years to obtain
the value of E from undrained triaxial compression tests on un-
disturbed samples of clay from beneath the foundation. However,
soils being essentially non-linear in their stress - strain relation-
ships the tangent modulus as well as the secant modulus change con-
tinuously with increasing shear stress thus making it imperative to
268.
choose some criterion on which the determination of E can be
based.
The most common procedure is, of course, to obtain the
value of E (the secant modulus) corresponding to a certain level
of stress such as one-half or a third of the failure stress
(Skempton and Henkel, 1957, Ward, Samu&ls and Butler 1959, Simons
1963, Ladd 1964). Some workers have chosen various levels of
strain (1%, 2'4, 5% etc.) as the criterion (Seed and Chan 1957,
Mitchell 1964). Although neither of the above-mentioned criteria
is complete in itself, the stress based one is certainly more satis-
factory as it is the stresses which are known in a foundation pro-
blem and the strains which have to be determined.
The elastic modulus cf a soil depends not only on the
effective normal stresses but also on the shear stresses which act
on it - their effects being in opposition to one another. With
increasing normal stresses an element of soil becomes stiffer, but
increasing shear stresses cause it to deform more. This will:be
clear from the stress - strain relationships shown in Fig. 11.2
where it can be seen that specimens having higher pre-shear
effective stresses have steeper stress - strain curves giving higher
modulus of elasticity at any strain. But with increasing stress
difference the modulus decreases.
The non-linearity of stress - strain relationships of
London clay even at small strains can be clearly seen from Figs.
269.
11.27 and 11.28 where some of the stress - strain data have been
replotted to a larger scale for strains of up to 1%. This shows
that the modulus changes appreciably even at small strains. In
Fig. 11.29 are plotted the values of secant modulus calculated for
-different stress levels from all the Oxford Circus tests. To
facilitate comparison the modulus has been expressed in non-
dimensional terms by dividing it by the pre-shear effective stress
(crr') for each test. The corresponding data for the Ongar tests
are plotted in Fig. 11.30. For the A3 and D tests (stress - strain
relationships shown in Figs. 11.4, 11.5 and 11.18 - 11.20) the
compression modulus has been calculated with reference to the point
corresponding to the end of the extension stage and has been divided
by the mean effective stress ( m )o
. at that point: Although
there is considerable scatter, which is typical of London clay, the
definite trend of the variation of E with stress ratio is clearly
established. The following features of Figs. 11.29 and 11,30 are
of particular interest:
(a) There appears to be definite relationships between the
non-dimensional quantity EMT m ')o or E/( Cr')r and the effective
stress ratio during shear. This means that for any stress ratio
the secant modulus E is proportional to the pre-shear effective
stress (.0 ,)o or CT r
This canbe clearly seen from Figs.
For specimens sheared from initially isotropic condition T' = ( (7 ) r m o
270.
11.31 and 11.32 where E for compression has been plotted againtt
the pre-shear effective stress for stress ratios 1.5 and 2.0.
Similar relationships have been obtained by Ladd (1964) who carried
out an extensive investigation on four undisturbed clays. It must
be recognised, however, that although this is true for the limited
range of stresses considered, the same relationships may not hold
for higher stresses, because the stiffness of a clay increases with
effective stress only at a decreasing rate.
(b) For any value of CT r or ( Cr 1)o the secant modulus
m
decreases steadily with increasing stress level. This is also true
of the compression modulus for increasing ( 3 ' - from an initially
' an-
isotropic (0-31‹ 0'2') stress condition - although the latter
is always higher than the modulus corresponding to initially isotropic
stresses. Beyond Cr 1 - ,/(1-3 = 1, however, the recompression modulus
is similar to those obtained from conventional tests. It is also
noticeable that the extension modulus for any effective stress ratio
is not vastly different from those for compression. (Note that the
extension modulus has been plotted against 0731/0-1' and, there-
fore, to make direct comparison with the compression modulus, the
former has to be referred to the reciprocal of 445-3t/c1 1) This
latter result is in conflict with those obtained for other sites in
London which have shown higher modulus for extension than for com-
pression (Skempton and Henkel 1957, Skempton 1959).
(c) It has already been mentioned that in the conventional
271.
settlement analysis we commonly use the elastic modulii such as
shown in Fig. 11.29 and for the portion 1°- 1'/(1-31 1 in Fig.
11.30. This modulus is usually obtained from the stress strain
relationships for one half or a third of the failure stress. In
Table 11.1 is summarised the values of secant modulus for different
factors of safety (F.S. = CT1 - C13/(Cr1 3)f) taken from the
mean curves of Figs. 11.29 and 11.30, and based on the average stress
ratio at failure. It can be seen that the modulus increases by
40 to 50% in moving from F.S. = 2 to F.S. = 5.
(d) The foregoing results have important practical signifi-
cance. For settlement analysis it is common practice to perform
undrained tests on undisturbed specimens of clay at confining
pressures equal to the overburden pressure. In such cases, the
effective stresses prior to shear are quite different from those
in-situ (see Chapter 8). Ideally, the elastic modulus should be
determined for stress increases corresponding to those in the field
starting from the in-situ stresses. Although the compression parts
of the A3 and D tests reported above do not exactly satisfy this
condition, the stresses in these specimens, prior to compression,
were closerto the in-situ stresses than is the case with conventional
tests. The compression modulus shown in Fig. 11.29 - for 0-3
1/(T1
less than one, but increasing, - is, therefore, likely to be more
applicable to foundations on London clay than the modulus obtained
from conventional tests.
272.
(e) The above point can best be illustrated by taking an
hypothetical example. For the Ongar specimens, the in-situ
effective stresses are,
((rv 1) o = 32 lbs/in2
((Th')o = 76 lbs/in2
giving (CT ')o 4-(32 + 76 + 76) = 61 lbs/in2 m
Average all-round effective stresses in the specimens after
sampling, tr r, = pk = 58.5 lbs/in2 (see Chapter 8). Let the increase of total stresses on the element due to a
foundation loading be
AcTv = 30 lbs/in2
46 Cr h = 8 lbs/in2
which will set up an excess pore pressure, (see section 11.4)
. h A( A(Tv h)
. 8 + 0.5(30 - 8) = 19 lbs/in2
So the effective stresses after load application in the field,
are
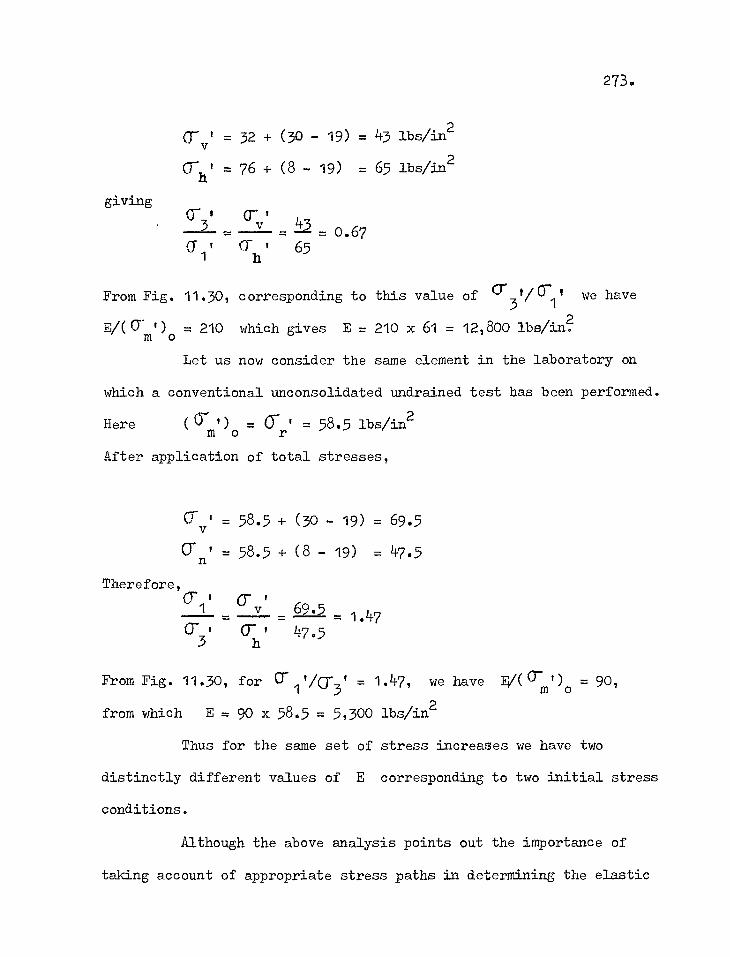
273.
Cry' = 32 + (30 - 19) = 43 lbs/in2
G - = 76 4. (8 - 19) = 65 lbs/in 2
giving C73' '
. 0.67 cr cr , 65 1
From Fig. 11.30, corresponding to this value of O"3'/cr t we have
E/(0-111 1)0 = 210 which gives E = 210 x 61 = 12,800 lbs/i/Z
Let us now consider the same element in the laboratory on
which a conventional unconsolidated undrained test has been performed.
Here
(cr o ,) = crr 58.5 lbs/in2 m
After application of total stresses,
' = 58.5 + (30 - 19) = 69.5
CT = 58.5 + (8 - 19) = 47.5
Therefore, Cr , cr
6 - = 1.47
3 TIT 47.5
From Fig. 11.30, for or l,/cr,, = 1.47, we have E/(0,)0 = 90,
from which E = 90 x 58.5 = 5,300 lbs/in2
Thus for the same set of stress increases we have two
distinctly different values of E corresponding to two initial stress
conditions.
Although the above analysis points out the importance of
taking account of appropriate stress paths in determining the elastic
274.
modulus for use in settlement analysis, it must be emphasised that
the experimental data is as yet somewhat limited and final con-
clusions cannot, therefore, be drawn. More work is needed,
particularly in the following fields;
(i) Tests of the type described above should be made on
samples from various depths in London clay. It is worth remem-
bering that in a foundation problem elements of clay at different
depths are subjected to different stress paths. This makes it
difficult to assign a single value of E for the entire depth.
While by virtue of increasing effective stresses E will generally
tend to increase with depth, different levels of shear stress due
to the foundation load will have varying influence and a combina-
tion of these two factors will determine the true values of E
for the problem concerned.
(ii) For the concept of stress path to be successfully em-
ployed in settlement analysis it is essential that in-situ stresses
in London clay be correctly known. The author is not aware of any
direct measurement to date (1968) and recourse has had to be made
to indirect determinations such as those described in Chapter 8.
While there is little doubt that the latter give reasonably correct
results, there are some uncertainties which make it desirable that
they be compared with direct measurements wherever possible. There
are, of course, considerable difficulties, but perhaps model studies
may be useful in this respect.
275.
Apart from the considerations of stress path mentioned
above there are many other factors which are known to influence the
deformation modulus of clay determined from laboratory tests. Rut-
ledge (1942), Terzaghi and Peck (1948), Ladd and Lambe (1963) have
studied the effect of sampling disturbances on the deformation of
clay. Such disturbances not only give rise to effective stresses
in a sample which are different from those in a "perfect" sample but
also increase the deformability of the clay, resulting in low
modulus of elasticity determined from laboratory tests (Klohn 1965).
This has led many research workers to suggest the use of the con-
solidated undrained tests in settlement analysis (Simons 1957, 1963,
Ladd 1964). It is obvious that good sampling is an essential
prerequisite for accurate settlement prediction and in this respect
block samples are believed to be more satisfactory than ordinary
piston samples.
The rate of loading also influences the stress - strain
behaviour of clay during undrained shear. Casagrande and Wilson
(1951), Bjerrum, Simons and Torblaa (1958), Bishop and Henkel (1962),
Richardson and Whitman (1963), and Burn (1965) have shown that
this rate effect is primarily caused by the difference in the excess
pore pressure developed during the shearing process. To correspond
with field conditions it is necessary to run a test sufficiently
slowly so that uniform distribution of pore pressures throughout
the specimen is achieved.
276.
Finally, the accuracy of any prediction of settlement,
based on laboratory data, can only be checked by direct measurement
in the field, such as those undertaken, in recent years, for measure-
ment of heave of excavations (Serota and Jennings 1959, Bozuzuk 1965,
Klohn 1965, Bara and Hill 1967, Resendiz 1967).
11.4 Pore pressure parameters A and B
A general discussion on the pore pressure response of soils
to undrained loading and its importance in settlement analysis has
been made in Chapter 7. In this section numerical results will be
presented of the pore pressure parameters A and B determined
from the triaxial tests reported in Section 11.1.
For an element of clay subjected to axi-symmetric loading
with zero drainage, the increase in pore pressure due to increase in
total stresses can be expressed as, (Skempton 1954),
u= B FACr3 + A(6 - 6 0' 3) 11
(11.4.1)
where AT 3 1 and A J are increases in the major and minor
principal stresses and A and B are the pore pressure parameters.
11.4.1 Parameter B
When a specimen of clay is subjected to all-round stress
increase, (i.e. AT 1 = L10-3) equation (11.4.1) takes the form
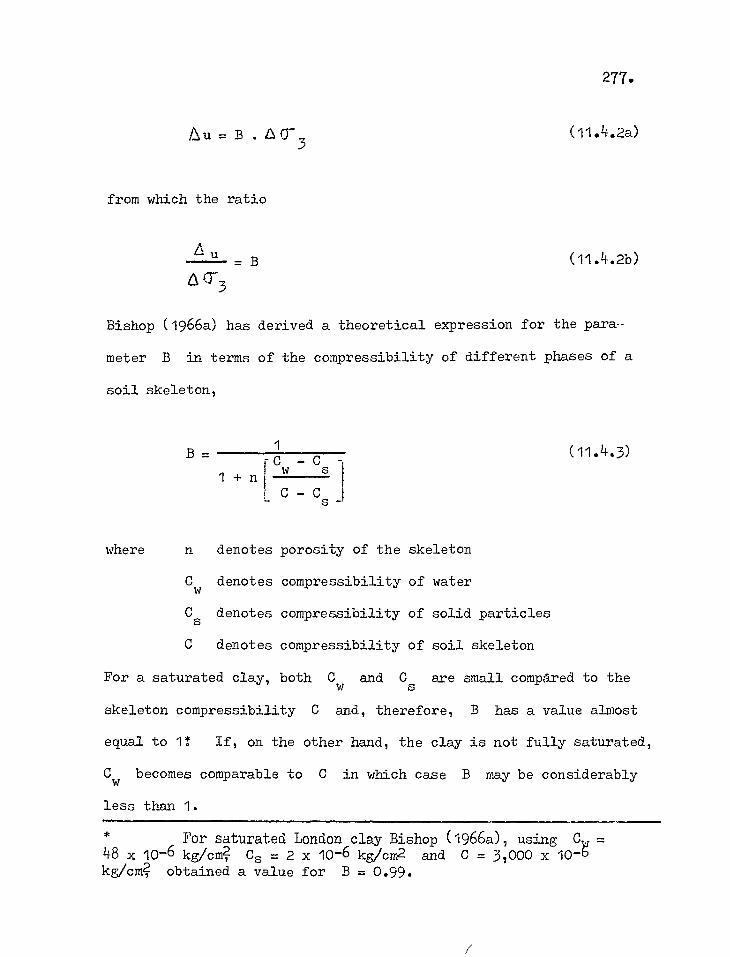
Au.B.AT3
from which the ratio
u B 0-3
277.
(11.4.2a)
(11.4.210)
Bishop (1966a) has derived a theoretical expression for the para-
meter B in terms of the compressibility of different phases of a
soil skeleton,
B _
1 (11.4.3)
Cw - C
s 1
C - Cs
1 + n
where n denotes porosity of the skeleton
Cw denotes compressibility of water
Cs denotes compressibility of solid particles
C denotes compressibility of soil skeleton
For a saturated clay, both Cw and Cs are small compAred to the
skeleton compressibility C and, therefore, B has a value almost
equal to 1! If, on the other hand, the clay is not fully saturated,
Cw becomes comparable to C in which case B may be considerably
less than 1.
For saturated London clay Bishop (1966a), using C = 48 x 10-6 kg/cm2 Cs = 2 x 10⁻⁶ kg/cm2 and C = 3,000 x 10-b kg/cm2 obtained a value for B = 0.99.
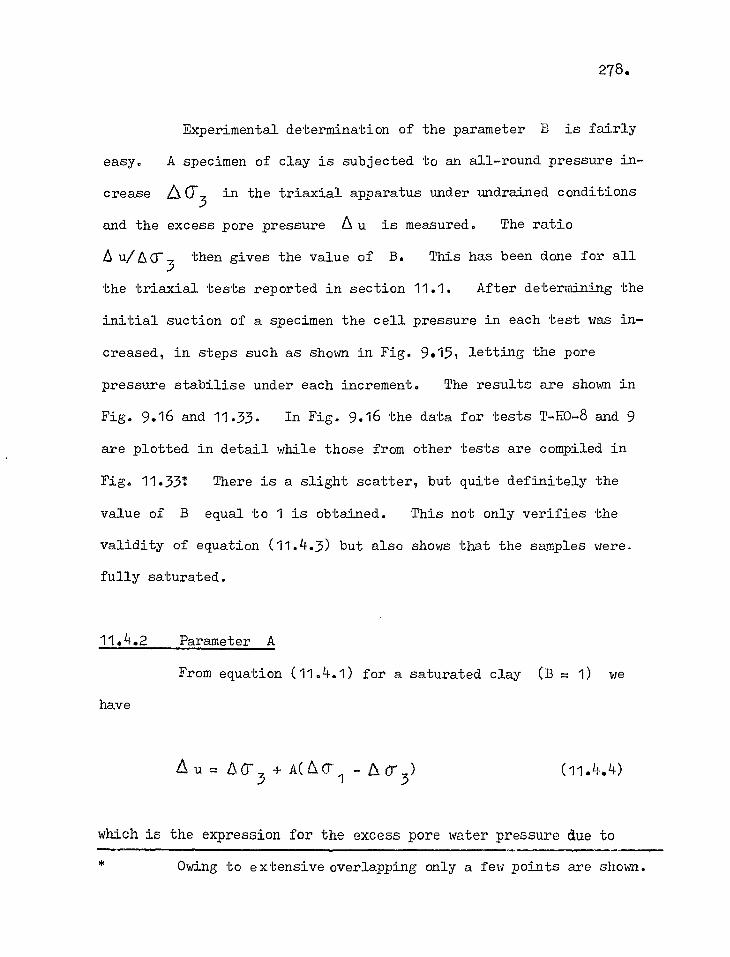
278.
Experimental determination of the parameter B is fairly
easy. A specimen of clay is subjected to an all-round pressure in-
crease3
in the triaxial apparatus under undrained conditions
and the excess pore pressure Au is measured. The ratio
A u/60-3 then gives the value of B. This has been done for all
the triaxial tests reported in section 11.1. After determining the
initial suction of a specimen the cell pressure in each test was in-
creased, in steps such as shown in Fig. 9,15, letting the pore
pressure stabilise under each increment. The results are shown in
Fig. 9.16 and 11.33. In Fig. 9.16 the data for tests T-HO-8 and 9
are plotted in detail while those from other tests are compiled in
Fig. 11.33: There is a slight scatter, but quite definitely the
value of B equal to 1 is obtained. This not only verifies the
validity of equation (11.4.3) but also shows that the samples were.
fully saturated.
11.4.2 Parameter A
From equation (11.4.1) for a saturated clay (B = 1) we
have
Au= 60-3 1- A(6.0-1 -A0 3 ) (11.4.4)
which is the expression for the excess pore water pressure due to
Owing to extensive overlapping only a few points are shown.
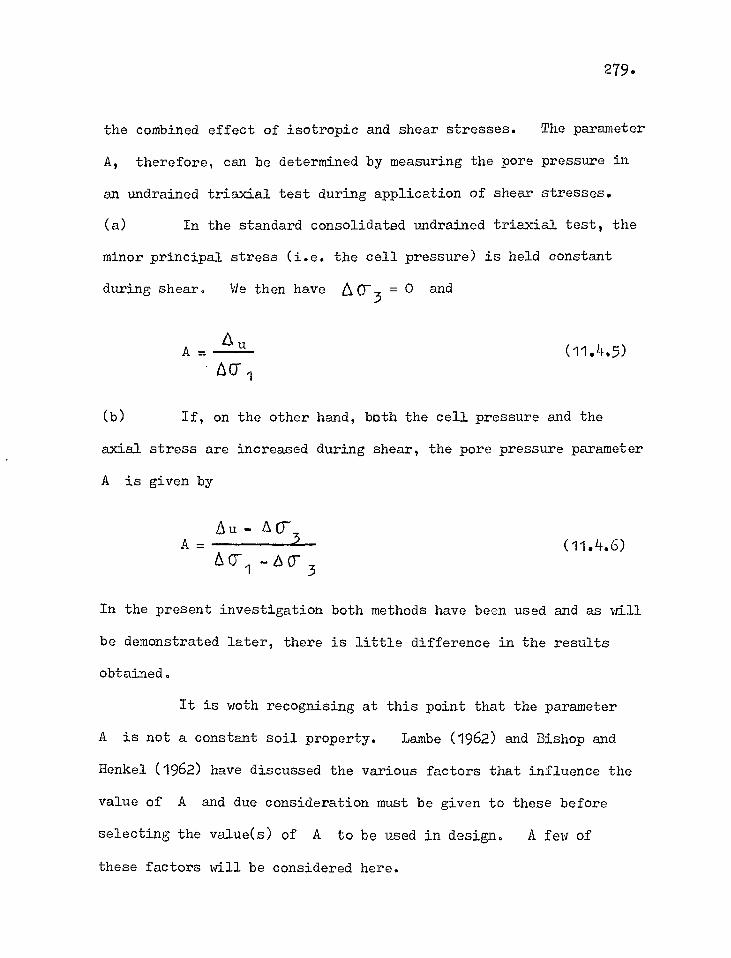
279.
the combined effect of isotropic and shear stresses. The parameter
A, therefore, can be determined by measuring the pore pressure in
an undrained triaxial test during application of shear stresses.
(a) In the standard consolidated undrained triaxial test, the
minor principal stress (i.e. the cell pressure) is held constant
during shear. We then have tiCr3 0 and
(11.4,5)
(b) If, on the other hand, both the cell pressure and the
axial stress are increased during shear, the pore pressure parameter
A is given by
6u - Am A _ 0-1 - 0" 3
(11.4.6)
In the present investigation both methods have been used and as will
be demonstrated later, there is little difference in the results
obtained.
It is woth recognising at this point that the parameter
A is not a constant soil property. Lambe (1962) and Bishop and
Henkel (1962) have discussed the various factors that influence the
value of A and due consideration must be given to these before
selecting the value(s) of A to be used in design. A few of
these factors will be considered here.
280.
(a) The effect of stress histoty
The influence of stress history on the pore pressure para-
meter A has been the subject of many investigations (Henkel 1958,
Simons 1960b; Lambe 1962, Parry 1968). Depending on whether a clay
is normally-consolidated or over-consolidated the build-up of pore
pressure for the same set of total stresses may be quite different.
Normally consolidated clays usually show high A values while over-
consolidated clays indicate lower values. Also, as shown by Lambe
(1962) and Ladd (1965) anisotropic consolidation, loading/unloading
sequences and consolidation pressure may have important influence
on the value of A.
(b) The influence of stress level
From a practical point of view this is, perhaps, the most
important factor which has to be taken into account in any settle-
ment analysis. When values of A are quoted in the literature
they usually correspond to failure conditions (Bishop and Henkel
1962, Lambe 1962). In the ordinary foundation problem, however,
the shear stresses caused by the applied load are well below the
shear strength of the clay and the use of A at failure (Af) must
be misleading.
In Fig. 11.34 are plotted the values of A against the
effective stress ratio ( (T1 T/0-3 ') for Oxford Circus, obtained from
the stress - strain relationships shown in Figs. 11.1 and 11.27.
The values of Af corresponding to the maximum deviator stresses
281.
for the three specimens that were taken to failure are also shown.
In spite of the scatter it is clear that the value of A drops
from 0.6 at the beginning of a test to approximately 0.45 at failure.
Similar data for Ongar are shown in Fig. 11.35. The
A values obtained from standard tests, i.e. method (a) above - for
stress - strain relationships see Figs. 11.2 and 11.28 - are in-
dicated by open circles while the results obtained from method (b)
- stress - strain relationships shown in Figs. 11.11, 11.12, 11.14
and 11.15 - are indicated by the open triangles. The A values
corresponding to compression subsequent to unloading in the case of
the A3 and D tests, (Figs. 11.4, 11,5, 11.18 - 11.20) are plotted
as the solid dots and those for extension (cell pressure constant,
axial stress decreasing - see Figs. 11.3 - 11.5, and 11.18 - 11.20)
are also given. Af values at failure, corresponding to maximum
stress differences are indicated by the crosses. As usual there
is considerable scatter in the results, although the rate of strain
and overall range of stresses were similar in all tests. It can
be seen that all the values of A for compression lie within a
band and the discrepancies between different types of test are not
significant. Once again the parameter A decreases slowly from
an average 0.6 at low stress levels to 0.4 at failure. The A
values for extension are considerably lower than those for com-
pression but increases as failure is approached.
Perhaps the most surprising result to emerge from the
282.
above data is that the A value does not drop even more drastically
near failure. Experimental work on clays over-consolidated in the
laboratory, has often shown very low and even negative values of
A at failure (Henkel 1958, Simons 1960b, Bishop and Henkel 1962,
Lambe 1962). However, from an analysis of the Ashford Common
data (Webb 1966) the writer finds that Af'
determined from con-
solidated undrained tests, depends to a great extent on the pre-
shear effective consolidation pressure. It can be seen from Fig.
11.36, where Webb's data have been plotted, that Af becomes zero
at low effective stresses but increases as the consolidation pressure
is increased. Similar results have been obtained for other over-
consolidated clay and clay shales e.g. Kings Norton Marl (Chandler
1967) and Edmonton Shale (Sinclair and Brooker 1967).
It appears from Figs. 11.34 and 11.35 that for Oxford
Circus and Ongar the pore pressure parameter A for a typical
foundation problem will be in the range 0.5 - 0.6. For the
appropriate stress paths in the field - following the same argument
as in section 11.3 for elastic modulus - A values should be as
shown by the solid dots in Fig. 11.35. However, it is dear that
in the range of stresses normally encountered in practice, i.e.
within an adequate factor of safety, the parameter A will not
vary appreciably with stress level.
It is difficult to say precisely, from the limited data
presented above, a great deal about the possible variation of A
283.
with depth beneath a foundation. Of course, the level of shear
stresses due to the applied pressure will vary with depth and,
strictly speaking, so will the parameter A. However, if relation-
ships such as shown in Fig. 11.34 and 11.35 hold irrespective of
depth, this variation of A may not be great.
Much of what has been said above applies as well to the
relationship between A and strain. As the axial strain increases
with increasing stress level A will decrease with increasing strain
and the parameter corresponding to the strains in the field will
apply. However, analysis based on considerations of stress and
stress level seems to be more satisfactory.
(c) Other factors affecting A
In addition to stress history and stress level, certain
other factors may also influence the value of the pore pressure
parameter A measured in the laboratory. These include sampling
disturbances and test conditions.
Sampling disturbances may increase the pore pressure of
a soil specimen. This not only results in a smaller initial suction
measured for an "undisturbed" specimen than for a "perfect" sample
(Ladd and Lambe 1963) but, as suggested by Lambe (1962), can also
give rise to a more compressible soil skeleton thus causing more of
the applied shear stresses to be transmitted to the pore water.
This will give higher values of A measured in the laboratory.
The rate of shear, which has been discussed previously,
284.
also plays an important role in the development of pore pressures
under undrained conditions. Bishop, Alpan, Blight and Donald
(1960) have shown that too rapid a rate of loading results in non-
uniformity of pore pressure within a specimen and base measurement
may not, therefore, be representative of the whole specimen. (See
also Blight 1963, Crawford 1963). Bjerrum, Simons and Torblaa
(1958) and Richardson and Whitman (1963) have found that measured
pore pressuring during shear depends significantly on the rate of
loading, and Bishop and Henkel (1953) and Lo (1961) have shown that
for normally consolidated clays, creep at constant stress difference
may also be accompanied by an increase of pore pressure.
Temperature is also known to affect the pore pressure
measured during an undrained triaxial test (Ladd 1961, Paaswell
1967, Narain and Singh 1967, Mitchell and Campanella 1968).
Although this factor has not been investigated in the present work,
all the tests were run in a constant temperature room (19 ±1°C).
The influence of temperature on the measured values of A is,
therefore, unlikely to be great. However, ground temperature may,
sometimes, be different from that in the laboratory and should be
taken account of where this difference is significant. The nature
of pore fluid may also affect the pore pressure set up in a specimen
but little is known on this subject.
285.
11.5 Volume change characteristics
This section deals with the deformation of London clay
under drained conditions i.e. the axial and volumetric strains
associated with the expulsion of water from the clay. The experi-
mental work was conducted almost exclusively on the clay from Ongar,
except for the three teats of type Cl on Oxford Circus specimens.
The basic data have been presented in section 11.1.
11.5'4,1 Volumetric strains
Fig. 11.44 shows the axial and volumetric strains of the
specimens consolidated isotropcially from initially isotropic stress
conditions (BI tests). Since the effective stresses before con-
solidation varied from specimen to specimen, depending on the in-
itial suction (see Table 11.2), the results have been expressed in
terms of the non-dimensional quantity Acr1,/(cr1t)o where
(0-1 ')0 = ( (73' )o is the effective stress before consolidation and
(3-1 ' =6Q'3' is the stress increase due to consolidation
It can be seen that both axial and volumetric strains (6I
and
6 v) are proportional to A0-1 1/(0y)0 which indicates that,
within the range of stresses considered, ( 6 o- ii/( aii)o < 0.7
and 50 lbs/in2 < (CT ')0 <100 lbs/in2 ),
286.
(a) for a particular effective stress before consolidation,
the strains are directly. proportional to the stress increment and
(b) the compressibility is inversely proportional to the
effective stress before consolidation.
Thus, under isotropic stress conditions, the stress - strain
relationships are essentially linear for small stress increments.
It can also be seen from Fig. 11.44 that the ratio E,I4,v
is on
the average equal to 0.45 (range 0.40 - 0.49) which is greater than the value 1/E v = i) for an isotropic, elastic material.
It must be emphasised here that relationships such-as shown
in Fig. 11.44 are not expected to hold for high stresses and large
pressure increments because, in general, the compressibility of
soils is not inversely proportional to pressure and stress - strain
relationships are non-linear.
In Fig. 11.45 are plotted the volumetric strains obtained
from the B2 tests, in which the specimens were consolidated aniso-
tropically - keeping the axial stress constant and decreasing the
cell pressure, thus giving different stress - increment ratios, -
from initially isotropic stress conditions. The details are given
in Fig. 11.39 and Table 11.3. The open circles are the individual
points while the solid dots indicate the cumulative strains for the
first two increments in each test. Also shown are the data for the
E type tests in which the specimens were subjected to slow increases
of both axial and lateral stresses under drained conditions - from
287.
initially isotropic stresses - keeping the stress increment ratio
(K' AO-3t/ C1') constant. (First parts of test nos. T-HO-31,
32 and 33. See Figs. 11.21 - 11.23). Although the E test
results lie a little below the B2 test data it is possible 156
draw a mean curve through all the points which almost coincides
with the isotropic line, also shown in Fig. 11.45 for comparison.
It can, therefore, be said that the influence of the lateral stress
increase on the volumetric strain during consolidation or drained
compression is small. It is worth noticing, however, that the
linear relationship between stress and volumetric strain holds only
in the range LTI'/( Cri')0‹. 0.5, beyond which the curve begins
to tail off. The axial strain in these tests, of course, depends
on the stress - increment ratio (see Table 11.3) - a point which
will be discussed later.
Fig. 11.46 shows the volumetric strains obtained in the
consolidation stages of the Cl, C2 and D tests. It should be
pointed out that consolidation of these specimens followed different
stages of undrained loading, along stress paths shown in Figs. 11.10,
11.13, 11.16, 11.18 - 11.20. Consequently, the major and minor
principal effective stresses* and their ratios at the start of con-
solidation were different for all tests (see Tables 11.4 and 11.5).
In the particular case of triaxial tests described here Cril and 0-3' coincide with the vertical and horizontal stresses and the terminology can be interchanged without loss of generality.
288.
Also the lateral stress increase during consolidation was, in fact,
partly reloading. In the case of the C1 and D tests the stress
changes during consolidation were isotropic (i.e. AT 3l)
while those for the C2 tests were anisotropic. It is also of
interest to note that the stress paths followed by these specimens
are similar to those that an element of soil is likely to undergo
in the field (see Chapter 5).
It can be seen from Fig. 1146 that although there is some
scatter, there appears to be no significantly different pattern of
behaviour from the different types of test, and all the points fall
within the general scatter. Moreover, the mean curve drawn through
the points lies close to the isotropic line, replotted here from
Fig. 11.44. The most important conclusion to be drawn from these
results is that neither the stress path followed during undrained
loading prior to consolidation nor the magnitude of the lateral
effective stress has any significant influence on the volume change
that occurs during consolidation, which is, therefore, primarily a
function of the major principal effective stress.
In Fig. 11.47 the v vs LC71 (r 1/( 11)0 data have been
compiled for all the different types of test mentioned above. Once
again it can be clearly seen, in spite of the scatter, that the
volumetric strain of undisturbed London clay is primarily determined
by the major principal stress (i.e. the axial stress) and is not
significantly influenced by the lateral stresses - at least within
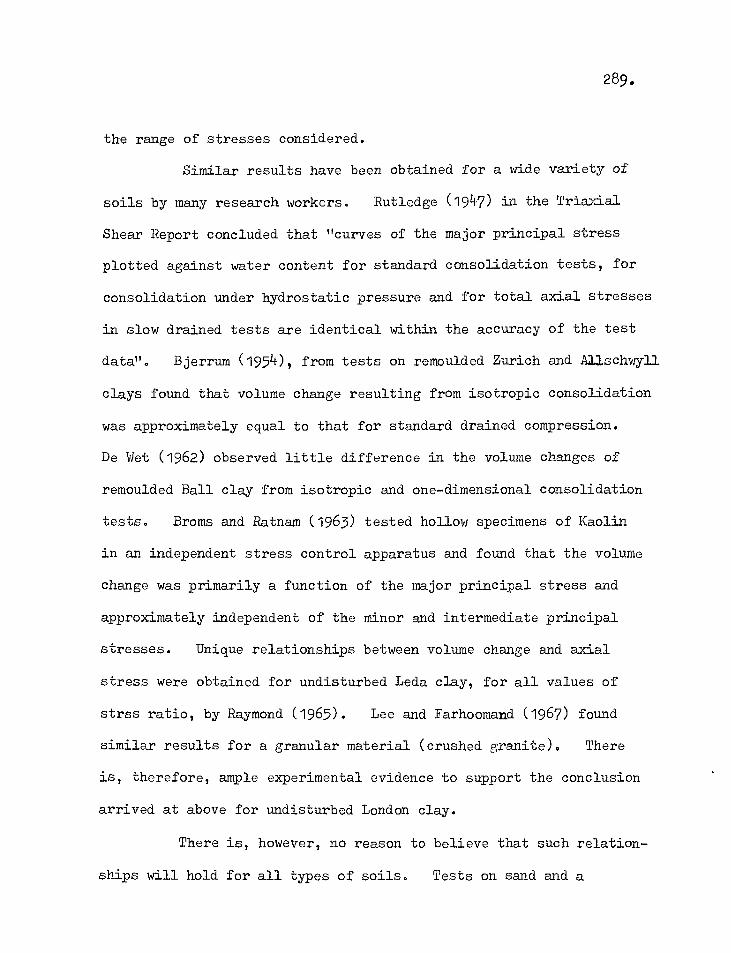
289.
the range of stresses considered.
Similar results have been obtained for a wide variety of
soils by many research workers. Rutledge (1947) in the Triaxial
Shear Report concluded that "curves of the major principal stress
plotted against water content for standard consolidation tests, for
consolidation under hydrostatic pressure and for total axial stresses
in slow drained tests are identical within the accuracy of the test
data". Bjerrum (1954), from tests on remoulded Zurich and Allschwyll
clays found that volume change resulting from isotropic consolidation
was approximately equal to that for standard drained compression.
De Wet (1962) observed little difference in the volume changes of
remoulded Ball clay from isotropic and one-dimensional consolidation
tests. Broms and Ratnam (1963) tested hollow specimens of Kaolin
in an independent stress control apparatus and found that the volume
change was primarily a function of the major principal stress and
approximately independent of the minor and intermediate principal
stresses. Unique relationships between volume change and axial
stress were obtained for undisturbed Leda clay, for all values of
strss ratio, by Raymond (1965). Lee and Farhoomand (1967) found
similar results for a granular material (crushed granite). There
is, therefore, ample experimental evidence to support the conclusion
arrived at above for undisturbed London clay.
There is, however, no reason to believe that such relation-
ships will hold for all types of soils. Tests on sand and a
290.
variety of remoulded clays have shown that volume change may be a
function of the average principal effective stress (Fraser 1957,
Wood 1958, Henkel 1958, Wade 1963, Sowa 1963, Roscoe et al 1963,
Schofield and Wroth 1968). Some of these studies relate conditions
at failure when the influence of shear stress becomes more important.
In the context of the work being described here, where stresses and
strains are relatively small and well below failure conditions, the
relationship between volume change and the major principal effective
stress, obtained above, seems to be approximately valid.
In order to find possible explanations for the above
phenomenon, let us now consider Fig. 11.48. Here the volume
change data have been plotted for the standard drained tests (i.e.
A(r3, = 0) for the range 0 <,,a(7 1 1/( Or1t)0‹ 0.8, ( Tit).
being the pre-shear effective stress (see Fig. 11.24). For com-
parison the isotropic consolidation line has also been shown. It
can be seen that the volumetric strain is essentially linear for the
stress range considered, except for the very small stress increments.
Two major features of Fig. 11.48 are easily observed:
( a)
For the same value of ©G 1'/( 0')o, volumetric strain
increases with the pre-shear effective stress. This means that
under this type of loading, compressibility of the clay is not in-
versely proportional to rr1IN /o - in contrast to the results of
isotropic consolidation tests.
(b) The unique relationship between volume change and major
291.
principal effective stress does not hold for standard drained com-
pression, the volume change being always lower than for isotropic
stress increase, thus contradicting the relationship obtained for
all other tests, although the discrepancy lessens with higher values
of the pre-shear effective stress.
It is well known that for an isotropic material, (*eying
the normal laws of elasticity, the volume change due to increases
of principal effective stresses ' (Y- 1 T ' Acr 2' and 31 is
given by
AO- + a tT 2° + er
Av - C V CV
(11.5.1)
3
where Ccv is the average compressibility of the material over the
range of stresses considered. This means that, for the same in-
itial condition, the volume change caused by an increase of axial
stress AU' in a standard drained test (/1 447-2
= 60-3
= 0)
should be 3 of the volume change caused by an isotropic stress
increase of the same amount (ACT 1 = AG-2 = 3
'). It is
easy to see from Fig. 11.48 that experimental results do not corres-
pond to this condition. In order to take this variation from ideal
elastic theory into account Skempton has proposed an expression for
volume change of soils in terms of the compressibility Ccv and a
(structural parameter" Sd (Skempton and Bishop 1954). For the
case of triaxial test conditions (Acr 1 > 6(T
2' = A07
3') this
is given by
V , c [ 6a- sci. &cy, a- 3' ) I V cv 3 (11.5.2)
292.
The parameter Sd is primarily a function of the dilatancy of the
soil (i.e. the volume change caused by the application of shear
stresses) and is equal to 1 for an isotropic elastic material.
For the case of isotropic consolidation ( 6 1` .Acr 30
equation (11.5.2) reduced to
A Acr CV
')
(11.5.3)
and for axial compression (A0-3 = 0)
= - Ccv(Sd . L1 cr i) 01.5.0
Therefore, for identical stress increase in the two cases, we have
_ Sd
So we
[A, v / i
value of Sd from Fig.
(11.5.5)
11.48
V 11 / V
can determine the
directly by the application of equation (11.5.5). The results are
shown in Fig. 11.49. It can be seen that Sd is a function of the
pre-shear effective stress, as well as the stress level. By extra,.
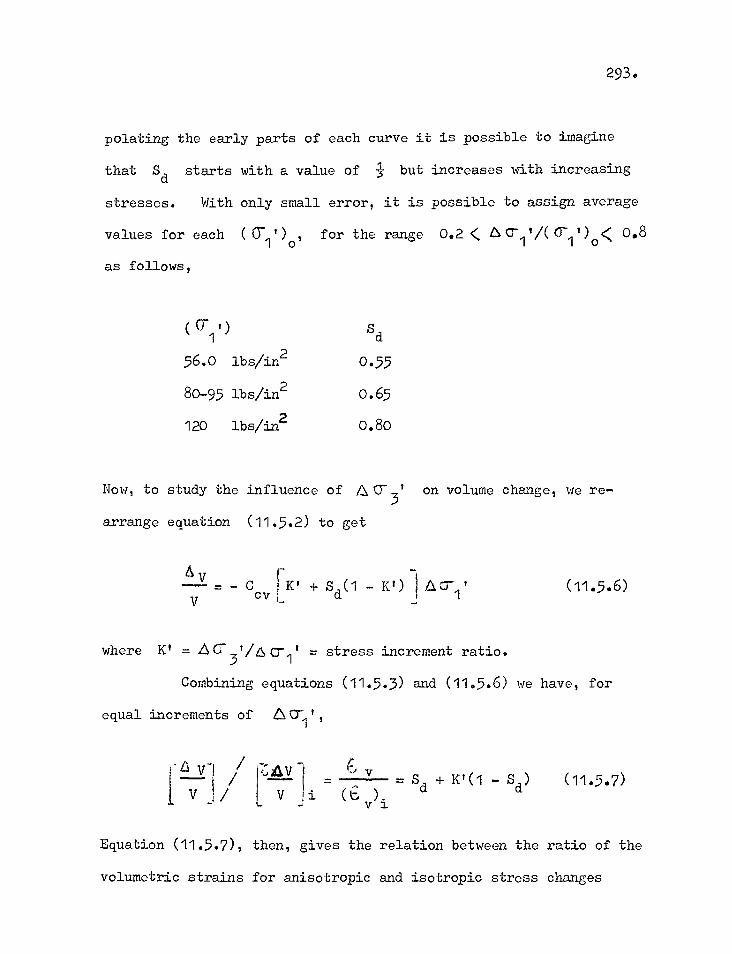
293.
polating the early parts of each curve it is possible to imagine
that Sd starts with a value of 3- but increases with increasing
stresses. With only small error, it is possible to assign average
values for each (CT1')0, for the range 0.2 < CNC"11/( 0-1' )0< 0.8
as follows,
( C1
I) Sd
56.0 lbs/ir.2 0.55
80-95 lbs/in2 0.65
120 lbs/in2 0.80
Now, to study the influence of A Cr 3' on volume change, we re-
arrange equation (11.5.2) to get
- c 1 K' Sd(1 - K') '
V cv L 1 (11.5.6)
where K' = LSC73,hscr1 . stress increment ratio.
Combining equations (11.5.3) and (11.5.6) we have, for
equal increments of AO''
tavi v - Sd
K'(1 - Sd) v (e)i v
(11.5.7)
Equation (11.5.7), then, gives the relation between the ratio of the
volumetric strains for anisotropic and isotropic stress changes
294.
during consolidation and the corresponding stress increment ratio,
for equal increases of the major principal stress and is plotted
in Fig. 11.50.
There is not enough experimental data to check the validity
of equation (11.5.7). It is possible, however, to compare the
results of the E and C2 tests, the relevant values of Sd
having been obtained from Fig. 11.49. The details are given in
Table 11.6 and a comparison of the predicted and observed values of
61( v)i are shown in Fig. 11.51. It will be seen that the
correlation is not good, the observed values being, save for one
exception, too high. On the other hand, the average of all the
observed values of e v/(6v)i is almost exactly 1 indicating
that there is little difference between the volume changes, caused
by isotropic and anisotropic consolidation (hence the closeness of
the two curves in Fig. 11.45). Much more work is needed on this
subject before the volume change characteristics of London clay can
be properly understood, but one important point of practical sig-
nificance can be made from Fig. 11.50.
It has been explained in Chapter 7 that effective stress
changes during consolidation in the field are anisotropic insofar
as there is a re-distribution of stresses due to the decrease of
Poisson's ratio of the soil from 0.5 to the fully drained value i.
For points beneath the centre of a uniform circular load - it can
be seen from Fig. 7.3 - even with as low as 0.2 and the
295.
pore pressure parameter A equal to 0.5 (see section 11.4) the
stress increment ratio during consolidation will not be less than
0.7. Over much of the depth beneath the foundation it will be
considerably greater. This means that in the field, even if
lateral stresses did influence the volume change of the soil,.
the points will lie within the area shown by the bold lined triangle
in Fig. 11.50. It can clearly be seen from this that the assump-
tion of isotropic effective stress increase during consolidation
will cause a maximum error of about 10% for volumetric strains near
the surface and perhaps not more than 5% for the entire depth.
Since it is difficult to reproduce experimental data an London clay
to this degree of accuracy any consideration of the influence of the
lateral stress on volumetric strains, in practical settlement
analyses, is unwarranted.
It is now possible to compile the compressibility data
obtained from all the different types of test.mentioned above. In
Fig. 11.52 the volumetric compressibility Ccv (defined as
ccv = 6 v/I-(7.11) is plAtted against the effective major principal
stress before consolidation ((3"10 0. As usual, the scatter is
large but the best fit curve is, perhaps, the most representative
of all the points, although it may be possible to draw slightly
different curves for one or two groups of points. It can be seen
that, within the range under consideration, Ccv is approximately
inversely proportional to (cr ,)o - a point which was self-evident
296.
in Fig. 11.47. The compressibility data plotted in Fig. 11.52,
then, are the ones that should be applicable to a field problem.
A comparative study of these results with those from the oedometer
tests will be made in Chapter 12.
11.5.2 Axial strains
So far, discussions of the deformation of London clay
under drained conditions have been concerned mainly with the volu-
metric strains. For settlement studies, however, it is the
vertical component of the deformation that is important - and this
will now be considered.
It has already been shown in Fig. 11.44 that during iso-
tropic consolidation the ratio € /(:v
(axial strain/volumetric
strain) of undisturbed London clay, in the range of stresses under
consideration, is 0.45. If the clay had behaved as an isotropic
elastic material, this ratio would have been 4. This ratio, which
will hereafter be called (2<,_ , (61 /(:-
v for all round consolida-
tion) then gives a% measure, at least qualitatively, of how far a
material deviates from isotropic* elastic behaviour.
The quantity c'( , however, is not a constant material
parameter. Among other things, it depends on the stress level
The word "isotropic" is used in the present discussion to mean either isotropic (i.e. all round) stress increase or identical elastic properties in the three orthotropic directions.
297.
(Cr 1/0-1) - as shown in Fig. 11.53, where the ratio E 1/ v o 1 L-v
for isotropic stress increases has been plotted against the
effective stress ratio before consolidation. The value of
4= 0.45 mentioned above refers, of course, to initially isotropic
stress conditions, (i.e. (Cr11/0"
3)0 = 1.0 ). It can be seen
that the higher the effective stress ratio reached after undrained
loading, the greater will be the value of OK for subsequent all
round consolidation. One reason for this may be that because part
of the lateral stress increase during consolidation in the case of
Cl and D tests is recompression (see stress paths in Fig. 11.10,
11.13, 11.18, 11.20), the clay is stronger in the lateral direction
than when the stresses are initially isotropic, thus cuasing more
of the deformation to take place vertically.
Now in a foundation problem the increase of effective
stresses during consolidation will not be isotropic. Referring
once again to Chapter 7, it can be seen that the stress increment
ratio during consolidation depends on the pore pressure parameter
A and Poisson's ratio s) '. Restricting our consideration to in-
itially isotropic stresses, Fig. 11.54 shows the ratio f i/ev
plotted against the stress increment ratio as obtained from the
C2 and E tests. The ratio corresponding to A a-3,/6crit . 0,
hereafter called p , has been obtained from the standard
drained test data plotted in Fig. 11.241
p , in fact, varies with the pre-shear effective stress. But for 46C71 1/(C1-1 1 )0‹ 0.5 an average value of 1.45 for the stress range 50 ::(0-1')0 100 lbs/in2 has been taken.
298.
It is clear that, as expected, E., 1/6v increases as the
stress increment ratio decreases. So even if the lateral stresses
have only a minor influence on the volumetric strains, (see section
11.%1), the axial strains and hence settlements are significantly
dependent on the stress increment ratio.
The solid curve in Fig. 11.54 is the best fit curve
through the observed points which intersects the ordinate
6 /(--- v =1 at Ac-3'/AcT = 0.29. At this point the lateral
strain is zero and the stress increment ratio, therefore, corres-
ponds to the incremental coefficient of earth pressure at rest,
o as defined in Chapter 10 (see section 10.4). It is interest-
ing to note that the value of Ro 0.29 corresponds almost exactly
to the value 0.28 obtained from similar stress range from the strain
gauge oedometer tests (see Fig. 10.74).
In order, now, to predict the relationship between
E 1/c v and K'( = LA cr3
') analyses will be made on the
basis of (a) isotropic elasticity and (b) anisotropic elasticity
and the respective results compared with the experimental data shown
in Fig. 10.54.
(a) Isotropic elasticity
For conditions of axial symmetry, if E and are
respectively the Young's modulus and Poisson's ratio "of the clay
for drained compression, the axial and radial strains are given by
E 2 =E3= E, E
) (11.5.8)
1 cr
299.
For small strains, the volumetric strain
v + 263 - 1 -2 (A011 + 2 /SU3') (11.5.9) E
and € 1 1 - (11.5.10) e IT (1 - 2 ')(1 + 2K')
where K' = ACr3'/40-1'
Therefore, for an isotropic material the strain ratio G
is determined by only one elastic parameter
Now for zero lateral strain (e 2 = 6 3 = 0), it can
easily be shown that
Ro = %)' 1 -
or (11.5.11)
where Ro = ACT 3 A (71' corresponding to one-dimensional strain.
Combining the last two equations we have
E 1 1 + Ro - 2RoK'
(11.5.12)
(1 - Ko)(1 + 2K')
Equation (11.5.12) then gives the relation between the strain ratio
300.
and the stress increment ratio during consolidation. For the
range of stresses under consideration, Ro 0.29 and we get the
curve shown by the chain-dotted line in Fig. 10.54. It can be
seen that the curve starts at Elk. v = - for Kt = 1 - as all isotropic materials must - and passes through the experimental
point corresponding to Ro 0.29. Lambe (1964) and Seed (1965)
have suggested the use of equation (11.5.12) to predict the strati
ratio for consolidation in the field but it can be seen that over
much of the range the correlation is not good indicating that the
assumptions of isotropy are not strictly valid.
(b) Anisotropic elasticity
It will now be assumed that the clay behaves as a cross-
anisotropic material (Barden 1963) during drained compression,
having different elastic properties in the vertical and horizontal
directions. Five elastic parameters are now required to define
the behaviour of the material - these are:
E:1 = the elastic modulus in the vertical direction
E3' = the elastic modulus in the horizontal direction
and three values of the Poisson's ratio
= effect of one horizontal strain on the other
horizontal strain
= effect of horizontal strain on vertical strain
= effect of vertical strain on horizontal strain
For a triaxial specimen with its axis vertical, the strains are
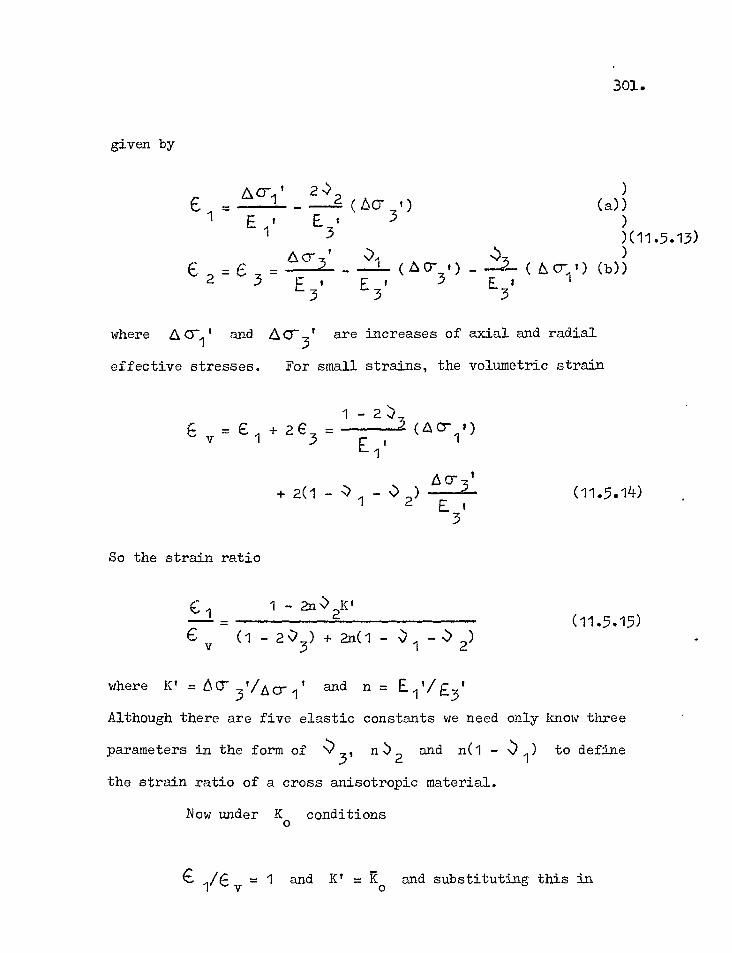
301.
given by
2 2
-.> ) cr 1 - (a)) I -
L E l , E3,
31) ( Lo- ) )(11.5.13)
.5 ) C- 2 = 6 3 - Ac13: - )1 (Acr.4 ') - --2-• ( &c7"1 ') (13»
E 3, E 3'
- E3'
where Acr1 and ACr3' are increases of axial and radial
effective stresses. For small strains, the volumetric strain
1 - 2
v G 1 +E 2€3 - 3 (AO '
11)
E ,
+ 2(1 - J - 0- ) 3 1 2 E 3
(11.5.14)
So the strain ratio
1 - 2n .N)2K
(11.5.15) e (1 -
3) + 2n(1 ,)1 - .) 2)
where K' = 66 31/210- 1 ' and n = E1 l/E3'
Although there are five elastic constants we need only know three
parameters in the form of 3, n 2 and n(1 - to define
the strain ratio of a cross anisotropic material.
Now under Ko conditions
= 1 and K' = Ro and substituting this in
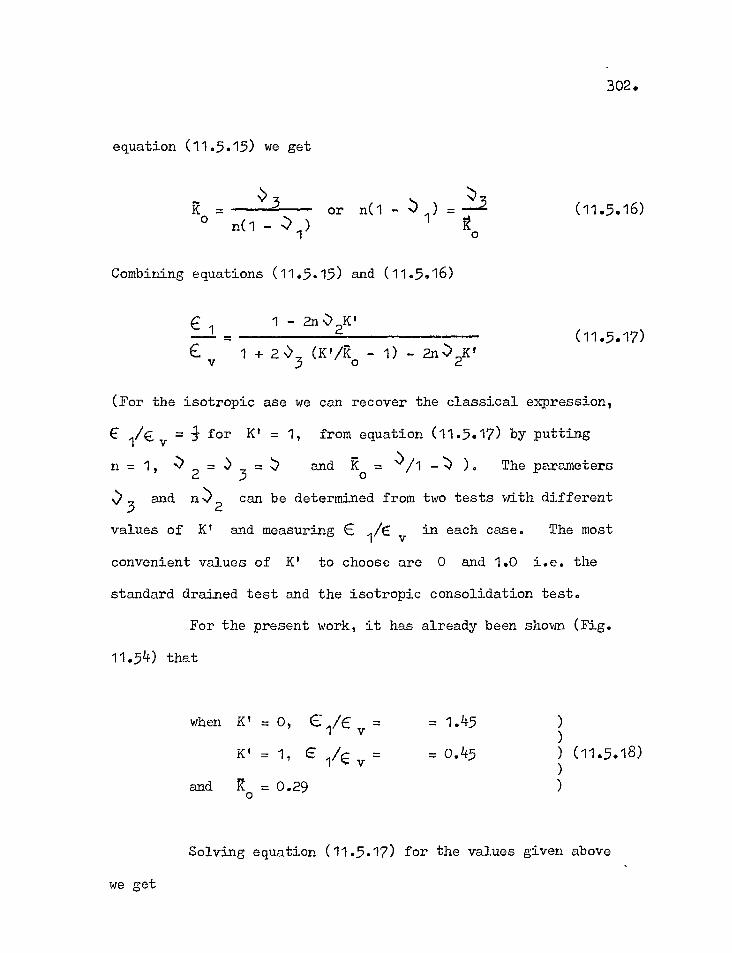
302.
equation (11.5.15) we get
.;"). R _
3 or n(1 - J ) =
n(1 - J1) 1 1‘*0
Combining equations (11.5.15) and (11.5.16)
(11.5.16)
€ 1 1 - 2n• 2K'
(11.5.17) E. v 1 + 2 .s.)
3 (m/Ro - 1) - 2n 2
Kt
(For the isotropic ase we can recover the classical expression,
1/€ v = i for K' = 1, from equation (11.5.17) by putting
n = 1, -) 2 = 3 = J and Ro = ")/1 ). The parameters
N)3
and n.>2 can be determined from two tests with different
values of K' and measuring E 1/E v in each case. The most
convenient values of K' to choose are 0 and 1.0 i.e. the
standard drained test and the isotropic consolidation test.
For the present work, it has already been shown (Fig.
11.54) that
when = 0, C i/E v = = 1.45
K' = 1, E v = = 0.45 ) (11.5.18)
and it = 0.29
Solving equation (11.5.17) for the values given above
we get
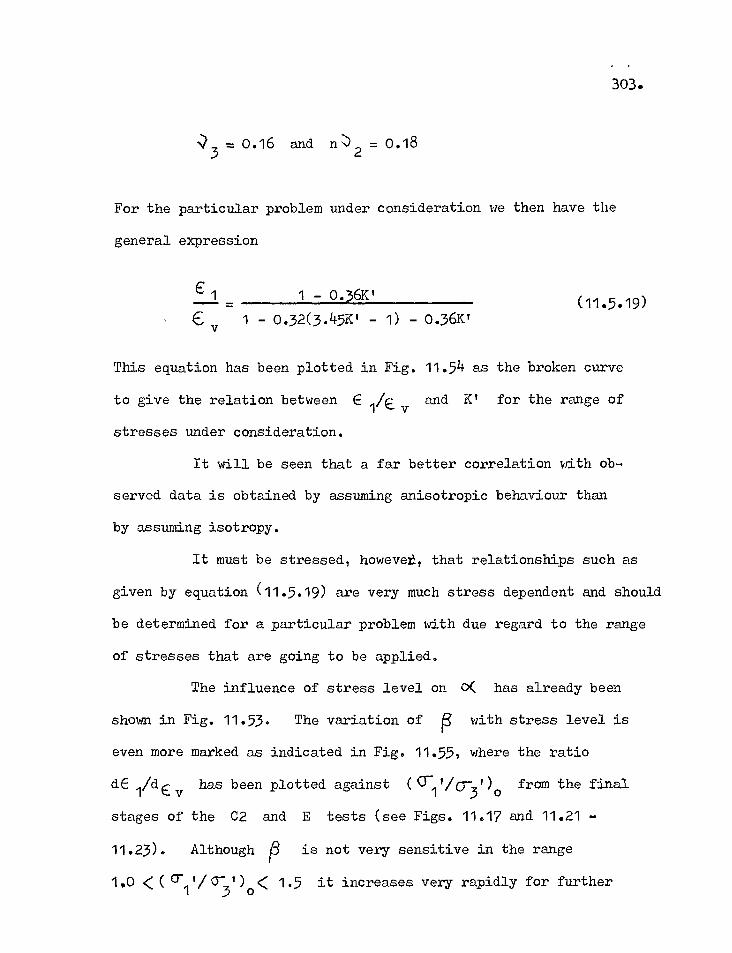
303.
3 o.16 and
2 0.18
For the particular problem under consideration we then have the
general expression
6 1 1 - 0.36K' (11.5.19)
v 1 - 0.32(3.45K 1 - 1) - 0.36K'
This equation has been plotted in Fig. 11.54 as the broken curve
to give the relation between E 1/E, v and K' for the range of
stresses under consideration.
It will be seen that a far better correlation with ob-
served data is obtained by assuming anisotropic behaviour than
by assuming isotropy.
It must be stressed, howevet, that relationships such as
given by equation (11.5.19) are very much stress dependent and should
be determined for a particular problem with due regard to the range
of stresses that are going to be applied.
The influence of stress level on 0( has already been
shown in Fig. 11.53. The variation of i3 with stress level is
even more marked as indicated in Fig. 11.55, where the ratio
dE 1/dEv has been plotted against (071'/0-31)0 from the final
stages of the C2 and E tests (see Figs. 11.17 and 11.21 -
11.23). Although ig is not very sensitive in the range
1.0 <(Cri70-300‹ 1.5 it increases very rapidly for further
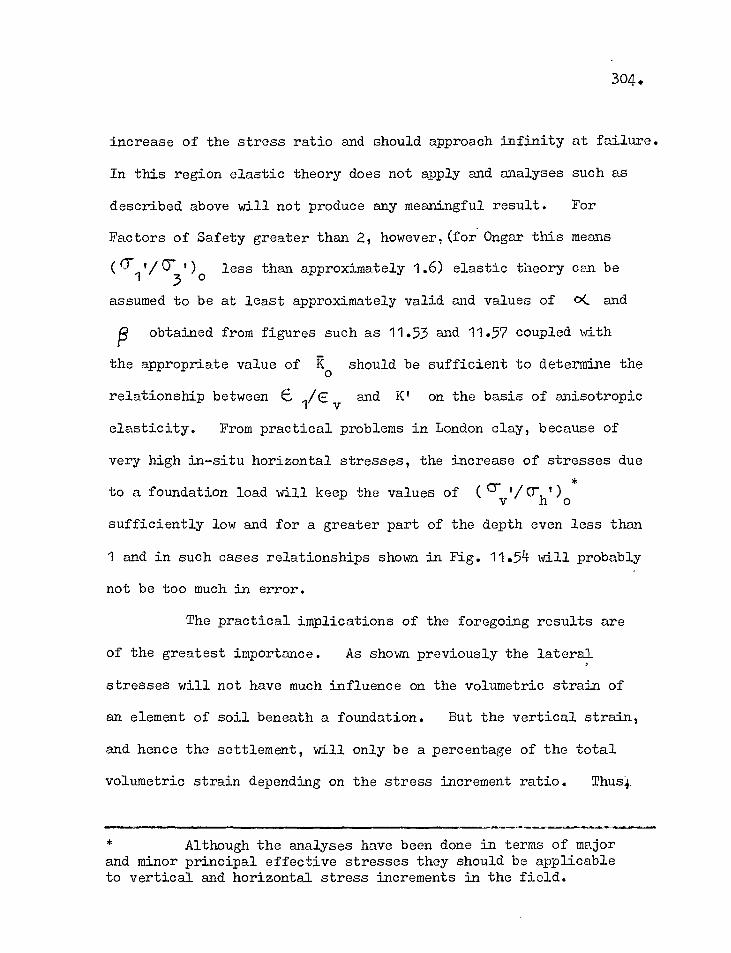
304.
increase of the stress ratio and should approach infinity at failure.
In this region elastic theory does not apply and analyses such as
described above will not produce any meaningful result. For
Factors of Safety greater than 2, however,(for Ongar this means
(C71t/C5- t) o less than approximately 1.6) elastic theory can be 3
assumed to be at least approximately valid and values of O( and
13
obtained from figures such as 11.53 and 11.57 coupled with
the appropriate value of Ro should be sufficient to determine the
relationship between 6 1/(-7,v
and K' on the basis of anisotropic
elasticity. From practical problems in London clay, because of
very high in-situ horizontal stresses, the increase of stresses due
to a foundation load will keep the values of ( 7 t/crh')o
sufficiently low and for a greater part of the depth even less than
1 and in such cases relationships shown in Fig. 11.54 will probably
not be too much in error.
The practical implications of the foregoing results are
of the greatest importance. As shown previously the lateral
stresses will not have much influence on the volumetric strain of
an element of soil beneath a foundation. But the vertical strain,
and hence the settlement, will only be a percentage of the total
volumetric strain depending on the stress increment ratio. Thu4
Although the analyses have been done in terms of major and minor principal effective stresses they should be applicable to vertical and horizontal stress increments in the field.
E: 1 and E 3,
in the vertical direction ( Ey, E1') can be determined from the
(and thus n) independently. The elastic modulus
305.
for example, if A 0- 3f/per1, = 0.7 we have, from Fig. 10.54,
el/e, = 0.6. But in a conventional settlement analysis, use
of oedometer test data implies one-dimensional strain i.e.
E:A v = 1.0. So if the volumetric strains are equal, direct use
of the oedometer compressibility will over-estimate the vertical
strain of the element by more than 60%. (This point will be dis-
cussed in greater detail in Chapter 12).
11.5.3 Elastic parameters of London clay
So far we have determined three elastic quantities J 3' ,
n .) 2 and n(1 - J 1) = N) 3/Ro which are sufficient to define the
strain - ratio fo an anisotropic material (equation 11.5.15). In
order to obtain all the five parameters it is necessary to determine
standard drained test data (Fig. 11.24), by applying equation
(11.5.13a) in which is substituted AO-3, = 0. The results are
plotted in Fig. 11.56 in the form of secant modulus vs effective
stress ratio. Since,the modulus increases with consolidation
pressure the data have been plotted in terms of the non-dimensional
quantity E2 v '/crc As in the case with the undrained modulus
(see section 11.3) Ev decreases with increasing shear stress,
indicated by the effective stress ratio, and the best fitted linear
relationship has been obtained by the method of least squares.
- 2 a.
v ver
(11.5.20)
MI6!!
To determine the horizontal modulus (Eht = El31)
standard drained tests were performed on three specimens with their
axes parallel to the direction of bedding at effective consolidation
pressures of 60, 100 and 100 lbs/in2 (Fig. 11.25). During the
consolidation stages of test nos. T-H0-35 and T-H0-36 both the
axial and volumetric strains were measured as in the C1 tests.
The results are shown at the bottom of Table 11.2. It can be seen
that the average ratio e i/E, for the two tests is 0.40.
Now the axial strain €1 for a horizontal sample is,
in fact, equivalent to the lateral strain (C3) of a vertically
oriented sample. This means, from equation (11.5.14) that
€ 1 i
v Hor _ C v .1 ver
Using (61/E ver = 0.45 we have
€ 1 2(1 - 0.45) = 0.28 v Hor
The observed (E1/(.1v)Hor does not correspond well with the ratio
calculated on the basis of the tests on vertical specimens. How-
ever, more tests on horizontal samples are needed before this dis-
crepancy can be properly examined, although one possible reason may
be that the two horizontal specimens, for which data are available,
had their stress/strain modulii very similar to those for the
307.
vertical specimens (compare Figs. 11.24 and 11.25) indicating that
their degree of anisotropy was, perhaps, not great.
The secant modulus for the horizontal specimens (expressed
in non-dimensional terms by dividing it by the pre-shear consolida=te
tion pressure 4-0') has been plotted, as before, against stress
level lir11/cr3, in Fig. 11.57. Although the scatter is large the
best fit line has been obtained, as for the vertical samples, by
the method of least square. Fig. 11.58 shows the comparison
between the horizontal and vertical modulii. It can be seen that
E is greater than El 1 but only by a small amount, the ratio
n = E:vVEEh' being in the range 0.85 - 0.95. This confirms that
the degree of anisotropy, insofar as the elastic modulii are con-
cerned, is small. Of course, to have a clearer idea of the overall
anisotropy one must consider the difference between the three
Poisson's ratios as well.
With the average value of n = 0.87, for the range
<A(711,/(cri t)0A( 0.5, we can..now calculate --)1 and *> 2 in
addition to •••.) 3 which has already been determined. The results
are summarised in Table 11.7. For comparison, the Poissonts ratio
calculated on the assumption of isotropic elasticity
Of = R0/1 + R0) is also shown.
308.
The above parameters can be used to predict the com-
pressibility of undisturbed London clay for drained compression.
From equation (11.5.14)
E'
1 - 2 3 (60-11)+2(1- 2 ) El 3
Substituting &cr ' = Acr3 for isotropic consolidation
1 - 2,)3
2(1 - 1 - )2)
- E 1
E. 3
E (11.5.21)
Compressibility 12cv is defined as
v
ccv f(Cr/)o - (11
The two equations can be combined to give
C _ 1 - 2.)
3 2(1 - 1 2 )
Cv p 3'
(11.5.22)
(11.5.23)
Taking the values of E 1 = El v f = 52((11)0 and
E 3 = E = 60( 1t)o from Fig. 11.56, for (01 1/0-31)0
= 1.0 and the elastic parameters listed in Table 11.7, we get
c _ 0.027 cv (0-1,)0 (11.5.24)
309.
Equation (11.5.24) has been plotted in Fig. 11.59 as the
predicted relationship between volumetric compressibility and
effective stress which shows extremely good agreement with the
average experimental curve, replotted here from Fig. 11.52. How-
ever, this is not a completely independent check because one of the
five elastic parameters has been determined for the all round con-
solidation tests.
Although the above data suggest that the deformation of
London clay under drained conditions can be approximately analysed
in terms of anisotropic elasticity a few inconsistencies still re-
main to be investigated. Most important is the apparent insensi-
tivity of the volumetric compressibility to lateral stress incre-
ment which cannot be explained in terms of elastic theory.
11.6 Rate of consolidation
The time vs volumetric strain and time vs axial strain
data for the consolidation stages of the triaxial tests have been
presented in Figs. 11.37 - 11.43. All the tests were terminated
when there was no more measurable volume change or axial deformation.
Secondary consolidation was not studied in detail.
It can be seen from the isotropic consolidation data
(Figs. 11.37 and 11.38) that the end of primary consolidation is
reached at about the same time with respect to both axial and
volumetric strains. The two Cv
values indicated in Table 11.2
310.
for each consolidation stage refer to the two strains and have been
calculated on the basis of t50. As would be expected, the
difference between them is not great although in six out of eight
cases the Cv
values for axial strain are slightly greater. Figs.
11.60 - 11.63 show the comparisons between the observed rate of
consolidation and the Terzaghi theoretical curves fitted at t50.
It can be seen that the agreement, on the whole, is satisfactory
for degrees of consolidation of up to 70%, although at early stages
there is a tendency for the observed rate to be a little faster.
Towards the end of consolidation, however, the observed rate is
always slower than theoretical, indicating the influence of second-
ary and creep effects as in the case of the oedometer tests (see
Chapter 10, section 10.2). The curves for1 and e v, which
should ideally be identical, show small differences, reflecting
the differences in Cv, although the maximum discrepancy is no
more than 5% at any time.
Similar results are obtained for the Cl and D tests
in which the specimens were subjected to isotropic consolidation
after different stages of undrained loading. The Cv
values are
given in Tables 11.4 and 11.5 and the comparisons between the ob-
served rate of consolidation and the Terzaghi theoretical curves,
fitted at t50, are shown in Figs. 11.64 - 11.69. Here the
discrepancy between the rate of volume change and the rate of
axial deformation is somewhat greater than for the BI tests -
311.
about 10%. Perhaps some difference is to be expected because the
samples in these tests were subjected to shear stresses under which
creep and secondary effects influence the axial and volumetric
strains in different degrees.
The results of anisotropic consolidation (B2 and C2)
tests are plotted in Figs. 10.70 - 10.72, and the Cv values are
summarised in Tables 11.3 and 11.5. Very good agreement is
obtained between the rate of volume change and the theoretical
Terzaghi curve fitted at t50. No comparisons are shown for the
rate of axial deformation, because the rate at which the lateral
pressures were decreased during consolidation (see Chilpter 9,
section 9'4..2) did not exactly conform to the rate of dissipation of
the average pore water pressure. Although this did not affect the
volume change or the total axial strain, the rate of axial deforma-
tion was considerably affected (see consolidation curves in Figs.
11.39 and 11.43).
The permeability data shown in Tables 11.2 - 11.5 have
been calculated from the Cv •values obtained for volume change,
using the expression
C _ v -N(
C w cv
where u w = unit weight of water
C cv = coefficient of volume compressibility and
(11.6.1)
312.
k = coefficient of permeability.
Fig. 11.75 shows the Cv values, obtained for volume
change from the different types of test, plotted against the average
vertical effective stress during consolidation while similar data
for the coefficient of permeability are shown in Fig. 11.76. It
is clear that the scatter is large and no consistent picture emerges
as to the influence of the type of test on Cv and k. Although
the C2 tests seem to indicate slightly higher values, the number
of tests is too small to allow one to be conclusive about this.
Notwithstanding the scatter, however, it is possible to see a
definite decrease of the coefficient of permeability with pressure
(Fig. 11.76), while the mean curve lies fairly close to that ob-
tained from oedometer tests. In the case of Cv, on the other
hand, the data show only a small decrease with pressure, but this
agrees well with the range of Cv values obtained from oedometer
tests - also plotted in Fig. 11.75 for comparison.
The two isotropic consolidation tests on horizontal
specimens indicate that both Cv and it are considerably higher
for horizontal drainage than for vertical drainage (see Table 11.2),
although the data are clearly inadequate to allow any definite com-
parisons to be made. However, similar results have been obtained
from oedometer tests by Ward et al (1959) and Agarwal (1967).
It has been mentioned earlier that there is good agree-
ment between the observed rates of settlement and the predictions
313.
based on the Terzaghi theory fitted at t50. This is more clearly
seen from Figs. 11.73 and 11.74 where the theoretical and observed
rates of consolidation have been plotted against the Terzaghi
time factor Tv for the different types of test reported above.
Thbre can be no doubt about the validity of the Terzaghi theory
in predicting the average rate of consolidation of undisturbed
London clay, at least for degrees of consolidation of up to 70%T
In this respect, too, the behaviour of London clay under triaxial
test conditions is very similar to that under oedometer conditions
(see Chapter 10, section 10.2). It can be said, therefore, that
for one-dimensional drainage, both the volumetric compressibility
and the coefficient of consolidation of undisturbed London clay
are essentially independent of whether the specimen is allowed to
deform in all directions or is restrained laterally. Of course,
the influence of stress level on these quantities will still have
to be considered in any;;settlement analysis.
It is worth recalling, at this point, that field pre-
dictions of the rate of settlement, based on laboratory data, have
ogten been found to be slower than actually measured (see Chapter
3). There are many reasons for this, the most important being
It has been shown in Chapter 10 that there is greater discrepancy between the observed rate of dissipation of the maxi-mum pore water pressure, as opposed to the average degree of con-solidation, and the Terzaghi theory. Pore pressures were not measured in the triaxial tests, since to do this, much longer testing times would have been necessary.
314.
that in addition to vertical drainage, consolidation in the field
takes place horizontally. This three-dimensional flow of water
causes settlement to progress much faster than predicted on the
assumption of one-dimensional flow (see Chapter 13). The general
theory of three-dimensional consolidation in a porous elastic medium
was formulated by Biot (1941). Biot (1955) extended this work to
cover the more general case of the anisotropic medium. The
solution of these mathematical problems are, however, much too
complex for use in engineering analysis and only a few special cases
have so far been solved. Gibson and Lumb (1953) used numerical
methods to solve the Terzaghi equation for combined radial and
vertical flow. Analytical solutions have been obtained for the
consolidation of a semi-infinite, isotropic elastic medium, sub-
jected to uniform boundary loads (Gibson and McNamee 1957, 1963,
de Josselyn de Jong 1957, McNamee and Gibson 1960). These
analyses show that the problem of aonsolidation in the field is
Intimately linked with the problem of stress distribution and a
knowledge of both the Young's modulus and Poisson's ratio are re-
quired for its evaluation. However, as has been shown in the
previous section, the properties of London clay, like most other
clays, are anisotropic. Analytical solutions of the consolidation
problems for such media are not yet available.
There is also considerable difficulty in determining
from laboratory tests the true coefficient of consolidation that
315.
should be applicable in the field. Rowe (1968) made an extensive
study of the calculated and observed rates of settlement of em-
bankment:dams, with particular reference to sand drains, and found
that the Cv
values determined from field rates of settlement
were generally many times higher than those obtained from con-
ventional oedometer tests on 3 in diameter samples. This he
attributed to the presence of thin layers of more pervious materials
which, if spaced closely, may alter the field value of Cv
con-
siderably (see also RO--7 1959, 1964). With usual structural
foundations on London clay, however, this problem is not likely to
be as great because, in the absence of sand drains, horizontal
drainage may only be accentuated insofar as the presence of lamina-
tions causes horizontal permeability to be greater than vertical
(Ward et al 1959).
It may be remarked, finally, that the presence of random
fissures in London clay may also influence the rate of consolidation
in the field. But, of this, very little is known.
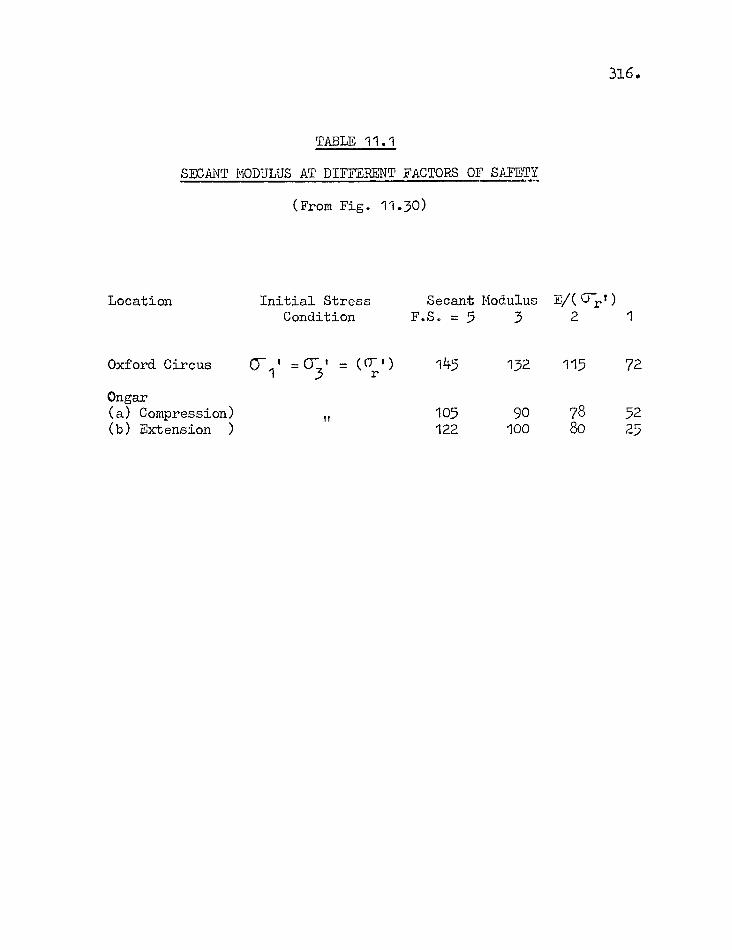
316.
TABLE 11.1
SECANT MODULUS AT DIFFERENT FACTORS OF SAFETY
Location
Oxford Circus
Ongar (a) Compression) (b) Extension )
(From Fig.
Initial Stress Condition
0--1
= 03
a-- =
11
11.30)
Secant Modulus F.S. = 5 3
145 132
105 90 122 100
EACTp) 2
115
78 8o
1
72
52 25
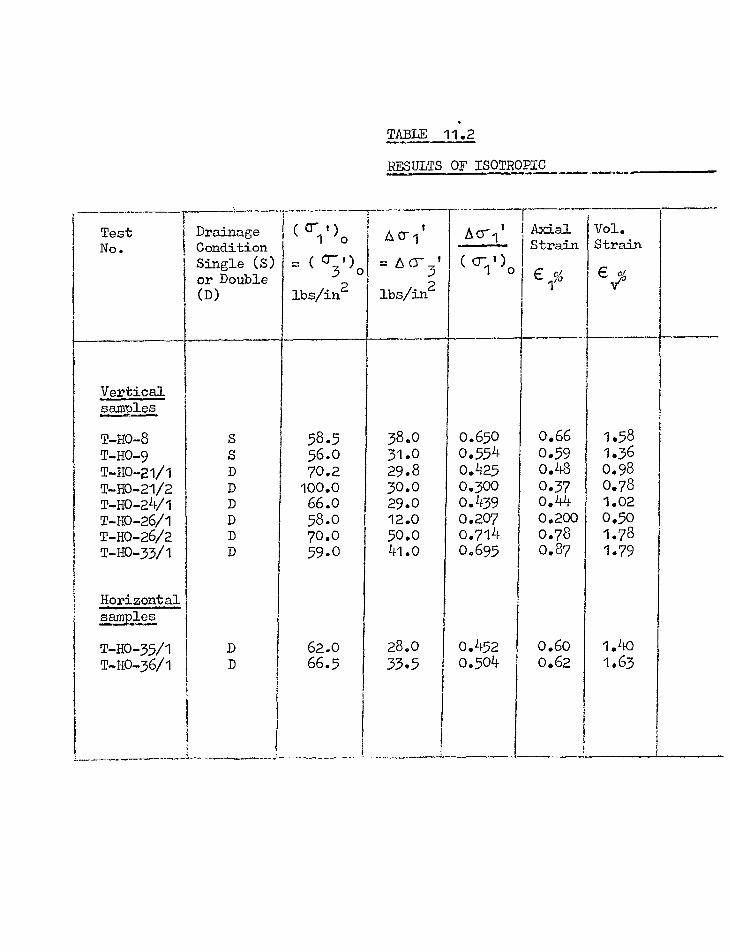
TABLE 11.2
RESULTS OF ISOTROPIC
Test No.
Drainage Condition Single (S) or Double (D)
(a- t) 1 o
= ( (7 ')o 3 lbs/in2
Acrit
= La-3 lbs/in2
Acril Axial Strain
oz 1'
Vol. Strain
€ 26 „, (crY) „..,€
Vertical I aaalaa
T-110-8 s 58.5 38.0 0.650 0.66 1.58 T-Ho-9 s 56.0 31.0 0.554 0.59 1.36 T-H0-21/1 D 70.2 29.8 0.425 0.48 0.98 T-H0-21/2 D 100.0 30.0 0.300 0.37 0.78 T-HO-24/1 D 66.0 29.0 0.439 0.44 1.02 T-HO-26/1 D 58.0 12.0 0.207 0.200 0.50 T-HO-26/2 D 70.0 50.0 0.714 0.78 1.78 T-HO-33/1 D 59.0 41.0 0.695 0.87 1.79
Horizontal aaalaa
T-H0-35/1 D 62.0 28.0 0.452 0.60 1.40 T-110-36/1 D 66.5 33.5 0.504 0.62 1.63
_____
CONSOLIDATION (B1) TESTS
E 1 ccl E 1 _
acv ' v ,
c Ir
(From 6 v)
in2/min x 10-3
cv (From E 1)
in2/min x 10-
k .
-.!
cms/sec 10-10
I, ( IN Cr
) 1
0
in2/lb x 10-4
60- , 1
in2/lb x 10-4
0.418 1.74 446 1.32 1.80 11.46 0.435 1.90 4.38 1.20 1.80 12.06 0.490 1.61 3.29 1.40 1.45 7.30 0.473 1.23 2.60 1.28 1.17 4.65 0.432 1.52 3.52 1.89 2.15 11.58 0.400 1.67 4.18 2.68 2.21 14.14 0.438 1.56 3.56 2.22 2.45 13.34 0.483 2.10 4.35 1.09 1.45 9.65
0.428 2.14 5.00 6.92 2.93 22.40 0.380 1.87 4.85 4.23 3.46 25.67
317.
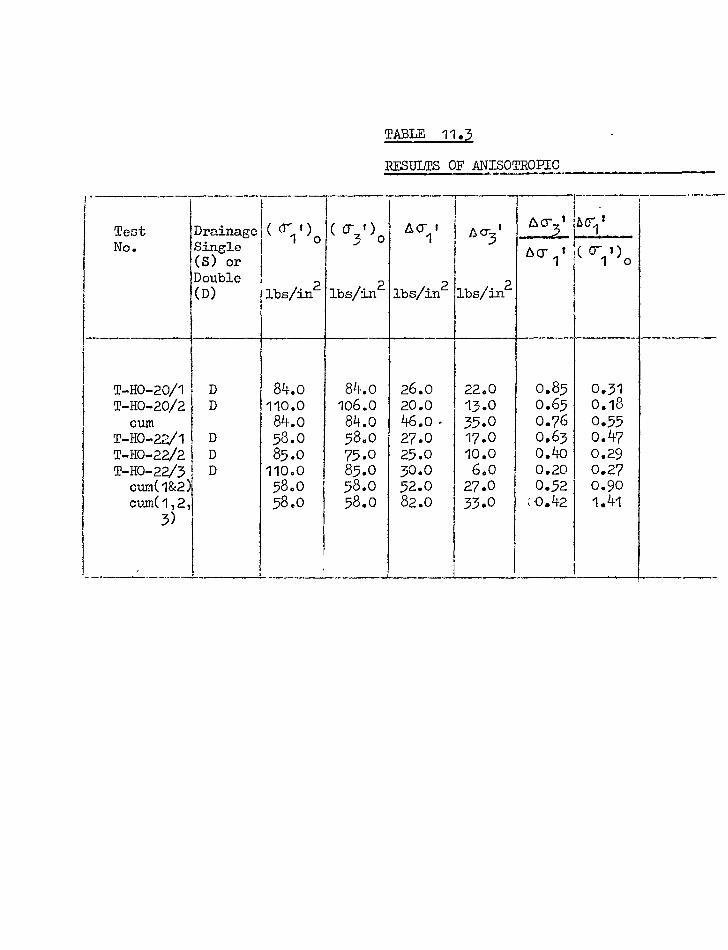
TABLE 11.3
RESULTS OF ANISOTROPIC
Test No.
Drainage Single (S) or Double
( (r.. 0 1 ( cr ') 3 0 cr 1 A ' Acr I ' ' AT 5 ' no- I ,
60- t 1 ( cr 1) 1
(D) lbs/in2 lbs/in2 lbs/in2 lbs/in2
T-HO-20/1 D 84.o 84.o 26.o 22.0 0.85 0.31 T-HO-20/2 D 110.0 106.0 20.0 13.0 0.65 0.18
cum 84.o 84.o 46.o. 35.o 0.76 0.55 T-110-22/1 D 58.0 58.0 27.0 17.0 0.63 0.47 T-HO-22/2 D 85.0 75.0 25.0 10.0 0.40 0.29 T-HO-22/3 D 110.0 85.0 30.0 6.o 0.20 0.27
cum(1&2) 58.0 58.0 52.0 27.0 0.52 0.90 cum(1,2,
3) 58.0 58.0 82.0 33.0 .0.42 1.41
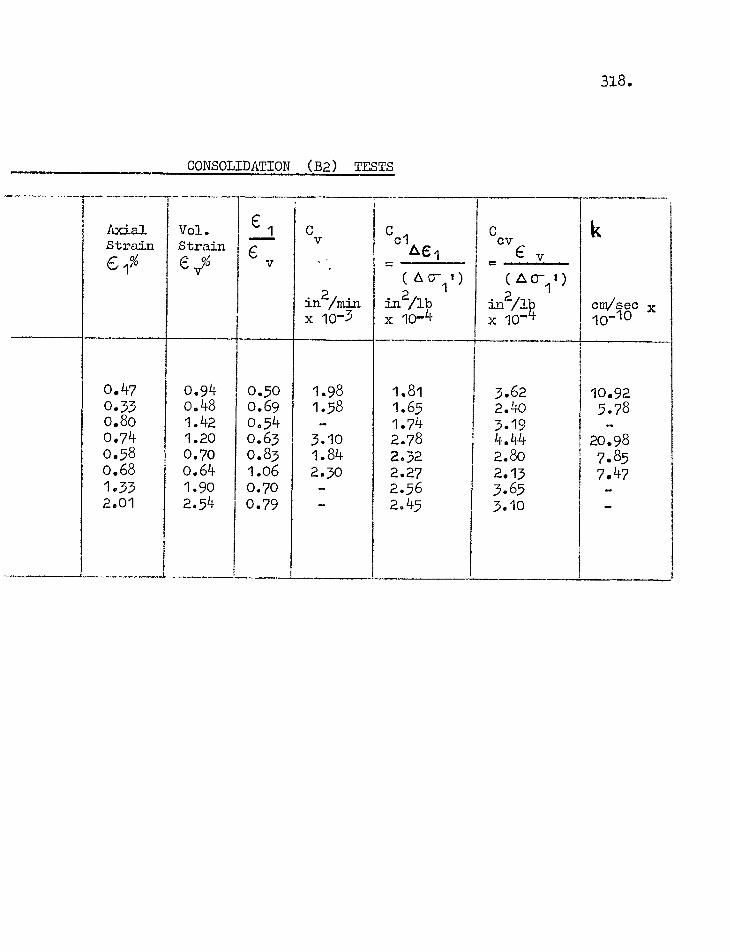
318.
CONSOLIDATION (B2) TESTS
Axial Strain 61%
Vol. Strain C. v%
E 1 Cv ccl 1161
=
c E v =
k c
V (d am 1 ) ( n0- Z ) 1 1
in2/min x 10-3
in2/lb x 10-4
in2/1p x 10-9-
cm/sec x 10-10
0.47 0.94 0.50 1.98 1.81 3.62 10.92 0.33 o.48 0.69 1.58 1.65 2.4o 5.78 o.8o 1.42 0.54 - 1.74 3.19 - 0.74 1.20 0.63 3.10 2.78 4.44 20.98 0.58 0.70 0.83 1.84 2.32 2.80 7.85 0.68 0.64 1.06 2.3o 2.27 2.13 7.47 1.33 1.90 0.70 2.56 3.65 - 2.01 2.54 0.79 - 2.45 3.10 -
.1.
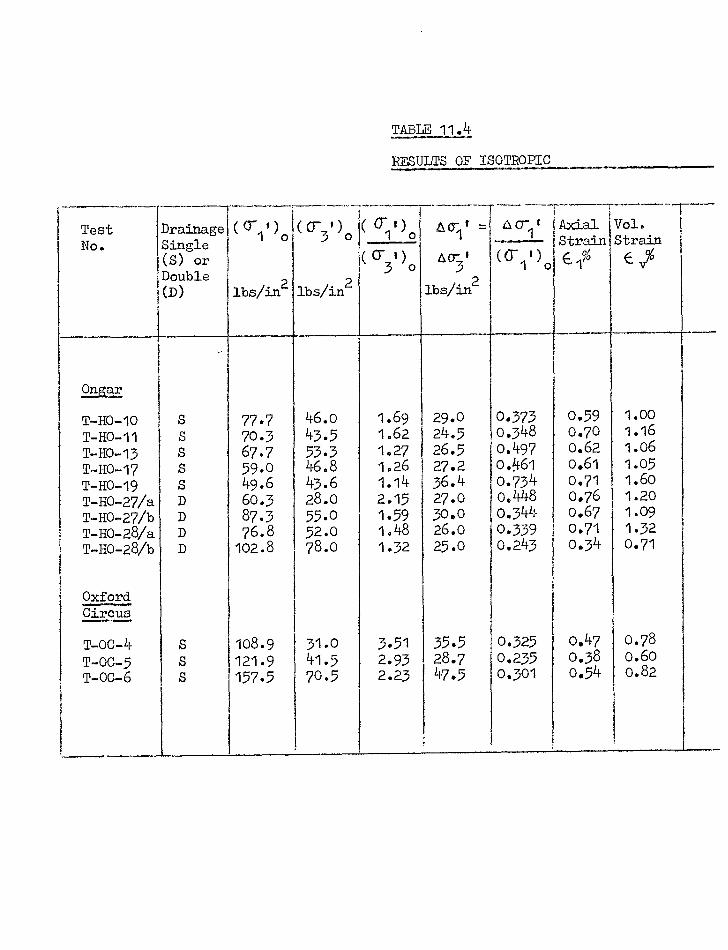
TABLE 11.4
RESULTS OF ISOTROPIC
Test No.
Drainage Single (S) or Double
(Tit), (0-31)0 ( orif)0 Acy =
air , 3
i16r1 f Axial
Strain E l%
Vol. Strain
E v% ( 63,)0
(<T1 ' )o (D) lbs/in2 lbs/in2 lbs/in2
ilasaE
T-110-10 S 77.7 46.o 1.69 29.0 0.373 0.59 1.00 T-H0-11 S 70.3 43.5 1.62 24.5 0.348 0.70 1.16 T-HO-13 S 67.7 53.3 1.27 26.5 0.497 0.62 1.06
T-H0-17 s 59.o 46.8 1.26 27.2 0.461 0.61 1.05
T-Ho-19 s 49.6 43.6 1.14 36.4 0.734 0.71 1.60
T-HO-27/a D 60.3 28.0 2.15 27.0 0.448 0.76 1.20 T-H0-27/b D 87.3 55.0 1.59 30.0 0.344 0.67 1.09 T-HO-28/a D 76.8 52.0 1.48 26.0 0.339 0.71 1.32 T-H0-28/b D 102.8 78.0 1.32 25.0 0.243 0.34 0.71
Oxford Circus
T-OC-4 s 108.9 31.0 3.51 35.5 0.325 0.47 0.78
T-OC-5 S 121.9 41.5 2.93 28.7 0.235 0.38 o.6o
T-0C-6 S 157.5 70.5 2.23 47.5 0.301 o.54 0.82
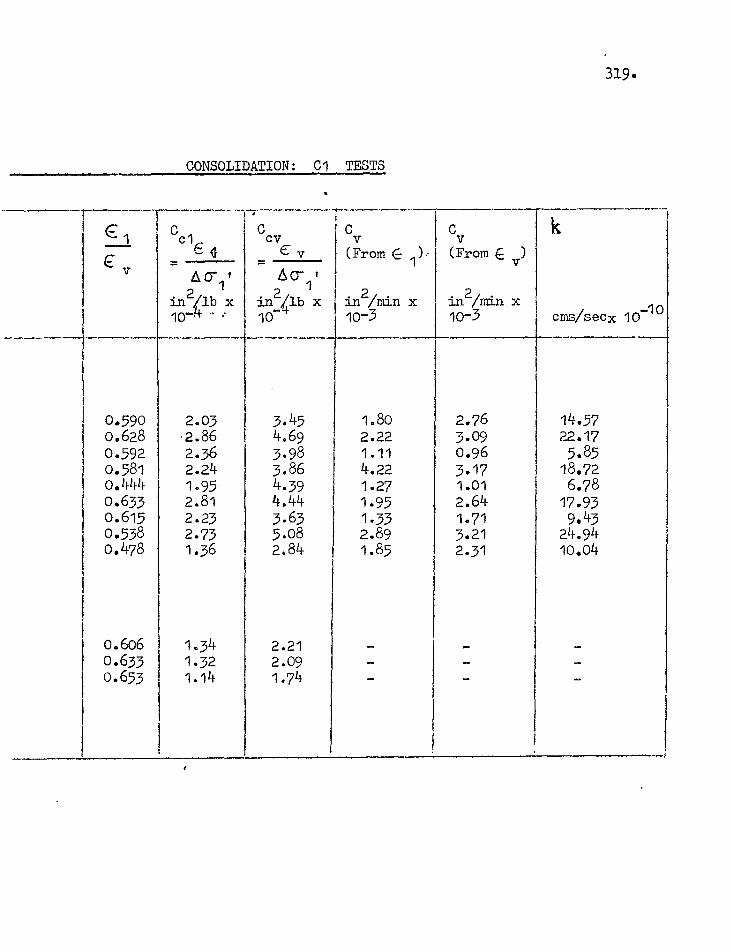
CONSOLIDATION: Cl TESTS
ccl 6 0 _
, c
E• v cv (From C-,- i
in2/min x 10-3
cv (From € v)
in2/min x 10-3 cms/seox 10 1°
€ v Ao- I 1 in2/lb x 10-44. - 2
=
AT , 1
in2ilb x 10-4
0.590 2.03 3.45 1.80 2.76 14.57 0.628 2.86 4.69 2.22 3.09 22.17 0.592 2.36 3.98 1.11 0.96 5.85 0.581 2.24 3.86 4.22 3.17 18.72 0.444 1.95 4.39 1.27 1.01 6.78 0.633 2.81 4.44 1.95 2.64 17.93 0.615 2.23 3.63 1.33 1.71 9.43 0.538 2.73 5.08 2.89 3.21 24.94 0.478 1.36 2.84 1.85 2.31 10.04
0.606 1.34 2.21 - - - 0.633 1.32 2.09 - - - 0.653 1.14 1.74 - - -
319.
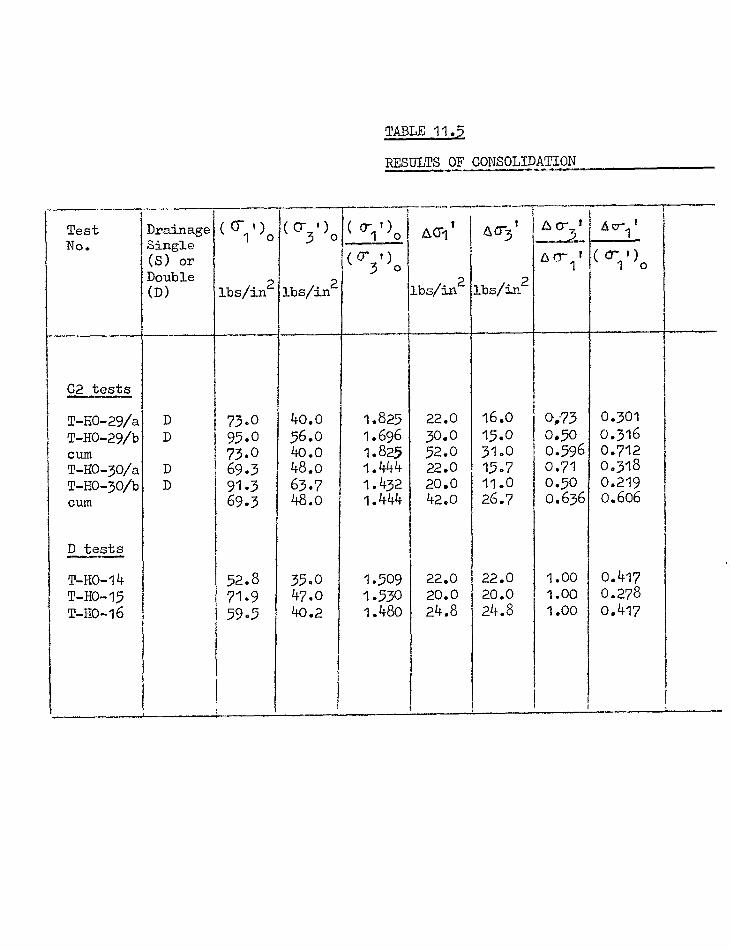
TABLE 11.5
RESULTS OF CONSOLIDATION
Test No.
Drainage Single (S) or Double (D)
( 0-11)0
lbs/in2
( Cr3 ' )o
lbs/in2
( cri T)Aci I
lbs/in2
4 310
lbs/in2
A a-.1
4 v-i '
( Cr3') o A 0-1 f ( Cr1 ' )o
C2 tests
T-H0-29/a D 73.0 40.0 1.825 22.0 16.0 0,-73 0.301 T-H0-29/b D 95.0 56.0 1.696 30.0 15.0 0.50 0.316 cum 73.0 40.0 1.825 52.0 31.0 0.596 0.712 T-HO-30/a D 69.3 48.0 1.444 22.0 15.7 0.71 0.318 T-H0-30/b D 91.3 63.7 1.432 20.0 11.0 0.50 0.219 cum 69.3 48.0 1.444 42.0 26.7 0.636 0.606
D tests
T-HO-14 52.8 35.0 1.509 22.0 22.0 1.00 0.417 T-HO-15 71.9 47.0 1.530 20.0 20.0 1.00 0.278 T-H0-16 59.5 40.2 1.480 24.8 24.8 1.00 0.417
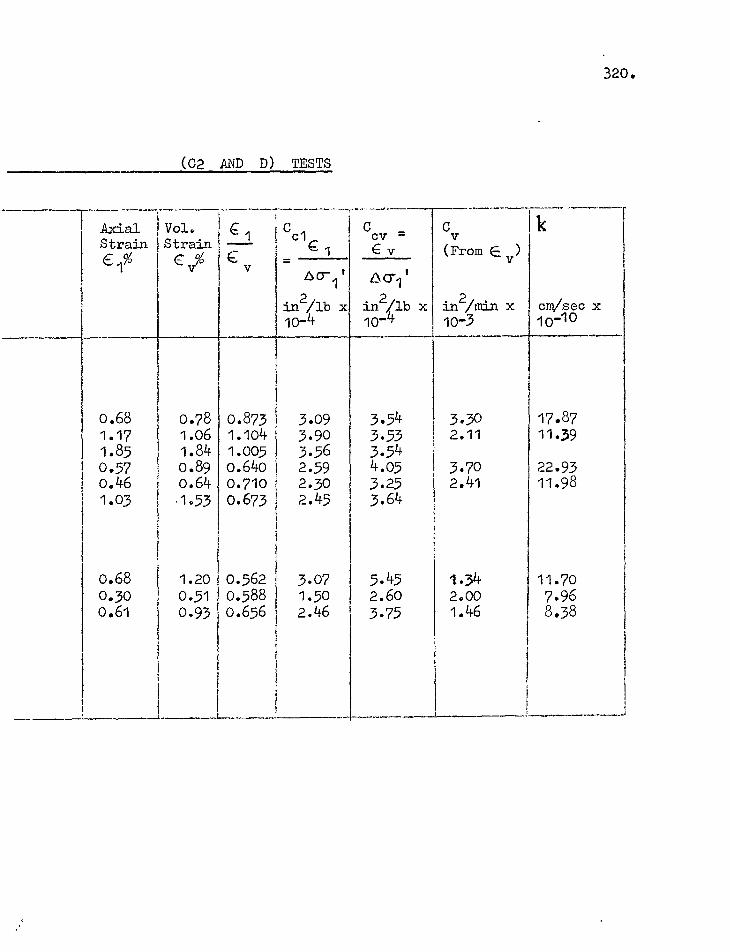
(C2 AND D) TESTS
Axial Strain El%
Vol. Strain
C v%
C1
ccl € 1 _
ccv = c v
Cv (From E) v
in2/min x 10-3
k
cm/sec x 10-10
v A °-1 t
in2/lb x 10-4
6c71' in2/lb x 10-4
0.68 0.78 0.873 3.09 3.54 3.3o 17.87 1.17 1.06 1.104 3.90 3.53 2.11 11.39 1.85 1.84 1.005 3.56 3.54 0.57 0.89 0.640 2.59 4.05 3.70 22.93 0.46 0.64 0.710 2.3o 3.25 2.41 11.98 1.03 .1.53 0.673 2.45 3.64
0.68 1.20 0.562 3.07 5.45 1.34 11.70 0.30 0.51 0.588 1.50 2.60 2.00 7.96 0.61 0.93 0.656 2.46 3.75 1.46 8.38
320.
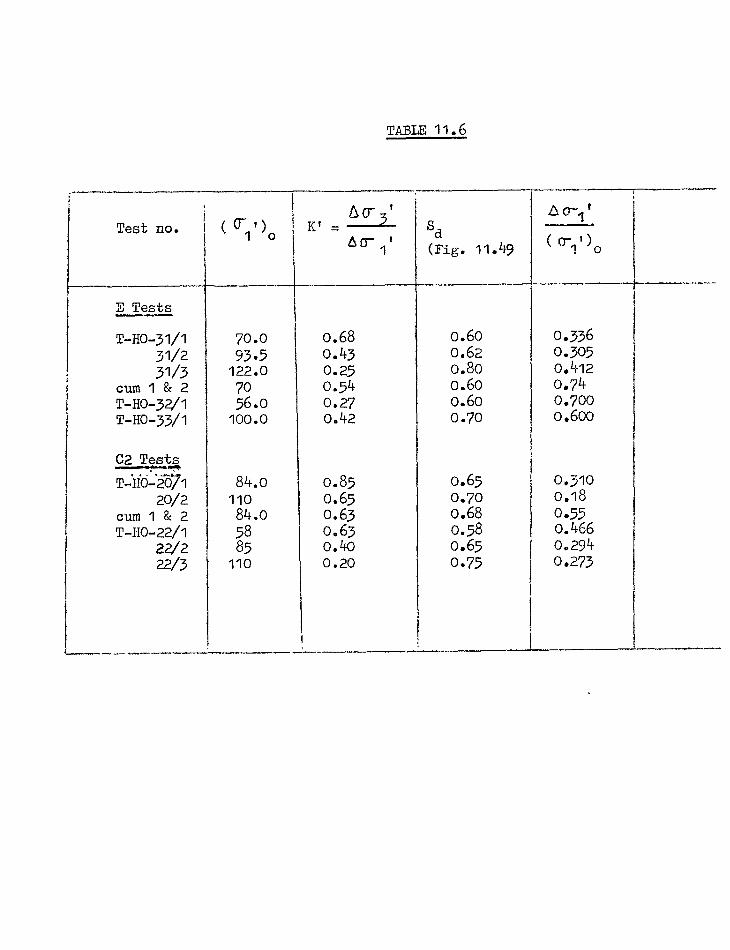
TABLE 11.6
Test no.( (r1 ?)o
Au' .31
(Fig. 11.49
po---I
I K' = ----'- d d 6- 1' ((T71,)o
E Tests
T-H0-31/1 70.0 0.68 0.60 0.336 31/2 93.5 0.43 0.62 0.305 31/3 122.0 0.25 o.8o 0.412
cum 1 & 2 70 0.54 0.60 0.74 T-H0-32/1 56.0 0.27 0.60 0.70o T-110-33/1 100.0 0.42 0.70 0.600
Ca Tests
T-1162201 84.o 0.85 o.65 0.310 2o/2 110 0.65 0.70 0.18
cum 1 & 2 84.o 0.63 0.68 0.55 T-H0-22/1 58 0.63 0.58 0.466
22/2 85 0.4o 0.65 0.294 22/3 110 0.20 0.75 0.273
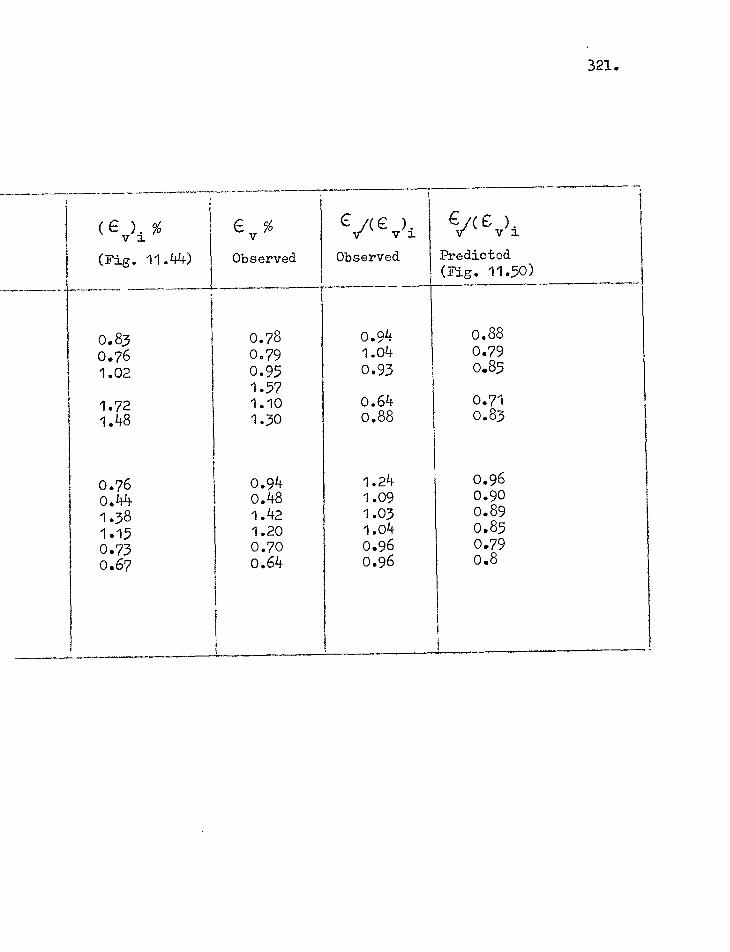
321.
( e ). % v 3. (Fig. 11.44)
G v % Observed
€1( E ) . IT 3. Observed
eic e ). 1r I Predicted (Fig. 11.50)
0.83 0.78 0.94 0.88
0.76 0.79 1.04 0.79
1.02 0.95 0.93 0.85 1.57
1.72 1.10 0.64 0.71 1.48 1.30 o.88 0.83
0.76 0.94 1.24 0.96
0.44 0.48 1.09 0.90
1.38 1.42 1.03 0.89
1.15 1.20 1.04 0.85 0.73 0.70 0.96 0.79 0.67 0.64 0.96 o.8
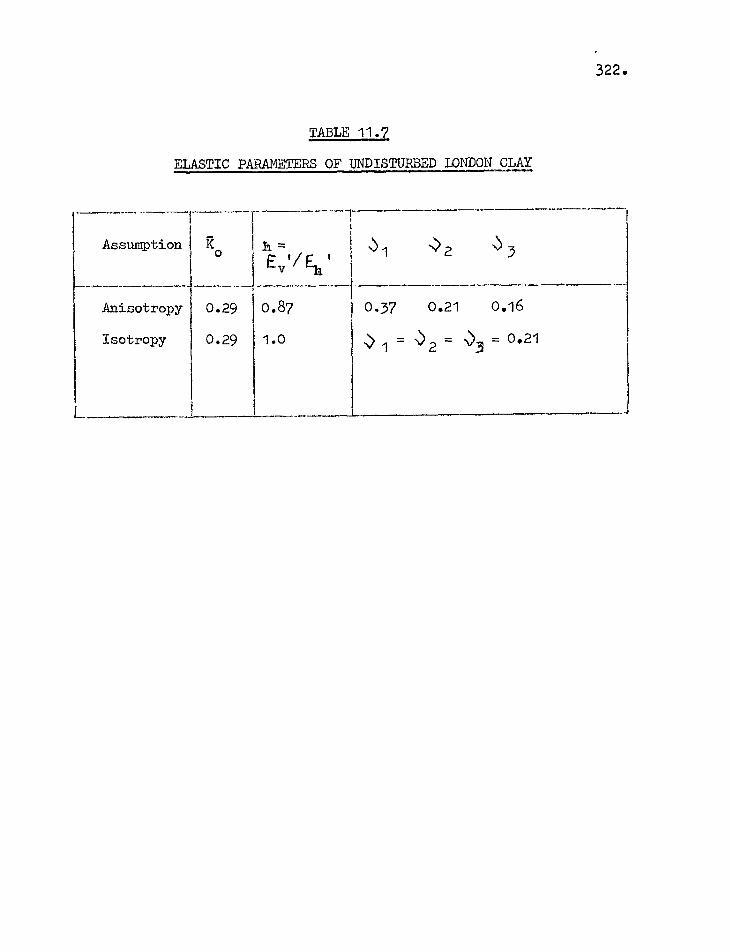
322.
TABLE 11.7
ELASTIC PARAMETERS OF UNDISTURBED LONDON CLAY
1 -
Assumption Ro la= '' 1 ...> 2 N.) 3 Ek '
Anisotropy 0.29 0.87 0.37 0.21 0.16
Isotropy 0.29 1.0 ..,) 1 = ..)2 = „:),.5 = 0.21
323.
CHAPTER 12
A COMPARATIVE STUDY OF THE TRIAXIAL AND OEDOMETER TEST DATA
In Chapter 11 comparisons have been made between some
oedometer and triaxial test results. In this chapter a more
detailed study will be made of the various quantities that can be
determined from both triaxial and oedometer tests, in relation to
their practical applications.
12.1 Volumetric compressibility
For the oedometer test, the coefficient of volume com-
pressibility my is defined as
1 d e my = 1 + eo
(12.1.1)
where eo is the void ratio at pressure po, and Ae is the
change of void ratio for increase of pressure from po to po + L p.
The relationships between my and the effective vertical
stress for the different oedometer tests have been presented in
Chapter 10 - the data are summarised in Fig. 10.54. The various
factors that affect the compressibility of clays have also been
discussed in Chapter 10.
The volumetric compressibility for triaxial compression,
C cv, defined as
324.
C — . 1
(12.1.2)
cv V CT1
(where AT1' is the change of the major principal stress from
(a-11)o
to (Cr!)o + tscr ,) has been plotted against (Cr.1 1)o 1
in Fig. 11.52. It should be noted that in the range of stresses
under consideration the effective vertical stress is the major
principal stress for both oedometer and triaxial tests.
The two sets of results have been replotted in Fig. 12.1
for comparison. The oedometer data consist of four compressibility
vs vertical effective stress relationships for the following tests
which have been reported in detail in Chapter 10,
(a) Standard oedometer test - first loading
(b) Standard oedometer test - second loading
(c) Tests in the high pressure (hydraulic) oedometer
(d) Controlled rate of strain test.
(The data do not include the results of the standard
oedometer tests in which the specimens were allowed to rest for 90
days at the in-situ effective overburden pressure - they are shown
in Figs. 10.21 and 10.22).
The triaxial test data, on the other hand, are represented
by a single Ccv vs co-1 1)0 curve for all the consolidation tests
reported in Chapter 11.
The first point to note from Fig. 12.1 is that the com-
pressibilities determined from triaxial tests lie within the range
325.
of those obtained from oedometer tests. The triaxail compressibi-
lities fall in between the first and second loading standard tests,
the former always giving higher values. Over most of the stress
range, the hydraulic oedometer data lie close to the triaxial
results while the controlled rate of strain test gives compressi- .
bilities- which are smaller than the triaxial values at low stresses
but greater at high stresses. It is difficult to say how far these
differences are significant, because the stress conditions in all
the oedometer tests - except, perhaps, the second loading standard
tests - are similar, yet there appears to be a marked difference
in the compressibilities. That initial conditions in the oedo-
meter affect the compressibility has been discussed in detail in
Chapter 10. It is possible, however, that the controlled rate of
strain test under-estimates the compressibility at low stresses -
giving smaller values than even the second loading standard tests
(see Fig. 10.54).
Nevertheless, the above study reveals that the difference
in compressibility obtained from triaxial and oedometer tests is
only small - the first loading oedometer test giving slightly higher
values. But it has been described already in Chapter 10 that these
latter tests were affected by initial swelling and the close corres-
pondence between the triaxial and hydraulic oedometer data suggests
that a properly conducted oedometer test, where the initial swelling
is really prevented, gives a reliable estimate of the volumetric
326.
compressibility of undistrubed London clay. The comparison shown
above also supports the general conclusion, arrived at in the pre-
vious chapter, that the lateral stress has only a small effect on
the compressibility. It should be remembered that the triaxial
tests were conducted, following many different stress paths, prior
to and during consolidation, while deformation was always one-
dimensional in the oedometer, the corresponding stress paths being
as shown in Fig. 10.74. Yet the data plotted in Fig. 12.1 do not
suggest any strong influence of stress path on the volumetric com-
pressibility.
The effect of small pressure increments, following long
periods of rest was not studied in the triaxial tests, It has
been found from the oedometer tests, however, that, after a rest
period of 90 days, an increase of effective stress of less than
10% does not cause any appreciable volume change. Applying this
to a problem in the field, this means that a "threshold" value of
at least 10% of the in-situ vertical effective stress must be ex-
ceeded before any significant volume change would occur.
12.2 Axial strain
It follows from the above discussion that volumetric com-
pressibility of undisturbed London clay can be correctly determined
from oddometer tests, (provided the initial swelling is truly pre-
vented) as well as from triaxial consolidation tests. Similar
327.
results will be obtained by the two methods of testing because the
lateral stresses have no significant influence on the compressibility.
On the other hand - it has been shown in Chapter 11 - the lateral
stress increment does have an important influence on the vertical
strain associated with the process of consolidation. For the
same increase of the vertical effective stress, two specimens will
undergo different amounts of settlement depending upon the magnitude
of the lateral stress increment. This can best be seen with re-
ference to the stress paths shown in Fig. 12.2.
Point A represents the in-situ vertical and horizontal
effective stresses Of the Ongar specimens, their magnitudes being
Crv' = 32.0 lbs/in
2
CS h = 76.0 lbs/in2
After sampling the total stresses are reduced to zero and the
specimens are acted upon by an all round effective stress, Pk =
58.5 lbs/in represented by the point B (see chapter 8). Such a
specimen is now mounted in the oedometer and, in fact, a "swelling"
test is initially carried out, i.e. nominally no change in height
is allowed, at the end of which the effective stresses are given by
the point C (see Table 10.6). For subsequent one-dimensional
consolidation the stress path CDD' is obtained. (Curve 1 of Fig.
10.74). It can be seen that the portion CD of the path ODD'
328.
is a straight line, giving Ro = A 0-ht/Arry' = 0.28. At higher
pressures the stress path CDD' curves down and finally becomes
parallel to the normally consolidated Ko line. It has also been
found from the triaxial tests that, following initial isotropic
stress conditions, Ro = 0.29 in the range of effective stresses
50 - 100 lbs/i0 The corresponding stress paths are shown by
BE and FG. It can be seen that all the Ko lines CD, BE and
FG are essentially parallel and to produce one-dimensional con-
solidation in the field, therefore, the effective stress path must
be parallel to them.
Let us now consider, as an example, that the element in
the field is subjected, under undrained conditions, to axi-symmetric
total stress increases, Acr vi . 30 lbs/in2 and AO- hl = 8 lbs/in2.
Taking the pore preasure parameter A = 0.5 (see Chapter 11, section
11.4), the excess pore pressure A u is given by
6 u = 8 + 0.5(30 - 8) = 19 lbs/in2
So, at the end of undrained loading, the new values of effective
stresses are
v = 32 + (30 - 19) = 43 lbs/in2
ht = 76 + (8 - 19) = 65 lbs/in2
329.
This will cause the effective stress point to move from A to X
and the immediate settlement will be a function of the effective
stress path AX.
The excess pore pressure will now begin to dissipate
and if the total stresses remain unchanged, the specimen will have
followed, during consolidation, the stress path XY" which is
parallel to the isotropic line 00". In practice, however, there
will be a reduction of the horizontal stress due to the decrease of
Poisson's ratio during consolidation. For points beneath the centre
of a uniform circular load the magnitude of this reduction, which
depends on the pore pressure parameter A and Poisson's ratio
has been analysed in Chapter 7. Assuming that the point is located
at a depth z/b = 0.5, Fig. 7.3 gives, for A = 0.5 and 4 = 0.22,
a stress increment ratio (K1 ) during consolidation of 0.75. The
corresponding stress path is shown by the line XY. Now the stress
path required for one-dimensional (oedometer) consolidation is XY1
(K' = 0.29), the line XZ being drawn parallel to the Ko lines
for the stress range under consideration. That the axial strains
for the two stress paths will be quite different can clearly be
seen from Fig. 11.54, which gives the following results:
Stress path K'= crh s/A (ry' E 1/E v
XY' 0.29 1.0 XY 0.75 0.56
330.
Since the volume change in the two cases will be essentially
the same the vertical deformation of the element in the field will
be only 56% of that for one-dimensional consolidation. In other
words direct use of the oedometer data will over-estimate the
vertical strain by as much as 79% (i.e. 0.44/0.56)
The above example emphasises the importance of taking
into consideration the relevant stress path in determining the
vertical strain of an element of soil during consolidation in the
field, because it is the integration of all such strains beneath a
foundation that gives the total settlement of a structure. A com-
plete procedure for such a settlement analysis is developed in
Chapter 13.
The preceding discussion implies that volume changes
during consolidation in the field are acoompanied by significant
changes in lateral strain. The customary assumption made in the
usual settlement analysis that the strain during consolidation is
one-dimensional (i.e. e 1
= e v) may be approximately correct in
certain problems (see Skempton and Bjerrum 1957), but, for an
ordinary building foundation, where the loaded area is of limited
extent compared to the thickness of the clay layer, this is not even
remotely so.
Only liMited data are available of field measurements of
lateral strain beneath foundations. Wilson and Hancock (1960)
measured horizontal movements of up to 3.4 in in the foundation clay
331.
beneath the North Ridge Dam in Western Canada. An overall short-
ening towards the point of maximum settlement of 6 in in a length
of 1200 ft has been observed by Hardy and Ripley (1961) in the
foundation of an aluminium smelter plant in Kitimat, British
Columbia. Measurements beneath a test embankment at Ska-Edeby,
Sweden, showed large horizontal movements which varied with depth
(Osterman and Lindskog 1963) and Eggestad(1963) measured vertical
and horizontal strains beneath a model footing on dry sand and
found that the maximum strains occurred at a depth of about 3/4
width of the loading plate. Cappleman (1967) presented data from
an extensive field study of horizontal movements of pipe conduits
under earth dams. Although not all horizontal deformations re-
ported in the above references are due to consolidation - there
are other factors, e.g. shear deformation and general ground sub-
sidence which also cause lateral strains - the data serve to in-
dicate that settlement of structures in the field are often accom-
panied by lateral deformation of the subsoil and the assumption of
one-dimensional strain is not generally valid. It is worth
emphasising, however, that the magnitude and kind of lateral move-
ment (inward or outward) will depend on the soil type and the re-
lative magnitude of the vertical and horizontal stress increments
and every case has to be considered on its merit.
332.
12.3 Rate of consolidation
A comparative discussion of the rate of consolidation for
oedometer and triaxial tests has been made in Chapter 11 (section
11.6). It has been shown that, for uni-axial drainage, the
Terzaghi theory predicts the average rate of consolidation of un-
disturbed London clay quite accurately for degrees of consolidation
of up to 70%, beyond which secondary and creep effects make the
observed rate slower than predicted. The dissipation of the
maximum pore water pressure (studied only in the high pressure oedo-
meter), on the other hand, proceeds faster than predicted at early
stages of consolidation, but slower towards the end (see Chapter 10,
section 10.2).
Similar values of the coefficient of consolidation (Cv)
and the coefficient of permeability (k) are obtained from both
triaxial and oedometer tests (see Figs. 11.75 and 11.76). Either
method can, therefore, be adopted to determine the value of Cv
required to calculate the rate of settlement of a structure in the
field. Much work still needs to be done, however, on the subject
of the rate of consolidation, particularly under three-dimensional
conditions, permitting both axial and radial flow of water. Both
the oedometer and the triaxial apparatus can be used for the purpose
provided, of course, that a representative sample is tested. (see
Escario and Uriel 1961, Mackinley 1961, Shields and Rawe 1965).
333.
CHAPTER 13
THE STRESS PATH METHOD OF SETTLEMENT ANALYSIS
13.1 Introduction
In the foregoing sections of the thesis theoretical and
experimental considerations have, been given to the study of stress
path and its influence on the deformation and consolidation of un-
disturbed London clay. The experimental work has shown with clarity
the importance of taking proper account of the stress path in ex-
amining the stress - deformation characteristics of London clay and
its relevance to settlement of structures in the field. In this
chapter the use of stress path in settlement analysis will be
demonstrated by considering a typical foundation in London clay.
It is emphasised that the problem does not refer to any real
structure and should be taken solely as an illustration.
13;2 Formulation of the problem
The problem to be studied consists of a circular, flexible,
smooth footing, 40 ft in diameter and founded at a depth of 20 ft
at a site for which the soil profile is taken to be the same as for
Bradwell - to which reference has already been made in the thesis.
The settlement analysis will be made for the centre of this circular
foundation. The Bradwell data have been chosen simply because the
effective stress - depth relationships have been established to
334.
considerable depth at this site, (Skempton 1961), and these are
necessary for the stress path method of analysis. It will further-
more be assumed that the experimental data presented in Chapters 10
and 11 (for the Ongar clay) will apply to the clay beneath the
foundation.
From considerations of bearing capacity of the soil (see
Skempton 1951) a net foundation pressure of 20 lbs/in2 has been
adopted. This gives a factor of safety against failure of more
than 3 and corresponds to a gross pressure of 28.8 lbs/in2 (1.85
T/ft2). The "buried" footing effect will not be considered in the
analyses that follow, Reference can be made to Fox (1948) for the
necessary corrections.
Distribution of stresses
Fig. 13.1(a) shows the distribution of vertical and
horizontal effective stresses in the soil before the commencement
of excavation. The data are taken directly from Skempton (1961).
It may be noted that a total depth of 160 ft (i.e. 8 x radius of the footing) beneath the foundation has been considered. This is in
accordance with Fig. 6.22 where it has been shown that almost 95%
of the total elastic displacement of a non-homogeneous medium takes
place within a depth equal to 8 x radius of the loaded area. It
will subsequently be demonstrated, however, that a considerably
smaller depth is adequate for calculation of the consolidation
335.
settlement. In order to obtain the in-situ effective stresses for
points beneath the depth of 90 ft - in the paper by Skempton the
data are given for this depth only - the Cr y' line has been ex-
tended linearly while the curve for Cr h' has been extended to a
point at a depth of 160 ft for which the effective horizontal
stress is given by Ko corresponding to the over-consolidation ratio
at this point! The distribution of the average effective stress,
(Tim' = (0-v' 20r 1/3) with depth, is also shown in Fig. 13.1(a)
while the variation of the effective stress ratio 07v1/0-h with
depth is indicated by curve 1 in Fig. 13.1(c).
The increases of vertical and horizontal total stresses
due to the net foundation pressure have been calculated for the
Boussinesq problem (Poisson's ratio s) = 1) and plotted in Fig.
1351(b). Although the elastic modulus of the clay almost certainly
varies with depth, it has been shown in Chapter 6 that such variation
does not influence the stress distribution in a semi-infinite medium
to any great extent - for which the Boussinesq problem gives a close
approximation. The settlement will, of course, be obtained by
numerical integration of the strains beneath the foundation, in
calculating which due account will be taken of the variation of the
elastic modulus with depth.
For Bradwell erosion has reduced the effective over-burden pressure by 210 lbs/in? This gives, at a depth of 160 ft ( Cry' = 74 lbs/in2), an over-consolidation ratio of 3.9, for which Ko = 1.2 (Fig. 10.76).
336.
The soil is now divided into twenty layers, as shown in
Fig. 13.1(a). The first eight layers are all 5 ft thick while the
lower twelve layers have thicknesses of 10 ft each. For an ideal
settlement analysis, samples from a number of different depths should
be obtained and be first brought to the stress conditions indicated
by Fig. 13.1(a) and then subjected to stress increments given by
Fig. 13.1(b). In the present illustration, however, the data for
the Ongar clay, presented earlier in the thesis, will be considered
to be applicable to all depths.
13.4 "Immediate" settlement
Table 13.1 summarises the data required for the calculation
of the "immediate" (elastic) settlement. It will be seen that the
effective stress ratio before construction varies throughout the
depth from 0.35 to 0.82 - hence the necessity of testing samples
from different depths. As indicated by Fig. 11.35, however, the
pore pressure parameter varies only slightly in this range of stress
ratio and an average value of 0.55 can be taken without great loss of
accuracy. The excess pore pressures set up under undrained con-
ditions have been calculated using this value of A [A u =A crh +
ACA Crlr - 411r1)] and shown by the dotted curve in Fig. 13.1(b)
- also tabulated in column 11 of Table 13.1. The vertical and
horizontal effective stresses as well as the stress ratios at the
end of construction, calculated on the basis of no volume change,
337.
are shown in columns 12, 13 and 14.
The Young's modulus, appropriate for each layer, can now
be obtained from Fig. 11.30, for the corresponding effective stress
ratio at the end of construction, (0-1)o referring to the
average effective stress prior to construction. The data are
shown in columns 15 and 16 and the variation of E with depth is
plotted in Fig. 13.1(d). The immediate settlement can now be
easily calculated by integrating the strains of all the layers
beneath the foundation, according to the equation
"cry — a- h dz i - r E (z)
(13.4.1)
The settlement thus obtained is 0.68 in (column 17 of
Table 13.1). It is interesting to note that, if a depth of 80 ft
(4 x Radius) only is considered, integration of the strains for
the first twelve layers gives a settlement of 0.61 in. Thus,
ignoring the lower 80 ft under-estimates the "immediate" settle-
ment by not more than 10%.
The above results can be compared with the "immediate"
settlement obtained by the conventional method of calculation.
Here, of course, the effect of stress path is not taken into con-
sideration and the average Young's modulus determined from stress
- strain relationships of standard undrained tests is 5,600 lbs/in
The "immediate" settlement is, then, (Terzaghi 1943),
338.
f) .212 (1 0 ) E (13.4.2)
where q = net foundation pressure (20 lbs/in2)
b = Radius of the circle (20 ft)
Ir= Dimensionless influence factor (1.5 for settlement of
the centre)
Substituting the appropriate values in equation (13.4.2) we have
= 1.29", compared to 0.68 in obtained by the stress path method.
In order to illustrate the use of Gibson's theoretical
analysis for non-homogeneous soil medium, numerical results of
which have been presented in Chapter 6, the elastic settlements have
been computed for the two cases shown by the broken lines in Fig.
13.1(d). The details of calculation are given in Table 13.2.
It will be seen that the two cases give settlements of 0,90 in and
0.58 in respectively while the actual settlement for the correct
variation of E with depth is 0.68 in.
13.5 Consolidation settlement
Let us consider an element of soil, beneath a foundation,
which undergoes both axial and lateral deformation during consolida-
tion. The volumetric strain of such an element due to the dissipa-
tion of excess pore water pressure 6, u, is given by
d E = (mv)3 . Q u (13.5.1)
339.
where (mv)3 is the coefficient of volume compressibility for
three-dimensional strain. The corresponding vertical strain is
..,_ X. (mv)3 . (13.5.2)
where X is the ratio of the vertical strain to the volumetric
strain. The vertical compression of the element during consolida-
tion can, then, be expressed as
d c X (mv)3 . b u . dz (13.5.3)
where dz is the thickness of the element. The consolidation
settlement of the foundation resting on a bed of clay of thickness
z is, therefore
pc = I X (mv)3 . A u . dz (13.5.4)
In the case of one-dimensional consolidation, in which
lateral strains are zero during load application as well as during
subsequent consolidation, the settlement is given by
z oed = f (m v)1 • 6. Cr • v 1
0 dz (13.5.5)
where Licr21"
is the increase of vortiea/( stress, and
340.
(mv)1 is the coefficient of compressibility for one-
dimensional strain.
Equation (13.5.5) gives the "conventional" method of calculating
final settlements and can be obtained by the straightforward applica-
tion of the oedometer test results (Skempton and McDonald 1955,
Skempton, Peck and McDonald 1955).
Skempton and Bjerrum (1957) modified equation (13.5.5),
taking account of the lateral strain during load application, but
still assuming one-dimensional strain during dissipation of the
excess pore pressures, and gave the following expression for the
consolidation settlement
Pctc1 (m v)1 )1 ts u . d (13.5.6) jr
Combining equations (13.5.5) and (13.5.6), Skempton and Bjerrum
obtained the following simplified relationship between the settle-
ment of a structure in the field and that obtained by the straight-
forward application of the oedometer test results
Pct =/1 fD oed (13.5.7 )
where the factor /1-t is a function of the soil type and the
geometry of the foundation.
Now it has been shown in Chapters 11 and 12 that volu-
341.
metric compressibility of undisturbed London clay, in the range
of stresses considered, is not significantly influenced by the
stress path and is primarily a function of the vertical effective
stress. So, for the same set of vertical stress increases the
oedometer and triaxial compressibilities are approximately equal,
i.e.
(mv)1 = (mv)3 = my (13.5.8)
Equations (13.5.4) and (13.5.6) can, therefore, be re-written as
) f a = Jx (mv) . dz )(13.5.4a)
o ) ) )
rci =( (my ) . u • dz )(13.5.6a) ) 0
Thus the settlement of a structure, where the foundation
soil undergoes three-dimensional strain (equation 13.5.4a) is
different from that given by the Skempton and Bjerrum method (equa-
tion 13.5.6a), even if the compressibilities may be identical. It
is only when A = 1 (i.e. one-dimensional strain) that the two co-
incidtt
In fact, there will still be a slight difference, because, in the Skempton and Bjerrum method my corresponds to the in-situ vertical effective stresses while in the stress path method my should correspond to the vertical effective stresses at the end of construction.
342.
The parameter X will, in general, depend on the soil
type, stress level and the stress increment ratio and should be
determined experimentally (see Chapter 11).
For the problem under consideration, the consolidation
settlement will be calculated by both equations (13.5.4a) and
(13.5.6a), the two methods being referred to as the stress path
method and the Skempton and Bjerrum method respectively. The com-
pressibility data obtained from the high pressure oedometer tests
(see Fig. 10.54) will be used throughout - the relevant data for
the stress range of the problem are shown in Fig. 13.3.
(a) The stress path method
The complete procedure for calculating the consolidation
settlement by the stress path method is summarised in Table 13.3.
It can be seen from column 6 and Fig."13.2(a) that the increase of
vertical effective stress during consolidation, expressed as a ratio
of the effective stress before consolidation, decreases sharply
with depth. At 45 ft the ratio is only 9%. It has been shown
from oedometer tests (see Chapter 10) that after long rest periods
at the in-situ overburden pressure, stress increases of less than
10% do not cause any appreciable volume change. So, the consolida-.
tion settlement has been calculated for this depth only, the clay
underneath being assumed to undergo no volume change.
The compressibility data, tabulated in column 7 are taken
directly from Fig. 13.3 - corresponding, for each layer, to the
343.
effective vertical stress before consolidation. The stress in-
crement ratio K' (column 9 and Fig. 13.2(c)) depends on the
Poisson's ratio of the material as well as on the pore pressure
parameter A and has been obtained for values of A = 0.55 and
2,7 = 0.21; from the theoretical work presented in Chapter 7 (see
Fig. 7.3). The corresponding values of -X , tabulated in column
9, have been interpolated from the experimental curve in Fig. 11.54.
The last column of Table 13.3 gives the vertical compression of
the individual layers which are added up to obtain the consolida-
tion settleinent (1.61 in).
(b) Skempton and Bjerrum's method
The calculation of consolidation settlement by Skempton
and Bjerrum's method is shown in Table 13.4. Once again the
effective depth is taken to be the depth - in this case 60 ft -
within which the vertical effective stress increments are greater
than 10% of the in-situ stresses. A settlement of 4.30 in is
obtained - which is the settlement given by the "conventional"
method (equation 13.5.5). The factor ft of Skempton and Bjerrum's
method is 0.69 (for A = 0.55 and z/b = 1.5) and the corresponding
settlement is, therefore, 0.69 x 4.30 = 2.96 in.
Poisson's ratio = 0.21, corresponding to 170 = 0.29 - for an isotropic material - has been used in the analysis (see Table 11.7).
3/14.
13.6 Comparison of different methods of settlement analysis
Table 13.5 summarises the "immediate" and consolidation
settlements obtained by the different methods of analysis described
above. It can be seen that the stress path method gives settle-
ments - which are only 54% of those given by Skempton and Bjerrumts
method. The almost identical ratio obtained for both "immediate"
and consolidation settlements is, perhaps, fortuitious, but the
effect of taking proper account of the stress path in settlement
analysis is amply clarified by the data in Table 13.5.
One final point is of interest. Column 9 of Table 13.2
indicates that A varies only slightly within the depth considered
so that a weighted average of 0.53 can be assigned for the entire
problem. Referring, now, to equations (13.5.4a) and (13.5.6a)
it can be seen that for constant A, ec = h pct*, where p cl
is the settlement given by Skempton and Bjerrum's method. Sub-
stituting A = 0.53 .and f)c1 = 2.96 in, we get the settlement
under three-dimensional conditions, = 1.57 in which is slightly
less than the settlement obtained by numerical integration in Table
13.2.
This statement is only approximately correct because the compressibilities for the two methods of analysis are slightly different (see Footnote on P-341)
345-
13.7 Rate of settlement
The final step in a settlement analysis is to calculate
the rate of consolidation settlement and thus to determine the
complete time - settlement relationship for the structure concerned.
In the analysis that follows it will be assumed that the excess
pore pressures do not begin to dissipate until construction is
complete and that secondary consolidation is absent.
The settlement of a structure at any time t after the
end of construction is given by
t- (13.7.1)
f)
where P. is the "immediate" (elastic) settlement (0.68")
is the total consolidation settlement (1.61") and c
U is the degree of consolidation settlement at time t
as evaluated from the theory of consolida-
tion
The rate of consolidation settlement of structures founded
on clay is usually calculated on the assumption that flow of pore
water occurs in the vertical direction only, for which Terzaghi's
theory of one-dimensional consolidation applies. Although it is
widely recognised that this is too simplifying an assumption - the
flow of water in the field being generally three-dimensional - the
mathematical solutions to problems involving three-dimensional con-
346.
solidation have not been easily available to engineers. As a con-
sequence Terzaghi's theory is almost universally used to predict
the rate of consolidation although it is generally known that such
predictions are usually slower than actually observed in the field,
particularly for structures on over-consolidated clays. In the
following paragraphs, the rate. of settlement of the structure under
consideration will be predicted by both Terzaghi's theory and some
approximate three-dimensional solutions for which numerical results
are available.
(a) One-dimensional consolidation
The process of one-dimensional consolidation, when the
distribution of total stresses remains unchanged, is governed by the
well known Terzaghi equation
2_ c " = " vi z2 t (13.7.2)
where Cv1 is the coefficient of consolidation for one-dimensional
strain and
u(z, t) is the excess pore pressure, which is a function
of the co-ordinate z and time t.
The degree of consolidation at any time t is given by
U = 1 fut dz f uo dz
(13.7.3)
347.
where ut is the excess pore pressure at time t and
uo is the initial excess pore pressure.
The solution of the above equation for a number of cases with
different boundary conditions have been given by Terzaghi and
Frbhlick (1936) (see also Janbu, Bjerrum and Kjaernsli 1964). For
the problem under consideration the distribution of the initial
excess pore pressure with depth is shown in Fig. 13.2(b). Con-
tinuing with the assumption that only the first 45 ft contributes
towards the consolidation settlement the problem is defined by
an impermeable boundary at a depth of 45 ft dnd a fully permeable
upper boundary (it is assumed that the base of the footing is fully
permeable). Although an exact solution for the initial condition
shown in Fig. 13.2(b) is not available* the problem can be simpli-
fied to the case of a triangular distribution of the initial ex-
cess pore pressure as indicated in the figure. The corresponding
relation between the degree of consolidation U and time factor
Tv (defined as Tv
= C vt/H2 where H is the maximum drainage
length) has been obtained from Janbu, Bjerrum and Kjaernsli (1964)
and the complete calculation of the time - settlement relationship
is shown in column A of Table 13.6. A value of Cv = 0.003 in2/
min (11 ft2/year) for the average stress range within the effective
depth has been taken from the oedometer test data (Chapter 10).
woorcs...seurevikamem.....m.mr
It can, of course, be obtained numerically (Gibson and Lumb 1953).
348.
The time - settlement relationship thus obtained is plotted in
Fig. 13.4 (curve A). It can be seen from both Table 13.6 and Fig.
13.4 that the rate of settlement is very slow taking more than 50
years to reach 80% of the total settlement.
(b) Three-dimensional consolidation
It has been explained earlier that the process of con-
solidation in the field is interconnected with the problem of stress
distribution and any rigorous analysis must consider the two together.
The general theory of three-dimensional consolidation for an iso-
tropic elastic medium was developed by Biot (1941), who later ex-
tended the theory to the more general case of the anisotropic
medium (Biot 1955, 1957). Rigorous analytical treatment of
practical problems, however, leads to very complex mathematics and
solutions have so far been obtained for a few special cases (Gibson
and McNamee 1957, 196o, 1963, de Josselyn de Jong 1957). Numerical
data are not yet available for ready use in practical settlement
analysis.
In what follows, approximate numerical solutions of
Gibson and Lumb (1953) and Davis and Poulos (1966) will be used to
study the influence of three-dimensional consolidation on the rate
of settlement of the structure under consideration.
The general Biot equation for three-dimensional consolida-
tion is
349.
2u -6 2u -a 2u 1 0 -611 C + + (13.7.4) v3 I) x2 -6 y2 -6 z2 3 -Ot
where Cv3 is the three-dimensional coefficient of consolidation
and G is the sum of the total normal stresses
( Cr „ cr cr ) xx yy zz
In the particular case where the total stresses remain constant
o (i.e. at = 0) the above equation reduces to its simplified form
"a 2u )2u -6 2u Cv3 x2 y2 ± z2
(13.7.5)
which is an extension of the Terzaghi one-dimensional equation
(Terzaghi (1943)).
(i) Gibson and Lumbe solution
Gibson and Lumbe (1953) obtained a numerical solution of
equation (13.7.5) by using the finite difference method. The
particular problem they considered was the rate of consolidation of
the centre of a uniformly loaded circular footing founded on a
stratum of clay whose thickness was 3.2 times the radius of the
footing and which was impermeable at its base. The initial excess
pore pressures were assumed to be equal to the increase of vertical
total stresses (i.e. pore pressure parameter A = 1.0). Although
the problem under consideration is somewhat different from the one
described above, Gibson and Lumbe suggested that their solution may
hold, at least for short times, for other thicknesses of the com-
cr Z), for Poisson's ratio
z *.
350.
pressible stratum. In order to get a rough estimate of the
difference between one and three-dimensional methods of analysis
Gibson and Lumbe's solution can, therefore, be used as a first
approximation. The time - settlement relationship thus obtained
is shown by curve 2 in Fig. 13.4. The details of calculation are
given in columns B of Table 13.6. Values of Cv = 0.005 in2/min
(11 ft2/year) and H = 45 ft - the same as for the one-dimensional
analysis - have been used. Comparing curves 1 and 2 it can be
seen that the rate of settlement for three- dimensional consolida-
tion is decidedly faster - taking 15 years to reach 80% of the
total settlement as compared to 50 years for one-dimensional con-
solidation.
(ii) Davis and Poulos solution
Davis and Poulos (1966) adopted an approximate method - 2
for t#e ntmerical solution of the three-dimensional consolidation
equation for circular and strip footings founded on layers of finite
depth. Their method which is called "the crossover procedure" is
described below.
The rate of dissipation of the average pore water pressure
is first obtained by solving equation (13.7.4) in which 1)Q/7t is
assumed to be zero and the distribution of the initial pore pressure
is given by ui = 0/3 where 0 is the bulk stress (Cr cryy xx
Suchla dissipation curve
The stress distribution is obtained from Poulos (1967), referred to in Chapter 6.
351.
for the geometry of the problem under consideration (H = 45 ft,
R = 20 ft) is shown as curve 1 in Fig. 13.5. Next, a stress dis-
tribution is obtained for Poisson's ratio ::,)= 0 and equation
(13.7.4) is solved a second time for the new values of the bulk
stress, again assumed to remain constant during consolidation.
The corresponding curve for our problem is shown as curve 2 in
Fig. 13.5. (Curves 1 and 2 are called the Z0.5 and Z0 curves
respectively). Now, for a medium having = z during load
application and ";)= 0 at the end of consolidation, it is postu-
lated that the true time - settlement relationship, alloying for
internal stress redistribution, follows a curve that starts as the
0.5 curve and gradually crosses over to the Zo curve..;..., It is
further assumed that this crossover takes place in proportion to
the degree of settlement, i.e. the corrected degree of settlement
is
uo z0.5 + u o (z0 - z0.5 )
(13.7.6)
Davis and Poulos found that the numerical solution for
the semi-infinite medium obtained by the approximate crossover
procedure shows very good agreement with the rigorous analytical
solution of Gibson and McNamee (1960).
To facilitate calculation of the degree of consolidation
for a soil having a Poisson's ratio •‘)= )' a further simplification
352.
is achieved by assuming that the Z 4 / curve is a linear inter-
polation between the curve for = 3 (the Z0.5 curve) and the
curve for ;,)=- 0 (the Z0 curve). The corrected degree of
settlement is, then, given by
U 0.5' - (13.7.7) 1 (1 2'')(Z0 - Z0.5)
For our problem, the corrected U vs Tv relationship is obtained
by substituting ' = 0.21 in equation (13.7.7) (see curve 3 of
Fig. 13.5).
The field time settlement relationship for the problem
under consideration has been calculated by the approximate Davis
and Poulos method (see columns C of Table 13.6) and plotted as
curve 3 in Fig. 16.4. It can be seen that the rate of settlement
so obtained is even faster than the Gibson and Lumb solution, 80%
of the total settlement, in this case, occurs after only' 11 years.
It is too early to judge the reliability of Davis and
Poulos' method of estimating the rate of settlement under.bhree-
dimensional conditions. The author is not aware of the method
being applied to any full scale structure at the present time. It
appears from a comparison of the three time ,= settlement curves in
Fig. 14.4 that the method is at least a good approximation.
The above analysis leaves no doubt whatever that, where
flow of water is three-dimensional, the assumption of one-dimensional
353•
consolidation grossly under-estimates the rate of settlement. Much
of the discrepancy between calculated and observed rates of settle-
ment of structures can, therefore, be attributed to this inaccuracy.
Referring to the case records mentioned in Chapter 3, it can be seen
that, for structures on over-consolidated clays, settlement virtually
ceases after only 4 - 5 years of construction. This does not
appear unreasonable. If settlement at the end of construction is
as high as 50% of the total, three-dimensional consolidation will
cause most of the settlement to occur within a few years after cones
struction. Furthermore, horizontal permeability in the field, if
greater than the vertical, will hasten the process of consolidation,
leading to an even faster rate of settlement. This factor, which
has not been considered in the present work, is still to be in-
vestigated. Non-homogeniety of the soil with respect to com-
pressibility and permeability also affects the rate of settlement in
the field (Schiffman and Gibson 1964). Finally, geological details
such as small layers of silt or sand which may not be easily detected
from ordinary borings may radically idfluence the rate of settlement
of full scale structures (Rowe (1968)).
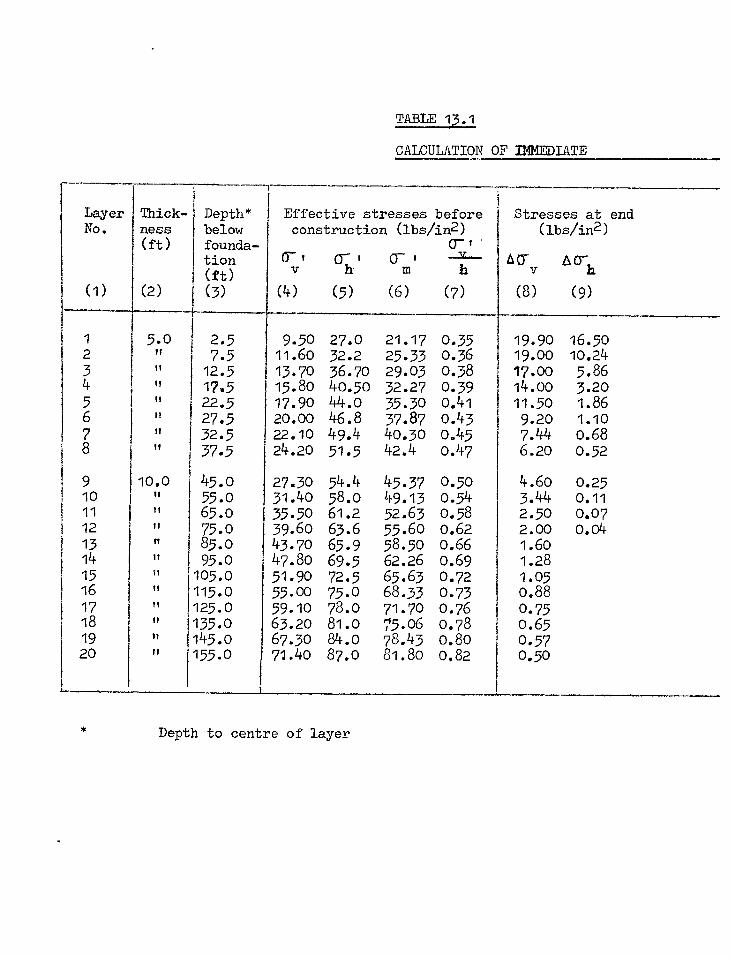
TABLE 13.1
CALCULATION OF IMMEDIATE
Layer No.
(1)
Thick- ness (ft)
(2)
Depth* below founda- tion(3-1 (ft) (3)
Effective stresses construction (lbs/in2)
07-h ' 0 ' v , m
(4) (5) (6)
before
0-1
Stresses at end (lbs/in2)
60-v ACII.
(8) (9)
-I"- h
(7)
1 2 3 4 5 6 7 8
9 10 11 12 13 14 15 16 17 18 19 20
5.o 11
II II
I, il " II
10.0 n ?I
tt ti it " " " " " "
2.5 7.5 12.5 17.5
22.5 27.5 32.5 37.5
45.o 55.0 65.o 75.0 85.0 95.0 105.0 115.0 125.0 135.0 145.0 155.0
9.5o 11.60 13.70 15.80
17.90 20.00 22.10 24.20
27.30 31.40 35.50 39.60 43.70 47.80 51.90 55.0o 59.10 63.2o 67.30 71.40
27.o 32.2 36.70 40.50 44.o 46.8 49.4 51.5
54.4 58.0 61.2 63.6 65.9 69.5 72.5 75.0 78.0 81.0 84.o 87.0
21.17 25.33 29.03 32.27 35.3o 37.87 40.30 42.4
45.37 49.13 52.63 55.60 58.50 62.26 65.63 68.33 71.70 75.06 78.43 81.80
0.35 0.36 0.38 0.39 0.41 0.43 0.45 0.47
0.50 0.54 0.58 0.62 0.66 0.69 0.72 0.73 0.76 0.78 0.80 0.82
19.90 19.00 17.00 14.00 11.50 9.2o 7.44 6.2o
4.6o 3.44 2.5o 2.00 1.60 1.28 1.05 0.88 0.75 0.65 0.57 0.50
16.50 10.24 5.86 3.20 1.86 1.10 0.68 0.52
0.25 0.11 0.07 0.04
Depth to centre of layer
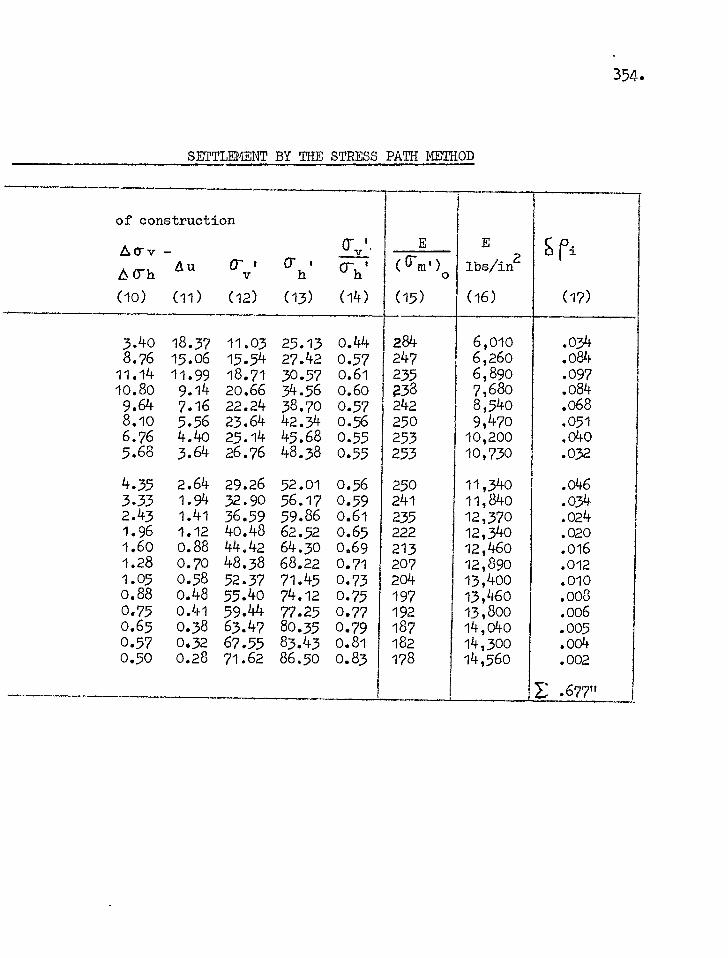
SETTLEMENT BY THE STRESS PATH METHOD
of construction
&Tv - A u 0- , OM
(ii) (12)
Cr h i
(13)
lbs/in
(1o)
0'v' E E 2
(16)
Si Pi
(17)
( irm' )o
(15)
Grh'
(14)
3.4o 18.37 11.03 25.13 0.44 284 6,010 .034 8.76 15.06 15.54 27.42 0.57 247 6,260 .084 11.14 11.99 18.71 30.57 0.61 235 6,890 .097 10.80 9.14 20.66 34.56 0.60 238 7,680 .084 9.64 7.16 22.24 38.70 0.57 242 8,540 .068 8.10 5.56 23.64 42.34 0.56 25o 9,470 .051 6.76 4.4o 25.14 45.68 0.55 253 10,200 .040 5.68 3.64 26.76 48.38 0.55 253 10,730 .032
4.35 2.64 29.26 52.01 0.56 25o 11,340 .046 3.33 1.94 32.90 56.17 0.59 241 11,84o .034 2.43 1.41 36.59 59.86 0.61 235 12,370 .024 1.96 1.12 40.48 62.52 0.65 222 12,340 .020 1.60 0.88 44.42 64.30 0.69 213 12,460 .016 1.28 0.70 48.38 68.22 0.71 207 12,890 .012 1.05 0.58 52.37 71.45 0.73 204 13,400 .010 0.88 0.48 55.4o 74.12 0.75 197 13,460 .008 0.75 0.41 59.44 77.25 0.77 192 13,800 .006 0.65 0.38 63.47 80.35 0.79 187 14,040 .005 0.57 0.32 67.55 83.43 0.81 182 14,300 .004 0.50 0.28 71.62 86.50 0.83 178 14,560 .002
E. .677"
354.
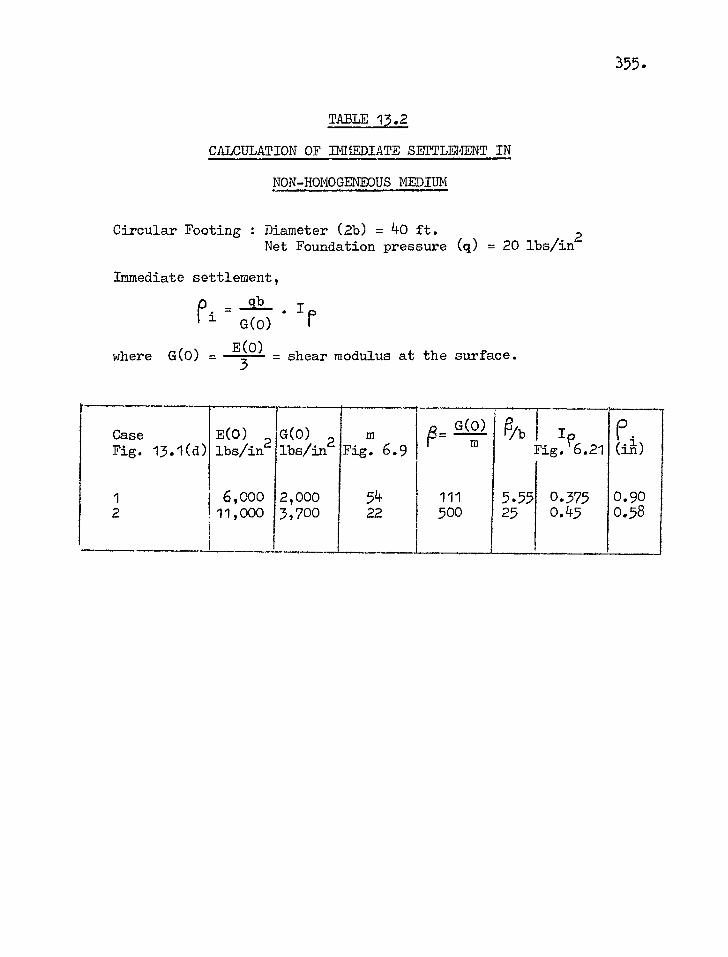
355.
TABLE 13.2
CALCULATION OF ETIMIATE SETTLEMENT IN
NON-HOMOGENEOUS MEDIUM
Circular Footing : Diameter (2b) = 40 ft. Net Foundation pressure (q) = 20 lbs/in2
Immediate settlement,
. —213— I I I G(0) f
where G(0) = E(0) = shear modulus at the surface.
r
Case Fig. 13.1(d)
1 2
E(0) 2 lbs/in
6,000 11,000
G(0) 2 lbs/in
2,000 3,700
m Fig. 6.9
54 22
G(0) p /b
5.55 25
1 I? Fig. 6.21
0.375 0.45
P. . (in)
0.90 0.58
(3- m
111 500
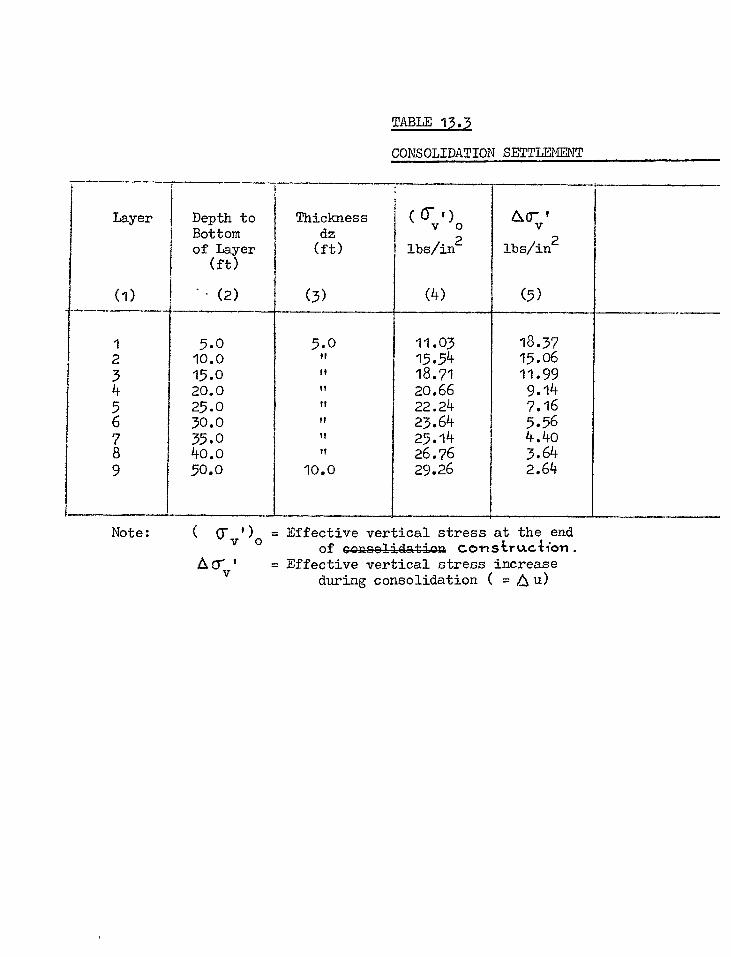
TABLE 13.3
CONSOLIDATION SETTLEMENT
Layer
(i)
Depth to Bottom of Layer (ft)
(2)
Thickness dz
(ft)
(3)
( 0- ' )o
lbs/in2
(4)
v &O- '
lbs/in2
(5)
r" C1.1 \
tr \v) C. - 00 ON
5.o 5.o 11.03 18.37 10.0 II 15.54 15.06 15.0 n 18.71 11.99 20.0 I? 20.66 9.14 25.0 1, 22.24 7.16 30.0 n 23.64 5.56 35.0 n 25.14 4.4o 40.0 IT 26.76 3.64 50.0 10.0 29.26 2.64
Note: ( 6lr')0 = Effective vertical stress at the end of consolidation colisiruclioln.
= Effective vertical stress increase during consolidation ( = 6u)
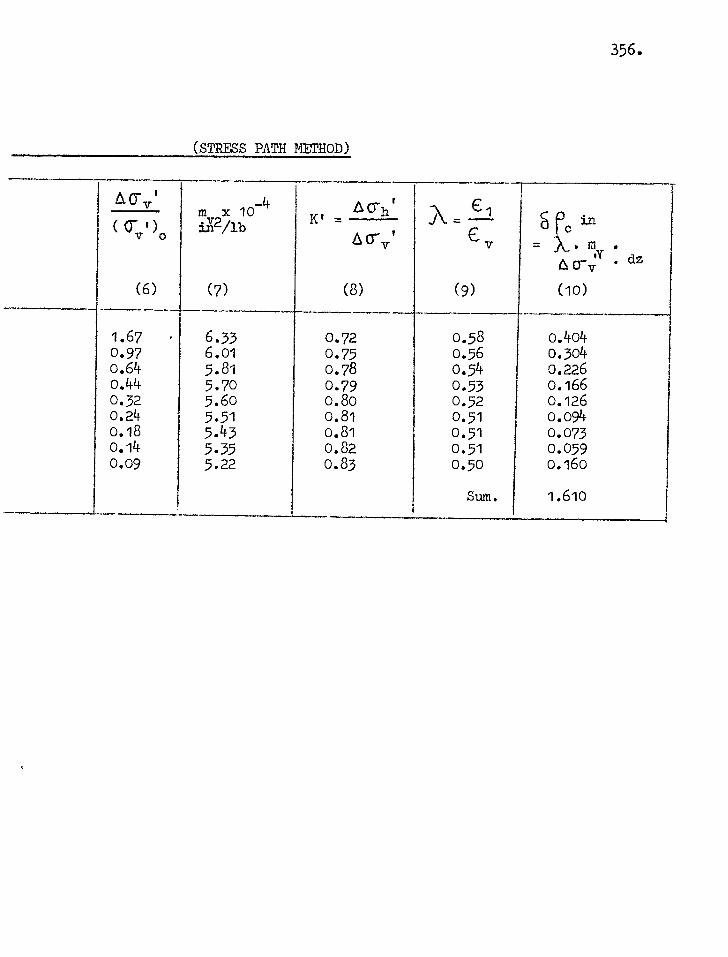
(STRESS PATH METHOD)
AC V I M X 10-4 g2/110,
ACht
K' - -\. C1 J . ---
V S r in
c = x, . M .
6 cr :I. . dz
( 0- ') V 0 6 cry '
(6) (7) (8) (9) (10)
1.67 • 6.33 0.72 0.58 0.404 0.97 6.01 0.75 0.56 0.304 0.64 5.81 0.78 0.54 0.226 0.44 5.70 0.79 0.53 0.166 0.32 5.6o 0.80 0.52 0.126 0.24 5.51 0.81 0.51 0.094 0.18 5.43 0.81 0.51 0.073 0.14 5.35 0.82 0.51 0.059 0.09 5.22 0.83 0.50 0.160
sum. 1.610
356.
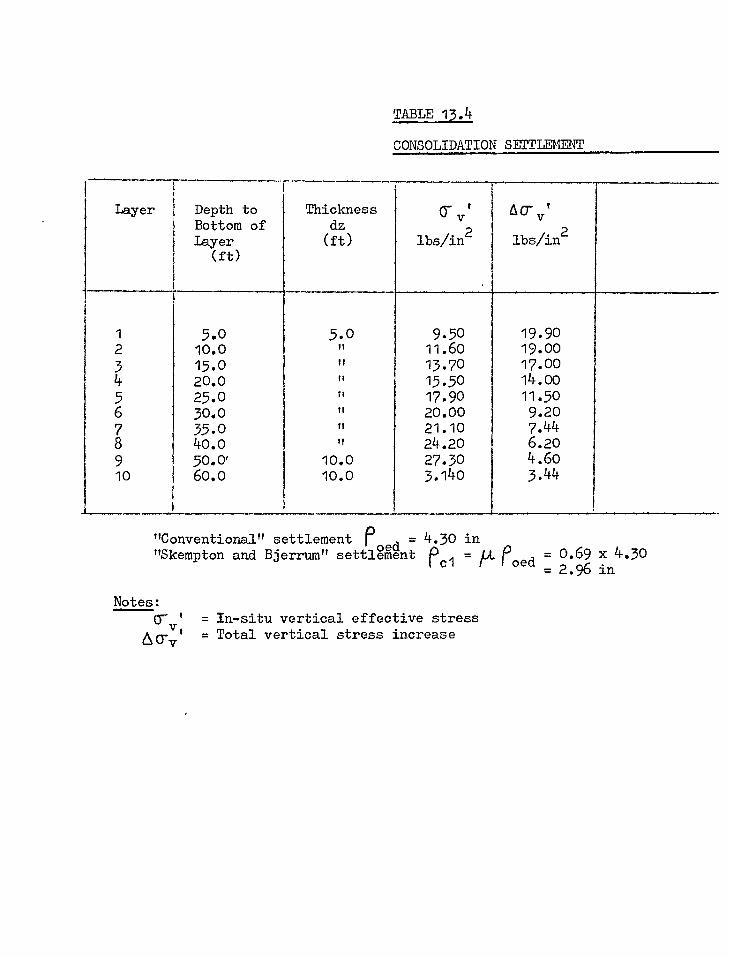
TABLE 13.4
CONSOLIDATION SETTLEMENT
Layer Depth to Bottom of Layer (ft)
Thickness dz
(ft)
6- v t
lbs/in2 Acr v i
lbs/in2
1 5.0 5.0 9.50 19.90 2 10.0 II 11.60 19.00 3 15.0 It 13.70 17.00 4 20.0 It 15.50 14.00 5 25.0 I/ 17.90 11.50 6 30.0 II 20.00 9.20 7 35.0 It 21.10 7.44 8 4o.o it 24.2o 6.20 9 50.0' 10.0 27.30 4.6o 10 60.0 10.0 3.14o 3.44
"Conventional" settlement f)o = 4.30 in "Skempton and Bjerrum" settlement p
01 = r- oed a = 0.69 x 4.30
= 2.96 in
Notes: = In-situ vertical effective stress = Total vertical stress increase Cry'
(SKENPTON AND WERRUM METHOD)
4o-- vpoed ( m x 10 4
iv2 n /lb in )
7... mv . Acrv ' . dz ( 0- ' )o
2.09 6.45 0.770 1.64 6.28 0.716 1.24 6.13 0.625 0.90 6.00 0.504 0.64 5.86 0.404 0.46 5.73 0.316 0.35 5.6o 0.250 0.26 5.48 0.204 0.17 5.32 0.294 0.11 5.12 0.212
Sum 4.30 in
357.
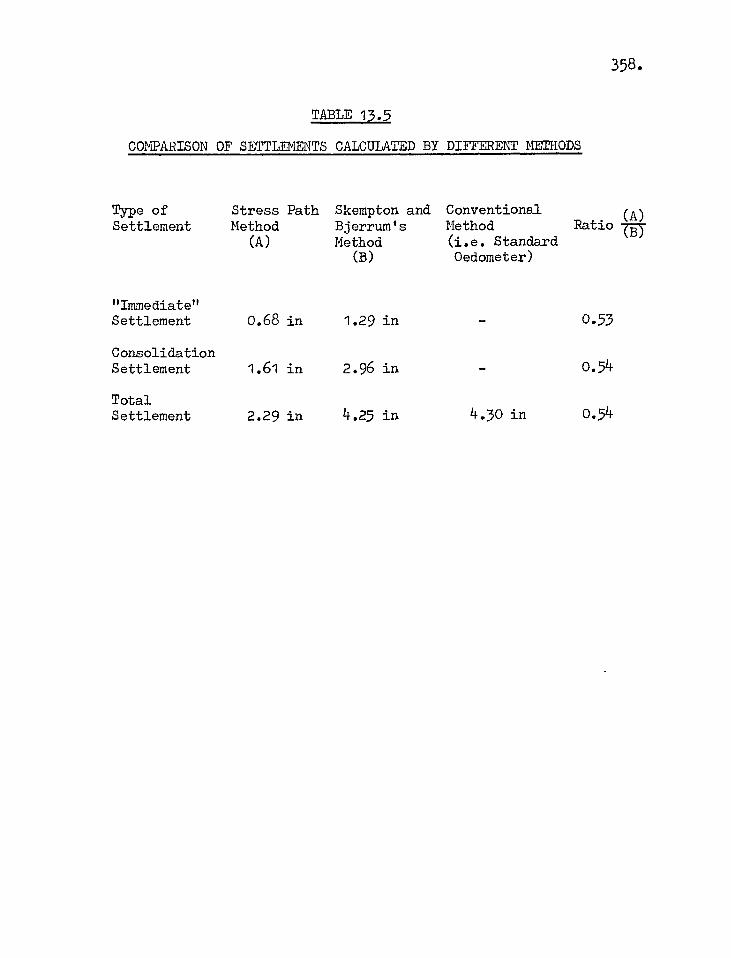
358.
TABLE 13.5
COMPARISON OF SETTLEMENTS CALCULATED BY DI1FbRENT METHODS
Type of Stress Path Skempton and Conventional Settlement Method
(A) Bjerrum's Method
Method (i.e. Standard
Ratio TET
(B) Oedometer)
"Immediate" Settlement 0.68 in 1.29 in 0.53
Consolidation Settlement 1.61 in 2.96 in 0.54
Total Settlement 2.29 in 4.25 in 4.30 in 0.54
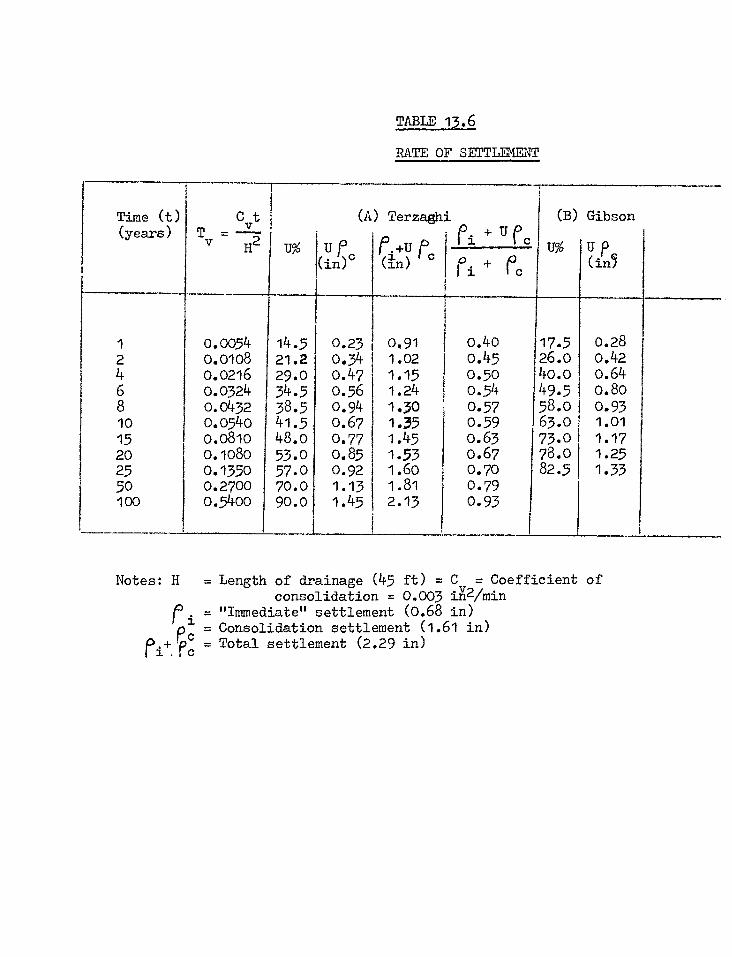
TABLE 13.6
RATE OF SETTLEMENT
Time (t) (years)
C t T =-2--r
U%
(A)
Ur (in)c
Terzaghi
r.+Ii. 10 (in) °
P +UP t i l c
(B)
u%
Gibson
U p (in,
v H2 Ci + (%
1 0.0054 14.5 0.23 0,91 0.40 17.5 0.28 2 0.0108 21.2 0.34 1.02 0.45 26.0 0.42 4 0.0216 29.o 0.47 1.15 0.50 40.0 0.64 6 0.0324 34.5 0.56 1.24 0.54 49.5 0.80 8 0.0432 38.5 0.94 1.30 0.57 58.0 0.93 10 0.0540 41.5 0.67 1.35 0.59 63.o 1.01 15 0.0810 48.o 0.77 1.45 0.63 73.0 1.17 20 0.1080 53.0 0.85 1.53 0.67 78.0 1.25 25 0.1350 57.0 0.92 1.60 0.70 82.5 1.33 50 0.2700 70.0 1.13 1.81 0.79 100 0.5400 90.0 1.45 2.13 0.93
Notes: H = Length of drainage (45 ft) = C = Coefficient of consolidation = 0.003 iX2/min
1i = "Immediate" settlement (0.68 in) Consolidation settlement (1.61 in) pi+.1)pec = Total settlement (2.29 in)
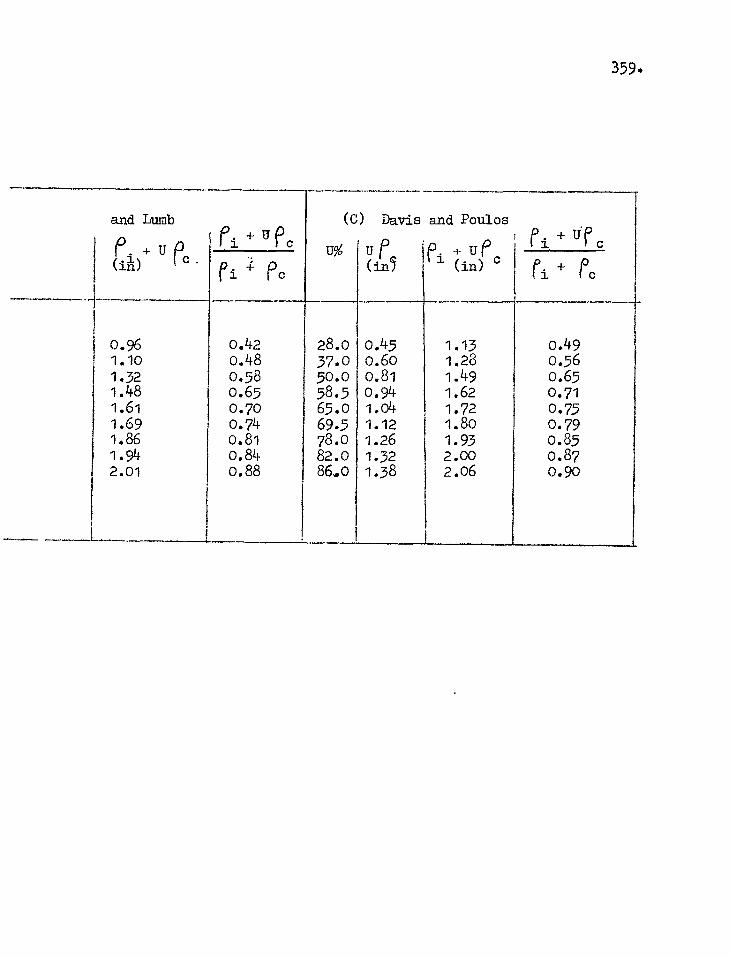
359.
and Lumb
+ U IC. 01)
ri +II PC
ri pc
(0) Davis and Poulos
P + UP 1 (in) c
P.
ri
0.42
28.o 0.45 0.48
37.0 0.60 0.58
50.0 0.81 0.65
58.5 0.94 0.70
65.0 1.04 0.74
69.5 1.12 0.81
78.0 1.26 0.84
82.0 1.32 0.88
86.0 1.38
0.96 1.10 1.32 1.48 1.61 1.69 1.86 1.94 2.01
1.13 1.28 1.49 1.62 1.72 1.8o 1.93 2.00 2.06
0.49 0.56 0.65 0.71 0.75 0.79 0.85 0.87 0.90
360.
CHAPTER 14
CONCLUSIONS AND SUGGESTIONS FOR FURTHER RESEARCH
14.1 Conclusions
The settlement of structures on over-consolidated clays
has been studied in the light of the influence of stress path on
the deformation characteristics of such clays, with particular
emphasis on London clay. It has been shown that the stress path
of an element of soil beneath a foundation in the field differs in
many important respects from those implied in the existing methods
of settlement analysis and predictions of settlement are, therefore,
not always accurate. Deformation of soil being essentially path
dependent, it is necessary, for successful application of laboratory
data to field problems, that a soil be tested under the same set
of stresses that it is likely to undergo in the field and a method
of analysis has been proposed that takes this into consideration.
The stresses and displacements in non-homogeneous elastic
media, whose modulus of elasticity varies linearly with depth, have
been calculated from Gibson's analytical solution (Gibson 1967).
The results show that the distribution of stresses in such a medium
(incompressible) differs only slightly from the Boussinesq stress
distribution for identical boundary load. It is, therefore,
possible to calculate the "immediate" (elastic) settlement for a
non-homogeneous medium by numerkblintegration of the strains
361.
beneath a foundation, assuming Boussinesq stress distribution but
taking proper account of the variation of the Young's modulus with
depth.
In a foundation problem, the modulus of elasticity of the
soil generally varies with depth as a consequence of increasing
effective stresses before construction as well as due to the
different stress levels that are imposed by the applied foundation
pressure. To obtain the true variation of E with depth, there-
fore, it is essential that an undistrubed sample be first brought
back to the stresses prevailing in the ground before sampling and
then subjected to stress increments that it is likely to undergo
in the field. It is found that the Young's modulus of London clay
so obtained differs considerably from that determined from standard
undrained tests. The same is true of the pore pressure parameter
A, although to a lesser extent.
In calculating the consolidation settlement, the influence
of lateral stresses cannot be ignored. The experimental data show
that although the volumetric compressibility of undisturbed London
clay is primarily a function of the vertical effective stress and
is largely independent of lateral stresses - at least within the
range of stresses considered - the vertical strain is greatly in-
fluenced by the relative magnitude of the vertical and lateral
stress increments during consolidation. Direct use of the oedo-
meter test results will give accurate prediction of the consolida-
362.
tion settlement only when the stress increment ratio K' ( = 110-h t/
vl ) during consolidation is equal to the Ro value of the
material (i.e. when the strain is one-dimensional). The ratio K'
would, of course, be equal to 1 but for the redistribution of
stresses in the foundation due to the decrease of Poisson's ratio
of the soil from 2 during load application to the drained value
after full consolidation. An approximate method of calculating
K' for points beneath the centre of a circular foundation has been
suggested, -but it is necessary to determine experimentally the re-
lationship between K' and the vertical strain for the problem
concerned.
The volumetric compressibility of London clay can be
determined from both triaxial and oddometer tests, the latter giving
satisfactory results only when the initial swelling is positively
prevented. For this it is necessary to eliminate all bedding
errors as well as any deformation of the apparatus which may be
important when the clay tested in the oedometer undergoes only
small deformations. It is, then, possible to use the oedometer
compressibility (my) data coupled with the relationship between
K' and k ( = Vey) to predict the consolidation settlement
of a structure. It is also important to note that the pressure
increment ratio (Ap/p) beneath a formation decreases rapidly with
depth and it may be necessary to exceed a threshold value before
apprecaible volume change can occur. This can only be detected,
363.
however, from °odometer tests where specimens are allowed long rest
periods and then subjected to small load increments. Based on
tests with 90 days' rest followed by small load increments, a
threshold value of 10% of the in-situ overburden pressure has been •
suggested for London clay. This consequently reduced the effective
depth beneath a foundation which contributes towards the consolida-
tion settlement of a structure. A method of settlement analysis
taking all these factors into consideration has been proposed.
The example of a circular foundation shows that the settlement
calculated by the stress path method is considerably smaller than
that given by either the conventional method or the Skempton and
Bjerrum method of analysis.
The incremental Ro value of undisturbed London clay is
found to depend on stress level. For the Ongar clay it is as
small as 0.29 at the low pressure range (<100 lbs/in2), but in..
creases with increasing pressure until it becomes equal to the
Ko value (0.64) for remoulded London clay. The relationship between K' and X during anisotropic consolidation can be
analysed in terms of anisotropic elasticity. A method of determ-
ining the necessary parameters (E1"
3' ,)1" ,)2" .)3') from
triaxial tests is demonstrated.
The pre-consolidation pressures of London clay at Ongar
and Wraysbury have been determined from tests on specimens loaded
2 to pressures of up to 7,000 lbs/in in the controlled rate of strain
364.
oedometer. It has been assumed that, on the e vs log p plot,
the geologic rebound is parallel to the laboratory rebound, pro-
vided the latter is begun from pressures greater than the pre-
consolidation pressure. Limited field evidence available suggests
that this assumption is at least approximately valid for the cases
considered. It is found that the pre-consolidation pressure at
Wraysbury, to the west of the London Basin, was considerably greater
than that at Ongar, to the east, thus supporting the estimates of
Skempton (1961) for Bradwell and Bishop et al (1965) for Ashford
Common.
The consolidation tests in the triaxial apparatus as well
as in the hydraulic oedometer, allowing vertical drainage only,
show that Terzaghi's theory of one-dimensional consolidation pre-
dicts the rate of volume change and the rate of settlement of un-
disturbed London clay extremely well although the prediction of the
rate of dissipation of the maximum pore pressure is less accurate.
In the field, however, most settlements take place under three-
dimensional conditions. In such cases the one-dimensional theory
grossly under-estimates the rate of settlement. Only a few approx-
imate numerical solutions to the three-dimensional problem are at
present available, the application of which are shown to improve
considerably the prediction of the rate of settlement of structures
in the field.
365.
14.2 Suggestions for further research
It emerges from the work presented in this thesis that
further research may fruitfully be carried out on the following
subjects.
(a) More work is required to study the influence of stress
paths on the stress - strain modulus of undisturbed clays. Samples
should be brought back to the stresses prevailing in the ground and
then subjected to further load increments. , It is desirable that
samples be obtained from different depths to see if the data for one
depth can be applied to an entire foundation problem.
(b) The influence of lateral stress on the deformation of clay
during drained compression needs to be studied more thoroughly,
again with samples from different depths. Two distinct points
should be considered - the influence of the lateral stress on
(i) volume change and (ii) the ratio of the axial strain to volu-
metric strain.
(c) Reliable estimates are required of the in-situ vertical
and horizontal stresses in soil media. As direct measurements
seem difficult, if not impossible, model studies to simulate de-
position and subsequent erosion may be considered.
(d) The question of threshold value and the influence of small
load increments following long rest periods should be studied, using
for example, an hydraulic oedometer of the type described in the
thesis.
366.
(e) Theoretical and experimental work on three-dimensional
consolidation with numerical results therefrom are urgently required
to predict more accurately the rate of settlement in the field.
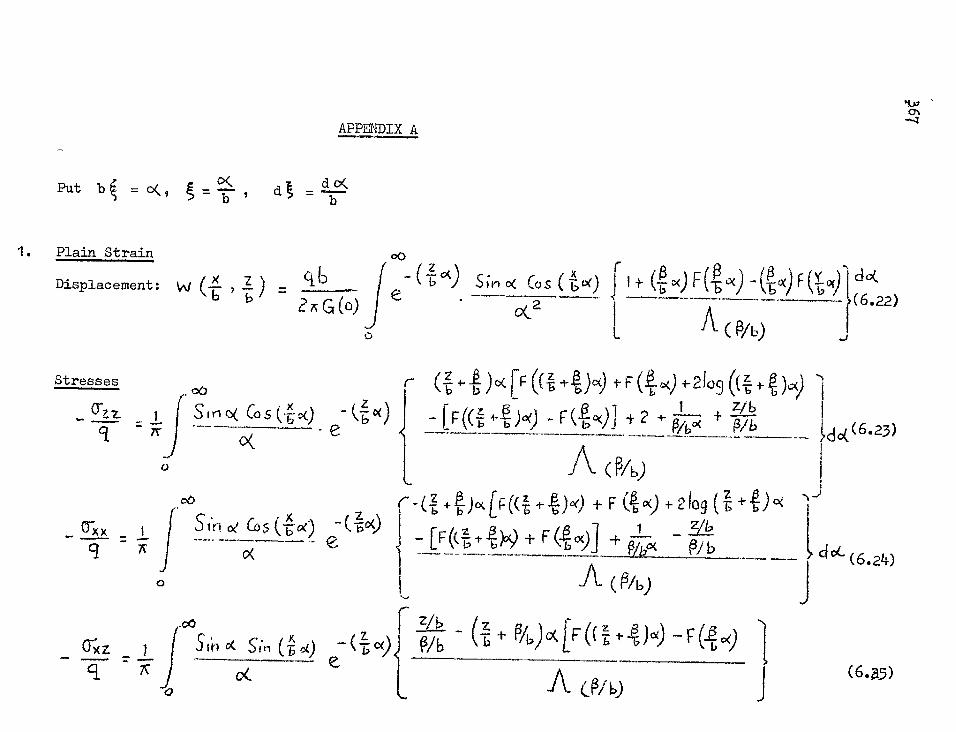
a
Sin oe CO5 (t «) e
(4) s;r) o< cos ( + D<) FN ,x) -(11a) FC/60(1 c a (6.22)
.4 oc
( p/b)
co SInc<Cos(%,00
(f...., 4.4 )0(IF (q -4)cx) +.44 +21o9 ((-,, -4 )0() '
6,4 (6.23) - [Fo +Alpo - r(-,2,,,x)] +2 4- 0/7i„ + it e
A (p/6)
( (.+.) 1..4)o ) + F (0)
(p/b)
-1-21090 44,)°‘ 1 _ z/b
b (6.24) 0
.00
ot. ,c) e—
A 03/0 94.
(rxqz (6.a5)
Stresses
0
APPENDIX A
Put b = c‹, = , d = V-
1. Plain Strain
= cif)
2nG(0)
Displacement:
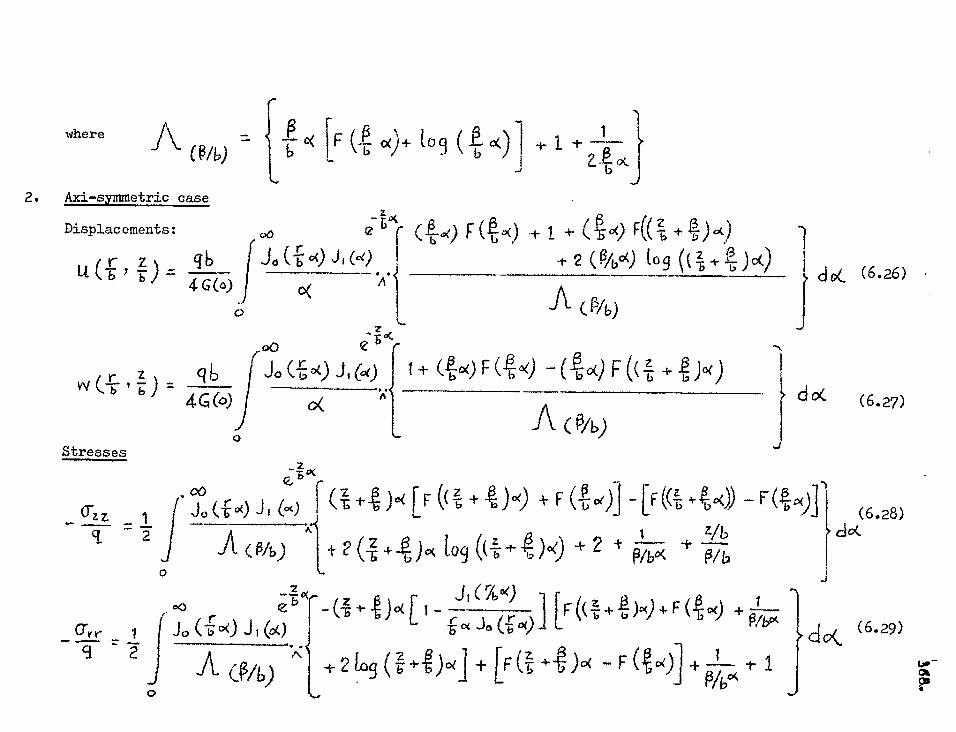
do( (6.26)
do< (6.27)
where to ( Pc 091
2. Axi—symmetric case
Displacements:
u. (f; y (lb 4G(0)
z q6
Stresses
crzz -7f- T 2.
00 el°( FIto() + FP6 41-)49 Jo (rod J , (a) I 2 (PAM to ((l )0(
A1 A 04)
oo
(f,- 0) Ji 60 f 1+ (4°) F (CA F (4). + )°( oC
00 Jo (f o) J (-0
(:t [F((b+ 4).4) + F ( 0e).1 -[Fq 4.0) - F(to)]
2 +4)0( 1o9 ((**- 4)°0 + 2
(6.28) do(
A (134)
_cry, b• • 2
t)c( [ 1 tia:(jribo (1)0,0 I [F*Lt + 4 12) + F 4, c‹) + filiri; 1 (6.29) Jo (f00 Ji 60 (lac A (i3/0 -''' ..,- 2 to9 ( 72,- +Ceti + LF a +4 ) 0( - F q0()) + -171.--; t I ao-
op i ...,
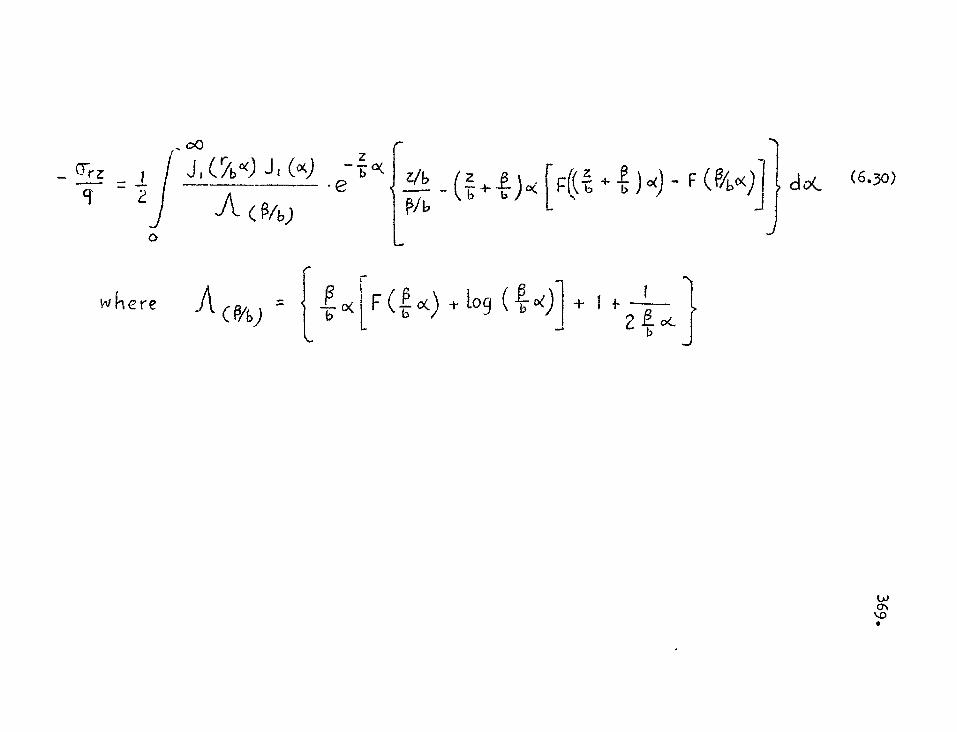
0
d of (6.30)
.o0 z J 1 ( r/b k) -1 i (X) e- -6
A ( 3/4) 416_ _ (-f;+.1 )0< [F -f, +t)0‘)— F (%o< /6.
r where F ( Po oo + Lo 9 (-ic- 0)-1 + 1 + 2--i ca,
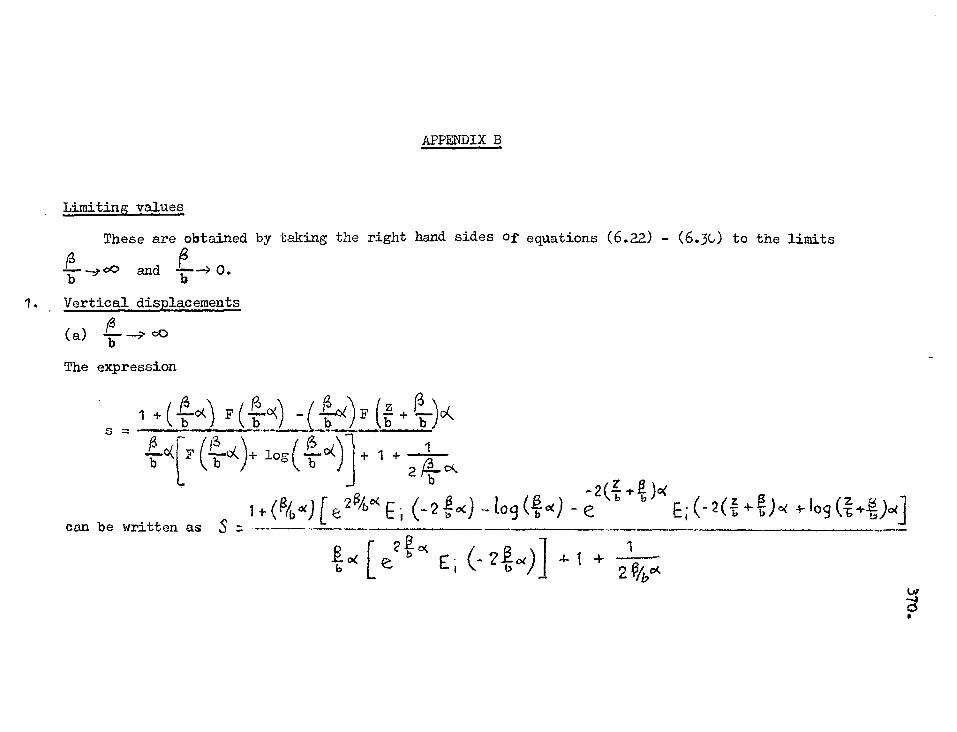
APPENDIX B
Limiting values
These are obtained by taking the right hard sides
P and 7--> O.
1. Vertical displacements
(a)
The expression
oc)
of equations (6.22) - (6.30 to the limits
1 4. (43;"°() F (4: °) r1.7)°(
can be written as S
b kIF (1b 6-4 log( 140'() + + 1
1 f(t34,04) e2-64)°c (-21cx) —tog (0() -e2(g
2 4-0c
2.0 04 2 404.)] 4.1 +1 21340(..
s =
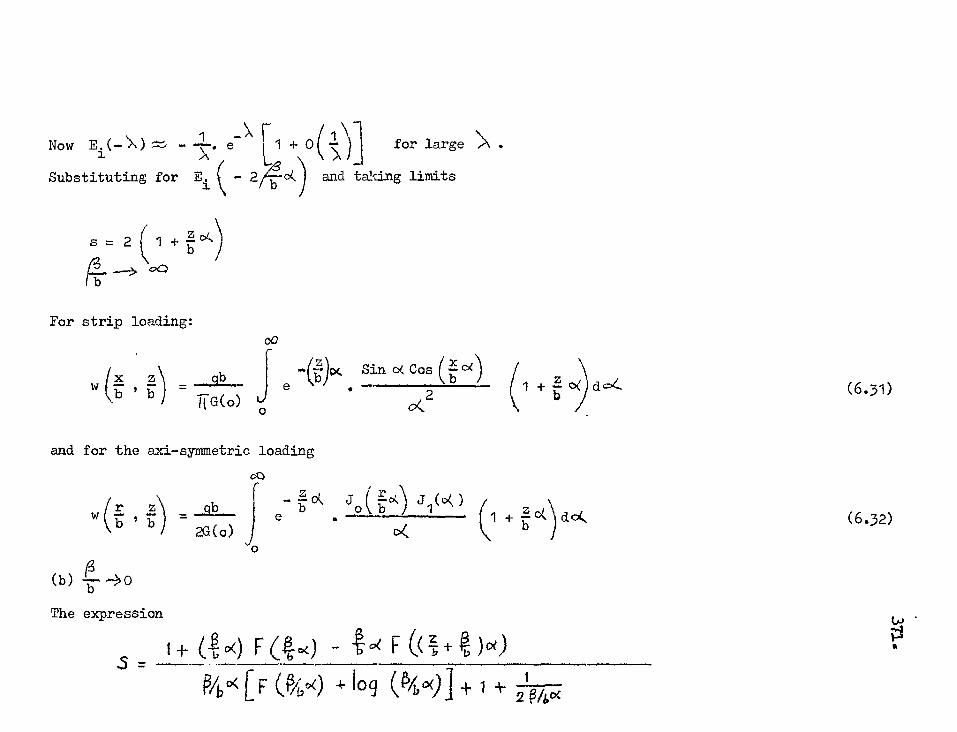
- e + 0
2/44)
\ - ),k —
,) and taking
for large
limits
Now E.( —`X) -
Substituting for
x z W b
1.3)4Y., Sin 0( Cos (0) e
oe...2
Z
and for the axi-symmetric loading
s a (1 ±
For strip loading: o0
(6.31)
e- 1) °c 1̀0(f'`) J1(°‹ ) + °() doIL (6.32)
(b) ---->o The expression
+ (tx) F - F ((t- t )00 5 -
w
= qb
b b 2G(0)
040( F (kot) + log (P4,0)j + 1 +
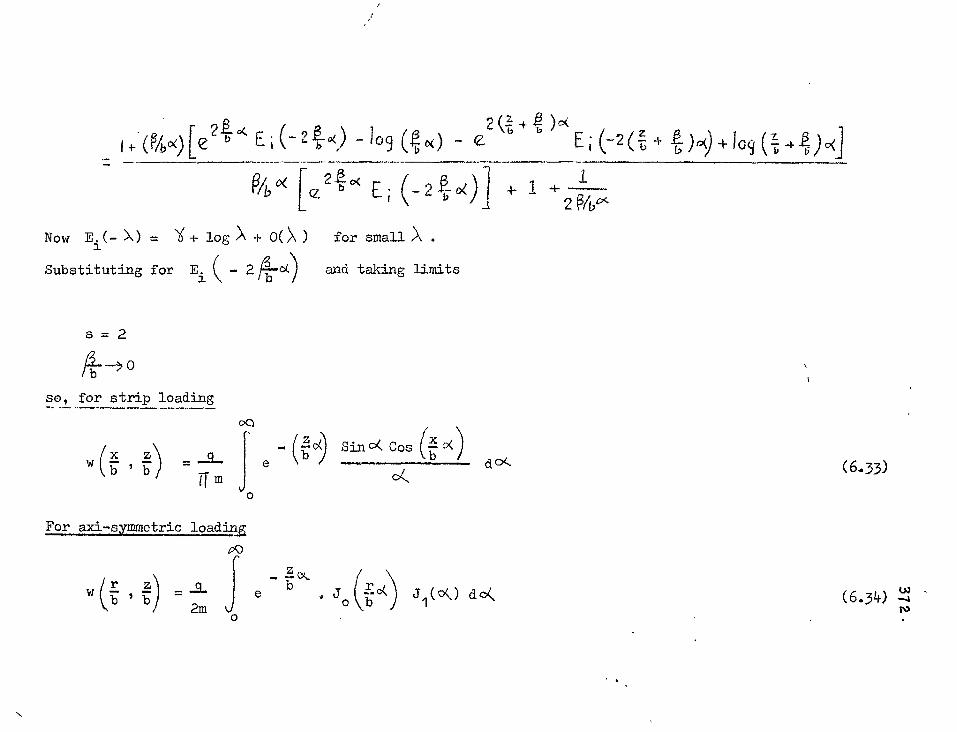
÷ (P/b,g)[e24°' E (- 2 ia9 (.0.f., ex) ) I (-2 (16 ) la' VC; 4 )
-I- 2 Wv>c
Now E ( X) = + log )\ + 0( ) for small )‘ .
Substituting for Ei - 2 40-0C) and taking limits
s = 2
so, for strip loading
/b [c E ; (-2 Pi,- 04)1 +-1
00
b 09 Sin o< Cos (l X) e \
c4,
x z w (b b = —2—
m
dc< ( 6. 33 )
0
For axi-symmetric loading
r z = b b 2m ° Jo f c4) j1(Q) d°( (6.34) N
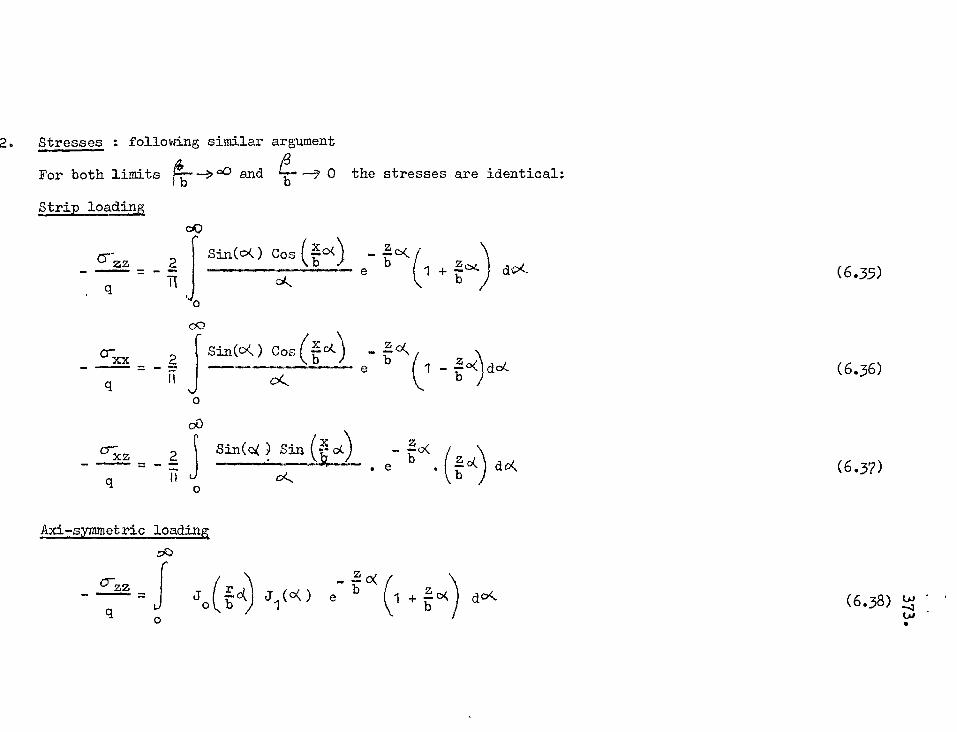
Sin(DC) Cos ( 04-) z oc
b (I- 3- 0C 2
q It
2. Stresses : following similar argument
For both limits 14-t--°0 and 0 the stresses are identical:
Strip loading
co C
Sin(O() Cos (-x-:°()
Crzz 2 =
, q
e - Toc)((1
dot-
b /
o0
x- z 2 q fl u
0
Sin( a() Sin (25.0()
oc
_ • e
Axi-symmetric loading
cx J o b () J1 (0K) e b Eck
o_zz
q
z do<
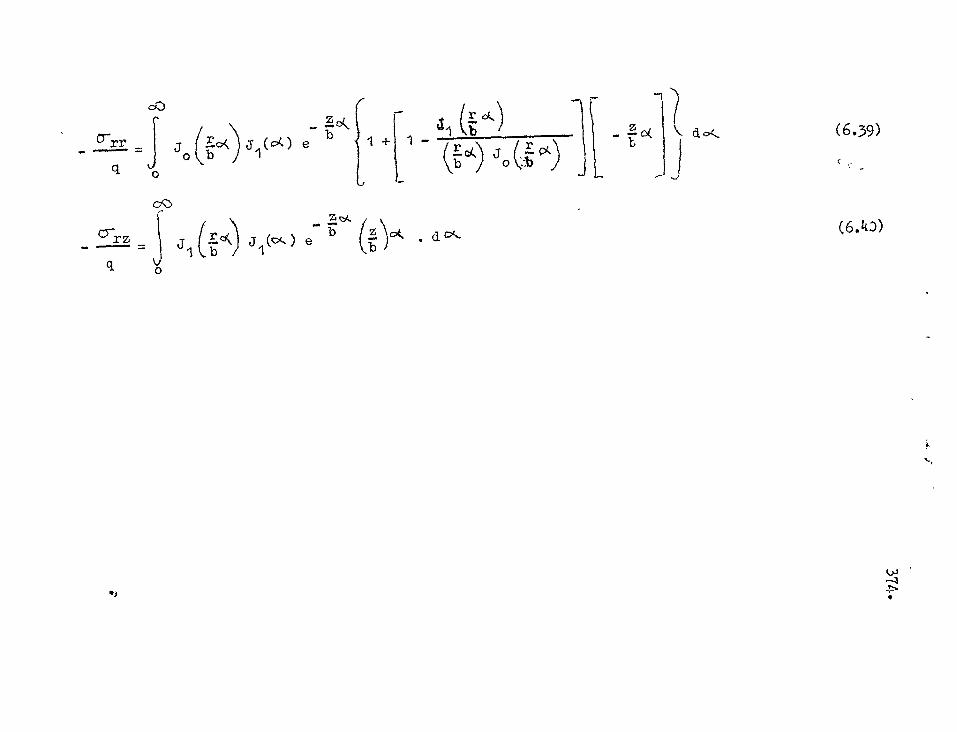
q
cr rr = j I0.1.),S (01, ) e ° b
s.ac) j 1 (c) e 1( b
Z oc b 1 + 1
.. z zA. b (z ')c,i., . o.
f 0,, (b (4) j 0 \ A
d c)c-
q
cr. rz
1
(6.39)
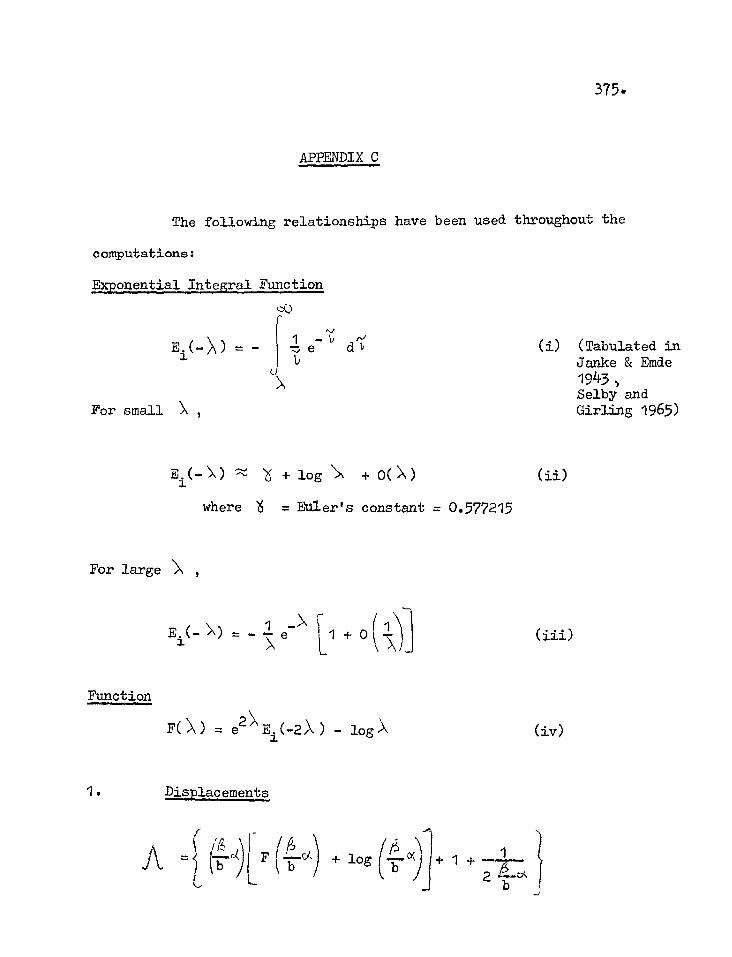
375.
APPENDIX C
The following relationships have been used throughout the
computations:
Exponential Integral Function
?() ti
(i) (Tabulated in Janke & Emde 1943 . Selby and Girling 1965) For small \
x + log +
where '6 = Euler's constant = 0.577215
For large ,
1 ->\
E.(- = - e 1 0 L
Function
FO‘) = e2 ‘ E. (-2.\ ) - logy
(iv)
1. Displacements
1 + 2 --b c)c
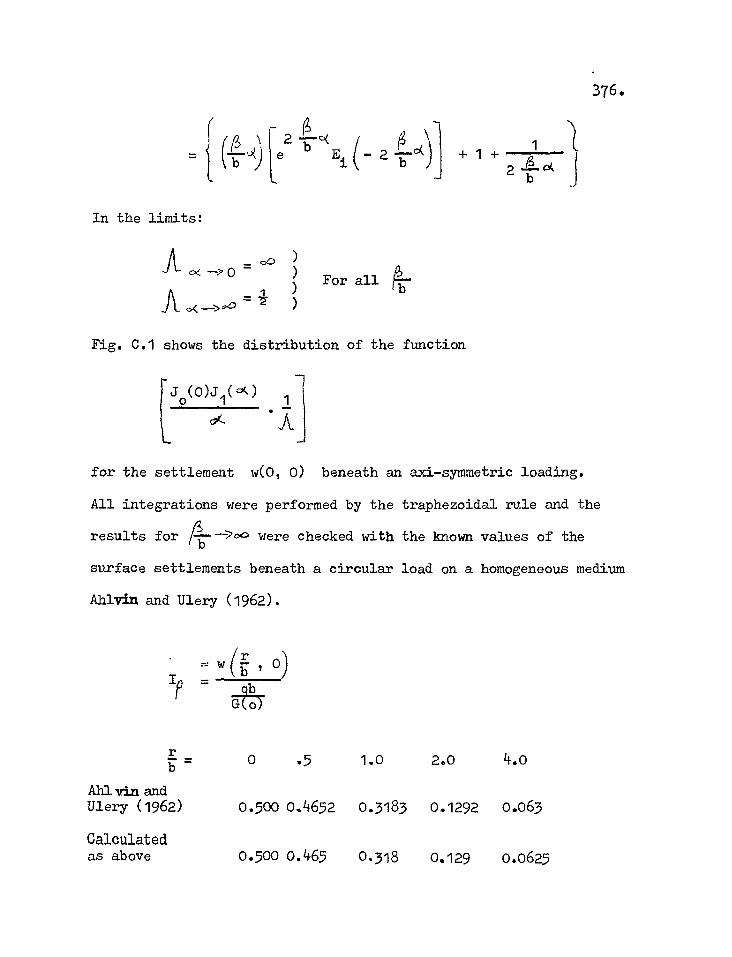
+ 1 + 1
2 ct (24
376.
In the limits:
A= 0° ) )
For all r--- A
Fig. C.1 shows the distribution of the function
Jo(0)J1(-'7%,) 1 . —
for the settlement w(0, 0) beneath an axi-symmetric loading.
All integrations were performed by the traphezoidal rule and the
results for were checked with the known values of the
surface settlements beneath a circular load on a homogeneous medium
AID:yin and Ulery (1962).
IP
r _ b
Ala vin and Ulery (1962)
Calculated as above
= w(131. , 01
.5
0.4652
0.465
1.0
0.3183
0.318
2.0
0.1292
0.129
4.0
0.063
0.0625
G(o)
0
0.500
0.500
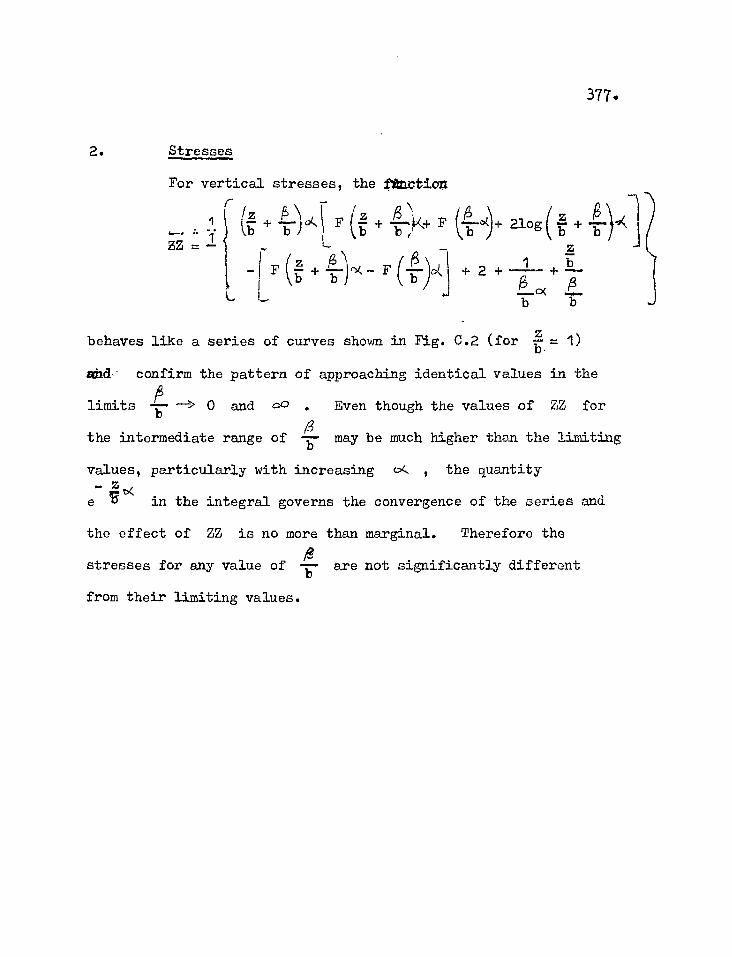
2. Stresses
For vertical stresses, the fiction
377.
(lz ) F 13 + 17 04, F (z + )-I- 2log +
- I F + -1T),X F (4.3),4- L
' -1* ZZ = — 1 b + 2 + + ab b
behaves like a series of curves shown in Fig. C.2 (for = 1)
aidcl- confirm the pattern of approaching identical values in the
limits —> 0 and 00 . Even though the values of ZZ for
the intermediate range of may be much higher than the limiting
values, particularly with increasing 04. , the quantity Z
in the integral governs the convergence of the series and
the effect of ZZ is no more than marginal. Therefore the
stresses for any value of are not significantly different
from their limiting values.
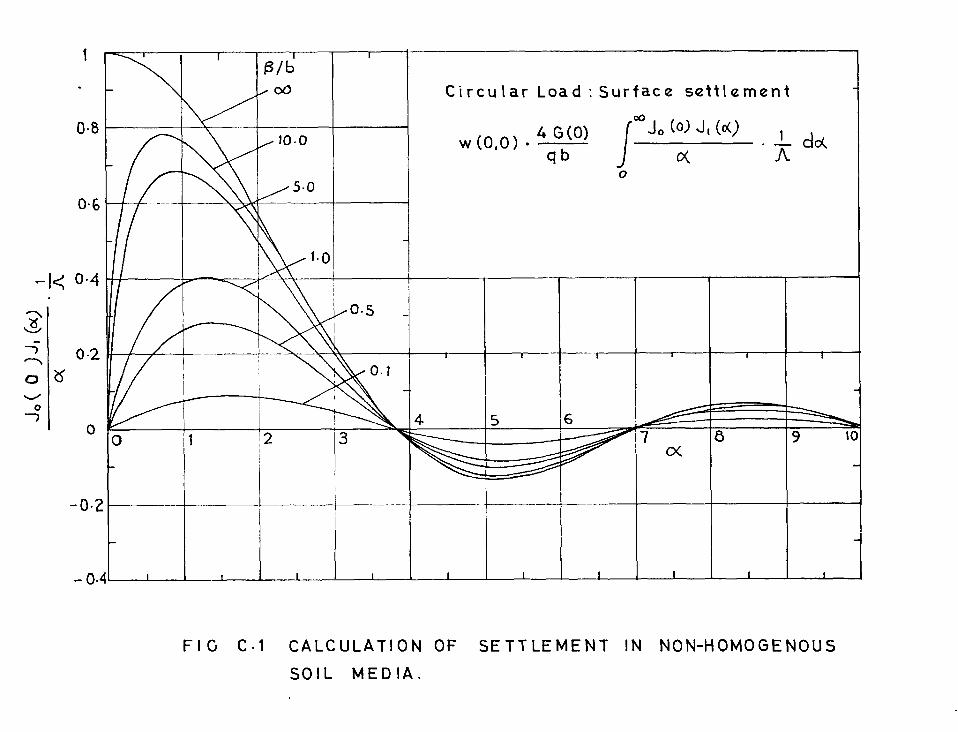
(3/6 oo Circular Load : Surface settlement _.
co 4 G(0) Jo (4)) -1 1 (c() (0,0) dor, w • -,-,-1 io.o
5.0
qb 0( A
j
0
\ 1.0
0.5
o.1 I , . 1
/..---------- 7
c< to
1 , 1 i 1 1 I I 1 1
1
0-8
06
-I< 0-4
0-2 ZS
0
0
-0.2
-0-
FIG C•1 CALCULATION OF SETTLEMENT IN NON-HOMOGENOUS SOIL MEDIA.
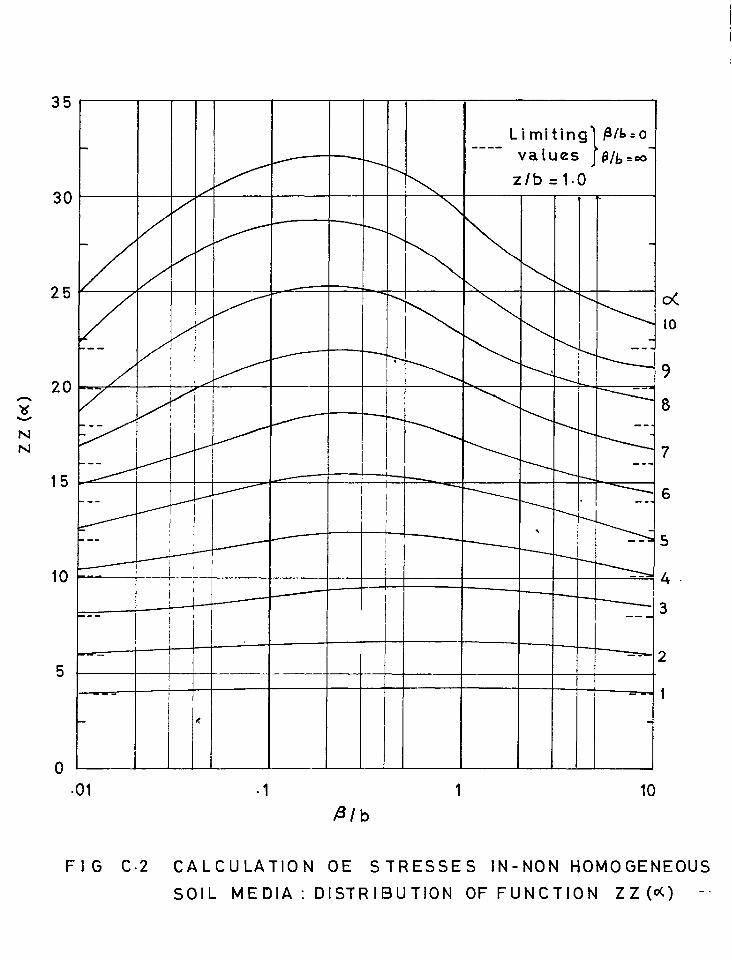
..IIIIi-MI 4
Limiting P/ =o values !M..° z/b =1.0
,
3
2
i
35
30
25
20 c N N
15
10
•01 1 1 10 A/a
F I G C•2 CALCULATION OE S TRESSES IN-NON HOMOGENEOUS SOIL MEDIA : DISTRIBUTION OF FUNCTION ZZ (0() --
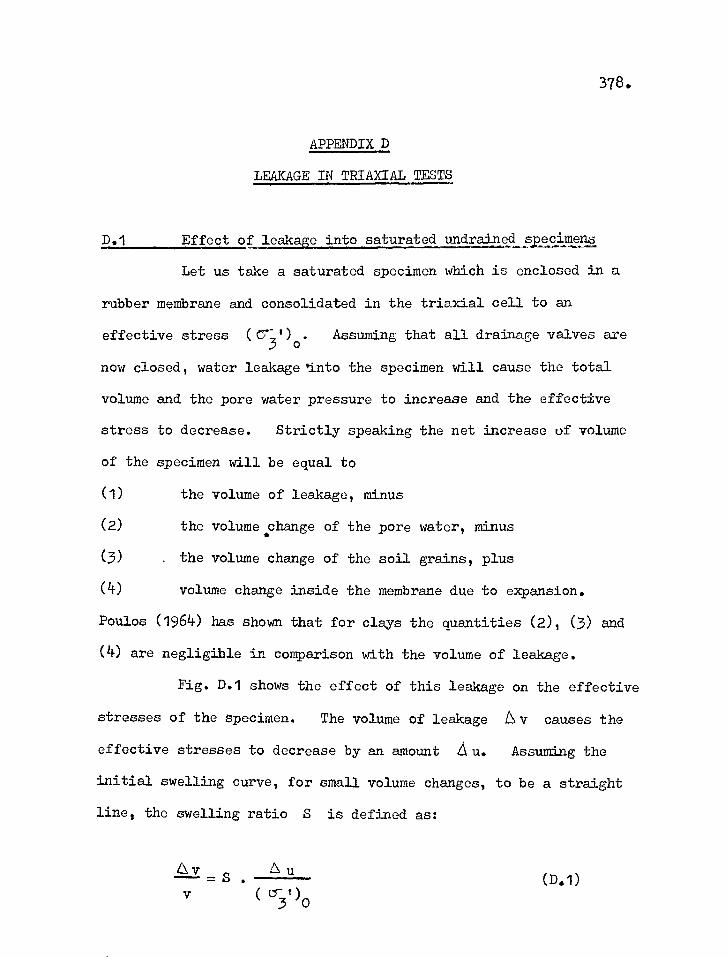
378.
APPENDIX D
LEAKAGE IN TRIAXIAL TESTS
D.1 Effect of leakage into saturated undrained specimens
Let us take a saturated specimen which is enclosed in a
rubber membrane and consolidated in the triaxial cell to an
effective stress (C7- ')0. Assuming that all drainage valves are 3
now closed, water leakage'into the specimen will cause the total
volume and the pore water pressure to increase and the effective
stress to decrease. Strictly speaking the net increase of volume
of the specimen will be equal to
(1) the volume of leakage, minus
(2) the volume change of the pore water, minus
(3) the volume change of the soil grains, plus
(4) volume change inside the membrane due to expansion.
Poulos (1964) has shown that for clays the quantities (2), (3) and
(4) are negligible in comparison with the volume of leakage.
Fig. D.1 shows the effect of this leakage on the effective
stresses of the specimen. The volume of leakage tsv causes the
effective stresses to decrease by an amount A u. Assuming the
initial swelling curve, for small volume changes, to be a straight
line, the swelling ratio S is defined as:
v A u S. ( 07 )
3 0
(D.1)
379.
S, is, therefore, the slope of the initial swelling curve plotted
on a non-dimensional basis.
The initial swelling ratio of the Ongar clay has been
determined (Test no. T-H0-18) by the method proposed by Poulos.
A specimen was set up in the triaxial apparatus under a
cell pressure of 60 lbs/in2 and a deviator stress of about 50% of
that at failure applied under undrained conditions. The pore
pressure (i.e. the back pressure) was then increased in steps of
5%, 10% and 20% (cumulative) of the effective lateral stress
allowing full swelling to take place under each increment. The
results are shown in Fig. D.2. Assuming the swelling curve to be
Au a straight line in the range 0 '\ < 5 the initial swelling (
ratio is 0.090. This is much higher-tan the values for other
clays obtained by Poulos, such as Bearpaw clay shale (0.03) and
Boston Blue clay (0.015).
So the maximum permissible leakage which will cause a
change in effective stress of not more than 2% is given by
= 0.09 x .02 = .0018
for a sample 1-i" dia. x 3" high v = 88 c.c.
Therefore Llv = 0.0018 x 88 = .158 c.c. = 158 m.m.3
For a test lasting 30 days this means a leakage rate of 5.3
m.m.3/day.
Dv
380.
The above analysis strictly applies to undrained tests
for the particular stress level used in the pilot test. These
stresses were, however, similar to those for most of the tests
reported in this thesis.
D.2 Amount of leakage through membranes
(a) Due to hydraulic pressure gradient
Assuming the validity of Darcy's Law (Poulos 1964), the
rate of flow through a porous medium,
q =KiA
where
K = coefficient of permeability (cm/sec)
i = hydraulic gradient
A = area of flow (cm2)
Taking the pressure difference between the inside and out-
side of the membrane (0.016 in. thick in the present series of tests)
as 100 lbs/in2, the area of a sample (li" dia. x 3" high) equal to
91.2 cm2 and K = 5 x 10⁻¹ 6cm/sec for natural rubber, as determined
by Poulos (1964),
—16 100 x 70.3 q = 5 x 10 x x 91.2 0.016 x 2.54
= 0.79 x 10⁻⁸ cm3/sec
381.
= 0.68 mm3/day
(b) Due to osmotic pressure difference
Assuming the pore space was filled with sea water (i.e.
high salt concentration) Poulos (1964) determined the rate of flow
through a membrane 0.006 cm thick as equal to
0.19 mm3/day/cm2
Using Poulos' data for the relationship between flow and
membrane thickness the rate of flow through a membrane 0.016" thick
into a sample 12" dia. x 3" high
= 0.19 x 20 x 91.2 mm3/day 350
= 0.99 mm3/day
Therefore, the maximum possible leakage for the above
conditions, due to the combined effect of hydraulic and osmotic
pressure differences
= 0.68 + 0.99 = 1.67 mm3/day
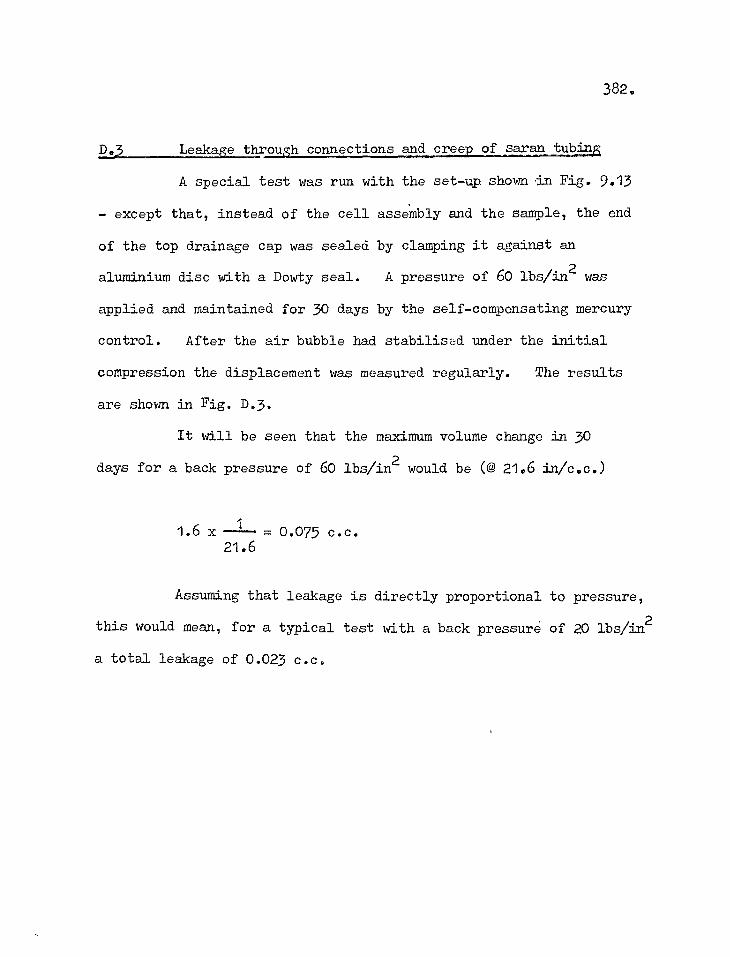
382.
D.3 Leakage through connections and creep of saran tubing
A special test was run with the set-up shown in Fig. 9.13
- except that, instead of the cell assembly and the sample, the end
of the top drainage cap was sealed by clamping it against an
aluminium disc with a Dowty seal. A pressure of 60 lbs/in2 was
applied and maintained for 30 days by the self-compensating mercury
control. After the air bubble had stabilised under the initial
compression the displacement was measured regularly. The results
are shown in Fig. D.3.
It will be seen that the maximum volume change in 30
days for a back pressure of 60 lbs/in2 would be (@ 21.6 in/c.c.)
1.6 x 1 - 0.075 c.c. 21.6
Assuming that leakage is directly proportional to pressure,
this would mean, for a typical test with a back pressure of 20 lbs/in2
a total leakage of 0.023 c.c.
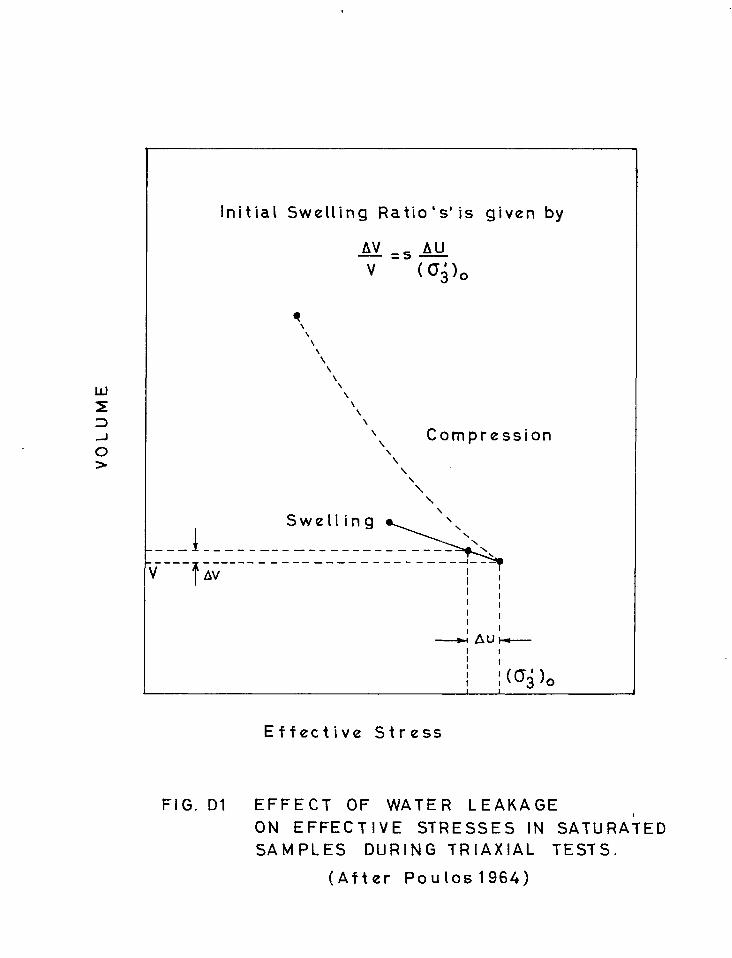
Initial Swelling Ratio's' is given by
i
AV AU =5 V (q)0
.\ Compression
Swelling .
V f AV
----1.4 A U 1-4---
( ai) 0
w
n -J 0 >
Effective Stress
FIG. D1 EFFECT OF WATER LEAKAGE ON EFFECTIVE STRESSES IN SATURATED SAMPLES DURING TRIAXIAL TESTS.
(After Poulos1964)
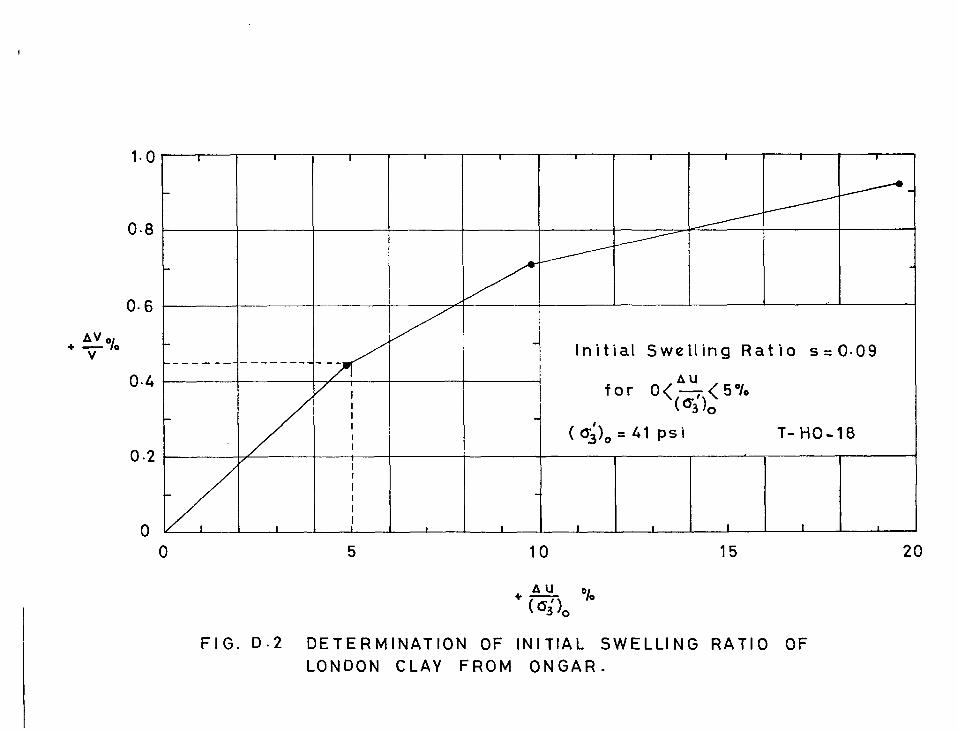
5 0 15 10 20
4. au 0/0 ( (5Do
FIG. D•2 DETERMINATION OF INITIAL SWELLING RATIO OF LONDON CLAY FROM ONGAR.
I I I I II I I I
-•
- 11 Initial
(0-3).=
for
Swelling Ratio
0<A U
<510
s=0.09
T- HO-18 1 1
( 15-3')0 41 psi
I I 1 I I 1
I I I I I I .
1.0
0.8
0.2
0
0.6
Ay / , + •••-- 10 v
0.4
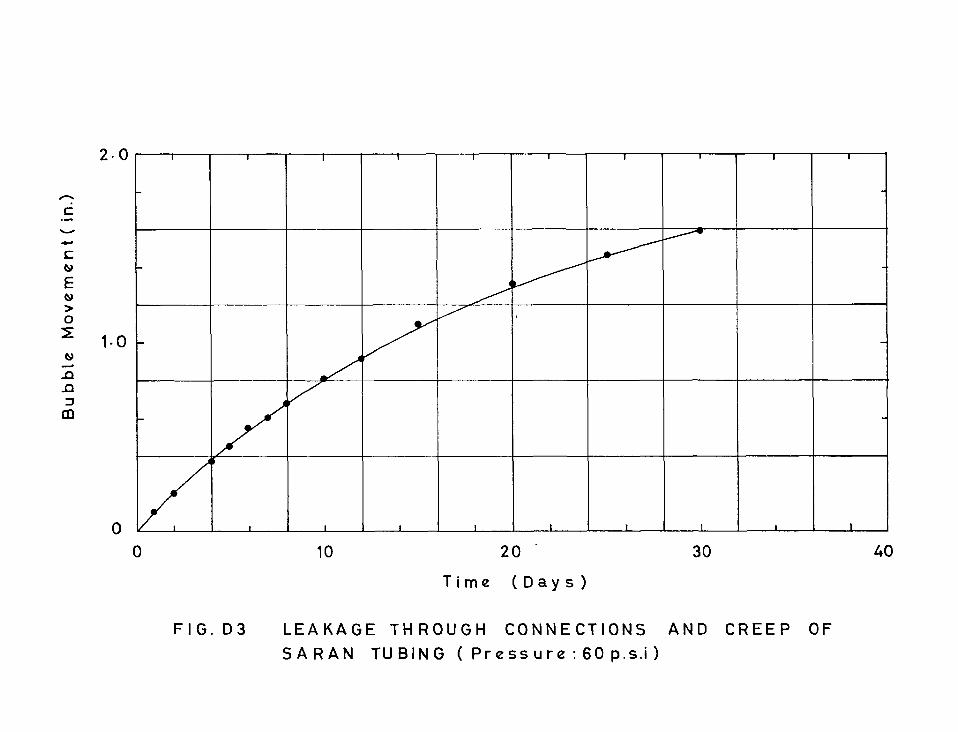
0 10 20 30
2.0
1.0
0
Time (Days)
FIG. D3 LEAKAGE THROUGH CONNECTIONS AND CREEP OF SARAN TUBING ( Pressure :60 p.s.i)
1 1 i i 1 1
383.
APPENDIX E
TIME - SETTLEMENT DIAGRAMS FOR STANDARD OEDOMETER TESTS
A few typical cases are shown Ion semi-log plots in Figs.
E.1 - E.10. The following notations have been used to denote the
three values of the zero reading:
1 Initial Reading on the dial gauge before load application
2 - Zero reading correcting for apparatus deformation only
3 - Zero reading obtained by Casagrande construction from the
shape of the early portion of each curve (see Taylor 1948).
Time ( Minutes )
FIG. El : 0-H0-2 1 1st LOADING.
5 000 100 10 1000
Time ( Minutes )
FIG. E2 : 0-H0-21 2nd Loading.
1 100 1000 5000 10
0
•-•••-__....____._.
- 4
0 8 • 4-
(1) • 8-16
---...
16-32
Tift2
230
220
210 0
1600
1500
1400
,•••••••,,,
c -4.
190
1800
a! a
1700
200
0-
8-16
16-32
0.1 3300
1
Time ( Minutes )
10 100 1000 5000
o 3200
0 ® --•
1 - 2 3100
• • 2 -4
2 900 .,,••••••
c .1.
t o 2 800
rn c .....
1:7 m 0 cc 2700
0
—co
• 4 -8
0
2600
25 00
2400
2300
2200
2100
T / ft 2
FIG. E3 : 0 -H0-8 / 1st LOADING.
3000
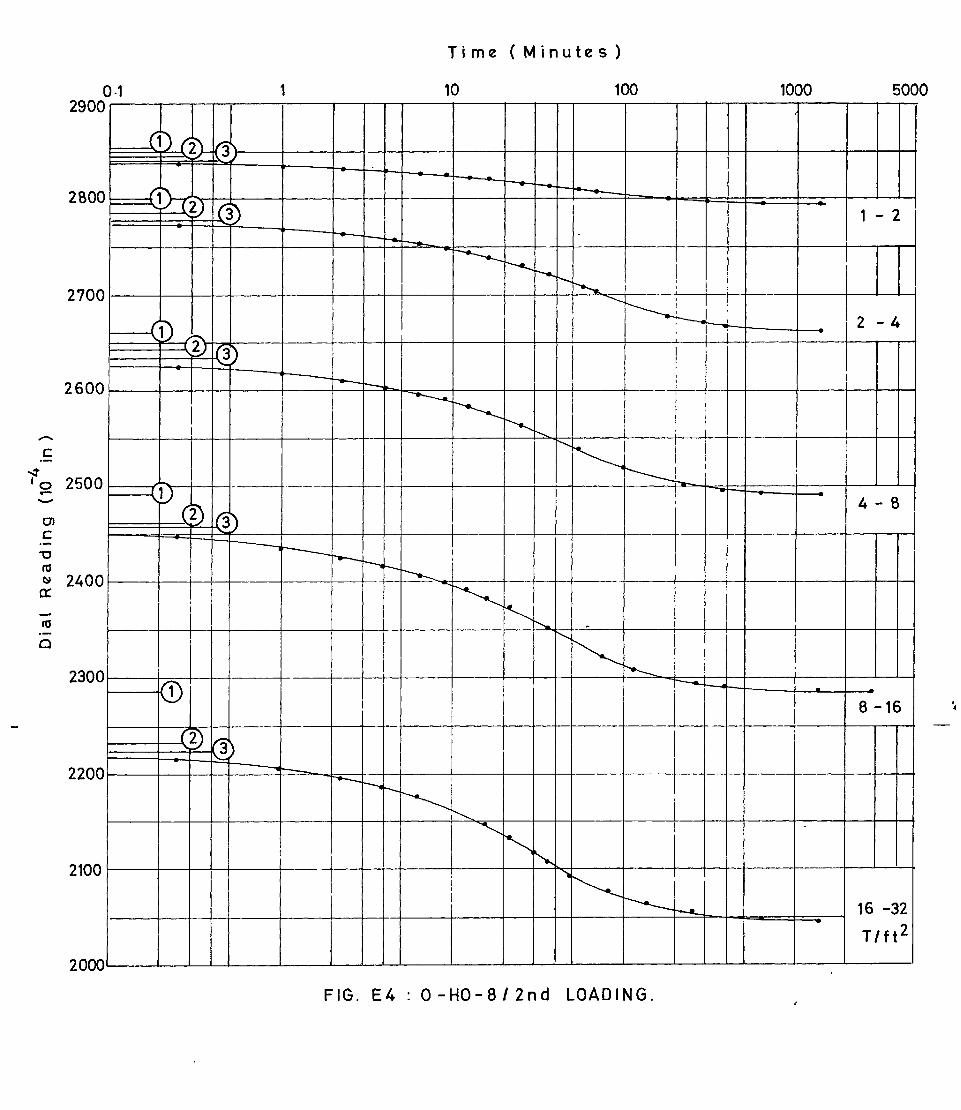
Time ( Minutes )
FIG. E4 : 0 -H0-8 / 2nd LOADING.
5000 100 1000 10 1
0 °Awe
---4------.---.7„.
- 2
2 - 4
1
0
4 - 8
-16 8
o0
16 -32
T/ft2
0.1 2900
2800
2700
2600
a c -0 m 0 2400 rx -
fa
c)
2300
2200
2100
2000
........
C -4. 'cp 2500 ,
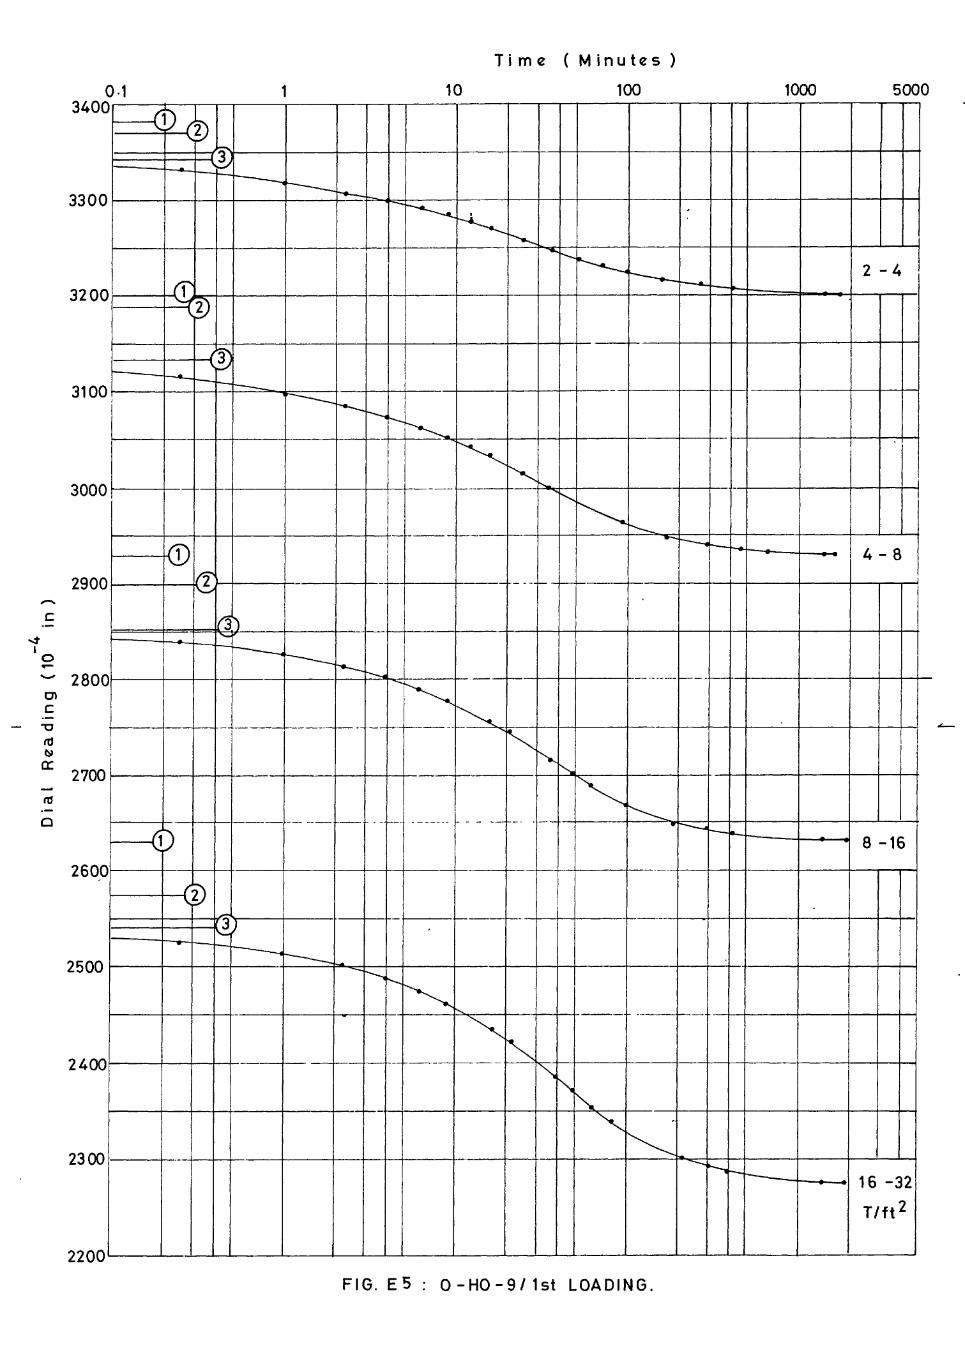
Time ( Minutes )
0.1 3400
10
100
1000 5000
6
3300
32 00
3100
3000
-4
4 - 8
2900 o
2800
2700
8 -16
2600
2500
2400
2300
®
16 -32
Tift 2
2200
FIG. ES : 0-H0-9/ 1st LOADING.
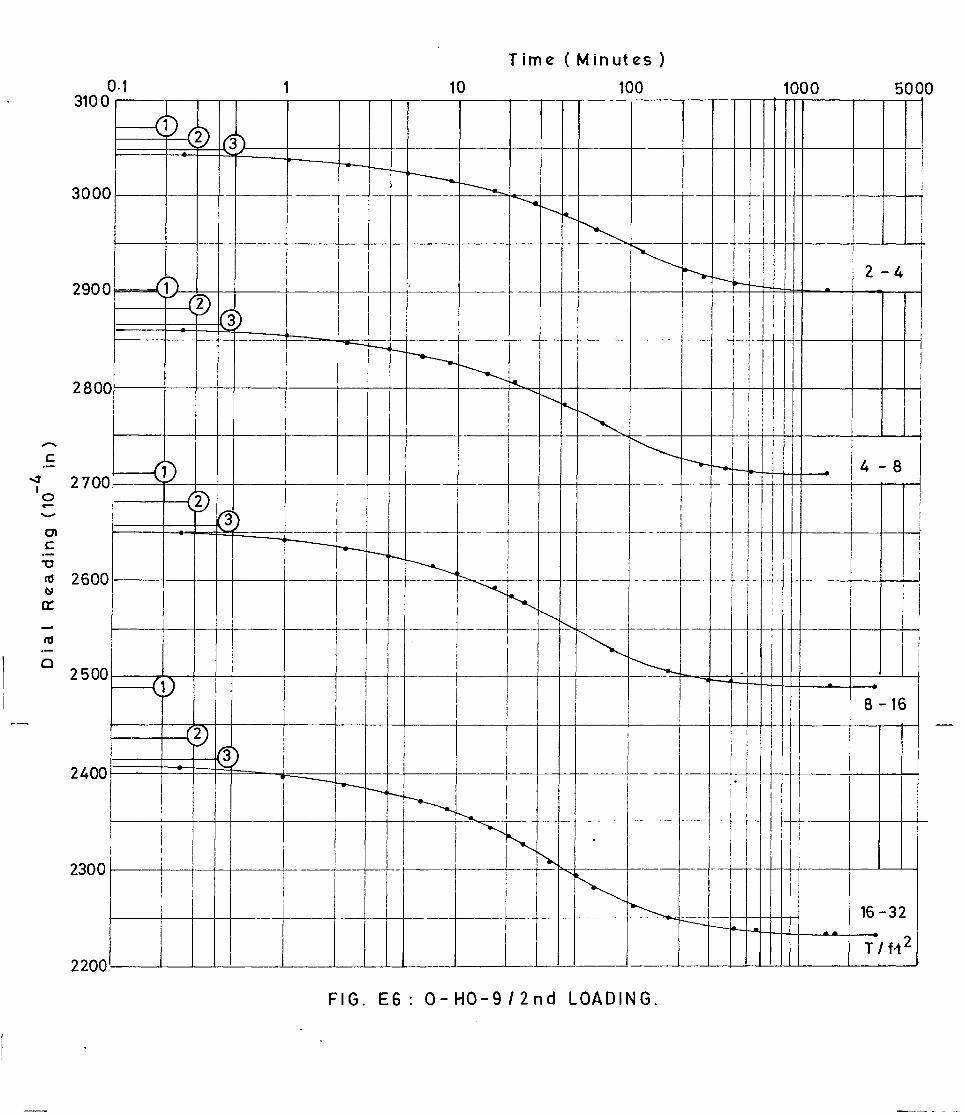
Time (Minutes)
FIG. E6: 0-H0-9 / 2nd LOADING.
C
10
2700
310 0
300
290
280
2400
2300
2200
rd
a 2 500
cn C
2600
cc
J•1 1 10 100 1000 5001
oa
2 -4
-1- 1
0 ._ 4- 8
0 _
8-16
0 0
t
16-32
T/ft 2
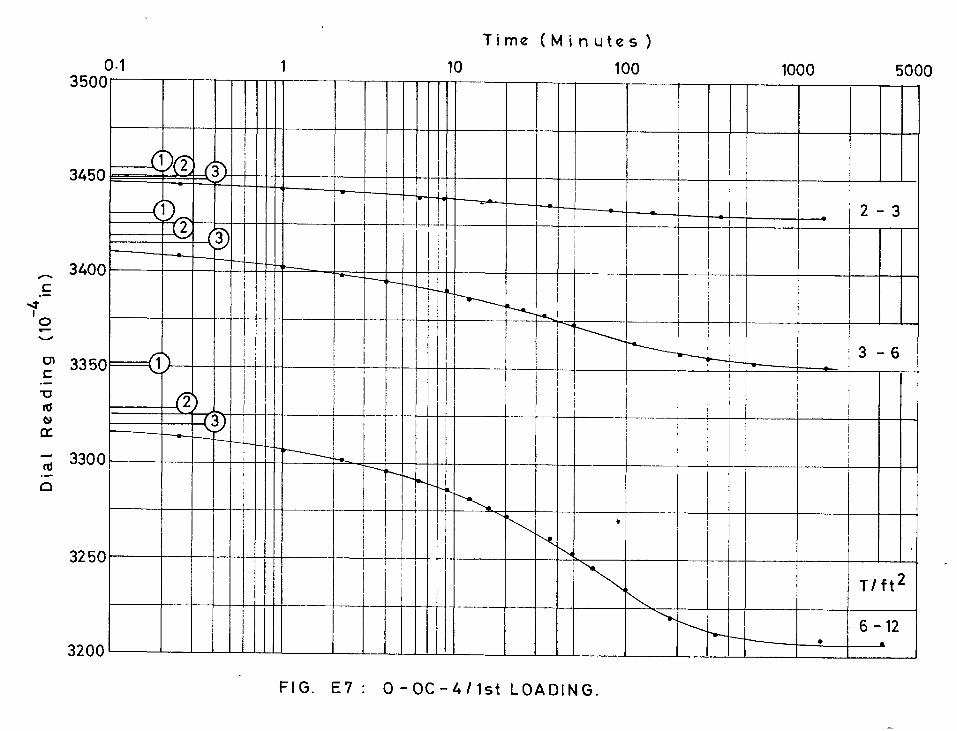
0.1 3500
1 Time (Minutes)
10 100 1000 5000
3450
—.. 3400 c
..t l o ..„...
cnc 3350 17 MI C9 tx
rti 330 0
0
3
3 -6
3250
T/ft 2
6-12 •
3200
FIG. E7 : 0-0C- 4 / 1st LOADING.
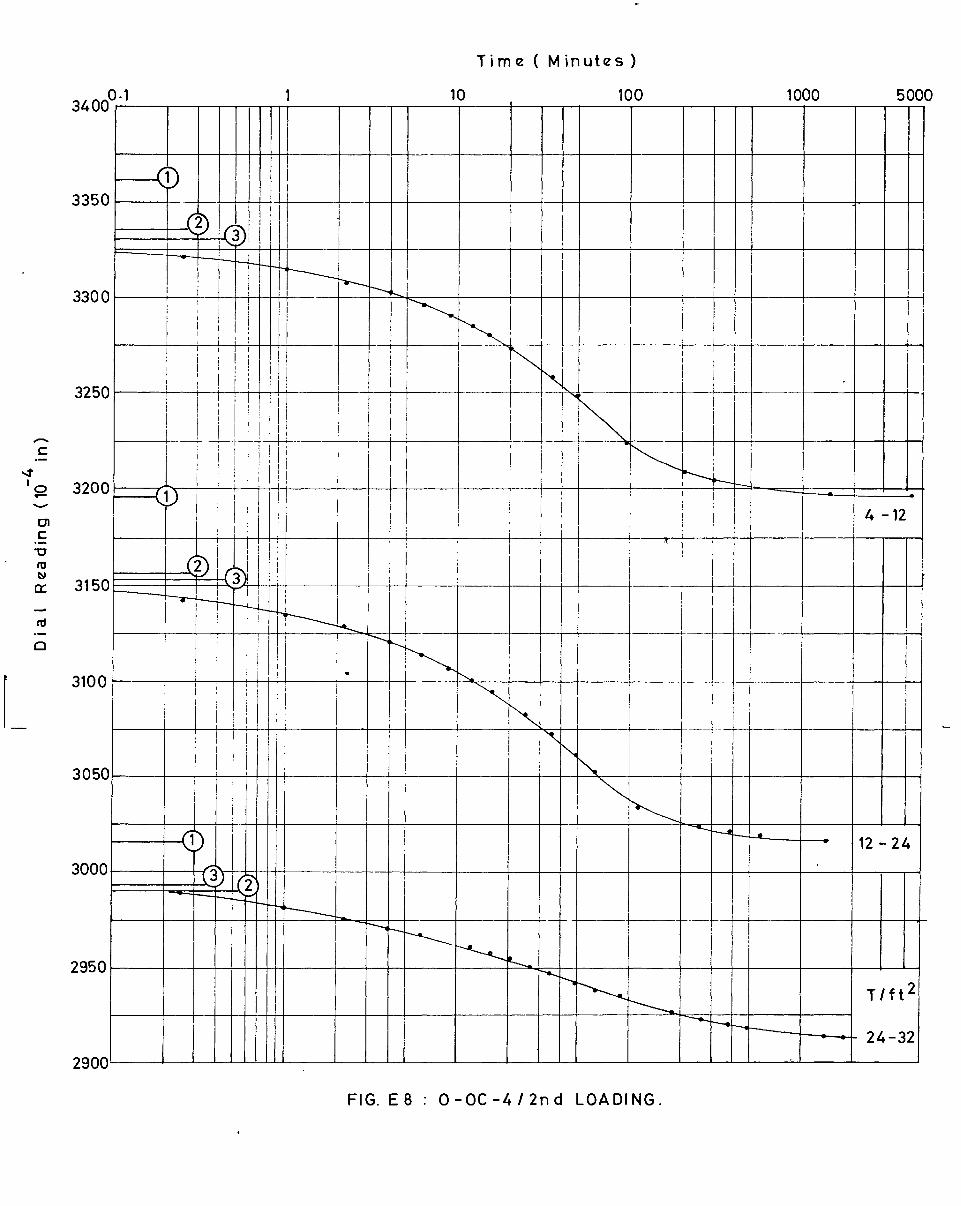
3350
3300
3250
.t s o 3200
cn c -0 n3 u cc 3150
al
0
3100
3050
3000
34000.1
o
Time ( Minutes )
10 100 1000 5000
sci ®
4 -12
12 -24
M a
2950
41.---........
T/ft 2
24-32
2900
FIG. E 8 : 0-0C-4 / 2nd LOADING.
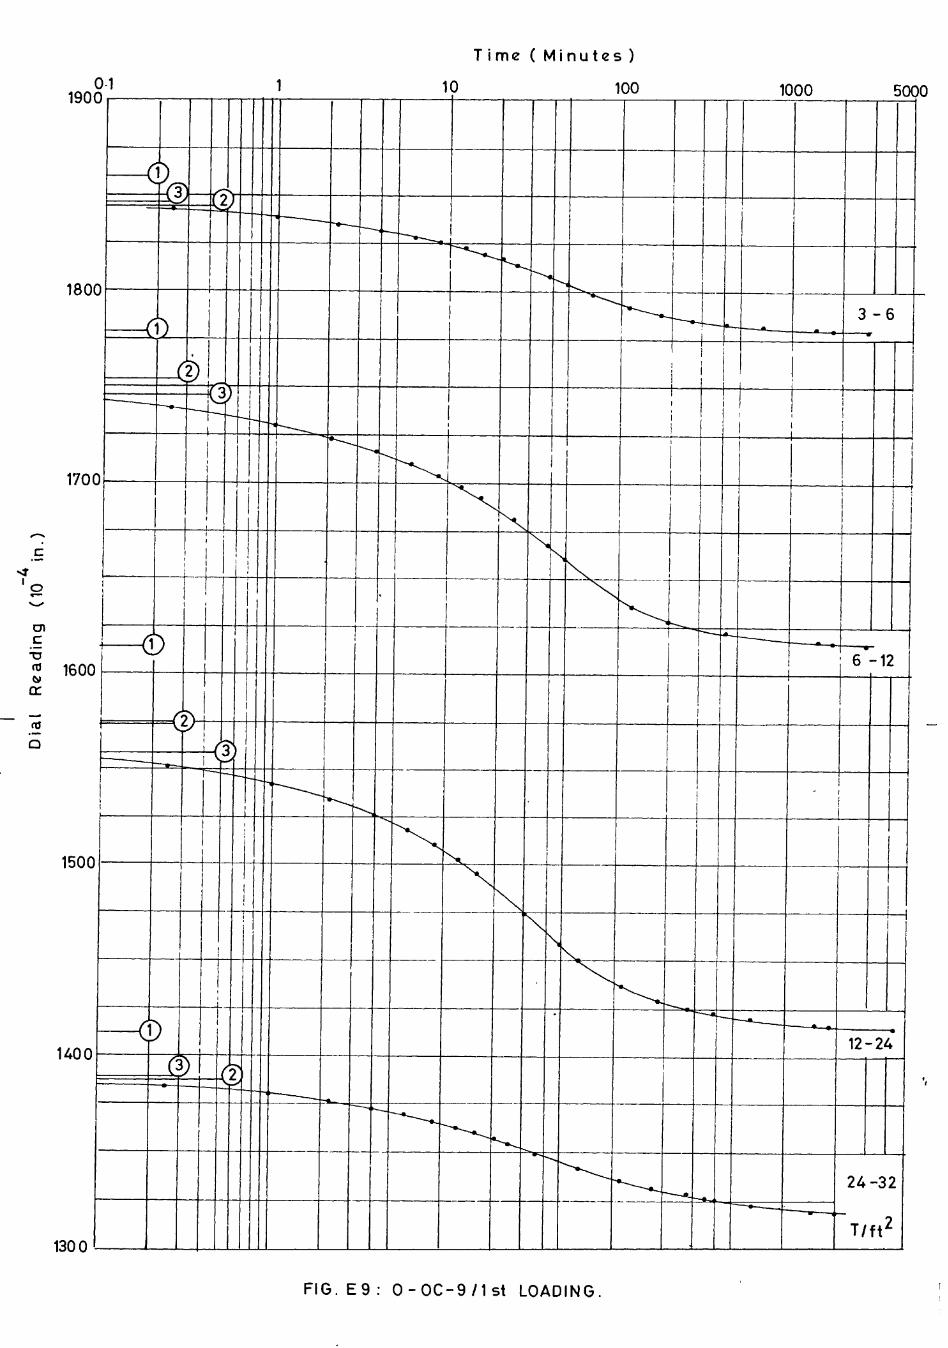
FIG. E 9 : 0-0C-9 /1st LOADING.
100
Time ( Minutes )
10 0-1 1 190
180
170
0:9 160 CC
150
140 0
130 0
0
3 - 6
0
)
6 r --L'a--------„_. -12
o
i
0 12-24
O
24 -32
T/ft 2
SnO0 ___
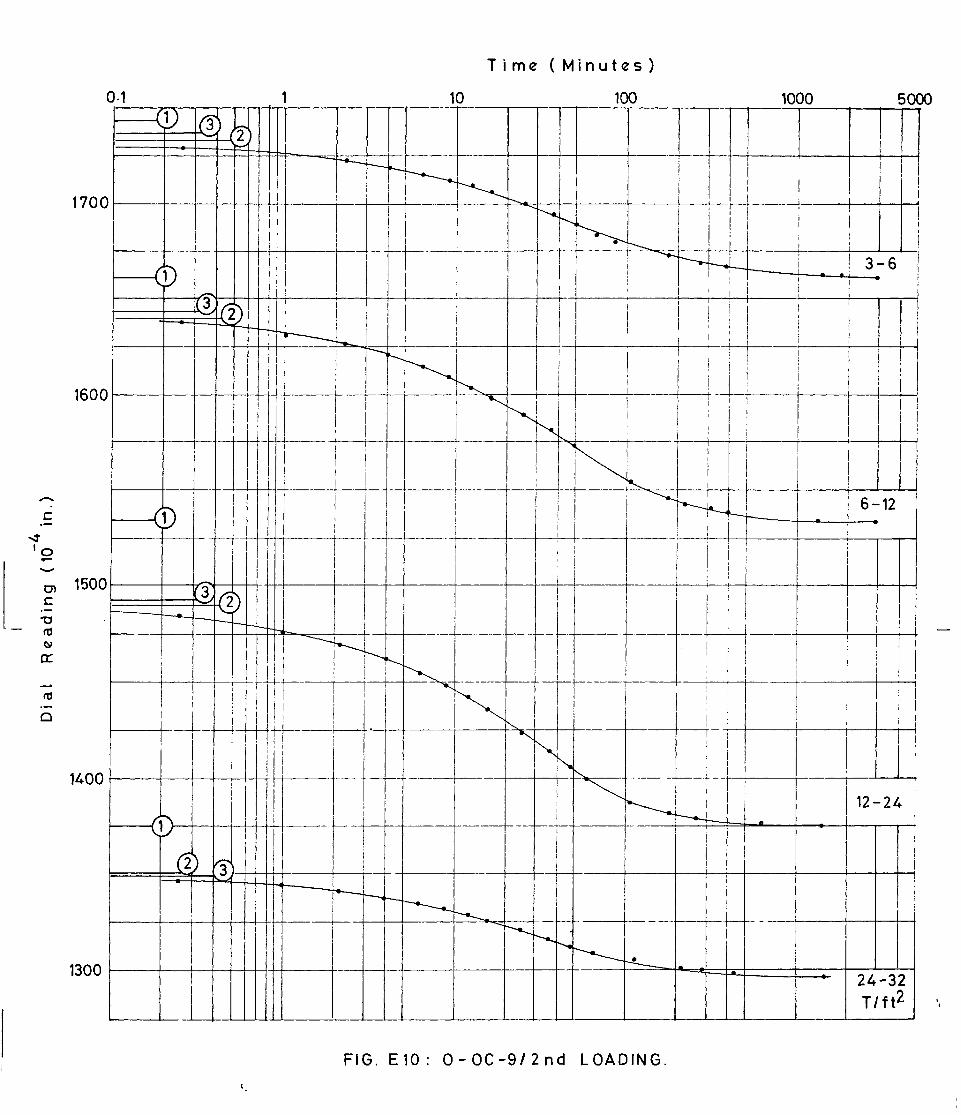
rn 1500
tx
1400
1300
Time (Minutes)
0.1
1
10
100
1000
5000
U
--...il ---
. 3-6 •
-----T
1 6-12
.--
0
7
_1 12-24
0
24-32 T/ft2
FIG. E10: 0-0C-9/ 2nd LOADING.
1700
1600
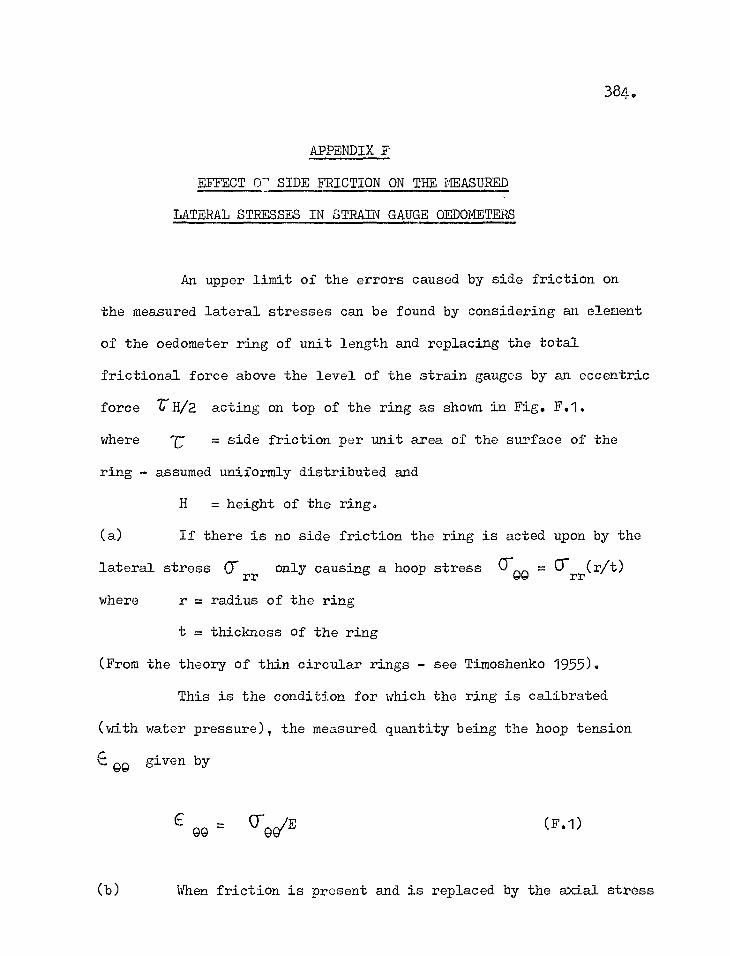
384.
APPENDIX F
EFIWCT 0- SIDE FRICTION ON THE MEASURED
LATERAL STRESSES IN STRAIN GAUGE OEDOMETERS
An upper limit of the errors caused by side friction on
the measured lateral stresses can be found by considering an element
of the oedometer ring of unit length and replacing the total
frictional force above the level of the strain gauges by an eccentric
force trii/2 acting on top of the ring as shown in Fig. F.1.
where .77 = side friction per unit area of the surface of the
ring - assumed uniformly distributed and
H = height of the ring.
(a) If there is no side friction the ring is acted upon by the
lateral stress 0rr only causing a hoop stress 0-9®_ Crrr( r/t)
where r = radius of the ring
t = thickness of the ring
(From the theory of thin circular rings - see Timoshenko 1955).
This is the condition for which the ring is calibrated
(with water pressure), the measured quantity being the hoop tension
Qg given by
C 99 = 009/E
(F.1)
(b) When friction is present and is replaced by the axial stress
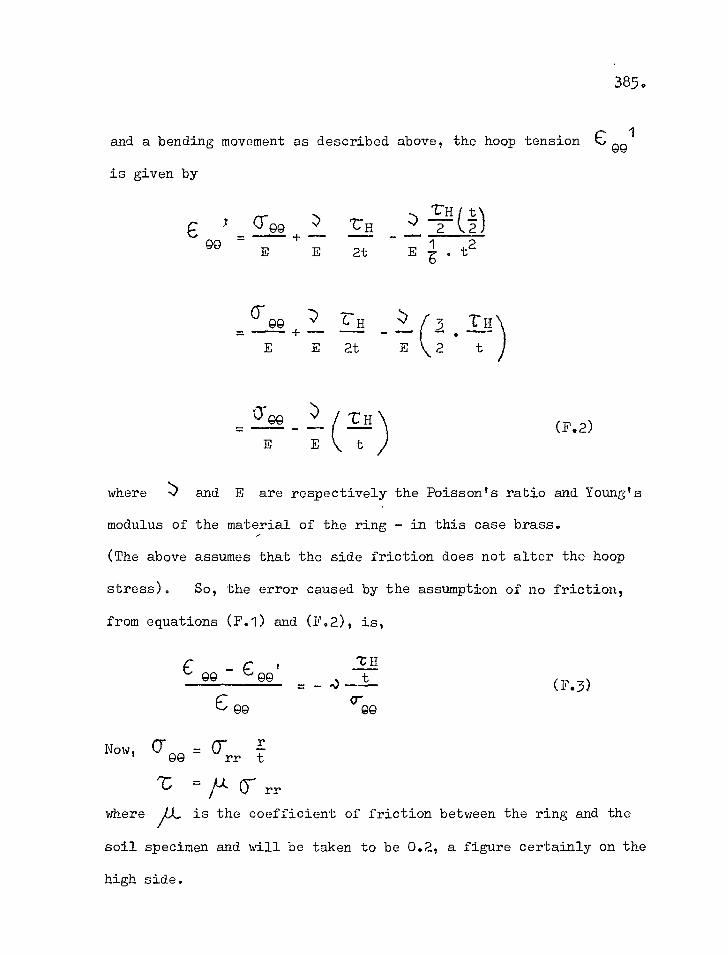
385.
and a bending movement as described above, the hoop tension
is given by
I t\ -t Q9 ecH -/ + gg _
1 2 E 2t E z . t
e QQ1
(IGO H) + -- -
CrGG 1:11 I)
E E t
E E 2t E \,2 t
(F.2)
where and E are respectively the Poisson's ratio and Young's
modulus of the material of the ring - in this case brass.
(The above assumes that the side friction does not alter the hoop
stress). So, the error caused by the assumption of no friction,
from equations (F.1) and (F.2), is,
c H Q9 GQ t
GG 0- QG
(F.3)
Now, Cr GG rr t
r-C =
/' 0- rr
where JOL is the coefficient of friction between the ring and the
soil specimen and will be taken to be 0.2, a figure certainly on the
high side.
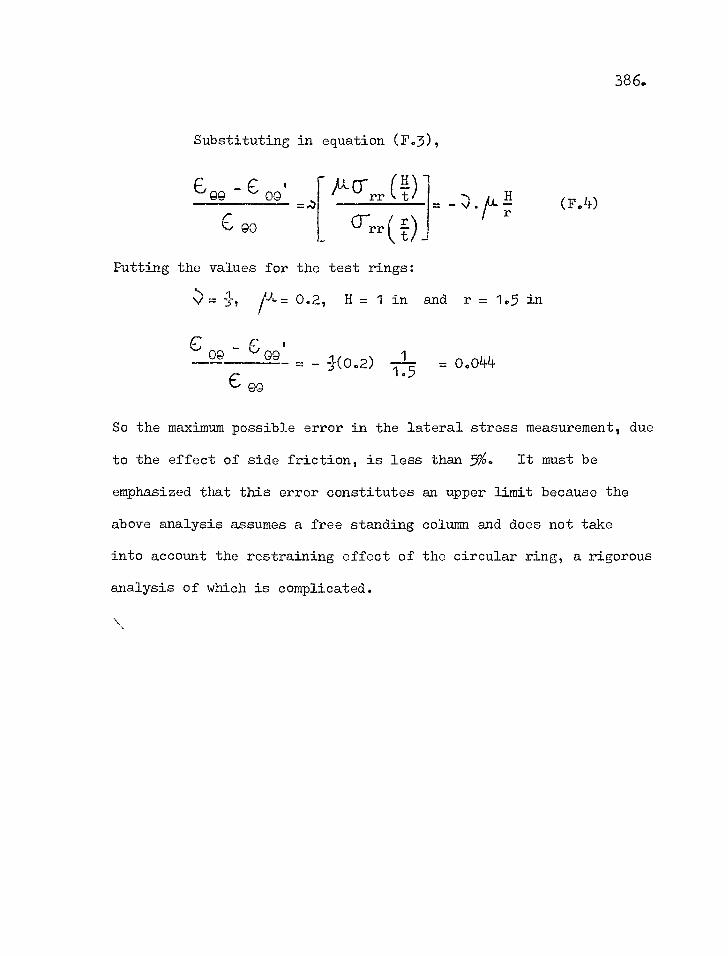
386.
Substituting in equation (F.3),
98 - 09
C90
rr t
(rrr(
•/L. H (F.4)
Putting the values for the test rings:
=
_ 09
/4-=
G9
0.2, H = 1 in and r = 1.5 in
- 0.044 3(0.2) -- 1 .15 99
So the maximum possible error in the lateral stress measurement, due
to the effect of side friction, is less than 5%. It must be
emphasized that this error constitutes an upper limit because the
above analysis assumes a free standing column and does not take
into account the restraining effect of the circular ring, a rigorous
analysis of which is complicated.
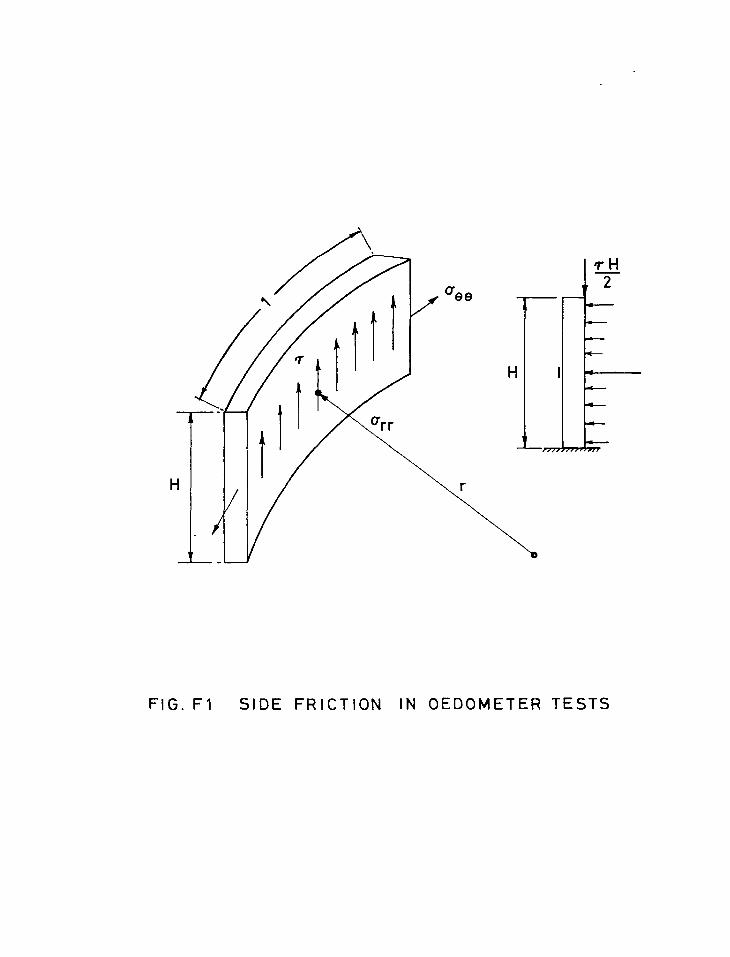
H
FIG. Fl SIDE FRICTION IN OEDOMETER TESTS
387.
REFERENCES
Abbreviations
Trans. ASCE - Transactions of the American Society of Civil Engineers.
J. ASCE SMFD - Journal of the American Society of Civil Engineers, Soil Mechanics and Foundation Divisions
ASTM. STP - American Society for Testing and Materials, Special Technical Publication
C.G.J. - Canadian Geotechnical Journal
Proc. ICE - Proceedings of the Institution of Civil Engineers, London
ICSMFE - International Conference on Soil Mechanics and Foundation Engineering
IUTAM - International Union of Theroetical and Applied Mechanics
H.R.B. - Highway Research Board, Washington, D.C.
H.R.R. - Highway Research Record, published by the Highway Research Board.
N.G.I. - Norwegian Geotechnical Institute
388•
Abbott, A. M. (1960) - "One-Dimensional Consolidation of Multi-. Layered Soils"rGeotechnique, Vol. 10, No. 4,13. 151.
Acura, W. and Fox, L. (1951) - "Computation of Load Stresses in a Three Layer Elastic System".-Geotechnique, Vol. 2, p. 293.
Agarwal, K. B. (1967) - "The Influence of Size and Orientation of Sample oil the Undrained Strength of London Clay" - Ph.D. Thesis, University of London.
Ahlvin, R. G. and Ulery, H. H. (1962) - "Tabulated Values for Determining the Complete Pattern of Stresses, Strains and Deflections Beneath a Uniform Circular Load on a Homogeneous Half Space" - H.R.B. Bulletin No. 342, p. 1.
Akai, K. and Adachi, T. (1965) - "Study of One-Dimensional Consolida-tion and the Shear Strength Characteristics of Fully Saturated Clay in Terms of Effective Stress" - Proc. 6th ICSMFE, Montreal, Vol. 1, p. 146.
Alderman, J. K. (1956) - Discussion of Ref: Skempton and McDonald (1955), Proc. ICE, Vol. 5, Part 1, p. 169.
Bara, J. P. and Hill, R. R. (1967) - "Foundation Rebound at Dos Amigin Pumping Plant" - J. ASCE, SMFD, Vol. 93, SM 5, September 1967.
Barber, (1940) - see De Barros (1966).
Barden, L. (1963) - "Stresses and Displacements in Cross-Anisotropic Soil" - Geotechnique, Vol. 13, No. 3.
Barden, L. (1965) - "Consolidation of Normally Consolidated Clays" -J. ASCE SMFD, Vol. 91, SM 5, September 1965.
Barron, R. A. (1948) - "Consolidation of Fine Grained Soils by Drain Wells" - Trans. ASCE, Vol. 113, 1948.
act, M. A. (1935) - "The Effect of Certain Discontinuities on the Pressure Distribution in a Loaded Soil" - Physics, Vol. 6, No. 12, p. 367.
Biot, M. A. (1941) - "General Theory of Three-Dimensional Consolidation" - J. of Applied Physics, Vol. 12, p. 1557164.
Biot, M. A. (1941a) - "Condolidation Settlement Under a Rectangular Load Distribution" - J. of Applied Physics, Vol. 12, p. 426.'430.
389.
Biot, M. A. (1955) - "Theory of Elasticity and Consolidation for a Porous Anisotropic Solid" - J. of Applied Physics, Vol. 26, p. 182-185.
Biot, M. A. and Elingan, F. M. (1941) - "Consolidation Settlement of a Soil with an Impervious Top Surface" - J. of Applied Physics, Vol. 12, p. 578-581.
Biot, M. A. and Willis, D. G. (1957) - "The Elastic Coefficients of the Theory of Consolidation" - J. of Applied Mechanics, Vol. 24, No. 4, p. 594-601.
Binnie, G. M. and Price, J. A. (1941) - "An Apparatus for Measuring the Lateral Pressure of Clay Samples under Vertical Load" - J. ICE, Vol. 15, p. 297.
Bishop, A. W. (1947) - "The London Clay, Part III - Strength Variations in London Clay" - Journees Internationales Consacrees a l'Etude ... Silicates Industriels, Vol. 13, No. 9.
Bishop, A. W. (1952) - "The Stability of Earth Dams" - Ph.D. Thesis, University of London.
Bishop, A. W. (1954) - "The Use of Pore Pressure Coefficients in Practice" - Geotechnique, Vol. 4, p. 148-152.
Bishop, A. W. (1957) - "Some Factors Controlling the Pore Pressures 43eitt 145 during Construction of Earth Dams" - Proc. 4th ICSMFE, London, Vol. 2, p. 294-300.
Bishop, A. W. (1958) - "Test Requirements for Measuring the Coefficient of Earth Pressure at Rest" - Proc. Brussels Conf. on Earth Pressure Problems, Vol. 1, p. 2.
Bishop, A. W. (1958a) - Contribution to Discussions, Brussels Conf. on Earth Pressure Problems, Vol. 3, p. 38.
Bishop, A. W. (1959) - "The Principle of Effective Stress" - N.G.I. Publication No. 32.
Bishop, A. W. (1966) - "Strength of Soils as Engineering Materials" - 6th Rankine Lecture, Geotechnique, Vol. 16, June 1966.
Bishop, A. W. (1966a) - "Soils and Soft Rocks as Engineering Materials" - Inaugural Lecture, Imperial College, May 1966.
390.
Bishop, A. W. and Henkel, D. J. (1953) - "Pore Pressure Changes during Shear in two Undisturbed Clays" - Proc. 3rd ICSMFE, Zurich, Vol. 1, p. 94.
Bishop, A. W. and Donald, I. B. (1961) - "The Experimental Study of Partly Saturated Soils in the Triaxial Apparatus" - Proc. 5th ICSMFE, Paris, Vol. 1, p. 13-21.
Bishop, A. W., Alpan, I., Blight, G. E. and Donald, I. B. (1960) -"Factors Controlling the Strength of Partly Saturated Cohesive Soils" - Proc. Res. Conf. Shear Strength of Cohesive Soils, Boulder, p. 503.
Bishop, A. W. and Henkel, D. J. (1962) - "The Measurement of Soil Properties in the Triaxial Test" . 2nd Ed. Edward Arnold, London.
Bishop, A. W., Webb, D. L. and Lewin, P. I. (1965) - "Undisturbed Samples of London Clay from the Ashford Common Shaft: Strength Effective Stress Relationships" - Geotechnique, Vol. 15, No. 1, p. 1-31.
Bishop, A. W., Webb, D. L. and Skinner, A. E. (1965) - "Triaxial Tests on Soil at Elevated Cell Pressures" - Proc. 6th ICSMFE, Montreal, Vol. 1, p. 170-174.
Bishop, A. W. and Little, A. L. (1967) - "The Influence of the Size and the Orientation of the Sample on the Apparent Strength of the London Clay at Malden, Essex" - Proc. Geo. Conf. Oslo, Vol. 1, p. 89-96.
Bishop, A. W. and Vaughan, P. R. (1962) - "Selset Reservoir - Design and Performance of the Embankment" - Proc. ICE, Vol. 21, p. 305.
Bjerrum, L. (1954) - "Theoretical and Experimental Investigations on the Shear Strength of Soils" - N.G.I. Publication No. 5.
Bjerrum, L. (1964a) - "Relation Between Observed and Calculated Settle-ments of Structures in Clay and Sand" - (In Norwegian) - N.G.I. Oslo, October 1964.
Bjerrum, L. (1964b) - "Secondary Settlement of Structures" - Proc. IUTAM Symposium, GrenOble, 1964. Also N.G.I. Publication No. 73.
Bjerrum, L. (1965) - "Mechanism of Progressive Failure in Slopes of Over-consolidated Plastic Clay and Clay Shales" - 3rd Terzaghi Lecture, J. ASCE SMFD, Vol. 93, SM 5.
391.
Bjerrum, L. (1967) - "Engineering Geology of Normally Consolidated Marine Clays as related to Settlement of Buildings" - 7th Rankine Lecture, Geotechnique, Vol. 17, dune 1966.
Bjerrum, L., Simons, N. and Torblia, (1958) - "The Effecto of Time on the Shear Strength of Soft Marine Clay"- Proc. Brussels Conf. on Earth Pressure Problems, Vol. 1, p. 148-158.
Blight, G. E. (1963) - "The Effect of Non-uniform Pore Pressures on Laboratory Measurements of Shear Strength of Soils" - ASTM/NRC Symposium on Laboratory Shear Testing of Soils, Ottawa, ASTM STP No. 361.
Bozuzuk, M. (1963) - "The Modulus of Elasticity of Leda Clay from Field Measurements" - CGJ, Vol. 1, No. 1.
Brinch Hansen, J. (1961) - See Hansen and Misi (1961).
Broms, B. B. and Ratnam, M. V. (1963) - "Shear Strength of Aniso-tropically Consolidated Clay" - J. ASCE SMFD, Vol. 89, No. SM 6, p. 1.
Brooker, E. W. and Ireland, H. 0. (1965) - "Earth Pressure at Rest Related to Stress History" - CGJ, Vol. 2, No. 1, Feb. 1965.
Buckton, E. J. and Currel, J. (1943) - "The New Waterloo Bridge" - J. ICE, Vol. 20, No. 7.
Buckton, E. J. and Fereday, H. J. (1938) - "The Reconstruction of Chelsea Bridge" - J. ICE, Vol. 7, p. 383.
Buchan, S. (1938) - "The Water Supply of the County of London" -Memoirs of the Geol. Survey, London, HMSO.
Burmister, D. M. (1943) - "Theory of Stresses and Displacements in Layered Systems" - Proc. HRB, Vol. 22, p. 127-148.
Burmister, D. M. (19W - "The General Theory of Stresses and Dis- placements in Layered Soil Systems" - J. of Applied Physics, Vol. 16, No. 2, p. 89-96, No. 3, p. 126-127, No. 5, p. 296-302.
Burmister, D. M. (1952) - "The Application of Controlled Test Methods in Consolidation Testing" - ASTM, Spl. Tech. Pub. No. 126.
Burmister, D. M. (1956) - "Stress and Displacement Characteristics of a Two Layer Rigid Base Soil System" - Proc. HRB, Vol. 35.
392.
Burn, K. N. (1965) - Discussion on Klohn (1965) - CGJ, Vol. 2, p. 341.
Cappleman, H. L. (1967) - "Movements in Pipe Conduits under Earth Dams" - J. ASCE SMFD, Vol. 93, SM 6.
Carothers, S. D. (1920) - "Plane Strain: Direct Determination of Stresses" - Proc. Royal Soc. Series A : Vol. 97, p. 110-123.
Casagrande, A. (1936) - "The Determination of Pre-consolidation Load and its Practical Significance" - Proc. 1st ICSMFE, Cambridge, Mass., Vol. 3.
Casagrande, A. and Wildon, S. D. (1951) - "Effect of Rate of Loading on the Strength of Clays and Shales at Constant Water Content"-Geotechnique, Vol. 2, p. 251-263.
Cebertowicz and Wedzinski, (1958) - "Relation advenant entre les Tensions Internes Horizontales et Verticales du Sol" - Brussels Conf. on Earth Pressure Problems, Vol. 1, p. 28.
Chandler, R. J. (1967) - "The Strength of a Stiff Silty Clay" -Proc. Geo. Conf., Oslo, Vol. 1,R.103.
Christie, I. F. (1963) - "The Consolidation of Soils" - Ph.D. Thesis, Edinburgh University.
Christie, I. F. (1965) - "Secondary Compression Effects During One- Dimensional Compression Tests" - Proc. 6th ICSMA, Montreal, Vol. 1.
Clayton, K. M. (1964) - "Geology and Geomorphology - Guide to London Excursions" - 20th Int. Geographical Congress, London.
Cooling, L. F. and Skempton, A. W. (1942) - "A Laboratory Study of London Clay" - J. ICE, Vol. 17, No. 3, p. 251.
Cooling, L. F. and Gibson, R. E. (1955) - "Settlement Studies of Structures in England" - Conf. Corr. Cale. and Obs. Stresses and Displacements of Structures, Vol. 1, p. 295.
Creasey, L. R., Adams, H. C. and Lampitt, N. (1965) - "Museum Radio Tower" - Proc. ICE, Vol. 30, p. 33-78.
Cornforth, D. H. (1964) - "Some Experiments on the Influence of Strain Conditions on the Strength of Sand" - Geotechnique, Vol. 14, No. 2.
393.
Crawford, C. B. (1963) - "Pore Pressures within Soil Specimens in Triaxial Compression" - ASTM, Spl. Tech. Pub. 361.
Crawford, C.B. (1964) - "Interpretation of Consolidation Tests" - J. ASCE SMFD, Vol. 90, SM 5.
Crawford, C. B. (9165) - "Resistance of Soil Structures to Consolida-tion" - CGJ, Vol. 2, No. 2.
Crisp, J. (1953) - Discussion on Schmertmann (1953) - Trans. ASCE, Vol. 120, p. 1228.
Davis, E. H. and Poulos, H. G. (1963) - "Triaxial Testing and Three-Dimensional Settlement Analysis" - Proc. 4th Aust.-N.Z. Conf. on Soil Mechanics, p. 233.
Davis, E. H. and Poulos, H. G. (1966) - "The Analysis of Settlement under Three-Dimensional Conditions" - Research Report No. R.65, Univ. of Sydney.
Davis, E. H. and Poulos, H. G. (1968) - "The Use of Elastic Theory for Settlement Prediction under Three-Dimensional Conditions" Geotechnique, Vol. 18, No. 1, p. 67.
Davis, E. H. and Raymond, G. P. (1965) - "A Non-linear Theory of Consolidation" - Geotechnique, Vol. 15, No. 2, p. 161.
Dawson, R. F. (1940) - "A Comparison between Results of Loading Tests, Settlement Analysis based on Consolidation Tests and Observed Settlements" - Proc. Purdue Conf. on Soil Mechanics and its Application.
Dawson, R. F. and Simpson, W. E. (1948) - "Settlement Records of Structures in Texas Gulf Coast Area" - Proc. 2nd ICSMFE, Rotterdam, Vol. 4, p. 125.
De Barros, S. T. (1966) - "Deflection Factor Charts for Two and Three Layer Systems" - HRR, No. 145, p. 83.
De Beer, E. E. (1963) - "The Scale Effects in the Transposition of the Results of Deep Sounding Tests on the Ultimate Bearing Capacity of Piles and Caisson Foundations" - Geotechnique, Vol. 13, No. 1.
Delory, F. A., Gass, A. A. and Wong, W. W. (1965) - "Measured Pore Pressures used for the Control of Two Stage Construction of an Embankment" - GCJ, Vol. 2, p. 216.
394.
De Wet, J. A. (1962) - "Three Dimensional Consolidation" - HRB. Bulletin No. 342, p. 152.
Eggestad,A.(1963) - "Deformation Measurements below a Model Footing on the Surface of a Dry Sand" - Proc. European Corif. on Settle-ment Problems, Wiesbaden, Vol. 1, p. 233.
Escario, V. and Uriel, S. (1961) - "Determining the Coefficient of Consolidation and Horizontal Permeability of Radial Drainage" - Proc. 5th ICSMFE, Vol. 1.
Fadum, R. E. (1948) - "Influence Values for Estimating Stresses in Elastic Foundations" - Proc. 2nd ICSMFE, Vol. 3, p. 77.
Fraser, A. M. (1957) - "The Influence of Stress Ratio on Compressi-bility and Pore Pressure Coefficients in Compacted Soils" -Ph.D. Thesis, University of London.
FrostiA.D.and Mason, J. (1963) - "Stag Place Development" - The Structural Engineer, Vol. 41, p. 347.
Fookes, P. (1966) - Letter to Geotechnique, Vol. 16, p. 261.
Fox, L. (1948) - "The Mean Elastic Settlement of a Uniformly Loaded Area at a Depth below Ground Surface" - Proc. 2nd ICSMFE, Rotterdam, Vol. 1, p. 129.
Geresvanoff, N. (1936) - "Improved Methods of Consolidation Tests and Determination of the Capillary Pressure in Soils" - Proc. 1st ICSMFE, Vol. 1, p. 47-50.
Gibson, R. E. (1958) - "The Progress of Consolidation in a Clay Layer increasing in Thickness with Time" - Geotechnique, vol. 8, No. 4.
Gibson, R. E. (1963) - "An Analysis of System Flexibility and its Effect on Time Lag in Pore Water Pressure Measurements" -Geotechnique, Vol. 13, No. 1:
Gibson, R. E. (1967) - "Some Results Concerning Displacements and Stresses in Non-homogeneous Elastic Half Space" - Geotechnique, Vol. 17, No. 1.
Gibson, R. E. (1968) - Better to Geotechnique, Vol. 18, No. 2.
Gibson, R. E. and Lumb, P. E. (1953) - "Numerical Solutions to Some Problems in the Consolidation of Clay" - Proc. ICE, Vol. 2, pt. 1, p. 182.
395.
Gibson, R. E. and McNamee, J. (1957) - "The Consolidation Settlement of a Load Uniformly Distributed over a Rectangular Area" - Proc. 4th ICSMFE, Vol. 1, p. 297.
Gibson, R. E. and McNamee, J. (1960)'- "Plane Strain and Axi-symmetric Problems of the Consolidation of a Semi-Infinite Clay Stratum" - Qtly. J. of Mech. and App. Maths, Vol. 13, p. 210.
Gibson, R. E. and McNamee, J. (1963) - "A Three-Dimensional Problem of the Consolidation of a Sea-Infinite Clay Stratum" - Qtly. J. of Mech.-and Appl. Maths, Vol. 16, p. 115.
Gibson, R. E., Hussey, G. L. and England, M. J. L. (1967) - "The Theory of One-Dimensional Consolidation of Saturated Clays" -Geotechnique, Vol. 17, No. 3.
Gibson, R. E. and Marsland, A. (1960) - "Pore Water Pressure Observa-tions in a Saturated Alluvial Deposit beneath a Loaded Oil Rink" - Conf. on Pore Pressure and Suction in Soils, Butterworths, London.
Golecki, J. (1959) - "On the Foundation of the Theory of Elasticity of Plane Incompressible Non-homogeneous Bodies" - Proc. IUTAM Symposium, Pergamon Press.
Gray, H. (1945) - "Simultaneous Consolidation of Contiguous Layers of unlike Compressible Soils" - Trans. ASCE, Vol. 110, p. 1327.
Hantal, W. S. (1950) - "Settlement Studies in Egypt" - Geotechnique, Vol. 2, p. 33.
Hanna, W. S. (1953) - "Settlement of Buildings on Pre-Consolidated Clay Layers" - Proc. 3rd ICSMFE, Zurich, Vol. 1, p. 366.
Hansbo, S. (1960) - "Consolidation of Clay Layers with Special Reference to the Influence of Vertical Sand Drains" - Royal Swedish Geo. Inst., Proc. No. 18.
Hansen, J. B. and Misi, T. (1961) - "An Empirical Evaluation of Consolidation Tests with Little Belt Clay" - Danish Geo. Institute, Bull. No. 17.
Hardy, R. M. and Ripley, C. F. (1961) - "Horizontal Movements Assoc-iated with Vertical Settlements" - Proc. 5th ICSNFE, Paris, Vol. 1, p. 665.
396.
Harr, M. (1966) - "Foundations of Theoretical Soil Mechanics" -McGraw-Hill, New York.
Haythornthwaite, R. M. (1960) - "The Shear Strength of Saturated Remoulded Clays" - "Plasticity", Pergamon Press, New York.
Helendlund, K. V. (1953) - "Settlement Observations in Finland" -Proc. 3rd ICSMFE, Zurich, Vol. 1, p. 370.
Hendron, A. J. (9163) - "The Behaviour of Sand in One-Dimensional Compression," - Tech. Report No. RTD-TDR-63-3089: USAF.
Henkel, D. J. (1958) - "The Correlation between Deformation, Pore Water Pressure and Strength Characteristics of Saturated Clay" - Ph.D. Thesis, University of London.
Henkel, D. J. (9160) - "The Shear Strength of Saturated Remoulded Clays" - Proc. Res. Conf. on Shear Strength of Cohesive Soils, Boulder, p. 533.
Henkel, D. J. (1960a) - "The Relationships between Effectit.e Stresses and Water Content in Saturated Clays" - Geotechnique, vol. 10, No. 1.
Henkel, D. J. and Sowa, V. A. (1963) - "The Influence of Stress History on Stress Paths in Undrained Triaxial Teats on Clay" - ASTM, STP No. 361.
Henkel, D. J. and Wade, N. H. (1966) - "Plane Strain Tests on Saturated Remoulded Clay" - J. ASCE SMFD, Vol. 92, SM 6, p. 67.
Hooper, J. A. and Butler (1966) - "Some Numerical Results Concerning the Shear Strength of London Clay" - Geotechnique, Vol. 16, No. 4.
Hruban, K. (1948) - "Sources of Error in Settlement Estimates" - Proc. And ICSMFE, Rotterdam, Vol. 1, p. 127.
Hruban, K. (1959) - "The Basic Problem of a Non-Linear and a Non-Homogeneous Half Space" - Non-Homogeneity in Elasticity and Plasticity, Pergamon Press.
Hvorslev, M. J. (1937) - "Uber die festigkeitsei-genschaften gesttirter bindiger &Men" - Ingeniorvidenskabelige Skrifter A.No. 45, Copenhagen.
Hvorslev, M. J. (1960) - "Physical Components of the Shear Strength of Saturated Clays" - Res. Conf. on Shear Strength of Cohesive Soils, Boulder, p. 169.
397.
Huang, Y. H. (1968) - "Stresses and Displacements in Non-Linear Soil Medium" - J. ASCE SMFD, Vol. 94, SM 1.
Jackson, W. Y. (1964) - "Stress Paths and Strains in Saturated Clay" - M.Sc. Thesis, M.I.T., unpublished.
Jakobson, B. (1957) - "Some Fundamental Properties of Sand" - Proc. 4th ICSMFE, London, Vol. 1, p. 167.
Janbu, N. Bjerrum, L. and Kjaernsli, B. (1964) - "Soil Mechanics Applied to Some Engineering Problems" - (in Norwegian) : N.G.I. Pub. No. 16.
Jahnke and Emde (1943) - "Tables of Functions".
Jones, A. (1962) - "Table of Stresses in Three-Layer Elastic Systems" H.R.B. Bulletin, No. 342.
de Josselyn de Jong, J. (1957) - "Application of Stress Functions to Consolidation Problems" - Proc. 4th ICSMFE, London, Vol. 1, p. 320.
Jurgenson, L. (1934) - "Application of Theories of Elasticity and Plasticity to Foundation Problems" - J. Boston Soc. of Civil Eng., Vol. 21, No. 3.
Kenney, T. C. (1967) - "Field Measurements of in-situ Stresses in Quick Clays" - Proc. Geo. Conf., Oslo, Vol. 1, p. 49.
Kerisel, J. and Quatre, M. (1968) - "Settlement Under Foundations - Calculations using Triaxial Apparatus" - Civil Eng. and Public Works Review : Part I (May 1968) and Part II (June 1968).
Kirk, J. M. (1966) - "Tables of Radial Stresses in Top Layer of Three Layer Elastic Systems at Distance from Load Axis" - H.R.R. No. 145, (H.R.B.)
Kirkpatrick, W. M. (1957) - "The Condition of Failure of Sands" - Proc. 4th ICSMFE, London, Vol. 1, p. 172.
Kjellman, W. (1936) - "Report on an Apparatus for Consummate Investiga-tions of the Mechanical Properties of Soils" - Proc. 4th ICSMFE, London, Vol. 2, p. 16.
Kjellman, W. and Jakobson, B. (1955) - "Some Relations between Stress and Strain in Coarse Grained Cohesionless Materials" - Proc. Roy. Swedish Geo. Inst. No. 9.
398.
KlBhn, E. J. (1965) - "The Elastic Properties of a Dense Glacial Fill Deposit" - CGJ., May 1965.
Ko, H. Y. and Scott, R. F. (1967) - "A New Soil Testing Apparatus" - Geotechnique, Vol. 17, p. 210.
Korenov,B. G. (1957) - "A Die Resting on an Elastic Half Space, the Modulus of Elasticity of which is an Exponential Function of Depth" - Dokl. Akad. Nank S.S.R., Vol. 112.
Ladd, C. C. (1964) - "Stress-strain Modulus of Clay in Undrained Shear" - J. ASCE SMFD, Vol. 90, SM 5.
Ladd, C. C. (996) - "Stress Strain Behaviour of Anisotropically Consolidated Soil during Undrained Shear" - Proc. 6th ICSMFE, Montreal, Vol. 1, p. 282.
Ladd, C. C. and Lambe, T. W. (1963) - "The Strength of 'Undisturbed' Clay Determined from Undrained Tests" - ASTM STP 361.
Lambe, T. W. (1961) - "Residual Pore Pressures in a Compacted Clay" - Proc. 5th ICSMFE, Paris, Vol. 1, p. 207.
Lambe, T. W. (1962) - "Pore Pressures in a Foundation Clay" - J. ASCE SMFD, Vol. 88, No. SM 2.
Lambe, T. W. (1964) - "Methods of Estimating Settlement" - J. ASCE SMFD, Vol. 90, SM 5.
Lambe, T. W. and Horn, H. M. (1965) - "The Influence on an Adjacent Building of Pile Driving for the M.I.T. Materials Centre" - Proc. 6th ICSMFE, Vol. 2, p. 280.
Lambe, T. W. (1965) - "Contribution to Discussions" - Proc. 6th ICSMFE, Montreal, Vol. 3, p. 355.
Lambe, T. W. (1967) - "The Stress Path Method" - J. ASCE SMFD, Vol. 93, SM 6.
Langer, K. (1936) - "The Influence of the Speed of Loading on the Pressure Void Ratio Diagram of Undisturbed Samples" - Proc. 1st ICSMFE, Cambridge, Mass., Vol. 2, p. 116.
Lee, K. L. and Farhoomand, T. (1967) - "Compressibility and Crushing of Granular Soil in Anisotropic Triaxial Compression" - CGJ., Vol. 4, No. 1.
399•
Lekhnitskii, S. G. (1962) - "Radial Distribution of Stresses in a hedge and in a Half Plane with Variable Modulus of Elasticity" - PMM, Vol. 26, No. 1.
Lemcoe, M. M. (1961) - "Stresses in Layered Elastic Solids" - Trans. ASCE, Vol. 126, p. 194.
Leonards, G. and Altschaeffl, A. G. (1964) - "Compressibility of Clays" - J. ASCE SMFD, Vol. 90, SM 5.
LeoKlards, G. and Ramiah, B. K. (1959) - "Time Effects in the Consolida-tion of Clays" - ASTM, Spl. Tech. Pub. No. 254.
Lewis, W. A. (1950) - "An Investigation of the Consolidation Test for Soils" - DSIR, Road Research Lab. Note No. RN/1349/WAL.
Lewis, W. A. (1963) - "The Effect of Vertical Sand Drains on the Settlement of a Road Embankment on the Thames Estuary" - Proc. European Conf. on Settlement, Wiesbaden, Vol. 1, p. 359.
Lo, K. Y. (1961) - "Stress Strain Relationships and Pore Water Pressure Characteristics of a Normally Consolidated Clay" - Proc. 5th ICSMFE, Paris, Vol. 1, p. 223.
Love, A. E. H. (1928) - "The Stress Produced in a Seipi-Infinite Solid by Pressure on part of the Boundary" - Phil. Trans. of the Roy. Soc., Series A, Vol. 228, p. 377.
Lowe, J., Zaccheo, P. F. and Feldman, H. S. (1964) - "Consolidation Testing with Back Pressure" - J. ASCE SMFD, Vol. 90, SM 4.
Lovenbury, H. T. (1968) - "Creep Characteristics of London Clay" -Ph.D. Thesis, University of London.
McKinley, D. G. (1961) - "A Laboratory Study of Rates of Consolidation in Clays with Special Reference to Conditions of Radial Pore Water Drainage" - Proc. 5th ICSMFE, Paris, Vol. 1.
Measor, E. 0. and Williams, G. M. J. (1962) - "Features in the Design and Construction of the Shell Centre, London" - Proc. ICE, Vol. 21, p. 475.
Meyerhoff, G. G. (1956) - Discussion of Ref. Skempton and McDonald, 1955 - Proc. ICE, Part 1, Vol. 5, P. 170.
Miller, R. J. and Low, P. F. (1963) - "Threshold Gradient for Water Flow in Clay Systems" - Proc. Soil Science Soc. of America;. Madison, Wis., Vol. 27, No. 6, p. 605.
400.
Mitchell, J. K. (1964) - "Shearing Resistance of Soil as a Rate Process" - J. ASCE SMFD, Vol. 90, SM 1.
Mitchell, J. K. and Campanella, R. G. (1968) - "Influence of Tempera-ture Variations on. Soil Behaviour" - J. ASCE SMFD, Vol. 94, SM 3.
Moretto, 0. (1965) - General Report on "Shear Strength and Consolida-tion" - Proc. 6th ICSMFE, Montreal, Vol. 3, p. 220.
Nakase, A. (1963) - "Side Friction in Conventional Consolidation Tests" - Report No. 3 : Port and Harbour Tech. Res. Inst., Japan.
Narain, J. and Singh, B. (1967) - "Role of Temperature in Triaxial Testing" - Proc. S.E. Asian Regional Conf. on Soil Eng., Bangkok, P. 103.
Newmark, N. M. (1942) - "Influence Charts for Computation of Stresses in Elastic Foundations" - Circular No. 24, Eng. Exp. Stn. Univ. of Illinois.
Nitchiporovitch, A. A. (1957) - "Results of Field Observation of Settlements of Large Hydraulic Struttures" - Proc. 4th ICSMIE, London, Vol. 1, p. 387.
Nooramy, I. and See, H. B. (1965) - "In-Situ Strength Characteristics of Soft Clays" - J. ASCE SMFD, Vol. 91, SM 2.
Northey, R. D. (1956) - "Rapid Consolidation Tests for Routine In-vestigation" - Proc. 2nd Aust. N.Z. Conf. on SMFE, Christchurch, p. 20.
Northey, R. D. and Thomas, R. F. (1965) - "Consolidation Test Pore Pressures" - Proc. 6th ICSMFE, Montreal, Vol. 1, p. 323.
Odenstad,S.(1949)- Geotechnique, Vol. 1, p. 242.
Osterman,J.and Lindskog,G.(1963) - "Influence of Lateral Movement in Clay upon Settlement in Some Test Areas" - Proc. Europ. Conf. on Settlement, Wiesbaden, Vol. 1, p. 137.
Paaswell, R. E. (1967) - "Temperature Effect on Clay Consolidation" -J. ASCE SMFD, Vol. 93, SM 3.
Parry, R. H. G. (1956) - "Strength and Deformation of Clay" T. Ph.D. Thesis, University of London.
401.
Parry, R. H. G. (196'0 - "Field and Laboratory Behaviour of Lightly Over-Consolidated Clay" - Geotechnique, Vol. 18, No. 2.
Peattie, K. R. (1962) - "Stress and Strain Factors for Three Layer Systems" - HRB Bulletin No. 342.
Peck, R. B. and Uyanik, M. E. (1955) - "Observed and Computed Settle-ment of Structures in Chicago" - Univ. of Illinois, Eng. Expt. Stn., Bulletin No. 24.
Peterson, R. (1954) - "Studies of Bearpaw Shale at a Dam Site in Saskatchewan" - Proc. ASCE SMFD, Vol. 80, Separate No. 476.
Peterson, R. (1958) - "Rebound in Bearpaw Shale in Western Canada" -Bull. Geol. Soc. of America, Vol. 69, p. 1113.
Phukan, A. L. T. (1968) - "Non-Linear Deformation of Rocks" - Ph.D. Thesis, University of London.
Pickett, G. (1938) - "Stress Distribution in a Layered Soil with Some Rigid Boundaries" - Proc. HRB, Vol. 18, Part 2, 1938.
Plantelpa. . (1953) - "Soil Pressure Measurements during Loading Tests on a Runway" - Proc. 3rd ICSMFE, Zurich, Vol. 1, p. 289.
Poulos, S. G. (1964) - "Control of Leakage in the Triaxial Test" - Harvard Soil Mechanics Series No. 71, Cambridge, Mass.
Poulos, H. G. (1967) - "Stresses and Displacements in an Elastic Layer Underlain by Rough Rigid Base" - Geotechnique, Vol. 17, No. 4.
Raymond, G. P. (1965) - "Contribution to Discussions" - CGJ, Vol. 2, p. 101.
Rendulic, L. (193) - "Der Hydrodynamische Spannungsansgleich in Zentral entwasserten Tozylindern" Wasserwitschaft und Teknik, Vienna, Vol. 2.
Rendulic, L. (1936) - 'Discussion of "Relation between Void Ratio and Effective Principal Stresses for Remoulded Silty Clay" - Proc. leb ICSMFE, Cambridge, Mass., Vol. 3, p.
Rendulic, L. (1937) - "Ein grundgesetz der tonmechanik und sein experimentaller beweis" - Bauingenieur, Vol. 18, p. 459.
1+02.
Resendiz, D., Nieto, J. A. and Figueroa, J. (1967) - "The Elastic Properties of Saturated Clays from Field and Laboratory Measure-ments" - Proc. 3rd PANAM. Conf. on S.M., Mexico, Vol. 1, p. 443.
Richart, F. E. (1957) - "A Review of Theories for Sand Drains" -J. ASCE SMFD.
Richardson, A. M. and Whitman, P. (1963) - "Effect of Strain Rate upon undrained Shear Resistance of a Saturated Remoulded Fat Clay" - Geotechnique, Vol. 13, No. 2.
Rivard, P. J. and Kohuska, A. (1965) - "Shehmouth Dam Test Fill" ON
CGJ., Vol. 2, p. 198.
Roberts, J. E. and De Souza, J. M. (1958) - "The Compressibility of Sand" - Proc. ASTM, Vol. 58, p. 1269.
Roscoe, K. A., Seoffield, A. N. and Wroth, C. P. (1958) - "On the Yielding of Soils" - Geotechnique, Vol. 8, No. 1.
Rowe, P. W. (1958) - "Contributions to Discussion" - Brussels Conf. on Earth Pressure Problems, Vol. 3.
Rowe, P. W. (1959) - "The Measurement of Coefficients of Consolidation of Lacustrine Clay" - Geotechnique, Vol. 9, No. 3.
Rowe, P. W. (1964) - "The Calculation of the Consolidation Rates of Laminated, Varved or Layered Clays, with particular Reference to Sand Drains" - Geotechnique, Vol. 14, No. 4.
Rowe, P. W. (1968) - "The Influence of Geological features of Clay Deposits on the Design and Performance of Sand Drains" - Proc. ICE, Paper No. 7058 S (Supp. Vol. 1968).
Rowe, P. W. and Barden, L. (1966) - "A New Consolidation Cell" -Geotechnique, Vol. 16, p. 162.
Rutledge, P. L. (1947) - "Relation of Undisturbed Sampling to Laboratory Testing" - Trans. ASCE, Vol. 109, p. 1155.
Schiffman, R. L. (1958) - "Consolidation of Soil under Time Dependent Loading and Varying Permeability" - Proc. HRB, Vol. 37, p. 584.
Schiffman, R. L. and Gibson, R. E. (1964) - "The Consolidation of Non-Homogeneous Clay Layers" - J. ASCE SMFD, Vol. 90, SM 5.
403.
Schmertmann, J. M. (1953) - "Estimating the Time-Consolidation Be- haviour-of Clay from Laboratory Test Results" - Proc. ASCE, Separate No. 311.
Schmidt, B. (1967) - "Lateral Stresses in Uniaxial Strain" - Danish Geo. Institute, Bulletin, No. 23.
Schmidt, B. (1966) - Discussion on Brooker and Ireland, 1965 CGJ, Vol. 3, p. 239.
Scott, R. F. (1963) - "Principles of Soil Mechanics" - Addison-Wesley, Boston.
Seed, H. B. (1965) - "Settlement Analysis - A Review of Theory and Testing Procedures" - J. ASCE SMFD, Vol. 91, SM 2.
Seed, H. B. and Chan (1959) - "Structure and Strength Character- istics of Compacted Clays" - Proc. ASCE SMFD, Vol. 85, SM 5.
Selby, S. M. and Girling, B. (1965) (Ed.) - "Standard Mathematical Tables" - The Chemical Rubber Co., Cleveland.
Siorota, S. and Jennings, R. A. J. (1959) - "The Elastic Heave of the Bottom of Excavation" - Geotechnique, Vol. 9, p. 62.
Sherlock, R. L. (1962) - "British Regional Geology - London and Thames Valley" - Geol. Survey, 3rd Ed., HMSO.
Sherman, D. I. (1959) - "On the Problem of Plane Strain in Non-Homogeneous Media" - Non-Homogeneity in Elasticity and Plasticity, Pergamon Press.
Sheppard,G. and A3rien,L. (1957) - "The Usk Scheme for the Water Supply of Swansea" - Proc. ICE, Vol. 7, p. 240.
Shields,D.and Rowe, P. W. (1965) - "Radial Drainage Oedometer for Laminated Clays" - J. ASCE SMFD, Vol. 91, SM 1.
Shibata, T. and Karbbe, D. (1965) - "Influence of the Variation of the Intermediate Principal Stress on the Mechanical Properties of Normally Consolidated Clays" - Proc. 6th ICSMFE, Montreal, Vol. 1, P. 359.
Simons, N. E. (1957) - "Settlement Studies of Two Structures in Norway" - Proc. 4th ICSMFE, London, Vol. 2, p. 13.
4o4.
Simons, N. E. (1958) - "Contribution to Discussion" - Brussels Conf. on Earth Pressure Problems, Vol. 3, P. 50.
Simons, N. E. (1960a) - "Comprehensive Investigation of the Shear Strength of Undisturbed Drammen Clay" - Proc. Res. Conf. on Shear Strength of Cohesive Soils, Boulder, p. 727.
Simons, N. E. (1960b) - "The Effect of Over-Consolidation on the Shear Strength Characteristics of Undisturbed Oslo Clay" - Ibid, p. 747.
Simons, N. E. (1963) - "Settlement Studies of an Apartment Building in Oslo" - Proc. European Conf. on Settlement Problems, Vol. 1, p. 179.
Simons, N. E. (1965) - "Consolidation Investigation of Undisturbed Fornebu Clay" - N.G.I. Publication No. 62.
Sinclaire, S. R. and Brooker, E. W. (1967) - "The Shear Strength of Edmonton Shale" - Proc. Geo. Conf. Oslo, Vol. 1, p. 295.
Skempton, A. W. (1948) - "The Rate of Softening in Stiff Fissured Clays with Special Reference to London Clay" - Proc. 2nd ICSMFE, Rotterdam, Vol. 2, p. 50.
Skempton, A. W. (1948a) - "The Effective Stresses in Saturated Clays Strained at Constant Volume" - Proc. 7th Int. Cong. on Appl. Mech., Vol. 1, p. 378.
Skempton, A. W. (1951) - "The Bearing Capacity of Clays" - Building Res. Congress.
Skempton, A. W. (1954) - "The Pore Pressure Coefficients A and B" - Geotechnique, Vol. 4, p. 143.
Skempton, A. W. (1959) - Letter to Geotechnique, Vol. 9, p. 145.
Skempton, A. W. (1960a) - Letter to Geotechnique, Vol. 10, No. 4.
Skempton, A.. W. (1960b) - "Terzaghi's Discovery of Effective Stress" - From Theory to Practice in Soil Mechanics, John Wiley & Sons.
Skempton, A. W. (1961) - "Horizontal Stresses in an Over-Consolidated Eocene Clay" - Proc. 5th ICSMFE, Paris, Vol. 1, p. 351.
Skempton, A. W. (1964) - "Long Term Stability of Clay Slopes" - 4th Rankine Lecture, Geotechnique, Vol. 14, No. 2.
405;
Skempton, A. W. and Bishop, A. W. (1954) - "Soils" - Chapter 10 of "Building Materials" - North Holland Publishing Co., Amsterdam.
Skempton, A. W. and Bjerrum, L. (1957) - "A Contribution to the Settle- ment Analysis of Foundations on Clay" - Geotechnique, Vol. 7, No. 4.
Skempton, A. W. and Henkel, D. J. (1957) - "Tests on London Clay from Deep Borings at Paddington, Victoria and South Bank" - Proc. 4th ICSMFE, London, Vol. 1, p. 100.
Skempton, A. W. and La Rochelle, P. (1965) - "The Bradwell Slip - A Short Term Failure in London Clay" - Geotechnique, Vol. 15, No.3.
Skempton, A. W. and McDonald, D. H. (1955) - "A Survey of Comparisons Between Calculated and Observed Settlements of Structures in Clay" - Proc. Conf. Corr. Calc. and Obs. Stresses and Displ. of Structures, ICE, Vol. 1, p. 318.
Skempton, A. W., Peck, R. B. and McDonald, D. H. (1955) - "Settlement Analysis of Six Structures in London and Chicago" - Proc. ICE, Vol. 4, Pt. 1, p. 525.
Skempton, A.14 and Sowa, V.(1963) during Sampling and Testing"
Skinner, A. E. (1967) - "Cobbins Dissipation Tests on London Partners, Nov. 1967.
- "Behaviour of Saturated Clays - Geotechnique, Vol. 13, No. 4.
Brook Reservoir - Pore Pressure Clay" Unpub. Report to Binnie and
Sowa, VS1963) - "A Comparison of Isotropic and Ani'sotropic Consolida-tion on the Shear Behaviour of a Clay" - Ph.D. Thesis, University of London.
Smith, C. K. and Redlinger, J. F. (1953) - "Soil Properties of Fort Union Clay Shale" - Proc. 3rd ICSMFE, Zurich, Vol. 1, p. 62.
Steffanof, G., 7latarev, K., Grantcharov, M. and Miley, G. (1965) -"Anticipated and Observed Settlement of a High Chimney" - Proc. 6th ICSMFE, Montreal, Vol. 2, p. 202.
Steinbrenner, W. (19 4) - "Tafeln zur Setzungbenechnung" Strasse, Vol. 1, p. 121.
Tan, S. B. (1968) - "Consolidation of Soft Clays with Special Refer-ence to Sand Drains" - Ph.D. Thesis, University of London.
406.
Taylor, D. W. (1942) - "Research on the Consolidation of Clays" -M.I.T. Report 82, Civil and Sanitary Eng. Department.
Taylor, D. W. (1948) - "Fundamentals of Soil Mechanics" - John Wiley and Sons.
Taylor, D. W. and Clough, R. H. (1951) - "Report on Research on Shearing Characteristics of Clay" - M.I.T. Report.
Terzaghi, K. (1925) - "Erdbaumechanik" - Deutiche, Vienna.
Terzaghi, K. (1929) - "Settlement of Buildings due to Progressive Consolidation of Individual Strata" - J. of Math. Physics, Vol. 8, p.26. See also Terzaghi, K., "Settlement Analysis" - World Eng. Congress (Tokyo, 1929), Vol. 8, Pt. 2, p. 1.
Terzaghi, K. (1933) - "Earths and Foundations'►-Progress Report of Special Committee - Proc. ASCE, Vol. 59, p. 1360, Discussion by Terzaghi, K., p. 1363.
Terzaghi, K. (1936) - "Stability of Slopes of Natural Clays" Proc. 1st ICSMFE, Vol. 1, p. 161.
Terzaghi, K. (1936a) - "Opening Discussion on 'Settlement of Structures'," - Proc. 1st ICSMFE, Cambridge, Mass., Vol. 3, P. 79.
Terzaghi, K. (1943) - "Theoretical Soil Mechanics" - John Wiley and Sons Inc.
Terzaghi, K. (1941) - "Undisturbed Clay Samples and Undisturbed Clays" - J. Boston Soc. of Civil Eng., Vol. 28, .No. 3.
Terzaghi, K. (1955) - "Evaluation of Coefficients of Subgrade Reaction" - Geotechnique, Vol. 5, p. 297.
Terzaghi, K. (1961) - "Discussion on Skempton 1961" - Proc. 5th ICSMFE, Paris, Vol. 3, p. 144.
Terzaghi, K. and Fv8lich (1936) - "Theorie der Setzung von Ton-schichten" Denticke, Vienna.
Terzaghi, I. and Peck, R. B. (1948) - "Soil Mechanics in Engineering Practice" - John Wiley and Sons.
Texeira, A. H. (1960) - "Case History of Building Underlain by Un-usual Conditions of Pre-Consolidated Clay Layers" - Proc. 1st Pan Am Conf. on S.M., Vol. 1, p. 201.
407.
Timoshenko, S. and Goodier, J.(1954) - "Theory of Elasticity" -McGraw Hill PubIiShing Co.
Timoshenko, S. (1955) - "Strength of Materials" - D. Van Norstand Co. Inc.
Toms, A. H. (1966) - "Errors in Soil Consolidation Presses" - Eng-ineering, 22nd July 1966.
Triaxial Shear Report (1947) - Waterways ExperimentSAation, Vicksburg, Miss., April 1947.
Tscheborarioff, G. P. (1952) - "Soil Mechanics, Foundations and Earth Structures" - McGraw Hill Publishing Co.
Turnbull, W. J., Maxwell, A. and Ahlvin, R. G. (1961) - "Stresses and Deflections in Homogeneous Soil Mass" - Proc. 5th ICSMFE, Paris, Vol. 2, p. 337.
Uyeshita, K. and Meyerhof, G. G. (1967) - "Deflections of Multi-Layered Soil System" - J. ASCE SMFD, Vol. 93, SM 5.
Vesic, A.B. (1963) - "The Validity of Layered Solid Theories for Flexible Pavements" - Proc. Int. Conf. on Str. Design of Asphalt Pavements, Univ. of Michigan, p. 283.
Vesic, A. B. and Barksdale, R. D. (1963) - "On Shear Strength of Sand at Very Hi Pressures" - ASTM STP No. 361, p. 301.
Vesic, A. B. and Clough, G. W. (1968) - "Behaviour of Granular Materials under High Pressures" - J. ASCE SMFD, Vol. 94, OM 3.
Wade, N. H. (1953) - "Plane Strain Failure Characteristics of Saturated Clay" - Ph.D. Thesis, University of London.
Ward, W. H., Saatels, S. G. and Butler, M. E. (1959) - "Further Studies of the Properties of London Clay" - Geotechnique, Vol. 9, No. 2.
Ward, W. H., Marsland, A. and Samuels, S. G. (1965) - "Studies of the Properties of Undisturbed London Clay at the Ashford Common Shaft" - In-situ and Immediate Strength Tests" - Geotechnique, Vol. 15, No. 3.
Waterways Expt. Station, Vicksburg (1953, 1954) - "Investigations of Pressures and Deflections for Flexible Pavements" - Report 3 (Sept. 1953), Report 4 (Dec. 1954).
408.
Webb, D. L. (1966) - "The Mechanical Properties of Undisturbed Samples of London Clay and Pierre Shale" - Ph.D. Thesis, Univ-ersity of London.
Whitman, R. V. and Miller, E. T. (1965) - "Yielding and Locking of Confined Sand" - J. ASCE SMFD, Vol. 91, SM 4.
Whitman, R. V., Richardson, A. M., and Healey, K. A. (1961) . "Time Lags in Pore Pressure Measurements" - Proc. 5th ICSMFE, Faris, Vol. 1, p. 407.
Williams, G. M. J. and Rutter, P. A. (1967) - "The Design of Two Buildings with Suspended Structures in High Yield Steel" - The Structural Engineer, Vol. 45, No. 4.
Wilson, G. H. and Grace, H. (1942) - "The Settlement of London due to Undordrainage of the London Clay" - J. ICE, Vol. 19, No. 2, p. 100.
Wilson, S. D. and Hancock, C.(1960) - "Horizontal Displacements in Clay Foundations" - Proc. 1st Pan Am, Conf. on SMFE., Vol. 1, p. 41.
Wood, C. C. (1958) - "Shear Strength and Volume Change Characteristics of Compacted Soil Under Conditions of Plane Strain" - Ph.D. Thesis, University of London.
Woodward, H. B. (1922) - "The Geology of the London Basin" - Memoirs of the Geol. Survey, 2nd Ed., HMSO.
Wooldridge,S.(1926) - "Structural Evolution of London Basin" - Proc. Geol. Ass., Vol. 37, p. 162.
Wooldridge, S. W. and Linton, D. L. (1955) - "Structure, Surface and Drainage in S.E. England" - George Philip and Son Ltd.
Winkler, E. (1867) - "Die Lehre von Elastizitat and Fostigteit" Prague, p. 182.
Wu, T. H. (1966) - "Soil Mechanics" - Allyn and Bacon Inc.
Wu, T. H., Loh, A. K. and Malvern, L. E. (1963) - "Study of the Failure Envleopocf Soils" - J. ASCE SMFD, Vol. 89, SM 1.
Yong, R. N. and Osier, J. C. (1965) - "Contribution to Discussion" - CGJ., Vol. 2, p. 229.
409.
Yu, T. M., Shu, W. Y. and Tong, Y. K. (1965) - "Settlement Analysis of Pile Foundations of Structures in Shanghai" - Proc. 5th ICSMFE., Montreal, Vol. 2, p. 356.
Zeevaert, L. (1953) - "Contribution to Discussions" - Proc. 3rd ICSMFE, Zurich, Vol. 3, p. 113.
Zeevaert, L. (1958) - "Consolidation of Mexico City Volcanic Clay" - Conf. on Soils for Eng. Purposes, ASTM STP 232.