The effect of silicon on strawberry plants and it’s role ...
231
The effect of silicon on strawberry plants and it’s role in reducing infection by Podosphaera aphanis Kaneez Fatema Thesis submitted in fulfilment of the requirements for the degree of Doctor of Philosophy University of Hertfordshire School of Life and Medical Sciences Department of Human and Environmental Sciences Hatfield, AL 10 9AB UK July 2014
Transcript of The effect of silicon on strawberry plants and it’s role ...

The effect of silicon on strawberry plants and it’s role in reducing infection by
Podosphaera aphanis
Kaneez Fatema
Thesis submitted in fulfilment of the requirements for the degree of
Doctor of Philosophy
University of Hertfordshire
School of Life and Medical Sciences Department of Human and Environmental Sciences
Hatfield, AL 10 9AB UK
July 2014

ii
Acknowledgements
I would like to thank all the people who have encouraged and supported me during this
period. In particular, I am very grateful to my supervisors, Dr. Avice Hall, and Dr. David
Naseby for their constant support, guidance and advice during the course of my PhD.
Their expertise in different areas has allowed me to develop a wide range of techniques
in the laboratory.
I would also like to acknowledge all the academic, technical staff and fellow PhD student
of the School of Life and Medical Sciences for creating the right atmosphere that enabled
the completion of these studies. I would like to thank Gidon Bahiri (King’s Lynn,
Norfolk) to supply Omex SW7 for this experiment and Andy and Helen Barker for
carrying out the spraying and special thanks goes to Harriet and Henry Duncafe
(Maltmas Farm) who gave extremely generously of their time and contributed
significantly to the success of this work and also providing runners and field trial
facilities,
I appreciate the financial support from Hall Charitable Trust and Charles Wallace
Bangladesh Trust, UK.
Finally, I would like to thank my husband Dr. Waliul Hoque Chowdhury for his support,
patience and encouragement and also my daughter Nahian Chowdhury and son Faiyaj
Chowdhury and my parents for their constant support and encouragement throughout
the duration of my PhD.

iii
Abstract
Podosphaera aphanis which causes powdery mildew of strawberry is of economic importance in strawberry production in United Kingdom as it affects yield and fruit quality. Silicon has been shown to reduce the severity of a number of plant diseases. In strawberry, the mechanism of suppression against powdery mildew remains uncertain. Therefore, it has been suggested that supplying silicon would help strawberry plants to absorb silicon and improve resistance against the pathogen. The silicon based wetter Omex SW7 was used and three different concentrations of silicon wetter were applied on the leaves of the strawberry plants (foliar application). Each treatment was applied at three different timings. Enhanced level of silicon was quantified by the Autoclave Induced Digestion (AID) method. Whilst the main study has used the variety Elsanta, other varieties have also been used. It was observed that the weekly application (total 5 sprays) of 3 different concentrations of Omex SW7 on leaves showed significantly (P<0.05) higher silicon concentrations compared to application 3 times in weeks 1, 3 and 5 or twice in weeks 1 and 5. Microscopic observations showed that weekly application of standard, high and very high concentrations of Omex SW7 significantly (P<0.05) increased the number and length of leaf hairs on both the upper and lower surfaces of strawberry leaves. The different varieties of strawberry used showed morphological changes in the leaves with regard to the density and length of leaf hairs. Untreated leaves from Rhapsody had no hairs on the upper leaf surface, but a low density of hairs was observed after treatment with the high concentration of Omex SW7.
In this study, Omex SW7, a silicon based wetter was applied to the roots of strawberry plants (root application) and silicon accumulation and physical changes in leaves were assessed. Strawberry variety Elsanta was used in this experiment. Results revealed that weekly application (total 5 applications) of 2 different concentrations (standard and high) of Omex SW7 to roots showed significantly (P<0.05) higher silicon concentrations compared to application 3 times in weeks 1, 3 and 5 or twice in weeks 1 and 5. It was found that the weekly application of two different concentrations of Omex SW7 showed significantly higher (P<0.05) leaf hair numbers and significantly (P<0.05) longer leaf hair length on both the upper and lower surfaces of leaves compared to application 3 times in weeks 1, 3 and 5 or twice in weeks 1 and 5.
The effect of foliar application of silicon and potassium carbonate to limit P. aphanis infection was examined in a field trial under polythene tunnel at Wisbech. Treatments were arranged in a randomised block design of 3 replicates. There were a total of 18 plots. There were six treatments and all treatments were applied to the strawberry variety Sonata. Results revealed that application of silicon based wetter Omex SW7 onto the leaf surface does result in accumulation of silicon in the leaves. The application of Omex SW7 has stimulated an increase in the number and length of leaf hairs in strawberry plants. Results showed that germinating ascospores and colonies were present in all plots before the trial was sprayed. Treatments with standard and high Omex SW7 significantly (P<0.05) reduced the number of germinating ascospores and colonies in this trial. However, Potassium carbonate alone gave some reduction in the number of colonies and germinating ascospores. Moreover, potassium carbonate mixed with silicon based wetter Omex SW7 significantly (P<0.05) reduced the number of germinating ascospores and colonies.

iv
List of Contents
Title Page
i
Acknowledgements
ii
Abstract
iii
List of contents
iv
List of Figures
xi
List of Tables
xviii
Appendix
xx
Chapter 1 General Introduction
1
1.1. Introduction
1
1.2. Literature Review
3
1.2.1. Strawberry Plant
3
1.2.2. Polythene tunnel production of strawberries
6
1.2.3. Strawberry cultivation methods
8
1.2.3.1. Varieties
8
1.2.3.2. Planting
10
1.2.3.3. Spacing
12
1.2.3.4. Watering/Irrigation
12
1.2.3.5. Continuing care
13
1.2.3.6. Polythene tunnel management
13
1.2.3.7. Fertilizer
15
1.2.3.8. Pollination
15
1.2.3.9. Harvesting
16
1.2.3.10. Pests and diseases in strawberry crops
16

v
1.2.4. Strawberry powdery mildew
18
1.2.4.1. Classification
18
1.2.4.2. Economic loss caused by powdery mildew
19
1.2.4.3. Symptoms of infection
20
1.2.4.4. Reproduction of powdery mildew
21
1.2.4.5. Environmental requirements of the fungus P. aphanis
26
1.2.4.5.1. Effect of temperature
26
1.2.4.5.2. Effect of humidity
27
1.2.5. Control of powdery mildew
28
1.2.5.1. Chemical control
28
1.2.5.2. Integrated control methods
29
1.2.5.3. Biocontrol agents to control powdery mildew
31
1.2.6. Role of silicon in plants
34
1.2.6.1. Silicon uptake in plants
35
1.2.6.2
Effects of silicon on plant growth and development 36
1.2.6.3. Silicon and disease resistance in plants
36
1.2.6.4. Effect of silicon on diseases caused by abiotic stresses
39
1.2.7. Leaf hairs
41
1.2.8. Silicon wetter Omex SW7
41
1.2.9. Potassium carbonate (K50)
42
1.3. Rationale, Aims and Objectives 42
1.3.1 Rationale 42
1.3.2. Hypothesis
43
1.3.3. Aims and Objectives
43

vi
1.3.3.1. 1.3.3.2.
Aim (overall aim) Objectives
43 43
Chapter 2
General Materials and Methods
44
2.1. Elsanta
44
2.2. Symphony
44
2.3. Florence
44
2.4. Rhapsody
44
2.5 Growing strawberry plants in the Glasshouse
45
2.6. Application of the treatments
46
2.7. Silicon determination
47
2.7.1. Determination of the standard curve 47
2.7.2. Methods for extraction of silicon from strawberry leaves
48
2.7.2.1.
Preparation of solutions 48
2.7.2.2.
Extraction of silicon from ground leaves 49
2.7.2.3.
Determination of silicon in the different treatments 50
2.8. Microscopic observation of density and length of leaf hairs
51
2.9. Data analysis
51
Chapter 3 An investigation of the effect of foliar application of silicon (Omex SW7) on strawberry plants in the glasshouse
52
3.1. Introduction
52
3.1.1.
Objectives 53
3.2. Materials and Methods
53
3.2.1. Pilot experiment
53
3.2.1.1. Application of the treatments 56

vii
3.2.1.2. Collection of leaves
56
3.2.2. Main experiment
57
3.2.2.1. Application of the treatments
57
3.2.2.2.
Collection of leaves
58
3.2.3. Main experiment (used different varieties)
61
3.2.3.1. Application of the treatments
61
3.2.3.2. Collection of leaves
64
3.2.4. Data analysis
65
3.3. Results
65
3.3.1. Pilot experiment in Hatfield Glasshouse
65
3.3.2. Main Experiment in Bayfordbury Glasshouse
68
3.3.3. Effect of timing on silicon concentrations in strawberry leaves
69
3.3.4. Effect of silicon on the density of leaf hairs
73
3.3.5 Relationship between the leaf hair numbers and accumulation of silicon
76
3.3.6. Effect of silicon on the length of leaf hairs
77
3.3.7.
Relationship between the length of leaf hairs and accumulation of silicon
79
3.3.8. Effect of treatments on accumulation of silicon in different strawberry varieties
80
3.3.9. Effect of silicon on the density of leaf hairs in different strawberry varieties
82
3.3.10.
Relationship between the leaf hair numbers and accumulation of silicon (different varieties)
84
3.3.11. Effect of silicon on the length of leaf hairs in different strawberry
varieties
85
3.3.12. Relationship between the length of leaf hairs and accumulation of silicon (different varieties)
87

viii
3.4. Discussion
88
Chapter 4 An Investigation of the effect of root application of silicon (Omex SW7) on strawberry plants in the glasshouse
94
4.1. Introduction
94
4.1.1.
Objectives 96
4.2. Materials and Methods
96
4.2.1. Plant material and growth
96
4.2.2. 4.2.3.
Experimental design of the silicon treatments Application of the treatments
97 98
4.2.4.
Collection of leaves
100
4.2.5.
Data analysis 100
4.3.
Results 101
4.3.1. Effect of treatments on silicon concentrations in strawberry leaves (silicon wetter Omex SW7 was applied to roots)
101
4.3.2. Effect of timing on silicon accumulation in strawberry leaves
102
4.3.3. Effect of silicon on the density of leaf hairs
104
4.3.4.
Relationship between the leaf hair numbers and accumulation of silicon
106
4.3.5. Effect of silicon on the length of leaf hairs
107
4.3.6.
Relationship between the length of leaf hairs and accumulation of silicon
109
4.3.7. Comparison between foliar and root applications of Omex SW7 on strawberry plants
111
4.3.8. Comparison and effect of foliar and root applications of silicon on the density of leaf hairs (upper surface)
114
4.3.9. Comparison and effect of foliar and root applications of silicon on the density of leaf hairs (lower surface)
116

ix
4.3.10. Comparison and effect of foliar and root applications of silicon on
the length of leaf hairs (upper surface)
119
4.3.11. Comparison and effect of foliar and root applications of silicon on the length of leaf hairs (lower surface)
121
4.4. Discussion
123
Chapter 5 A study of the role of a silicon wetter (Omex SW7) in the control of strawberry powdery mildew in a field trial
128
5.1. Introduction
128
5.1.1.
Objectives 130
5.2. Materials and Methods
130
5.2.1.
Sonata 130
52.2. Experimental design of the field trial
131
5.2.3. Microscopic assessment of P. aphanis from trial
135
5.2.4. Microscopic observation of leaf hair length and density
136
5.2.5. Silicon determination
136
5.2.6. Data analysis
137
5.3. Results
137
5.3.1. Assessment of P. aphanis in field trial
137
5.3.2. Effect of silicon on the density of leaf hairs
141
5.3.3.
Relationship between the leaf hair numbers and the number of germinating ascospores
143
5.3.4.
Relationship between the leaf hair numbers and the number of colonies
144
5.3.5. Effect of silicon on the length of leaf hairs
145
5.3.6.
Relationship between the length of leaf hairs and the number of germinating ascospores
146

x
5.3.7.
Relationship between the length of leaf hairs and the number of colonies
147
5.3.8. Concentrations of silicon in leaves
148
5.3.9. Relationship between concentrations of silicon and the number of germinating ascospores
150
5.3.10. Relationship between concentrations of silicon and the number of colonies
151
5.3.11. Relationship between the number of leaf hairs and concentrations of silicon
151
5.3.12 Relationship between the length of leaf hairs and concentrations of silicon
152
5.4. Discussion 153
Chapter 6
General Discussion and Conclusions
161
6.1. Discussion and conclusions
161
6.2. Future Work
172
References
175

xi
List of Figures
Figure 1 Diagram of a strawberry plant
4
Figure 2 Diagram of a strawberry plant and daughter plant
5
Figure 3A Different parts of a strawberry flower and strawberry fruit
6
Figure 3B Floral diagram for strawberry
6
Figure 4 Strawberry plants under polythene tunnel
7
Figure 5 Diagram show the relationship between harvesting and crop cover use polythene tunnels
9
Figure 6A Preparing raised bed for planting
11
Figure 6B Planting in raised bed
11
Figure 6C Plants grown in bags filled with peat placed on raised bed
12
Figure 7A Tunnel with the polythene sheet pulled down
14
Figure 7B Tunnel with the polythene sheet pushed up
14
Figure 7C Maximum and minimum thermometer in the raised bed, under polythene tunnel
15
Figure 8 Symptoms of strawberry powdery mildew
20
Figure 9 Life cycle of powdery mildew of strawberry caused by Podosphaera aphanis
22
Figure 10 Different stages of asexual life cycle of Podosphaera aphanis
23
Figure 11 Chasmothecia on strawberry leaf
24
Figure12 Beneficial effects of silicon on plant growth in relation to biotic and abiotic stresses
39
Figure 13 Growing strawberry plants on the capillarity bench in the glasshouse
45
Figure 14 Example of a standard curve
47
Figure 15 Concentrations of silicon in strawberry leaves (variety Elsanta) sprayed weekly and weeks 1 and 5 with different concentrations (standard and high) of silicon wetter
66

xii
Figure 16 Concentrations of silicon in strawberry leaves (variety Elsanta)
sprayed weekly with different concentrations (standard, high, and very high) of silicon wetter
69
Figure 17 Concentrations of silicon in strawberry (variety Elsanta) leaves treated weekly, weeks 1 and 5 and weeks 1, 3 and 5 with different concentrations (standard, high and very high) of silicon wetter
71
Figure 18A
Number of leaf hairs on the upper surface i) without silicon treatment ii) with silicon (standard) treatment and on the lower surface i) without silicon treatment ii) with silicon (standard) treatment. Leaves were examined under the dissection microscope (X30)
73
Figure 18B Number of leaf hairs on the upper surface of leaves in strawberry variety Elsanta sprayed weekly, weeks 1 and 5 and weeks 1, 3 and 5 with different concentrations (standard, high and very high) of silicon wetter
74
Figure 19 Number of leaf hairs on the lower surface of leaves in strawberry variety Elsanta sprayed weekly, weeks 1 and 5 and weeks 1, 3 and 5 with different concentrations (standard, high and very high) of silicon wetter
75
Figure 20
Relationship between concentrations of silicon and average number of leaf hairs on the upper surface of the leaves (variety Elsanta)
76
Figure 21
Relationship between concentrations of silicon and average number of leaf hairs on the lower surface of the leaves (variety Elsanta)
77
Figure 22 Length of leaf hairs on the upper surface of leaves (variety Elsanta) sprayed weekly, weeks 1 and 5 and weeks 1, 3 and 5 with different concentrations (standard, high and very high) of silicon wetter
78
Figure 23 Length of leaf hairs on the lower surface of leaves (variety Elsanta) sprayed weekly, weeks 1 and 5 and weeks 1, 3 and 5 with different concentrations (standard, high and very high) of silicon wetter
78
Figure 24
Relationship between concentrations of silicon and average length of leaf hairs on the upper surface of the leaves (variety Elsanta)
79
Figure 25
Relationship between concentrations of silicon and average length of leaf hairs on the lower surface of the leaves (variety Elsanta)
80
Figure 26 Concentrations of silicon in strawberry leaves in different varieties sprayed weekly with different concentrations (standard and high)
81

xiii
of silicon wetter
Figure 27 Number of leaf hairs on the upper surface of leaves in different strawberry varieties sprayed weekly with different concentrations (standard and high) of silicon wetter.
83
Figure 28 Number of leaf hairs on the lower surface of leaves in different strawberry varieties sprayed weekly with different concentrations (standard and high) of silicon wetter
84
Figur 29 Length of leaf hairs on the upper surface of leaves in different strawberry varieties sprayed weekly with different concentrations (standard and high) of silicon wetter
86
Figure 30 Length of leaf hairs on the lower surface of leaves in different strawberry varieties sprayed weekly with different concentrations (standard and high) of silicon wetter
87
Figure 31 Concentrations of silicon in strawberry (variety Elsanta) leaves treated weekly, weeks 1 and 5 and weeks 1, 3 and 5 with different concentrations (standard and high) of silicon wetter, which were applied to roots
101
Figure 32 Number of leaf hairs on the upper surface of leaves in the strawberry variety Elsanta treated weekly, weeks 1 and 5 and weeks 1, 3 and 5 with different concentrations (standard and high) of silicon wetter, which were applied to roots
105
Figure 33 Number of leaf hairs on the lower surface of leaves in the strawberry variety Elsanta treated weekly, weeks 1 and 5 and weeks 1, 3 and 5 with different concentrations (standard, high) of silicon wetter, which were applied to roots
106
Figure 34
Relationship between concentrations of silicon and average number of leaf hairs on the upper surface of the leaves (variety Elsanta)
107
Figure 35
Relationship between concentrations of silicon and average number of leaf hairs on the lower surface of the leaves (variety Elsanta
107
Figure 36 Length of leaf hairs on the upper surface of leaves in the strawberry
variety Elsanta treated weekly, weeks 1 and 5 and weeks 1, 3 and 5 with different concentrations (standard and high) of silicon wetter, which were applied to roots
108
Figure 37 Length of leaf hairs on the lower surface of leaves in the strawberry variety Elsanta treated weekly, weeks 1 and 5 and weeks 1, 3 and 5
109

xiv
with different concentrations (standard and high) of silicon wetter, which were applied to roots
Figure 38
Relationship between concentrations of silicon and average length of leaf hairs on the upper surface of the leaves (variety Elsanta)
110
Figure 39 Relationship between concentrations of silicon and average length of leaf hairs on the lower surface of the leaves (variety Elsanta)
110
Figure 40(A-B) Comparison of silicon concentrations in strawberry leaves (variety Elsanta) after being treated weekly with (A) standard concentration of Omex SW7 to leaves (Standard F) and roots (Standard R) and (B) high concentration of Omex SW7 to leaves (High F) and roots (High R).
112
Figure 41(A-B) Comparison of silicon concentrations in strawberry leaves (variety Elsanta) after being treated in weeks 1, 3 and 5 with (A) standard concentration of Omex SW7 to leaves (Standard F) and roots (Standard R) and (B) high concentration of Omex SW7 to leaves (High F) and roots (High R).
112
Figure 42(A-B) Comparison of silicon concentrations in strawberry leaves (variety Elsanta) after being treated in weeks 1 and 5 with (A) standard concentration of Omex SW7 to leaves (Standard F) and roots (Standard R) and (B) high concentration of Omex SW7 to leaves (High F) and roots (High R).
113
Figure 43(A-B) Comparison of leaf hair numbers on the upper surface of strawberry leaves (variety Elsanta) after being treated weekly with (A) standard concentration of Omex SW7 to leaves (Standard F) and roots (Standard R) and (B) high concentration of Omex SW7 to leaves (High F) and roots (High R).
114
Figure 44(A-B) Comparison of leaf hair numbers on the upper surface of strawberry leaves (variety Elsanta) after being treated in weeks 1, 3 and 5 with (A) standard concentration of Omex SW7 to leaves (Standard F) and roots (Standard R) and (B) high concentration of Omex SW7 to leaves (High F) and roots (High R).
115
Figure 45(A-B) Comparison of leaf hair numbers on the upper surface of strawberry leaves (variety Elsanta) after being treated in weeks 1 and 5 with (A) standard concentration of Omex SW7 to leaves (Standard F) and roots (Standard R) and (B) high concentration of Omex SW7 to leaves (High F) and roots (High R).
116
Figure 46(A-B) Comparison of leaf hair numbers on the lower surface of strawberry leaves (variety Elsanta) after being treated weekly with (A) standard concentration of Omex SW7 to leaves (Standard F) and roots (Standard R) and (B) high concentration of Omex SW7 to
117
xv
leaves (High F) and roots (High R).
Figure 47(A-B) Comparison of leaf hair numbers on the lower surface of strawberry leaves (variety Elsanta) after being treated in weeks 1, 3 and 5 with (A) standard concentration of Omex SW7 to leaves (Standard F) and roots (Standard R) and (B) high concentration of Omex SW7 to leaves (High F) and roots (High R).
118
Figure 48(A-B) Comparison of leaf hair numbers on the lower surface of strawberry leaves (variety Elsanta) after being treated in weeks 1 and 5 with (A) standard concentration of Omex SW7 to leaves (Standard F) and roots (Standard R) and (B) high concentration of Omex SW7 to leaves (High F) and roots (High R).
118
Figure 49(A-B) Comparison of length of leaf hairs on the upper surface of strawberry leaves (variety Elsanta) after being treated weekly with (A) standard concentration of Omex SW7 to leaves (Standard F) and roots (Standard R) and (B) high concentration of Omex SW7 to leaves (High F) and roots (High R).
119
Figure 50(A-B) Comparison of length of leaf hairs on the upper surface of strawberry leaves (variety Elsanta) after being treated in weeks 1, 3 and 5 with (A) standard concentration of Omex SW7 to leaves (Standard F) and roots (Standard R) and (B) high concentration of Omex SW7 to leaves (High F) and roots (High R).
120
Figure 51(A-B) Comparison of length of leaf hairs on the upper surface of strawberry leaves (variety Elsanta) after being treated in weeks 1 and 5 with (A) standard concentration of Omex SW7 to leaves (Standard F) and roots (Standard R) and (B) high concentration of Omex SW7 to leaves (High F) and roots (High R).
121
Figure 52(A-B) Comparison of length of leaf hairs on the lower surface of strawberry leaves (variety Elsanta) after being treated weekly with (A) standard concentration of Omex SW7 to leaves (Standard F) and roots (Standard R) and (B) high concentration of Omex SW7 to leaves (High F) and roots (High R).
122
Figure 53(A-B) Comparison of length of leaf hairs on the lower surface of strawberry leaves (variety Elsanta) after being treated in weeks 1, 3 and 5 with (A) standard concentration of Omex SW7 to leaves (Standard F) and roots (Standard R) and (B) high concentration of Omex SW7 to leaves (High F) and roots (High R).
122
Figure 54(A-B) Comparison of length of leaf hairs on the lower surface of strawberry leaves (variety Elsanta) after being treated in weeks 1 and 5 with (A) standard concentration of Omex SW7 to leaves (Standard F) and roots (Standard R) and (B) high concentration of Omex SW7 to leaves (High F) and roots (High R).
123

xvi
Figure 55 Plan of the trial under polythene tunnel at Wisbech field site. Trial plot was 25 m long and 36 m wide. Whole polythene tunnel was 172 m long
133
Figure 56 Trial design. Number shows the plot number and lower case letter indicate the treatment number. Each trial plot was 3 m long and each plot was separated by 1 m guard row. In this trial there were 5 rows. Spray was applied on 3 rows and spray was not applied on the guard row
134
Figure 57 (A) Leaflet submerged in trypan blue stain for 24 hours. (B) After 24 hours staining at room temperature, leaflet was washed in water and cut into 4 strips (parallel to the mid rib). (C) Leaf strip was placed on microscope slide and cover with cover slip. (D) Cover slip was sealed with nail polish
136
Figure 58 (A) Germinating ascospore seen under the microscope (X400). (B) Another germinating ascospore seen under the microscope (X400). (C) Mycelium seen under the microscope (X400)
138
Figure 59 Number of germinating ascospores on strawberry leaves (variety Sonata) from different trial plots. The disease was assessed on 7 April before beginning of treatment/spray and also on 28 April, 19 May and 10 June
139
Figure 60 Number of colonies on strawberry leaves (variety Sonata) from different trial plots. The disease was assessed on 7 April before beginning of treatment/spray and also on 28 April, 19 May and 10 June
140
Figure 61 Disease development predictions for Wisbech, 2011
141
Figure 62 Number of leaf hairs on both the upper and lower surfaces of leaves (strawberry variety Sonata) collected from different trial plots. Leaves were collected on 28 April 2011, after being treated with different concentrations (standard and high) of silicon wetter (Omex SW7) with and without the use of K50 (Potassium carbonate) and control (untreated)
142
Figure 63(A-B) Relationship between the number of leaf hairs and the number of germinating ascospores on both the upper (A) and lower (B) surfaces of the strawberry leaves (variety Sonata)
143
Figure 64(A-B) Relationship between the number of leaf hairs and the number of colonies on both the upper (A) and lower (B) surfaces of the strawberry leaves (variety Sonata)
144
Figure 65 Length of leaf hairs on both the upper and lower surfaces of the strawberry leaves (variety Sonata). Leaves were collected on 28
146

xvii
April 2011, after being treated with different concentrations (standard and high) of silicon wetter (Omex SW7) with and without the use of K50 (Potassium carbonate) and control (untreated)
Figure 66(A-B) Relationship between the length of leaf hairs and the number of germinating ascospores on both the upper (A) and lower (B) surfaces of the strawberry leaves (variety Sonata)
147
Figure 67(A-B) Relationship between the length of leaf hairs and the number of colonies on both the upper (A) and lower (B) surfaces of the strawberry leaves (variety Sonata)
148
Figure 68 Concentrations of silicon in strawberry leaves (variety Sonata). Strawberry plants were treated with different concentrations (standard and high) of silicon wetter (Omex SW7) with and without the use of K50 (Potassium carbonate) and control (untreated)
149
Figure 69 Relationship between concentrations of silicon and the number of germinating ascospores
150
Figure 70 Relationship between concentrations of silicon and the number of colonies.
151
Figure 71(A-B) Relationship between concentrations of silicon and number of leaf hairs on both the upper (A) and lower (B) surfaces of the strawberry leaves (variety Sonata)
152
Figure 72(A-B) Relationship between concentrations of silicon and length of leaf hairs on both the upper (A) and lower (B) surfaces of the strawberry leaves (variety Sonata).
153

xviii
List of Tables Table 1 Infectious diseases of strawberry plants caused by the different causal
organisms
16
Table 2 Name and number of different pest species affecting strawberry production in the UK
17
Table 3 Summary of conditions that effect the life cycle of Podosphaera aphanis
27
Table 4 Summary of fungicides currently approved for use in strawberry with recommendations for powdery mildew control
29
Table 5 Biological products or agents with anti-powdery mildew activity
33
Table 6 Treatment rates and spray timings (Pilot experiment)
54
Table 7A
Distribution of treatments in the Hatfield glasshouse (variety Elsanta)
55
Table 7B
Randomised distribution of treatments, date of application of the treatments and leaf collections from different rows of block A (Pilot experiment)
55
Table 8 Treatment rates and spray timings (Main experiment)
58
Table 9A Distribution of treatments in the Bayfordbury glasshouse (variety Elsanta)
59
Table 9B Randomised distribution of the treatments, date of application of the treatments and leaf collections from different rows of block A (Main experiment)
60
Table 10 Treatment rates and spray timings
62
Table 11A Distribution of treatments in the Bayfordbury glasshouse (different varieties)
63
Table 11B Randomised distribution of the treatments, date of application of the treatments and leaf collections from different rows of blocks A and B (different varieties)
64
Table 12 Increased percentage of silicon concentrations in leaves after different treatments
67
Table 13A
Total amounts of silicon in the different treatments and accumulation of silicon in the leaves after different treatments
70

xix
Table 13B
Increased percentage of silicon concentrations in leaves after different treatments
72
Table 14 Increased percentage of silicon concentrations in leaves after different treatments (different varieties)
82
Table 15 Relationship between concentrations of silicon and number of leaf hairs on both the upper and lower surfaces of leaves in the different varieties
85
Table 16 Relationship between concentrations of silicon and length of leaf hairs on both the upper and lower surfaces of leaves in the different varieties
88
Table 17 Treatment rates and timings
97
Table 18A Distribution of treatments in the Hatfield glasshouse (variety Elsanta)
98
Table 18B
Randomised distribution of treatments, date of application of the treatments and leaf collections from different rows of block A
99
Table 19A
Total amounts of silicon in the different treatments and accumulation of silicon in the leaves after different treatments
102
Table 19B
Increased percentage of silicon concentrations in the leaves after different treatments
103
Table 20 Spray and date of assessment 132
Table 21 Product and dilution rates 132
Table 22 List of different treatments 135

xx
Appendix
Appendix 1 Randomised distribution of the treatments, date of application of the treatments and leaf collections from different rows of block B (variety Elsanta) (Pilot experiment) (Chapter 3)
188
Appendix 2 Randomised distribution of the treatments, date of application of the treatments and leaf collections from different rows of block B, C and D (variety Elsanta) (Main experiment) (Chapter 3)
189
Appendix 3 Randomised distribution of the treatments, date of application of the treatments and leaf collections from different rows of block C and D (different varieties) (Chapter 3)
192
Appendix 4 Randomised distribution of the treatments, date of application of the treatments and leaf collections from different rows of block B, C and D(variety Elsanta)(Chapter 4)
193
Appendix 5 Published paper Study the role of silicon in strawberries and its possible role in control of strawberry powdery mildew
195
Appendix 6 Published paper A study of the role of silicon in the control of strawberry powdery mildew (podosphaera aphanis) in a field trial
203
Appendix 7 Appendix 8 Appendix 9
Poster for BSPP Conference (2009)
Poster for Research Day (2010)
Poster for BSPP Conference (2011)
209 210 211

1
Chapter-1: General Introduction 1.1. Introduction
Strawberries are one of the most popular fruit in the United Kingdom (UK) and the
production of strawberries has been expanding rapidly to meet rising consumer
demand (Defra, 2008). During the past 18 years, total area has decreased from around
5600 hectares (1988/89) to 3800 hectares (2005/2006) (Dodgson, 2008). However
during the same period, gross production has risen from approximately 43,000 tonnes
to 64,000 tonnes. The use of improved varieties and production techniques helps to
increase productivity and enhance fruit quality. In addition, emphasis on quality
control, marketing and sales promotion has helped to increase sales of fresh fruit. Due
to the high demand for these crops, methods were devised to harvest them over a
longer period. Strawberry production under polythene tunnels is a method which helps
to extend the strawberry harvest to 26 weeks (CALU, 2007; Dodgson, 2008).
The use of polythene tunnels, however, tends to create the environmental conditions
(150C to 300C and 95% humidity, Dodgson et al., 2008) which are conducive to
epidemics of powdery mildew (Podosphaera aphanis). This has had a major impact on
strawberry production. The control of powdery mildew, which occurs sporadically
during the growing season, is one of the greatest challenges faced by the UK growers.
Powdery mildews are one of the most common diseases in many crops and fruit
including wheat, barley, grape, apple, strawberry and a number of vegetables and
ornamental plants. Despite extensive research on their pathogenesis, epidemiology and
control, powdery mildew infections remain among the most important plant
pathological problems worldwide (Belanger and Labbe, 2002). Fungicides are generally
used by growers to control powdery mildew infections. Due to the adverse effect of
fungicides, there is research effort to find new, non-chemical methods of control
powdery mildew (Anon., 2005). This includes alternative methods such as biocontrol
agents or natural products to control powdery mildews (Pertot et al., 2008; Kiss, 2003).
In plant pathology, the term biological control and its abbreviated synonym biocontrol
refers to the suppression of diseases by the use of microbial antagonists (Pal and
Gardener, 2006). In a broader sense, the term biological control means the use of the

2
natural products extracted or fermented from various sources. The use of biocontrol
agents in reducing disease has increased dramatically within the last 10 years. These
are still a small fraction in comparison with chemical fungicides which are used in field
crops and also in glasshouse crops. Biocontrol agents are very sensitive to
environmental conditions. Biocontrol agents are more effective in glasshouses and
polytunnels because temperature and relative humidity are more easily controlled in
the glasshouses and polytunnels than in the field and for this reason, more uses of
biological agents are observed in glasshouses in comparison with the field (Paulitz and
Belanger, 2001). There are limited numbers of biocontrol agents which are effective in
reducing the strawberry powdery mildew. Most of the studies focus on the application
of Ampelomyces quisqualis which parasitizes and kills the powdery mildew fungus (Falk
et al., 1995). Ampelomyces quisqualis requires high relative humidity and sometimes
paraffin oil mixed with it for achieving good disease control.
Several alternative control agents, i.e. soluble silicon, oils, salts and plant extracts have
been tested against powdery mildew on different crops (Falk et al., 1995; Kiss, 2003,
Pertot et al., 2008). The benefits of silicon have been well documented in plants.
Although silicon has not been recognised as an essential element for higher plants, the
beneficial effects have been demonstrated in many plants. These include enhanced
productivity and tolerance to various biotic and abiotic stresses (Ma and Yamaji, 2006).
Beneficial effects of silicon have been particularly well documented in rice and
cucumber (Kim et al. 2002; Samuels et al., 1993). Silicon fertilization is now routinely
applied to rice and sugarcane to enhance growth and yield (Kim et al., 2002; Ma et al.,
2002). One of the most thoroughly studied beneficial effects of silicon on plant health is
its role in reducing susceptibility to fungal diseases.
Besides this, the addition of silicon has also been shown to have beneficial effects on
strawberry plants. Foliar applications of silicon induce metabolic changes in strawberry
plants (Wang and Galletta, 1998). Wang and Galletta (1998) also reported that foliar
applications of silicon increased chlorophyll and organic acid content and enhanced
plant growth. In strawberry, Miyake and Takahashi (1986) in their experiment found
that fruit production is related to silicon fertilization. They indicated that silicon helps
to increase pollen fertility and also increases the production of fruit (Miyake and

3
Takahashi, 1986). The above study showed that although strawberry is not a silicon
accumulator, silicon does have beneficial effects on strawberry plants. However, in
strawberry, the mechanism of suppression of powdery mildew remains unclear.
Therefore, enhancing the plant’s natural resistance by optimizing the mineral
fertilization could be a useful contribution to a sustainable control of Podosphaera
aphanis. Silicon supply might be a tool to achieve this goal since the positive effects of
silicon on plant health have been widely demonstrated.
1.2. Literature Review 1.2.1. Strawberry Plant
Strawberries are perennial, dicotyledonous, non-deciduous plants. The modern
strawberry, Fragaria x ananassa Duchesene (family Rosaceae) is a hybrid species that
dominates commercial production worldwide (Hokanson and Maas, 2001). The modern
strawberry Fragaria ananassa resulted from a cross between Fragaria chiloensis (L)
Duchesene and Fragaria virginia Duchesene. Following further hybridizations since
1850 the modern Fragaria x ananassa developed with the large, fragrant and tasty fruit
that is common today (Maas, 1998). The genus Fragaria consists of approximately 20
species, with a basic chromosome number X=7. To distinguish between species, the
number of pairs of these chromosomes must be determined, some strawberry plant
species are diploid, meaning they have two sets of the seven chromosomes (14 total);
others are tetraploid (4 pairs, 28 total), hexaploid (6 pairs, 42 total), octoploid (8 pairs,
56 total). The cultivated strawberry (Fragaria x ananassa) is octoploid (Marta et al.,
2004). Classification of the strawberry plant is shown below.
Scientific Classification Kingdom : Plantae Class : Magnoliopsida Order : Rosales Family : Rosaceae Genus : Fragaria Species : ananassa Classification of strawberry plant within the kingdom Plantae (Anon, 2012a).
4
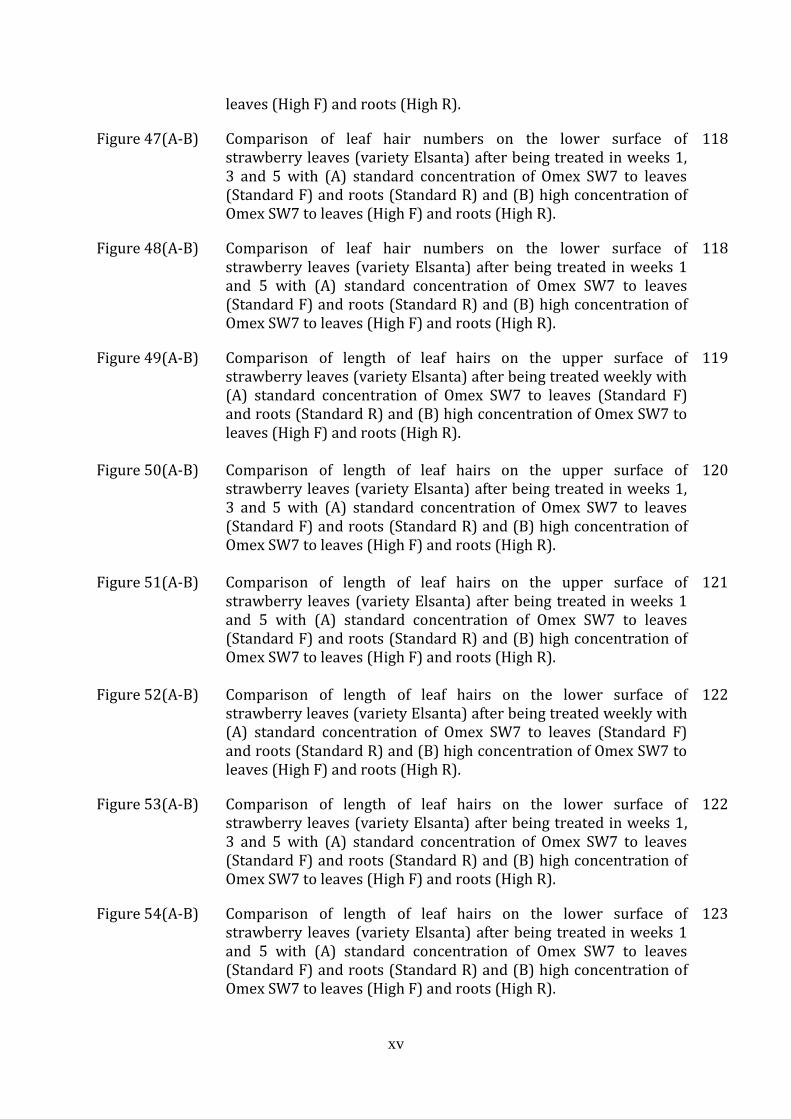
The main stem of the strawberry plant is the much shortened stem called a crown.
Strawberry plants produce leaves and flowering stems from a woody crown in a spiral
arrangement (Figure 1). Each leaf has three or more leaflets depending on the variety;
leaflets are oval to oblong with coarsely toothed edge (Pritts and Handley, 1998).
Figure 1: Diagram of a strawberry plant. Leaves, crown and roots of a strawberry plant are shown in this diagram (Source: strawberrygardenproject.blogspot.com).
Roots develop from the crown where the crown tissue comes into contact with the soil
(Figure 2). They extend several inches into the soil and form numerous lateral roots,
which are the primary means of taking in water and nutrients. Lateral roots usually
survive one or two years. The largest concentration of roots occurs in the upper three
inches of the soil. Length and number of roots formed depends upon soil conditions and
plant density (Darrow, 1999).
Strawberry plants also produce stolons, known as runners (Figure 2). These runners
produce roots when they come into contact with soil and then can be detached from the
parent plant. Runner development is stimulated by long day lengths and warm
temperatures. Therefore runners emerge mostly during the summer months. Runner
plants are the primary means of propagating strawberries commercially. Runners
which have rooted over the summer are dug up late in the autumn and stored in a cool
Roots
Crown
Leaf

5
place at about 00C (320F) until spring for planting (Handley, 1998). In crop production,
removal of runners is expensive and labour intensive, so cultivars that produce fewer
runners are favoured.
Figure 2: Diagram of a strawberry plant and daughter plant. Leaf, crown, runner and daughter plant of a strawberry plant are shown in this diagram (Source: strawberrygardenproject.blogspot.com).
The strawberry inflorescence is a modified stem called cyme terminated by a primary
flower. Following the primary flower, there are typically two secondary, four tertiary
and depending on the variety and time of season, eight quaternary flowers (Handley,
1998). An individual flower typically has 10 green sepals, five white petals, 20 to 30
stamens and 60 to 600 pistils (Figures 3A and B). The greatest number of pistils occurs
on the primary flower and decreases successively down the inflorescence. Each pistil
contains a single ovary (Figure 3A) that develops into an achene (Handley, 1998,
Darnell et al., 2003). Achenes are the true fruits of the strawberry. Together with the
receptacle they form an aggregate, which is referred to as a berry (Figure 3A), but it is
not a true berry in the botanical sense. Development of fruit from pollination to ripeness
takes from 20 to 60 days, depending on the cultivar and weather conditions. While all
strawberry plants share common characteristics, they are also extremely variable
according to variety and the environment in which they are grown.

6
Figure 3A: Different parts of a strawberry flower are shown on the left and on the right a strawberry fruit showing the swollen end of the flower stalk which becomes red and fleshy and bears the ripened pistils over its surface (Source www.tripod.com).
Figure 3B: Floral diagram for strawberry (Source www.the wild classroom.com)
1.2.2. Polythene tunnel production of strawberries
Growing strawberries under polythene tunnels is one of the success stories of the
British soft fruit industry (Figure 4). In the UK, the growers started to use polythene
tunnels in 1993 (Fletcher, 2006; Anon., 2012b). Strawberries and raspberries, British-
grown soft fruit, have become an important and successful rural business. In the last
four years sales of home grown berries have increased 130% in the UK supermarket
(Anon., 2012b). The plastic structures (polythene tunnels) are not permanent, so they
Stamen
Style Stigma
Anther
Sepal Receptacle
Fruit
Ovary
Ovaries
mature as
achene
Petal
Pistil
Anther
Petal
Sepal

7
can be moved to cover the crop as required. Polythene tunnels were developed from
similar designs used by farmers in Spain to protect their winter salad crops.
More than fourteen years ago it was very difficult to grow strawberries in Britain due to
the unpredictable weather conditions and disease. Summer rain not only prevents
harvesting, but also produces poor quality berries. Most were used for the production of
jam and other fruit products most notably because the berries were not of high quality.
The farmers of Spain, France and America used polythene tunnels and as a result they
produced high quality fruit and dominated the UK market with imports. Since the use of
polythene tunnels in the UK the level of imports has dropped. Currently 80% of
strawberries sold in supermarkets are produced under polythene tunnels in Britain
(Anon., 2012b).
Figure 4: Strawberry plants under polythene tunnel. The advantages of using tunnels are:
* The season of strawberry harvest can be extended from 6 weeks (June and July) to 26
weeks (May to November) (CALU, 2007; Dodgson, 2008). Prior to the introduction of
polythene tunnels in the UK, British strawberries were only available for the short 6
weeks season in June and July. The use of polythene tunnels has enabled British soft
fruit to be successfully grown from early May to November. This has dramatically
reduced the amount of imported soft fruit from Spain, France and America.

8
* Production of class 1 grade (supermarket saleable fruit) can be improved from 55-
70% to 80-90% (CALU, 2007; Phillips and Reid, 2008). The use of polythene tunnels
protects the fruit from rain damage and provides temperature more conducive to
strawberry production than external temperatures, at the start and end of the season. In
the UK, 50% of the soft fruit yield was grade 1 fruit before the use of polythene tunnel;
now it is nearer 90% (Anon., 2012b).
* Reduction in the use of pesticides by up to 50% against Botrytis, Downy mildew and
Black spot (CALU, 2007; Anon., 2012b). Soft fruit’s biggest enemy is Botrytis and due to
the infection of the fruit by Botrytis cinerea yield was significantly reduced. Under
tunnels, the fruit are kept dry which significantly reduces the moisture related diseases
such as Botrytis, Downy mildew and Black spot. Thus the polythene tunnel protects the
fruit from moisture which reduces the need to spray with chemicals.
1.2.3. Strawberry cultivation methods
The extension of British strawberry production by the use of polythene tunnels needs
different varieties and cultivation methods to produce fruit at different times of the
season.
1.2.3.1. Varieties
Strawberry varieties are grouped according to their harvesting periods. Strawberry
varieties are divided into June-bearers, Everbearers and Day-neutral types. June-bearer
strawberry varieties initiate flowers under short day conditions and are tremendously
popular and common. Most June-bearing strawberry varieties produce the largest
strawberries around the month of June. Everbearing strawberry varieties initiate
flowers under long day conditions and generally produce fruit twice a year, once in the
spring and again in the autumn. In general, there are fewer runners in ever bearing
strawberry varieties in comparison with June-bearing varieties (Anon., 2012a).
Everbearer varieties are grown commercially under Spanish tunnels in Scotland but are
much more difficult to grow than June-bearers.

9
Day-neutral strawberry varieties produce fruit regardless of day length and produce a
good yield in the first year they are planted. In general day-neutral varieties produce
smaller strawberries than do the June-bearing and everbearing varieties (Hancock and
Handley, 1998). Generally growers have several early, mid season and everbearer fields.
They are managed so that fruit production by the farm continues throughout the season
(Dodgson, 2008). The strawberry growing season is broken down into 3 main cropping
periods, which are shown schematically in Figure 5. This shows the period when each
crop is covered and subsequently picked. The early crop is often a second season crop
that has over wintered in the ground. The main crop is planted at the start of the season
(March to early May) and forced to produce fruit (a 60 day crop). June-bearer varieties
and day-neutral varieties are used to produce the early crop and main crop. The late
crop is produced using special everbearer varieties which produce fruit over a longer
period of time (Dodgson, 2008).
Early crop
Early crop
Main crop
Main crop
Ever bearers
Ever bearers
Tunnels covered
March April May June July August September October
Harvesting fruit
Figure 5: Diagram shows the relationship between harvesting and crop cover use polythene tunnels (Source Dodgson, 2008).

10
1.2.3.2. Planting
Commercial strawberries can be grown on the flat or in raised beds (Figure 6A). The
raised bed is covered with a plastic mulch, to prevent weeds growing and help protect
the ripe fruit (Figures 6A and B). The irrigation system is placed under the mulch
(Figure 6A). Alternatively, strawberries can be grown in containers, troughs or bags
filled with potting mix on the top of the ground (Figure 6C). The troughs can be either
on the ground or placed on raised platforms to ease picking. Raised beds and troughs
require more irrigation but reduce the risk of soil borne disease considerably.
Strawberry plants can be planted any time from February through to July. When
strawberry plants are planted in the summer, sometimes they need to be misted by over
head sprinklers, in addition to the irrigation system within the strawberry bed (Figure
6B).The strawberry plants for commercial production are produced by specialist
growers referred to as propagators (Dodgson, 2008). They bulk up the numbers of
strawberry runners until there are enough to be harvested and sold to the growers.
All the plants produced by propagators are grown in open fields. Propagation of
strawberry plants is highly regulated as the asexual development of new plants could
lead to the transmission of viruses to the daughter plants. Usually the propagation of
strawberry plants and the production of commercial fruit are carried out at completely
different locations (Dodgson, 2008). When harvested, runners are graded for size then
stored at 00C over the winter in a cold store before being planted the following season
by strawberry growers. The plant health propagation scheme (PHPS) provides healthy
planting material to growers. Nuclear Stock association provides a scheme that reduces
the risk of viruses being passed to growers via plants (Anon., 2006).

11
Figure 6A: Preparing raised bed for planting. Irrigation pipe under the raised bed (as indicated by arrow).
Figure 6B: Planting in raised bed. Temporary irrigation pipe used to mist plant (when planted in summer) in addition to the irrigation system. This is only done for a maximum of two to three weeks after planting.
Temporary
irrigation
pipe
Holes for
planting

12
Figure 6C: Plants grown in bags filled with peat placed on raised bed.
1.2.3.3. Spacing
Newly received runners should be planted as soon as possible in raised beds (Figure
6B) or troughs. Runners should be planted with the crown of the plant just level with
the soil surface. Runners should be planted approximately 35-45 cm apart within rows
and 65-75 cm between rows. It is important not to leave the roots exposed or to bury
the crowns (Lewis, 2006). Firm the soil gently round plants with heel or knuckles.
1.2.3.4. Watering/Irrigation
After planting, strawberry plants should be watered regularly to encourage root
development. Watering may need to be continued under dry conditions (CALU, 2007).
Water is always delivered through irrigation pipes. When the weather gets cool and the
plants are transpiring less, irrigation frequency will be reduced. Once fruit set has
occurred, it is essential not to over water strawberries. Use of excess water may
encourage the development of grey mould (Botrytis cinerea) which results in fruit
rotting.

13
1.2.3.5. Continuing care
In spring, as growth begins, dead leaves, aphids, and other pests in the crown and
elsewhere can create problems for fruit production. For this reason, growers remove
dead leaves regularly. To reduce disease and pests, growers generally use
recommended pesticides. From June onwards plants will begin to produce rapidly
extending runners. These runners will produce more fruit but of generally smaller size.
It may also increase the likelihood of disease. For this reason, all runners are removed
regularly unless used to fill gaps in the rows (Anon., 2012g).
1.2.3.6. Polythene tunnel management
The conditions inside polythene tunnels need to be carefully managed, to optimize the
fruit production of the plants (Dodgson, 2008; Rowley and Drost, 2010). Soft, white, non
woven, UV established polypropylene material permeable to air and water called
horticultural fleece is sometimes used to cover the field. Horticultural fleece protects
the plants from late frost and encourages the plants to produce flowers. The most
important point about using tunnels is to protect the fruit and flowers from frost injury
in the early and late parts of the year. The second important point is to keep the
temperature in the tunnel warm enough for the plants to continue growing (Rowley and
Drost, 2010). Temperatures in tunnels can become too hot in day time, especially when
the sun is shining. In order to avoid high temperature, tunnels can be vented by pushing
the polythene sheets up the sides of the tunnels (Figure 7A).
On the other hand when the temperature is cool or during the night the sheets can be
lowered to keep warm air inside the tunnels (Figure 7B). A maximum and minimum
thermometer is a valuable tool to help growers determine when to vent and when to
close their tunnels (Figure 7C). At the start of the season tunnels are only vented when
necessary and the sheets are lowered at night. During this time the tunnels are fitted
with doors and plastic sheet at the edge where the polythene sheet does not reach the
ground, so that the tunnel is completely enclosed (Dodgson, 2008). When the weather
gets hotter these can be removed. As the season progresses to summer the sheets are

14
fixed in the open position until the conditions cool down again towards the end of the
season.
Figure 7A: Tunnel with the polythene sheet pulled down (as indicated by the arrows)
Figure 7B: Tunnel with the polythene sheet pushed up (as indicated by the arrow). Plants grown in raised bed.

15
Figure 7C: Maximum and minimum thermometer (indicated by arrow) in the raised bed, under polythene tunnel used by growers.
1.2.3.7. Fertilizer
Plant nutrition is best accomplished through fertigation or applying fertilizer in the
irrigation water. Fertigation will help growers to apply fertilizers in small amounts
every time plants are watered. Fertilizer rates vary among soil types according to
nutrient holding capacity (Rowley and Drost, 2010). The optimal pH range for
strawberries is 5.8-6.5. Granular fertilizer (N-P-K) can be broadcast over each raised
bed prior to laying plastic mulch. Although, the growers choose not to apply fertilizer
this way, they can apply a soluble fertilizer through the irrigation system (Lewis, 2006).
It is very important not to apply too much nitrogen to strawberry plants. Excessive
nitrogen will encourage the growth of branch crowns. Too many branches in crowns
significantly reduce the average fruit size in the strawberry plants (Lewis, 2006).
1.2.3.8. Pollination
Pollination is the transfer of pollen from the anthers (male floral part) to the stigma
(female floral part) of a flower. Most fruit crops require pollination. Pollen from the
anther adheres to the sticky surface of stigma and grows down the style and unites with
the female cell in the ovary. This enables fertilization which results in development of
seeds from the flower (Warmund, 2002). Strawberry flowers need to be pollinated to

16
produce fruit like other fruit bearing plants. In the spring, strawberry plants start to
produce flowers. The new flowers mostly rely on the wind to circulate pollen among the
plants. However, strawberry plants grown in the glasshouses or tunnels require bees to
pollinate the plants. Honey bee hives are generally used to enhance pollination and fruit
set. Honey bees which help pollinate strawberries can help increase fruit size up to 40
percent. Alternatively, Bumble bee hives (supplied by Biological control companies)
may also be used. Bumble bees are more expensive than honey bees but are generally
more active in cold, dull weather early in the year (Lewis, 2006).
1.2.3.9. Harvesting Strawberries are very delicate so strawberries must be picked and handled very
carefully. The fruit must be firm, well coloured and free from rot. The optimum time to
harvest strawberries is the early morning when the fruits are cool (CALU, 2007). When
harvested at the right time and handled properly strawberries will remain in good
condition for many days.
1.2.3.10. Pests and diseases in strawberry crops
The worldwide most common diseases of strawberry plants are listed by Maas (1998)
shown in Table 1 and those which are significant in UK strawberry production are also
shown in this table.
Table 1: Infectious diseases of strawberry plants (worldwide and UK) caused by the different causal organisms (Maas, 1998; Anon., 2004).
Infectious diseases of strawberry plants
Types of diseases Number of species (Worldwide)
Number of species (UK)
Bacterial diseases (leaf) 2 1 Fungal diseases (fruit) 17 4 Fungal diseases (leaf) 20 5 Fungal diseases (root and crown) 23 3 Aphid transmitted viruses 6 1 Nepoviruses 5 1 Other viruses and virus like diseases 5 0 Leafhopper transmitted diseases 6 1 Phytoplasmas (mycoplasmas) 2 1

17
The two most common diseases of strawberries under polythene tunnels are powdery
mildew and grey mould. Powdery mildew diseases will be described in section 1.2.4.
Grey mould caused by Botrytis cinerea is severe in cloudy, cool and humid conditions.
Grey mould is a fluffy fungal growth on the fruit or flower stalks making the fruit
unmarketable. Excessive foliage from too much nitrogen fertilization can also trigger
grey mould problems (Rowley and Drost, 2010).
Table 2: Name and number of different pest species affecting strawberry production in the UK (Anon., 2004). Name of the pests
Number of species
Aphid 4 Whitefly 1 Two- spotted spider mite 2 Tarnished plant bug 1 Thrips 1 Weevil 3 Caterpillars 2 Slugs 1 Beetle 1 Nematodes 1 Table 2 shows the pests which affect strawberry production. The two most damaging
pests are Two-spotted spider mites and Aphids. There are also many arthropod and
mollusc pests of strawberries and a large proportion of these can act as vectors for
pathogens. Adult spider mites hibernate in the winter period and in early spring move
on to host plants to start laying eggs. The young nymphs and adults feed on the
underside of the leaves, where cell contents have been sucked out. If not controlled, the
mite population multiplies rapidly and whole leaf turns bronze. A range of different
aphid species attack strawberry plants. Different species of aphids transmit a range of
viruses into strawberry plants including Yellow edge and Crinkle virus which result in
crinkling, stunting or yellow mottling in leaves of affected plants. Early control of aphids
helps prevent population build up and the spread of sooty mould and viruses (Lewis,
2006). Identification of virus diseases that affected cultivated strawberries were first
noted in the 1920s. The viruses affecting strawberries are disseminated through seed or
pollen, vegetative propagation, vectors (aphids, thrips, mites, whiteflies, leafhoppers
and nematodes) (Tzanetakis and Martin, 2013). In general growth and yield of
18
strawberry plants are not affected by a single virus infection. However infections by
multiple viruses have the potential to reduce the yield. For this reason, it is important to
minimise viruses in strawberry propagation through the use of certified virus free
runners.
1.2.4. Strawberry powdery mildew
1.2.4.1. Classification
Strawberry powdery mildew is a fungal disease caused by the pathogen Podosphaera
aphanis. This biotrophic fungus is in the family Erysiphaceae (Powdery mildews), a
member of the class Ascomycetes (Kirk et al., 2011). There are many species and genera
of angiosperms that are hosts for the biotrophic parasitic powdery mildew fungi.
Taxonomy and identification of the Erysiphales have traditionally been based on the
teleomorph (sexual stage) and the morphology of the ascocarp and its appendages.
Current taxonomic research in powdery mildews includes anamorphic (asexual stage)
morphology and molecular approaches (Glawe, 2008). The morphology based
taxonomy has been extensively revised on the basis of DNA sequence data.
Identification of powdery mildew according to new taxonomy incorporates
characteristics of the whole fungus (anamorph plus telemorph i.e holomorph) (Glawe,
2008). Powdery mildew genera are now grouped into five tribes, and some genera have
been added or merged. There has been confusion about the name of the causal agent,
whether strawberry and hop powdery mildew are caused by the same fungus
Sphaerotheca macularis (Smith et al., 1988). The study of Braun (2002) provides the
confirmation that the causal agents of strawberry and hop powdery mildew are
different. The causal pathogen of strawberry powdery mildew is Podosphaera aphanis
and the fungus that infects hop is Podosphaera macularis (Braun, 2002). According to
Braun (2002) Podosphaera and Sphaerotheca both produce chasmothecia containing
only a single ascus. The main difference between Podosphaera and Sphaerotheca is that
ascocarp appendages are dichotomously branched in Podosphaera and ascocarp
appendages are myceloid in Sphaerotheca (Braun, 2002; Webster and Weber, 2007).
Braun (2002) differentiates Podosphaera and Sphaerotheca on the basis of the sexual
stage and the morphology of the chasmothecium. In order to reconstruct the phylogeny

19
of Podosphaera and to determine evolutionary relationships between Podosphaera and
Sphaerotheca, molecular examinations were carried out by Saenz and Taylor (1999) and
Takamatsu et al., (2000). Saenz and Taylor (1999) stated that Sphaerotheca spp. could
be changed to Podosphaera and demonstrated that Podosphaera and Sphaerotheca do
not form distinct clades. A comprehensive examination was carried out by Takamatsu et
al., (2000) and fully confirmed the outcome of the experiments carried out by Saenz and
Taylor (1999). The chasmothecia of P. aphanis contain a single ascus and the ascus
usually contains 8 ascospores. According to Mukerji (1968) the cleistothecia
(chasmothecia) of P. aphanis (referred to as Sphaerotheca macularis) are gregarious or
scattered, or caespitose, 60-125 µm diameter, dark brown to black, smooth and with
numerous hyphal appendages from the lower half and each contains one ascus. The
classification of P. aphanis is provided below:
Kingdom Fungi
Phylum Ascomycota
Class Ascomycetes
Order Erysiphales
Family Erysiphaceae
Genus Podosphaera
Species aphanis
Classification of Podosphaera aphanis within the kingdom Fungi (Webster and Weber, 2007; Kirk et al., 2011).
1.2.4.2. Economic loss caused by strawberry powdery mildew
Powdery mildew of strawberry is one of the most destructive diseases causing
significant losses in strawberry production (Peries, 1962a; Belanger and Labbe, 2002).
Serious damage to the foliage results in reduction of photosynthesis due to the dense
mycelium coverage, which can lead to necrosis and eventual defoliation. When foliage
infections are severe, flowers and fruit may also be infected. Powdery mildew is a
polycyclic disease and thus many infection cycles occur throughout the season (Lucas,
1998). When a polycyclic pathogen completes each life cycle quickly then disease levels
build up rapidly. Every species develops at different rates. For this reason, the length of
each cycle depends on the species of pathogen. Peries (1962b) described that a P.
aphanis spore takes 120 hours to germinate and form a mature colony. According to

20
Dodgson (2008) spores of P. aphanis require 144 hours to germinate and develop a
mature colony. The incidence of powdery mildew infection is increasing rapidly, causing
damage to fruit and leading to crop losses. The disease can result in yield losses of
between 20-70% of the crop potential. At 20% losses, this could contribute to decreases
in industry volume of 12,800 tonnes or market value of £25 million (Dodgson, 2008).
1.2.4.3. Symptoms of infection
Powdery mildew can be recognized easily on most varieties by the white powdery
mycelial and spore growth that forms on both sides of leaves, sometimes on flowers and
fruits and on shoots (Amsalem et al., 2006). Symptoms of P. aphanis cause a progression
of symptoms on the leaves and fruit. A healthy strawberry leaf is flat and green. When
they are infected by the fungus P. aphanis, the leaves of strawberry begin to cup
upwards exposing the underside of the leaf (Dodgson, 2008). If infection progresses,
mycelium can be first seen on the lower leaf surface and then on the upper surface.
After this stage purple reddish blotches appear on the upper surface of the leaves. When
foliage infections are severe, flowers and fruit may also be infected (Blanco et al., 2004;
Dodgson et al., 2007). Infected fruit become hard, covered by white mycelium and
unmarketable. Symptoms of powdery mildew infections are shown in Figure 8.
Healthy leaf Cupped leaf Mycelium on leaf
Red blotch on leaf Mycelium on fruit
Figure 8: Symptoms of strawberry powdery mildew (modified from Dodgson, 2008).

21
1.2.4.4. Reproduction of powdery mildew
Powdery mildews are biotrophic parasites and they require living plant tissue to grow.
Powdery mildew fungi including Podosphaera aphanis reproduce by means of asexual
spores, known as conidiospores (conidia) or by means of sexual spores, known as
ascospores. The life cycle of strawberry powdery mildew (Figure 9) is dependent on the
influence of temperature and humidity on growth from spore germination through to
mycelium (Figures 10C and D) development and finally to spore production. When
conditions are favourable, the fungi produce asexual spores that are called conidia
(Figure 10A). Conidia are genetically similar and produce in enormous numbers during
the growing season, under disease conducive conditions. The rapid rate of asexual
reproduction can lead to exponential growth of powdery mildew populations which can
initiate epidemic. These enable a rapid build up of the epidemic. Conidia are smooth
walled and barrel shaped (Figure 10B) 25 to 38 µm long and 15 to 23 µm wide with
whorl-patterned ends (Mukerji, 1968; Braun et al., 2002).
Pathogens exploit every possible pathway to enter their host, although individual
species of pathogen tend to have a preferred method. Rusts and powdery mildews are
both biotrophic fungi, though they use different pathways to enter the host plants. Rusts
usually enter the host plants through natural openings like stomata. Once a spore has
anchored itself to the plant and the germ tube emerges, the germ tube eventually
locates stomata by a specific surface sensing mechanism. This involves growing towards
a ridge between the epidermal cells, followed by a perpendicular growth which ends at
the stomata (Dickinson, 2003). The powdery mildews use the direct penetration
pathway to enter the host (Carver et al., 1995). This requires adhesion of pathogen to
the plant surface, followed by the application of pressure and then enzymatic
degradation of the cuticle and cell wall (Nicholson and Epstein, 1991; Francis et al.,
1996). Germination of the powdery mildew conidia leads to the development of the
germ tube which extends over the leaf surface. The germ tube searches for a favourable
site for penetration and the tip of the germ tube swells to form an appressorium (Kunoh
et al., 1979; Lucas, 1998; Green et al., 2002). The spherical structure of the
appressorium increases the attachment between the fungus and the host. The

22
appressorium produces a fine needle-like penetration peg, which applies huge pressure
to the host cuticle and cell wall (Green et al., 2002).
Figure 9: Life cycle of powdery mildew of strawberry caused by Podosphaera aphanis. Infected strawberry leaves, (Source Dodgson, 2008). Overwintering chasmothecia, (X10) (Source Fatema, 2011). Chasmothecia on Leaf (X30) (Source Fatema, 2011). Chasmothecium releasing an ascus with 8 ascospores (X400) (Source Jin, 2012). Germinating ascospore on leaf (X100) (Source Fatema, 2011). Liberated conidiospore (X400) (Source Gadoury et al., 2007). Production of conidiospore (X200) (Source Jin, 2012). Mycelium on leaf (X100) (Source Fatema, 2011).
Germinating
ascospore on
leaf
Chasmothecium
releasing an ascus with
8 ascospores
Infected strawberry leaves
Penetration of
leaf,
development of
haustoria
Penetration of leaf,
development of
haustoria
Chasmothecia on leaf
Liberated conidiospore
Production of
conidiospore
Overwintering
Chasmothecia
Mycelium on leaf
Asexual phase Sexual Phase
Germinating
conidiospore
on leaf

23
Molecular and genetic techniques showed that several fungi are known to produce
cutinase an enzyme able to degrade cutin and facilitate penetration of the outer layer of
the host surface by the fungus (Keon et al., 1987; Lucas, 1998; Green et al., 2002). Now it
is known that combinations of enzymatic (cutinase and cellulase) and mechanical forces
are required for penetration of the host (Carver et al., 1995; Green et al., 2002).
Pathogen development is influenced by temperature, humidity, nutrient availability and
pH. The temperature range of germination of P. aphanis conidia is 150C to 250C (Peries,
1962a; Jhooty and McKeen, 1965). This is supported by Dodgson et al., (2008) who
found that germination rate was similar over the temperature range 150C to 250C.
A B
C D
Figure 10: Different stages of asexual life cycle of Podosphaera aphanis. A) Conidia (X100) of P. aphanis born in chain. These stalk-like conidiophores give mildew colonies their powdery appearance (Source Gadoury et al., 2007). B) Conidia (X400) (Source Gadoury et al., 2007). C) Mycelium (web like growth) growth on the underside of the leaflet (X30) (Source Fatema, 2011). D) Mycelium on the underside of the leaf (X100) (Source Fatema, 2011). Jhooty and McKeen (1965) found that maximum infection of the host occurs at 200C
when the relative humidity is 100%. Given optimum conditions, conidia on strawberry
leaves germinate 4 to 6 hours after inoculation and form indistinct appresoria (Braun et

24
al., 2002) within 12 hours (Jhooty and McKeen, 1965). All the germ tubes are fully
developed after 48 hours and the development of haustoria in the host cell takes 48
hours. Conidiophores and conidia are developed between 3 to 5 days post inoculation
(Peries, 1962b; Jhooty and McKeen, 1965). Conidiation is visible to the naked eye from 6
days post inoculation.
A B
C D
E F
Figure 11: A) Chasmothecia on strawberry leaf (X10) (Source Fatema, 2011). B) Close up of chasmothecia on leaf (X30) (Source Fatema, 2011). C) A chasmothecium with appendages (X100) (Source Fatema, 2011). D) Broken chasmothecia each releasing an ascus (X100) (Source Ferrari, 2007). E) Broken chasmothecia releasing an ascus (X400) (Source Jin, 2012). F) Close up of an ascus containing 8 ascospores (X800) (Source Jin, 2012).
Chasmothecia
Chasmothecium
Appendages
Broken chasmothecium
Ascus with ascospore
Ascus
Ascospore
Broken
chasmothecium
Ascus
Ascospore
Closed chasmothecium

25
Sexual reproduction of the fungus results in the formation of ascospores which are
contained in a fruiting body called chasmothecium. Initiation, development and
maturation of chasmothecia followed an orderly process. According to Gadoury et al.,
(2010) P. aphanis is a heterothallic fungus and is composed of two mutually exclusive
mating type hypha. Asalf et al., (2013) confirmed that the fungus P. aphanis is
heterothallic. However they (Asalf et al., 2013) stated that the initiation of chasmothecia
development was not only dependent upon the presence of isolates of both mating
types but they observed that initiation of chasmothecia development was suppressed at
temperatures above 130C. For this reason they (Asalf et al., 2013) stated that P. aphanis
chasmothecia development depends on heterothallism and also on temperature.
Chasmothecium development is initiated when fusion occurs between hypha of two
different mating types. Chasmothecia are produced in low light intensity or short days,
high humidity and relatively low temperature during winter.
According to Gadoury et al., (2010) initiation, development of chasmothecia and
maturation of germinable and infectious ascospores progressed through a lengthy
process over the winter and takes about 4 weeks. Chasmothecia are nearly spherical, 60
to 120 µm in diameter, dark brown and smooth with many hyphal appendages (Figure
11C) (Mukerji, 1968). They are scattered or clumped on the leaf surface (Figures 11A
and B) and each chasmothecium contains an ascus with eight ascospores (Figures 11D,
E and F). Overwintered chasmothecia release ascospores at the end of the winter or
early in the spring and visible mildew colonies can be observed within 7 to 10 days in
the renewed plant growth in spring.
Ascospores are genetically dissimilar and they are the long term survival structure of
the fungus (Moseman, 1966; Amsalem et al., 2006). Genetic recombination resulting
from sexual reproduction can produce acospores of new genotypes that display greater
virulence than parental genotypes. Ascospores are hyaline, oval, 10 to 50 µm long and 8
to 30 µm wide (Belanger and Labbe, 2002). Some researchers have concluded that they
do not play an essential role in the life history of P. aphanis (Peries, 1962a; Maas, 1998).
However, Hall et al., (2007) reported that in winter, chasmothecia developed and
survived and ascospores initiate new infections in the spring after conducive conditions
develop in the tunnels. Dodgson et al., (2005) strongly suggested that initial infection in

26
tunnels comes from disease that has over wintered in the field and not from
conidiospores blown into the tunnels. Gadoury et al., (2010) reported that chasmothecia
of P. aphanis are functional survival structures and are the source of primary inoculum
for strawberry powdery mildew epidemics.
1.2.4.5. Environmental requirements of the fungus P. aphanis
Throughout the life cycle, the fungi P. aphanis are affected by the environment in which
they are surrounded.
1.2.4.5.1. Effect of temperature
Podosphaera aphanis has a range of temperatures or a specific temperature for optimal
life cycle progression. The optimum temperature range for germination of the conidia is
18⁰C to 22.5⁰C described by Peries (1962a). Jhooty and McKeen (1965) observed in
their study that maximum germination of conidia occurred near 20⁰C. Amsalem et al.,
(2006) described that the temperature for disease development ranges from 15⁰C to
25⁰C with an optimum of approximately 20⁰C. However, temperatures below 10⁰C and
above 30⁰C have been shown to have a detrimental effect on the development of
strawberry powdery mildew (Peries, 1962a; Jhooty and McKeen, 1965). According to
Dodgson et al., (2008) optimum temperature for germination and infection is 15-250C
and optimum temperature for sporulation is 200C. All the conditions affecting the
germination and growth of P. aphanis are summarised in Table 3.
The wide range of temperature tolerance indicates that the powdery mildew pathogen
is able to survive from season to season. Jhooty and McKeen (1965) showed that conidia
attached to mildewed leaves can survive longer than 40 days at 0⁰C. During their
experiment, about 1-3% of the conidia germinated at 0⁰C. Schnathorst (1965) described
that conidia will survive for several days when exposed to below freezing temperatures,
therefore enabling the fungus to overwinter in this form.

27
Table 3: Summary of conditions that affect the life cycle of Podosphaera aphanis (data obtained from laboratory observations). (Peries, 1962a)1, (Jhooty and McKeen, 1965)2, (Amsalem et al., 2006) 3,, (Dodgson, 2008)4
1.2.4.5.2. Effect of humidity
Humidity, another component of the environment also has an effect on conidial
germination and development. Jhooty and McKeen (1965) found that maximum
development of the disease occurred at 100% RH. They also found very low levels of
disease development at 18 and 8% RH. On the other hand RH levels of 70-75% and 80-
85% gave a good result in conidiation. Amsalem et al., (2006) also found that the
production of conidia significantly decreased when the RH was above 95%. Dodgson et
al., (2008) reported that 97-100% relative humidity is optimum for germination of
conidia. However, Peries (1962a) did not observe any effect of RH on the production of
conidia in the RH range of 12-100%. Peries (1962a) also found that RH does not affect
the development of the fungus after germination. Schnathorst (1965) in his review
paper reported that free moisture is inhibitory to powdery mildew.
Variable Germination Infection Sporulation Temperature (OoC)
Minimum Optimum Maximum
21,4, 32, 53 18-22.51, 15-252,3,4, 30-351,4, 382, 353
51,2,4 18-301,4 301,2,4
131,4 202,4 352,4
Relative Humidity (%)
Minimum Optimum Maximum
121 971, 1003 1001,2,3,4
No effect1,4 No effect1,4 No effect1,4
No effect1,4 No effect1,4 No effect1,4
Presence of free water (immersion time hours)
Minimum Optimum Maximum
NA4 0,NA4 241, NA4
No effect1,4 No effect1,4 No effect1,4
No effect1,4 No effect1,4 No effect1,4
Time of day (hours)
Minimum Optimum
No effect1,4 No effect1,4
No effect1,4 No effect1,4
20.00-8.001,4 12.00-16.001,4

28
1.2.5. Control of powdery mildew
1.2.5.1. Chemical control
The vast majority of strawberry growers still use fungicides to control powdery mildew.
Dodgson (2008) stated in his thesis that some growers use as many as 20 fungicides for
control of just P. aphanis within a season. The growers apply fungicides regularly
throughout the season and especially during fruit production. Table 4 lists all of those
fungicides currently approved for use in strawberries, which provide some effective
control of powdery mildew. The use of numerous fungicides over the decades has
resulted in the development of fungicides resistance in P. aphanis. The occurrence of
fungicide resistance has been increasing gradually since the introduction of systemic
fungicides in the early 1970s.
When the growers use same mode of action of fungicides in multiple applications this
can lead to fungicide resistance developing faster than if products with different modes
of action are used. The increasing concerns for public health and the environment
because of the use of pesticides, as well as the development of powdery mildew strains
resistant to different fungicides motivate growers to seek alternative control methods
(Pertot et al., 2008) For these reasons, a need has arisen for new and effective means of
disease control that pose less risk to human health and the environment.

29
Table 4: Summary of fungicides currently approved for use in strawberry with recommendations for powdery mildew control (Anon., 2012i; Dodgson et al., 2008).
1.2.5.2. Integrated control methods
Integrated pest management (IPM) is an effective and environmentally sensitive
approach to control insects and other crop pests. IPM programmes use current,
comprehensive information on the life cycles of pests and their interaction with the
Mode of Action
Active ingredient
Trade name
Activity Harvest Interval
Max. Number of applications/year & other information
Nucleic acid synthesis
Bupirimate Nimrod Protectant, Eradicant, Systemic
1day 3 applications. Outdoor and protected crops.
Respiration Boscalid & Pyraclostrobin
Signum Protectant, Systemic
3 days Max total dose: 3.6kg/ha/year. Outdoor and protected crops.
Kresoxim-methyl
Storby WG Protectant 14 days 3 applications. Outdoor and protected crops. Do not use consecutive applications.
Signal transduction
Quinoxyfen Fortess Protectant, Systemic
14 days Max total dose: 0.5 litres/ha/year. Outdoor and protected crops.
Sterol biosynthesis in membrane
Myclobutanil Systhane20 EW Systhane 6 FLO
Protectant, Eradicant, Systemic
3 days Max total dose: 2.7 litres/ha/year. Outdoor and protected crops.
Penconazole Topas Agrovista Penco
Protectant 3 days 4 applications. Outdoor and protected crops.
Fenpropimorph Corbel
Protectant, Eradicant, Systemic
14 days 3 applications. Outdoor crops only.
Not classified
Potassium hydrogen carbonate
Potassium bicarbonate
Eradicant
Nil Unlimited. Max. Ind. dose: 20 g per litre. Max total dose: 60kg/ha/year. Outdoor and protected crops. Use food grade only. Adjuvants may be used.
Multi site contact activity
Sulphur Kumulus DF
Protectant
Nil Unlimited. Outdoor and protected crops.

30
environment. This information is used to manage pest control by the most economical
means and with the least possible hazard to people, property and the environment. IPM
can also be referred to as integrated control that uses a variety of complementary
strategies including mechanical devices, physical devices, genetic, biological, cultural
management and chemical management (Cross and Berrie, 2006). IPM can be used
wherever pest damage occurs. Historically, the main focus of IPM programmes was on a
horticultural insect pest. IPM programmes can be applied to diseases, weeds and other
pests. According to the US Environmental Protection Agency, there are 6 basic
components in IPM programmes:
1) Identify the pest
2) Understand the biology and life cycle of pests
3) Monitor pests and natural controls
4) Establish action threshold level (economic, health or aesthetics)
5) Select an appropriate combination of management practice (cultural, biological
or chemical control)
6) Evaluate the programme
An integrated approach to disease control does not remove all pesticides, but it aims to
reduce the frequency and the amount of pesticides used. This can be achieved in part by
using alternative products where appropriate. Homma et al., (1981) showed that
sodium bicarbonate has an inhibitory effect on cucumber powdery mildew. The
infection of powdery mildew in cucumber was significantly reduced by the foliar
application of a mixture of Riboflavin and Methionine (Kang, 2008). Potassium
bicarbonate has been shown to inhibit the powdery mildew of sweet red pepper and
cucurbit (Fallik et al., 1997, McGrath and Shishkoff, 1999). Potassium bicarbonate also
has a good control effect on powdery mildew on soft fruit such as strawberry (Cross and
Berrie, 2006; Dodgson, 2008). Potassium bicarbonate is an odourless, slightly basic,
salty taste, white crystalline powder. It is stable under normal conditions. Potassium
bicarbonate is soluble in water; however it is not soluble in alcohol. It is used as a
contact fungicide in a variety of crops such as grapevine, pome and stone fruit, berries
and soft fruit, vegetables and cereals (Homma et al., 1981; Sawant and Sawant, 2008).

31
Potassium bicarbonate was found to be very effective in controlling established
infection. Bicarbonate works by contact, so good leaf coverage is necessary to achieve
the optimum control. Bicarbonate does not have a harvest interval, so it is an ideal
product to use at the time fruit is being picked (Dodgson et al., 2008).
1.2.5.3. Biocontrol agents to control powdery mildew
Biological control is an alternative way to protect crops from pests and diseases
including powdery mildew disease. Powdery mildew is one of the most common
diseases in strawberry. UK strawberry growers are under pressure from retailers to
produce high quality fruit while reducing the amount of chemicals applied to control
pathogens. There are no strawberry varieties with acceptable fruit quality and
resistance to other important diseases that are also resistant to powdery mildew
(Pertot et al., 2008). Pertot et al., (2008) described in their paper that beneficial
arthropods are affected by fungicides, especially sulphur containing fungicides which
are used to control powdery mildew. Moreover, fungicides also have a detrimental
effect on the environment. All these constraints associated with the use of fungicides
and resistant cultivars have led to the search for new alternatives such as, natural
products or biocontrol agents (Kiss, 2003; Pertot et al., 2008).
The term biological control has been used in entomology and plant pathology. In
entomology, it has been used to describe the suppressing of the populations of different
pest insects by the use of live predatory insects, nematodes or microbial pathogens. In
plant pathology, the term applies to the use of microbial antagonists to suppress
diseases. In both cases, the biological control agent (BCA) used refers to the organism
that suppresses the pest or pathogen (Pal and Gardener, 2006). Moreover, the term
biological control has also been applied to the use of natural products extracted or
fermented from various sources. In general, the term biological control means the
suppression of harmful activities of one organism by one or more other organisms.
Nowadays, it is shown that suppression can be accomplished in many ways including
cultural activities such as rotations and planting of disease resistant cultivars (Pal and
Gardener, 2006). In plant pathology, biological control of plant pathogens is now an

32
established sub discipline. The amount of research in this area has increased
dramatically over the last 20 years. The use of biocontrol agents in reducing diseases
has also increased, but these are still small fractions that are used in the field in
comparison with chemical fungicides (Belanger and Labbe, 2002).
Strawberry powdery mildew has been known in the UK for over 100 years and it is still
an important disease in all parts of the world where strawberries are grown (Peries,
1962a; Maas, 1998). Powdery mildews cause significant diseases on many crops which
reduce yield and causes important economic losses. For these reasons powdery
mildews have received considerable attention from researchers to develop both
conventional (chemical) and non conventional (biological) methods of control.
Moreover, it is necessary that biological alternatives must offer special advantages to
control powdery mildew worldwide. Table 5 presents a list of biological products that
are known to have anti powdery mildew activity.
According to Belanger and Labbe, (2002), the non-chemical methods for powdery
mildew control can be classified in two ways 1) Microorganisms, which protect plants
through parasitism or antibiosis 2) Products or microorganisms which protect plants by
inducing host defence mechanisms. The fungus Ampelomyces quisqualis has the capacity
to parasitize powdery mildew pathogens (Kiss, 2003).
Ampelomyces quisqualis is now used commercially as a biocontrol agent against
powdery mildews. A formulated product (AQ10) which uses Ampelomyces quisqualis
was registered as a biocontrol agent in the late 1980’s in Australia. However, the high
humidity requirements of A. quisqualis have hampered its effectiveness (Kiss, 2003).
Ecogen Inc. has developed a new formulation and use another strain of A. quisqualis
which is effective at lower humidity. The growth of fungus is slow and it requires the
presence of powdery mildew colonies for its development. For this reason, the use of A.
quisqualis as a preventive measure makes a contradiction from an ecological point of
view (Kiss, 2003; Belanger and Labbe, 2002).

33
Table 5: Biological products or agents with anti-powdery mildew activity (modified from Belanger and Labbe, 2002).
Products Mode of action Reference Inorganic products (Synthetic and/natural
Potassium bicarbonate Fungicide Cross and Berrie 2006
Potassium silicate (Kasil) Fungicide Borel et al., 2005 Potassium silicate Fungicide Kanto et al., 2007 Potassium silicate Induced
resistance (IR) Shetty et al., 2012
Potassium silicate Physical IR Dallagnol et al., 2012
Baking soda (Sodium bicarbonate)
Fungicide Horst et al., 1992
Soluble silicon Induced resistance (IR)
Belanger et al.,1995
Whitewash or clay Physical IR Marco et al., 1994 Organic products (Synthetic and/natural)
Detergents Protectant/ Fungicide
Cohen et al., 1996
Antitranspirants Protectant Ziv and Hagiladi, 1993
Oils Protectant McGrath and Shishkoff, 2000
Plant Extracts IR Daayf et al., 1995 Reymoutria sachalinensis (Milsana) Neem kernals IR Paisini et al., 1997 (Azadirachta indica) Living organism (biological) Bacterium Bacillus
subtilis(Serenade) Parasitism/antibiosis/IR
Highland, 2000
Fungi Ampelomyces quisqualis (AQ-10)
Parasitism Sztejnberg et al., 1989
Verticillium lecanii Parasitism/antibiosis/
Askary et al., 1998
Acremonium alternatum Parasitism Malathrakis, 1985 Pseudozyma rugulosa Antibiosis Jarvis et al., 1989 Pseudozyma flocculosa
(Sporodex) Antibiosis Hajlaoui and
Belanger, 1991 Arthropod Orthotydeux lambi Parasitism Gadoury et al.,
1998
34
Verticillium lecanii, is a fungus and it has been reported to parasitize arthropods, rust
and powdery mildew fungus. The use of fungal antagonists as a biocontrol agent is not
without problems. One of the major problems is that they lose their effectiveness below
85-90% relative humidity. Another problem is that sometimes they cannot work
without the addition of an additive (Belanger and Labbe, 2002). Kiss (2003) described
that V. lecanii, P. flocculosa and T. pallescens work efficiently with the use of additive oils
to control the powdery mildew of cucumber. AQ10 biofungicides are recommended to
be used with a wetting agent. In addition, to increase the effectiveness of biocontrol
agents paraffin oils are also used. Some oils alone can give better control against
powdery mildew. For this reason, there is more understanding necessary to distinguish
the efficiency of adjuvant and bio control agent in controlling disease. Soluble silicon
has been used to protect powdery mildews on a variety of crops including
monocotyledons and dicotyledons. However, it is still not clear the exact mode of action
of silicon in reducing disease in plants. In monocotyledons, it was found that absorbed
silicon accumulates in the leaf cells and creates a mechanical barrier against the
penetration of the hyphal peg.
In dicotyledons such as cucumber, Miyake and Takahashi (1983) found that addition of
soluble silicon reduces disease development. In strawberry, Wang and Galletta (1998)
reported that foliar application of silicon induces metabolic changes in plants. Kanto et
al., (2004) in their experiment revealed that application of a silicon fertilizer reduces
powdery mildew infection in strawberries. However, the exact mode of action of silicon
in the reduction of powdery mildew disease in strawberry remains unclear. The control
of powdery mildew disease in strawberry remains a challenge for future research and
development.
1.2.6. Role of silicon in plants
Silicon (Si) is one of the most abundant elements on the surface of the earth and is also
abundant in most soils (Epstein, 1999). It is readily taken up by plants and is often
present in relatively high concentrations in plant tissues (Epstein, 1999). In some plants
the concentration of silicon sometimes exceeds the concentrations of nitrogen and
potassium (Epstein, 1994). However even taken up in high amounts it is the only

35
element that is not harmful for plants (Takahashi et al., 1990). Although it is not
considered to be an essential nutrient for terrestrial plants in general (Epstein, 1999),
silicon is often a major constituent of plant tissue.
Silicon has been shown to be a beneficial element for many and under certain
conditions, perhaps most terrestrial plants (Epstein, 1994). Silicon has been used to
prevent plant disease for centuries (Belanger et al., 1995). A number of studies have
indicated that silicon application can reduce the severity of fungal diseases. For
example, application of potassium silicate to soil reduces powdery mildew in
strawberry by 86% in the first year and 60% in the second year (Kanto et al., 2006).
Root application of 1.7 mM silicon reduced the severity of powdery mildew disease in
wheat by as much as 80% (Guevel et al., 2007). The mechanism by which silicon
protects plants from fungal attack is not well understood. Although silicon has for
centuries been used for preventing diseases in agriculture, it’s possible role in plant
physiology and in disease prevention needs more understanding and more research.
Other beneficial effects of silicon include increased growth in some plants and greater
tolerance of environmental stresses such as cold, heat, drought, salinity, mineral toxicity
or deficiency.
1.2.6.1. Silicon uptake in plants
Silicon content in plants greatly varies with species and differences in silicon content
between plant species are related to differences in the silicon uptake mechanism. Three
different modes of silicon uptake have been proposed for plants having different
degrees of silicon accumulation, that is, active, passive and rejective uptake (Takahashi
et al., 1990). Plants with an active mode of uptake take up silicon faster than water and
are classified as silicon accumulators. Plants with a passive mode of uptake take up
silicon at a rate that is similar to the uptake rate of water and are classified as an
intermediate. Plants with a rejective mode of silicon uptake take up silicon to a lower
degree than water (Takahashi et al., 1990). Plants take up silicon in the form of
monosilicic acid (H4SiO4) and it accumulates in leaves and other plant tissue primarily
as amorphous silicates (Epstein, 1994). Hydrated, amorphous silica is deposited in cell
lumens, cell walls and intercellular spaces. It also accumulates in external layers below
and above the cuticle of leaves. However, among plant species there are large

36
differences in the magnitude of silicon uptake, for example in rice the amount of silicon
taken up from cortical cells to the xylem differs from that of cucumber and tomato.
Silicon is present in roots, leaves, and the inflorescence bracts of cereals, especially in
rice, wheat, oat and barley (Epstein, 1999). The uptake of silicon by plants is not well
understood, but appears to be influenced by a number of soil and climatic factors.
1.2.6.2. Effects of silicon on plant growth and development
Silicon has been shown to play an important role in the development and growth of
plants. Silicon enhances plant growth rates and increases yield by balancing nutrient
uptake, transport and distribution. Even though from a scientific point of view silicon
was not proven to be essential for higher plants, some investigators have shown the
beneficial role of silicon in cucumber, tomato and strawberry plants (Epstein, 1999).
Rice is considered to be a silicon accumulator and a relatively large amount of plant
available silicon appears to be very important for both robust growth and fungal disease
resistance of rice (Datnoff et al., 1997). An experiment conducted by Ma et al., (2002)
showed that the addition of silicon had an effect on growth and development of rice
plants. Adatia and Besford (1986) found that addition of silicon had an effect on
cucumber leaves. They found that rigidity of mature leaves increased, the leaves had a
rougher texture and were held more horizontally and the lower leaves on the high
silicon plant were darker green and senescence was delayed. Epstein (1994) reported
that deposition of silicon in the plant tissue decreases the transpiration rate and
increases stem thickness and strength. According to Ma and Takahashi (2002) foliar
application of silicon, increases accumulation of silicon in leaves, thus increases
photosynthesis rates and increases yield.
1.2.6.3. Silicon and disease resistance in plants
One of the most thoroughly studied beneficial effects of silicon on plant health is its role
in reducing susceptibility of some plants to fungal diseases. This effect of silicon has
been particularly well documented in rice and cucumbers. Neck blast and brown spot
are two major fungal diseases which have an effect of reducing rice yield in Florida
(Datnoff et al., 1991). Datnoff et al., (1991) found that the amount of neck blast disease
reduced 73-86% and the amount of brown spot reduced 58-75% when silicon was

37
added during 1987 and 1988 growing season. Remarkably, this degree of disease
control was not significantly different from that achieved by fungicides such as benomyl
(Datnoff et al., 1997). According to Datnoff et al., (1991) rice yield also increased 56-
88% and they concluded that it might be due to addition of silicon which helps to
reduce the disease. As with rice, addition of silicon in greenhouse grown cucumber has
also been shown to decrease fungal diseases (Balanger et al., 1995; Menzies and
Belanger, 1996). Adatia and Besford (1986) found that addition of silicon has an effect
on reducing the powdery mildew infection on cucumber. Menzies et al., (1991)
investigated the effect of different rates of silicon (Potassium silicate) on powdery
mildew infection. The investigators found that silicon fertilization reduced the leaf area
covered by powdery mildew by as much as 98% (Menzies et al., 1991). Shetty et al.,
(2012) found that rose powdery mildew caused by Podosphaera pannosa was
significantly reduced by the application of silicon. Potassium silicate was used as the
source of silicon and 100 ppm was applied to the roots of rose plants. Application of
silicon increased the silicon content two to four folds compared to control plants. Silicon
application reduced the disease severity by up to 48.9%.
Despite the wide range of beneficial roles of silicon in managing disease susceptibility
there is a scientific debate, as to how silicon reduces disease in plants. One possible
mechanism is that the application of soluble silicon accumulates in the apoplast,
particularly in the epidermal cell wall. The silicon deposition in the cell wall inhibits
fungal disease by physically inhibiting fungal germ tube penetration in the epidermis
(Epstein, 1994; Samuels et al., 1993). In cucumber, Samuels et al., (1993) reported that
on silicon treated plants, germinating conidia had shorter hyphae. They also showed
that at the early stage of infection, the presence of silicon was correlated with a
decreased fungal colony. Besides these, silicon fertilization has also been shown to
decrease fungal disease susceptibility in strawberry. Kanto et al., (2007) examined the
effect of silicon fertilization on germination of conidia of strawberry powdery mildew
and also the effect of silicon on the leaf cuticle. In this experiment, silicon was added in
the hydroponic solution and strawberry leaves were inoculated with powdery mildew
conidia. Leaves were observed with a scanning electron microscope 1-2 days after
inoculation showed that the germ tube and the length of secondary hyphae were
shorter and fewer branches in comparison with the control. They (Kanto et al., 2007)

38
also reported that germination rate of powdery mildew conidia was 49.7% in silicon
treated leaves and 67.2% on untreated control leaves. In strawberry Shen et al., (2010)
investigated the effect of potassium silicate on the growth of five soil borne fungi which
slows plant growth, reduces yield and causes economic loss to the strawberry industry.
Results showed that the growth of the four fungi (Rhizoctonia solani, Pestalobiopsis
clavispora, Fusarium oxysporum and Fusarium oxysporum f. sp. fragariae) were
significantly (P<0.05) inhibited on potassium silicate amended PDA plates. However the
reduction of pH in the potassium silicate amended PDA plates was not effective to
inhibit the fungus growth. In summary, investigation indicated that reduction of fungal
diseases in strawberry plants is probably not due to the fungistatic effect of silicon, but
rather due to other mechanisms such as silicon acting as a physical barrier against
pathogen penetration or silicon induced defence response in plants.
Another mechanism through which silicon affects disease susceptibility could be the
metabolic role of silicon. Belanger et al., (2003) explained that in wheat exogenously
supplied silicon stimulated the accumulation of phenolic compounds in infected cells
and protected wheat plants from powdery mildew disease caused by Blumeria graminis
f. sp. tritici. Microscopic and ultra structural observations have described the presence
of phenolic materials associated with degraded powdery mildew haustoria in epidermal
cells of silicon treated wheat leaves (Belanger et al., 2003). Borel et al., (2005) indicated
that silicon treated wheat plants produce an antifungal compound in response to
powdery mildew infection. The phenolic compounds are highly toxic to the pathogen
and fungal hyphae are destroyed by the action of phenolic compounds. As a
consequence, the pathogen failed to colonize and for this reason disease severity
decreased (Epstein, 1994).

39
1.2.6.4. Effect of silicon on diseases caused by abiotic stresses
In addition to inhibiting fungal diseases (biotic stress) silicon has the potential to
significantly decrease the diseases caused by abiotic stresses in plants (Figure 12).
Chemical stresses include salt, metal toxicity, nutrient imbalance and physical stresses
include lodging, drought, radiation, high temperature, freezing, UV radiation and many
others (Epstein, 1999; Ma, 2004; Epstein, 2009).
`
Figure 12: Beneficial effects of silicon on plant growth in relation to biotic and abiotic stresses. Modified from (Ma and Yamaji, 2006).
Enhance resistance to biotic stress
e.g. blast, powdery mildew
e.g. stem borer, plant hopper
Disease
Pest
Reduce abiotic stress
Reduce metal toxicity
Improve nutrient imbalance
e.g. N excess, P deficiency
e.g. Al, Cd, As,Mn, Fe
Reduce salt stress
Prevent lodging
Increase resistance to low
and high temperature
Increase resistance to
drought stress
Increase resistance to
radiation stress
Chemical
stress
Stress
stress
Physical
stress
Si
40
Most of these beneficial effects are also attributed to silicon deposition in cell walls of
roots, leaves, stems, and hulls. Silicon has been shown to reduce manganese (Mn) and
iron (Fe) toxicity and also has beneficial effects on aluminium (Al) toxicity (Marshner,
1995). An early and striking demonstration of the significance of silicon in plant
nutrition was given by Williams and Vlamis (1957). They found that barley plants
grown in standard nutrient solutions in the absence of silicon developed necrotic spots
on their leaves. Necrotic spots increased when Mn concentration increased and
decreased when Mn concentration lowered. Necrotic spots disappeared with the
addition of silicon. It was also observed that the leaves of the silicon treated plants were
healthy and green and took up more Mn than the leaves of the non silicon treated
plants. The leaves of non silicon treated plants were heavily affected by necrotic spots
and took up less Mn compared to the silicon treated leaves. For this reason the authors
thought that addition of silicon to the solution did not reduce the Mn uptake, but led to a
homogeneous distribution of Mn in the leaf blade whereas in the absence of silicon, Mn
tends to be distributed non homogenously and accumulates to toxic levels in leaves
which help to build up the necrotic spots on the leaves. However, the exact mechanism
of homogeneous distribution of Mn by silicon has not been known yet.
According to Epstein (1999) deposition of silicon in leaves, culms and hulls enhances
the strength and rigidity of cell walls and reduces transpiration from the cuticle and
develops resistance to UV and drought stresses, varying temperature and lodging. The
rate of transpiration of silicon deficient rice plants increased by about 30% over the rate
of control plants (Yoshida et al., 1962). This observation suggests that silicon has a role
in transpiration. The rate of transpiration is influenced by the deposition of the silicon
on the cell wall. Silicon deposited in the cell wall forms a protective layer reducing
transpiration through the outer cells. Silicon has been shown to reduce high
transpiration caused by drought or heat stress. Water is lost faster through
transpiration when the temperature is more than 900F. This results in harmful increase
in intercellular mineral concentrations that inhibit plant function. Deposit of silicon in
the cell wall reduced transpiration loss caused by high temperatures thus allowing
continued metabolic functions at high temperature.

41
1.2.7. Leaf hairs
Trichomes and bristles generally known as leaf hairs are derived from specialized
epidermal cells on leaf or stem. These hairs are produced as a result of the outward
growth of one or more epidermal cells. The morphology and density of leaf hairs vary
considerably among plant species and may also vary among populations and within
individual plants (Werker, 2000). Trichomes serve a variety of functions such as
decrease of water loss by transpiration and lower plant temperature. They also provide
a defence against insects. Some trichomes have glands which release poisonous
substances that trap insects and other organisms. Dalin et al., (2008) showed that
glandular trichomes contribute to plant resistance against herbivorous animals,
especially insects. The structure of trichomes can range from unicellular to multi
cellular and the trichomes can be straight, spiral, hooked, branched or unbranched
(Werker, 2000). Larger trichomes may play a role as a structural defence against the
pathogen to prevent mycelia penetration and infection (Bonos et al., 2004). Bonos et al.,
(2004) investigated dollar spot, a major disease that affects the performance of creeping
bentgrasss on golf greens and fairways. In their investigation they found that resistant
clones have 42 to 64% larger trichomes than susceptible clones. Therefore they stated
that trichome size may play a role in resistance of creeping bentgrass to the dollar spot
fungus. This study aimed to investigate the relationship between density of leaf hairs
and reduction of infection by Podosphaera aphanis, the causal agent of strawberry
powdery mildew.
1.2.8. Silicon wetter Omex SW7
Omex SW7 is a silicon based wetter, designed to give enhanced uptake of foliar
nutrients. It also supplies silicon to the crop, when it is used at a higher rate. Omex SW7
is routinely used by growers to apply potassium carbonate. In order to achieve a good
spread of potassium carbonate, Omex SW7 is used as a wetter in the application of
potassium carbonate to reduce the infection of strawberry powdery mildew. Silicon is
widely recognised as a beneficial element for many crops. Omex SW7 can be applied to a
wide range of agricultural and horticultural crops, including soft fruit, field vegetables,

42
potatoes and ornamental and nursery plants. Both hard and soft water are suitable for
making the dilution. After application to the crops, it is transported in the xylem and
deposited in the epidermal cells. It acts as a physical strengthener when it forms a
complex with calcium in the cell wall (Anon., 2012h).
1.2.9. Potassium carbonate (K50)
Potassium carbonate is a concentrated inorganic formulation containing potassium and
carbonate. K50 is the trade name of this product. Potassium is a major nutrient, which is
required by all crops. The main role of the potassium in the plant is as a water regulator.
It is highly mobile and quickly distributed in the plant. Potassium carbonate (K50) is
used by the growers to decrease disease incidence such as Powdery mildew and
Botrytis. Potassium carbonate can be applied in a wide range of crops including fruit,
flower and salad crops. Recommended dose for application in fruit is 300-500 ml/100l
water. Potassium carbonate does not have a harvest interval, so application of
potassium carbonate with Omex SW7 is an ideal product to use at the time the fruit is
being picked (Anon., 2012h).
1.3. Rationale, Aims and Objectives
1.3.1 Rationale
There has been little research on the role of silicon as a nutrient supplement in
strawberries. Also there has not been research on the ability of silicon to enhance
disease resistance in strawberries. However anecdotal observations suggested that
when Omex SW7, a silicon wetter, was used to apply potassium carbonate, a synergistic
effect occurred whereby there was enhanced disease control in the presence of the
silicon wetter. It is not clear how the silicon wetter reduced the infection. Moreover, it
was not known if the application of Omex SW7 enhanced silicon levels in plant tissues.
Trichomes (containing silicon), generally known as hairs serve several functions
including protection against the attacks of herbivorous animals, especially insects.
However, there is little information available about the role of hairs during the
interaction with other organisms, especially with fungi.

43
1.3.2. Hypothesis
Application of silicon (in the form of Omex SW7) sprayed onto leaves or applied to roots
would give enhanced silicon levels in strawberry plants, stimulate formation of leaf
hairs and also reduce strawberry powdery mildew infection.
1.3.3. Aims and Objectives
1.3.3.1. Aim (overall aim)
To investigate the uptake of silicon through the leaves and roots of several varieties of
strawberry and to study the effect of enhanced silicon levels on the density and length
of leaf hairs on the leaves of strawberry plants and its role in reducing infection by
Podosphaera aphanis causal agent of strawberry powdery mildew in the field.
1.3.3.2. Objectives
To determine if there are enhanced levels of silicon in strawberry plants treated
with silicon wetter (Omex SW7) when applied on leaves (foliar application) and
to quantify the effect of applying different concentrations of silicon on the
density and length of leaf hairs of the leaves of strawberry plants.
To determine the enhanced levels of silicon in strawberry plants when applying
different concentrations of Omex SW7 (silicon wetter) to the root zone (root
application) and to assess the effect of applying different concentrations of
silicon on the density and length of leaf hairs of the leaves of strawberry plants.
To investigate the effects of silicon wetter with and without the use of potassium
carbonate to limit the development of strawberry powdery mildew in the field.

44
Chapter-2: General Materials and Methods
The strawberry varieties used in the different experiments are described below.
2.1. Elsanta
Elsanta is a mid season June-bearing variety. The high production, firmness and long
shelf life of the fruit make Elsanta extremely suitable for both growers and customers.
Elsanta has a good flavour with a strong strawberry aroma. Elsanta’s fruit has a strong
skin which makes it more insensitive to damage due to pressure, thus very suitable for
eating fresh. The juicy berries can be picked from mid-June through mid-July. The yield
of Elsanta is high to very high and can be compared with Sonata. Elsanta is
recommended for all types of cultivation, indoor as well as outdoor and from early to
fairly late in the season. However, it is susceptible to some diseases such as wilt
(Verticillium dahliae), crown rot (Phytophthora cactorum), powdery mildew
(Podosphaera aphanis) and also susceptible to frost (Anon., 2012c)
2.2. Symphony
Symphony is a late season June-bearing variety. Symphony produces similar yields to
Elsanta but with a higher proportion of marketable fruit. Symphony produces high
quality bright red firm fruit with excellent flavour and good shelf-life. High yielding,
vigorous Symphony is very good for disease resistance especially red core
(Phytophthora fragariae) and also shows resistance to vine weevil (Otiorhynchus
sulcatus). Symphony tolerates more extreme soil conditions due to its vigorous nature
and disease resistance capabilities (Anon., 2012d).
2.3. Florence
Florence is an excellent late season June-bearing variety bred by HRI East Malling.
Florence produces delicious sweet strawberries from the end of June to the end of July.
The berries have a regular conical shape with firm skin and flesh and very good flavour.
Florence is moderately resistant to powdery mildew and other fungal leaf diseases. The
variety has also shown tolerance to vine weevil (Anon., 2012a; Anon., 2012e).
2.4. Rhapsody
Rhapsody was bred by SCRI (now James Hutton Institute) and released in 1990. The
long conical fruits are medium to large, attractively glossy and with an excellent flavour.
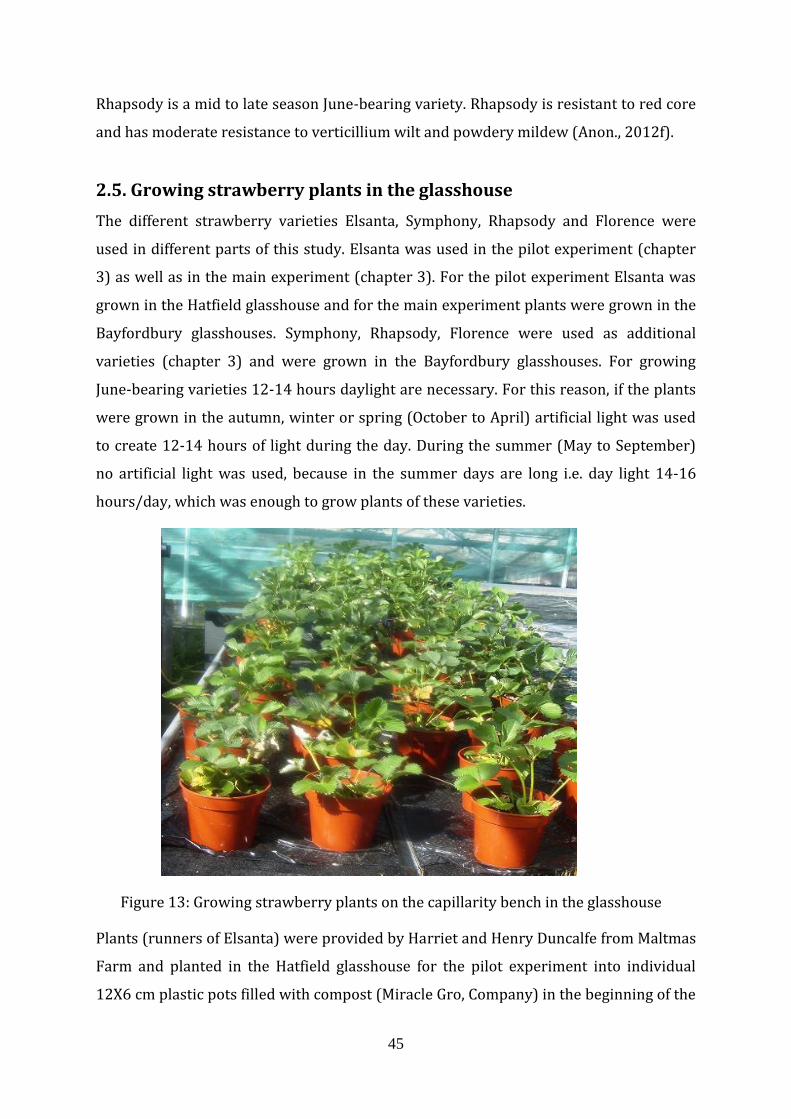
45
Rhapsody is a mid to late season June-bearing variety. Rhapsody is resistant to red core
and has moderate resistance to verticillium wilt and powdery mildew (Anon., 2012f).
2.5. Growing strawberry plants in the glasshouse
The different strawberry varieties Elsanta, Symphony, Rhapsody and Florence were
used in different parts of this study. Elsanta was used in the pilot experiment (chapter
3) as well as in the main experiment (chapter 3). For the pilot experiment Elsanta was
grown in the Hatfield glasshouse and for the main experiment plants were grown in the
Bayfordbury glasshouses. Symphony, Rhapsody, Florence were used as additional
varieties (chapter 3) and were grown in the Bayfordbury glasshouses. For growing
June-bearing varieties 12-14 hours daylight are necessary. For this reason, if the plants
were grown in the autumn, winter or spring (October to April) artificial light was used
to create 12-14 hours of light during the day. During the summer (May to September)
no artificial light was used, because in the summer days are long i.e. day light 14-16
hours/day, which was enough to grow plants of these varieties.
Figure 13: Growing strawberry plants on the capillarity bench in the glasshouse
Plants (runners of Elsanta) were provided by Harriet and Henry Duncalfe from Maltmas
Farm and planted in the Hatfield glasshouse for the pilot experiment into individual
12X6 cm plastic pots filled with compost (Miracle Gro, Company) in the beginning of the

46
September, 2008. Pots were placed on capillary matting on bench at Hatfield glasshouse
(Figure 13). Plants were watered through the capillary matting and no water was
sprayed over leaves. In September, natural daylight (12-14 hours/day) was used but
from October natural day light was only 8-9 hours/day. Artificial light (incandescent
light) which provided additional light 4-6 hours/day was therefore used to create 12-14
hours light during the day. Temperatures were approximately 18-220C during the day
and 15-180C at night. Normal plant fertilizer (organic strawberry fertilizer, Vitex Ltd)
was applied to each pot after the runners were planted in the pots. Organic strawberry
fertilizer 15ml was mixed with 4.5 litres of water (according to the manufacturer’s
instructions) and 125 ml was applied to each pot once a week and continued until the
application of the treatments. In the main experiment different strawberry varieties
such as Elsanta, Symphony, Rhapsody and Florence were grown in the Bayfordbury
glasshouses and runners were used for growing plants which were provided by Harriet
and Henry Duncalfe from Maltmas Farm. All these varieties were grown in the same
way as described above.
2.6. Application of the treatments
Treatments were not applied until the plants were well established. After about 6-7
weeks when the runner plants had 10-12 leaves, treatments were applied to the leaves
(foliar) or roots. Omex SW7 (details are described in chapter 1, section 1.2.8) was
applied as the source of silicon. Details of foliar application and root application will be
described in chapter 3 and chapter 4. Leaves were collected after completing the
application of the treatments. Details of sample collection will also be described in
chapter 3, section 3.2.2.2 and chapter 4, section 4.2.4. All leaves were washed after
collection to remove the silicon on the surface of the leaves (foliar application). Leaves
were kept in sample bags labelled with the date of collection and the treatment (rate +
timing). All samples were stored in the -70⁰C freezer. Collected leaves (number of leaves
will be mentioned in chapter 3 and chapter 4) which were used for silicon extraction
were oven dried at 67⁰C for up to 36 hours and dried leaves were then ground using
pestle and mortar. Some of the leaves collected (number of leaves will be mentioned in
chapter 3 and chapter 4) were used to measure density and length of leaf hairs using a
dissection microscope.

47
2.7. Silicon determination
In the present study, a modified form of Autoclave Induced Digestion (AID) method as
described by Elliott and Snyder (1991) was selected for the determination of the silicon
content because of its rapidity, simplicity and appropriate sensitivity. The AID method
is more rapid than other methods and involves fairly low cost equipment and a
minimum of hazardous chemicals (Elliott and Snyder, 1991).
2.7.1. Determination of the standard curve
In order to determine the concentrations of silicon present in strawberry leaves
(treated and untreated), a standard curve had to be worked out each time the
experiment was carried out. Silicon dioxide (Sigma Aldrich Company, UK) was used to
make a standard curve. The concentrations of known samples were 1.562, 3.125, 6.25,
12.5, 25, 50, 100 mg/l Si. These known concentrations would give the absorbance value,
when put in the spectrophotometer (Bausch and Lomb spec 21). From these
concentrations and absorbance value a standard curve was drawn, shown in Figure 14.
From this graph it was possible to determine the concentrations of unknown samples
by drawing a line from the absorbance of the unknown sample. The other way to do this
is by using a regression line. In this study, the known concentrations and absorbance
value from the spectrophotometer, were put into an excel program and from this excel
program a standard curve was drawn (Figure 14). By the use of the equation, Y=0.0036x
(excel program) the concentrations of unknown samples were found. In this standard
curve, concentrations were expressed in mg/l.
Figure 14: Example of a standard curve.
y = 0.0036x R² = 0.9992
0
0.05
0.1
0.15
0.2
0.25
0.3
0.35
0.4
0 20 40 60 80 100 120
Ab
sorb
ance
concentrations (mg/l)
Standard Curve
abs
Linear (abs)

48
2.7.2. Methods for extraction of silicon from strawberry leaves
Silicon content was determined by a modification of the autoclave induced digestion
method. The extraction procedure was similar to Elliott and Snyder (1991); however
the amount of H2O2, NaOH and other chemicals used according to Taber et al., (2002).
The following chemicals used in the AID methods were bought from the Sigma Aldrich Company, UK. 1) Hydrogen peroxide (H2O2)
2) Sodium Hydroxide (NaOH)
3) Boric acid (H3BO3)
4) Tartaric acid (CHOH.CHOH)2
5) Ammonium molybdate (NH4)6MO7O24.4H2O
6) Sodium sulfite (Na2SO3)
7) 1 amino-2 napthol-4 sulphonic acid (NH2C10H5(OH)SO3H)
8) Sodium bisulfite (NaHSO3)
2.7.2.1. Preparation of solutions
Sodium Hydroxide (50%): 50 g of sodium hydroxide pellets were dissolved in 100 ml of
DI (Deionized or Demineralised) water.
Boric acid (2.5%): 2.5 g of boric acid were dissolved in 100 ml of DI water.
Tartaric acid (20%): 20 g of tartaric acid were dissolved in 100 ml of DI water
Ammonium molybdate (54 g/l, pH 7): 54 g of ammonium molybdate were dissolved in
1000 ml of DI water. After mixing with DI water the pH of the solution was measured
using the pH meter (Mettler Toledo). The pH of the solution was adjusted to 7 by using
NaOH or HCl (Hydrochloric acid). If the pH of the solution was more than 7 then HCl
was added on the other hand, when the pH of the solution was less than 7 then NaOH
was added.
The reducing solution was made by combining the two solutions (solution A and B).
Solution A was made by adding 2 g of Na2SO3 and 0.4 g of 1-amino-2-napthol-4-sulfonic
acid in 25 ml DI and solution B was made by 25 g of NaHSO3 dissolved in 200 ml DI
water. Solution A and B were mixed together and brought to 250 ml final volume with
DI.

49
2.7.2.2. Extraction of silicon from ground leaves
1) First of all 100 mg samples (dried ground leaves) were added to an autoclave
resistant 100 ml polyethylene bottle. Then 3.0 ml of 50% H2O2 were added to moisten
the samples followed by the addition of 3.5 ml of 50% NaOH.
2) The bottles were gently vortexed and the bottles were individually covered with
loose fitting plastic caps and autoclaved for 1 hour at 138 kPa at 1200C. When the
contents cooled, then the solutions were quantitatively transferred to 50 ml
polyethylene tube through an ashless coarse filter paper.
3) The silicon content was then determined colorimetrically using the procedure
described below.
4) 1 ml was taken from the digested plant tissue (mentioned above in step 2) and 3 ml
of 2.5% boric acid was added and the solution mixed by inversion. The next step was
the addition of 1 ml of ammonium molybdate (54 g/l, pH 7) solution. The mixture of the
solution was left to stand for 5 minutes.
5) 0.5 ml of 20% tartaric acid was then added, the solution was shaken and finally 0.5
ml of the reducing solution was added.
6) After addition of all the reagents including the reducing solution (section 2.7.2.1) the
final volume of the solution was made up to 10 ml with adding DI water. The mixture
was allowed to stand for 30 minutes before taking the reading of absorbance at 650 nm
by a spectrophotometer (Bausch and Lomb Spec 21). Glassware contains silicon;
therefore to avoid contamination all equipment used was polyethylene or
polycarbonate that had been rinsed with 0.1M NaOH.
7) A standard curve which had been prepared earlier (section 2.7.1) was used to
determine the silicon content in the plant material. The value of x (concentration) for
any given value of y (absorbance) was calculated using the following equation:
y=0.0036x (regression equation from standard curve)
Silicon content was calculated, adjusted for weight of plant material used and expressed
as mg/kg silicon in dry matter using the following equation:
Si in extract (mg/l)*10
Si (mg/kg) =
Sample size (g)

50
For an example, sample A (100 mg) has an absorbance value y=0.044 (at 650 nm with
spectrophotometer). To calculate the value of x (concentration of Si) the equation
y=0.0036x was used.
0.044 = 0.0036x
Now x= 12.22 mg/l (concentrations of Si).
To convert Si concentrations mg/l into mg/kg used the formula given above.
That is
Si in extract (mg/l)*10
Si (mg/kg) =
Sample size (g)
12.22*10
Si (mg/kg) =
0.1
Concentrations of Si = 1222 mg/kg
8) All above methods were done in triplicate and the results were analyzed by
statistical (section 2.9) procedure.
2.7.2.3. Determination of silicon in the different treatments
Different treatments were used in this study (chapters 3, 4 and 5). Standard, high and
very high concentrations of silicon were made by adding DI water to 2.5 ml, 25 ml and
50 ml Omex SW7 respectively and made the final volume 1000 ml. After that 1 ml was
taken from 1000 ml for each treatment (standard, high and very high) and the amounts
of silicon in the different treatments were determined colorimetrically following the
steps from (4 to 6) described above (section 2.7.2.2). A standard curve which was
prepared before (section 2.7.1) was used to determine the silicon content in the
different treatments. The value of x (concentration) for any given value of y
(absorbance) was calculated using the following equation:
y=0.0036x (regression equation from standard curve)
Using the above equation the value of x (concentrations of silicon) in the different
treatments was calculated and expressed in mg/l.
51
2.8. Microscopic observation of density and length of leaf hairs
In order to determine the density and length of leaf hairs, 20 leaves from each treatment
group were examined under the microscope. There were 4 leaflets in each leaf in the
different varieties (Elsanta, Rhapsody, Florence and Symphony) of strawberry plants.
To identify the effect of silicon on the density and length of leaf hairs a 1cm2 square was
cut out of a piece of Acetate Sheet and used as a quadrat. This 1cm2 square was placed
six times randomly on the adaxial (upper) and abaxial (lower) surface of the leaf.
Number of leaf hairs on each 1cm2 on the upper and lower leaf surfaces were
determined by observing the leaves under the dissection microscope (Hampshire Micro,
Meiji EMZ-TR) using a X30 magnification. The length of leaf hairs were measured using
a microscope eyepiece graticule. To measure the length of leaf hairs, a 1cm2 quadrat
was placed on the upper and lower surface of the leaf. The lengths of 10 leaf hairs from
each quadrat were measured using the eyepiece graticule in the dissection microscope
(X30). This was repeated for the remaining 3 leaflets from each leaf and also repeated
for the remaining leaves. Average number and length of leaf hairs were calculated from
20 leaves and results were analysed using the statistical procedure described below.
2.9. Data analysis
Data were analysed using the statistical software program, SPSS for windows, version
17. Data were analysed by one way ANOVA (analysis of variance) under the Compare
Mean in the SPSS version 17. Individual means were subjected to further post-hoc
analyses using Tukey’s HSD (Honestly Significant Difference) test to determine the
differences between treatments. Homogeneous subsets were used to differentiate the
treatment in different groups. A value of P<0.05 was considered to be statistically
significant. Pearson’s correlation and linear regression analysis were used to find the
relationship between silicon level and density and length of leaf hairs.

52
Chapter -3: An investigation of the effect of foliar application of silicon (Omex SW7) on strawberry plants in the glasshouse 3.1. Introduction
Even though from a scientific point of view silicon is not considered as an essential
nutrient for most plants to complete their life cycle, it has been reported that silicon
reduces the effects of biotic and abiotic stresses (Epstein, 2009). Silicon is the second
most abundant element in mineral soils and this is perhaps the reason that silicon has
been under evaluated as an important nutrient for so many years. Moreover, little
research has been performed and there is limited availability of commercial silicon
supplements or concentration recommendations for different crops. Recently, there has
been an increased interest for sustainable crop production and silicon can contribute to
that direction with its prophylactic properties and promotion of plant health. Several
studies have found that silicon enhances metabolic function and plant growth rates by
balancing nutrient uptake, distribution and transport and increasing chlorophyll
concentration in leaves resulting in improved pollen fertility and increased yield
(Epstein, 1994; Wang and Galletta, 1998; Ma and Takahashi, 2002). Lewin and Reimann
(1969) in their review paper said that silicon is responsible for improved growth of a
wide variety of plant species, both monocotyledons and dicotyledons. Various
symptoms develop when silicon is absent or present in only small amounts.
Although the beneficial effects of silicon on plant growth and development have been
observed in a wide variety of plant species, little information is available about foliar
application of silicon on plant growth and development. Menzies et al., (1992) reported
that foliar application of silicon was absorbed through the cuticle and was transported
in the xylem and deposited in the epidermal cell, cell wall of the leaves and also
deposited in other parts of the plants (mentioned in chapter 1). In rice, silicon
accumulates in the epidermal cells of the leaves, motor cells and hulls. The deposition of
silicon enhances the strength and rigidity of cell walls and thus increases the resistance
of rice to diseases and pests (Epstein, 1999; Ma and Takahashi, 2002). Beneficial effects
of silicon on rice have been reported by several workers; however the response of
dicotyledons to silicon has received less attention. Strawberry is a dicotyledon, as is
cucumber and contains less silicon than cucumber (Kanto et al., 2007). Wang and

53
Galletta (1998) found that strawberry plants fertilised with silicon produce more dry
matter in roots and shoots and they also described that plants sprayed with silicon had
enhanced strawberry plant growth. Epstein (1994) reported that deposition of silicon in
the plant tissue decreases the transpiration rate and increases stem thickness and
strength. Omex SW7 is a silicon based wetter which is routinely used by the growers on
different crops including strawberry. However, it is not clear that application of Omex
SW7 can enhance the silicon levels in plant tissues. The hypothesis tested in this chapter
was that application of silicon (Omex SW7) to the leaves of the different varieties of
strawberry would lead to enhanced levels of silicon in the plants. The enhanced levels of
silicon in the plants would lead to morphological changes in the leaves with regard to
the formation of a greater number and longer leaf hairs of all the varieties used.
3.1.1. Objectives
To investigate the effect of foliar application of Omex SW7 on the accumulation
of silicon in the leaves of strawberry plants of all the varieties used in this study.
To investigate the effect of foliar application of Omex SW7 on the morphological
changes that occurs in the leaves with regard to the modification of leaf hair
length and density of different varieties used in this study.
To determine the relationships between accumulation of silicon and density and
length of leaf hairs of all the varieties used in this study.
3.2. Materials and Methods 3.2.1. Pilot experiment A pilot experiment was conducted in the glasshouse at the College Lane Campus. The
strawberry variety Elsanta was used in the pilot experiment and the plants of Elsanta
were grown on the capillarity bench of the Hatfield glasshouse which was described in
chapter 2, section 2.5. In the pilot experiment 80 plants were grown and finally 64
healthy plants were selected for the experiment. Silicon wetter (Omex SW7) was used
as the source of silicon. The recommended dose of the silicon wetter is 0.1-0.25%
dilution with foliar nutrients in a minimum of 200 l/ha water.

54
There were two different application rates (standard and high) and the product was
applied at two different timings (sprayed each week for 5 weeks i.e. 5 sprays and
sprayed in weeks 1 and 5 i.e. 2 sprays). There were two controls, one where the plants
were sprayed with water alone and a second where plants received no foliar spray.
Different treatments in the pilot experiment are shown in Table 6. The treatments were
applied to 2 different blocks (Block A and Block B) which were situated in one
glasshouse cubicle. Within each block each treatment occurred once and the treatments
were distributed randomly (Table 7A). Each block was divided into 6 rows and each
row consisted of 4 plants. The treatments which were applied in the different rows of
block A are shown in Table 7B, and the treatments in block B are shown in Appendix 1.
The pilot experiment helped design of the main experiment which was conducted at
Bayfordbury glasshouse.
Table 6: Treatment rates and spray timings
Treatment rates and spray timings
Standard (Omex SW7at 0.25%) which contains 27.02 mg/l Si was applied each week
for 5 weeks (total 5 sprays)
Standard (Omex SW7 at 0.25%) which contains 27.02 mg/l Si was applied in weeks
1 and 5 (total 2 sprays)
High (Omex SW7 at 2.5%) which contains 270.20 mg/l Si was applied each week for
5 weeks (total 5 sprays)
High (Omex SW7 at 2.5%) which contains 270.20 mg/l Si was applied in weeks 1
and 5 (total 2 sprays)
Water (only) was applied each week for 5 weeks (total 5 sprays)
Water (only) was applied in weeks 1 and 5 (total 2 sprays)
Untreated (control)

55
Table 7A: Distribution of treatments in the Hatfield glasshouse (variety Elsanta)
Block Row Treatment Block Row Treatment
A
1 Standard-(2 sprays)
B
9 Control 2 Control 10 High-(5 sprays)
3 High-(5 sprays) 11 Water-(2 sprays)
4 Water-(5 sprays) 12 High-(2 sprays)
5 High-(2 sprays) 13 Standard-(2 sprays)
6 Standard-(5 sprays) 14 Standard-(5 sprays)
7 Control 15 Water-(5 sprays)
8 Water-(2 sprays) 16 Control
Table 7B: Randomised distribution of the treatments, date of application of the treatments and leaf collections from different rows of block A (variety Elsanta).
Block
Row numbers and treatments
Application of the treatments date Leaf collection
A
Week 1 14.10.08
Week 2 21.10.08
Week 3 28.10.08
Week 4 4.11.08
Week 5 11.11.08
Week 6 18.11.08
Row-1 Standard (sprayed twice weeks 1 and 5)
Standard
Standard Collection of leaves
Row-2 Control
Control
Control Control Control Control Collection of leaves
Row-3 High weekly (sprayed 5 times)
High
High High High High Collection of leaves
Row-4 Water weekly (sprayed 5 times)
Water Water Water Water Water Collection of leaves
Row-5 High (sprayed twice, weeks 1 and 5)
High
High Collection of leaves
Row-6 Standard weekly (sprayed 5 times)
Standard
Standard Standard Standard Standard Collection of leaves
Row-7 Control
Control
Control Collection of leaves
Row-8 Water (sprayed twice weeks 1 and 5)
Water Water Collection of leaves
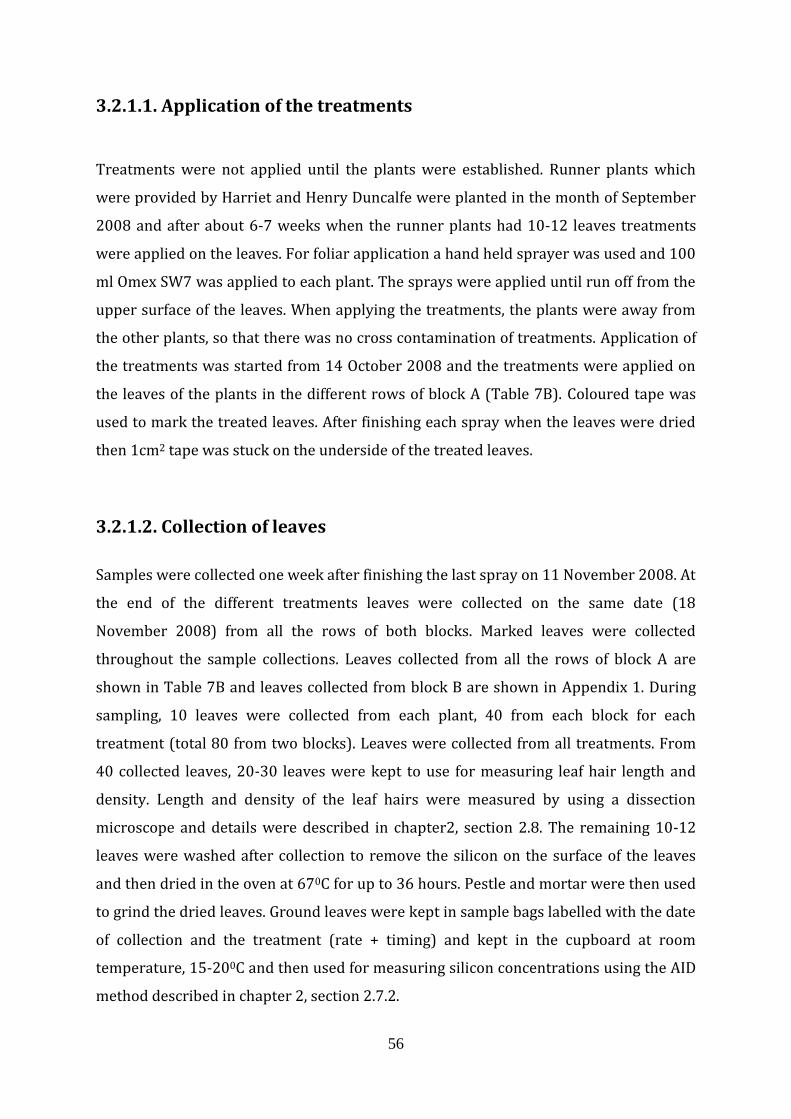
56
3.2.1.1. Application of the treatments
Treatments were not applied until the plants were established. Runner plants which
were provided by Harriet and Henry Duncalfe were planted in the month of September
2008 and after about 6-7 weeks when the runner plants had 10-12 leaves treatments
were applied on the leaves. For foliar application a hand held sprayer was used and 100
ml Omex SW7 was applied to each plant. The sprays were applied until run off from the
upper surface of the leaves. When applying the treatments, the plants were away from
the other plants, so that there was no cross contamination of treatments. Application of
the treatments was started from 14 October 2008 and the treatments were applied on
the leaves of the plants in the different rows of block A (Table 7B). Coloured tape was
used to mark the treated leaves. After finishing each spray when the leaves were dried
then 1cm2 tape was stuck on the underside of the treated leaves.
3.2.1.2. Collection of leaves
Samples were collected one week after finishing the last spray on 11 November 2008. At
the end of the different treatments leaves were collected on the same date (18
November 2008) from all the rows of both blocks. Marked leaves were collected
throughout the sample collections. Leaves collected from all the rows of block A are
shown in Table 7B and leaves collected from block B are shown in Appendix 1. During
sampling, 10 leaves were collected from each plant, 40 from each block for each
treatment (total 80 from two blocks). Leaves were collected from all treatments. From
40 collected leaves, 20-30 leaves were kept to use for measuring leaf hair length and
density. Length and density of the leaf hairs were measured by using a dissection
microscope and details were described in chapter2, section 2.8. The remaining 10-12
leaves were washed after collection to remove the silicon on the surface of the leaves
and then dried in the oven at 670C for up to 36 hours. Pestle and mortar were then used
to grind the dried leaves. Ground leaves were kept in sample bags labelled with the date
of collection and the treatment (rate + timing) and kept in the cupboard at room
temperature, 15-200C and then used for measuring silicon concentrations using the AID
method described in chapter 2, section 2.7.2.

57
3.2.2. Main experiment
The main experiment was conducted in the Bayfordbury glasshouse and Elsanta was
used. In the main experiment (210-215) runners (Elsanta) were used to grow the plants
and finally 192 healthy plants were selected for the experiment. In April 2009 runners
were planted in the 12x6 cm pots filled with compost and pots were placed on the
capillarity bench in the glasshouse. Temperatures were approximately 15-200C during
the day and 12-150C at night. In April, natural daylight (8-9 hours/day) and artificial
light which provided additional light 4-6 hours/day were used and from May to July
natural day light (12-14 hours/day) was used and no artificial light was used. Normal
plant fertilizer described in chapter 2 (section 2.5) was provided to all the pots. Plants
were watered through the capillarity bench and no water was spread over the leaves.
There were three different application rates and the product was applied at three
different timings. Control plants received no foliar spray. Different treatments in the
main experiment are shown in Table 8. The treatments were applied to 4 different
blocks (Block A, B, C and D). Each block was divided into 12 rows and each treatment
was applied to an individual row which consisted of 4 plants. Within each block each
treatment occurred once and they were distributed randomly (Table 9A). Each
treatment was applied to 16 plants (4 rows from 4 different blocks). Block A and B were
situated in one glasshouse cubicle and block C and D were situated in another
glasshouse cubicle. Distribution of the treatments and application of the treatments and
leaf collections from different rows of block A are shown in Table 9B and from block B,
C, and D are shown in Appendix 2.
3.2.2.1. Application of the treatments
The treatments were applied when the plants had 10-12 leaves, as described in the
previous section 3.2.1.1. The method used for the application of the treatments was
described in the previous section 3.2.1.1. and Omex SW7 (100 ml) was applied to each
plant with a hand held sprayer. Application of the treatments was started from 8 June
2009. On 8 June all the treatments were applied on the leaves of the plants in the
different rows of block A (Table 9B). After finishing each spray when the leaves were
dried then 1cm2 coloured tape was stuck on the underside of the treated leaves
(mentioned in section 3.2.1.1.).

58
Table 8: Treatment rates and spray timings
Treatment rates and spray timings
Standard (Omex SW7 at 0.25%) which contains 27.02 mg/l Si was applied each
week for 5 weeks (total 5 sprays)
Standard (Omex SW7 at 0.25%) which contains 27.02 mg/l Si was applied in
weeks 1, 3 and 5 (total 3 sprays).
Standard (Omex SW7 at 0.25%) which contains 27.02 mg/l Si was applied in
weeks 1 and 5 (total 2 sprays)
High (Omex SW7 at 2.5%) which contains 270.20 mg/l Si was applied each week
for 5 weeks (total 5 sprays).
High (Omex SW7 at 2.5%) which contains 270.20 mg/l Si was applied in weeks 1,
3 and 5 (total 3 sprays).
High (Omex SW7 at 2.5%) which contains 270.20 mg/l Si was applied in weeks 1
and 5 (total 2 sprays).
Very high (Omex SW7 at 5%) which contains 540.40 mg/l Si was applied each
week for 5 weeks (total 5 sprays).
Very high (Omex SW7 at 5%) which contains 540.40 mg/l Si was applied in week
1, 3 and 5 (total 3 sprays).
Very high (Omex SW7 at 5%) which contains 540.40 mg/l Si was applied in weeks
1 and 5 (total 2 sprays).
Untreated (control).
3.2.2.2. Collection of leaves
Leaves were collected on 11 July 2009 from all the rows of 4 different blocks after the
application of the last treatment on 4 July. Treated and untreated (control) leaves were
collected from four different blocks (A-D). Treated and untreated (control) leaves
collected from different rows of block A are shown in Table 9B and leaves collected
from block B, C and D are shown in Appendix 2. During the collection of samples marked
leaves were collected. During sampling 40 leaves were collected from each block for
each treatment (10 leaves from each plant). Collected leaves were used for measuring

59
hair length, density and measuring silicon concentrations as described in the previous
section 3.2.1.2.
Table 9A: Distribution of treatments in the Bayfordbury glasshouse (variety Elsanta)
Block Row Treatment
Block Row Treatment
A
1 Standard-(2 sprays)
B
13 High-(3 sprays)
2 High-(3 sprays) 14 Control 3 Control 15 Standard-(3 sprays)
4 Very high-(2 sprays) 16 High-(5 sprays)
5 Very high-(3 sprays) 17 Very high-(5 sprays)
6 High-(5 sprays) 18 Control 7 High-(2 sprays) 19 High-(2 sprays)
8 Standard-(3 sprays) 20 Standard-(2 sprays)
9 Control 21 Standard-(5 sprays)
10 Standard-(5 sprays) 22 Very high-(3 sprays)
11 Very high-(5 sprays) 23 Very high-(2 sprays)
12 Control 24 Control
Block Row Treatment
Block Row Treatment
C
25 Standard-(5 sprays)
D
37 High-(2 sprays)
26 Control 38 Very high-(2 sprays)
27 Standard-(3 sprays) 39 Control 28 High-(2 sprays) 40 Standard-(3 sprays)
29 High-(3 sprays) 41 Standard-(5 sprays)
30 Very high-(3 sprays) 42 Control 31 Very high-(2 sprays) 43 High-(5 sprays)
32 Control 44 High-(3 sprays)
33 High-(5 sprays) 45 Standard-(2 sprays)
34 Standard-(2 sprays) 46 Very high-(3 sprays)
35 Very high-(5 sprays) 47 Very high-(5 sprays)
36 Control 48 Control

60
Table 9B: Randomised distribution of the treatments, date of application of the treatments and leaf collections from different rows of block A (variety Elsanta).
Block Row numbers and treatments
Application of the treatments date Leaf collection
A
Week 1 8.06.09
Week 2 15.06.09
Week 3 22.06.09
Week 4 29.06.09
Week 5 4.07.09
Week 6 11.07.09
Row-1 Standard sprayed twice (weeks 1 and 5)
Standard Standard Collection of leaves
Row-2 High sprayed 3 times (weeks 1, 3 and 5)
High High High Collection of leaves
Row-3 Control
Control Control Control Control Control Collection of leaves
Row-4 Very high sprayed twice (weeks 1 and 5)
Very high Very high Collection of leaves
Row-5 Very high sprayed 3 times (weeks 1, 3 and 5)
Very high Very high Very high Collection of leaves
Row-6 High weekly (sprayed 5 times)
High High High High High Collection of leaves
Row-7 High sprayed twice (weeks 1 and 5)
High High Collection of leaves
Row-8 Standard sprayed 3 times (weeks 1, 3 and 5)
Standard Standard Standard Collection of leaves
Row-9 Control
Control Control Control Collection of leaves
Row-10 Standard weekly (sprayed 5 times)
Standard Standard Standard Standard Standard Collection of leaves
Row-11 Very high weekly (sprayed 5 times)
Very high Very high Very high Very high Very high Collection of leaves
Row-12 Control
Control Control Collection of leaves

61
3.2.3. Main experiment (used different varieties)
This experiment investigated the uptake of silicon in different varieties, Rhapsody,
Florence, Symphony and Elsanta. This experiment was conducted in the Bayfordbury
glasshouse. Runners (35-40) from each variety were used to grow the plants in the
beginning of the September 2009 and finally 24 healthy plants for each variety were
selected for the experiment. Runners of different varieties were grown in the glasshouse
which was already described in chapter 2, section 2.5. Temperature and day light were
used, as described in chapter 2, section 2.5. There were two different application rates
and control. There were 3 different treatments for each variety (Table 10). The
treatments were divided into 2 blocks of 4 plants each. Control plants received no foliar
spray. Within each block each treatment appeared once and they were distributed
randomly (Table 11A). There were 4 blocks (A-D) situated in 2 glasshouses at
Bayfordbury. Block A and B were situated in one glasshouse cubicle and block C and D
were situated in the other glasshouse cubicle (mentioned in section 3.2.2). Distribution
of treatments and application of the treatments in block A and B are shown in Table 11B
and in block C and D are shown in Appendix 3.
3.2.3.1. Application of the treatments
The method for the application of the treatments was also used here which is described
in the section 3.2.1.1. Application of the treatments was started from 16 October 2009.
On 16 October all the treatments were applied on the leaves of the plants in the
different rows of block A and B. After that treatments were applied on 23, 30 October
and then on 7 and 14 November 2009. After finishing each spray when the leaves were
dried then 1cm2 coloured tape as mentioned in section 3.2.1.1. was used to mark the
treated leaves.

62
Table 10: Treatment rates and spray timings
Variety Name of the treatments
Elsanta Standard (Omex SW7 at 0.25%) which contains 27.02 mg/l Si was applied each week for 5 weeks (total 5 sprays)
Elsanta
High (Omex SW7 at 2.5%) which contains 270.20 mg/l Si was applied each week for 5 weeks (total 5 sprays)
Elsanta
Untreated (control)
Symphony Standard (Omex SW7 at 0.25%) which contains 27.02 mg/l Si was applied each week for 5 weeks (total 5 sprays)
Symphony High (Omex SW7 at 2.5%) which contains 270.20 mg/l Si was applied each week for 5 weeks (total 5 sprays)
Symphony Untreated (control)
Florence Standard (Omex SW7 at 0.25%) which contains 27.02 mg/l Si was applied each week for 5 weeks (total 5 sprays)
Florence High (Omex SW7 at 2.5%) which contains 270.20 mg/l Si was applied each week for 5 weeks (total 5 sprays)
Florence Untreated (control)
Rhapsody Standard (Omex SW7 at 0.25%) which contains 27.02 mg/l Si was applied each week for 5 weeks (total 5 sprays)
Rhapsody High (Omex SW7 at 2.5%) which contains 270.20 mg/l Si was applied each week for 5 weeks (total 5 sprays)
Rhapsody Untreated (control)

63
Table 11A: Distribution of treatments in the Bayfordbury glasshouse (different varieties)
Block Variety Row Treatment
Block Variety Row Treatment
A
Elsanta
1 Standard-(5 sprays)
B
Florence 7 Control
Elsanta
2 Control
Florence
8 High-(5 sprays)
Elsanta
3 High-(5 sprays)
Florence
9 Standard-(5 sprays)
Symphony
4 High-(5 sprays)
Rhapsody
10 Standard-(5 sprays)
Symphony
5 Standard-(5 sprays)
Rhapsody
11 High-(5 sprays)
Symphony
6 Control
Rhapsody
12 Control
Block Variety Row Treatment
Block Variety Row Treatment
C
Symphony
13 Standard-(5 sprays)
D
Rhapsody 19 Control
Symphony
14 Control
Rhapsody
20 High-(5 sprays)
Symphony
15 High-(5 sprays)
Rhapsody
21 Standard-(5 sprays)
Elsanta
16 High-(5 sprays)
Florence
22 Standard-(5 sprays)
Elsanta
17 Standard- (5 sprays)
Florence
23 High-(5 sprays)
Elsanta
18 Control
Florence
24 Control

64
Table 11B: Randomised distribution of the treatments, date of application of the treatments and leaf collections from different rows of blocks A and B (different varieties).
3.2.3.2. Collection of leaves
Leaves were collected on 21 November 2009 from all the rows of 4 blocks after the
application of the final spray on 14 November 2009. During the collection of samples
only marked leaves were collected. Treated (weekly) and untreated leaves from four
Blocks Variety Row numbers
and treatments
Applications of the treatments date Leaf collections
A Week 1 16.10.09
Week 2 23.10.09
Week 3 30.10.09
Week 4 7.11.09
Week 5 14.11.09
Week 6 21.11.09
Elsanta Row-1 Standard (5 sprays)
Standard Standard Standard Standard Standard Collection of leaves
Elsanta Row-2 Control
Control Control Control Control Control Collection of leaves
Elsanta Row-3 High (5 sprays)
High High High High High Collection of leaves
Symphony Row-4 High (5 sprays)
High High High High High Collection of leaves
Symphony Row-5 Standard (5 sprays)
Standard Standard Standard Standard Standard Collection of leaves
Symphony Row-6 Control
Control Control Control Control Control Collection of leaves
B Florence Row-7 Control
Control Control Control Control Control Collection of leaves
Florence Row-8 High (5 sprays)
High High High High High Collection of leaves
Florence Row-9 Standard (5 sprays)
Standard Standard Standard Standard Standard Collection of leaves
Rhapsody Row-10 Standard (5 sprays)
Standard Standard Standard Standard Standard Collection of leaves
Rhapsody Row-11 High (5 sprays)
High High High High High Collection of leaves
Rhapsody Row-12 Control
Control Control Control Control Control Collection of leaves

65
different varieties were collected from four different blocks (A-D). Treated and
untreated (weekly) leaves from four different varieties were collected from different
rows of block A and B are shown in Table 11B and leaves collected from block C and D
are shown in Appendix 3. During sampling 10 leaves from each plant, 40 from each
block were collected. Leaf samples were collected in a similar way from all varieties and
all the treatments. Some of the leaves collected were used for measuring hair length and
density, as described in the Chapter 2, section 2.8. The remaining leaves were used for
measuring silicon concentrations, as described in the chapter 2, section 2.7.2.
3.2.4. Data analysis
Statistical method one way ANOVA under the Compare Mean in the SPSS version 17 was
used to analyse the data of concentrations of silicon in strawberry leaves, density and
length of leaf hairs after foliar application of different concentrations of Omex SW7 in
different varieties (Elsanta, Rhapsody, Florence and Symphony). Tukey’s HSD test and
homogeneous subsets also used here to differentiate the treatment in different groups
and the relationships between accumulation of silicon and density and length of leaf
hairs of all the varieties used in this study were determined by using the method
described in section 2.9.
3.3. Results
3.3.1. Pilot experiment in Hatfield Glasshouse
Strawberry variety Elsanta was used in the pilot experiment. Leaves collected from
Elsanta after different treatments showed different levels of silicon concentrations
(Figure 15). It was observed that there were significant differences in silicon
concentrations in different treatments. All treated plants showed significantly higher
(P<0.05)) silicon concentrations compared to that in leaves collected from the
untreated control and water treated plants. Leaves collected from control (untreated)
and water treated plants showed the background level of silicon in strawberry plants.
No significant difference (P>0.05) in silicon concentrations was observed between the
leaves collected from water treated plants and control plants (Appendix 11). Therefore

66
silicon concentrations from water treated plants were not shown in the results (Figure
15). Because of this when the main experiment was conducted in the Bayfordbury
glasshouse the untreated control was used as a control. Standard and high
concentrations of Omex SW7 were applied weekly and a total of 2000 ml (400 ml X 5
times) Omex SW7 was applied. Similarly when Omex SW7 was applied in weeks 1 and 5,
a total of 800 ml (400 ml X 2 times) Omex SW7 was applied. Spectrophotometric
analysis showed that a 2000 ml Omex SW7 contained 54.04 mg Si (standard), 540.40
mg Si (high) and 800 ml Omex SW7 contained 21.61 mg Si (standard) and 216.16 mg Si
(high). When different concentrations of Omex SW7 were applied weekly,
concentrations of silicon in the leaves were 18.22 mg/l Si (standard), 23.74 mg/l Si
(high) and 11.30 mg/l Si (control). When different concentrations of silicon were
applied in weeks 1 and 5 concentrations of silicon in the leaves were 14.29 mg/l Si
(standard), 19.39 mg/l Si (high) and 11.03 mg/l Si (control). However, the silicon
concentrations measured by the spectrophotometer were adjusted with the weight of
plant material (dried leaf) used and expressed as mg/kg silicon in dried leaf tissue
(Figure 15).
Figure 15: Concentrations of silicon in strawberry leaves (variety Elsanta) sprayed weekly (total 5 sprays) and weeks 1 and 5 (total 2 sprays) with different concentrations (standard, high) of silicon wetter and control (no application). Samples were collected one week after the final spray. Each value represents the mean of 6 replications (n=6). Means (± standard error of means) followed by different letters indicate significant differences (P<0.05) between treatments as indicated by Tukey’s HSD (Post-hoc test) in the statistical software program, SPSS for Windows version 17.
a
c
e
a b
d
0
500
1000
1500
2000
2500
3000
3500
4000
4500
5000
Control Standard High
Co
nce
ntr
atio
ns
of
silic
on
(m
g/K
g)
Treatment
Weekly (total 5 sprays)
Weeks 1 and 5 (total 2 sprays)
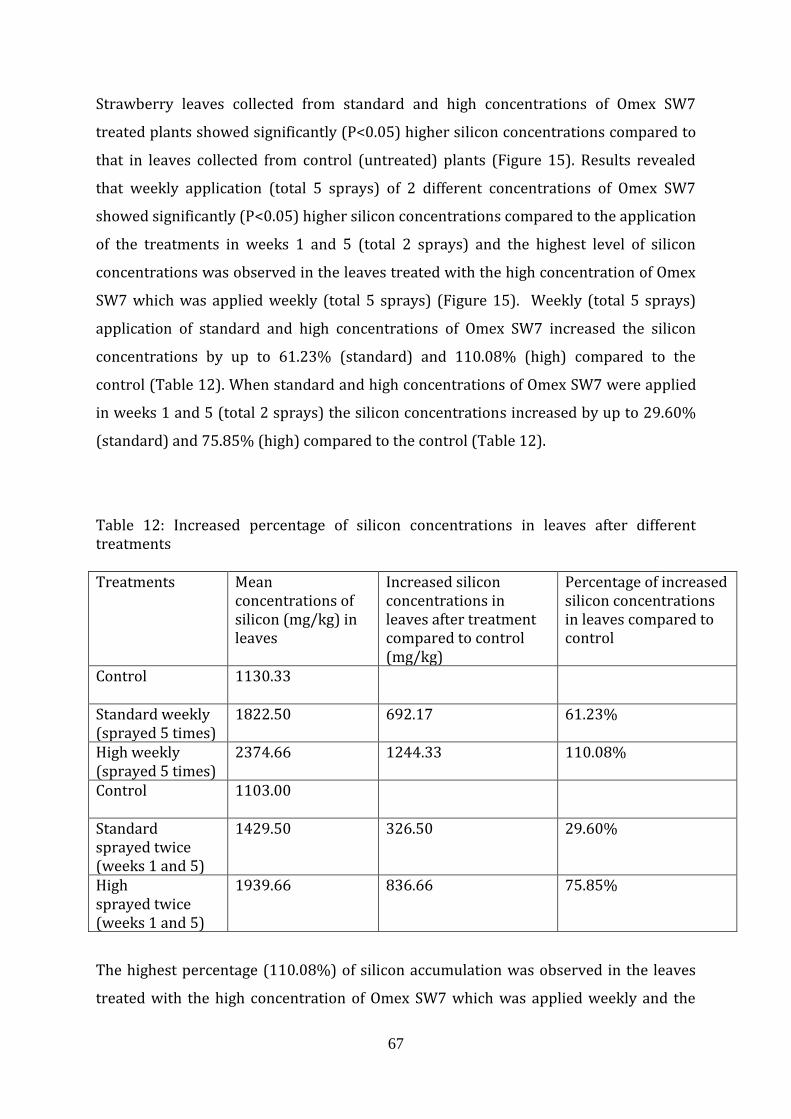
67
Strawberry leaves collected from standard and high concentrations of Omex SW7
treated plants showed significantly (P<0.05) higher silicon concentrations compared to
that in leaves collected from control (untreated) plants (Figure 15). Results revealed
that weekly application (total 5 sprays) of 2 different concentrations of Omex SW7
showed significantly (P<0.05) higher silicon concentrations compared to the application
of the treatments in weeks 1 and 5 (total 2 sprays) and the highest level of silicon
concentrations was observed in the leaves treated with the high concentration of Omex
SW7 which was applied weekly (total 5 sprays) (Figure 15). Weekly (total 5 sprays)
application of standard and high concentrations of Omex SW7 increased the silicon
concentrations by up to 61.23% (standard) and 110.08% (high) compared to the
control (Table 12). When standard and high concentrations of Omex SW7 were applied
in weeks 1 and 5 (total 2 sprays) the silicon concentrations increased by up to 29.60%
(standard) and 75.85% (high) compared to the control (Table 12).
Table 12: Increased percentage of silicon concentrations in leaves after different treatments Treatments
Mean concentrations of silicon (mg/kg) in leaves
Increased silicon concentrations in leaves after treatment compared to control (mg/kg)
Percentage of increased silicon concentrations in leaves compared to control
Control 1130.33
Standard weekly (sprayed 5 times)
1822.50 692.17 61.23%
High weekly (sprayed 5 times)
2374.66 1244.33
110.08%
Control
1103.00
Standard sprayed twice (weeks 1 and 5)
1429.50 326.50 29.60%
High sprayed twice (weeks 1 and 5)
1939.66 836.66 75.85%
The highest percentage (110.08%) of silicon accumulation was observed in the leaves
treated with the high concentration of Omex SW7 which was applied weekly and the

68
lowest percentage (29.60%) was observed in the leaves treated with the standard
concentration of Omex SW7 which was applied in weeks 1 and 5 compared to the
control (Table 12). The work reported here showed that concentrations of silicon in
strawberry leaves were increased by the addition of the silicon wetter. Moreover, the
more silicon that was applied the higher the levels of silicon absorbed by the plants
(Figure 15). Weekly application of Omex SW7 gave significantly (P<0.05) greater
accumulation of silicon compared to application of Omex SW7 in weeks 1 and 5. Results
of the pilot experiment helped to design the main experiment in the Bayfordbury
glasshouse.
3.3.2. Main experiment in the Bayfordbury glasshouse (effect of
treatments on silicon concentrations in strawberry leaves)
In the Bayfordbury glasshouse (main experiment) four different treatments, control
(untreated) and three different concentrations of silicon (Omex SW7), standard, high
and very high were applied weekly (sprayed each week for 5 weeks total 5 sprays), on
the leaves of strawberry plants (variety Elsanta). Extraction of silicon from strawberry
leaves with the AID method and analysis of the silicon by spectrophotometric procedure
are shown in different graphs. Leaves collected from strawberry plants after different
treatments showed different levels of silicon concentrations (Figure 16). It was
observed that there was a significant difference in silicon concentrations in different
treatments. Strawberry leaves collected from standard, high, and very high
concentrations of Omex SW7 treated plants showed significantly (P<0.05) higher
silicon concentrations compared to that in leaves collected from control (untreated)
plants (Figure 16).

69
Figure 16: Concentrations of silicon in strawberry leaves (variety Elsanta) sprayed weekly (total 5 sprays) with different concentrations of silicon wetter (standard, high, and very high) and untreated control. Samples were collected one week after the final spray. Each value represents the mean of 6 replications (n=6). Means (± standard error of means) followed by different letters indicate significant differences (P<0.05) between treatments as indicated by Tukey’s HSD (Post-hoc test) in the statistical software program, SPSS for Windows version 17.
The leaves collected from the high concentration of Omex SW7 treated plants showed
significantly (P<0.05) higher concentrations of silicon compared to the control and the
standard Omex SW7 treated plants but significantly (P<0.05) lower compared to the
very high concentration of Omex SW7 treated plants (Figure 16). Moreover, the highest
levels of silicon concentrations were observed in leaves collected from the very high
concentration of Omex SW7 treated leaves compared to all other treatments (Figure
16).
3.3.3. Effect of timing on silicon concentrations in strawberry leaves
Strawberry plants were treated with different concentrations of silicon wetter (Omex
SW7) at three different timings. During the weekly application, a total of 2000 ml (400
ml X 5 times) of different concentrations of Omex SW7 were applied. Similarly when
different concentrations of Omex SW7 were applied in weeks 1, 3 and 5, a total of 1200
ml (400 ml X 3 times) and in weeks 1 and 5, a total of 800 ml (400 ml X 2 times) was
applied. Total amounts of silicon in the different treatments and concentrations of
a
b
c
d
0
500
1000
1500
2000
2500
3000
3500
4000
4500
5000
Control Standard High Very high
Co
nce
ntr
atio
ns
of
silic
on
mg/
kg
Treatments
Weekly (total 5 sprays)

70
silicon in leaves after the application of the different treatments were determined by
spectrophotometer which has been shown in Table 13A. However, in this study, dried
leaf samples were used to determine the concentrations of silicon. For this reason, the
silicon concentrations measured by the spectrophotometer were adjusted in relation to
the weight of plant material used and expressed as mg/kg silicon in dried leaf tissue
(mentioned in chapter 2) which is shown in the graphs (Figures 16 and 17) and also
shown in Table 13B.
Table 13A: Total amounts of silicon in the different treatments and accumulation of silicon in the leaves after different treatments. Treatments
Total amounts of
Omex SW7 applied
Total amounts of silicon in the different treatments (mg)
Mean concentrations of silicon in the leaves (mg/l)
Control No application of Omex SW7
11.25
Standard weekly (sprayed 5 times)
2000 ml 54.04 18.98
High weekly (sprayed 5 times)
2000 ml 540.40 24.51
Very high weekly (sprayed 5 times)
2000 ml 1080.80 32.70
Control No application of Omex SW7
11.23
Standard sprayed 3 times (weeks 1, 3 and 5)
1200 ml 32.42 15.99
High Sprayed 3 times (weeks 1, 3 and 5)
1200 ml 324.24 21.25
Very high Sprayed 3 times (weeks 1, 3 and 5)
1200 ml 648.48 28.29
Control No application of Omex SW7
10.94
Standard sprayed twice (weeks 1 and 5)
800 ml 21.61 13.30
High sprayed twice (weeks 1 and 5)
800 ml 216.16 17.96
Very high sprayed twice (weeks 1 and 5)
800 ml 432.32 24.33
It was observed that absorption of silicon in strawberry leaves was significantly
different with different timing of applications (Figure 17). Results showed that weekly

71
foliar application of Omex SW7 showed more silicon accumulation in leaves with 3
different silicon treatments. It was observed that the weekly application (total 5 sprays)
of 3 different concentrations of Omex SW7 showed significantly (P<0.05) higher silicon
concentrations compared to 3 applications in weeks 1, 3 and 5 or 2 applications in
weeks 1 and 5 (Figure 17).
Figure 17: Concentrations of silicon in strawberry (variety Elsanta) leaves treated weekly (total 5 sprays), weeks 1, 3, 5 (total 3 sprays) and weeks 1 and 5 (total 2 sprays) with different concentrations (standard, high, and very high) of silicon wetter and control (no application). Samples were collected one week after the final spray. Each value represents the mean of 6 replications (n=6). Means (± standard error of means) followed by different letters indicate significant differences (P<0.05) between treatments as indicated by Tukey’s HSD (Post-hoc test) in the statistical software program, SPSS for Windows version 17.
Silicon concentrations in leaf samples indicated that weekly (total 5 sprays) application
of Omex SW7 increased the silicon concentrations by up to 68.98% (standard), 118.16%
(high) and 191.05% (very high) compared to control (Table 13B). Similarly
concentrations of silicon increased in leaves after applications of different
concentrations of silicon in weeks 1, 3 and 5 (total 3 sprays) and in weeks 1 and 5 (total
2 sprays) (Table 13B). Highest levels (191.05%) of silicon were observed in the leaves
treated weekly with the very high concentration of Omex SW7 and lowest levels
(21.53%) of silicon were observed in the leaves treated with the standard concentration
of Omex SW7 which was applied in weeks 1 and 5 (total 2 sprays) compared to the
control (Table 13B).
a
d
f
h
a
c
e
g
a b
d
f
0
500
1000
1500
2000
2500
3000
3500
4000
4500
5000
Control Standard High Very high
Co
nce
ntr
atio
ns
of
silic
on
mg/
kg
Treatments
Weekly (total 5 sprays)
Weeks 1, 3 and 5 (total 3 sprays)
Weeks 1 and 5 (total 2 sprays)

72
Table 13B: Increased percentage of silicon concentrations in leaves after different treatments
Treatments
Mean concentrations of silicon (mg/kg) in leaves
Increased silicon concentrations in leaves after treatment compared to control (mg/kg)
Percentage of increased silicon concentrations in leaves compared to control
Control weekly 1123.50
Standard weekly (sprayed 5 times)
1898.58 775.08 68.98%
High weekly (sprayed 5 times)
2451.08 1327.58 118.16%
Very high weekly
(sprayed 5 times)
3270.00 2146.50 191.05%
Control
1123.41
Standard sprayed 3 times (weeks 1, 3 and 5)
1599.33 475.92
42.36%
High
Sprayed 3 times (weeks 1, 3 and 5)
2125.75 1002.34 89.22%
Very high Sprayed 3 times (weeks 1, 3 and 5)
2829.50 1706.09 151.86%
Control
1094.50
Standard
sprayed twice (weeks 1 and 5)
1330.25 235.75 21.53%
High sprayed twice (weeks 1 and 5)
1796.00 701.50 64.09%
Very high
sprayed twice (weeks 1 and 5)
2433.16 1338.66 122.30%

73
3.3.4. Effect of silicon on the density of leaf hairs
This experiment aimed to investigate whether the silicon supplements had any effect on
the number of leaf hairs. Interestingly, microscopic observations of silicon treated
leaves showed that there were increased numbers of leaf hairs on both the upper and
lower surfaces of leaves (Figure 18A). The numbers of leaf hairs were observed more on
the lower surface compared with the upper surface of leaves. It was also found that
there were significant differences in the number of leaf hairs in different treatment
groups.
Figure 18 A: Number of leaf hairs on the i) upper surface without silicon treament ii) upper surface with silicon (standard) treatment iii) lower surface without silicon treament iv) lower surface with silicon (standard) treatment. Leaves were examined under the dissection microscope (X30). Leaf hairs are indicated by arrows.
The upper surface of leaves treated with different concentrations of Omex SW7 showed
significantly (P<0.05) higher leaf hair numbers compared to the control (untreated)
leaves (Figure 18B). Moreover, leaves treated with the high concentration of Omex SW7
showed significantly (P<0.05) higher leaf hair numbers compared to the standard Omex
i ii
iii iv

74
SW7 treated leaves but significantly (P<0.05) lower compared to the very high
concentration of Omex SW7 treated leaves (Figure 18B).
Figure 18 B: Number of leaf hairs on the upper surface of leaves in strawberry variety Elsanta treated weekly (total 5 sprays), weeks 1, 3, 5 (total 3 sprays) and weeks 1 and 5 (total 2 sprays) with different concentrations (standard, high, and very high) of silicon wetter and control (no application). Samples were collected one week after the final spray. A total of 20 leaves for each treatment were used to measure the average number of leaf hairs per cm2 (n=20). Means (± standard error of means) followed by different letters indicate significant differences (P<0.05) between treatments as indicated by Tukey’s HSD (Post-hoc test) in the statistical software program, SPSS for Windows version 17.
The number of leaf hairs on the lower surface of leaves collected after different
treatments, shown in Figure 19. It was observed that the foliar application of silicon on
strawberry leaves increased the leaf hair numbers on the lower surface (Figure 19). The
number of leaf hairs was significantly (P<0.05) higher in the high and very high Omex
SW7 treated leaves compared to the control and standard Omex SW7 treated leaves
(Figure 19). Moreover, the highest levels of Omex SW7 treated leaves showed
significantly higher (P<0.05) leaf hair numbers compared to all other treatment groups
(Figure 19). Different timings, weekly (sprayed each week for 5 weeks, total 5 sprays),
sprayed in weeks 1, 3 and 5 (total 3 sprays) and sprayed in weeks 1 and 5 (total 2
sprays) also had an effect on the density of leaf hairs on both the upper and lower
surfaces of leaves.
a
d
f
h
a
c
e
g
a b
d
f
0
10
20
30
40
50
60
70
80
90
100
Control Standard High Very high
Ave
rage
nu
mb
er
of
hai
rs p
er
cm2
Treatments
Weekly (total 5 sprays)
Weeks 1, 3 and 5 (total 3 sprays)
Weeks 1 and 5 (total 2 sprays)

75
Figure 19: Number of leaf hairs on the lower surface of leaves in the strawberry variety Elsanta treated weekly (total 5 sprays), weeks 1, 3, 5 (total 3 sprays) and weeks 1 and 5 (total 2 sprays) with different concentrations (standard, high, and very high) of silicon wetter and control (no application). Samples were collected one week after the final spray. A total of 20 leaves for each treatment were used to measure the average number of leaf hairs per cm2 (n=20). Means (± standard error of means) followed by different letters indicate significant differences (P<0.05) between treatments as indicated by Tukey’s HSD (Post-hoc test) in the statistical software program, SPSS for Windows version 17.
There was no significant (P>0.05) difference in the leaf hair numbers on the leaves
collected from control plants in any of the three different intervals. On the other hand,
weekly (total 5 sprays) foliar application of Omex SW7 showed more leaf hairs on both
the upper and lower surfaces of leaves with three different silicon treatments.
Furthermore, it was also observed that the weekly (total 5 sprays) applications of three
different concentrations of Omex SW7 showed significantly (P<0.05) higher leaf hair
numbers on both the upper (Figure 18B) and lower surfaces (Figure 19) of leaves than
when the application was 3 times in weeks 1, 3 and 5 or twice in weeks 1 and 5.
Moreover, when different concentrations of Omex SW7 (standard, high and very high)
were applied in weeks 1, 3 and 5 (total 3 sprays) there were significantly (P<0.05)
higher leaf hair numbers on both the upper and lower surfaces of leaves compared with
application in weeks 1 and 5 (total 2 sprays) (Figures 18B and 19).
a
e
g h
a
c
f
g
a
b
d f
0
10
20
30
40
50
60
70
80
90
100
Control Standard High Very high
Ave
rage
nu
mb
er
of
hai
rs p
er
cm2
Treatment
Weekly (total 5 sprays) Weeks 1, 3 and 5 (total 3 sprays) Weeks 1 and 5 (total 2 sprays)

76
3.3.5. Relationship between the leaf hair numbers and accumulation of silicon The results showed that foliar application of standard, high and very high
concentrations of silicon increased silicon concentrations in leaves as well as increased
the number of leaf hairs on both the upper and lower surfaces of leaves. The results
from the leaves collected on 11 July 2009 from all the different treatments (standard,
high and very high concentrations of Omex SW7 were applied at three different timings)
were used to find the relationships between density and length of leaf hairs and
accumulation of silicon in the variety Elsanta. Pearson’s correlation as mentioned in
section 2.9 was used to find a correlation. It was observed that there was a significant
positive correlation (P<0.01) between accumulation of silicon and the number of leaf
hairs on both the upper and lower surfaces of leaves (Figures 20 and 21). The
correlation coefficients (r) were 0.992 and 0.977 and regression coefficients (R2) were
0.984 and 0.954 for the upper and lower surfaces of leaves respectively.
Figure 20: Relationship between concentrations of silicon and average number of leaf hairs (per cm2) on the upper surface of leaves (variety Elsanta). The correlation coefficient (r) was 0.992 and regression coefficient (R2) was 0.984.
y = 0.0095x + 15.85 R² = 0.984
0
10
20
30
40
50
60
70
80
90
100
0 500 1000 1500 2000 2500 3000 3500
Ave
rage
nu
mb
er
of
hai
rs p
er
cm2
Concentrations of silicon (mg/kg)

77
Figure 21: Relationship between concentrations of silicon and average number of leaf hairs (per cm2) on the lower surface of leaves (variety Elsanta). The correlation coefficient (r) was 0.977 and regression coefficient (R2) was 0.954.
3.3.6. Effect of silicon on the length of leaf hairs
This study examined whether the silicon supplement had any effect on the length of leaf
hairs. It was observed that the foliar application of silicon had an effect on the length of
leaf hairs on both the upper and lower surfaces of leaves. The application of three
different silicon concentrations (standard, high and very high) of Omex SW7 showed
significantly (P<0.05) longer leaf hair length compared to control leaves (Figures 22 and
23). It was observed that the length of leaf hairs in the presence of the high
concentration of silicon were significantly (P<0.05) longer in length than those treated
with the standard Omex SW7 but significantly (P<0.05) shorter when compared with
the very high concentration of Omex SW7 treated leaves (Figures 22 and 23) on both
the upper and lower surfaces of leaves. Furthermore, it was also observed that the
weekly (total 5 sprays) application of three different concentrations of Omex SW7
showed significantly (P<0.05) longer leaf hair length on both the upper (Figure 22) and
lower (Figure 23) surfaces of leaves than when the application was 3 times in weeks 1,
3 and 5 (total 3 sprays) or twice in weeks 1 and 5 (total 2 sprays).
y = 0.0225x + 21.571 R² = 0.9542
0
10
20
30
40
50
60
70
80
90
100
0 500 1000 1500 2000 2500 3000 3500
Ave
rage
nu
mb
er
of
hai
rs p
er
cm2
Concentrations of silicon (mg/kg)

78
Figure 22: Length of leaf hairs on the upper surface of leaves (variety Elsanta) treated weekly (total 5 sprays), weeks 1, 3, 5 (total 3 sprays) and weeks 1 and 5 (total 2 sprays) with different concentrations (standard, high, and very high) of silicon wetter and control (no application). Samples were collected one week after the final spray. A total of 20 leaves for each treatment were used to measure the average length of leaf hairs (n=20). Means (± standard error of means) followed by different letters indicate significant differences (P<0.05) between treatments as indicated by Tukey’s HSD (Post-hoc test) in the statistical software program, SPSS for Windows version 17.
Figure 23: Length of leaf hairs on the lower surface of leaves (variety Elsanta) treated weekly (total 5 sprays), weeks 1, 3, 5 (total 3 sprays) and weeks 1 and 5 (total 2 sprays) with different concentrations (standard, high, and very high) of silicon wetter and control (no application). Samples were collected one week after the final spray. A total of 20 leaves for each treatment were used to measure the average length of leaf hairs (n=20). Means (± standard error of means) followed by different letters indicate significant differences (P<0.05) between treatments as indicated by Tukey’s HSD (Post-hoc test) in the statistical software program, SPSS for Windows version 17.
a
d e
f
a
c d
e
a b
c d
0
0.5
1
1.5
2
2.5
3
3.5
Control Standard High Very high
Len
gth
(av
era
ge)
of
leaf
hai
rs in
mm
Treatments
Weekly (total 5 sprays)
Weeks 1, 3 and 5 (total 3 sprays)
Weeks 1 and 5 (total 2 sprays)
a
d
f
h
a
c
e
g
a b
d
f
0
0.5
1
1.5
2
2.5
3
3.5
Control Standard High Very high
Len
gth
(av
era
ge)
of
leaf
hai
rs in
mm
Treatment
Weekly (total 5 sprays) Weeks 1, 3 and 5 (total 3 sprays) Weeks 1 and 5 (total 2 sprays)

79
3.3.7. Relationship between the length of leaf hair and accumulation of silicon Results showed that foliar application of standard, high and very high concentrations of
silicon wetter increased silicon concentrations in leaves as well as increased the length
of leaf hairs on both the upper and lower surfaces of leaves. Therefore, the relationship
between the length of leaf hairs and the silicon level was investigated. It was observed
that there was a significant positive correlation (P<0.01) between accumulation of
silicon and the length of leaf hairs on both the upper and lower surfaces of leaves
(Figures 24 and 25). The correlation coefficients (r) were 0.970 and 0.996 and
regression coefficients (R2) were 0.941 and 0.991 for the upper and lower surfaces of
leaves respectively. These results indicated the possibility that silicon application on the
leaf surfaces increased the length of leaf hairs on both the both upper and lower
surfaces of leaves.
Figure 24: Relationship between concentrations of silicon and average length of leaf hairs on the upper surface of leaves (variety Elsanta). The correlation coefficient (r) was 0.970 and regression coefficient (R2) was 0.941.
y = 0.0006x + 0.0003 R² = 0.941
0
0.5
1
1.5
2
2.5
3
3.5
0 500 1000 1500 2000 2500 3000 3500
Len
gth
(av
era
ge)
of
leaf
hai
rs in
mm
Concentrations of silicon (mg/kg)

80
Figure 25: Relationship between concentrations of silicon and average length of leaf hairs on the lower surface of leaves (variety Elsanta). The correlation coefficient (r) was 0.996 and regression coefficient (R2) was 0.991.
3.3.8. Effect of treatments on accumulation of silicon in different
strawberry varieties
This project also investigated the uptake of silicon in different strawberry varieties
Symphony and Elsanta which are susceptible to strawberry powdery mildew and
Florence and Rhapsody which are moderately resistant to powdery mildew. The
accumulation of silicon and the physical changes in leaves with regard to the density
and length of leaf hairs of all the four varieties were assessed. Two different
concentrations of Omex SW7 standard, high and a control were used to assessed the
accumulation of silicon on strawberry leaves in four strawberry varieties. The very high
concentration of Omex SW7 used in the main experiment was not used here.
Observations in the main experiment showed that the very high concentration of Omex
SW7 had a harmful effect on plant growth and development. It was observed that leaves
of plants treated with the very high concentration of Omex SW7 had a white surface
which may be detrimental to photosynthesis. For this reason plants treated with the
very high concentration of Omex SW7 did not survive more than two weeks after
finishing the treatment.
Silicon was applied weekly (sprayed each week for 5 weeks, total 5 sprays) and a total
of 2000 ml (400 ml X 5 times) Omex SW7 was applied. Spectrophotometer analysis
showed that 2000 ml Omex SW7 contained 54.04 mg of silicon for standard and 540.40
y = 0.0009x + 0.001 R² = 0.991
0
0.5
1
1.5
2
2.5
3
3.5
0 500 1000 1500 2000 2500 3000 3500
Len
gth
(av
era
ge)
of
leaf
hai
rs in
mm
Concentrations of silicon (mg/kg)

81
mg of silicon for high treatment. Concentrations of silicon in leaves after the application
of the different treatments were determined by spectrophotometer and adjusted in
relation to the weight of plant material (dried leaf) used and expressed as mg/kg silicon
in dried leaf tissue (mentioned in section 3.3.3) (Figure 26).
Figure 26: Concentrations of silicon in strawberry leaves in different varieties treated weekly (sprayed each week for 5 weeks, total 5 sprays) with different concentrations of silicon (standard and high) wetter and untreated control. Samples were collected one week after the final spray. Each value represents the mean of 6 replications (n=6). Means (± standard error of means) followed by different letters indicate significant differences (P<0.05) between treatments as indicated by Tukey’s HSD (Post-hoc test) in the statistical software program, SPSS for Windows version 17.
Leaves collected from the strawberry variety Elsanta and the other three varieties
Rhapsody, Florence and Symphony after different treatments showed different levels of
silicon concentrations (Figure 26). All treated plants showed significantly (P<0.05)
higher silicon concentrations compared to that in leaves collected from the control
(untreated) plants (Figure 26). The highest levels of silicon were seen in leaves
collected from the highest treatment compared to all other treatments. Results showed
that in the varieties Elsanta, Rhapsody and Symphony there was a significant difference
in silicon concentrations in the leaves collected from different treatments (Figure 26).
However, in Florence there was no significant difference (P>0.05) in silicon
concentrations in the leaves collected from the control and the standard concentration
of Omex SW7 treated plants (Figure 26). Although there was a significant difference
(P<0.05) in silicon concentrations between standard and high concentrations of Omex
a
c
b
e
d e
b
g f
i h
j
0
500
1000
1500
2000
2500
3000
3500
4000
4500
5000
Elsanta Rhapsody Florence Symphony
Co
nce
ntr
atio
ns
of
silic
on
(m
g/kg
)
Varieties
Control Standard High

82
SW7 treated leaves in Florence (Figure 26). Highest levels of silicon (116.18%) were
observed in the leaves treated with the high concentration of Omex SW7 in Elsanta
followed by 108.8% (Florence), 72.56% (Rhapsody) and 33.33% (Symphony) (Table
14).
Table 14: Increased percentage of silicon concentrations in leaves after different treatments Variety Treatments
and application time
Mean concentrations of silicon (mg/kg) in leaves
Increased silicon concentrations in leaves after treatment compared to control (mg/kg)
Percentage of increased silicon concentrations in leaves compared to control
Elsanta Control 1105.54
Elsanta Standard (sprayed 5 times) 1850 744.46 67.33%
Elsanta High (sprayed 5 times) 2390 1284.46 116.18%
Rhapsody Control
1640
Rhapsody Standard (sprayed 5 times) 2250 610
37.19%
Rhapsody High (sprayed 5 times)
2830 1190 72.56%
Florence Control
1250
Florence Standard (sprayed 5 times)
1250
Florence High (sprayed 5 times)
2610 1360 108.8%
Symphony Control
2250
Symphony Standard (sprayed 5 times)
2530 280 12.45%
Symphony High (sprayed 5 times)
3000 750 33.33%
3.3.9. Effect of silicon on the density of leaf hairs in different
strawberry varieties
Microscopic observations of silicon treated leaves showed that there were increased
numbers of leaf hairs on both the upper and lower surfaces of leaves in all the four

83
varieties when compared to the control (Figures 27 and 28). The numbers of leaf hairs
were observed more on the lower surface in comparison with the upper surface of
leaves. It was found that there were significant differences in the number of leaf hairs in
different treatments in all the four varieties tested. Furthermore it was observed that on
the upper surface of leaves two different treatments of Omex SW7 treated leaves
showed significantly (P<0.05) higher leaf hair numbers compared to the control in the
varieties Elsanta, Florence and Symphony (Figure 27). On the other hand, untreated
leaves from Rhapsody had no hairs on the upper leaf surface, but a low density of hairs
was observed after treatment with the high concentration of Omex SW7 (Figure 27).
The number of leaf hairs on the lower surface of leaves collected after different
treatments are shown in Figure 28. It was observed that the foliar application of silicon
on strawberry leaves increased the lower surface leaf hair numbers (Figure 28) in all
the varieties tested. However, the number of leaf hairs on the lower surface was
significantly (P<0.05) higher on leaves treated with the high concentration of Omex
SW7 compared to the control and the standard Omex SW7 treated leaves (Figure 28).
Figure 27: Number of leaf hairs on the upper surface of leaves in different strawberry varieties treated weekly (sprayed each week for 5 weeks, total 5 sprays) with different concentrations of silicon (standard and high) wetter and untreated control. Samples were collected one week after the final spray. A total of 12 leaves for each treatment were used to measure the average number of leaf hairs per cm2 (n=12). Means (± standard error of means) followed by different letters indicate significant differences (P<0.05) between treatments as indicated by Tukey’s HSD (Post-hoc test) in the statistical software program, SPSS for Windows version 17.
c b b
e
f
d
f
a
h
g
0
10
20
30
40
50
60
70
80
90
100
Elsanta Rhapsody Florence Symphony
Ave
rage
nu
mb
er
of
hai
rs p
er
cm2
Varieties
Control
Standard
High
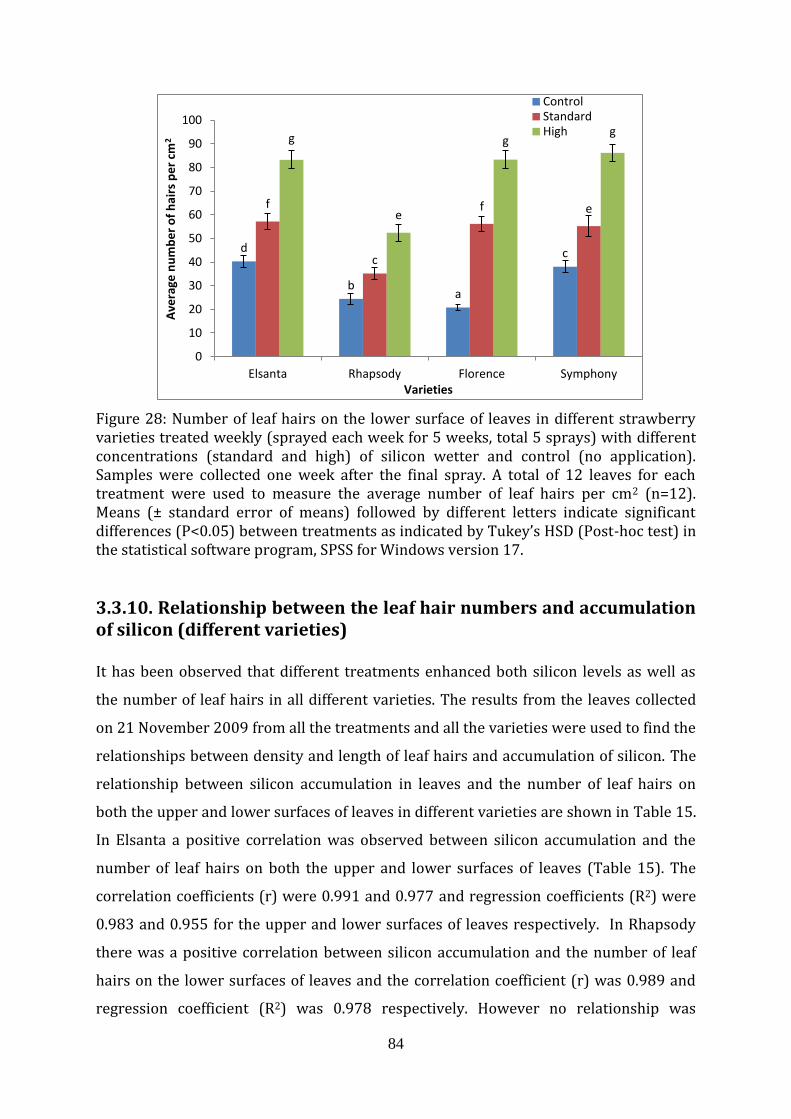
84
Figure 28: Number of leaf hairs on the lower surface of leaves in different strawberry varieties treated weekly (sprayed each week for 5 weeks, total 5 sprays) with different concentrations (standard and high) of silicon wetter and control (no application). Samples were collected one week after the final spray. A total of 12 leaves for each treatment were used to measure the average number of leaf hairs per cm2 (n=12). Means (± standard error of means) followed by different letters indicate significant differences (P<0.05) between treatments as indicated by Tukey’s HSD (Post-hoc test) in the statistical software program, SPSS for Windows version 17.
3.3.10. Relationship between the leaf hair numbers and accumulation of silicon (different varieties) It has been observed that different treatments enhanced both silicon levels as well as
the number of leaf hairs in all different varieties. The results from the leaves collected
on 21 November 2009 from all the treatments and all the varieties were used to find the
relationships between density and length of leaf hairs and accumulation of silicon. The
relationship between silicon accumulation in leaves and the number of leaf hairs on
both the upper and lower surfaces of leaves in different varieties are shown in Table 15.
In Elsanta a positive correlation was observed between silicon accumulation and the
number of leaf hairs on both the upper and lower surfaces of leaves (Table 15). The
correlation coefficients (r) were 0.991 and 0.977 and regression coefficients (R2) were
0.983 and 0.955 for the upper and lower surfaces of leaves respectively. In Rhapsody
there was a positive correlation between silicon accumulation and the number of leaf
hairs on the lower surfaces of leaves and the correlation coefficient (r) was 0.989 and
regression coefficient (R2) was 0.978 respectively. However no relationship was
d
b a
c
f
c
f e
g
e
g g
0
10
20
30
40
50
60
70
80
90
100
Elsanta Rhapsody Florence Symphony
Ave
rage
nu
mb
er
of
hai
rs p
er
cm2
Varieties
Control Standard High

85
observed on the upper surface in this variety because there were no leaf hairs on the
leaves collected from the control and standard treated plants (Table 15). In Florence
and Symphony positive correlation between silicon accumulation and the number of
leaf hairs on both the upper and lower surfaces of leaves was also observed (Table 15).
However the correlation coefficient (r) in Symphony was higher on both the upper and
lower surfaces of leaves in comparison with Florence.
Table 15: Relationship between concentrations of silicon and the number of leaf hairs on both the upper and lower surfaces of leaves in the different varieties Variety Upper surface Lower surface
Correlation
coefficient
( r)
Regression
coefficient (R
2)
Correlation
coefficient
( r)
Regression
coefficient (R
2)
Elsanta 0.991 0.983 0.977 0.955
Rhapsody - - 0.989 0.978
Florence 0.813 0.660 0.826 0.683
Symphony 0.994 0.988 0.996 0.992
3.3.11. Effect of silicon on the length of leaf hairs in different strawberry varieties
Furthermore, it was also demonstrated that the accumulation of silicon affects the
morphology of the strawberry leaves resulting in the formation of additional leaf hairs,
which were longer than when the plants were untreated. This effect occurs on all
varieties tested. It was observed that the foliar application of silicon had an effect on the
length of leaf hairs on both the upper and lower surfaces of leaves (Figures 29 and 30).
The application of different silicon concentrations showed significantly (P<0.05) longer
leaf hair length compared to control (Figures 29 and 30). It was observed that the
length of leaf hairs in the high silicon treated leaves showed significantly (P<0.05)
longer length compared to that in the standard Omex SW7 treated leaves (Figures 29
and 30). On the other hand, in Rhapsody the high concentration of Omex SW7 treatment
stimulated the growth of hairs which was observed on the upper surface (Figure 29).
However, in Rhapsody there were no significant differences in length of leaf hairs were

86
(P<0.05) observed between the control and the standard concentration of Omex SW7
treated leaves on the lower surface of leaves (Figure 30).
Figure 29: Length of leaf hairs on the upper surface of leaves in different strawberry varieties treated weekly (sprayed each week for 5 weeks, total 5 sprays) with different concentrations (standard and high) of silicon wetter and control (no application). Samples were collected one week after the final spray. A total of 12 leaves for each treatment were used to measure the average length of leaf hairs (n=12). Means (± standard error of means) followed by different letters indicate significant differences (P<0.05) between treatments as indicated by Tukey’s HSD (Post-hoc test) in the statistical software program, SPSS for Windows version 17.
Moreover, on the lower surface, in Rhapsody there were significant differences of length
of leaf hairs were observed between the control and the high concentration of Omex
SW7 treated leaves. The high concentration of Omex SW7 treated leaves showed longer
leaf hair length compared to the control and the standard treatment. In Elsanta,
Florence and Symphony, significant differences were observed between control and
treated leaves. Standard and high concentrations of Omex SW7 treated leaves showed
significantly (P<0.05) longer leaf hair length compared to hairs on untreated leaves.
c
d
b
d
e
d
e
a
f e
0
0.5
1
1.5
2
2.5
3
3.5
Elsanta Rhapsody Florence Symphony
Len
gth
(av
era
ge)
of
leaf
hai
rs in
mm
Varieties
Control
Standard
High
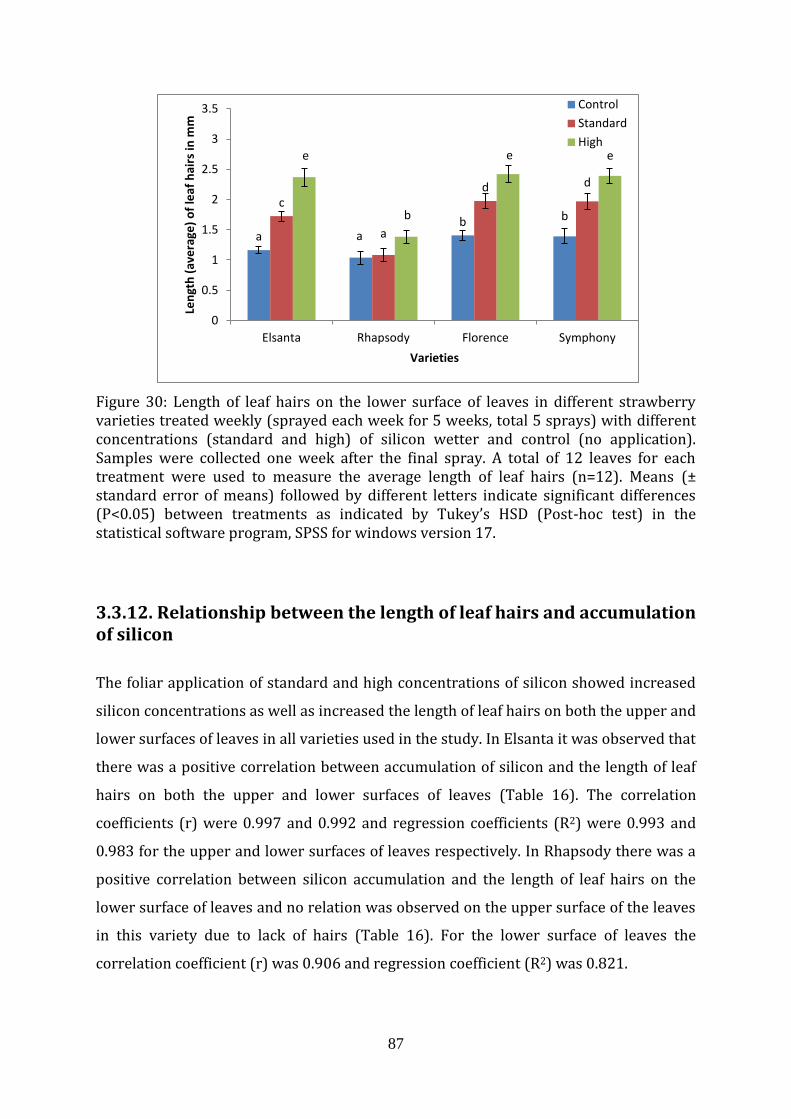
87
Figure 30: Length of leaf hairs on the lower surface of leaves in different strawberry varieties treated weekly (sprayed each week for 5 weeks, total 5 sprays) with different concentrations (standard and high) of silicon wetter and control (no application). Samples were collected one week after the final spray. A total of 12 leaves for each treatment were used to measure the average length of leaf hairs (n=12). Means (± standard error of means) followed by different letters indicate significant differences (P<0.05) between treatments as indicated by Tukey’s HSD (Post-hoc test) in the statistical software program, SPSS for windows version 17.
3.3.12. Relationship between the length of leaf hairs and accumulation of silicon
The foliar application of standard and high concentrations of silicon showed increased
silicon concentrations as well as increased the length of leaf hairs on both the upper and
lower surfaces of leaves in all varieties used in the study. In Elsanta it was observed that
there was a positive correlation between accumulation of silicon and the length of leaf
hairs on both the upper and lower surfaces of leaves (Table 16). The correlation
coefficients (r) were 0.997 and 0.992 and regression coefficients (R2) were 0.993 and
0.983 for the upper and lower surfaces of leaves respectively. In Rhapsody there was a
positive correlation between silicon accumulation and the length of leaf hairs on the
lower surface of leaves and no relation was observed on the upper surface of the leaves
in this variety due to lack of hairs (Table 16). For the lower surface of leaves the
correlation coefficient (r) was 0.906 and regression coefficient (R2) was 0.821.
a a b b
c
a
d d
e
b
e e
0
0.5
1
1.5
2
2.5
3
3.5
Elsanta Rhapsody Florence Symphony
Len
gth
(av
era
ge)
of
leaf
hai
rs in
mm
Varieties
Control
Standard
High

88
Table 16: Relationship between concentrations of silicon and the length of leaf hairs on both the upper and lower surfaces of leaves in the different varieties Variety Upper surface Lower surface
Correlation
coefficient
( r)
Regression
coefficient (R
2)
Correlation
coefficient
( r)
Regression
coefficient (R
2)
Elsanta 0.997 0.993 0.992 0.983
Rhapsody - - 0.906 0.821
Florence 0.817 0.667 0.827 0.684
Symphony 0.951 0.905 0.942 0.888
In both Florence and Symphony it was observed that there was a positive correlation
between accumulation of silicon and the length of leaf hairs on both the upper and
lower surfaces of leaves (Table 16).
3.4. Discussion
The work reported here showed that though strawberry is a non-accumulator of silicon
(Miyake and Takahashi, 1986) spraying with the silicon wetter (Omex SW7) onto the
leaf surface does result in accumulation of silicon in the leaves. There were significant
differences in concentrations in different treatments and different timings. Strawberry
leaves collected from standard, high and very high concentrations of Omex SW7 treated
plants showed significantly (P<0.05) higher silicon concentrations compared to that in
leaves collected from the control plants (Figure 17). This effect occurs on all varieties
tested although there was a significant difference in the accumulation of silicon in the
leaves collected from four varieties (Elsanta, Rhapsody, Florence and Symphony) after
being treated with different concentrations of Omex SW7 (Figure 26). Leaves collected
from the high concentration of Omex SW7 treated plants from all the four varieties
showed significantly (P<0.05) higher silicon concentrations compared to that in control
and standard Omex SW7 treated leaves. There was no significant difference (P>0.05)
found on the leaves collected from the standard Omex SW7 treated leaves and the
leaves collected from untreated plants in Florence (Figure 26). This might be due to the
varietal difference whereby the silicon was not taken up so readily from the low
concentrations of silicon in standard Omex SW7. Liang et al., (2009) found that high

89
concentrations of foliar application of silicon (Potassium metasilicate-K2SiO3) increased
the silicon content in the leaves of cucumber plants which was also a silicon non-
accumulator plant. This experiment (chapter 3) showed that, concentrations of silicon
increased by the addition of silicon wetter Omex SW7 which was also supported by
Wang and Galletta (1998) where they found that foliar application of silicon increased
the silicon levels in the strawberry leaves.
After foliar application of Omex SW7, silicon is absorbed through the cuticle and
transported in the xylem and deposited in the epidermal cell, cell wall, hairs or
trichomes. There is a debate about foliar application of silicon and increased
concentrations of silicon in leaves. In rice, X-ray analysis indicated that silicon
accumulated in leaves when silicon was root applied and foliar applied silicon could be
easily removed by rinsing (Rezende et al., 2009). However, Dallagnol et al., (2012)
showed that rinsing could not remove silicon completely. They also found that foliar
applied silicon treated leaves (rinsed) decreased the powdery mildew colony in melon
compared to that in control. The study of Dallagnol et al., (2012) suggested that rinsing
reduced the concentration of silicon in leaves to some extent but rinsing could not
prevent silicon absorption on the leaf surface through the cuticle. The amount of silicon
which is deposited on the external surface of the leaves could be removed by rinsing.
Although rinsing removed the silicon from the external surface however rinsing could
not remove the amount of silicon which is deposited in the epidermal cell wall and also
in the other parts of the plants. Menzies et al., (1992) observed that silicon sprayed
leaves that were washed to remove surface silicon 4 to 5 hours before inoculation had
significantly fewer colonies than non sprayed leaves. As a result of this, Menzies et al.,
(1992) stated that silicon absorbed before the wash may have been sufficient to reduce
the establishment of pathogen colonies by enhancing resistance. In this study (chapter
3) all leaves were washed to remove any surface silicon. Subsequently silicon was
extracted from the leaves and then measured (chapter 2, section 2.7.2).
To investigate the effect of timing, strawberry plants were treated with silicon wetter
(Omex SW7) at three different intervals and it was observed that absorption rate of
silicon in strawberry leaves was significantly different with different timing of
applications. In Elsanta, it was observed that weekly application (total 5 sprays) of 3

90
different concentrations of Omex SW7 showed significantly (P<0.05) higher silicon
concentrations than when the application was 3 times in weeks 1, 3 and 5 or twice in
weeks 1 and 5 (Figure 16). This was also observed in all other varieties and showed that
weekly application of the high concentration of Omex SW7 increased the silicon levels in
leaves. According to Datnoff et al., (2007) accumulation of silicon in the leaves depends
on the source and continuous supply of the silicon. Bowen et al., (1992) observed that
foliar application of extremely high concentrations of silicon increased the silicon
concentrations in the leaves. After foliar application, silicon deposits on the upper
surface of the leaves which may be removed by rinsing, this is perhaps the reason that
foliar application of silicon needs high concentrations of silicon. Silicon has not been
reported to cause toxicity in excess level (Ma et al., 2001) however; Kamenidou et al.,
(2008) observed that high concentration of silicon (Sodium silicate 100 mg/l weekly
application) had a detrimental effect on plant growth and development. The results
reported in chapter 3 showed that the very high concentration of Omex SW7 (Omex
SW7 at 5% which contains 540.40 mg/l Si) had a harmful effect on plant growth and
development. It was observed that leaves of plants treated with the very high
concentration of Omex SW7 had a white surface which may be detrimental to
photosynthesis.
In this experiment, it was examined whether the silicon supplement had any effect on
the morphological changes of the strawberry leaves. Results revealed that the
accumulation of silicon affects the morphology of the strawberry leaves resulting in the
formation of additional leaf hairs, which were longer than when the plants were
untreated. Microscopic observations of silicon treated leaves showed that there were
increased density of leaf hairs on both the upper (Figure 18B) and lower surfaces
(Figure 19) of leaves. It was observed that the weekly application (total 5 sprays) of
three different concentrations of Omex SW7 showed significantly higher (P<0.05) leaf
hair numbers on both the upper (Figure 18B) and lower surfaces (Figure 19) of leaves
compared to application 3 times in weeks 1, 3 and 5 or twice in weeks 1 and 3. Leaf
trichomes (leaf hairs) are hair like appendages that develop from epidermal cells; some
epidermal cells developed into trichome whereas surrounding cells developed into
regular epidermal cells (Werker, 2000). Leaf trichome’s size and density vary
genetically among plant species and may also vary within individual plants (Dalin et al.,

91
2008). In strawberries, the length and densities of leaf hairs varies between varieties
which was observed in the different varieties tested in this study. The genetic basis of
leaf hair production has been explored in detail in the model species Arabidopsis
thaliana. Studies of the genetic basis of leaf hair formation have identified that many
genes involved in leaf hair initiation, spacing and shapes. Besides this, abiotic stress,
such as drought and UV-radiation, may influence leaf hair formation (Nagatta et al.,
1999). In Arabidopsis thaliana, artificial damage, but also application of jasmonic acid
and application of gibberellin increases leaf hair production (Traw and Bergelson,
2003). The information reported in different studies indicates that there are many
factors which influence leaf hair initiation, spacing and density. The results reported
here in this chapter showed that application of different concentrations of Omex SW7
increased leaf hair numbers on both the upper (Figure 27) and lower (Figure 28)
surfaces of leaves. Moreover, this effect occurs on all varieties tested and in Rhapsody
had the effect of actually stimulating the production of hairs where there were none on
the untreated control. In Rhapsody there were no hairs on the upper surface of leaves
but at a high concentration of Omex SW7 stimulated the hair growth (Figure 27). The
results also showed the differences in the density of leaf hairs in the four varieties, this
was a result of the rate at which each variety accumulates silicon (Figures 27 and 28).
Results also showed that hairs on the lower surface were more than the leaf hairs on the
upper surface when the four varieties were compared. On the lower surface of leaves,
the high concentration of Omex SW7 treated leaves showed significantly (P<0.05)
higher leaf hair numbers compared to the control and the standard Omex SW7 treated
leaves in all the four varieties (Figure 28). According to Hayward and Parry (1973)
deposition of silicon differs between the upper and the lower leaf surfaces. In barley,
Hayward and Parry (1973) found that total silicon content was greatest on the lower
surface and on the upper surface silicon was confined to the trichomes. However,
Kaufmann et al., (1985) found that in different grasses (C3 and C4) silicon deposition
was more on the upper surface in comparison with the lower surface of leaves. The
information from the above studies stated that silicon deposition differs between plant
species. However, most of the studies indicated that trichomes or leaf hairs are the most
important sites of silicon deposition. Non uniform deposition and distribution of silicon
and the mechanism by which tissues avoid silicon deposition has not been understood.
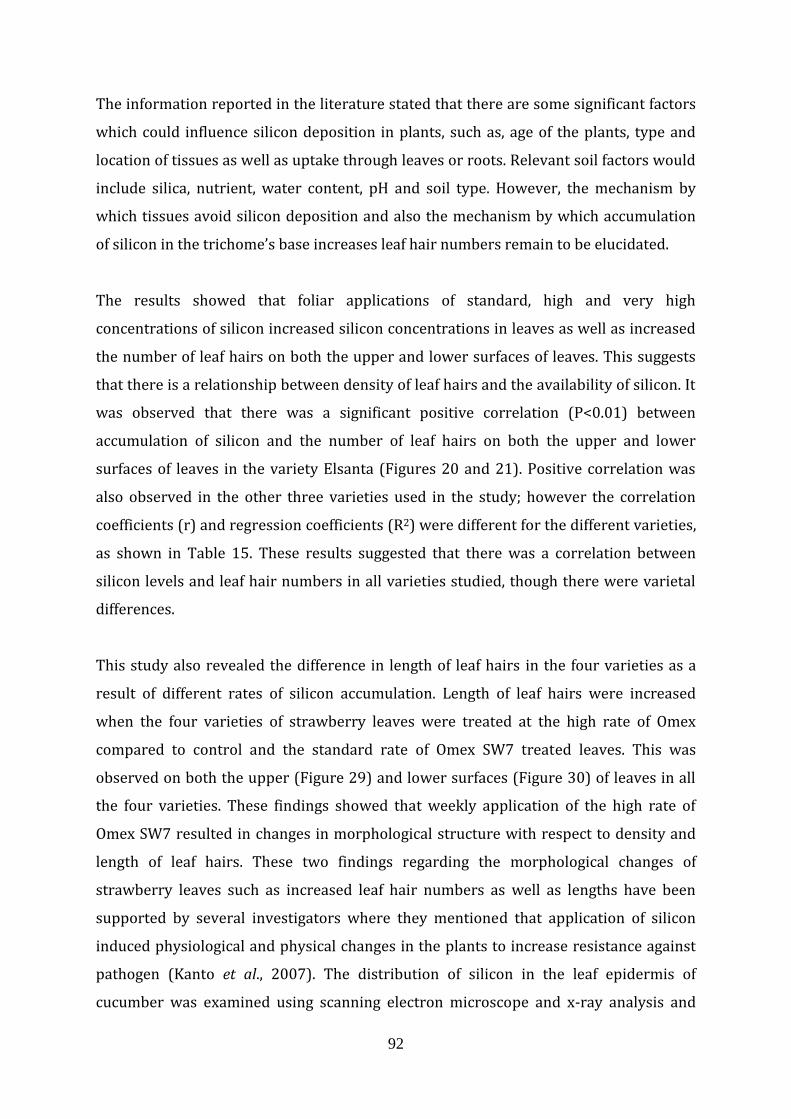
92
The information reported in the literature stated that there are some significant factors
which could influence silicon deposition in plants, such as, age of the plants, type and
location of tissues as well as uptake through leaves or roots. Relevant soil factors would
include silica, nutrient, water content, pH and soil type. However, the mechanism by
which tissues avoid silicon deposition and also the mechanism by which accumulation
of silicon in the trichome’s base increases leaf hair numbers remain to be elucidated.
The results showed that foliar applications of standard, high and very high
concentrations of silicon increased silicon concentrations in leaves as well as increased
the number of leaf hairs on both the upper and lower surfaces of leaves. This suggests
that there is a relationship between density of leaf hairs and the availability of silicon. It
was observed that there was a significant positive correlation (P<0.01) between
accumulation of silicon and the number of leaf hairs on both the upper and lower
surfaces of leaves in the variety Elsanta (Figures 20 and 21). Positive correlation was
also observed in the other three varieties used in the study; however the correlation
coefficients (r) and regression coefficients (R2) were different for the different varieties,
as shown in Table 15. These results suggested that there was a correlation between
silicon levels and leaf hair numbers in all varieties studied, though there were varietal
differences.
This study also revealed the difference in length of leaf hairs in the four varieties as a
result of different rates of silicon accumulation. Length of leaf hairs were increased
when the four varieties of strawberry leaves were treated at the high rate of Omex
compared to control and the standard rate of Omex SW7 treated leaves. This was
observed on both the upper (Figure 29) and lower surfaces (Figure 30) of leaves in all
the four varieties. These findings showed that weekly application of the high rate of
Omex SW7 resulted in changes in morphological structure with respect to density and
length of leaf hairs. These two findings regarding the morphological changes of
strawberry leaves such as increased leaf hair numbers as well as lengths have been
supported by several investigators where they mentioned that application of silicon
induced physiological and physical changes in the plants to increase resistance against
pathogen (Kanto et al., 2007). The distribution of silicon in the leaf epidermis of
cucumber was examined using scanning electron microscope and x-ray analysis and

93
silicon was found primarily in cells surrounding the bases of the trichomes (Samuels et
al., 1991). According to Adatia and Besford (1986) silicon was translocated in the xylem
but may then be taken up by certain cells, e.g. the trichomes. According to the above
investigation it can be postulated that the application of silicon accumulated in the
trichome (leaf hairs) bases and this may have increased the number and length of leaf
hairs on the upper and lower surfaces of the leaves in this study. The relationship
between the length of leaf hairs and the uptake of silicon was investigated. It was
observed that there was a significant positive correlation (P<0.01) between
accumulation of silicon and the length of leaf hairs on both the upper and lower surfaces
of leaves in Elsanta (Figures 24 and 25). Besides this, positive correlations were
observed in all the varieties (Table 16); however the correlation coefficients (r) and
regression coefficients (R2) were different for the different varieties. These might be
due to the varietal efficiency which is mentioned above. These relationships indicated
the possibility that silicon application on leaf surface increased the length of leaf hairs
on both the upper and lower surfaces of leaves.
The present study revealed that silicon uptake can be enhanced by the application of
Omex SW7. Results also revealed that the enhanced levels of silicon affect the
morphology of the strawberry leaves resulting in the formation of additional leaf hairs,
which were longer than when the plants were untreated. This effect observed on all the
varieties used in the study. Wang and Galletta (1998) showed that the application of
silicon stimulated the growth and production of strawberry plants. This study showed
accumulation of silicon and a correlation between silicon levels and leaf hair density
and length. This could contribute to disease resistance (Kortekamp and Zyprian, 1999).
Silicon had been shown to increase resistance to the powdery mildew fungus in a
number of plant species such as cucumber, melon, rose (Menzies et al., 1991; Dallagnol
et al., 2012; Shetty et al., 2012). Therefore the application of the silicon based wetter
may help to strawberry plant to absorb silicon and improve resistance against powdery
mildew infections. However, further work is required to establish evidence for this
protective effect in the field. This effect was further examined in a field trial in the 2011
season.

94
Chapter 4: An investigation of the effect of root application of silicon (Omex SW7) on strawberry plants in the glasshouse
4.1. Introduction
Silicon accumulation differs greatly between plant species. Differences in silicon content
between plant species are related to differences in silicon uptake by the roots. The
beneficial effects of silicon are mainly associated with its high deposition in plant
tissues, enhancing their strength and rigidity. However, until the beginning of the 20th
century the beneficial role of silicon in plant growth and development was overlooked
(Epstein, 1999; Ma and Takahashi, 2002). The abundance of the silicon element in
nature and fact that the silicon deficiency symptoms are not visible in all plant species
might be the reason for the ignorance of silicon by plant physiologists. However, most
soils contain significant quantities of silicon, but continuous cropping particularly with
crops that accumulate significant quantities of silicon can reduce plant available silicon.
Repeated rice cropping can reduce silicon levels in many rice growing soils which
initially contained significant quantities of silicon. When silicon is depleted silicon
fertilization becomes beneficial for growth and disease resistance in rice (Datnoff et al.,
1997). Therefore silicon fertilization is required, particularly in soil which contains low
amounts of plant available silicon and for known silicon accumulating plants such as
rice and sugarcane. Factors that can contribute to low silicon concentrations in the soil
solution are the low solubility of silicon minerals in the parent materials (Jones and
Handreck, 1967).
Plants take up silicon by the roots from solutions below pH 9 in the form of silicic acid
(Jones and Handreck, 1965; Raven, 2003). Following uptake by the roots, silicon is
translocated to the shoot via the xylem through transpiration. The form in which silicon
is ultimately deposited is mainly amorphous silica SiO2. nH2O (Epstein, 1994). Many
studies have investigated silicon in the above ground plant organs, but there is still a
great lack of knowledge with regard to silicon in roots. In rice and wheat silica
deposition was found in the root endodermis (Parry and Soni, 1972; Bennett, 1982). On
the other hand no silica deposition was observed in maize roots (Bennett and Sangster,
1982). In roots, the amounts of silicic acid are low compared to shoots. In general, the

95
major proportion of silicon which is taken up by the roots is translocated to the shoots
(Ma and Yamaji, 2006). In strawberry silicon is translocated from the roots to the shoots
and leaves (Miyake and Takahashi, 1986). Miyake and Takahashi (1986) reported that
after the application of 50 ppm SiO2 in strawberry plants, silicon was translocated to all
the organs of the strawberry plants. Hairs or trichomes are another important site of
silicon deposition (Kaufmann et al., 1981). The hydrated amorphous silica is immobile
and not redistributed. For this reason, after polymerization, silicic acid is no longer
available as a source of silicon for any other parts of the plant. According to Jones and
Handreck (1965) only 1% of the total silicon is present in the form of silicic acid.
Nowadays, silicon is still not recognised as an essential element for plant growth and
development but the beneficial effects of this element on the growth, development, yield
and disease resistance have been observed in a wide variety of plant species (Epstein,
1999; Ma, 2004). Okuda and Takahashi (1965) showed that silicon influenced the
growth of rice plant kept in plastic container. Both roots and shoots were longer in the
presence of silicon and the grain yield was greater. At harvest, the dry weight of ears
was half or two-thirds in control plants (without silicon) compared with silicon treated
plants. Beneficial effects of silicon on rice have been reported by several workers;
however the response of dicotyledons to silicon has received less attention. Cucumber is
a dicotyledon and contains less silicon than rice. Adatia and Besford (1986) showed that
although cucumber is a dicotyledon and contains less silicon, addition of silicon could be
beneficial to cucumbers grown in a medium which contains less silicon, e.g. peat. Adatia
and Besford (1986) stated that addition of silicon in the growing media increased the
silicon content of cucumber leaves and found that deposition of silicon induced physical
changes in the leaves. The lower leaves on the plants treated with high levels of silicon
were darker green and remained well presented to intercept light efficiently, while the
leaves on the plants treated with low levels of silicon were more prone to wilting. An
experiment conducted by Miyaki and Takahashi (1986) stated that silicon increased the
total amount of strawberry fruit and total yield of useful fruit (fruit weight of 6g or
above) in a hydroponic culture. This is thought to be due to increased chlorophyll
content (Wang and Galletta, 1998) and enhanced pollen fertility (Miyaki and Takahashi,
1986). Fruit quality traits influenced by silicate treatments are increased citric acid,
malic acid and membrane bound glycol and phospholipids and decreased fructose,
96
glucose and myo-inositol content (Wang and Galletta, 1998). In this study, Omex SW7, a
silicon based wetter was applied to the roots of strawberry plants and silicon
accumulation and morphological changes in leaves were assessed. The hypothesis
tested in this chapter was that application of silicon (Omex SW7) to the roots of the
strawberry plants would lead to enhanced levels of silicon in the plants. The enhanced
levels of silicon in the plants would lead to morphological changes in the leaves with
regard to the density and length of leaf hairs.
4.1.1. Objectives
To investigate the effect of root application of Omex SW7 on the accumulation of
silicon in the leaves of strawberry plants.
To investigate the effect of root application of Omex SW7 on the morphological
changes that occurs in the leaves with regard to the modification of leaf hair
length and density.
To determine the relationships between accumulation of silicon and length and
density of leaf hairs after root application of Omex SW7.
To compare the effect of foliar and root applications of Omex SW7 on the
accumulation of silicon in the leaves including modification of leaf hair length
and density.
4.2. Materials and Methods
4.2.1. Plant material and growth
The strawberry variety Elsanta was used in this experiment and the plants of Elsanta
were grown on the capillarity bench of the Hatfield glasshouse which was described in
chapter 2, section 2.5. In this experiment (160-165) runners (Elsanta) were used to
grow the plants and finally 144 healthy plants were selected for the experiment. In April
2009 runners were planted in the 12x6 cm pots filled with compost (Miracle Gro,
Company) and pots were placed on the capillarity bench in the glasshouse. As plants
were grown in April, artificial light was used to create 12-14 hours light during the day

97
(mentioned before in chapter 2, section 2.5). In April, natural day light (8-9 hours/day)
and incandescent light which provided additional light 4-6 hours/day was used and
from May to July natural day light was used and no artificial light was used.
Temperatures were approximately 15-200C during the day and 12-150C at night.
Normal plant fertilizer (described in chapter 2, section 2.5) was provided to all the pots.
Plants were watered through the capillarity bench and no water was spread over the
leaves (mentioned before in chapter 2, section 2.5).
4.2.2. Experimental design of the silicon treatments
Silicon wetter Omex SW7 was used as the source of silicon. Silicon was applied to the
roots of the plants. There were two application rates (standard and high) and the
product was applied at three different timings. Control plants received no treatment.
Treatment rates and timings are shown in Table 17.
Table 17: Treatment rates and timings
Treatment rates and timings
Standard (Omex SW7 at 0.25%) which contains 27.02 mg/l Si was applied each
week for 5 weeks (total 5 applications)
Standard (Omex SW7 at 0.25%) which contains 27.02 mg/l Si was applied in
weeks 1, 3 and 5 (total 3 applications)
Standard (Omex SW7 at 0.25%) which contains 27.02 mg/l Si was applied in
weeks 1 and 5 (total 2 applications)
High (Omex SW7 at 2.5%) which contains 270.20 mg/l Si was applied each week
for 5 weeks (total 5 applications)
High (Omex SW7 at 2.5%) which contains 270.20 mg/l Si was applied in weeks 1,
3 and 5 (total 3 applications)
High (Omex SW7 at 2.5%) which contains 270.20 mg/l Si was applied in weeks 1
and 5 (total 2 applications)
Untreated (control)
The treatments were applied to 4 different blocks (Block A, B, C and D). Each block was
divided into 9 rows and each treatment was applied to an individual row which

98
consisted of 4 plants. Within each block each treatment appeared once and they were
distributed randomly (Table 18A). Each treatment was applied to 16 plants (4 rows
from 4 different blocks). Date of application of the treatments and leaf collections from
different rows of block A are shown in Table 18B and from block B, C and D are shown
in Appendix 4.
4.2.3. Application of the treatments
Treatments were applied to the roots when the plants had 10-12 leaves. Omex SW7
(100 ml) was applied to the roots of each pot containing a plant. For applying Omex
SW7, a small hole was made in the soil near the roots of the plant in each pot. A funnel
was placed inside the hole and 100 ml Omex SW7 was poured in the funnel. After
finishing the pouring of Omex SW7, the funnel was removed from the soil and placed in
the hole by the roots in the soil of another pot. To avoid cross contamination different
funnels for different treatments were used during application of the treatments.
Application of the treatments was started from 7 June 2010. On 7 June all the
treatments were applied to the roots of the plants in the different rows of block A (Table
18B). After that, treatments were applied on 14, 21, 28 June and 5 July 2010.
Table 18A: Distribution of treatments in the Hatfield glasshouse (variety Elsanta) Block Row Treatment Block Row Treatment
A
1 Standard-(2 applications)
B
10 High-(3 applications)
2 High-(3 applications) 11 Control 3 Control 12 Standard-(3 applications)
4 High- (5 applications) 13 High-(5 applications)
5 High-(2 applications) 14 Control 6 Standard-(3 applications) 15 High-(2 applications)
7 Control 16 Standard-(2 applications)
8 Standard-(5 applications) 17 Standard-(5 applications)
9 Control 18 Control
Block Row Treatment Block Row Treatment
C
19 Standard- (5 applications)
D
28 High-(2 applications)
20 Control 29 Control 21 Standard-(3 applications) 30 Standard-(3 applications)
22 High-(2 applications) 31 Standard- (5 applications)
23 High-(3 applications) 32 Control 24 Control 33 High-(5 applications)
25 High-(5 applications) 34 High-(3 applications)
26 Standard-(2 applications) 35 Standard-(2 applications)
27 Control 36 Control

99
Table 18B: Randomised distribution of treatments, date of application of the treatments
and leaf collections from different rows of block A (variety Elsanta).
Block Row numbers and treatments
Application of the treatments date Leaf collections
A
Week 1 7.06.10
Week 2 14.06.10
Week 3 21.06.10
Week 4 28.06.10
Week 5 5.07.10
Week 6 12.07.10
Row-1 Standard applied twice (weeks 1 and 5)
Standard Standard Collection of leaves
Row-2 High applied 3 times (weeks 1, 3 and 5)
High High High Collection of leaves
Row-3 Control
Control Control Control Control Control Collection of leaves
Row-4 High weekly (applied 5 times)
High High High High High Collection of leaves
Row-5 High applied twice (weeks 1 and 5)
High High Collection of leaves
Row-6 Standard applied 3 times (weeks 1, 3 and 5)
Standard Standard Standard Collection of leaves
Row-7 Control
Control Control Control Collection of leaves
Row-8 Standard weekly (applied 5 times)
Standard Standard Standard Standard Standard Collection of leaves
Row-9 Control
Control Control Collection of leaves

100
4.2.4. Collection of leaves
Leaves were collected on 12 July 2010 from all the rows of 4 different blocks after the
application of the last treatment on 5 July. Treated and untreated (control) leaves were
collected from four different blocks (A-D). Treated and untreated (control) leaves were
collected from different rows of block A, shown in Table 18B, and leaves collected from
block B, C and D, shown in Appendix 4. Leaves were kept in sample bags labelled with
the date of collection and the treatment (rate + timing). All samples were stored in the -
70⁰C freezer (mentioned in chapter 2, section 2.6). During sampling 40 leaves were
collected from each block for each treatment (10 leaves from each plant) and from 40
leaves, 20-30 leaves were used for measuring hair length and density as described in
chapter 2, section 2.8. The remaining leaves were oven dried according to the method
described in chapter 2, section 2.6 and dried leaves were then used for measuring
silicon concentrations using the AID method described in chapter 2, section 2.7.2.1.
4.2.5. Data analysis
Data from studies of concentrations of silicon in strawberry leaves, density and length
of leaf hairs after root application of different concentrations of Omex SW7 in the
variety Elsanta were analysed by one way ANOVA (analysis of variance) under the
Compare Mean in the SPSS version 17. Comparison between foliar and root treatments
were analysed by a Univariate model under the general linear model in the statistical
software program SPSS version 17. For further post-hoc analysis Tukey’s HSD test was
used and to differentiate the treatments in different groups homogeneous subsets test
was used. The relationships between silicon level and density and length of leaf hairs
were analysed by the method described in section 2.9.

101
4.3. Results
4.3.1. Effect of treatments on silicon concentrations in strawberry leaves (silicon wetter Omex SW7 was applied to roots)
Leaves collected from strawberry plants (variety Elsanta) after treatment with different
concentrations of Omex SW7, which were applied to roots showed different levels of
silicon absorption (Figure 31). It was observed that there was a significant difference in
silicon absorption in different treatments. Strawberry leaves collected from standard
and high concentrations of Omex SW7 (to roots) treated plants showed significantly
(P<0.05) higher silicon accumulation compared to that in leaves collected from control
(untreated) plants (Figure 31). Leaves collected from control plants showed the
background level of silicon in strawberry plants. Highest levels of silicon accumulation
were detected in leaves collected from the high concentration of Omex treated plants
compared to all other treatments (Figure 31).
Figure 31: Concentrations of silicon in strawberry (variety Elsanta) leaves treated weekly (total 5 applications), weeks 1, 3 and 5 (total 3 applications) and weeks 1 and 5 (total 2 applications) with different concentrations (standard, high) of silicon wetter, which was applied to roots and control (no application). Samples were collected one week after the final application. Each value represents the mean of 6 replications (n=6). Means (± standard error of means) followed by different letters indicate significant differences (P<0.05) between treatments as indicated by Tukey’s HSD (Post-hoc test) in the statistical software program, SPSS for Windows version 17.
a
f
g
a
d
e
a
b
c
0
500
1000
1500
2000
2500
3000
3500
4000
4500
5000
Control Standard High
Co
nce
ntr
atio
ns
of
silic
on
(m
g/kg
)
Treatments
weekly (total 5 applications) Weeks 1, 3 and 5 (total 3 applications) Weeks 1 and 5 (total 2 applications)

102
4.3.2. Effect of timing on silicon accumulation in strawberry leaves
Silicon wetter Omex SW7 was applied to roots of strawberry plants at three different
timings, weekly (applied each week for 5 weeks, total 5 applications), applied in weeks
1, 3 and 5 (total 3 applications) and applied in weeks 1 and 5 (total 2 applications).
Results showed that when standard and high concentrations of Omex SW7 were applied
weekly a total of 2000 ml (400 ml X 5 times) Omex SW7 was applied. Similarly when
standard and high concentrations of Omex SW7 were applied in weeks 1, 3 and 5, a total
of 1200 ml (400 ml X 3 times) and in weeks 1 and 5, a total of 800 ml (400 ml X 2 times)
Omex SW7 was applied. Total amounts of silicon in 2000 ml, 1200 ml and 800 ml of
Omex SW7 (standard and high) and concentrations of silicon in the leaves after the
application of the different treatments were determined by spectrophotometer which
has been shown in Table 19A.
Table 19A: Total amounts of silicon in the different treatments and accumulation of silicon in the leaves after different treatments. Treatments
Total amounts
of Omex SW7 applied
Total amounts of silicon in the treatments (mg)
Mean concentrations of silicon in the leaves (mg/l)
Control No application of Omex SW7
11.23
Standard weekly (applied 5 times)
2000 ml 54.04 35.86
High weekly (applied 5 times)
2000 ml 540.40 42.96
Control No application of Omex SW7
11.23
Standard applied 3 times (weeks 1, 3 and 5)
1200 ml 32.42 29.23
High applied 3 times (weeks 1, 3 and 5)
1200 ml 324.24 34.38
Control No application of Omex SW7
10.94
Standard applied twice (weeks 1 and 5)
800 ml 21.61 19.60
High applied twice (weeks 1 and 5)
800 ml 216.16 27.91
Dried leaf samples were used in this study to determine the concentrations of silicon.
The silicon concentrations measured by the spectrophotometer were therefore adjusted
in relation to the weight of plant material used and expressed as mg/kg silicon in dried

103
leaf tissue. This is shown in Figure 31 and in Table 19B. Concentrations of silicon in the
leaves indicated that weekly (total 5 times) application of Omex SW7 increased the
silicon concentrations by up to 219.21% (standard) and 282.43% (high) compared to
control (Table 19B). Similarly after applications of different concentrations of silicon in
weeks 1, 3 and 5 (total 3 applications) and in weeks 1 and 5 (total 2 applications)
concentrations of silicon increased in leaves, as shown in Table 19B.
Table 19B: Increased percentage of silicon concentrations in the leaves after different treatments
Highest levels (282.43%) of silicon were observed in the leaves treated weekly with the
high concentration of Omex SW7 and lowest levels (79.15%) of silicon were observed in
Treatments
Mean concentrations of silicon (mg/kg) in leaves
Increased silicon concentrations in leaves after treatment compared to control (mg/kg)
Percentage of increased silicon concentrations in leaves compared to control
Control 1123.50
Standard weekly
(applied 5 times)
3586.33 2462.83 219.21%
High weekly
(applied 5 times)
4296.67 3173.17 282.43%
Control 1123.42
Standard applied 3 times in (weeks 1, 3 and 5)
2923.33 1799.83 160.20%
High
applied 3 times in (weeks 1, 3 and 5)
3438.00 2314.5 206.02%
Control 1094.50
Standard
applied twice in (weeks 1 and 5)
1960.83 866.33 79.15%
High applied twice in (weeks 1 and 5)
2791.67 1668.17 152.41%

104
the leaves treated with the standard concentration of Omex SW7 which was applied in
weeks 1 and 5 (total 2 applications) compared to the control (Table 19B). It was
observed that the absorption rate of silicon in strawberry leaves was significantly
different with different timing of applications (Figure 31). Results revealed that the
weekly application (total 5 times) of 2 different concentrations (standard and high) of
Omex SW7 showed significantly (P<0.05) higher silicon accumulation compared to 3
applications in weeks 1, 3, and 5, or 2 applications in weeks 1 and 5 (Figure 31).
Moreover, standard and high concentrations of Omex SW7 when applied in weeks 1, 3
and 5 (total 3 applications) showed significantly (P<0.05) more silicon accumulation in
leaves compared to treatments applied in weeks 1 and 5 (total 2 applications) (Figure
31).
4.3.3. Effect of silicon on the density of leaf hairs
The effect of root application of two different concentrations of Omex SW7 on the
density of leaf hairs of strawberry leaves was examined using a dissection microscope.
Microscopic observation of silicon treated leaves showed that there were increased
number of leaf hairs on both the upper and lower surfaces of leaves. The number of leaf
hairs observed was more on the lower surface in comparison with the upper surface of
leaves. Results also indicated that there was a significant difference in number of leaf
hairs in different treatment groups. On the upper surface, leaves collected from the
plants after being treated with the two different concentrations of Omex SW7 which
were applied to roots showed significantly (P<0.05) higher leaf hair numbers compared
to the leaves collected from the control plants (Figure 32). Moreover, leaves collected
from the plants treated with the high concentration of Omex SW7 showed significantly
(P<0.05) higher leaf hair numbers compared to the leaves collected from the standard
and control (untreated) plants. The number of leaf hairs on the lower surface of leaves
collected after different treatments are shown in Figure 33. It was observed that the
number of leaf hairs was significantly (P<0.05) higher in the leaves collected from the
plants treated with the high concentration of Omex SW7 compared to the leaves
collected from the control and the standard Omex SW7 treated plants.

105
Figure 32: Number of leaf hairs on the upper surface of leaves in strawberry variety Elsanta treated weekly (total 5 applications), weeks 1, 3 and 5 (total 3 applications) and weeks 1 and 5 (total 2 applications) with different concentrations (standard, high) of silicon wetter, which was applied to roots and control (no application). Samples were collected one week after the final application. A total of 20 leaves for each treatment were used to measure the average number of leaf hairs per cm2 (n=20). Means (± standard error of means) followed by different letters indicate significant differences (P<0.05) between treatments as indicated by Tukey’s HSD (Post-hoc test) in the statistical software program, SPSS for Windows version 17.
Timing also had an effect on the density of leaf hairs on both the upper (Figure 32) and
lower surfaces (Figure 33) of treated leaves. It was observed that the weekly (5
applications) application of two different concentrations of Omex SW7 showed
significantly (P<0.05) higher leaf hair numbers on both the upper (Figure 32) and lower
surfaces (Figure 33) of leaves compared to 3 applications in weeks, 1, 3 and 5 or 2
applications in weeks 1 and 5. Moreover, standard and high concentrations of Omex
SW7 when applied in weeks 1, 3 and 5 (total 3 applications) showed significantly
(P<0.05) higher leaf hair numbers compared to those applied in weeks 1 and 5 (total 2
applications) on both the upper and lower surfaces of leaves (Figures 32 and 33).
a
e
f
a
c
e
a
b
d
0
10
20
30
40
50
60
70
80
90
100
Control Standard High
Ave
rage
nu
mb
er
of
hai
rs p
er
cm2
Treatments
Weekly (total 5 applications)
Weeks 1, 3 and 5 (total 3 applications)
Weeks 1 and 5 (total 2 applications)

106
Figure 33: Number of leaf hairs on the lower surface of leaves in strawberry variety Elsanta treated weekly (total 5 applications), weeks 1, 3 and 5 (total 3 applications) and weeks 1 and 5 (total 2 applications) with different concentrations (standard, high) of silicon wetter, which was applied to roots and control (no application). Samples were collected one week after the final application. A total of 20 leaves for each treatment were used to measure the average number of leaf hairs per cm2 (n=20). Means (± standard error of means) followed by different letters indicate significant differences (P<0.05) between treatments as indicated by Tukey’s HSD (Post-hoc test) in the statistical software program, SPSS for Windows version 17.
4.3.4. Relationship between the leaf hair numbers and accumulation of silicon The results showed that root applications of standard and high concentrations of silicon
increased silicon concentrations in leaves as well as increased the number of leaf hairs
on both the upper and lower surfaces of leaves. The results from the leaves collected on
12 July 2010 were used to find the relationship. It was observed that there was a
significant positive correlation (P<0.01) between accumulation of silicon and the
number of leaf hairs on both the upper and lower surfaces of leaves (Figures 34 and 35).
The correlation coefficients (r) were 0.980 and 0.958 and regression coefficients (R2)
were 0.960 and 0.918 for the upper and lower surfaces of leaves respectively.
a
c
d
a
b
c
a a
b
0
10
20
30
40
50
60
70
80
90
100
Control Standard High
Ave
rage
nu
mb
er
of
hai
rs p
er
cm2
Treatments
Weekly (total 5 applications)
Weeks 1, 3 and 5 (total 3 applications)
Weeks 1 and 5 (total 2 applications)

107
Figure 34: Relationship between concentrations of silicon and average number of leaf hairs (per cm2) on the upper surface of leaves (variety Elsanta). The correlation coefficient (r) was 0.980 and regression coefficient (R2) was 0.960.
Figure 35: Relationship between concentrations of silicon and average number of leaf hairs (per cm2) on the lower surface of leaves (variety Elsanta). The correlation coefficient (r) was 0.958 and regression coefficient (R2) was 0.918
4.3.5. Effect of silicon on the length of leaf hairs
This study examined whether the silicon supplement had any effect on the length of leaf
hairs. It was observed that the root application of silicon wetter Omex SW7 had an effect
y = 0.012x + 1.9045 R² = 0.960
0
10
20
30
40
50
60
70
80
90
100
0 1000 2000 3000 4000 5000
Ave
rage
nu
mb
er
of
hai
rs p
er
cm2
Concentrations of silicon (mg/kg)
y = 0.0127x + 34.024 R² = 0.9186
0
10
20
30
40
50
60
70
80
90
100
0 1000 2000 3000 4000 5000
Ave
rage
nu
mb
er
of
hai
rs p
er
cm2
Concentrations of silicon (mg/kg)

108
on the length of leaf hairs on both the upper and lower surfaces of leaves. The
application of two different silicon concentrations (standard and high) of Omex SW7
showed significantly (P<0.05) longer leaf hair length compared to control leaves
(Figures 36 and 37). It was observed that the length of leaf hairs in the high
concentration of silicon treated leaves showed significantly (P<0.05) longer length
compared to that in the standard Omex SW7 treated leaves and also the leaves collected
from the control plants (Figures 36 and 37) on both the upper and lower surfaces of
leaves. Furthermore, it was also observed that the weekly (total 5 applications)
application of two different concentrations of Omex SW7 showed significantly (P<0.05)
longer leaf hair length on both the upper (Figure 36) and lower (Figure 37) surfaces of
leaves compared to 3 applications in weeks 1, 3 and 5 or 2 applications in weeks 1 and
5.
Figure 36: Length of leaf hairs on the upper surface of leaves in strawberry variety Elsanta treated weekly (total 5 applications), weeks 1, 3 and 5 (total 3 applications) and weeks 1 and 5 (total 2 applications) with different concentrations (standard, high) of silicon wetter, which was applied to roots and control (no application). Samples were collected one week after the final application. A total of 20 leaves for each treatment were used to measure the average length of leaf hairs (n=20). Means (± standard error of means) followed by different letters indicate significant differences (P<0.05) between treatments as indicated by Tukey’s HSD (Post-hoc test) in the statistical software program, SPSS for Windows version 17.
a
c
d
a
b c
a a b
0
0.5
1
1.5
2
2.5
3
3.5
Control Standard High
Len
gth
(av
era
ge)
of
leaf
hai
rs in
mm
Treatments
Weekly (total 5 applications)
Weeks 1, 3 and 5 (total 3 applications)
Weeks 1 and 5 (total 2 applications)

109
Figure 37: Length of leaf hairs on the lower surface of leaves in strawberry variety Elsanta treated weekly (total 5 applications), weeks 1, 3 and 5 (total 3 applications) and weeks 1 and 5 (total 2 applications) with different concentrations (standard, high) of silicon wetter, which was applied to roots and control (no application). Samples were collected one week after the final application. A total of 20 leaves for each treatment were used to measure the average length of leaf hairs (n=20). Means (± standard error of means) followed by different letters indicate significant differences (P<0.05) between treatments as indicated by Tukey’s HSD (Post-hoc test) in the statistical software program, SPSS for Windows version 17.
4.3.6. Relationship between the length of leaf hairs and accumulation of silicon Root applications of standard and high concentrations of silicon showed increased
silicon concentrations in leaves as well as increased the length of leaf hairs on both the
upper and lower surfaces of leaves. Therefore, the relationship between the length of
leaf hairs and the silicon level was investigated. It was observed that there was a
significant positive correlation (P<0.01) between accumulation of silicon and the length
of leaf hairs on both the upper and lower surfaces of leaves (Figures 38 and 39). The
correlation coefficients (r) were 0.961 and 0.968 and regression coefficients (R2) were
0.923 and 0.937 for the upper and lower surfaces of leaves respectively. These results
indicated the possibility that silicon application on the leaf surfaces increased the length
of leaf hairs on both the upper and lower surfaces of leaves.
a
d
e
a
c
d
a b
c
0
0.5
1
1.5
2
2.5
3
3.5
Control Standard High
Len
gth
(av
era
ge)
of
leaf
hai
rs in
mm
Treatments
Weekly (total 5 applications)
Weeks 1, 3 and 5 (total 3 applications)
Weeks 1 and 5 (total 2 applications)

110
Figure 38: Relationship between concentrations of silicon and average length of leaf hairs on the upper surface of leaves (variety Elsanta). The correlation coefficient (r) was 0.961 and regression coefficient (R2) was 0.923.
Figure 39: Relationship between concentrations of silicon and average length of leaf hairs on the lower surface of leaves (variety Elsanta). The correlation coefficient (r) was 0.968 and regression coefficient (R2) was 0.937.
y = 0.0005x + 0.001 R² = 0.923
0
0.5
1
1.5
2
2.5
0 1000 2000 3000 4000 5000
Len
gth
(av
era
ge)
of
leaf
hai
rs in
mm
Concentrations of silicon (mg/kg)
y = 0.0004x + 0.403 R² = 0.9374
0
0.5
1
1.5
2
2.5
3
0 1000 2000 3000 4000 5000
Len
gth
(av
era
ge)
of
leaf
hai
rs in
mm
Concentrations of silicon (mg/kg)

111
4.3.7. Comparison between foliar and root applications of Omex SW7
on strawberry plants
Foliar and root applications of different concentrations of Omex SW7 were evaluated for
their effects on strawberry plants. Three different concentrations of Omex SW7
(standard, high and very high) were applied to strawberry plants at three different
timings. Results of silicon accumulation and physical changes on leaves were shown in
different graphs in chapter 3. In chapter 4 two different concentrations (standard and
high) of Omex SW7 were applied to the root zone at three different timings. The very
high concentration of Omex SW7 was not applied to roots. Reasons for not using the
very high concentration of Omex SW7 has already been described in chapter 3 (section
3.3.8). Leaves collected from strawberry plants (variety Elsanta) after being treated
weekly with foliar and root applications of different concentrations (standard and high)
of Omex SW7 showed different levels of silicon absorption. Standard (F) represents
standard foliar application i.e. the standard concentration of Omex SW7 applied on
leaves and Standard (R) represents standard root application i.e. the standard
concentration of Omex SW7 applied to roots. High (F) represents high foliar application
i.e. the high concentration of Omex SW7 applied on leaves and High (R) represents high
root application i.e. the high concentration of Omex SW7 applied to roots. Results
showed that there was a significant difference in silicon absorption when different
concentrations of silicon wetter were applied to strawberry plants at three different
timings. Leaves collected from control plants showed significantly (P<0.05) lower
silicon accumulation compared to the leaves collected from standard foliar and
standard root applications. There was a significant difference in silicon accumulation
between standard foliar and standard root treatment when the standard concentration
of Omex SW7 was applied weekly (total 5 applications) (Figure 40A).

112
A B
Figure 40(A-B): Comparison of silicon concentrations in strawberry leaves (variety Elsanta) after being treated weekly with (A) standard concentration of Omex SW7 to leaves (Standard F) and roots (Standard R) and (B) high concentration of Omex SW7 to leaves (High F) and roots (High R). Each value represents the mean of 6 replications (n=6). Means (± standard error of means) followed by different letters indicate significant differences (P<0.05) between treatments as indicated by Tukey’s HSD (Post-hoc test) in the statistical software program, SPSS for Windows version 17.
A B
Figure 41(A-B): Comparison of silicon concentrations in strawberry leaves (variety Elsanta) after being treated in weeks 1, 3 and 5 with (A) standard concentration of Omex SW7 to leaves (Standard F) and roots (Standard R) and (B) high concentration of Omex SW7 to leaves (High F) and roots (High R). Each value represents the mean of 6 replications (n=6). Means (± standard error of means) followed by different letters indicate significant differences (P<0.05) between treatments as indicated by Tukey’s HSD (Post-hoc test) in the statistical software program, SPSS for Windows version 17.
a
b
c
0
500
1000
1500
2000
2500
3000
3500
4000
4500
5000
Control Standard (F) Standard (R)
Co
nce
ntr
atio
ns
of
silic
on
(m
g/kg
)
Treatments
Weekly (total 5 applications)
a
b
c
0
500
1000
1500
2000
2500
3000
3500
4000
4500
5000
Control High (F) High (R)
Co
nce
ntr
atio
ns
of
silic
on
(m
g/kg
)
Treatments
Weekly (total 5 applications)
a
b
c
0
500
1000
1500
2000
2500
3000
3500
4000
4500
5000
Control Standard (F) Standard (R)
Co
nce
ntr
atio
ns
of
silic
on
(m
g/kg
)
Treatments
Weeks 1, 3 and 5 (total 3 applications)
a
b
c
0
500
1000
1500
2000
2500
3000
3500
4000
4500
5000
Control High (F) High (R)
Co
nce
ntr
atio
ns
of
silic
on
(m
g/kg
)
Treatments
Weeks 1, 3 and 5 (total 3 applications)

113
A B
Figure 42(A-B): Comparison of silicon concentrations in strawberry leaves (variety Elsanta) after being treated in weeks 1 and 5 with (A) standard concentration of Omex SW7 to leaves (Standard F) and roots (Standard R) and (B) high concentration of Omex SW7 to leaves (High F) and roots (High R). Each value represents the mean of 6 replications (n=6). Means (± standard error of means) followed by different letters indicate significant differences (P<0.05) between treatments as indicated by Tukey’s HSD (Post-hoc test) in the statistical software program, SPSS for Windows version 17.
Significant difference was also observed in silicon accumulation between high foliar and
high root treatment when the high concentration of Omex SW7 was applied weekly
(Figure 40B). Similar results were also found in silicon accumulation between foliar and
root treatment when standard and high concentrations of Omex SW7 were applied in
weeks 1, 3 and 5 (total 3 applications) and also applied in weeks 1 and 5 (total 2
applications) (Figures 41A and B and Figures 42A and B). Results revealed that root
application significantly (P<0.05) increased silicon accumulation compared to the foliar
application. Observation also indicated that when standard and high concentrations of
Omex SW7 were applied to roots at three different timings significantly (P<0.05) more
silicon accumulated in the leaves compared to the foliar treatments.
a b
c
0
500
1000
1500
2000
2500
3000
3500
4000
4500
5000
Control Standard (F) Standard (R)
Co
nce
ntr
atio
ns
of
silic
on
(m
g/kg
)
Treatments
Weeks 1 and 5 (total 2 applications)
a
b
c
0
500
1000
1500
2000
2500
3000
3500
4000
4500
5000
Control High (F) High (R)
Co
nce
ntr
atio
ns
of
silic
on
(m
g/kg
)
Treatments
Weeks 1 and 5 (total 2 applications)

114
4.3.8. Comparison and effect of foliar and root applications of silicon
on the density of leaf hairs (upper surface)
Results showed that standard and high concentrations of Omex SW7 when applied to
leaves (foliar) and roots had an effect on the density of leaf hairs. There was a
significant difference in the density of leaf hairs on both the upper and lower surfaces of
leaves between foliar and root application.
A B
Figure 43(A-B): Comparison of leaf hair numbers on the upper surface of strawberry leaves (variety Elsanta) after being treated weekly with (A) standard concentration of Omex SW7 to leaves (Standard F) and roots (Standard R) and (B) high concentration of Omex SW7 to leaves (High F) and roots (High R). A total of 20 leaves for each treatment were used to measure the average number of leaf hairs per cm2 (n=20). Means (± standard error of means) followed by different letters indicate significant differences (P<0.05) between treatments as indicated by Tukey’s HSD (Post-hoc test) in the statistical software program, SPSS for Windows version 17.
On the upper surface of leaves, the standard concentration of Omex SW7 when applied
weekly (total 5 applications) showed significantly higher (P<0.05) leaf hair numbers on
the leaves collected from the root treated plants compared to the leaves collected from
standard concentration of foliar treatment (Figure 43A). Furthermore when the high
concentration of Omex SW7 was applied weekly (total 5 applications) significant
difference between high foliar and high root treatment was also observed (Figure 43B).
On the upper surface of leaves significant (P<0.05) difference in leaf hair numbers was
a
b
c
0
10
20
30
40
50
60
70
80
90
100
Control Standard (F) Standard (R)
Ave
rage
nu
mb
er
of
hai
rs p
er
cm2
Treatments
Weekly (total 5 applications)
a
b
c
0
10
20
30
40
50
60
70
80
90
100
Control High (F) High (R)
Ave
rage
nu
mb
er
of
hai
rs p
er
cm2
Treatments
Weekly (total 5 applications)

115
observed between standard foliar and standard root treatment, when the standard
concentration of Omex SW7 was applied in weeks 1, 3 and 5 (total 3 applications)
(Figure 44A). Leaves collected from standard root treatment showed significantly
(P<0.05) higher leaf hair numbers compared to the leaves collected from standard foliar
treatment (Figure 44A). Similar results were also found between high foliar and high
root treatment when the high concentration of Omex SW7 was applied in weeks 1, 3 and
5 (total 3 applications) (Figure 44B).
A B
Figure 44(A-B): Comparison of leaf hair numbers on the upper surface of strawberry leaves (variety Elsanta) after being treated in weeks 1, 3 and 5 with (A) standard concentration of Omex SW7 to leaves (Standard F) and roots (Standard R) and (B) high concentration of Omex SW7 to leaves (High F) and roots (High R). A total of 20 leaves for each treatment were used to measure the average number of leaf hairs per cm2 (n=20). Means (± standard error of means) followed by different letters indicate significant differences (P<0.05) between treatments as indicated by Tukey’s HSD (Post-hoc test) in the statistical software program, SPSS for Windows version 17.
On the upper surface of leaves standard and high concentrations of foliar and root
treatment when applied in weeks 1 and 5 (total 2 applications) also had an effect on the
density of leaf hairs. No significant difference (P>0.05) in leaf hair numbers was
observed between standard foliar and standard root treatment when the standard
concentration of Omex was applied in weeks 1 and 5 (total 2 applications) (Figure 45A).
On the other hand a significant difference was found between high foliar and high root
treatment when the high concentration of Omex was applied in weeks 1 and 5 (total 2
applications) (Figure 45B). Application of the high concentration of Omex SW7 to roots
a
b c
0
10
20
30
40
50
60
70
80
90
100
Control Standard (F) Standard (R)
Ave
rage
nu
mb
er
of
hai
rs p
er
cm2
Treatments
Weeks 1, 3 and 5 (total 3 applications)
a
b c
0
10
20
30
40
50
60
70
80
90
100
Control High (F) High (R)
Ave
rage
nu
mb
er
of
hai
rs p
er
cm2
Treatments
Weeks 1, 3 and 5 (total 3 applications)

116
in weeks 1 and 5 (total 2 applications) showed significantly (P<0.05) higher leaf hair
numbers compared to the foliar treatment (Figure 45B).
A B
Figure 45(A-B): Comparison of leaf hair numbers on the upper surface of strawberry leaves (variety Elsanta) after being treated in weeks 1 and 5 with (A) standard concentration of Omex SW7 to leaves (Standard F) and roots (Standard R) and (B) high concentration of Omex SW7 to leaves (High F) and roots (High R). A total of 20 leaves for each treatment were used to measure the average number of leaf hairs per cm2 (n=20). Means (± standard error of means) followed by different letters indicate significant differences (P<0.05) between treatments as indicated by Tukey’s HSD (Post-hoc test) in the statistical software program, SPSS for Windows version 17.
4.3.9. Comparison and effect of foliar and root applications of silicon
on the density of leaf hairs (lower surface)
On the lower surface of leaves, significant difference in leaf hair numbers was observed
between standard foliar and standard root treatment when the standard concentration
of Omex SW7 was applied weekly (total 5 applications) (Figure 46A). Moreover, weekly
(total 5 applications) application of the high concentration of Omex SW7 to roots
showed significantly (P<0.05) higher leaf hair numbers compared to the leaves
collected from high foliar treatment and the leaves collected from control plants (Figure
46B). When the standard concentration of Omex SW7 was applied in weeks 1, 3 and 5
(total 3 applications) a significant difference (P<0.05) between standard foliar and
standard root treatment was observed (Figure 47A). Similar results were also found
a b b
0
10
20
30
40
50
60
70
80
90
100
Control Standard (F) Standard (R)
Ave
rage
nu
mb
er
of
hai
rs p
er
cm2
Treatments
Weeks 1 and 5 (total 2 applications)
a
b c
0
10
20
30
40
50
60
70
80
90
100
Control High (F) High (R) A
vera
ge n
um
be
r o
f h
airs
pe
r cm
2
Treatments
Weeks 1 and 5 (total 2 applications)

117
between high foliar and high root treatment when the high concentration of Omex SW7
was applied in weeks 1, 3 and 5 (total 3 applications) (Figure 47B). However, no
significant difference (P>0.05) was observed between foliar and root treatment when
standard and high concentrations of Omex SW7 were applied in weeks 1 and 5 (total 2
applications) (Figures 48A and B).
A B
Figure 46(A-B): Comparison of leaf hair numbers on the lower surface of strawberry leaves (variety Elsanta) after being treated weekly with (A) standard concentration of Omex SW7 to leaves (Standard F) and roots (Standard R) and (B) high concentration of Omex SW7 to leaves (High F) and roots (High R). A total of 20 leaves for each treatment were used to measure the average number of leaf hairs per cm2 (n=20). Means (± standard error of means) followed by different letters indicate significant differences (P<0.05) between treatments as indicated by Tukey’s HSD (Post-hoc test) in the statistical software program, SPSS for Windows version 17.
a
b
c
0
10
20
30
40
50
60
70
80
90
100
Control Standard (F) Standard (R)
Ave
rage
nu
mb
er
of
hai
rs p
er
cm2
Treatments
Weekly (total 5 applications)
a
b
c
0
10
20
30
40
50
60
70
80
90
100
Control High (F) High (R)
Ave
rage
nu
mb
er
of
hai
rs p
er
cm2
Treatments
Weekly (total 5 applications)

118
A B
Figure 47(A-B): Comparison of leaf hair numbers on the lower surface of strawberry leaves (variety Elsanta) after being treated in weeks 1, 3 and 5 with (A) standard concentration of Omex SW7 to leaves (Standard F) and roots (Standard R) and (B) high concentration of Omex SW7 to leaves (High F) and roots (High R). A total of 20 leaves for each treatment were used to measure the average number of leaf hairs per cm2 (n=20). Means (± standard error of means) followed by different letters indicate significant differences (P<0.05) between treatments as indicated by Tukey’s HSD (Post-hoc test) in the statistical software program, SPSS for Windows version 17.
A B
Figure 48(A-B): Comparison of leaf hair numbers on the lower surface of strawberry leaves (variety Elsanta) after being treated in weeks 1 and 5 with (A) standard concentration of Omex SW7 to leaves (Standard F) and roots (Standard R) and (B) high concentration of Omex SW7 to leaves (High F) and roots (High R). A total of 20 leaves for each treatment were used to measure the average number of leaf hairs per cm2 (n=20). Means (± standard error of means) followed by different letters indicate significant differences (P<0.05) between treatments as indicated by Tukey’s HSD (Post-hoc test) in the statistical software program, SPSS for Windows version 17.
a
b c
0
10
20
30
40
50
60
70
80
90
100
Control Standard (F) Standard (R)
Ave
rage
nu
mb
er
of
hai
rs p
er
cm2
Treatments
Weeks 1, 3 and 5 (total 3 applications)
a
b c
0
10
20
30
40
50
60
70
80
90
100
Control High (F) High (R)
Ave
rage
nu
mb
er
of
hai
rs p
er
cm2
Treatments
Weeks 1, 3 and 5 (total 3 applications)
a
b b
0
10
20
30
40
50
60
70
80
90
100
Control Standard (F) Standard (R)
Ave
rage
nu
mb
er
of
hai
rs p
er
cm2
Treatments
Weeks 1 and 5 (total 2 applications)
a
b b
0
10
20
30
40
50
60
70
80
90
100
Control High (F) High (R)
Ave
rage
nu
mb
er
of
hai
rs p
er
cm2
Treatments
Weeks 1 and 5 (total 2 applications)
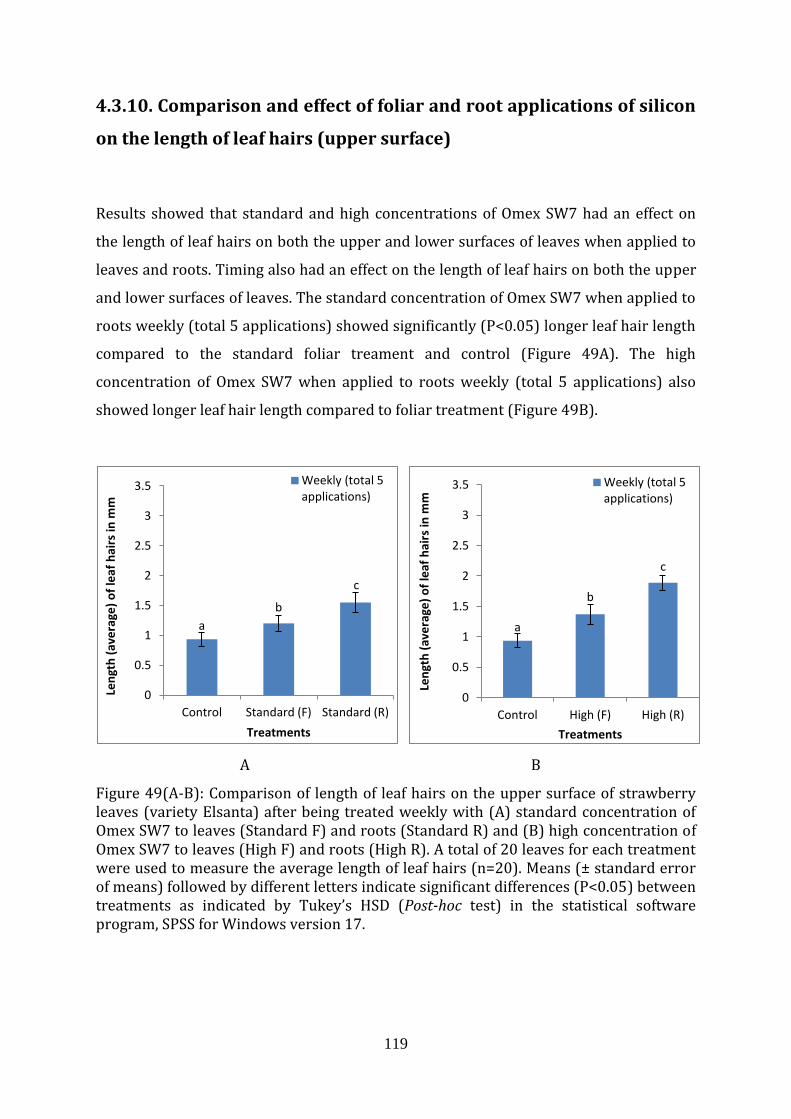
119
4.3.10. Comparison and effect of foliar and root applications of silicon
on the length of leaf hairs (upper surface)
Results showed that standard and high concentrations of Omex SW7 had an effect on
the length of leaf hairs on both the upper and lower surfaces of leaves when applied to
leaves and roots. Timing also had an effect on the length of leaf hairs on both the upper
and lower surfaces of leaves. The standard concentration of Omex SW7 when applied to
roots weekly (total 5 applications) showed significantly (P<0.05) longer leaf hair length
compared to the standard foliar treament and control (Figure 49A). The high
concentration of Omex SW7 when applied to roots weekly (total 5 applications) also
showed longer leaf hair length compared to foliar treatment (Figure 49B).
Figure 49(A-B): Comparison of length of leaf hairs on the upper surface of strawberry leaves (variety Elsanta) after being treated weekly with (A) standard concentration of Omex SW7 to leaves (Standard F) and roots (Standard R) and (B) high concentration of Omex SW7 to leaves (High F) and roots (High R). A total of 20 leaves for each treatment were used to measure the average length of leaf hairs (n=20). Means (± standard error of means) followed by different letters indicate significant differences (P<0.05) between treatments as indicated by Tukey’s HSD (Post-hoc test) in the statistical software program, SPSS for Windows version 17.
A B
a
b
c
0
0.5
1
1.5
2
2.5
3
3.5
Control Standard (F) Standard (R)
Len
gth
(av
era
ge)
of
leaf
hai
rs in
mm
Treatments
Weekly (total 5 applications)
a
b
c
0
0.5
1
1.5
2
2.5
3
3.5
Control High (F) High (R)
Len
gth
(av
era
ge)
of
leaf
hai
rs in
mm
Treatments
Weekly (total 5 applications)

120
The standard concentration of Omex SW7 when applied to roots in weeks 1, 3 and 5
(total 3 applications) showed significantly longer (P<0.05) leaf hairs compared to the
leaves collected from foliar treatment (Figure 50A). Similar results were also found
between foliar and root treatment when the high concentration of Omex SW7 was
applied in weeks 1, 3 and 5 (total 3 applications) (Figure 50B). However no significant
difference (P>0.05) in length of leaf hairs was observed between foliar and root
treatment when the standard concentration of Omex SW7 was applied in weeks 1 and 5
(total 2 applications) (Figure 51A). Results also indicated that there was a significant
difference (P<0.05) between high foliar and high root treatment when the high
concentration of Omex SW7 was applied to roots and leaves in weeks 1 and 5 (total 2
applications) (Figure 51B). The high concentration of Omex SW7 applied to roots
showed significantly (P<0.05) longer leaf hair length compared to the foliar treatment
(Figure 51B).
A B
Figure 50(A-B): Comparison of length of leaf hairs on the upper surface of strawberry leaves (variety Elsanta) after being treated in weeks 1, 3 and 5 with (A) standard concentration of Omex SW7 to leaves (Standard F) and roots (Standard R) and (B) high concentration of Omex SW7 to leaves (High F) and roots (High R). A total of 20 leaves for each treatment were used to measure the average length of leaf hairs (n=20). Means (± standard error of means) followed by different letters indicate significant differences (P<0.05) between treatments as indicated by Tukey’s HSD (Post-hoc test) in the statistical software program, SPSS for Windows version 17.
a b
c
0
0.5
1
1.5
2
2.5
3
3.5
Control Standard (F) Standard (R) Len
gth
(av
era
ge)
of
leaf
hai
rs in
mm
Treatments
Weeks 1, 3 and 5 (total 3 applications)
a b
c
0
0.5
1
1.5
2
2.5
3
3.5
Control High (F) High (R)
Len
gth
(av
era
ge)
of
leaf
hai
rs in
mm
Treatments
Weeks 1, 3 and 5 (total 3 applications)

121
A B
Figure 51(A-B): Comparison of length of leaf hairs on the upper surface of strawberry leaves (variety Elsanta) after being treated in weeks 1 and 5 with (A) standard concentration of Omex SW7 to leaves (Standard F) and roots (Standard R) and (B) high concentration of Omex SW7 to leaves (High F) and roots (High R). A total of 20 leaves for each treatment were used to measure the average length of leaf hairs (n=20). Means (± standard error of means) followed by different letters indicate significant differences (P<0.05) between treatments as indicated by Tukey’s HSD (Post-hoc test) in the statistical software program, SPSS for Windows version 17.
4.3.11. Comparison and effect of foliar and root applications of silicon
on the length of leaf hairs (lower surface)
Results showed that on the lower surface of leaves, length of leaf hairs in the root
treated leaves was significantly (P<0.05) longer compared to the foliar treated leaves
and control (untreated) leaves. Significant difference (P<0.05) in length of leaf hairs was
observed between foliar and root treatment when standard and high concentrations of
Omex SW7 were applied weekly (total 5 applications) and also when applied in weeks 1,
3 and 5 (total 3 applications) to roots and leaves (Figures 52A and B and Figures 53A
and B). On the other hand no significant difference (P>0.05) was observed between
foliar and root treatment when standard and high concentrations of Omex SW7 were
applied in weeks 1 and 5 (total 2 applications) (Figures 54A and B).
a a a
0
0.5
1
1.5
2
2.5
3
3.5
Control Standard (F) Standard (R)
Len
gth
(av
era
ge)
of
leaf
hai
rs in
mm
Treatments
Weeks 1 and 5 (total 2 applications)
a b
c
0
0.5
1
1.5
2
2.5
3
3.5
Control High (F) High (R)
Len
gth
(av
era
ge)
of
leaf
hai
rs in
mm
Treatments
Weeks 1 and 5 (total 2 applications)

122
A B Figure 52(A-B): Comparison of length of leaf hairs on the lower surface of strawberry leaves (variety Elsanta) after being treated weekly with (A) standard concentration of Omex SW7 to leaves (Standard F) and roots (Standard R) and (B) high concentration of Omex SW7 to leaves (High F) and roots (High R). A total of 20 leaves for each treatment were used to measure the average length of leaf hairs (n=20). Means (± standard error of means) followed by different letters indicate significant differences (P<0.05) between treatments as indicated by Tukey’s HSD (Post-hoc test) in the statistical software program, SPSS for Windows version 17.
A B Figure 53(A-B): Comparison of length of leaf hairs on the lower surface of strawberry leaves (variety Elsanta) after being treated in weeks 1, 3 and 5 with (A) standard concentration of Omex SW7 to leaves (Standard F) and roots (Standard R) and (B) high concentration of Omex SW7 to leaves (High F) and roots (High R). A total of 20 leaves for each treatment were used to measure the average length of leaf hairs (n=20). Means (± standard error of means) followed by different letters indicate significant differences (P<0.05) between treatments as indicated by Tukey’s HSD (Post-hoc test) in the statistical software program, SPSS for Windows version 17.
a
b
c
0
0.5
1
1.5
2
2.5
3
3.5
Control Standard (F) Standard (R)
Len
gth
(av
era
ge)
of
leaf
hai
rs in
mm
Treatments
Weekly (total 5 applications)
a
b
c
0
0.5
1
1.5
2
2.5
3
3.5
Control High (F) High (R)
Len
gth
(av
era
ge)
of
leaf
hai
rs in
mm
Treatments
Weekly (total 5 applications)
a
b c
0
0.5
1
1.5
2
2.5
3
3.5
Control Standard (F) Standard (R)
Len
gth
(av
era
ge)
of
leaf
hai
rs in
mm
Treatments
Weeks 1, 3 and 5 (total 3 applications)
a
b c
0
0.5
1
1.5
2
2.5
3
3.5
Control High (F) High (R)
Len
gth
(av
era
ge)
of
leaf
hai
rs in
mm
Treatments
Weeks 1, 3 and 5 (total 3 applications)

123
A B
Figure 54(A-B): Comparison of length of leaf hairs on the lower surface of strawberry leaves (variety Elsanta) after being treated in weeks 1 and 5 with (A) standard concentration of Omex SW7 to leaves (Standard F) and roots (Standard R) and (B) high concentration of Omex SW7 to leaves (High F) and roots (High R). A total of 20 leaves for each treatment were used to measure the average length of leaf hairs (n=20). Means (± standard error of means) followed by different letters indicate significant differences (P<0.05) between treatments as indicated by Tukey’s HSD (Post-hoc test) in the statistical software program, SPSS for Windows version 17.
4.4. Discussion
Leaves collected from strawberry plants after treatment with different concentrations
of Omex SW7, which was applied to roots at different timings, showed different levels of
silicon absorption. There were significant differences in concentrations in different
treatments and different timings. Strawberry leaves collected from standard and high
concentrations of Omex SW7 treated plants showed significantly (P<0.05) higher silicon
concentrations compared to that in leaves collected from control plants (Figure 31).
Highest levels of silicon accumulation were detected in leaves collected from the high
concentration of Omex SW7 treated plants compared to all other treatments (Figure
31). Results also showed that the high concentration of Omex SW7 when applied weekly
(total 5 applications) to roots increased the silicon concentrations by up to 282.43%
compared to control. Shetty et al., (2012) observed that application of silicon
(Potassium silicate) to roots increased the silicon levels in the leaves of the rose plants.
The observations reported above showed that root application of silicon increased the
concentrations of silicon in both strawberries (above) and roses (Shetty et al., 2012).
a b
b
0
0.5
1
1.5
2
2.5
3
3.5
Control Standard (F) Standard (R)
Len
gth
(av
era
ge)
of
leaf
hai
rs in
mm
Treatments
Weeks 1 and 5 (total 2 applications)
a
b b
0
0.5
1
1.5
2
2.5
3
3.5
Control High (F) High (R)
Len
gth
(av
era
ge)
of
leaf
hai
rs in
mm
Treatments
Weeks 1 and 5 (total 2 applications)

124
Accumulation of silicon in plant tissues varies greatly among plant species and the
difference in silicon accumulation has been attributed to the ability of the roots to take
up silicon (Takahashi et al., 1990). According to Takahashi et al., (1990) there are three
different modes of silicon uptake that is active, passive and rejective uptake. Plants
species, which take up silicon faster than water have an active mechanism of silicon
uptake and are classified as silicon accumulators (mentioned in chapter 1). According to
the above classification plants belonging to the group of silicon excluders or silicon non-
accumulators have a rejective mode of silicon uptake and consequently take up silicon
to a lower degree than water. Takahashi and Miyake (1976a and 1976b) made an
extensive study covering 147 plant species grown under similar soil conditions and
measured silicon concentrations from the leaves. Takahashi and Miyake (1976a and
1976b) observed that there is a characteristic distribution of silicon accumulation in the
plant kingdom. They observed that silicon accumulators belong to the plant families
Gramineae and Cyperaceae and show high silicon accumulation. Intermediate plants
(mentioned in chapter 1) are found within the orders Cucurbitales and Urticales and
show intermediate silicon accumulation. Whereas species of all other plant families
were silicon excluders and show low silicon accumulation. Based on this, strawberry
has been classified as a silicon excluder type plant (Takahashi and Miyake, 1976a and
1976b; Miyake and Takahashi, 1986). Although strawberry is considered as a silicon
excluder plant, addition of silicon in the hydroponic solution showed (Kanto et al.,
2006) increased concentrations of silicon in the strawberry plants. The results from
chapter 4 and the results from Shetty et al., (2012) showed that although strawberry
and rose are not classified as silicon accumulator plants application of silicon to roots
increased the silicon concentrations in leaves of strawberry and rose plants. Shetty et
al., (2012) also found that accumulation of silicon was different in different varieties
used in their study. They (Shetty et al., 2012) found that accumulation of silicon was
365.3% in a powdery mildew resistant variety (genotype 99/9496-19) of rose and
198.9% in a powdery mildew susceptible variety (genotype 95/5166-1) of rose
compared to the control. The difference of accumulation of silicon between strawberry
and rose and the discrepancy between the two varieties (resistant and susceptible
variety of rose) indicated that accumulation of silicon depends on plant species and
their ability to take up silicon. Therefore according to the results of the study (chapter
4) and the results from Shetty et al., (2012) it can be postulated that strawberry plants

125
can accumulate silicon. The classification of Takahashi and Miyake (1976a and 1976b)
were merely based on silicon contents in the plant dry tissue whereas detailed studies
involving the measurements of silicon uptake rates, soil, climatic factors and
transpiration are missing. Such a detailed study could be specially interesting for a more
precise characterization of silicon excluder plants.
Silicon wetter Omex SW7 was applied to roots of strawberry plants (variety Elsanta) at
three different timings and it was observed that the absorption rate of silicon in
strawberry leaves was significantly different with different timing of applications.
Results revealed that weekly (total 5 applications) application of 2 different
concentrations (standard and high) of Omex SW7 showed significantly (P<0.05) higher
silicon concentrations compared to 3 applications in weeks 1, 3 and 5 or 2 applications
in weeks 1 and 5 (Figure 31). In order to guarantee a continuous disease control, silicon
must be constantly available for root uptake because once it is deposited in the plant
tissue it is not retranslocated (Datnoff et al., 2007). This might be the reason that
weekly application of standard and high concentrations of Omex SW7 increased the
concentrations of silicon in the plants compared to 3 applications in weeks 1, 3 and 5 or
2 applications in weeks 1 and 5. Besides this, Ma and Yamaji (2006) stated that the
amount of silicon in soil or media is also important for plant growth and development.
This is applicable in this study which showed that application of the high concentration
of Omex SW7 increased the concentrations of silicon in the strawberry plants, because
of high amount of silicon in the high Omex SW7 treatment compared to the standard
treatment.
The effect of root application of Omex SW7 on the density and length of leaf hairs was
investigated using a dissection microscope. It was observed that the root application of
Omex SW7 had an effect on the density and length of leaf hairs on both the upper and
lower surfaces of leaves. Furthermore, it was also revealed that the weekly (total 5
times) applications of two different concentrations (standard and high) of Omex SW7
showed significantly higher leaf hair numbers and longer leaf hair length on both the
upper and lower surfaces of leaves compared to applications 3 times in weeks 1, 3 and 5
or twice in weeks 1 and 5. Plants take up silicon by the roots. Following uptake by the
roots, silicon is translocated to the shoot through transpiration. Preferential sites of
silica deposition are the cell wall, cell lumen, intercellular space of epidermal tissue.

126
Hairs or trichomes are another important site of silica deposition. Samuels et al., (1993)
stated that trichomes are the most common site where the silica is found. Application of
standard and high concentrations of Omex SW7 to the roots of strawberry plants
showed increased density and increased length of leaf hairs in leaves. According to the
above discussion it can be explained that after application of Omex SW7, silicon is taken
up by the roots of strawberry plants and then silicon is deposited in the base of the leaf
hair which stimulated the number and growth of leaf hairs. The results of this chapter
also showed that there was a significant positive correlation (P<0.01) between
accumulation of silicon and the number of leaf hairs on both the upper and lower
surfaces of leaves. Significant positive correlation (P<0.01) was also observed between
accumulation of silicon and the length of leaf hairs on both the upper and lower surfaces
of leaves. These results emphasize the possibility that application of silicon to the roots
increased the number and length of leaf hairs on both the upper and lower surfaces of
leaves.
Foliar and root applications of different concentrations of Omex SW7 were evaluated for
their effects on strawberry plants. The purpose of the study was to compare the effect of
foliar and root applications of Omex SW7 on silicon accumulation and morphological
changes in leaves of strawberry plants. Results showed that there was a significant
difference in silicon absorption at different concentrations of silicon wetter application
to strawberry plants. Results showed that standard and high concentrations of Omex
SW7 when applied weekly to roots showed significantly higher accumulation of silicon
in the leaves compared to the leaves collected from foliar application (Figures 40A and
B). The difference in silicon accumulation has been attributed to the differences in the
silicon uptake mechanism although the mechanism responsible for these different
uptake systems is poorly understood. In a study Ma et al., (2004) reported that a gene
Lsi1 is mainly expressed in the root which is responsible for active silicon uptake,
suggesting that root absorption is optimal. On the other hand, after foliar application
silicon is not totally absorbed through the cuticle and this might be the reason why
foliar application of silicon leads to less silicon accumulation compared to the root
application. In the literature there are varying reports about levels of accumulation of
silicon in different plant species. Guevel et al., (2007) reported that in wheat silicon
deposition was highest when different silicon based products were applied to roots as
opposed to leaves. Bowen et al., (1992) observed that both foliar and root applications

127
of silicon increased silicon concentrations in the leaves of grapes. Wang and Galletta
(1998) observed that foliar application of silicon increased silicon accumulation and
also increased growth in strawberry plants. Foliar application of silicon has been shown
to increase concentrations of chlorophyll per unit area of leaf tissue (Wang and Galletta,
1998). Although there is a debate about foliar and root application, to date many studies
have confirmed the beneficial role of the application of silicon on plant growth and
development either through leaves or roots. The present study showed that standard
and high concentrations of Omex SW7 had an effect on the density and length of leaf
hairs when applied to leaves (foliar) and roots. There was a significant difference in the
density and length of leaf hairs between foliar application and root application on both
the upper and lower surfaces of leaves. Results revealed that standard and high
concentrations of silicon when applied weekly (total 5 applications) and also when
applied in weeks 1, 3 and 5 (total 3 applications) showed significantly more leaf hairs
and significantly longer leaf hair length compared to the foliar treatment.
The above comparison revealed that the impact of silicon was best achieved when this
element was taken up by the roots. This was supported by Shetty et al., (2012) who
found that application of silicon to the roots significantly increased the silicon content in
the rose plant which is considered as a silicon non-accumulator plant. Another
investigator Dallagnol et al., (2012) found that in melon which is not a silicon
accumulator plant, concentration of silicon increased by the application of silicon. They
stated that best results could be achieved by root application compared to foliar
application. Both authors also found that root application of silicon was effective in the
reduction of powdery mildew in melon and in rose (Dallagnol et al., 2012; Shetty et al.,
2012). Although silicon is not considered as an essential element, its role in plant
resistance to both biotic and abiotic stresses has received increasing attention (Ma and
Yamaji, 2006). To date most studies showed that disease control by silicon had involved
root absorption of silicon, either from soils or application of silicon to the root zone
(Guevel et al., 2007; Rezende et al., 2009). The objectives of this chapter were achieved
and thus revealed that accumulation of silicon could be increased by the application of
Omex SW7 and best result could be achieved by root application compared to foliar
application. This study also indicated that accumulation of silicon stimulated the
increase in density and length of leaf hairs which might be a positive tool in the
decrease of powdery mildew infection in strawberry.

128
Chapter 5: A study of the role of a silicon wetter (Omex SW7) in the control of strawberry powdery mildew (Podosphaera aphanis) in a field trial
5.1. Introduction
Growers are under pressure from the retailers to reduce the amount of fungicides that
they use to control P. aphanis. A prediction system has been developed especially for P.
aphanis that has the potential to reduce the number of fungicide applications applied by
the growers and still give good disease control. The prediction system identified when
strawberry plants would be at greatest risk of infection by P. aphanis. This helps
growers to apply the fungicides when their crop is at greatest risk of infection by P.
aphanis. The high risk day predicted by the prediction system corresponds to the onset
of the epidemic often at the start of the exponential phase (Dodgson, 2008). An initial
set of parameters for the prediction system was developed from the literature review.
Temperature and relative humidity that favours development of P. aphanis infection
were then confirmed from field observation data (Dodgson, 2008). The prediction
system identifies when there have been 144 hours of temperature and humidity which
are in the optimum range for disease development. The development time for a fungal
infection by P. aphanis is 144 (6+138) hours of suitable conditions from spore
germination to visible symptoms. Germination of a spore requires a total of 6 hours and
further growth of the germinated spore requires a further 138 hours where the
optimum temperature is 15-25OC and relative humidity 97-100% (Dodgson, 2008). In
this study the temperature and relative humidity data that were used in the prediction
system were measured on the grower’s own weather station situated on the farm for
their use. The data from the weather station was input into the prediction system. In the
field trial reported here, the prediction system was not used to predict high risk days for
fungicide applications but was used in the results section to demonstrate that the
environmental conditions during the trial were not conducive to disease development.
A field trial experiment applies scientific method to examine intervention and
innovative ideas which come from farmers and researchers in the naturally occurring
environment. In the laboratory, researchers develop scientific method. Field trial
experiments test this scientific method in the real world and then transfer the new

129
invention to the farmers. There are many designs which can be used in the field trial
experiment. Each design has its own advantages and disadvantages. Basically, four
types of design are used in plant pathological field trials: demonstration strip design,
randomised complete block design, split plot design and factorial design. Among these
designs randomised complete block design is generally used in the field trials.
Randomization and replication (i. e. repetition) are the two major components of the
randomized complete block design. Repetition and randomization help the researcher
to determine the difference in results between treatments being real or simply due to
chance. According to Goddard (2010) each treatment needs to be replicated at least
three times. In each block of replications, each treatment is included once. Palmer
(2007) used randomised block design in a field trial experiment and found that
potassium silicate had an effect on strawberry powdery mildew. Randomised complete
block design was used in the field trial experiment by Dallagnol et al., (2012) and
showed the effect of silicon supplied in the form of potassium silicate to control the
powdery mildew infection in melon.
It has been reported that silicon reduces several diseases caused by biotrophic
pathogens in both monocotyledons and dicotyledons (Datnoff et al., 2007). Buck et al.,
(2008) reported that foliar application of potassium silicate at rates ranging from 1 to
16 g/l reduce blast incidence in rice leaves. In grape, Bowen et al., (1992) found that
feeding plants 1.7 mM silicon had no effect on the reduction of disease severity caused
by Uncinula necator whereas 17mM silicon spraying on leaves one day before
inoculation substantially reduced the development of diseases. Scanning electron
micrographs and x-ray analysis revealed that silicon deposition on the leaf surface of
grapes prevented the fungal hyphae development. Conidia of U. necator were cultured
on an agar medium and 0-17mM silicon was added to the agar medium to test whether
silicon was an inhibitor of conidia germination or germ tube development. Results
showed that the presence of silica weakly promoted conidia germination and germ tube
development. The above study showed that foliar application of silicon reduced the
fungal infection. Silicon has been shown to control a number of diseases and it is
believed that silicon creates a physical barrier which can restrict fungal hyphae
penetration (Epstein, 1994). However, the mechanism of suppression against powdery
mildews in strawberry is still not clear. Anecdotal observations suggested that a silicon

130
based wetter (Omex SW7) had a synergistic effect with potassium carbonate (described
in chapter 1) in controlling Podosphaera aphanis on strawberries. The work reported
here demonstrates this effect in the field in a commercial setting. Therefore, it has been
hypothesized that supplying silicon as a wetter would help the strawberry plants to
absorb silicon and improve resistance against the pathogen and help to find out how
silicon reduces disease development.
5.1.1. Objectives
To investigate the effect of foliar applications of silicon wetter (Omex SW7) and
potassium carbonate to limit P. aphanis infection in a field trial under polythene
tunnel at Wisbech.
To determine the uptake of silicon from silicon based wetter into strawberry
plants and the effect of absorbed silicon on the relationships between leaf hair
length and density and reduction in the severity of powdery mildew.
To determine the relationships between density of leaf hairs with germinating
ascospores and colonies.
To determine the relationships between length of leaf hairs with germinating
ascospores and colonies.
To determine the relationships between silicon level and germinating ascospores
and also colonies.
5.2. Materials and Methods
5.2.1. Sonata
Sonata is a mid season June-bearing strawberry variety. Sonata was used in the field
trial experiment. The variety Sonata was developed from a cross between Elsanta and
Polka (Meulenbroek, 2005). Elsanta was used in the glasshouse experiment and the
work reported in chapter 3 showed that spraying with the silicon wetter (Omex SW7)
onto the leaf surface does result in accumulation of silicon in the leaves. Accumulation
of silicon affects the morphology of the strawberry leaves resulting in the formation of
additional leaf hairs, which were longer than when the plants were untreated. This
effect occurred on all varieties tested (Rhapsody, Florence and Symphony) after being
treated with different concentrations of Omex SW7. It could be postulated that the effect

131
of spraying silicon would be observed in the variety Sonata which would be used in the
field trial study. Sonata was used in this field trial study because it is now a widely
grown variety by the growers. Sonata produces beautiful conically shaped strawberries
and the amount of misshaped berries is minimal. On average Sonata is more productive
than Elsanta with a more uniform fruit size and shape throughout the picking season
with significantly higher levels of class I fruit. The fruits are bright red and taste a little
sweeter and juicer than Elsanta. Sonata is more winter hardy and less prone to winter
frost. Sonata is less susceptible to powdery mildew but is susceptible to wilt
(Verticillium), crown rot (Phytophthora cactorum) and root rot (Rhizoctonia fragariae)
(Meulenbroek, 2005).
5.2.2. Experimental design of the field trial
The effect of foliar applications of silicon wetter and K50 (Potassium carbonate) to limit
strawberry powdery mildew infection was examined in a field trial in a polythene
tunnel at Wisbech on a commercial crop. Silicon was applied to strawberry plants with a
hand held spray boom. Silicon wetter (Omex SW7-Omex Agrifluids Ltd) was used as the
source of silicon. K50 (Potassium carbonate-Omex Agrifluids Ltd) is used by the
growers to reduce disease incidence (Anon, 2012h). Treatments were arranged in a
randomised block design of 3 replicates (Figure 56). Each plot was 3 metres (m) long
and separated by 1 metre guard row. The trial plot was 25 metres long and 36 metres
wide. The whole polythene tunnel was 172 metres long (Figure 55). There were a total
of 18 plots. There were five rows and treatments were applied to the alternate rows, no
treatment was applied to the guard rows. The untreated plots received no treatments
and no water was sprayed as free water alone inhibits the germination of powdery
mildews (Jhooty and McKeen, 1965; Schnathorst, 1965; Amsalem et al., 2006). All
treatments were applied to the strawberry variety Sonata. There were six treatments
and each treatment was applied weekly. The plot was sprayed weekly starting from 7
April until 11 May 2011. The spray dates, disease assessment date and leaf collection
date are shown in Table 20. In this trial 500 ml was sprayed on each plot. Product and
dilution rates used in this trial are shown in Table 21. Treatments used in this trial are
shown in Table 22.

132
Table 20: Spray and date of assessment
Table 21: Product and dilution rates
Spray date Assessment date in
field
Leaf collection for assessment
for disease and silicon level
1st spray- 7.04.11 7.04.11 7.04.11-before spray (morning)
11.04.11
2nd spray-13.04.11 14.04.11
18.04.11
3rd spray-20.04.11 21.04.11
4th spray-27.04.11 28.04.11 28.04.11
5th spray-4.05.11 5.05.11
Last spray-11.05.11 12.05.11
19.05.11 19.05.11
26.05.11
10.06.11 10.06.11
Name of the chemicals Dilution rate
1) Omex SW7 (0.25%) 2.5 ml/l
2) Omex SW7 (2.5%) 25 ml/l
3) K50 (Potassium carbonate) 10 gm/l

133
Figure 55: Plan of the trial under polythene tunnel at Wisbech field site. The trial plot was 25 m long and 36 m wide. The whole polythene tunnel was 172 m long.
36 m
172 m
Trial plot
137 m
25 m
10 m
mm
mm

134
Figure 56: Trial design. Number shows the plot number and lower case letter indicates the treatment number. Each trial plot was 3 m long and each plot was separated by 1 m guard row. In this trial there were 5 rows. Spray was applied to 3 rows and spray was not applied to the guard row.
Guard
Row
Guard
Row
3m
1
b
12
f
13
e
2
d
11
c
14
c
3
a
10
b
15
f
4
c
9
d
16
a
5
f
8
e
17
b
6
e
7
a
18
d
Plot number
Treatment
number
1m guard
row

135
Table 22: List of different treatments Treatment no Name of the treatment
a Standard (Omex SW7 at 0.25%) which contains 27.02 mg/l Si
b High (Omex SW7 at 2.5%) which contains 270.20 mg/l Si
c Standard + K50
d High + K50
e K50 (Potassium carbonate) used at field rate
f Untreated (Unt)
5.2.3. Microscopic assessment of P. aphanis from trial
Strawberry leaves were collected from the variety Sonata from the trial at Wisbech. To
identify P. aphanis symptoms 20 leaves were collected from each trial plot at each
sample date. Each set was assessed for visible P. aphanis symptoms on each assessment
date. There were 4 to 5 leaflets in each leaf in the variety Sonata. Each leaflet was then
placed in a Petri dish and submerged in 0.1% trypan blue stain (trypan blue in lactic
acid) (Waller et al., 2002). Leaflets were left to stain for 24 hours at room temperature,
after which they were washed in water and cut into 4 strips (parallel to the mid rib). Of
the 4 strips, 2 were placed on microscope slides upper surface up and 2 were placed
lower surface up (Figure 57). The slide was placed on the microscope stage and viewed
at X100 magnification (Nikon, model YS100). One transect of the leaflet strip was
viewed. The number of germinating ascospores (size, length 10-50 µm and width 8-30
µm) and the number of distinct P. aphanis colonies (mycelium was assessed as a colony)
were recorded. This was repeated for the remaining 3 strips from each leaflet. The
number of germinating ascospores and number of colonies were recorded from all the 4
or 5 leaflets from each leaf. This was repeated for the remaining leaves. Average number
of germinating ascospores and average number of colonies were calculated from 20
leaves.
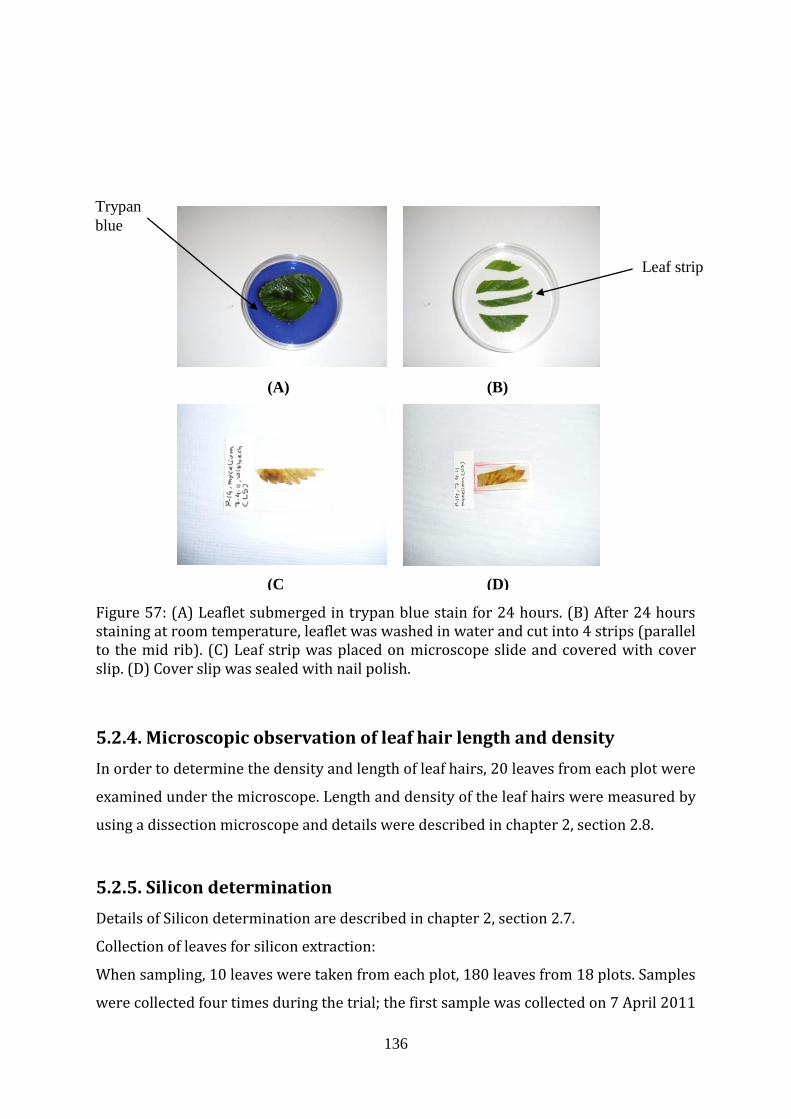
136
Figure 57: (A) Leaflet submerged in trypan blue stain for 24 hours. (B) After 24 hours staining at room temperature, leaflet was washed in water and cut into 4 strips (parallel to the mid rib). (C) Leaf strip was placed on microscope slide and covered with cover slip. (D) Cover slip was sealed with nail polish.
5.2.4. Microscopic observation of leaf hair length and density
In order to determine the density and length of leaf hairs, 20 leaves from each plot were
examined under the microscope. Length and density of the leaf hairs were measured by
using a dissection microscope and details were described in chapter 2, section 2.8.
5.2.5. Silicon determination
Details of Silicon determination are described in chapter 2, section 2.7.
Collection of leaves for silicon extraction:
When sampling, 10 leaves were taken from each plot, 180 leaves from 18 plots. Samples
were collected four times during the trial; the first sample was collected on 7 April 2011
(A)
Trypan
blue
(B)
Leaf strip
(C
)
(D)

137
before spraying started in order to measure the background level of silicon in untreated
plants throughout the trial. The second sample was collected on 28 April 2011 to
measure the effect of spray, third sample was collected on 19 May 2011 after
completing the five weeks of spray treatments to measure the effect of spray and to
analyse the level of silicon after the final spray. The last sample was collected on 10 June
2011 to measure the level of silicon one month after the final spray. Leaves were kept in
a cold room at 40C in sample bags labelled with the date of collection and the treatments
(rate, timing). Drying of the leaves, grinding of the leaves and extraction method of
silicon are described in chapter 2.
5.2.6. Data analysis
Statistical method one way ANOVA (analysis of variance) under the Compare Mean in
the SPSS version 17 was used to analyse the data, number of germinating ascospores,
and colonies, concentrations of silicon in leaves, density and length of leaf hairs after
foliar application of different concentrations of Omex SW7 and potassium carbonate.
Tukey’s HSD test was used for further post-hoc analysis and homogeneous subsets also
used here to differentiate the treatment in different groups (mentioned in section 2.9).
Pearson’s correlation and linear regression analysis were used to find the relationships
between silicon level and density and length of leaf hairs and also the relationships
between density and length of leaf hairs and disease incidence. The relationship
between silicon level and disease incidence was analysed using the correlation and
regression analysis.
5.3. Results 5.3.1. Assessment of P. aphanis in field trial
Leaves collected from different trial plots on 7 April 2011 before the trial was sprayed
showed that there were germinating ascospores and colonies on all the treated and
untreated plots. While no symptoms of powdery mildew infection were observed with
the naked eye, microscopic observation showed that there were germinating ascospores
and colonies present throughout the trial (Figure 58). When the trial was carried out the

138
temperature and relative humidity were not conducive for growth and development of
P. aphanis infection, so the symptoms were not visible in the trial, but there was still
evidence that germinating ascospores and colonies were present in 18 trial plots
(Figures 59 and 60).
A. Germinating ascospore
(X400)
B. Germinating ascospore
(X400)
C. Mycelium (X400)
Figure 58. (A) Germinating ascospore seen under the microscope (X400). (B) Another germinating ascospore seen under the microscope (X400). (C) Mycelium seen under the microscope (X400).
Results showed that there were more germinating ascospores and colonies in the leaves
collected from all trial plots on 7 April before the trial was sprayed. Though there were
no colonies visible to the naked eye, ascospores and colonies were found throughout the
trial (Figures 59 and 60). On the untreated plots there were germinating ascospores and
colonies throughout the trial. On K50 (Potassium carbonate) treated plots there were
germinating ascospores and colonies throughout the trial. However, some reduction in
germinating ascospores was found in K50 (Potassium carbonate) treated plots when
compared with untreated plots on 28 April, 19 May and 10 June. On these four silicon
and K50 (Standard, High, Standard+K50, High+K50) treated plots there were no
germinating ascospores after 28 April 2011. However colonies were present throughout
the trial on the untreated plots and there was a reduction in colony numbers in both the
treated and untreated plots over time. However the reduction in treated plots was
greater than in the untreated plots. Thereafter the number of colonies was greatly
reduced on 19 May in all plots treated with Omex SW7 with or without K50. Whilst K50
(Potassium carbonate) alone gave some reduction in the number of colonies, all
treatments with silicon gave a significant (P<0.05) reduction in colonies on 28 April, 19
May and 10 June when compared with the untreated control. Effect of silicon wetter and

139
K50 in the reduction of the number of germinating ascospores and colonies was shown
in the decreasing order high+K50>high>standard+K50>standard>K50>untreated.
Figure 59: Number of germinating ascospores on strawberry leaves (variety Sonata) from 18 trial plots. The disease was assessed on 7 April before beginning of treatment/spray and also on 28 April, 19 May and 10 June after being treated with different concentrations (standard and high) of silicon wetter (Omex SW7) with and without the use of K50 (Potassium carbonate) and control (untreated). A total of 20 leaves for each treatment were used to calculate the average number of germinating ascospores (n=20). Means (± standard error of means) followed by different letters indicate significant differences (P<0.05) between treatments as indicated by Tukey’s HSD (Post-hoc test) in the statistical software program, SPSS for windows version 17. Colonies were present on all treatments throughout the trial. There was a reduction in
the number of colonies on the untreated plot on 28 April, 19 May and 10 June. The
reduction in the number of colonies was probably due to the weather conditions (Figure
61). There was no epidemic build up in the control plots which were unexpected. The
lack of an epidemic in the period of the trial was due to the low disease pressure caused
by the particular weather conditions in 2011 as shown by the print out from the
prediction system for that year (Figure 61).
d
c
a
b
a
a
d d
b c
a
0
1
2
3
4
5
6
7
8
9
10
7.4.11 28.4.11 19.5.11 10.6.11
Ave
rage
nu
mb
er
of
germ
inat
ing
asco
spo
res
pe
r
leaf
Dates
Unt
Standard
High
K50
Standard + K50
High + K50

140
Figure 60: Number of colonies on strawberry leaves (variety Sonata) from different trial plots. The disease was assessed on 7 April before beginning of treatment/spray and also on 28 April, 19 May and 10 June after being treated with different concentrations (standard and high) of silicon wetter (Omex SW7) with and without the use of K50 (Potassium carbonate) and control (untreated). A total of 20 leaves for each treatment were used to calculate the average number of colonies (n=20). Means (± standard error of means) followed by different letters indicate significant differences (P<0.05) between treatments as indicated by Tukey’s HSD (Post-hoc test) in the statistical software program, SPSS for windows version 17.
The prediction system was used here not to predict high risk days for fungicide
application but to show that environmental conditions during the trial were not
conducive to disease development. Temperature and relative humidity affect ascospore
germination and colony development. If conditions are not suitable for germination and
colony development there will be no epidemic build up. However, if conditions are not
suitable for germination or growth of P. aphanis this does not reduce the level of
development the fungus has already achieved. Further fungal growth starts again from
the point it had reached previously when conditions are suitable. There was very low
disease pressure from 7 April to 1 June (trial period) where the prediction system
(denoted by green to red lines) shows that it took 54 days to accumulate 144 hours of
disease conducive conditions (temperature 15-25OC and relative humidity 97-100%)
(Figure 61). However, from 1 June to 16 June where the prediction system shows that it
took only 16 days to accumulate 144 hours of disease conducive conditions.
i i
ab c
g
d
a
h f f
ab
f
c
a
i
e
b
0 1 2 3 4 5 6 7 8 9
10 11 12 13 14 15
7.4.11 28.4.11 19.5.11 10.6.11
Ave
rage
nu
mb
er
of
colo
nie
s p
er
leaf
Dates
Unt Standard High K50 Standard + K50 High + K50

141
Temperature and relative humidity data showed that the environmental conditions
were not conducive to P. aphanis development during the first 5 weeks of the trial so no
visible epidemic occurred in the untreated plots. However the trial does demonstrate
the effect of silicon in reducing both ascospore development and colony growth.
Figure 61: Disease development predictions for Wisbech, 2011. The green lines are accumulated hours with both above 200C and 95% relative humidity. The yellow/red is the warning period (action threshold) for the growers, showing the need to spray. As soon as the crop is sprayed, the prediction system is reset to zero and the accumulated hours calculation is restarted.
5.3.2. Effect of silicon on the density of leaf hairs
This experiment aimed to investigate whether the silicon supplements had any effect on
the number of leaf hairs. Interestingly, microscopic observations of leaves which were
collected on 28 April 2011 after being treated with silicon wetter and K50 (Potassium
carbonate) showed that there were increased number of leaf hairs on both the upper
and lower surfaces of leaves (Figure 62). It was also found that there was a significant
difference in number of leaf hairs in different treatment groups. On the upper surface of
leaves there was no significant (P>0.05) difference in leaf hair numbers between control
and K50 (Potassium carbonate) treated leaves. However, Omex SW7 treated leaves
showed significantly (P<0.05) higher leaf hair numbers compared to control and K50
(Potassium carbonate) treated leaves (Figure 62). Moreover, high Omex SW7 treated

142
leaves showed significantly (P<0.05) higher leaf hair numbers compared to standard
Omex SW7 treated leaves (Figure 62).
Figure 62: Number of leaf hairs on both the upper and lower surfaces of the strawberry leaves (variety Sonata) collected from different trial plots. Leaves were collected on 28 April 2011, after being treated with different concentrations (standard and high) of silicon wetter (Omex SW7) with and without the use of K50 (Potassium carbonate) and control (untreated). A total of 20 leaves for each treatment were used to measure the average number of leaf hairs per cm2 (n=20). Means (± standard error of means) followed by different letters indicate significant differences (P<0.05) between treatments as indicated by Tukey’s HSD (Post-hoc test) in the statistical software program, SPSS for windows version 17.
It was observed that the foliar application of silicon on strawberry leaves increased the
number of leaf hairs on the lower surface (Figure 62). There was no significant (P>0.05)
difference in leaf hair numbers between control and K50 (Potassium carbonate) treated
leaves (Figure 62). However, the number of leaf hairs on the lower surface was
significantly different in standard and high Omex SW7 treated leaves compared to
control and K50 (Potassium carbonate) treated leaves (Figure 62). Moreover, the
highest level of Omex SW7 treated leaves showed significantly higher (P<0.05) leaf hair
numbers compared to all other treatment groups (Figure 62). Results also showed that
the leaf hair numbers were not increased in K50 (Potassium carbonate) treated leaves
but when K50 (Potassium carbonate) was mixed with Omex SW7 an increase in the
number of leaf hairs on both the surfaces was observed.
a a
b
a
b
d c
e
g
c
f
h
0
10
20
30
40
50
60
70
80
90
100
Untreated Standard High K50 Standard +K50
High +K50
Ave
rage
nu
mb
er
of
hai
rs p
er
cm2
Treatments
Upper surface
Lower surface

143
5.3.3. Relationship between the leaf hair numbers and the number of germinating ascospores The above results showed that application of standard and high concentrations of
Omex SW7 and standard and high concentrations of Omex SW7 mixed with K50
increased the number of leaf hairs on both the upper and lower surfaces of leaves
(Figure 62). Leaves collected on 28 April 2011 showed that standard and high
concentrations of Omex SW7 and standard and high concentrations of Omex SW7 mixed
with K50 decreased the number of germinating ascospores (Figure 59). The results
from the leaves collected on 28 April 2011 were used to find a relationship between the
number of leaf hairs and the number of germinating ascospores. The results from the
leaves collected on 19 May and 10 June were not used to find the relationship because
no ascospores were observed on the leaves collected on 19 May and 10 June 2011
(Figure 59). The Pearson’s correlation was used to find a correlation. It was observed
that there was a significant (P<0.01) negative correlation between increased number of
leaf hairs on both the upper and lower surfaces of leaves and decreased number of
germinating acospores. The correlation coefficients (r) were -0.972 and -0.995 for the
upper and lower surfaces of leaves respectively. The negative r value means that there
was a negative relationship between the number of leaf hairs and the number of
germinating ascospores.
A. Upper surface B. Lower surface
Figure 63(A-B): Relationship between the number of leaf hairs and the number of germinating ascospores on both the upper (A) and lower (B) surfaces of leaves (variety Sonata). Leaves were collected on 28 April 2011, after being treated with different concentrations (standard and high) of Omex SW7 with and without the use of K50 (Potassium carbonate) and untreated (control).
y = -0.1531x + 5.32 R² = 0.9444
0
1
2
3
4
5
6
0 10 20 30 40
Ave
rage
nu
mb
er
of
germ
inat
ing
asco
po
res
pe
r le
af
Average number of hairs per cm2
y = -0.0683x + 6.6229 R² = 0.9903
0
1
2
3
4
5
6
0 20 40 60 80 100
Ave
rage
nu
mb
er
of
germ
inat
ing
asco
spo
res
pe
r le
af
Average number of hairs per cm2

144
This means that the increased number of leaf hairs is correlated with the decreased
number of germinating ascospores on both the upper and lower surfaces of leaves.
Regression analysis also showed a negative relationship between the number of leaf
hairs and the number of germinating ascospores on both the upper and lower surfaces
of leaves (Figures 63A and B).
5.3.4. Relationship between the leaf hair numbers and the number of colonies The results from the leaves collected on 28 April 2011 were used to find a relationship
between the number of leaf hairs and the number of colonies. The results from the
leaves collected on 19 May and 10 June were not used to find the relationship because
very few colonies were observed on the leaves collected on those days (Figure 60). A
significant (P<0.01) negative correlation was observed between increased number of
leaf hairs on both the upper and lower surfaces of leaves and decreased number of
colonies. The correlation coefficients (r) were -0.950 and -0.927 for the upper and lower
surfaces of leaves respectively. The negative r value means that there was a negative
relationship between the number of leaf hairs and the number of colonies.
A. Upper surface B. Lower surface Figure 64(A-B): Relationship between the number of leaf hairs and the number of colonies on both the upper (A) and lower (B) surfaces of leaves (variety Sonata). Leaves were collected on 28 April 2011, after being treated with different concentrations (standard and high) of Omex SW7 with and without the use of K50 (Potassium carbonate) and untreated (control).
y = -0.2023x + 9.99 R² = 0.9013
0
2
4
6
8
10
12
0 20 40
Ave
rage
nu
mb
er
of
colo
nie
s p
er
leaf
Average number of hairs per cm2
y = -0.0842x + 11.39 R² = 0.866
0
2
4
6
8
10
12
0 20 40 60 80 100
Ave
rage
nu
mb
er
of
colo
nie
s p
er
leaf
Average number of hairs per cm2

145
Significant negative correlation indicated the possibility that the increased number of
leaf hairs is correlated with the decreased number of colonies on both the upper and
lower surfaces of leaves. Regression analysis also showed a negative relationship
between the number of leaf hairs and the number of colonies on both the upper and
lower surfaces of leaves (Figures 64A and B).
5.3.5. Effect of silicon on the length of leaf hairs
This study examined whether the silicon supplement had any effect on the length of leaf
hairs. It was observed that the foliar application of silicon (Omex SW7) had an effect on
the length of leaf hairs on both the upper and lower surface of leaves (Figure 65). On the
upper surface, application of different silicon concentrations showed significantly
(P<0.05) longer leaf hair length compared to control and K50 (Potassium carbonate)
treated leaves, whereas there was no significant (P>0.05) difference in length of leaf
hairs between control and K50 (Potassium carbonate) treatment (Figure 65). The
length of leaf hairs in high silicon (Omex SW7) treated leaves was significantly (P<0.05)
longer compared to that in standard Omex SW7 treated leaves (Figure 65).
It was observed that the foliar application of silicon (Omex SW7) on strawberry leaves
increased leaf hair length on the lower surface (Figure 65). There was no significant
(P>0.05) difference in leaf hair length between control and K50 (Potassium carbonate)
treated leaves (Figure 65). However, the length of leaf hairs on the lower surface was
significantly different in standard and high Omex SW7 treated leaves compared to
control and K50 (Potassium carbonate) treated leaves (Figure 65). Moreover, the
highest level of Omex SW7 treated leaves showed significantly (P<0.05) longer leaf hair
length compared to all other treatment groups (Figure 65). Results also showed that
leaf hair length was not increased in K50 (Potassium carbonate) treated leaves but
when K50 (Potassium carbonate) was mixed with Omex SW7 an increase in the length
of leaf hairs on both the surfaces was observed.

146
Figure 65: Length of leaf hairs on both the upper and lower surfaces of the strawberry leaves (variety Sonata). Leaves were collected on 28 April 2011, after being treated with different concentrations (standard and high) of silicon wetter (Omex SW7) with and without the use of K50 (Potassium carbonate) and control (untreated). A total of 20 leaves for each treatment were used to measure the average length of leaf hairs (n=20). Means (± standard error of means) followed by different letters indicate significant differences (P<0.05) between treatments as indicated by Tukey’s HSD (Post-hoc test) in the statistical software program, SPSS for windows version 17.
5.3.6. Relationship between the length of leaf hairs and the number of germinating ascospores The results from the leaves collected on 28 April 2011 were used to find a relationship
between the length of leaf hairs and the number of germinating ascospores. The results
from the leaves collected on 19 May and 10 June were not used to find the relationship
which was mentioned in section 5.3.3. Correlation analysis showed that there was a
relationship between the length of leaf hairs and the number of germinating ascospores
on both the upper and lower surfaces of leaves. A significant (P<0.01) negative
correlation was observed between the length of leaf hairs and the number of
germinating ascospores. The negative correlation coefficients (r) were -0.995 and -
0.988 for both the upper and lower surfaces of leaves which indicated the possibility
that the increased length of leaf hairs is correlated with the decreased number of
germinating ascospores. Regression analysis also showed a negative relationship
between the length of leaf hairs and the number of germinating ascospores on both the
upper and lower surfaces of leaves (Figures 66A and B).
a
b
d
a
c
e
b
c
e
b
d
f
0
0.5
1
1.5
2
2.5
3
Untreated Standard High K50 Standard +K50 High +K50
Len
gth
(m
ean
) o
f le
af h
airs
in m
m
Treatments
Upper surface Lower surface

147
A. Upper surface B. Lower surface
Figure 66(A-B): Relationship between the length of leaf hairs and the number of germinating ascospores on both the upper (A) and lower (B) surfaces of leaves (variety Sonata). Leaves were collected on 28 April 2011, after being treated with different concentrations (standard and high) of Omex SW7 with and without the use of K50 (Potassium carbonate) and untreated (control).
5.3.7. Relationship between the length of leaf hairs and the number of colonies
To find a relationship, Pearson’s correlation was used and results from the leaves
collected on 28 April 2011 were also used. Correlation analysis showed that there was a
relationship between the length of leaf hairs and the number of colonies on both the
upper and lower surfaces of leaves. The negative correlation coefficient values (r) were
-0.925 and -0.909 for both the upper and lower surfaces of leaves which indicated the
possibility that the increased length of leaf hairs is correlated with the decreased
number of colonies. A significant (P<0.01) negative correlation was observed between
colonies and length of leaf hairs for the upper surface of leaves. For the lower surface of
leaves significant (P<0.05) negative correlation between colonies and length of leaf
hairs was observed at the 5% level. Regression analysis also showed a negative
relationship between the length of leaf hairs and the number of colonies on both the
upper and lower surfaces of leaves (Figures 67A and B)
y = -2.7738x + 6.8001 R² = 0.9904
0
1
2
3
4
5
6
0 1 2 3
Ave
rage
nu
mb
er
of
germ
inat
ing
asco
spo
res
pe
r le
af
Average length of leaf hairs in mm
y = -2.742x + 7.6205 R² = 0.9754
0
1
2
3
4
5
6
0 1 2 3
Ave
rage
nu
mb
er
of
germ
inat
ing
asco
spo
res
pe
r le
af
Average length of leaf hairs in mm

148
A. Upper surface B. Lower surface
Figure 67(A-B): Relationship between the length of leaf hairs and the number of colonies on both the upper (A) and lower (B) surfaces of leaves (variety Sonata). Leaves were collected on 28 April 2011, after being treated with different concentrations (standard and high) of Omex SW7 with and without the use of K50 (Potassium carbonate) and untreated (control).
5.3.8. Concentrations of silicon in leaves collected from trial plot Leaves collected on 7 April before the first spray and also on 28 April, 19 May and 10
June from strawberry plants showed different levels of silicon concentrations (Figure
68). Results showed that silicon concentrations in the leaves collected on 7 April (before
spray) were the same in all the plots. Concentrations of silicon in the leaves collected on
7 April showed the background level of silicon in all trial (18) plots. It was observed that
there was a significant difference in silicon concentrations between different
treatments. Strawberry leaves collected from standard, high, standard+K50, high+K50
treated plants showed significantly (P<0.05) higher silicon concentrations compared to
that in leaves collected from control and K50 (Potassium carbonate) treated plants.
However, there was no significant difference (P>0.05) of silicon concentrations in leaves
collected from control and K50 (Potassium carbonate) treated plants. The silicon
concentration in leaves collected from the high Omex SW7 treated plants showed
significantly higher (P<0.05) concentrations compared to control, K50 (Potassium
carbonate) treated and the standard Omex SW7 treated plants (Figure 68).
y = -3.4107x + 11.596 R² = 0.8556
0
2
4
6
8
10
12
0 1 2 3
Ave
rage
nu
mb
er
of
colo
nie
s p
er
leaf
Average length of leaf hairs in mm
y = -3.337x + 12.551 R² = 0.8255
0
2
4
6
8
10
12
0 1 2 3
Ave
rage
nu
mb
er
of
colo
nie
s p
er
leaf
Average length of leaf hairs in mm

149
Figure 68: Concentrations of silicon in the strawberry leaves (variety Sonata). Strawberry plants were treated with different concentrations (standard and high) of silicon wetter (Omex SW7) with and without the use of K50 (Potassium carbonate) and control (untreated). Leaves were collected on 7 April before beginning of treatment/spray and also on 28 April, 19 May and 10 June. Each value represents the mean of 6 replications (n=6). Means (± standard error of means) followed by different letters indicate significant differences (P<0.05) between treatments as indicated by Tukey’s HSD (Post-hoc test) in the statistical software program, SPSS for windows version 17.
However concentrations of silicon were significantly different on the leaves collected on
28 April in different treated plots after the weekly application of different
concentrations of silicon and K50 (Potassium carbonate). There was no significant
difference found in silicon concentrations in the leaves collected from untreated and
K50 (Potassium carbonate) treated plots. On 28 April there were significant differences
observed in standard, high, standard+K50, high+K50 treated plots. Weekly spraying
ceased on 11 May and the silicon level was maintained at the same level until 10 June
(Figure 68). This demonstrates that the silicon is absorbed into plant cell structures and
not lost from the plant in the four weeks since the last application of silicon to the
leaves. This result indicated that after foliar application of Omex SW7, silicon is
absorbed through the cuticle and is available for plant development for at least one
month.
a a a a a a a
b
e
a
c
f
a
d
g
a
e
h
a
d
g
a
e
h
0
500
1000
1500
2000
2500
3000
3500
4000
4500
5000
Unt Standard High K50 Standard+K50 High+K50
Co
nce
ntr
atio
ns
of
silic
on
(m
g/kg
)
Treatments
7.4.11 28.4.11 19.5.11 10.6.11

150
5.3.9. Relationship between concentrations of silicon and the number of germinating ascospores The above results showed that application of standard and high concentrations of Omex
SW7 and standard and high concentrations of Omex SW7 mixed with K50 increased the
concentrations of silicon in the strawberry leaves. The results also showed that
standard and high concentrations of Omex SW7 and standard and high concentrations
of Omex SW7 mixed with K50 decreased the number of germinating ascospores. The
results from the leaves collected on 28 April were used to find the relationship and were
also used to find the other relationship described in this chapter. It was observed that
there was a significant (P<0.01) negative correlation between increased levels of silicon
and decreased number of germinating ascospores.
Figure 69: Relationship between concentrations of silicon and the number of germinating ascospores. Leaves were collected on 28 April 2011, after being treated with different concentrations (standard and high) of Omex SW7 with and without the use of K50 (Potassium carbonate) and untreated (control).
The correlation coefficient (r) was -0.991. The negative r value means that the increased
levels of silicon is correlated with the decreased number of germinating ascospores.
Regression analysis also showed a negative relationship between increased levels of
silicon and decreased number of germinating ascospores (Figure 69).
y = -0.0036x + 9.6083 R² = 0.983
0
1
2
3
4
5
6
500 1000 1500 2000 2500
Ave
rage
nu
mb
er
of
germ
inat
ing
asco
spo
res
pe
r le
af
Concentrations of silicon (mg/kg)

151
5.3.10. Relationship between concentrations of silicon and the number of colonies Correlation analysis showed that there was a significant (P<0.05) negative correlation
between increased levels of silicon and decreased number of colonies. The correlation
coefficient (r) was -0.894. The negative r value means that the increased levels of silicon
is correlated with the decreased number of colonies. Regression analysis also showed a
negative relationship between increased levels of silicon and decreased number of
colonies (Figure 70).
Figure 70: Relationship between concentrations of silicon and the number of colonies. Leaves were collected on 28 April 2011, after being treated with different concentrations (standard and high) of Omex SW7 with and without the use of K50 (Potassium carbonate) and untreated (control).
5.3.11. Relationship between number of leaf hairs and concentrations of silicon The above results showed that application of standard and high concentrations of Omex
SW7 and standard and high concentrations of Omex SW7 mixed with K50 increased
concentrations as well as increased the number of leaf hairs on both the upper and
lower surfaces of leaves. A significant (P<0.01) positive correlation was observed
y = -0.0043x + 14.81 R² = 0.7993
0
2
4
6
8
10
12
0 500 1000 1500 2000 2500
Ave
rage
nu
mb
er
of
colo
nie
s p
er
leaf
Concentrations of silicon (mg/kg)
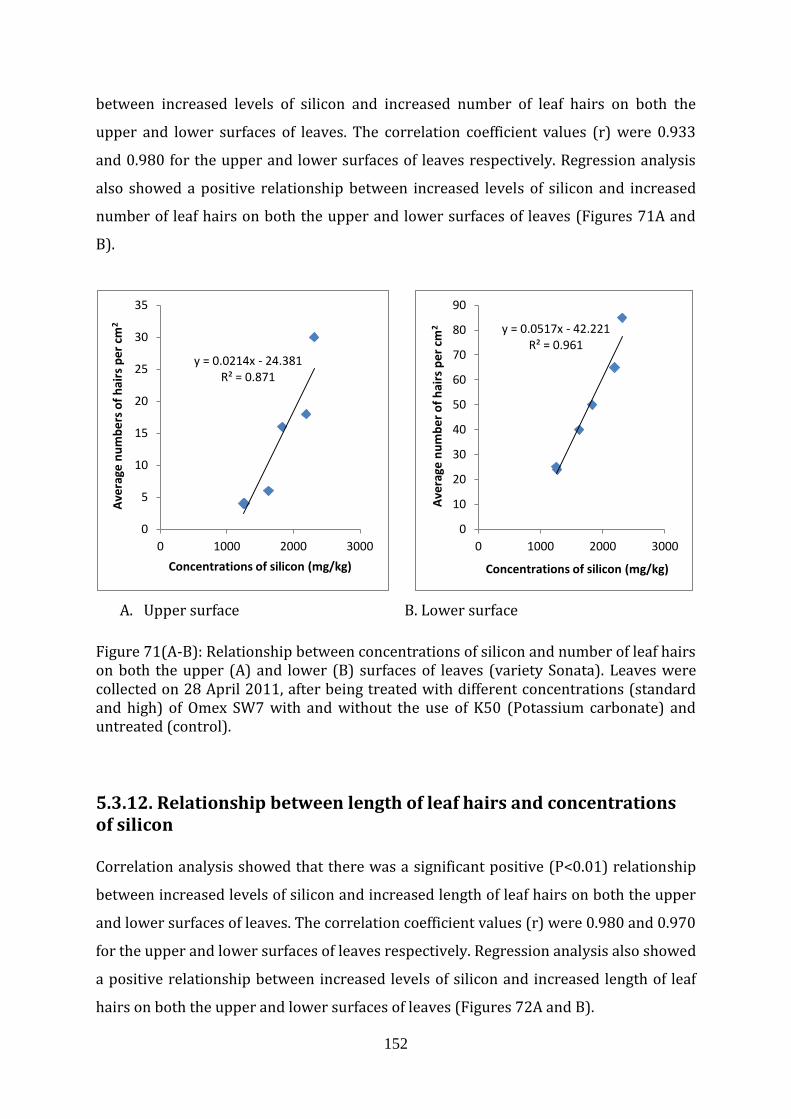
152
between increased levels of silicon and increased number of leaf hairs on both the
upper and lower surfaces of leaves. The correlation coefficient values (r) were 0.933
and 0.980 for the upper and lower surfaces of leaves respectively. Regression analysis
also showed a positive relationship between increased levels of silicon and increased
number of leaf hairs on both the upper and lower surfaces of leaves (Figures 71A and
B).
A. Upper surface B. Lower surface
Figure 71(A-B): Relationship between concentrations of silicon and number of leaf hairs on both the upper (A) and lower (B) surfaces of leaves (variety Sonata). Leaves were collected on 28 April 2011, after being treated with different concentrations (standard and high) of Omex SW7 with and without the use of K50 (Potassium carbonate) and untreated (control).
5.3.12. Relationship between length of leaf hairs and concentrations of silicon Correlation analysis showed that there was a significant positive (P<0.01) relationship
between increased levels of silicon and increased length of leaf hairs on both the upper
and lower surfaces of leaves. The correlation coefficient values (r) were 0.980 and 0.970
for the upper and lower surfaces of leaves respectively. Regression analysis also showed
a positive relationship between increased levels of silicon and increased length of leaf
hairs on both the upper and lower surfaces of leaves (Figures 72A and B).
y = 0.0214x - 24.381 R² = 0.871
0
5
10
15
20
25
30
35
0 1000 2000 3000
Ave
rage
nu
mb
ers
of
hai
rs p
er
cm2
Concentrations of silicon (mg/kg)
y = 0.0517x - 42.221 R² = 0.961
0
10
20
30
40
50
60
70
80
90
0 1000 2000 3000
Ave
rage
nu
mb
er
of
hai
rs p
er
cm2
Concentrations of silicon (mg/kg)

153
A. Upper surface B. Lower surface
Figure 72(A-B): Relationship between concentrations of silicon and length of leaf hairs on both the upper (A) and lower (B) surfaces of leaves (variety Sonata). Leaves were collected on 28 April 2011, after being treated with different concentrations (standard and high) of Omex SW7 with and without the use of K50 (Potassium carbonate) and untreated (control).
5.4. Discussion
The results showed that standard and high concentrations of silicon (Omex SW7)
significantly (P<0.05) reduced the number of germinating ascospores and colonies
compared with the untreated. Moreover, standard and high concentrations of silicon
(Omex SW7) mixed with K50 gave the greatest reduction in disease compared with the
untreated. On 7 April before the start of the spray there were germinating ascospores
and colonies on all the trial plots. No germinating ascospores were observed after 28
April on silicon (Omex SW7) and potassium carbonate (standard, high, standard+K50,
high+K50) treated plots whilst colonies were present throughout the trial. There was a
significant reduction in the number of colonies observed after 28 April on silicon (Omex
SW7) and potassium carbonate (standard, high, standard+K50, high+K50) treated plots
compared with the untreated plots. There are different hypotheses regarding the role of
silicon in inhibition of fungal pathogens. According to the mechanical barrier theory,
y = 0.0013x - 0.975 R² = 0.96
0
0.5
1
1.5
2
2.5
0 1000 2000 3000
Ave
rage
len
gth
of
leaf
hai
rs in
mm
Concentrations of silicon (mg/kg)
y = 0.0013x - 0.6473 R² = 0.941
0
0.5
1
1.5
2
2.5
3
0 1000 2000 3000
Ave
rage
len
gth
of
leaf
hai
rs in
mm
Concentrations of silicon (mg/kg)

154
application of silicon accumulates in the epidermal cell wall (Epstein, 1994). The silicon
deposition in the cell wall acts as a barrier against fungal germ tube penetration in the
epidermis (Epstein, 1994). Bowen et al., (1992) reported that the thick potassium
silicate deposits that coated a significant portion of the grape leaf cuticle prevented the
penetration by germinating ascospores of Uncinula necator. Fungal development was
more extensive in the areas of the leaf surface that had not been coated. Bowen et al.,
(1992) suggested that foliar application of silicon gave a satisfactory disease control
probably through a physical barrier of silicon deposited on leaf surfaces. Menzies et al.,
(1992) showed that foliar applications of silicon (Potassium silicate) to cucumber,
muskmelon and zucchini squash reduced the number of colonies of Podosphaera xanthii
and as a consequence severity of powdery mildew decreased. From this explanation it
might be stated that the reduction in the number of germinating ascospores and
colonies by silicon (Omex SW7) sprays might be partly due to a physical barrier to
hyphal penetration and the deposition of silicon within the leaf at fungal penetration
sites.
The results showed that there were germinating ascospores and colonies on the leaves
collected from all the trial plots on 7 April before spraying. Although there were no
colonies visible to the naked eye, microscopic observation showed that germinating
ascospores and colonies were present throughout the trial. This means that ascospores
and colonies were present in the tunnels before the trial started. Ascospores germinate
in the spring after conducive conditions developed in the tunnel and whilst the plants
were covered with fleece and mulch. After germination, mycelium developed. The
mycelium of the fungus then grew in a thin layer on the surface of the leaf and formed a
colony. The above explanation showed that colonies developed from ascospores.
However the results indicated that there were more colonies than ascospores.
According to Glawe (2008) ascospores germinate and initiate an epidemic in the spring
following the growing season during which they were formed. The trial was started on 7
April 2011 and the field used in the trial was a second year crop. Chasmothecia which
contained ascospores had overwintered in the tunnel and according to Glawe (2008)
ascospores germinate in the spring (March) which was before the trial started. The use
of fleece before the trial had allowed a high temperature and humidity to develop and so
acospores were released and ascospores germinated. In this trial, ascospores would

155
have been released and started to germinate whilst the plants were covered with fleece.
For this reason more colonies than germinating ascospores were observed in the trial.
When the trial was conducted the temperature and relative humidity were not
conducive for disease development therefore no epidemic built up on the untreated
plots where no treatments and no water were sprayed at all (mentioned in section
5.2.2). Water was not used as a control; as several studies have reported that although
high moisture levels favour strawberry powdery mildew development, free water
(moisture) is inhibitory to powdery mildews (Jhooty and McKeen, 1965; Schnathorst,
1965; Amsalem et al., 2006). Results showed that there was a reduction in the number
of germinating ascospores and colonies on all the treated and untreated plots after 7
April. The reduction in the number of germinating ascospores and colonies on the
treated plots was greater than the untreated plots. The reduction in the number of
germinating ascospores and colonies observed on the untreated plots on 28 April was
unexpected. The reduction in the number of germinating ascospores and colonies on the
untreated plots on 28 April was very small compared to 7 April. However there was no
further reduction of germinating ascospores and colonies on 19 May and 10 June on the
untreated plots. No significant reduction in the number of germinating ascospores and
colonies was observed on the untreated plots on 28 April, 19 May and 10 June. The
number of germinating ascospores and colonies gradually decreased on the treated
plots on 28 April, 19 May and 10 June and no germinating ascospores were observed
after 28 April on silicon (Omex SW7) and K50 treated plots. Therefore it might be stated
that the reduction in the number of germinating ascospores and colonies on the
untreated plots was probably due to the weather conditions (Figure 61). In addition due
to the weather conditions there was no real increase in disease during the experimental
period in all the treated and untreated plots, because the colonies formed did not
mature to produce the conidiospores which give epidemic build up. The study of Glawe
(2008) demonstrated that temperature and relative humidity affect ascospore
germination and colony development. During the experimental period weather
conditions (temperature and relative humidity) were not conducive for disease
development. Therefore no epidemic was observed and the small number of ascospore
germinated and the colonies formed were observed by dissection microscope.

156
Microscopic observations of silicon treated leaves showed that there was increased
density of leaf hairs on both the upper and lower surfaces (Figure 62) and increased
length of leaf hairs on both the upper and lower surfaces compared with the leaves
collected from the untreated plots (Figure 65). However increased density and length of
leaf hairs were not found in the leaves collected from the plots treated with K50
(Potassium carbonate). Moreover it was also found that leaves collected from silicon
(Omex SW7) and K50 (Potassium carbonate) treated plots had an effect on density and
length of leaf hairs. In this study it was found that application of silicon increased the
number and length of leaf hairs. Results also indicated that the number of germinating
ascospores and colonies also decreased when silicon (Omex SW7) was applied to the
different trial plots. These findings support the hypothesis that the silicon from the
silicon wetter is absorbed by the plant and changes the physical properties of the leaves,
including number and length of leaf hairs and in this way helps the plants to reduce
fungal infection. This is supported by the work of Kanto et al., (2004) and showed that
silicon was absorbed by strawberry plants and improved the physical properties of the
strawberry leaves, such as increased the hardness of the strawberry leaves. In another
study, Kanto et al., (2007) showed that silicon was absorbed by strawberry plants which
led to physiological changes in the strawberry leaves. As a result of these physiological
changes, Kanto et al., (2007) reported that germination and appressoria formation of
powdery mildew conidia were inhibited. Samuels et al., (1991) revealed that when a
silicon supplement (Potassium silicate) was added to hydroponic solution used for
growing cucumber, high silicon concentrations were found at the basal cells
surrounding the trichomes. They (Samuels et al., 1991) described that fungal colonies
were smaller in silicate treated leaves in comparison with the control. The findings of
Samuels et al., (1991) indicated that silicon supplement was absorbed by the plants,
changed the physical properties of the leaves, including the trichomes and in this way
helped the cucumber plants to reduce fungal infection. The discrepancy between the
studies of Samuels et al., (1991) and Kanto et al., (2007) and the work reported in
chapter 5 is that in this study silicon wetter (Omex SW7) was applied on leaves,
whereas in the above studies (Samuels et al., 1991; Kanto et al., 2007) silicon
(Potassium silicate) was applied in the hydroponic solution. However, the studies
referred to above (Samuels et al., 1991; Kanto et al., 2007) and the results in this
chapter (5) showed that silicon had an influence on changing the physical properties of

157
the leaves which play an important role in plant resistance against pathogens. The
results in chapter 5 do not demonstrate the direct inhibitory effects of increased leaf
hair numbers and length against the strawberry powdery mildew infection which will
be resolved by further investigations.
Trichomes and bristles, generally known as hairs play an important role against the
pathogen attack to prevent mycelia penetration and infection (Bonos et al., 2004).
Bonos et al., (2004) found that a resistant variety of creeping bentgrass had 42 to 64%
larger trichomes than a susceptible variety. For this reason they stated that large
trichomes work as a physical hindrance to the pathogen infecting the host. Shaik (1985)
explained that larger trichomes work as a structural defence in bean rust. He also
described that the presence of long, straight trichomes on the adaxial surfaces of bean
leaves helps to reduce the intensity of disease. The results described in chapter 5
indicated that application of silicon (Omex SW7) increased the number and length of
leaf hairs. Strawberry powdery mildew symptoms first appeared on the lower surface of
leaves and in general the number of leaf hairs is more on the lower surface in
comparison with upper surface of leaves which had already been observed in different
strawberry varieties. In strawberries, density and length of leaf hairs varies between
varieties. However the natural high density and length of leaf hairs on the lower surface
is not sufficient to limit the strawberry powdery mildew. Treatment with silicon (Omex
SW7) stimulated the production of leaf hairs and increases their density and length
which does result in disease reduction. Significant negative correlation was observed
between the number of leaf hairs on the lower surface of leaves and the number of
germinating ascospores (Figure 63B). Significant negative correlation was also
observed between the number of leaf hairs on the lower surface of leaves and the
number of colonies (Figure 64B). These relationships emphasize the possibility that an
increased number of leaf hairs on the lower surface helps to reduce the number of
germinating ascospores and colonies which leads to disease reduction. Kortecamp and
Zyprian (1999) observed that the high density of hairs on the leaves of grapes (variety,
Vitis labrusca) inhibit colonization of the leaf cuticle by Plasmopara viticola. Kortecamp
and Zyprian (1999) mentioned that the leaf hairs of Vitis labrusca were arranged very
closely and completely covered the leaf surface. Kortecamp and Zyprian (1999) showed
that leaf hairs prevent a successful penetration of the host by the fungal germ tube. The

158
study of Kortecamp and Zyprian (1999) and the study of Shaik (1985) showed that
although rust and downy mildew pathogen enters the plant through stomata, leaf hairs
inhibit fungal disease by physically inhibiting fungal germ tube penetration into the
stomata. However, P. aphanis enters the plant by direct penetration and not through
stomata. In addition, Shaik (1985) stated that leaf hairs could limit infection in the
following manner. Leaf hairs may distract a germ tube and in some instances the germ
tube twined from one hair to another like wire without touching the leaf surface. This
could be a mechanism by which the stimulation in leaf hair density and length causes
the reduction in disease development in P. aphanis. From the above explanation, it can
be stated that leaf surface characteristics, such as leaf hair numbers and length also
have an influence on pathogen infection.
The results showed that concentrations of silicon were significantly higher in the leaves
collected from standard and high concentrations of Omex SW7 treated plots than the
untreated plots (Figure 68). Leaves collected on 28 April and 19 May showed that
weekly application of standard and high concentrations of Omex SW7 significantly
increased the silicon concentrations in the strawberry leaves. Though strawberry is a
silicon non-accumulator plant, the results in chapter 3 showed that foliar application of
Omex SW7 increased silicon concentrations in the strawberry leaves in the variety
Elsanta, and the other three varieties which were observed in the glasshouse
experiment. The results in chapter 5 showed that foliar applications of Omex SW7
increased silicon concentrations in the leaves of strawberry variety Sonata which was
observed in the field trial experiment. Results in chapter 5 also stated that weekly
spraying ceased on 11 May and that concentrations of silicon were the same in the
leaves collected on 19 May and also on 10 June. This result indicated that after foliar
application, silicon is absorbed through the cuticle and is deposited in the epidermal cell
and available for plant development for at least one month. The information in the
literature indicated that after foliar application silicon accumulates in leaves and it
accumulates especially below and above the cuticle of leaves (Epstein, 1994). However,
silicon uptake and accumulation depends on plant species. Monocotyledon plants take
up more silicon than dicotyledon plants. However, the exact mechanism of uptake and
accumulation and how long the accumulated silicon is available for plant growth and
development is not clear and remains to be determined.

159
Correlation analysis showed that there was a negative relationship between
concentrations of silicon and the number of germinating ascospores (Figure 69). A
negative relationship was also observed between concentrations of silicon and the
number of colonies (Figure 70). These relationships showed that increased
concentrations of silicon are correlated with the decreased number of germinating
ascospores and colonies. Suppressive effects of silicon against plant pathogens
especially for blast and brown spot of rice have been known for a long time (Datnoff and
Rodrigues, 2005). Belanger et al., (2003) reported a suppressive effect of silicon and its
mode of action against powdery mildew on wheat (a silicon accumulator). Miyake and
Takahashi (1983) examined the suppressive effect of silicon against Fusarium wilt of
cucumber (a silicon non-accumulator) and reported that both potassium silicate and
calcium silicate alone suppressed Fusarium wilt of cucumber for 3 years. However there
was little relationship between the amount of applied silicon and the suppressive effect
against cucumber wilt. They showed that potassium silicate was more effective than
calcium silicate against Fusarium wilt of cucumber. Kanto et al., (2006) examined the
suppressive effect of solid potassium silicate and calcium silicate against strawberry
powdery mildew. They (Kanto et al., 2006) observed that solid potassium silicate and
calcium silicate was not effective against strawberry powdery mildew. Therefore, they
stated that solid potassium silicate cannot be absorbed by strawberry to any great
extent. However, in another study Kanto et al., (2004) used liquid potassium silicate and
examined the suppressive effect of liquid potassium silicate against strawberry
powdery mildew. They (Kanto et al., 2004) observed that little mildew developed in the
plots treated with low concentrations of silicon and no powdery mildew developed in
the plots treated with high concentrations of silicon. They also observed that
suppressive effect lasted for about 4 months and even longer on leaves. They also
observed a relationship between increased silicon content and decreased plant
diseases. The results in the chapter 5 showed that a silicon based wetter Omex SW7
significantly reduced the number of germinating ascospores and colonies. Correlation
analysis showed that increased silicon concentrations are correlated with decreased
plant diseases which were also observed by Kanto et al., (2004). Kanto et al., (2004)
used liquid potassium silicate and showed the suppressive effect against powdery
mildew of strawberries; Menzies et al., (1992) used potassium silicate and showed the

160
suppressive effect against cucumber powdery mildew. The above studies (Menzies et
al., 1992; Kanto et al., 2004) used potassium silicate as a silicon source, however in this
study (chapter 5) Omex SW7 (a liquid form of silicon) was used as a silicon source and
the results confirmed for the first time that silicon wetter (Omex SW7) had an effect on
the reduction of disease incidence.
The objectives of this study (Chapter 5) have been achieved and show that though
strawberry is classified as a silicon non-accumulator plant (Miyake and Takahashi,
1986) application of silicon based wetter Omex SW7 onto the leaf surface does result in
accumulation of silicon in the leaves. The application of Omex SW7 has stimulated an
increase in the number and length of leaf hairs in strawberry plants. Furthermore, the
applications of the silicon wetter lead to a reduction in the germination of ascospores
and a reduction in the number of colonies of P. aphanis on the leaf surface. This
reduction in germination and colony number after the use of Omex SW7 was greater
than if potassium carbonate as K50 was used alone. The greatest reduction was in the
plots treated with high rate of Omex SW7 mixed with K50. Significant negative
correlations were observed between density and length of leaf hairs and number of
germinating ascospores and number of colonies. Significant negative correlations were
also observed between increased silicon level and decreased number of germinating
ascospores and colonies. These relationships emphasize the possibility of the use of a
silicon wetter in the reduction of strawberry powdery mildew. Therefore the protection
offered by the application of silicon based wetter Omex SW7 mixed with K50 might
have important practical implications in commercial strawberry production. However,
further work is required to establish evidence for this protective effect under high
disease pressure.
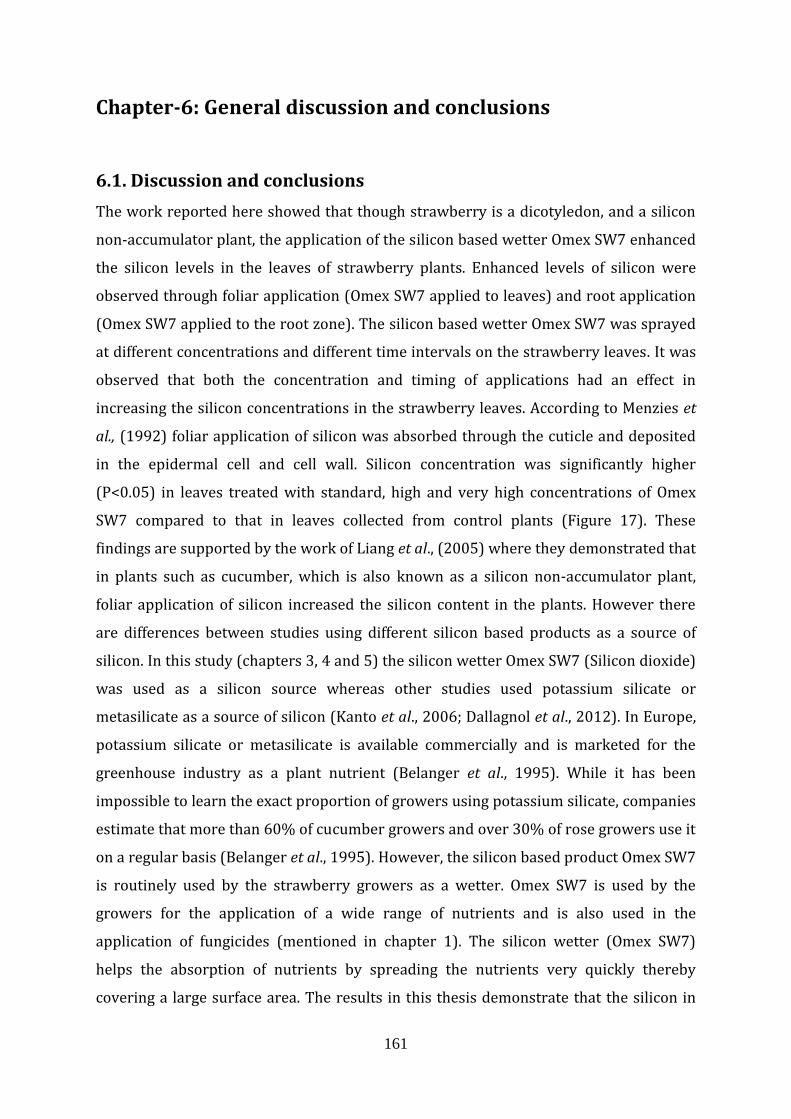
161
Chapter-6: General discussion and conclusions
6.1. Discussion and conclusions
The work reported here showed that though strawberry is a dicotyledon, and a silicon
non-accumulator plant, the application of the silicon based wetter Omex SW7 enhanced
the silicon levels in the leaves of strawberry plants. Enhanced levels of silicon were
observed through foliar application (Omex SW7 applied to leaves) and root application
(Omex SW7 applied to the root zone). The silicon based wetter Omex SW7 was sprayed
at different concentrations and different time intervals on the strawberry leaves. It was
observed that both the concentration and timing of applications had an effect in
increasing the silicon concentrations in the strawberry leaves. According to Menzies et
al., (1992) foliar application of silicon was absorbed through the cuticle and deposited
in the epidermal cell and cell wall. Silicon concentration was significantly higher
(P<0.05) in leaves treated with standard, high and very high concentrations of Omex
SW7 compared to that in leaves collected from control plants (Figure 17). These
findings are supported by the work of Liang et al., (2005) where they demonstrated that
in plants such as cucumber, which is also known as a silicon non-accumulator plant,
foliar application of silicon increased the silicon content in the plants. However there
are differences between studies using different silicon based products as a source of
silicon. In this study (chapters 3, 4 and 5) the silicon wetter Omex SW7 (Silicon dioxide)
was used as a silicon source whereas other studies used potassium silicate or
metasilicate as a source of silicon (Kanto et al., 2006; Dallagnol et al., 2012). In Europe,
potassium silicate or metasilicate is available commercially and is marketed for the
greenhouse industry as a plant nutrient (Belanger et al., 1995). While it has been
impossible to learn the exact proportion of growers using potassium silicate, companies
estimate that more than 60% of cucumber growers and over 30% of rose growers use it
on a regular basis (Belanger et al., 1995). However, the silicon based product Omex SW7
is routinely used by the strawberry growers as a wetter. Omex SW7 is used by the
growers for the application of a wide range of nutrients and is also used in the
application of fungicides (mentioned in chapter 1). The silicon wetter (Omex SW7)
helps the absorption of nutrients by spreading the nutrients very quickly thereby
covering a large surface area. The results in this thesis demonstrate that the silicon in

162
the wetter is taken up into the plants through the leaves. In addition when Omex SW7 is
used at higher than the recommended field rate, then more silicon is absorbed by the
plants. The results reported in this study (chapter 3) proved that the highest levels of
silicon accumulated in the leaves that were treated by the very high concentration of
silicon wetter Omex SW7. Moreover, the more silicon that was applied the higher the
levels of silicon absorbed by the plants. This effect was observed not only in the variety
Elsanta but also in the other varieties Rhapsody, Florence and Symphony used in the
glasshouse experiment (chapter 3).
The results in chapter 4 indicated that root application of silicon (Omex SW7) gave
more accumulation of silicon in the leaves of strawberry plants compared to the foliar
treatment. The difference in silicon content has been attributed to the ability of the
roots to take up silicon (Takahashi et al., 1990). Although strawberry is considered as a
silicon non-accumulator plant, addition of silicon in the hydroponic solution showed
(Kanto et al., 2007) the increased concentrations of silicon in the strawberry plants.
This finding supported the results that although strawberry plant is a silicon non-
accumulator but application of standard and high concentrations of Omex SW7 to roots
significantly (P<0.05) increased the silicon concentrations in leaves of strawberry
plants. However, the mechanisms involved in the different uptake modes are not fully
understood and scientists are still trying to find the exact mechanism involved in the
different uptake system. Mitani and Ma (2005) conducted a study to examine the uptake
system of silicon through the roots in rice, cucumber and tomato which accumulate
high, medium and low levels of silicon, respectively. The uptake system of silicon
involves at least two processes: radial transport of silicon from the external solution to
the root cortical cells (outer layer of the root) and the release of silicon from the cortical
cells to the xylem (xylem uptake) in rice, cucumber and tomato. Evidence has shown
that the uptake of silicon is an energy-dependent process (Mitani and Ma, 2005). In rice,
cucumber and tomato, it has been demonstrated that radial transport of silicon is
mediated by a transporter (SITI) and passive diffusion. However, the density of the
transporter differs among plant species following the order of rice>cucumber>tomato.
The next step of the process that is xylem uptake is mediated by a transporter (SIT2) in
rice. In cucumber and tomato xylem uptake is mediated by diffusion. Mitani and Ma
(2005) observed that the silicon concentration of xylem sap in rice was 20 and 100 fold

163
higher than that in cucumber and tomato, respectively. The much lower accumulation of
silicon in cucumber and tomato might be explained by a lower density of transporter
(SITI) to transport silicon from the external solution to the cortical cells and a defective
transporter or the absence of a transporter (SIT2) to transport silicon from cortical cells
to xylem (Mitani and Ma, 2005). Rice is a typical silicon accumulating plant which can
accumulate 10% (dry weight) silicon in the shoots. High levels of silicon in rice tissues
are attributed to the ability of the roots to take up this element. According to Ma and
Takahashi (2002) rice takes up silicon actively and the uptake is much faster than that
of water. Recently, a gene (Lsi1) that is responsible for active silicon uptake has been
identified from rice (Ma et al., 2004). Lsi1 is mainly expressed in the roots and the
expression of Lsi1 is regulated by silicic acid availability and supplying constant silicic
acid results in decreased expression. The identification of a gene in rice has been
proposed that governs a specific uptake system in rice that facilitates the uptake of
silicon. However, molecular mechanisms underlying silicon uptake in dicotyledonous
plants including cucumber, tomato and strawberry are still unknown and hence, silicon
uptake genes in dicotyledonous plants need to be isolated and characterized. The
beneficial effects of silicon are mainly associated with its high deposition in plant
tissues, enhancing their strength and rigidity. However, many plants especially
dicotyledonous plants are not able to accumulate a large amount of silicon in the shoot
from the soil (Mitani and Ma, 2005). Therefore, genetically manipulating the silicon
uptake system of the roots might help dicotyledonous plants to accumulate more
silicon, thereby enhancing the resistance of plants to multiple stresses.
The results reported in the present study (chapters 3, 4 and 5) showed that foliar and
root applications of silicon (Omex SW7) stimulated both the number and length of leaf
hairs on the leaves of strawberry plants. Moreover, it was also observed that the weekly
applications (foliar and root) of different concentrations of Omex SW7 showed
significantly (P<0.05) increased leaf hair numbers on both the upper and lower surfaces
of leaves compared to the other two intervals of applications. Silicon is rapidly bound in
leaf tissue and once it is deposited in the leaf tissue, it is not retranslocated (Datnoff et
al., 2007). Therefore continuous supply of silicon is very important in order to
guarantee a continuous beneficial effect of silicon on plants. This is perhaps the reason
that weekly application (foliar and root) of silicon wetter increased silicon levels in the

164
strawberry plants, which stimulated an increase in the number and length of hairs on
the leaves of strawberry plants.
Following uptake by the roots, silicon is translocated to the shoot via the xylem through
transpiration but may then be taken up actively by certain cells e.g. trichomes. Samuels
et al., (1993) stated that trichomes are the most common site where the silica is found.
Another investigator Adaita and Besford (1986) observed that leaves containing high
levels of silicon in the cucumber plants were rougher and the leaf hairs were also more
noticeable. These findings suggest that silicon has an effect on the leaves especially in
trichomes. The present study (chapter 3) also revealed that spraying the silicon wetter
(Omex SW7) onto the leaf surface affects the morphology of the strawberry leaves
resulting in the formation of additional leaf hairs which were longer than when the
plants were untreated. This effect was observed not only in the variety Elsanta. It was
observed in the varieties Rhapsody, Florence and Symphony. In the variety Rhapsody
although there were no hairs on the upper surface (Figure 27) of control leaves a high
concentration of Omex SW7 stimulated the growth of hairs on the upper surface. A
significant positive correlation was observed between silicon level and number of leaf
hairs on both the upper and lower surfaces of leaves in the variety Elsanta (Figures 20
and 21) and also observed in other varieties used in the study. Correlation analysis also
showed a significant positive relationship between silicon level and length of leaf hairs
on both the upper and lower surfaces of leaves (Figures 24 and 25) in the variety
Elsanta. Significant positive relationship between silicon level and length of leaf hairs
was also observed in other varieties used in the study. These relationships emphasize
that the silicon wetter has an influence in increasing the number and length of leaf hairs.
The results in chapter 4 showed that root application at the same concentrations of
silicon as the foliar application increased more silicon accumulation in leaves as well as
increased numbers and length of leaf hairs compared to that in the foliar application.
This can also be explained by the relationship mentioned above. The above positive
significant relationship showed that increased silicon levels are correlated with
increased leaf hair numbers and increased length of leaf hairs.
This is the first report demonstrating that absorbed silicon stimulated the number and
length of leaf hairs. Previous studies showed that silicon might be accumulated at the

165
base of the trichome but those studies did not show the effect of silicon on the
physiological change of the trichomes. The present study showed the effect of silicon on
trichomes. This result is supported by another study of Samuels et al., (1993) where
they found that addition of silicon to the hydroponic nutrient medium has been shown
to change the fruit trichome morphology. They (Samuels et al., 1993) found that
trichomes from silicon treated fruit had a coarse appearance compared to the untreated
fruit where the trichomes were smooth. These findings showed that deposition of
silicon in the trichome base changed the surface characteristics. The amount of silicon
accumulated in the trichomes depends on the species as well as the concentration of the
silicate in the growing medium or soil solution (Sangster and Hodson, 1986). Besides
this, there are other factors which could influence the accumulation of silicon on
trichomes but not in the surrounding epidermis. The cuticular membrane of the
trichomes may have a different ability to absorb silicon than the cuticle of the
surrounding epidermis. The high transpiration rate in this region may lead to super
saturation of the silicate solution and subsequent polymerisation. In addition Samuels et
al., (1993) stated that trichomes are the common site where the epicuticular wax was
observed. The component of the wax may have the ability of binding and concentrating
silicate, because the hydroxyl group of the primary alcohol of the wax bind the silicate
(Samuels et al., 1993).
The results reported in chapter 5 showed that at the beginning of the experiment on 7
April 2011 there were germinating ascospores and colonies on all the trial plots. The
four different silicon and K50 (standard, high, standard+K50, high +K50) treated plots
showed no germinating ascospores after 28 April (after 21 days of treatment). A
reduction in the number of colonies was also observed on these four silicon and K50
treated plots on 28 April 2011. The effect of silicon and K50 in reducing the number of
germinating ascospores and colonies can be shown in the decreasing order
(high+K50>standard+K50>high>standard>K50). This finding showed that silicon
played a role in the reduction of germinating ascospores and number of colonies. In
cucumber Liang et al., (2005) found that foliar application of silicon (Potassium
metasilicate) was effective in the reduction of powdery mildew diseases. They (Liang et
al., 2005) suggested that foliar applied silicon in their experiments probably played a
role as a physical barrier in preventing the penetration of fungal hyphae into host tissue.

166
The mode of action of foliar applied Omex SW7 in reducing germinating ascospores and
reducing the number of colonies was not determined in chapter 5. However, it appears
that silicon is the active ingredient in the foliar spray (Omex SW7) which might help to
reduce the number of germinating ascospores and colonies.
The mechanisms as to how silicon mediates disease resistance against pathogens are
still under debate among scientists. Kunoh and Ishizaki (1975) generalized that in
contrast to monocotyledons; in dicotyledons the deposition of silicon at the penetration
site of the pathogens does not confirm resistance to pathogens. This view is however
challenged by other workers. The reduction in cucumber powdery mildew with
addition of silicon has since been shown to be coincident with an accumulation of
silicon in the leaves (Menzies et al., 1992). Scanning electron microscope and X-ray
analysis showed that accumulation of silicon in rice leaves was closely associated with
enhanced resistance to rice blast (Kim et al., 2002). However, the concept that the
accumulation of silicon in cell walls is related to the inhibition of pathogens has become
widely accepted, but little emphasis has been placed on the possibility that silicon plays
a role in activating host defences. It appears that amendment of plants with silicon may
result in enhancement of defence responses. Therefore, in order to study the
mechanism by which silicon reduces disease severity, it is necessary to study if defence
responses in the host are enhanced, i.e. whether induced resistance is involved. For
cucumber, Menzies et al., (1991) reported that silicon might induce host resistance by
triggering a cascade of defence mechanisms of plants, leading to the accumulation of
antifungal compounds such as phytoalexins and pathogenesis-related proteins.
Strawberry is a dicotyledon, as is cucumber, and contains less silicon than cucumber.
The results in chapter 5 showed that application of silicon wetter Omex SW7
significantly reduced the disease incidence in comparison with the control. Kanto et al.,
(2007) mentioned that silicon had a role in the reduction of powdery mildew in
strawberry plants. Although both studies showed the suppressive effect of silicon
against powdery mildew in strawberry plants, the difference between the two studies is
that Kanto et al., (2007) showed that silicon was effective in the reduction of the
germination of conidia. On the other hand the results reported in chapter 5 showed that
germination of ascospores were reduced after the application of silicon wetter Omex
SW7.

167
Correlation analysis showed a negative correlation between silicon content in leaves
and the disease severity (chapter 5). A similar relationship was also observed by Kanto
et al., (2004). In another study Kanto et al., (2006) observed that powdery mildew in
strawberry plants was strongly suppressed by the application of silicon (as potassium
silicate) when applied before mildew appeared. Kunoh and Ishizaki (1975) observed
that silicon accumulated at the penetration sites in powdery mildew pathogens;
however accumulation of silicon was not correlated with increased resistance to fungal
penetration. For this reason, Kunoh and Ishizaki (1975) stated that silicon accumulation
might not constitute a physical barrier to block mildew penetration. Kanto et al., (2006)
also observed that although leaf hardness seemed to be greater than in control leaves,
leaf hardness did not differ significantly between control and silicon treated leaves.
Therefore, they (Kanto et al., 2006) stated that the main suppressive effect of silicon
against mildew is not only due to physical changes, but also it was absorbed into
strawberry plants and subsequently induced physiological changes in the strawberry
plants. Cherif et al., (1994) observed that incorporation of silicon into a hydroponics
system stimulated the activities of peroxidises and chitinases which can enhance
defence resistance in response to infection by the pathogen Pythium spp. in cucumber.
For this reason, Kanto et al., (2006) stated that silicon plays a role not only as a physical
barrier but also as a resistance inducer in plants.
The field trial (chapter 5) revealed that application of Omex SW7 significantly reduced
the number of germinating ascospores and colonies. This study (chapter 5) also
revealed that foliar application of Omex SW7 (standard and high) significantly (P<0.05)
increased the number and length of leaf hairs on both the upper and lower surfaces of
leaves (Figures 62 and 65). These increased number and length of leaf hairs might work
as a physical barrier and reduce the number of germinating ascospores and colonies.
These two findings regarding the morphological changes of strawberry leaf structure
such as increased number and length of leaf hairs could act as a physical barrier against
penetration of fungal hyphae that might help to prevent germination rate of powdery
mildew (Lewin and Reimann, 1969). Significant negative correlation was observed
between number of leaf hairs and disease severity (chapter 5). Correlation analysis also
showed a significant negative correlation between length of leaf hairs and disease
severity (chapter 5). This relationship further establishes the important role silicon
168
plays in disease resistance in strawberry. In addition, correlation analysis demonstrates
that number and length of leaf hairs might play a significant role in the reduction of
disease severity. Plant leaf hairs play important physiological roles. It has long been
known that glandular hairs protect the plants against the attacks of herbivorous animals
and especially of insects (Dalin et al., 2008). According to Brewer and Smith (1997) leaf
hairs can decrease pathogen germination rates by decreasing leaf wettability.
Kortekamp and Zyprian (1999) stated that leaf hairs work as a basic protective barrier
against downy mildew of grapes. Kortekamp and Zyprian (1999) observed that the high
density of leaf hairs on the leaves of grapes inhibit colonization of the leaf cuticle by
Plasmopora viticola, the downy mildew fungus of grape. According to the above findings
it might be stated that foliar application of Omex SW7 which increases the number and
length of leaf hairs might work as a protective barrier and decrease the number of
germinating ascospores and colonies in this trial. However this study (results of this
thesis) does not exclude the possibility that silicon may enhance host resistance by
triggering a systemic defence mechanism in strawberry plants leading to the
accumulation of antifungal compounds such as phytoalexin and pathogenesis-related
proteins in plants. In a study Wang and Galletta (1998) reported that spraying silicon
(Potassium silicate) increased unsaturated fatty acids (linoleic, linolenic acids) in
strawberry leaves. Linolenic acid is an unsaturated fatty acid related to the production
of jasmonate, a key substance in induced systemic resistance (Creelman and Mullet,
1997). According to the report of the different studies it can be stated that the
mechanism of silicon mediated resistance to fungal attacks in plants appears to be
extremely complicated, depending on the fungus involved and many other unknown
factors. In conclusion it can be said that silicon wetter Omex SW7 did not directly act
against infection by powdery mildew, but it was absorbed into strawberry plants and
subsequently induced physiological changes in the strawberry plants. According to
Wang and Galletta (1998) as a result of these physiological changes, after the
application of Omex SW7 on the strawberry leaves might be increased the unsaturated
fatty acids which could play an important role in the reduction of powdery mildew
infections. Thus the reduction in the number of germinating ascospores and colonies
after the application of silicon wetter Omex SW7, could indicate that silicon wetter
(Omex SW7) plays a role not only as a physical barrier, but also as a resistance inducer
in plants. However further study is required to investigate the presence and role of

169
induced compounds in silicon wetter Omex SW7 treated strawberry plants infected by
powdery mildew. It would be interesting to clarify whether silicon wetter treated
strawberry plants infected with powdery mildew exhibit the presence of phenol-like
material associated with degraded powdery mildew haustoria.
The results of this thesis support the hypothesis that silicon levels can be enhanced by
the application of Omex SW7 through leaves or roots and the application of silicon has
been shown to increase the number and length of leaf hairs in strawberry plants. The
field trial study also revealed that the application of the silicon based wetter
significantly (P<0.05) reduced the number of germinating ascospores and colonies. It
has also been observed that K50 (Potassium carbonate) alone can give some reduction
in the number of germinating ascospores and colonies. Potassium carbonate (K50) is a
contact type fungicide and direct contact with the fungus is necessary for control. In
order to achieve a good spread of K50, Omex SW7 is used as a wetter in the application
of potassium carbonate to reduce the infection of strawberry powdery mildew.
Therefore the result of the study suggests that foliar application of standard and high
concentrations of Omex SW7 mixed with K50 might limit the powdery mildew infection
in the field. The use of same mode of action of fungicides has resulted in the
development of fungicide resistance in P. aphanis. There are limited ranges of products
available for strawberry growers to control P. aphanis infection. According to Dodgson
(2008) effective control of P. aphanis infection could be achieved by using Systhane
(Myclobutanil) a systemic, protectant and curative fungicide. The use of natural and
low-toxicity substances such as sodium or potassium carbonate can reduce the number
of applications of fungicides that need to be used. For example, sodium bicarbonate has
been shown to control powdery mildew of rose (Horst et al., 1992). Potassium
carbonate however only works by contact with fungus and it has no lasting effect so can
require more frequent applications than fungicides. Potassium carbonate also could not
provide the same level of disease control which is achievable by using traditional
fungicides. For this reason potassium carbonate can be used in the integrated control
programme to complement fungicides rather than replace them completely. Potassium
carbonate does not have a harvest interval. Therefore, it is suggested that growers could
use standard and high concentrations of Omex SW7 and potassium carbonate routinely
in the immediate pre-harvest period to control the disease without using conventional

170
fungicides thus reducing the risk of occurrence of residues in the fruit and also reducing
conventional fungicide use.
The reduction of P. aphanis infection after the use of silicon wetter Omex SW7 was
greater than when K50 was used alone (chapter 5). Significant reduction was observed
in the plots treated with the standard and high concentrations of Omex SW7. The
reduction of disease severity as a result of foliar application of Omex SW7 was similar in
magnitude to that observed in melon plants infected with powdery mildew and
supplied with silicon (Dallagnol et al., 2012). Moreover, reductions of disease severity
were greater than those observed in cucumber and strawberry plants. In cucumber and
strawberry, foliar application of silicon did not show significant disease control (Liang
et al., 2005; Palmer, 2007). Therefore the result of the study suggests that weekly
application of standard and high concentrations of foliar application of Omex SW7
might be effective in reducing the powdery mildew severity in the field. In UK,
strawberry growers who are closely involved with this work used less than 14
applications of fungicide in each season; other growers sometimes applied fungicide
more than 14 times. In the Netherlands, a study carried out by Van Drooge et al., (2001)
showed that in strawberry more than 50 applications of pesticides were used in a
season, of which just less than half were fungicides. This number of applications greatly
increases the possibility of finding residues in the fruit as well as posing a health risk to
the operator. The use of the same mode of action of fungicides has resulted in the
development of fungicide resistance in P. aphanis. Some investigators have observed
that regular use of other fungicides and regular use of Systhane had adverse effects on
strawberry crops (Palmer, 2007; Dodgson, 2008). A reduction in fungicide applications
could be achieved in part by using alternate products where appropriate. According to
Ma et al., (2001) silicon is the only element that is not harmful for plants when
accumulated in excess levels. For this reason, the standard concentration of Omex SW7
could be used in the interval after use of conventional fungicides. Moreover, standard
concentration of silicon wetter could be used frequently when there is high disease
pressure. This would help growers to reduce the amount of fungicides they used to
control powdery mildew infection in strawberry production. Therefore, use of silicon
based wetter Omex SW7 as a supplement to fungicide in disease control has a strong
potential in integrated pest management and might help to ensure that the production
of strawberry is more sustainable.

171
Silicon concentrations in the leaves indicated that root application of Omex SW7
accumulates more silicon compared to the foliar application. The same results were
observed in rice, wheat and melon (Rezende et al., 2009; Guevel et al., 2007; Dallagnol et
al., 2012). All the above investigator findings supported the findings that concentrations
of silicon were higher when silicon was applied to roots compared to foliar application.
The results reported in chapter 5 showed that weekly (foliar) application of standard
and high concentrations of Omex SW7 significantly reduced the powdery mildew
infection. Application of silicon proved to be an effective means to increase the
resistance of plants for many combinations of plants and pathogens (Ma, 2004;
Dallagnol et al., 2012). Some investigators have found that root application of silicon
(Potassium silicate) was effective in the reduction of powdery mildew in strawberry,
melon and rose (Kanto et al., 2006; Shetty et al., 2012; Dallagnol et al., 2012). Therefore,
the results of this study suggest that the incorporation of Omex SW7 through the
irrigation water might be more effective in controlling powdery mildew disease than
the foliar treatment. Growers have complained that other silicon based products
especially potassium silicate can create a blockage when used in the irrigation pipes
(Personal communication). The advantage of using Omex SW7 is that when silicon
wetter is applied using the irrigation pipes it does not block the pipes. Growers usually
supply water to the strawberry plants through the irrigation pipes after planting up to
harvesting. Therefore, the standard concentration of Omex SW7 might be applied
weekly using the irrigation pipes after planting and continue up to harvesting. The
application of Omex SW7 in the irrigation pipes might help strawberry plants to absorb
more silicon and increase resistance against strawberry powdery mildew. This
treatment strategy might facilitate effective management of powdery mildew in
strawberries and increase productivity and marketability of strawberry crops. Thus the
incorporation of Omex SW7 in an integrated management programme might bring
positive results both in terms of reducing disease severity and consequently reducing
the amount of fungicides used.

172
6.2. Future Work
From the results described in this study and the information reported in the literature,
it becomes clear that application of silicon can contribute to disease control. Previous
reports from the literature clearly suggest that even though foliar application of silicon
can decrease the intensity of disease, the level of control achieved was not as great
when the silicon was applied to the roots. The present study revealed that
concentrations of silicon in the leaves were more when Omex SW7 was applied to the
roots compared to the foliar treatment. However, the molecular mechanism responsible
for the uptake of silicon is unknown and genes responsible for silicon uptake have not
been identified so far in the strawberry plants. Therefore, silicon uptake genes need to
be isolated and characterized. The gene responsible for silicon uptake in strawberry
plants could be isolated by using both expressed sequence tag based (EST) PCR and
microsatellite markers (Ma et al., 2004). Besides this, the ability of silicon applied as
Omex SW7 to the roots was not evaluated to control the powdery mildew disease in the
field. Therefore, further work is needed to investigate the effect of root applied Omex
SW7 in controlling strawberry powdery mildew disease in the field. Foliar application of
Omex SW7 significantly reduced the number of germinating ascospores and colonies
which was observed in the field trial. Therefore, further field trial study is needed to
identify whether the incorporation of Omex SW7 through the irrigation water (root
treatment) would be more effective in controlling powdery mildew disease compared to
the foliar treatment. The progress of the strawberry powdery mildew epidemic could be
monitored in each plot allowing comparison of treated and untreated plots. The area
under the disease progress curve (AUDPC) could be used to quantify the epidemics in
each treatment and used to compare epidemics by ANOVA to identify differences
between different treatments.
Many investigators have shown that silicon is deposited under the cell wall and forms a
silica-cuticle double layer (Kim et al., 2002; Raven, 2003). The deposition of silicon
enhances the strength and rigidity of the cell walls and thus increases the resistance of
plants to diseases. According to Kim et al., (2002) silicon accumulation on leaf surface
and under the cell wall might limit fungal penetration and invasion by acting as a
physical barrier. Therefore, further study needs to be carried out to determine whether

173
root applied Omex SW7 can enhance resistance due to accumulation and
polymerization of silicic acid under the cell wall of strawberry leaves. It would also be
interesting to know whether there is a relationship between cuticle thickness of leaves
and resistance against strawberry powdery mildew. This could be examined in a field
trial under high disease pressure. Location of silicon accumulation in strawberry leaves
and its possible association with resistance to strawberry powdery mildew could be
investigated by electron microscope and X-ray microanalysis. Localization of silicon
deposition in the strawberry leaves could be identified by using transmission electron
microscope coupled with energy-dispersive x-ray microanalysis. Transmission electron
microscope could also be used to measure the cuticle thickness. Silicon accumulation
and cuticle thickness measurement would identify whether root applied silicon wetter
could enhance cuticle thickness due to accumulation of silicon. To identify the
relationship between cuticle thickness and resistance against powdery mildew
correlation and regression analysis could be used. These relationships would determine
whether cuticle thickness has any effect against powdery mildew infections.
There is evidence that leaf hairs play an important role by protecting plants against
pathogen attack either by secreting chemicals or by acting as a physical barrier against
pathogen attack (Kumar et al., 2004; Dalin et al., 2008). In particular, trichome
formation in Arabidopsis thaliana has been used as a model system and many of the
genes which are involved in trichome initiation, spacing and shape have been identified
(Marks, 1997). Recent work on Arabidopsis indicates that artificial damage, and
application of jasmonic acid increases trichome production. The number of trichomes
produced and trichome density vary genetically within plant species. The results in the
present study (chapters 3, 4 and 5) showed that foliar and root applications of different
concentrations of Omex SW7 increased leaf hair density and length on both the upper
and lower surfaces of leaves. The results in chapter 5 showed that foliar application of
silicon wetter increased leaf hair numbers and length and decreased powdery mildew
infections. Therefore, further study needs to be carried out to examine the role of leaf
hairs during the infection of Podosphaera aphanis. In future, it could be investigated
whether high density of hairs on the leaf surface inhibits germ tube penetration and
thus inhibits colonization. Different strawberry varieties could be used. After the
application of different concentrations of silicon wetter to the roots, the youngest leaves

174
of strawberry plants could be dusted with conidia on the lower surface. After
inoculation, leaf samples could be collected and examined using the scanning electron
microscope. Use of a scanning electron microscope could help to identify whether
different density of leaf hairs from different strawberry varieties treated with silicon
wetter prevent penetration of P. aphanis fungus in the strawberry leaves.
There is strong evidence from the literature that silicon activates plants defence
mechanisms. In a study Liang et al., (2005) observed that in cucumber, root applied
silicon significantly suppressed powdery mildew and enhanced the activity of
pathogenesis-related proteins (peroxidase, polyphenoloxidase and chitinase) which
enhanced defence resistance in response to infection by the pathogen. However, it is
still unknown whether root applied silicon wetter can enhance or induce resistance in
strawberry plants infected with strawberry powdery mildew. In order to investigate
whether root applied silicon wetter could enhance the activity of pathogenesis-related
proteins would be identified by the method used by Liang et al., (2005). An alternative
approach is to determine the defence related genes expression due to silicon treatment,
which could be investigated by the use of molecular biology techniques such as
subtractive cDNA libraries or microarrays. These techniques were carried out by
Fauteux et al., (2006) to determine the defence related genes expressed in Arabidopsis
after treatment with silicon.

175
References
Adatia, M. H. and Besford, R. T. 1986. The effects of silicon on cucumber plants grown in recirculating nutrient solution. Annals of Botany, 58, 343-351. Amsalem, L., Freeman, S., Rav-David, D., Nitzani, Y., Sztajnberg, A., Pertot, I. and Elad, Y. 2006. Effect of climatic factors on powdery mildew caused by Sphaerotheca macularis f. sp. fragariae on strawberry. European Journal of Plant Pathology, 114, 283-292. Anon. 2004. Crop Walkers guide. Strawberry. Horticultural Development Council. www.hdc.org.uk. Anon. 2005. Fungicide resistance. http://www.pesticide.gov.uk. Anon. 2006. The Plant Health Propagation Scheme. Register of stocks entered and directory of participating growers 2000 http://www.defra.gov.uk/plant/phpsreg/info.htm#appx Anon. 2012a. Strawberry plants.org. Anon. 2012b. British Summer Fruits: The case for polytunnels. http://www.britishsummerfruits.co.uk/facts Anon. 2012c. Elsanta: one of the most cultivated varieties. www.flevoplant.nl. Anon. 2012d. Symphony strawberry plants from Welsh fruit stocks. http://www.welshfruitstocks.co.uk/acatalog Anon. 2012e. Strawberry Florence (late season) strawberry plants http://www.thompson-morgan.co.uk/fruit Anon. 2012f. SCRI. fruitbreeding .co.uk Anon. 2012g. How to grow strawberries. http://www.gardenorganic.org.uk/organicgardening Anon. 2012h. Agrifluids products.www.omex.co.uk/agrifluids/product Anon. 2012i. FRAC website. http://www.frac.info/frac/index.html Asalf, B., Gadoury, D. M., Tronsmo, A. M., Seem, R. C., Davidson, l. C., Brewer, M. T. and Stensvand, A. 2013. Temperature regulates the initiation of chasmothecia in powdery mildew of strawberry. Phytopathology, 103(7), 717-724. Askary, H., Carriere, Y., Belanger, R. R. and Brodeur, J. 1998. Pathogenicity of the fungus Verticillium lecanii to aphids and powdery mildew. Biocontrol Science Technology, 8, 23-32.

176
Belanger, R. R., Bowen, A. P., Ehrel, D. L. and Menzies, J. G. 1995. Soluble silicon, its role in crop and disease management of greenhouse crops. Plant Disease, 79, 329-336. Belanger, R. R., Benhamok, N. and Menzies, J. G. 2003. Cytological evidence of an active role of silicon in wheat resistance to powdery mildew (Blumeria graminis f. sp. tritici). Phytopathology, 93, 402-412. Belanger, R. R. and Labbe, C. 2002. Control of powdery mildews without chemicals: Prophylactic and biological alternatives for horticultural crops. In: Belanger, R. R., Bushnell, W. R., Dik, A. J. and Carver, T. L. W. eds. The powdery mildews: A comprehensive treatise, The American Phytopathological Society Press. St. Paul, Minnesota, U.S.A. 256-267. Bennett, D. M. 1982. Silicon deposition in the roots of Hordeum sativum Jess, Avena sativa L. and Triticum aestivum L., Annals of Botany, 50, 239-245. Bennett, D. M. and Sangster, A. G. 1982. Electron-probe microanalysis of silicon in the adventitious roots and terminal internode of the culm of Zea mays. Canadian Journal of Botany, 60, 2024-2031. Blanco, C., Santos, D. L., Barrau, C., Arroyo, F. T., Porras, M. and Romero, F. 2004. Relationship among concentrations of Sphaerotheca macularis conidia in the air, environmental conditions and the incidence of powdery mildew in strawberry. Plant Disease, 88(8), 878-881. Bonos, S. A., Casler, M. D. and Meyer, W. A. 2004. Plant responses and characteristics associated with dollar spot resistance in creeping bentgrass. Crop Science, 44, 1763-1769. Borel, W. R., Menzies, J. G. and Belanger, R. R. 2005. Silicon induces antifungal compounds in powdery mildew infected wheat. Physiology and Molecular Plant Pathology, 66, 108-115. Bowen, P., Menzies, J., Ehret, D., Samuels, L. and Glass, A. D. M. 1992. Soluble silicon sprays inhibit powdery mildew development on grape leaves. Journal American Society of Horticultural Science. 117(6), 906-912. Braun, U. 2002. Erysiphe miurae and E-syringae-japonicae- New records from Russia. Mikologiya/Fitopatologiya, 32, 15-16. Braun, U., Cook, R. T. A., Inman, A. J. and Shin, H. D. 2002. The taxonomy of the powdery mildew fungi. In: Belanger, R. R., Bushnell, W. R., Dik, A. J. and Carver, T. L. W. eds. The powdery mildews. A comprehensive treatise. The American Phytopathological Society Press, St. Paul, Minnesota, U.S.A., 13-55. Brewer, C. A. and Smith, W. K. 1997. Pattern of leaf surface wetness for montane and subalpine plants. Plant Cell Environment, 20, 1-11.

177
Buck, G. B., Korndorfer, G. H., Noila, A. and Coelho, L. 2008. Potassium silicate as foliar spray and rice blast control. Journal of Plant Nutrition, 31, 231-237. CALU. 2007. Protected strawberry production. www.calu.banger.ac.uk. www.tunnelfacts.co.uk/code. www.britishsummerfruits.co.uk/polytunnels. Carver, T. L. W., Thomas, B. J., Ingerson-Morris, S. M. and Zeyen, R. J. 1995. Early interactions during powdery mildew infection. Canadian Journal of Botany, 73, S632-S639. Cherif, M., Asselin, A. and Belanger, R. R. 1994. Defense responses induced by soluble silicon in cucumber roots infected by Pythium spp. Phytopathology, 84, 236-242. Cohen, R., Shtienberg, D. and Edelstien, M. 1996. Suppression of powdery mildew (Sphaerotheca fuliginea) in cucumber by the detergent Zohar LQ-215. European Journal of Plant Pathology, 102, 69-75. Creelman, R. A. and Mullet, J. E. 1997. Biosynthesis and action of jasmonate in plants. Annual Review of Plant Physiology and Plant Molecular Biology, 48, 355-381. Cross, J. and Berrie, A. 2006. The Challenges of developing IPM programmes for soft fruit crops that eliminate reportable pesticide residues. Journal of Fruit and Ornamental Plant Research, 14, 49-59. Daayf, F., Schmitt, A. and Belanger, R. R. 1995. The effects of plant extracts of Reynoutria sacchalinensis on powdery mildew development and leaf physiology of long English cucumber. Plant Disease, 79, 577-580. Dalin, P., Agren, J., Bjorkma, C., Huttunen, P. and Karkkainek, K. 2008. Leaf trichome formation and plant resistance to herbivory. In: Schaller, A. ed. Induced Plant Resistance to Herbivory. Springer Science & Business Media, 89-105. Dallagnol, L., Rodrigues, F. A., Tanaka, F. A., Amorim, L. and Camargo, L. E. A. 2012. Effect of potassium silicate on epidemic components of powdery mildew on melon. Plant Pathology, 613, 323-330. Darnell, R. L., Cantiff, D. J., Kirsehbanm, D. S. and Chandler, C. K. 2003. The physiology of flowering in strawberry. Horticultural Reviews, 28, 325-349. Darrow, G. M. 1999. The Strawberry: History, Breeding and Physiology. Holt, Rinehart and Winston, New York, Chicago and San Francisco. Datnoff, L. E., Deren, C. W., Raid, R. N. and Jones, D. B. 1991. Effect of calcium silicate on blast and brown spot intensities and yields of rice. Plant Disease, 75, 729-732. Datnoff, L. E., Deren, C. W. and Snyder, G. H. 1997. Silicon fertilization for disease management of rice in Florida. Crop Protection, 16, 525-531.

178
Datnoff, L. E. and Rodrigues, F. A. 2005. The role of silicon in suppressing rice diseases. Feature story, APS net. Datnoff, L. E., Rodrigues, F. A. and Seebold, K. W. 2007. Silicon and plant disease. In: Datnoff, L. E., Elmer, W. H., Huber, D. M. eds. Mineral nutrition and Plant disease. St. Paul, MN, USA: APS Press, 233-246. Defra. 2008. Developing resources for genetic improvement of strawberry. Science and Research project. Funded Organisation: East Malling Research. Dickinson, M. 2003. Molecular Plant Pathology. BIOS Scientific Publishers. Taylor and Francis group, 11 New Fetter lane, London EC4P 4EE and 29 West 35th Street, New York, NY 10001-2299, USA. Dodgson, J., Hall, A. and Parker, S. 2005. Overwintering Podosphaera aphanis as main source of inoculum in a second year Elsanta strawberry crop under Spanish tunnels and relative resistance of seven varieties. The BCPC International Congress – Crop Science and Technology. Glasgow: BCPC. Dodgson, J., Hall, A. and Parker, S. 2007. System to predict high risk periods for Podosphaera aphanis infection of strawberries grown in polythene tunnels. Aspects of Applied Biology, 83, 59-64. Dodgson, J. 2008. Epidemiology and sustainable control of Podosphaera aphanis (strawberry powdery mildew). University of Hertfordshire. Dodgson, J., Hall, A. M. and Parker, S. 2008. Control of strawberry powdery mildew under protection. Factsheet 17/08. Horticultural Development Council. Elliott, C. L. and Snyder, G. H. 1991. Autoclave induced digestion for the colorimetric determination of silicon in rice straw. Journal of Agricultural and Food Chemistry. 39, 1118-1119. Epstein, E. 1994. The anomaly of silicon in plant biology. Procedings of the National Academy of Science USA, 91, 11-17. Epstein, E. 1999. Silicon. Annual Review of Plant Physiology and Plant Molecular Biology. 50, 641-664. Epstein, E. 2001. Silicon in plants; Facts vs concepts, In: Datnoff, L. E. Snyder, G. Korndorfer, G. H., eds. Silicon in agriculture. Elsevier Science, B.V., Amsterdam, 1-15. Epstein, E. 2009. Silicon: its manifold roles in plants. Annals of Applied Biology, 155, 155-160. Falk, S. P., Gadoury, D. M., Cortesi, P., Pearson, R. C. and Seem, R. C. 1995. Parasitism of Uncinula necator cleistothecia by the mycoparasite Ampelomyces quisqualis. Phytopathology, 85, 794-800.

179
Fallik, E., Ziv, O., Grinberg, S., Alkalai S. and Klein, J. D. 1997. Bicarbonate solutions control powdery mildew (Leveillula taurica) on sweet red pepper and reduce the development of post harvest fruit rotting. Phytoparasitica, 25, 41-43. Fatema, K. 2011. Figure 9. Overwintering chasmothecia, Chasmothecia on leaf, Germinating ascospore on leaf, Mycelium on leaf, Figure 10C. Mycelium growth on the underside of the leaflet, Figure 10D. Mycelium on the underside of the leaf, Figure 11A. Chasmothecia on strawberry leaf, Figure 11B. Close up of chasmothecia on leaf, Figure 11C. A chasmothecia with appendages, PhD student, Department of Human and Environmental Sciences. University of Hertfordshire, AL10 9AB. Fauteux, F., Chain, F., Belzile, F., Menzies, J. G. and Belanger, R. R. 2006. The protective role of silicon in the Arabidopsis-powdery mildew pathosystem. Procedings of the National Academy of Science USA, 103, 17554-17559. Ferrari, R. 2007. BSc Project. Figure 11D. Broken chasmothecia releasing an ascus. University of Hertfordshire. Fletcher, A. 2006. Strawberry technology boosts UK super fruit growth. http://foodnavigator.com/news/ng.asp,strawberry-fruit-antioxidant. Francis, S., Dewey, M. and Gurr, S. J. 1996. The role of cutinase in germling development in Erysiphe graminis. Physiological and Molecular Plant Pathology, 49, 201-211. Gadoury, D. M., English-Loeb, G., Norton, A, P., Seem, R. C. and Wilcox, W, F. 1998. Suppression of grape powdery mildew by a mycophagous mite. Phytopathology, 88, S30. Gadoury, D. M., Stensvand, A., Seem, R. C. and Heidenreich, C. 2007. Ontogenic resistance of leaves, leaf folding and the distribution of mildew colonies in strawberry powdery mildew (Podosphaera macularis). Phytopathology, 97, S38 Gadoury, D. M., Asalf, B., Heidenreich, M. C., Herrero, M. L., Welser, M. J., Seem, R. C., Tronsmo, A. M. and Stensvand, A. 2010. Initiation, development, and survival of cleistothecia of Podosphaera aphanis and their role in the epidemiology of strawberry powdery mildew. Phytopathology, 100, 246-251. Glawe, D. A. 2008. The powdery mildews: A review of the world’s most familiar (yet poorly known) plant pathogens. Annual Review of Phytopathology, 46, 27-51. Goddard, T. 2010. Guide to field Experimentation: Experimental design. Agriculture and Rural Development. Green, J. R., Carver, T. L. W. and Gurr, S. J. 2002. The formation and function of infection and feeding structures. In: Belanger, R. R., Bughnell, W. R., Dik, A. J. and Carver, T. L. W. eds. The Powdery mildews. A comprehensive treatise. The American Phytopathological Society Press. St. Paul. Minnesota, U. S. A., 66-82.

180
Guevel, M. H., Menzies, J. G. and Belanger, R. R. 2007. Effect of root and foliar applications of soluble silicon on powdery mildew control and growth of wheat plants. European Journal of Plant Pathology, 119, 429-436. Hajlaoui, M. R., and Belanger, R. R. 1991. Comparative effects of temperature and humidity on the activity of three potential antagonists of rose powdery mildew. Netherland Journal of Plant Pathology, 97, 203-208. Hall, A. M., Dodgson, J. and Farooq, M. 2007. The overwintering chasmothecia of Podosphaera aphanis and the initiation of the subsequent epidemic. XVI International Plant Protection Congress, Glasgow, BCPC. Hancock, J. and Handley, D. 1998. The history and biology of the cultivated strawberry. Strawberry production guide for the Northeast, Mideast and Eastern Canada. Northeast Regional Agricultural Engineering Service (NRAES), Ithaca NY. Handley, D. T. 1998. The strawberry plant: what you should know. University of Marine Cooperative Extension, Highmoor Farm, P.O. Box 179, Monmouth Marine. Hayward, D. M. and Parry, D. W. 1973. Electron-probe microanalysis studies of silica distribution in barley (Hordeum sativum L.). Annals of Botany, 37, 579-591. Heine, G., Tikum, G. and Horst, W. J. 2005. Silicon nutrition of tomato and bitter gourd with special emphasis on silicon distribution in root fractions. Journal of Plant Nutrition and Soil Science, 167, 600-606. Highland, H. B. 2000. AgraQuests search for Serenade: The isolation and development of a new biopesticide for plant protection. (Abstr.) Phytopathology, 90, 93-95. Hodson, M. J. and Sangster, A. G. 1988. Observation on the distribution of mineral elements in the leaf of wheat (Triticum aestivum L) with particular reference to silicon. Annals of Botany, 62, 463-477. Hokanson, S. C. and Maas, J. L. 2001. Strawberry biotechnology. Plant Breeding Reviews, 21, 139-180. Homme, Y., Arimota, Y. and Misatu, T. 1981. Effect of sodium bicarbonate on each growth stage of cucumber powdery mildew fungus (Sphaerotheca fuliginea) in its life cycle. Journal of Pesticide Science, 6, 201-209. Horst, R. K., Kawamoto, S. O. and Porter, L. L. 1992. Effect of sodium bicarbonate and oils on the control of powdery mildew and black spot of roses. Plant Disease, 76, 247-251. Jarvis, W. R., Shaw, L. A. and Traquair, J. A. 1989. Factors affecting antagonism of cucumber powdery mildew by Stephanoascus flocculosus and S. rugulosus. Mycological Research, 92, 162-165. Jhooty, J. S. and Mckeen, W. E. 1965. Studies on powdery mildew of strawberry caused by Sphaerotheca macularis. Phytopathology, 55, 281-285.

181
Jin, X. 2012. Figure11E, broken chasmothecia releasing an ascus, Figure11F, Close up of an ascus containing 8 ascospores. PhD student, Department of Human and Environmental Sciences. University of Hertfordshire, AL10 9AB. Jones, L. H. P. and Handreck, K. A. 1965. Studies of silica in the oat plant. III. Uptake of silica from the soils by the plant. Plant and Soil, 23, 79-96. Jones, L. H. P. and Handreck, K. A. 1967. Silica in soils, plants and animals. Advance Agronomy, 19, 107-149. Kamenidou, S., Cavins, T. J. and Marek, S. 2008. Silicon supplements affect horticultural traits of greenhouse-produced ornamental sunflowers. HortScience, 43, 236-239. Kang, N. J. 2008. Inhibition of powdery mildew development and activation of antioxidant enzymes by induction of oxidative stress with foliar application of a mixture of riboflavin and methionine in cucumber. Scientia Horticulturae, 118, 181-188. Kanto, T., Miyoshi, A., Ogaw, T., Maekawa, K. and Aino, M. 2004. Suppressive effect of potassium silicate on powdery mildew of strawberry in hydroponics. Journal of General Plant Pathology, 70, 207-211. Kanto, T., Miyoshi, A., Ogaw, T., Maekawa, K. and Aino, M. 2006. Suppressive effect of potassium silicate on powdery mildew of strawberry in soil culture. Journal of General Plant Pathology, 72, 137-142. Kanto, T., Maekawa, K. and Aino, M. 2007. Suppression of conidial germination and appressorial formation by silicate treatment in powdery mildew of strawberry. Journal of General Plant Pathology, 73, 1-7. Kaufmann, P. B., Dayanandan, P., Takeoka, Y., Bigelow, W. C., Jones, J. D. and Iler, R. 1981. Silica in the shoots of higher plants. In: Simpson, T. L., Volcani, B. E. eds. Silicon and silicious structures in biological systems. Springer-verlag, New York, 409-449. Kaufman, P. B., Dayanandan, P., Franklin, C. I. and Takeoka, Y. 1985. Structure and function of silica bodies in the epidermal system of grass shoots. Annals of Botany, 55, 487-507. Keon, J. P. R., Byrde, R. J. W. and cooper, R. M. 1987. Some aspects of fungal enzymes that degrade plant cell walls, In: Pegg, G. F. and Ayres, P. G. eds. Fungal infection of plants. Cambridge University Press, Cambridge, England, 133-157. Kim, S. G., Kim, K., Park, E. W. and Choi, D. 2002. Silicon-induced cell wall fortification of rice leaves: A possible cellular mechanism of enhanced host resistance to blast. Phytopathology, 92, 1095-1103. Kirk, P. M., Cannon, D. F., David, J. C. and Stalpers, J. A. 2011. Ainsworth and Bisby’s dictionary of fungi (10th edition). Wallingford, CABI Biosciences.

182
Kiss, L. 2003. A review of fungal antagonists of powdery mildews and their potential as biocontrol agents. Pest Management Science, 59, 475-483. Kortekamp, A. and Zyprian, E. 1999. Leaf hairs as a basic protective barrier against downy mildew of grape. Journal Phytopathology, 147, 453-459. Kumar, N., Pandey, S., Bhattacharya, A. and Ahuja, P. S. 2004. Do leaf surface characteristics affect Agrobacterium infection in tea [Camellia sinensis (L.) O Kountze]? Journal Bioscience, 29(3), 309-317. Kunoh, H. and Ishizaki, H. 1975. Silicon levels near penetration sites of fungi on wheat, barley, cucumber and morning glory leaves. Physiological Plant Pathology, 29, 69-78. Kunoh, H., Itoh, O., Kohno, M. and Ishizaki, H. 1979. Are primary germ tubes of conidia unique to Erysiphe graminis? Annals of the Phytopathological Society of Japan, 45, 675-682. Lewin, J. and Reimann, B. E. F. 1969. Silicon and Plant Growth. Annual Review of Plant Physiology, 20, 289-304. Lewis, W. J. 2006. Growing strawberries in high tunnels in Missouri. Midwest strawberry production guide. The Ohio State University Bulletin, 926. Liang, Y. C., Sun, W. C., Si, J. and Romheld, V. 2005. Effects of foliar and root applied silicon on the enhancement of induced resistance to powdery mildew in Cucumis sativus. Plant Pathology, 54, 678-685. Lucas, J. A. 1998. Plant pathology and plant pathogens (3rd edition), Oxford, Blackwell Science. Ma, J. F., Goto, S., Tamai, K. and Ichii, M. 2001. Role of root hairs and lateral roots in silicon uptake by rice. Plant Physiology, 127, 1773-1780. Ma, J. F, Tamai, K., Masahiko, I. and Wu, G. F. 2002. A rice mutant defective in Si uptake. Plant Physiology. 130, 2111-2117. Ma, J. F. and Takahashi, E. 2002. Soil, Fertilizer and Plant Silicon Research in Japan. Elsevier Science, Amsterdam. Ma, J. F. 2004. Role of silicon in enhancing the resistance of plants to biotic and abiotic stresses. Soil Science and Plant Nutrition, 50, 11-18. Ma, J. F., Mitani, N., Nagao, S., Konoshi, S., Tamai, K., Iwashita,T. and Yano, M. 2004. Characterization of the silicon uptake system and molecular mapping of the silicon transporter gene in rice. Plant Physiology, 136, 3284-3289. Ma, J. F. and Yamaji, N. 2006. Silicon uptake and accumulation in higher plants. Trends in Plant Science, 11(8), 1-7.

183
Maas, J. L. 1998. Compendium of strawberry diseases (2nd edition), Minnesota, The American Phytopathological Society. Malathrakis, N. E. 1985. The fungus Acremonium alternatum a hyper-parasite of the cucurbit powdery mildew pathogen Sphaerotheca fuliginea Z. Pflanzenkrankh. Pflanzenschutz 92, 509-515. Marco, S., Ziv, O. and Cohen, R. 1994. Suppression of powdery mildew in squash by applications of whitewash, clay and anti-transpirant materials. Phytoparasitica, 22, 19-29. Marks, M. D. 1997. Molecular genetic analysis of trichome development in Arabidopsis. Annual Review of Plant Physiology and Plant Molecular Biology, 48, 137-163. Marta, A. E., Camadro, E. L., Diaz-Ricci, J. C. and Castagnaro, A. P. 2004. Breeding berries between the cultivated strawberry, Fragaria x ananassa and related wild germplasm. Euphytica, 136, 139-150. Marschner, H. 1995. Mineral nutrition of higher plants. Academic Press London. McGrath, M. T. and Shishkoff, N. 1999. Evaluation of biocompatible products for managing cucurbit powdery mildew. Crop Protection, 18, 471-478. McGrath, M. T. and Shishkoff, N. 2000. Control of cucurbit powdery mildew with JMS stylet oil. Plant Disease, 84, 989-993. Menzies, J. G. D. L., Ehret, A. D. M., Glass, T., Helmer, C. K. and Seywerd, F. 1991. Effects of soluble silicon on the parasitic fitness of Sphaerotheca fuliginea and Cucumis sativus. Phytopathology, 81 (1), 84-88. Menzies, J., Bowen, P., Ehret, D. and Glass, A. D. M. 1992. Foliar application of potassium silicate reduces severity of powdery mildew on cucumber, muskmelon and zucchini squash. Journal of the American Society for Horticultural Science, 112, 902-905. Menzies, J. G. and Belanger, R. R. 1996. Recent advances in cultural management of diseases of greenhouse crops. Canadian Journal of Plant Pathology, 18, 186-193. Meulenbroek, B. 2005. New variety with potential to replace Elsanta. Fruit and Vegetable Technique, 5(4), 1-3. Mitani, N. and Ma, J. F. 2005. Uptake system of silicon in different plant species. Journal of Experimental Botany, 56(414), 1255-1261. Miyake, Y. and Takahashi, E. 1983. Effect of silicon on the growth of solution-cultured cucumber plant. Soil Science and Plant Nutrition, 29(1), 71-83. Miyake, Y. and Takahashi, E. 1986. Effect of silicon on the growth and fruit production of strawberry plants in a solution culture. Soil Science and Plant Nutrition, 32(2), 321-326.

184
Moseman, J. G. 1966. Genetics of powdery mildews. Annual Review of Phytopathology, 4, 269-288. Mukerji, K. G. 1968. Sphaerotheca macularis. C.M.I. Descriptions of pathogenic fungi and bacteria. Nagata, T., Todoriki, S., Hayashi, T., Shibata, Y., Mori, M., Kanegae, H. and Kikuchi, S. 1999. Gamma-radiation induces leaf trichome formation in Arabidopsis. Plant Physiology, 120, 113-119. Nicholson, R. L. and Epstein, L. 1991. Adhesion of fungi to the plant surface: Prerequisite for pathogenesis. In: Cole, G. T. and Hoch, C. H. eds. The Fungal Spore and Disease Initiation in Plants and Animals. Plenum Press, New York, 3-24. Okuda, A and Takahashi, E. 1965. The role of silicon. In The Mineral Nutrition of Rice Plant, ed. By IRRI, Johns Hopkins Press, Baltimore, 123-146. Paisini, C., Aquila, D., Curir, F. P. and Gullino, M. L. 1997. Effectiveness of antifungal compounds against rose powdery mildew (Sphaerotheca pannosa var. rosae) in glasshouse. Crop Protection, 16, 251-256. Pal, K. K. and Gardener, B. M. 2006. Biological control of plant pathogens. APS net. Palmer, S. 2007. Strawberry powdery mildew: epidemiology and the effect of host nutrition on disease. The University of Adelaide. Faculty of Science. Parry, D. W and Soni, S. L. 1972. Electron probe microanalysis of silicon in the roots of Oryza sativa L. Annals of Botany, 36, 781-783. Paulitz, T. C. and Belanger, R. R. 2001. Biological control in greenhouse systems. Annual Review of Phytopathology, 39, 103-133. Peries, O. S. 1962a. Studies on strawberry mildew, caused by Sphaerotheca macularis (Wallr. ex Fries) Jaczewski. I. Biology of the fungus. Annals of Applied Biology, 50, 211-224. Peries, O. S. 1962b. Studies on strawberry mildew, caused by Sphaerotheca macularis (Wallr. ex Fries) Jaczewski. II. Host-parasite relationship on foliage of strawberry varieties. Annals of Applied Biology, 50, 225-233. Pertot, I., Zasso, R., Amsalem, L., Mario, B., Angeli, G. and Elad, Y. 2008. Integrating biocontrol agents in strawberry powdery mildew control strategies in high tunnel growing systems. Crop Protection, 27, 622-631. Phillips, D. and Reid, A. 2008. High and low tunnels in strawberry production. Department of Agriculture and Food. Government of Western Australia. Pritts, M. and Handley, D. 1998. Strawberry production guide for the Northeast, Midwest and eastern Canada (NRAES-88).

185
Raven, J. A. 2003. Cycling silicon-the role of accumulation in plants. New Phytopathology, 158, 419-430. Rezende, D. C., Rodrigues, F. A., Carre-Missio, V, Schurt, D. A., Kawamura, I. K. and Korndorfer, G. H. 2009. Effect of root and foliar applications of silicon on brown spot development in rice. Australian Plant Pathology, 38, 67-73. Rowley, D. and Drost, D. 2010. High tunnel strawberry production. https://extension usu.edu/files/publications/horticulture_High Tunnels_2012-02pr.pdf. Saenz, G. S. and Taylor, J. W. 1999. Phylogeny of the Erysiphales (powdery mildews) inferred from internal transcribed spacer (ITS) ribosomal DNA sequences. Canadian Journal of Botany, 77, 150-169. Samuels, A. L., Glass, A. D. M., Ehret, D. L. and Menzies, J. G. 1991. Distribution of silicon in cucumber leaves during infection by powdery mildew fungus (Sphaerotheca fuliginea). Canadian Journal of Botany, 69, 140-146. Samuels, A. L., Glass, A. D. M., Ehret, D. L. and Menzies, J. G. 1993. The effects of silicon supplementation on cucumber fruit: changes in surface characteristics. Annals of Botany, 72, 433-440. Sangster, A. G. and Hodson, M, J. 1986. Silica in higher plants. In: Evered, D., O’ Conner, M. eds. Silicon biochemistry. Ciba Foundation Symposium 121, John Wiley and Sons Ltd., Chichester, UK, 90-111. Sawant, S. S. D. and Sawant, I. S. 2008. Use of potassium bicarbonate for the control of powdery mildew in table grapes. Acta Horticulturae, 785 (ISHS, 2008), 285-291. Schnathorst, W. C. 1965. Environmental relationships in the powdery mildews. Annual Review of Phytopathology, 3, 343-366. Shaik, M. 1985. Race-nonspecific resistance in bean cultivars to races of Uromyces appendiculatus var. appendiculatus and its correlation with leaf epidermal characteristics. Phytopathology, 75(4), 478-481. Shen, G. H., Xue, Q. H., Tang, M., Wang, L. N., Duan, C. M., Xue, L. and Zhao, J. 2010. Inhibitory effects of potassium silicate on five soil-borne phytopathogenic fungi in vitro. Journal of Plant Diseases and Protection, 117(4), 180-184. Shetty, R., Jensen, B., Shetty, N. P., Hansen, M., Hansen, C. W., Starkey, K. R. and Jorgensen, H. J. L. 2012. Silicon induced resistance against powdery mildew of roses caused by Podosphaera pannosa. Plant Pathology, 61, 120-131. Smith, I. M., Dunez, J., Phillips, D. H., Lellioh, R. H. and Archer, S. A. 1988. European Handbook of Plant Diseases. Blackwell Scientific Publications.

186
Sztejnberg, A., Galper, S., Mazar, S. and Lisker, N. 1989. Ampelomyces quisqualis for biological integrated control of powdery mildews in Israel. Journal Phytopathology, 124, 285-289. Taber, H. G., Shogren, D. and Gang, L. 2002. Extraction of silicon from plant tissue with dilute HCL and HF and measurement by modified Inductive Coupled Argon Plasma Procedures. Communications in Soil Science and Plant Analysis, 33(9 & 10), 1661-1670. Takahashi, E. and Miyake, Y. 1976a. Distribution of silica accumulator plants in the plant kingdom (1) monocotyledons. Journal Science Soil Manure, 47, 269-300. Takahashi, E. and Miyake, Y. 1976b. Distribution of silica accumulator plants in the plant kingdom (2) dicotyledons. Journal Science Soil Manure, 47, 301-306. Takahashi, E., Ma, J. F. and Miyake, Y. 1990. The possibility of silicon as an essential element for higher plants. Comments Agric. Food Chem, 2, 99-122. Takamatsu, S., Hirata, T. and Sato, Y. 2000. A parasitic transition from trees to herbs occurred at least two times in tribus Cystotheceae (Erysiphaceae): Evidence from nuclear ribosomal DNA. Mycological Research, 104, 1304-1311. Traw, B. M. and Bergelson, J. 2003. Interactive effects of jasmonic acid, salicylic acid and gibberellins on induction of trichomes in Arabidopsis. Plant Physiology, 133, 1367-1375. Tzanetakis, I. E. and Martin, R. R. 2013. Expanding field of strawberry viruses which are important in North America. International Journal of Fruit Science, 13, 184-195. Van Drooge, H. L., Groeneveld, C. N. and Schipper, H. J. 2001. Data on application frequency of pesticide for risk assessment purposes. Annals of Occupational Hygiene, 45, S95-S101. Waller, J. m., Lenne, J. M. and Waller, S. J. 2002. Plant Pathologist’s Pocketbook (3rd Edition). Wallingford, CABI International. Wang, S. Y. and Galletta, G. J. 1998. Foliar application of potassium silicate induces metabolic changes in strawberry plants. Journal of Plant Nutrition, 21(1), 157-167. Warmund, R. M. 2002. Pollinating fruit crops. Department of Horticulture. University of Missouri. Webster, J. and Weber, R. 2007. Introduction to Fungi. Cambridge University Press, Leiden, ISBN; 9780511277832. Werker, E. 2000. Trichome diversity and development. In: Hallahan, D. L. and Gray, J. C. eds. Advances in Botanical Research incorporating advances in Plant Pathology, vol. 31: Plant Trichomes, San Diego/Boston/London: Academic Press, 1-35.

187
Williams, D. E. and Vlamis, J. 1957. The effect of silicon on yield and manganese 54 uptake and distribution in the leaves of barley plants grown in cucumber solutions. Plant Physiology, 32, 404-409. Yoshida, S., Ohnishi, Y. and Kitagishi, K. 1962. Chemical forms, mobility and deposition of silicon in rice plant. Soil Science and Plant Nutrition, Tokyo. 8, 15-20. Ziv, O. and Hagiladi, A. 1993. Controlling powdery mildew euonymus with polymer coatings and bicarbonate solutions. HortScience, 28, 124-125.

188
Appendix-1: Randomised distribution of the treatments, date of application of the treatments and leaf collections from different rows of block B (variety Elsanta) (Pilot experiment) (Chapter3)
Block Row numbers and treatments
Application of the treatments date Leaf collection
B
Week 1 14.10.08
Week 2 21.10.08
Week 3 28.10.08
Week 4 4.11.08
Week 5 11.11.08
Week 6 18.11.08
Row-9 Control
Control
Control Control Control Control Collection of leaves
Row-10 High weekly (sprayed 5 times)
High
High High High High Collection of leaves
Row-11 Water sprayed 2 times (weeks 1 and 5)
Water Water Collection of leaves
Row-12 High sprayed 2 times (weeks 1 and 5)
High
High Collection of leaves
Row-13 Standard sprayed 2 times (weeks 1 and 5)
Standard
Standard Collection of leaves
Row-14 Standard weekly (sprayed 5 times)
Standard
Standard Standard Standard Standard Collection of leaves
Row-15 Water weekly (sprayed 5 times)
Water Water Water Water Water Collection of leaves
Row-16 Control
Control
Control Collection of leaves

189
Appendix-2: Randomised distribution of the treatments, date of application of the treatments and leaf collections from different rows of block B, C and D (variety Elsanta) (Main experiment) (Chapter3)
Block Row numbers and
treatments Application of the treatments date Leaf
collection B
Week 1 08.06.09
Week 2 15.06.09
Week 3 22.06.09
Week 4 29.06.09
Week 5 04.07.09
Week 6 11.07.09
Row-13 High sprayed 3 times (weeks 1, 3 and 5)
High High High Collection of leaves
Row-14 Control
Control Control Control Control Control Collection of leaves
Row-15 Standard sprayed 3 times (weeks 1, 3 and 5)
Standard Standard Standard Collection of leaves
Row-16 High weekly (sprayed 5 times)
High High High High High Collection of leaves
Row-17 Very high weekly (sprayed 5 times)
Very high Very high Very high Very high Very high Collection of leaves
Row-18 Control
Control Control Control Collection of leaves
Row-19 High sprayed 2 times (weeks 1 and 5)
High High Collection of leaves
Row-20 Standard 2 times (weeks 1 and 5)
Standard Standard Collection of leaves
Row-21 Standard weekly (sprayed 5 times)
Standard Standard Standard Standard Standard Collection of leaves
Row-22 Very high sprayed 3 times (weeks 1, 3 and 5)
Very high Very high Very high Collection of leaves
Row-23 Very high sprayed 2 times (weeks 1 and 5)
Very high Very high Collection of leaves
Row-24 Control
Control Control Collection of leaves
Row-25 Standard weekly
Standard Standard Standard Standard Standard Collection of leaves

190
C
(sprayed 5 times)
Row-26 Control
Control Control Control Control Control Collection of leaves
Row-27 Standard sprayed 3 times (weeks 1, 3 and 5)
Standard Standard Standard Collection of leaves
Row-28 High sprayed 2 times (weeks 1 and 5)
High High Collection of leaves
Row-29 High sprayed 3 times (weeks 1, 3 and 5)
High High High Collection of leaves
Row-30 Very high sprayed 3 times (weeks 1, 3 and 5)
Very high Very high Very high Collection of leaves
Row-31 Very high sprayed 2 times (weeks 1 and 5)
Very high Very high Collection of leaves
Row-32 Control
Control Control Control Collection of leaves
Row-33 High weekly (sprayed 5 times)
High High High High High Collection of leaves
Row-34 Standard sprayed 2 times (weeks 1 and 5)
Standard Standard Collection of leaves
Row-35 Very high weekly (sprayed 5 times)
Very high Very high Very high Very high Very high Collection of leaves
Row-36 Control
Control Control Collection of leaves
D
Row-37 High sprayed 2 times (weeks 1 and 5)
High High Collection of leaves
Row-38 Very high sprayed 2 times (weeks 1 and 5)
Very high Very high Collection of leaves
Row-39 Control
Control
Control Collection of leaves

191
D
Row-40 Standard sprayed 3 times (weeks 1, 3 and 5)
Standard Standard Standard Collection of leaves
Row-41 Standard weekly (sprayed 5 times)
Standard Standard Standard Standard Standard Collection of leaves
Row-42 Control
Control Control Control Control Control Collection of leaves
Row-43 High weekly (sprayed 5 times)
High High High High High Collection of leaves
Row-44 High sprayed 2 times (weeks 1 and 5)
High High Collection of leaves
Row-45 Standard sprayed 2 times (weeks 1 and 5)
Standard Standard Collection of leaves
Row-46 Very high sprayed 3 times (weeks 1, 3 and 5)
Very high Very high Very high Collection of leaves
Row-47 Very high weekly (sprayed 5 times)
Very high Very high Very high Very high Very high Collection of leaves
Row-48 Control
Control Control Control Collection of leaves

192
Appendix-3: Randomised distribution of the treatments, date of application of the treatments and leaf collections from different rows of block C and D (different varieties) (Chapter3)
Block Variety Row numbers and treatments
Application of the treatments date Leaf collection
Week 1 16.10.09
Week 2 23.10.09
Week 3 30.10.09
Week 4 7.11.09
Week 5 14.11.09
Week 6 21.11.09
C Symphony Row-13 Standard (5 sprays)
Standard Standard Standard Standard Standard Collection of leaves
Symphony Row-14 Control
Control Control Control Control Control Collection of leaves
Symphony Row-15 High (5 sprays)
High High High High High Collection of leaves
Elsanta Row-16 High (5 sprays)
High High High High High Collection of leaves
Elsanta Row-17 Standard (5 sprays)
Standard Standard Standard Standard Standard Collection of leaves
Elsanta Row-18 Control
Control Control Control Control Control Collection of leaves
D Rhapsody Row-19 Control
Control Control Control Control Control Collection of leaves
Rhapsody Row-20 High (5 sprays)
High High High High High Collection of leaves
Rhapsody Row-21 Standard (5 sprays)
Standard Standard Standard Standard Standard Collection of leaves
Florence Row-22 Standard (5 sprays)
Standard Standard Standard Standard Standard Collection of leaves
Florence Row-23 High (5 sprays)
High High High High High Collection of leaves
Florence Row-24 Control
Control Control Control Control Control Collection of leaves

193
Appendix-4: Randomised distribution of the treatments, date of application of the treatments and leaf collections from different rows of block B, C and D(variety Elsanta)(Chapter 4)
Block Row numbers and treatments
Application of the treatments date Leaf collection
Week 1 7.06.10
Week 2 14.06.10
Week 3 21.06.10
Week 4 28.06.10
Week 5 5.07.10
Week 6 12.07.10
B Row-10 High applied 3 times (weeks 1, 3 and 5)
High
High High Collection of leaves
Row-11 Control
Control
Control Control Control Control Collection of leaves
Row-12 Standard applied 3 times (weeks 1, 3 and 5)
Standard
Standard Standard Collection of leaves
Row-13 High weekly (applied 5 times)
High
High High High High Collection of leaves
Row-14 Control
Control
Control Control Collection of leaves
Row-15 High applied 2 times (weeks 1 and 5)
High
High Collection of leaves
Row-16 Standard applied 2 times (weeks 1 and 5)
Standard
Standard Collection of leaves
Row-17 Standard weekly (applied 5 times)
Standard Standard Standard Standard Standard Collection of leaves
Row-18 Control
Control
Control Collection of leaves
C Row-19 Standard weekly (applied 5 times)
Standard Standard Standard Standard Standard Collection of leaves
Row-20 Control
Control
Control
Control
Control
Control
Collection of leaves
Row-21 Standard applied 3 times (weeks 1,
Standard Standard Standard Collection of leaves

194
3 and 5)
Row-22 High applied 2 times (weeks 1 and 5)
High High Collection of leaves
Row-23 High applied 3 times (weeks 1, 3 and 5)
High High High Collection of leaves
Row-24 Control
Control
Control
Control
Collection of leaves
Row-25 High weekly (applied 5 times)
High
High
High
High
High
Collection of leaves
Row-26 Standard applied 2 times (weeks 1 and 5)
Standard
Standard
Collection of leaves
Row-27 Control
Control
Control
Collection of leaves
D Row-28 High applied 2 times (weeks 1 and 5)
High
High
Collection of leaves
Row-29 Control
Control
Control
Collection of leaves
Row-30 Standard applied 3 times (weeks 1, 3 and 5)
Standard
Standard
Standard
Collection of leaves
Row-31 Standard weekly (applied 5 times)
Standard
Standard
Standard
Standard
Standard
Collection of leaves
Row-32 Control
Control Control Control Control Control Collection of leaves
Row-33 High weekly (applied 5 times)
High
High
High
High
High
Collection of leaves
Row-34 High applied 2 times (weeks 1 and 5)
High
High
Collection of leaves
Row-35 Standard applied 2 times (weeks 1 and 5)
Standard
Standard
Collection of leaves
Row-36 Control
Control Control Control Collection of leaves

195
Aspects of Applied Biology 106, 2011 Crop Protection in Southern Britain
Appendix-5: Published paper
Study the role of silicon in strawberries and its possible role in control
of strawberry powdery mildew
By KANEEZ FATEMA and AVICE HALL
School of Life Sciences, University of Hertfordshire, College Lane, Hatfield AL10 9AB, UK
Summary
Silicon has been shown to control a number of diseases. The physical effect of silicon on
strawberry plants is unknown. Omex SW7 is a silicon based wetter, which is used in the
application of potassium bicarbonate for the control of strawberry powdery mildew and
previous studies suggested that this combination has given enhanced control of strawberry
powdery mildew. There is evidence that leaf hairs involved in plant disease resistance.
This project investigated the uptake of silicon from the silicon based wetter into
strawberry plants. The physical effect of the silicon on leaf hair length and density was
also investigated. Three concentrations of silicon were used and three different timings
were used. Whilst the main study has used the variety Elsanta, other varieties have also
been used. The plants were assessed on a) silicon uptake over time, b) the density of leaf
hairs on upper and lower leaf surfaces, c) the length of leaf hairs on the upper and lower
surfaces, and d) accumulation of silicon in fruit. The principal findings include enhanced
levels of silicon in leaves and an additional level where there were multiple application of
silicon. On leaves with higher silicon levels there was an increased density of leaf hairs
and the leaf hairs were longer. Six months after treatment with silicon there were no
enhanced levels of silicon in the treated plants when compared with untreated controls.
Silicon accumulation was not found in harvested strawberry fruit after the application of
different concentrations of silicon. The different varieties of strawberry used showed
anatomical differences. Untreated leaves from Rhapsody had no hairs on the upper leaf
surface, but a low density of hairs was observed after treatment with silicon.
Key words: Strawberries, silicon, varietal differences, disease control, powdery mildew,
Omex
Introduction
Strawberry production in the UK is one of the success stories of intensification and
efficiency, as since the introduction of the use of polythene tunnels in the early 1990s
strawberry production has doubled whilst the hectarage has been halved. This is coupled with
very efficient production systems involving the delivery of water and fertilizer direct to the
growing plants with no evaporation. The use of polythene tunnels, however, tends to create
the environmental conditions (15°C to 30°C and 95% humidity, Dodgson et al., 2008a)

196
which are conducive to epidemics of powdery mildew (Podospheara aphanis). This has had a
major impact on strawberry production, requiring extensive use of fungicides to control these
epidemics. There is also pressure for the growers to produce the ‘perfect’ strawberries
without the use of pesticides. In order to achieve control of P. aphanis with reduced pesticide
use growers use some sprays of (food grade) potassium bicarbonate in the integrated control
programme (Dodgson et al., 2008). This is generally applied using a wetter to ensure a good
spread of the potassium bicarbonate. Anecdotal observations suggested that a silicon based
wetter had a synergistic effect with potassium bicarbonate in controlling P. aphanis on
strawberries. The work reported here aimed to explore possible explanations for this effect.
Silicon is absorbed into plants which are described as either silicon accumulators or non
accumulators. Strawberries are non accumulators of silicon (Epstein 1994). Silicon has been
shown to control a number of plant diseases and it is believed that silicon creates a physical
barrier which can restrict penetration of fungal hyphae and there is evidence that leaf hairs
are involved in plant disease resistance.(Kortekamp & Zyprian, 1999). Trichomes and
bristles, generally known as hairs, play an important role in protecting plants against fungal
attack (Kortekamp & Zyprian, 1999, Bonos et al., 2004). This project investigated the uptake
of silicon into strawberry plants and the effect of the absorbed silicon on leaf hair length and
density.
Material and Methods
A silicon wetter (Omex SW7) used to spray strawberries was used as the source of silicon
and the dose rate was based on multiples of the label recommendations. Experiments were
carried out in glasshouses and the treatments and timing of sprays are shown in Table 1.
Table 1 Treatment rates and spray timings
Treatment Timing
1 0.25% Omex SW7 (label rate) 27. 02mg/l si Weekly
Every 2 weeks
Every 4 weeks
2 2.5% Omex SW7 282.63 mg/l si Weekly
Every 2 weeks
Every 4 weeks
3 5% Omex SW7 538.60 mg/l si Weekly
Every 2 weeks
Every 4 weeks
4 Water only Weekly
Every 2 weeks
Every 4 weeks
5 Untreated Weekly
Every 2 weeks
Every 4 weeks

197
In this study, the Autoclave Induced Digestion (AID) method described by Elliott and Snyder
(1991) was selected for the determination of the silicon content of the leaves because of its
rapidity, simplicity and appropriate sensitivity. To quantify the effect of silicon on the density
and length of leaf hairs a 1cm² quadrat was used on the leaves and placed randomly six times
on the upper and lower surface of each leaf with a replicate of 20 leaves from each treatment.
The number of leaf hairs in each quadrat on the upper (adaxial) and lower (abaxial) leaf
surfaces was determined using a dissecting microscope. The lengths of 10 leaf hairs in each
quadrat were measured at x3 using a graticule. Statistical differences between treatments
were analysed by using Anova and differences between treatments were analysed by using
Tukey test in SPSS for windows (16 SPSS Inc).
Results
Leaves collected from strawberry variety Elsanta after different treatments showed different
levels of silicon concentrations (fig. 1). It was observed that there were significant differences
of silicon concentrations in different treatments. All treated plants showed significantly
higher (P < 0.05) silicon concentrations compared to that in leaves collected from the
untreated control and water-treated plants (fig. 1). Leaves collected from these control plants
show the background level of silicon in untreated strawberry plants and there were no
significant differences (P > 0.05) between the controls. The highest levels of silicon were
seen in leaves collected from the highest treatment (538.6 mg/l si) compared to all other
treatments.
Fig. 1 Concentrations of silicon in strawberry leaves (variety Elsanta) treated by silicon wetter. Bars
with different letters indicate significant differences (P < 0.05).
Timing influenced the silicon uptake by leaves (Fig. 1).The background level of silicon is
shown in the two controls. Results showed that plants treated more frequently resulted in
greater accumulations of silicon (fig. 1) with weekly application of all dose rates showing
significantly higher levels (P < 0.05) of silicon compared to 2-week and 4-week intervals of
applications. Figures 2 and 3 show the effect of silicon on leaf hair density. Observations
showed that there were increased numbers of leaf hairs on both upper and lower surfaces of
treated leaves. It was also found that there was a significant difference in number of leaf hairs
in different treatment groups. The observations (Figures 4 and 5) showed that silicon also had
an effect on the length of the leaf hairs on both upper and lower leaf surfaces. It was observed
that the length of leaf hair in 282.63 mg/l si treated leaves showed significantly (P < 0.05)
a
a d
e
a a
b
b
a a
c c
0 10 20 30 40 50 60 70 80 90
100
Control 27.02 mg/l si 282.63 mg/l si 538.60 mg/l si
Co
nce
ntr
atio
ns
of
silic
on
(m
g/L)
Treatments
weekly
2 Weekly
4 weekly

198
longer hairs compared with 27.02mg/l si treated leaves but significantly shorter (P < 0.05)
hairs than in 538.6 mg/l si treated leaves. Elsanta strawberries were grown on after silicon
treatment, through flowering to fruit production and then fruit and leaves were analysed for
silicon accumulation in the ripe fruits. Table 2 shows that the levels of silicon in the fruits
were not as high as in the sprayed leaves, though slightly above the control.
Fig. 2 Density of leaf hairs per 1cm² quadrat on upper surface of leaves in strawberry variety
Elsanta treated with silicon. Bars with different letters indicate significant differences (P <
0.05).
Fig. 3 Density of leaf hairs per 1cm² quadrat on lower surface of leaves in strawberry variety
Elsanta treated with silicon. Bars with different letters indicate significant differences (P <
0.05).
Figures 7, 8, 9 and 10 show that silicon accumulated in the leaves of all strawberry varieties
tested and that the silicon enhanced the number and density of leaf hairs in all four varieties.
In the variety Rhapsody, which normally has no leaf hairs on the upper surface, the silicon
sprays appeared to stimulate leaf hair formation.
Discussion
The work reported here shows that though strawberry is a non-accumulator of silicon
(Takahashi et al. 1990) spraying with the silicon wetter (Omex SW7) onto the leaf surface
does result in accumulation of silicon in the leaves. Futhermore it also demonstrates that the
accumulation of silicon affects the physiology of the strawberry leaves resulting in the
a
b
d
g
a
b e
h
a c
f i
0 10 20 30 40 50 60 70 80 90
100
Control 27.02 mg/l si 282.63mg/l si 538.60 mg/l si
Ave
rage
no
of
hai
rs p
er c
m²
Treatments
weekly 2 weeks 4 weeks
a
c
f i
b d
g j
b e
h k
0 10 20 30 40 50 60 70 80 90
100
Control 27.02 mg/l si 282.63 mg/l si 538.60 mg/l si
Ave
rage
no
. of
hai
rs p
er c
m²
Treatments
weekly 2 weeks 4 weeks

199
formation of additional leaf hairs, which are longer than when the plants are untreated.
Furthermore this effect occurs on all varieties tested and on Rhapsody has the effect of
actually stimulating the production of hairs where there were none on the untreated control.
As reported by Kortekamp & Zyprian (1999) and Bonos et al. (2004), leaf hairs play an
important role in protecting plants against attack from fungal pathogens. The work reported
here shows that silicon applied as Omex SW7 stimulated leaf hair development and that this
may be a contributing factor in the observed synergistic effect between potassium bicarbonate
and the silicon wetter OMEX SW. This will be further examined in a field trial in the 2011
season.
Fig. 4 Length of leaf hairs on upper surface in strawberry variety Elsanta in silicon treated
leaves. Bars with different letters indicate significant differences (P < 0.05).
Three different varieties of strawberry (Elsanta, Rhapsody and Symphony) were used to
compare the effect of silicon on different varieties. Accumulation of silicon in the leaves was
measured as were leaf hair density and leaf hair length (methods as above). The treatments
were an untreated control, and two different concentrations of silicon 27.02 mg/l si and
282.63 mg/l si applied weekly.
Fig. 5 Length of leaf hairs on lower surface in strawberry variety Elsanta in silicon treated
leaves. Bars with different letters indicate significant differences (P < 0.05).
a b
d g
a c
e g
a c
f h
0
0.5
1
1.5
2
2.5
3
3.5
Control 27.02 mg/l si 282.63 mg/l si 538.60 mg/l si
Len
gth
of
leaf
hai
rs in
mm
Treatment
weekly 2 weeks 4 weeks
a b
e
h
a c
f
i
a d
g
j
0
0.5 1
1.5 2
2.5
3
3.5
Control 27.02 mg/l si 282.63 mg/l si 538.60 mg/l si
Len
gth
of
leaf
hai
rs in
mm
Treatments
weekly 2 weeks 4 weeks

200
Table 2. Comparison of silicon levels in leaves and fruits after treatments with silicon wetter
Treatment Concentrations of Si in
leaves (mg/l)
Concentrations of Si in fruit
(mg/l)
Control 7.5 0.625
27.02 mg/l si weekly 17.5 1.25
27.02 mg/l si every 2 weeks 10 0.625
27.02 mg/l si every 4 weeks 8.125 0.625
282.63 mg/l si weekly 26.25 1.25
282.63mg/l si every 2 weeks 20 0.625
282.63 mg/l si every 4 weeks 16.25 0.625
538.60 mg/l si weekly 33.75 1.875
538.60 mg/l si every 2 weeks 25 1.25
538.60 mg/l si every 4 weeks 18.75 1.25
Fig. 6 Concentrations of silicon in strawberry leaves in different varieties treated by silicon
wetter. Bars with different letters indicate significant differences (P < 0.05).
a d g
i b
e g
i c f h j
0 10 20 30 40 50 60 70 80 90
100
Elsanta Rhapsody Florence Symphony
Co
nce
ntr
atio
n o
f si
lico
n
(mg/
l)
Variety
Control
0.25% (27.02 mg/l si)
2.5% (282.63 mg/l si)

201
Fig. 7 Number of leaf hairs on upper surface of leaves treated by silicon wetter. Bars with
different letters indicate significant differences (P < 0.05).
Fig. 8 Number of leaf hairs on lower surface of leaves treated by silicon wetter Bars with
different letters indicate significant differences (P < 0.05).
Fig. 9 Length of leaf hairs on upper surface in different strawberry varieties in silicon treated
leaves. Bars with different letters indicate significant differences (P < 0.05).
a
0 d g
b
0
e
h
c
f
i
0 10 20 30 40 50 60 70 80 90
100
Elsanta Rhapsody Florence Symphony
Ave
rage
no
of
hai
rs p
er
cm²
Variety
control 0.25%(27.02 mg/l si) 2.5%(282.63 mg/l si)
a d g
j
b
e
h k
c
f
i l
0 10 20 30 40 50 60 70 80 90
100
Elsanta Rhapsody Florence Symphony Ave
rage
no
of
hai
rs p
er
cm²
Variety
control
0.25%(27.02 mg/l )si
2.5%(282.63 mg/l) si
a
0
d
f
b
0
e
g
c
0
e h
0
0.5
1
1.5
2
2.5
3
3.5
Elsanta Rhapsody Florence Symphony
Len
gth
of
leaf
hai
rs in
mm
Variety
control 0.25%(27.02 mg/l si) 2.5%(282.63 mg/l si)

202
Fig. 10 Length of leaf hairs on lower surface in different strawberry varieties in silicon
treated leaves. Bars with different letters indicate significant differences (P < 0.05).
References
Bonos S A, Casler M D, Meyer W A. 2004. Plant responses and characteristics associated
with dollar spot resistance in creeping bentgrass. Crop. Sc. 44:1763–1769.
Dodgson J. 2008. Epidemiology and sustainable control of Podosphaera aphanis (strawberry
powdery mildew) PhD thesis. University of Hertfordshire.
Dodgson J, Hall A M, Parker S. 2008a. Control of Strawberry Powdery Mildew under
protection. Factsheet 17/08 HDC.
Epstein E. 1994. The anomaly of silicon in plant biology. Proc. Natl. Acad. Sci. 91:11–17.
Kortekamp A, Zyprian E. 1999. Leaf hairs as a basic protective barrier against downy
mildew of grape. J. Phytopathology. 147:453–459.
Phillips D, Reid A. 2007. High and low tunnels in strawberry production. Department of
Agriculture and Food. Government of Western Australia.
Takahashi E, Ma, J F, Miyake Y. 1990. The possibility of silicon as an essential element
for higher plants. Comments Agric. Food Chem. 2:99–122.
a
c d g
b
c
e h b
c
f i
0
0.5
1
1.5
2
2.5
3
3.5
Elsanta Rhapsody Florence Symphony
Len
gth
of
leaf
hai
rs in
mm
Variety
control 0.25%(27.02 mg/l si) 2.5%(282.63mg/l si)
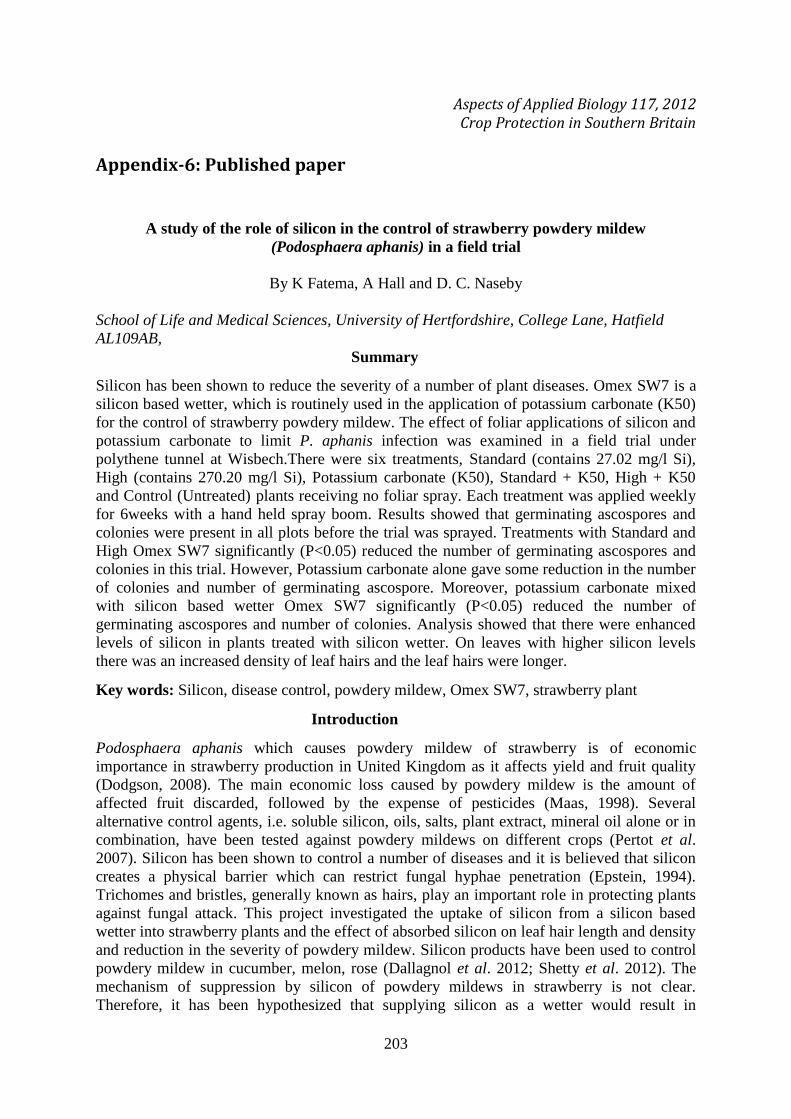
203
Aspects of Applied Biology 117, 2012 Crop Protection in Southern Britain
Appendix-6: Published paper
A study of the role of silicon in the control of strawberry powdery mildew
(Podosphaera aphanis) in a field trial
By K Fatema, A Hall and D. C. Naseby
School of Life and Medical Sciences, University of Hertfordshire, College Lane, Hatfield
AL109AB,
Summary
Silicon has been shown to reduce the severity of a number of plant diseases. Omex SW7 is a
silicon based wetter, which is routinely used in the application of potassium carbonate (K50)
for the control of strawberry powdery mildew. The effect of foliar applications of silicon and
potassium carbonate to limit P. aphanis infection was examined in a field trial under
polythene tunnel at Wisbech.There were six treatments, Standard (contains 27.02 mg/l Si),
High (contains 270.20 mg/l Si), Potassium carbonate (K50), Standard + K50, High + K50
and Control (Untreated) plants receiving no foliar spray. Each treatment was applied weekly
for 6weeks with a hand held spray boom. Results showed that germinating ascospores and
colonies were present in all plots before the trial was sprayed. Treatments with Standard and
High Omex SW7 significantly (P<0.05) reduced the number of germinating ascospores and
colonies in this trial. However, Potassium carbonate alone gave some reduction in the number
of colonies and number of germinating ascospore. Moreover, potassium carbonate mixed
with silicon based wetter Omex SW7 significantly (P<0.05) reduced the number of
germinating ascospores and number of colonies. Analysis showed that there were enhanced
levels of silicon in plants treated with silicon wetter. On leaves with higher silicon levels
there was an increased density of leaf hairs and the leaf hairs were longer.
Key words: Silicon, disease control, powdery mildew, Omex SW7, strawberry plant
Introduction
Podosphaera aphanis which causes powdery mildew of strawberry is of economic
importance in strawberry production in United Kingdom as it affects yield and fruit quality
(Dodgson, 2008). The main economic loss caused by powdery mildew is the amount of
affected fruit discarded, followed by the expense of pesticides (Maas, 1998). Several
alternative control agents, i.e. soluble silicon, oils, salts, plant extract, mineral oil alone or in
combination, have been tested against powdery mildews on different crops (Pertot et al.
2007). Silicon has been shown to control a number of diseases and it is believed that silicon
creates a physical barrier which can restrict fungal hyphae penetration (Epstein, 1994).
Trichomes and bristles, generally known as hairs, play an important role in protecting plants
against fungal attack. This project investigated the uptake of silicon from a silicon based
wetter into strawberry plants and the effect of absorbed silicon on leaf hair length and density
and reduction in the severity of powdery mildew. Silicon products have been used to control
powdery mildew in cucumber, melon, rose (Dallagnol et al. 2012; Shetty et al. 2012). The
mechanism of suppression by silicon of powdery mildews in strawberry is not clear.
Therefore, it has been hypothesized that supplying silicon as a wetter would result in

204
strawberry plants absorbing silicon and improved resistance against Podosphaera aphanis. A
field trial was designed to evaluate the effect of a silicon wetter on the severity of P. aphanis.
Materials and Methods Experimental design of the field trial
The effect of foliar applications of silicon and potassium carbonate to limit Strawberry powdery mildew infection was examined in a field trial in Polythene tunnel at Wisbech. Silicon wetter (Omex SW7-Omex Agrifluids Ltd) was used as the source of silicon. K50 (Potassium carbonate- Omex Agrifluids Ltd) used by the growers to decrease of disease incidence (Anon, 2012). Potassium carbonate does not have a harvest interval, so application of potassium carbonate with Omex SW7 is an ideal product to use at the time of fruit is being picked. Treatments were arranged in a randomised block design of 3 replicates. All treatments were applied to the strawberry variety Sonata. There were six treatments see table 1. The plot was sprayed weekly started 7th April until 11th May 2011. The first spray was applied on 7th April, 2nd spray was on 13th April and also on 20th April, 27th April, 4th May and 11th May. Leaves were collected for disease assessment on 7th April before spray and also on 28th April, 19th May and 10th June. In this trial 500ml was sprayed on each plot. Table 1. List of different treatments
Treatment no Name of the treatment
1 Untreated (Unt)
2 Standard (Omex SW7 at 0.25%) which contains 27.02 mg/l Si
3 High (Omex SW7 at 2.5%) which contains 270.20 mg/l Si
4 K50 (Potassium Carbonate) used at field rate
5 Standard + K50
6 High + K50
Microscopic assessment of P. aphanis from trial
To identify the P. aphanis symptoms 20 leaves were collected from each trial plot at each
sample date and assessed for visible P. aphanis symptom. Each leaf was then placed in Petri
dishes and submerged in 0.1% trypan blue stain (trypan blue in lactic acid) (Waller et al.
2002). Leaflets were left to stain for 24 hours at room temperature, after which they were
washed in water and cut into 4 strips (parallel to the mid rib). Of the 4 strips 2 were placed on
microscope slides upper surface up and 2 were placed lower surface up. The slide was placed
on the microscope stage and viewed at x100 magnification (Nikon, model YS100). One
transect of the leaflet strip was viewed. The number of germinating ascospore and the number
of distinct P. aphanis colonies were recorded. This was repeated for the remaining 3 strips
from each leaf.
Extraction of silicon and determination of leaf hair length and density
In this study, the Autoclave Induced Digestion (AID) method described by Elliott and Snyder
(1991) was selected for the determination of the silicon content of the leaves because of its
rapidity, simplicity and appropriate sensitivity. To quantify the effect of silicon on the density

205
and length of leaf hairs a 1cm² quadrat was used on the leaves and placed randomly six times
on the upper and lower surface of each leaf with a replicate of 20 leaves from each treatment.
The number of leaf hairs in each quadrat on the upper (adaxial) and lower (abaxial) leaf
surfaces was determined using a X30 magnification of dissecting microscope. The lengths of
10 leaf hairs in each quadrat were measured using an eyepiece graticule in the dissecting
microscope (X30). Data were analysed by linear model under the Mixed model in the
statistical software programme, SPSS for Windows, version 17 and subsequently, differences
between treatments were determined using LSD (Post-hoc test) in SPSS for windows version
17.
Results
Leaves were collected from all trial plots on 7th
April (2011) before the trial was sprayed this
showed that there were germinating ascospores and colonies on all plots (Fig. 1 & 2). There
were no visible symptoms of the powdery mildew infections but microscopic observation
showed that there were germinating ascospore and colonies present throughout the trial. The
environmental conditions (temperature and relative humidity in April and May 2011) were
not conducive to P. aphanis development (results not shown) but there was evidence that
germinating ascospore and colonies was present in all plots (Fig. 1 & 2). Treatments with
High plus K50 and Standard plus K50 gave the greatest reduction in disease.
Figure 1: Number of germinating ascospores on strawberry leaves (variety Sonata) from
different trial plots. The disease was assessed on 7th
April before beginning of
treatment/spray and also on 28th
April, 19th
May and 10th
June. Lower case letters indicate
significant differences (P<0.05) between treatments as indicated by LSD (Post-hoc test) in
SPSS for Windows, version 17.
Whilst potassium carbonate alone gave some reduction in the number of colonies, all
treatments with silicon gave a significant reduction (P<0.05) in colonies on 28th
April, 19th
May and 10th
June when compared with the untreated control. The trial was carried out early
in a year of very low disease pressure. There was very low disease pressure from 7th
April to
1st June when the prediction system showed that it took 54 days to accumulate 144 hours of
disease conducive conditions. This explains the lack of a visible epidemic.
Leaves collected on 7th
April before first spray and also on 28th
April, 19th
May and 10th
June
from strawberry plants showed different levels of silicon concentrations (Table 2). Results
also showed that the silicon concentration in the leaves collected on 7th
April (pre spray) was
a
c
e
b
d
f
0
1
2
3
4
5
6
7
8
9
10
7.4.11 28.4.11 19.5.11 10.6.11
Ave
rage
nu
mb
er
of
germ
inat
ing
asco
spo
re
Dates
Unt Standard High K50 Standard + K50 High + K50

206
the same in all treated and untreated plots. Concentration of silicon on the leaves collected on
7th
April showed the background level of silicon in all trial plots. However concentrations of
silicon were significantly different in the leaves collected on 28th
April in different treated
plots after the weekly application of different concentration of silicon and potassium
carbonate.
Figure 2: Number of colonies on strawberry leaves (variety Sonata) from different trial plots.
The disease was assessed on 7th
April before beginning of treatment/spray and also on 28th
April, 19th
May and 10th
June. Lower case letters indicate significant differences (P<0.05)
between treatments as indicated by LSD (Post-hoc test) in the statistical software programme,
SPSS for Windows, version 17.
There was no significant difference (P>0.05) found in silicon concentration in the leaves
collected from untreated and potassium carbonate treated plots. On 28th
April significant
differences (P<0.05) were observed in different treated plots such as Standard, High,
Standard+K50, High+K50 treated plots. Moreover the results also indicated that in the leaves
collected on 10th
June, concentrations of silicon were same as in the leaves collected on 19th
May. This result shows that the concentration of silicon did not decrease one month after the
final spray.
Table 2. Concentrations of silicon in strawberry leaves (variety Sonata) treated with different
concentrations of Omex SW7 and K50. Treatment 7.4.11
(mg/kg)
28.4.11
(mg/kg)
19.5.11
(mg/kg)
10.6.11
(mg/kg)
Untreated 1361 ± 155.4a 1356 ± 158.9
a 1353 ± 155.4
a 1350 ± 157.9
a
Standard 1333 ± 150.4a 1625 ± 203.9
b 1956 ± 258.3
c 1950 ± 318.3
c
High 1366 ± 152.3a 2291 ± 257.4
d 2625 ± 263.3
e 2611 ± 254.4
e
K50 1336 ± 158.1a 1333 ± 203.7
a 1335 ± 201.3
a 1333 ± 262.4
a
Standard+K50 1356 ± 155.6a 1833 ± 256.6
c 2125 ± 206.6
d 2111 ± 250.8
d
High K50 1357 ± 155.6a 2513 ± 256.2
e 2944 ± 257.8
f 2900 ± 300.7
f
Leaves were collected on 7th
April before beginning of treatment/spray and also on 28th
April,
19th
May and 10th
June. Means ± SE (n=6) followed by different letters indicate significant
differences (P<0.05) between treatments as indicated by LSD (post-hoc) analysis in the
statistical software programme, SPSS for windows version 17.
a
c
9
b
d
f e
0 1 2 3 4 5 6 7 8 9
10 11 12 13 14 15
7.4.11 28.4.11 19.5.11 10.6.11
Ave
rage
nu
mb
er
of
colo
nie
s
Dates
Unt Standard High K50 Standard + K50 High + K50

207
Leaves from untreated plots showed that the variety Sonata has more leaf hairs on the lower
than the upper surface (Table 3). All treatments with Omex SW7 showed significantly
(P<0.05) enhanced number of leaf hairs (Table 3). Observations showed that all treatments
with Omex SW7 also increased the length of leaf hairs (Table 4).
Table 3. Number of leaf hairs on upper surface (US) and lower surface (LS) of leaves
(Strawberry variety Sonata) collected from different trial plots after application of different
concentration of Omex SW7 and K50.
Treatments Surface Hair number Treatments Surface Hair number
Untreated US 4.08 ± 0.19a Untreated LS 25.05 ± 0.27
c
Standard US 6.25 ± 0.20a Standard LS 40.25 ± 0.72
e
High US 18.47 ± 0.21b High LS 65.00 ± 0.43
g
K50 US 4.04 ± 0.17a K50 LS 24.15 ± 0.25
c
Standard+K50 US 16.00 ± 0.31b Standard+K50 LS 50.08 ± 0.84
f
High+K50 US 30 ± 0.43d High+K50 LS 85.00 ± 0.81
h
(Means±SE, n=20) followed by different letters indicate significant differences (P<0.05)
between treatments as indicated by LSD (post-hoc) analysis in the statistical software
programme, SPSS for windows version 17.
Table 4: Length of leaf hairs on upper surface (US) and lower surface (LS) of leaves
(Strawberry variety Sonata) collected from different trial plots after application of different
concentration of Omex SW7 and K50.
Treatments Surface Hair Length
(mm)
Treatments Surface Hair Length
(mm)
Untreated US 0.654 ± 0.167a Untreated LS 1.01 ± 0.178
b
Standard US 1.004 ± 0.122b Standard LS 1.342 ± 0.291
c
High US 1.691 ± 0.136d High LS 1.99 ± 0.286
e
K50 US 0.712 ± 0.128a K50 LS 1.01 ± 0.291
b
Standard+K50 US 1.285 ± 0.115c Standard+K50 LS 1.525 ± 0.252
d
High+K50 US 2.153 ± 0.190e High+K50 LS 2.504 ± 0.232
f
(Means±SE, n=20) followed by different letters indicate significant differences (P<0.05)
between treatments as indicated by LSD (post-hoc) analysis in the statistical software
programme, SPSS for windows version 17.
Discussion
The work reported here showed that though strawberry is classified as a silicon non
accumulator plant (Miyake and Takahashi, 1986) application of silicon based wetter Omex
SW7 onto the leaf surface does result in accumulation of silicon in the leaves. The application
of Omex SW7 has stimulated an increase the number of leaf hairs and length of leaf hairs in
strawberry plants (Tables 3 & 4). It was also observed that Omex SW7 mixed with K50
significantly (P<0.05) reduced the number of germinating ascospore and number of colonies
(Fig.1 & 2). The results showed that there were germinating ascospores and colonies in the
leaves collected from all trial plots on 7th
April before spraying. Although there were no
colonies visible to the naked eye, microscopic observation showed that ascospores and
colonies were present throughout the trial. When the trial was done the temperature and
relative humidity was not conducive for growth and development of P. aphanis infection, so

208
no visible epidemic developed in the trial. The results indicated that application of Standard
and High concentrations of Omex SW7 on to the strawberry plants significantly (P<0.05)
reduced the number of germinating ascospores and the number of colonies. The above result
also indicated that potassium carbonate alone can give some reduction in the number of
germinating ascospores and number of colonies. Potassium carbonate mixed with a silicon
based wetter Omex SW7 can significantly (P<0.05) reduce the number of germinating
ascospores and colonies. These findings are supported by Kanto et al. (2007) who showed
that applying silicon (Potassium silicate) to strawberry plants results in physiological changes
of the strawberry leaves. As a result of these physiological changes, germination and
appressoria formation of mildew conidia was inhibited. The present study revealed that
silicon level can be enhanced by the application of Omex SW7, change the physical
properties of the leaves, such as increased number of leaf hairs and increased length of leaf
hairs and in this way help the plants to resist fungal infection. However, further work is
required to establish evidence for this protective effect under high disease pressure.
Acknowledgements
The authors would like to thank Harriet and Henry Duncafe (Maltmas Farm) for providing
field trial facilities, Gidon Bahiri (King’s Lynn, Norfolk) to supply Omex SW7 for this
experiment and Andy and Helen Barker for carrying out the spraying.
References
Anon. 2012. Agrifluids products.www.omex.co.uk/agrifluids/product
Dallagnol L J, Rodrigues F A, Tanaka F A O, Amorim L, Camargo L E A. 2012. Effect
of potassium silicate on epidemic components of powdery mildew on melon. Plant
Pathology. 61:323-33
Dodgson J. 2008. Epidemiology and sustainable control of Podosphaera aphanis (strawberry
powdery mildew). PhD thesis. University of Hertfordshire.
Elliott C L, Snyder G H. 1991. Autoclave Induced Digestion for the Colorimetric
determination of Silicon in Rice Straw. Journal of Agricultural and Food Chemistry. 39
(6):1118-1119.
Epstein E. 1994. The anomaly of silicon in plant biology. Proc. Natl. Acad. Sci.91:11-17.
Kanto T, Maekawa K, Aino M. 2007. Suppression of conidial germination and appressorial
formation by silicate treatment in powdery mildew of strawberry. Journal of General Plant
Pathology73:1-7.
Maas J L. 1998. Compendium of strawberry diseases (2nd
edition), Minnesota, The American
Phytopathological Society.
Miyake, Y., Takahashi, E. 1986. Effect of silicon on the growth and fruit production of
strawberry plants in a solution culture. Soil Science Plant Nutrition.32(2): 321-326
Pertot I, Zasso R, Amsalem L, Mario B, Angeli G, Elad Y. 2007. Integrating biocontrol
agents in strawberry powdery mildew control strategies in high tunnel growing systems. Crop
Protection 27:622-631.
Shetty R, Jensen B, Shetty N P, Hansen M, Hansen C W, Starkey K R, Jorgensen H J L.
2012. Silicon induced resistance against powdery mildew of roses caused by Podosphaera
pannosa. Plant Pathology. 61:120-131.
Waller J m, Lenne J M, Waller S J. 2002. Plant Pathologist’s Pocketbook (3rd
Edition).
Wallingford, CABI International.

209
Investigating the effect of foliar applications of soluble silicon and its possible role
in control of strawberrypowdery mildew
Kaneez Fatema, Avice Hall, David Naseby
University of Hertfordshire, College Lane, Hatfield, AL10 9AB, UK
Objectives
To determine if there are enhanced levels of silicon in strawberry
plants treated with silicon wetter (OMEX SW7). To identify whether the silicon supplement has any effect on the
anatomy of strawberry leaves.
Materials and methods
The silicon based wetter was sprayed at different concentrations to
the strawberry plants. Each treatment was applied in different timings. Enhanced level of silicon were quantified in washed leaves by the
Autoclave Induced Digestion (AID) method.3,4
Numbers of leaf hairs and length of leaf hairs were measured usinga dissecting microscope.
Introduction
● Soluble silicon induces both physiological andphysical changes, thereby increasing plant resistantagainst pathogen.1,2
In strawberry, the mechanism of suppressionagainst powdery mildew remains uncertain.● Omex SW7 is used as a wetter in the application ofpotassium bicarbonate and it has been reported bygrowers that this has given enhanced control ofstrawberry powdery mildew. We hypothesised that supplying soluble siliconwould help strawberry plants to absorb silicon andimprove resistance against the pathogen.
Results
Concentrations of silicon in strawberry leaves were increased by the addition of silicon
wetter (Figure 1). There was significant difference in concentrations in different treatments and in different
timings. There were higher levels of silicon in plants that were treated more frequentlyshown in figure 1.
Foliar applications of OMEX SW7 at a concentration of 5% in each week gave the highest
result in in terms of Si absorption. Microscopic observations of silicon treated leaves showed that there was increased densityof leaf hairs in upper (Figure 2) and lower surfaces (Figure 3) and increased length of leafhairs (Figure 4) on lower surface of leaves. The numbers of leaf hairs was more in 2.5% and 5% OMEX SW7 treated leaf compared to
other treatment groups. Enhanced levels of silicon was not observed in silicon treated leaves after six months.
Conclusions
There were enhanced levels ofsilicon in plants treated withsilicon wetter. The more silicon that isapplied, the higher the levels ofsilicon absorbed by the plant. Increased number of leaf hairsand increased length of leafhairs were found in 2.5% and5% treated leaves. There were increased numbersof hairs found on upper andlower surfaces of treatedleaves.
References1.Kanto T, Miyoshi A, Ogawa T,Maekawa K, Aino M (2004).Gen Plant Pathol, 70:207-211.2.Epstein E (1999). Annu RevPlant Physiol, 50 :641-64.3.Henry G.T, Diane Shogren,Gang L (2002). Commun. SoilSci. Plant Anal, 33:1661-70.4.Elliott C.L, Snyder G.H(1991). J Agric Food Chem,39:118-19.
Healthy plant Mycelium on leaves Red blotch Mycelium on fruit 0.25% 2.5% 5%
Symptoms of strawberry powdery mildew disease Silicon (OMEX SW7) treated leaves
0
10
20
30
40
50
60
70
80
90
100
Control Water 0.25% 2.50% 5%
Avera
ge n
o o
f hair
s p
er
cm
2
Treatments
a a a
b
c
0
10
20
30
40
50
60
70
80
90
100
Control Water 0.25% 2.50% 5%
Avera
ge n
o o
f hair
s p
er
cm
2
Treatments
a a
b
cd
0
100
200
300
400
500
600
700
800
900
1000
Control Water 0.25% 2.50% 5%
Concentr
ations o
f silic
on (
ppm
)
Treatments
weekly
2 Weekly
4 weekly
a a a a a a
bc
d
e
b c
f
g
e
Acknowledgement: The author wouldlike to thank Harriet and HenryDuncafe (Maltmas Farm) for providingstrawberry plant and Gidon Bahiri(King’s Lynn, Norfolk) to supply OMEXSW7 for this experiment.
Figure-1: Concentrations of silicon in strawberry leaves treated by silicon wetter.Bars with different letters indicate significant differences(P<0.05).
Figure-2: Number of leaf hairs on lower surface of strawberry leaves treated bysilicon wetter. Bars with different letters indicate significant differences(P<0.05).
Figure-3: Number of leaf hairs on upper surface of leaves treated by silicon wetter.Bars with different letters indicate significant differences (P<0.05).
Figure-4: Length of leaf hairs on lower surface of strawberry leaves. Bars withdifferent letters indicate significant differences (P<0.05).
0
0.2
0.4
0.6
0.8
1
1.2
1.4
1.6
1.8
2
Control Water 0.25% 2.50% 5%
Length
of le
af hair
s in m
m
Treatments
a ab
cd
Appendix-7: Poster for BSPP Conference 2009

210
Appendix -8
Study of the role of silicon in strawberries and its possible
role in control of strawberry powdery mildew
Kaneez Fatema, David Naseby and Avice Hall
University of Hertfordshire, School of Life Science, Hatfield, AL10 9AB
Introduction
*Soluble silicon induces both physiological and physical changes,
thereby increasing plant resistant against pathogen. ( Kanto et al.
2004; Epstein, 1990).
*Omex SW7 is a silicon based wetter, which is used in the
application of potassium bicarbonate for the control of strawberry
powdery mildew.
*Anecdotal observations suggested that a silicon based wetter had
a synergistic effect with potassium bicarbonate in controlling P.
aphanis on strawberries.
*The work reported here aimed to explore possible explanations for
this effect.
Objectives
*To investigate the uptake of
silicon in strawberry plants
treated with silicon wetter
Omex SW7.
*To determine the effect of
absorbed silicon on leaf hair
length and density.
*An assessment of the
silicon accumulation and
residues in harvested
strawberry fruits.
Materials and Methods
*The silicon based wetter was sprayed at different
concentrations to the strawberry plants.
*Each treatment was applied at different timings.
*Enhanced levels of silicon were quantified in
washed leaves by the Autoclave Induced Digestion
(AID) method.
*Numbers of leaf hairs and length of leaf hairs
were measured using a dissecting microscope.
Results
*Concentrations of silicon in strawberry leaves were
increased by the addition of silicon wetter..
*There was significant difference in concentration in different
treatment and in different timings.
There were higher levels of silicon in plants that were
treated more frequently shown in Fig.1.
Figure-1: Concentrations of silicon in strawberry leaves (variety Elsanta) treated
by silicon wetter. Bars with different letters indicate significant differences
(P<0.05).
*The highest levels of silicon were seen in leaves collected
from the highest treatment (538.6 mg/l si) compared to all
other treatments.
*Observations showed that there were increased numbers
of leaf hairs on both upper and lower surfaces of treated
leaves.
*It was also found that there was a significant difference in
number of leaf hairs in different treatment groups (Fig.2 & 3).
Figure-2: Density of leaf hairs on upper surface of leaves in strawberry variety
Elsanta treated with silicon. Bars with different letters indicate significant
differences.
Figure-3: Density of leaf hairs on lower surface of leaves in strawberry variety
Elsanta treated with silicon. Bars with different letters indicate significant
differences (P<0.05).
Figure-4 Length of leaf hairs on upper surface in strawberry variety Elsanta in
silicon treated leaves. Bars with different letters indicate significant difference
(P<0.05).
Figure-5: Length of leaf hairs on lower surface in strawberry variety Elsanta in
silicon treated leaves. Bars with different letters indicate significant differences
(P<0.05).
Table1: Comparison of silicon levels in leaves and fruits after
treatments with silicon wetter.
a
c
fi
b
d
g
j
be
h
k
0102030
40506070
8090
100
Control 27.02 mg/l si 282.63 mg/l si 538.60 mg/l si
Aver
age
no. o
f hai
rs p
er c
m²
Treatments
weekly
2 weeks
4 weeks
a
b
d
g
a
be
h
a
c
f
i
0102030405060708090
100
Control 27.02 mg/l si 282.63mg/l si 538.60 mg/l si
Aver
age
no o
fhai
rs p
er c
m²
Treatments
weekly
2 weeks
4 weeks
ab
d g
ac
eg
ac
f h
00.25
0.50.75
11.25
1.51.75
22.25
2.52.75
3
Control 27.02 mg/l si 282.63 mg/l si 538.60 mg/l si
Leng
th o
f lea
f hai
rs i
n m
m
Treatment
weekly
2 weeks
4 weeks
a
b
e
h
a
c
f
i
a
dg
j
00.25
0.50.75
11.25
1.51.75
22.25
2.52.75
33.25
3.5
Control 27.02 mg/l si 282.63 mg/l si 538.60 mg/l si
Leng
th o
f lea
f hai
rs in
mm
Treatments
weekly
2 weeks
4 weeks
Treatment Concentrations of Si in leaves (mg/l) Concentrations of Si in fruit (mg/l)
Control 7.5 0.625
0.25%( 27.02 mg/l si )(EW) 17.5 1.25
0.25%(27.02 mg/l si )(2W) 10 0.625
0.25%(27.02 mg/l si )(4W) 8.125 0.625
2.5%(282.63 mg/l si )(EW) 26.25 1.25
2.5%(282.63 mg/l si )(2W) 20 0.625
2.5%(282.63 mg/l si )(4W) 16.25 0.625
5%(538.60 mg/l si)EW) 33.75 1.875
5%(538.60 mg/l si)2W) 25 1.25
5%(538.60 mg/l si)4W) 18.75 1.25
*Silicon also had an effect on the length of
the leaf hairs on both upper and lower leaf
surfaces shown in figure 4 &5.
* It was observed that the length of leaf hair
in 282.63 mg/l si treated leaves showed
significantly (P<0.05) longer hairs compared
with 27.02 mg/l si treated leaves but
significantly shorter (P<0.05) hairs than in
538.6 mg/l si treated leaves.
*Elsanta strawberries were grown on after
silicon treatment, through flowering to fruit
production and then fruit and leaves were
analysed for silicon accumulation in the ripe
fruit.
*Levels of silicon in the fruits were not as
high as in the sprayed leaves, though
slightly above the control (Table-1).
Conclusions
•The principal findings include enhanced
levels of silicon in leaves and an additional
level where there were multiple application
of silicon.
*On leaves with higher silicon levels there
was an increased density of leaf hairs and
the leaf hairs were longer.
•Silicon accumulation was not found in
harvested strawberry fruit after the
application of different concentrations of
silicon.
Acknowledgement: The author would like to thank Harriet
and Henry Duncafe (Maltmas Farm) for providing
strawberry plant and Gidon Bahiri (King’s Lynn, Norfolk) to
supply OMEX SW7 for this experiment.
References
1.Kanto T, Miyoshi A, Ogawa T, Maekawa K, Aino M (2004).
Gen Plant Pathol, 70:207-211.
2.Epstein E (1999). Annu Rev Plant Physiol, 50 :641-64.
3.Henry G.T, Diane Shogren, Gang L (2002). Commun. Soil
Sci. Plant Anal, 33:1661-70.
4.Elliott C.L, Snyder G.H (1991). J Agric Food Chem,
39:118-19.
a a
de
g
a ab
b
f
a ac
c
e
0
10
20
30
40
50
60
70
80
90
100
Control Water 27.02 mg/l si 282.63 mg/l si 538.60 mg/l si
Conc
entr
atio
ns o
f sili
con
(mg/
L)
Treatments
weekly
2 Weekly
4 weekly

211
Introduction*Soluble silicon induces both physiological and physical changes, thereby
increasing plant resistance against pathogens (Kanto et al. 2004; Epstein,
1990).
*Omex SW7 is a silicon based wetter, which is used in the application of
potassium bicarbonate for the control of strawberry powdery mildew
caused by Podosphaera aphanis.
*Anecdotal observations suggested that the silicon based wetter had a
synergistic effect with potassium bicarbonate in controlling Podosphaera
aphanis on strawberries.
Objectives*To quantify the effect of silicon and potassium bicarbonate to limit the
development of strawberry powdery mildew.
*Identify the source of fungal inoculum responsible for initiating primary
outbreak of disease.
Materials and Methods*The effect of foliar applications of silicon (Si) and Potassium
Bicarbonate (PB) was examined in a field trial under polythene
tunnels.
*Treatments were arranged in a randomised block design of 3
replicates. All treatments were applied to the strawberry variety
Sonata.
*There were six treatments which consist of Untreated (Unt), Standard
(recommended field rate, Contains 27.02 mg/l si), High (contains
270.20 mg/l si), Potassium Bicarbonate (PB) contains 20gm/l,
Standard + PB, High + PB, Control plants receiving no foliar spray.
*The length, density of leaf hairs and number of germinating
ascospore as well as number of colonies assessed by the
dissection microscope.*The field trial was sprayed weekly from 7th April until 111h May, 2011.
*Silicon levels were measured from 8 leaves per plot using the AID
method (Elliott and Snyder, 1991).
Results *Results showed that germinating ascospores and
colonies were present throughout the trial on 7th April
before the first spray. Though there were no colonies
visible to the naked eye, ascospores and colonies were
found throughout the trial at this time(Fig.1 & 2).
*The untreated plots had germinating ascospores and
colonies throughout the trial. The levels of number of
germinating ascospores in plots treated with potassium
bicarbonate were similar to the controls throughout the
trial. Treatments with Si and Si and PB had no
germinating ascospores from 28th April onwards.
Colonies visible under the microscope was present
throughout the trial, on these treatments but number of
colonies decreased throughout the trial (Fig. 2).
*There was very low disease pressure
from 7th April to 1st June where the
prediction system (Fig.6) shows that it
took 54 days of accumulate of 144
hours of disease conducive conditions.
This explains the lack of a visible
epidemic.
*Observations showed that silicon
treated leaves had greater density and
length of leaf hairs in upper and lower
surfaces shown in figure 3& 4.
*Concentrations of silicon in strawberry
leaves were increased by the use of
silicon wetter (Fig.5).
*There was significant difference in
silicon levels between treatments .
Conclusions*Potassium bicarbonate alone cannot
reduce the number of germinating
ascospore and colonies whereas when
it mixed with silicon based wetter Omex
SW7 it significantly reduce the number
of germinating ascospore and
colonies.
References1.Kanto T, Miyoshi A, Ogawa T, Maekawa K,
Aino M (2004). Gen Plant Pathol, 70:207-
211.
2.Epstein E (1999). Annu Rev Plant Physiol,
50 :641-64.
3.Elliott C.L., Snyder G.H. (1991).J.Agric
Food Chem. 39:118-119.
AcknowledgementThe authors would like to thank Harriet and
Henry Duncafe (Maltmas Farm) for providing
field trial facilities, Gidon Bahiri (King’s Lynn,
Norfolk) to supply OMEX SW7 for this
experiment and Andy and Helen Barker for
carrying out the spraying.
Appendix-9 (Poster for BSPP Conference 2011)
Study of the role of silicon in control of strawberry
powdery mildew in strawberriesKaneez Fatema and Avice Hall
University of Hertfordshire, School of Life Science, Hatfield, AL10 9AB
Figure-5: Concentrations of silicon on strawberry leaves (variety Sonata)
collected from different trial plots.. Disease was assessed on 7th April before
the first spray and also on 28th April, 19th May and 8th June. Lower case letters
indicate significant differences (P<0.05) as indicated by Mixed model ANOVAs
using the general linear model.
Figure-2. Number of colonies on leaves collected from different trial
plots. Disease was assessed on 7th April before the first spray and also
on 28th April, 19th May and 8th June. Lower case letters indicate
significant differences (P<0.05) as indicated by Mixed model ANOVAs
using the general linear model.
Trial layout Polythene Tunnel Healthy leaves Cupped leaves Mycelium on leaf Germinating ascospore
Figure-1: Number of germinating ascospore on leaves collected from
different trial plots. Disease was assessed on 7th April before the first spray
and also on 28th April, 19th May and 8th June. Lower case letters indicate
significant differences (P<0.05) as indicated by Mixed model ANOVAs
using the general linear model.
Figure-3: Density of leaf hairs on lower surface of leaves in strawberry variety
Sonata collected from different trial plots. Lower case letters indicate significant
differences (P<0.05) as indicated by statistical method ANOVAs.
Figure-4: Length of leaf hairs on lower surface of leaves in strawberry variety
Sonata collected from different trial plots. Lower case letters indicate
significant differences (P<0.05) as indicated by statistical method ANOVAs.
Figure-6: Disease development prediction for Wisbech
fg
fg
fg
d d de
c bb ba a
0
5
10
15
20
Unt Standard High PB Standard + PB High + PB
Num
ber o
f ger
min
atin
g as
cosp
ore
Treatment
7.4.11
28.4.11
19.5.11
8.6.11
i j k k k k
g
df
hi i
f
bd c d
ef
a ab b b
0
2.5
5
7.5
10
12.5
15
17.5
20
Unt Standard High PB Standard + PB High + PB
Num
ber o
f col
onie
s
Treatment
7.4.1128.4.1119.5.118.6.11
ab
c
ab
d
0102030405060708090
100
Unt Standard High PB Standard + PB High + PB
Ave
rage
no
of h
airs
per
cm
2
Treatment
a
b c
a
bd
0
0.5
1
1.5
2
2.5
3
3.5
unt Standard High PB Standard + PB High + PBLeng
th o
f lea
f hai
rs in
mm
Treatment
a a aa a aa
bd
a f
h
a
c
e
a
g
i
ac
e
a
g
i
02468
101214161820
Unt Standard High PB Standard + PB High + PB
Conc
entr
atio
n of
sili
con
(gm
/kg)
Treatment
7.4.11 28.4.1119.5.118.6.11
25m Trial area
5 rows by 36 m
10m
172m