Academic Achievement, Academic Self-Concept, And Academic Motivation Of

The Effect of School Type on Academic Achievement: Evidence from Indonesia
David Newhouse International Monetary Fund
Kathleen Beegle World Bank
KEYWORDS: education, Indonesia, private JEL classifications: O12, O15, I21 World Bank Policy Research Working Paper 3604, May 2005 The Policy Research Working Paper Series disseminates the findings of work in progress to encourage the exchange of ideas about development issues. An objective of the series is to get the findings out quickly, even if the presentations are less than fully polished. The papers carry the names of the authors and should be cited accordingly. The findings, interpretations, and conclusions expressed in this paper are entirely those of the authors. They do not necessarily represent the view of the World Bank, its Executive Directors, or the countries they represent. Policy Research Working Papers are available online at http://econ.worldbank.org.
* Direct Correspondence: David Newhouse, IMF, 700 19th Street NW, Washington DC 2043; Phone: 202-623-5682; E-mail: [email protected]. We thank Elizabeth King, Joe Newhouse, two anonymous referees, and participants of seminars at the World Bank Resident Mission in Jakarta, Minnesota Development Economics Conference, and Cornell University for useful comments.
Pub
lic D
iscl
osur
e A
utho
rized
Pub
lic D
iscl
osur
e A
utho
rized
Pub
lic D
iscl
osur
e A
utho
rized
Pub
lic D
iscl
osur
e A
utho
rized
Pub
lic D
iscl
osur
e A
utho
rized
Pub
lic D
iscl
osur
e A
utho
rized
Pub
lic D
iscl
osur
e A
utho
rized
Pub
lic D
iscl
osur
e A
utho
rized

1
The Effect of School Type on Academic Achievement: Evidence from Indonesia
ABSTRACT Using data from Indonesia, this paper evaluates the impact of school type on academic achievement of junior secondary school students (grades 7-9). Students that graduate from public junior secondary schools, controlling for a variety of other characteristics, score 0.15 to 0.3 standard deviations higher on the national exit exam than comparable privately-schooled peers. This finding is robust to OLS, fixed-effects, and instrumental variable estimation strategies. Students attending Muslim private schools, including Madrassahs, fare no worse on average than students attending secular priva te schools. Our results provide indirect evidence that higher quality inputs at public junior secondary schools promote higher test scores.
INTRODUCTION
The existing evidence on how the characteristics of schools in developing
economies, including whether they are publicly or privately administered, affect students’
acquisition of cognitive skills is surprisingly mixed. The effect of educational policies in
general on learning in developing countries is poorly understood, as a recent survey on
the topic conceded that “most of what has been learned has been methodological” rather
than substantive (Glewwe, 2002). Better understanding of the effect of school
characteristics on learning is important because public policy can influence the
characteristics of public schools, as well as the cost of private schools through vouchers
and scholarships. As the first step towards understanding the determinants of student
achievement in Indonesia, this paper focuses on how the type of school attended by
junior secondary school students influences their academic achievement.
This study presents evidence that Indonesian public junior secondary schools are
more effective than their private counterparts at imparting cognitive skills, as measured

2
by students’ scores on the national test administered upon completion of junior secondary
school. We present a model in which households select a school type based on their
wealth and preference for academic achievement, which raises the prospect of selection
bias in empirical estimates of the effect of school type on test scores. Our empirical
results, however, suggest that after controlling for a large number of household
characteristics, selection bias due to parental preference for achievement is small. OLS,
fixed effects, and instrumental variables estimation methods indicate that public school
students have significantly higher exit scores than their privately schooled peers. We find
no evidence that private schools are more effective than public schools at raising test
scores.
We also examine the relative performance of Madrassah, Muslim non-Madrassah,
secular, and other religious schools, and find two tiers of performance. Students attending
public schools and the small number of students attending non-Muslim religious private
schools perform equally well, while students in secular and Muslim private schools each
fare worse by the same magnitude. In general, existing studies show that public junior
secondary schools appear to employ higher quality inputs. Our results therefore provide
indirect evidence that the higher quality of public school inputs promotes higher test
scores. Future research will hopefully lead to a better understanding of why public
schools outperform their private counterparts, by identifying the specific characteristics
of schools that explain this disparity.

3
BACKGROUND
Notwithstanding the Asian crisis in 1997-1998, schooling in Indonesia has been
characterized by rapid development since independence in 1945. Elementary school
enrollment increased steadily since the early 1970s, when it was around 76 percent, to
being nearly universal by 1995 (Ahuja and Filmer, 1996). This was fueled by a major
expansion of the availability of elementary schools in the early 1970s. While also
increasing in this period, enrollment rates at the junior secondary (grades 7-9) and senior
secondary (grades 10-12) levels remain at 75 to 80 percent. More recently, despite the
Asian financial crisis that hit Indonesia in late 1997 and early 1998, enrollment rates at all
levels were unchanged between 1997 and 2000 (see results in Pradhan, 2001, and Strauss
et al., 2004, drawn from two different sets of household surveys).
In Indonesia, focusing on junior secondary schools is appropriate for several
reasons. The universal enrollment achieved at the elementary level makes the junior
secondary level a focal point for efforts to increase school attainment in Indonesia and
achieve compulsory junior secondary education. At the same time, there are on-going
efforts aimed at decentralizing decision-making in the education system, devolving
authority from the centralized system to the district (kabupaten) level. Policy-makers at
the district level, in the presence of grant money, can benefit from studies that shed light
on which school types are effective. In addition, a better understanding of the
determinants of junior high school outcomes can also inform efforts to raise senior
secondary enrollment levels, since these outcomes presumably influence continuation to
and eventual graduation from senior secondary schools.

4
The Indonesia context is interesting in that it is atypical of the general consensus
in the literature that private schools are better (see evidence on academic performance in,
for example, Angrist et al, 2002, Cox and Jimenez, 1991, Evans and Schwab, 1995,
Jimenez et al., 1991, Neal, 1997). In Indonesia, evidence on inputs, as well as limited
information on per pupil expenditures, is consistent with longstanding perception of the
superiority of public schools over private schools. In terms of schooling inputs, Strauss
et al. (2004) and Serrato and Melnick (1995) generally point to higher quality inputs in
public schools, although private schools appear superior on two indicators. Private
schools offered lower student-teacher ratios in 1997 and 2000, and total household
expenditures on school fees and other schooling costs were higher for private school
students. Nonetheless, for the bulk of observed inputs, public schools look stronger.
Textbooks appear to be more available in public junior secondary schools than in private
ones, including textbooks that are borrowed or given for free. The average faculty
education at the junior secondary level is higher at public schools than private. At public
schools, teachers are significantly less likely to have a second job. Until they were
abolished in 1998, public school fees were actually higher than private fees on average.
Finally, there is limited evidence that public secular junior secondary schools have higher
funding per pupil (Asian Development Bank, 1997). Unfortunately, further data
regarding school financing are unavailable, making it impossible to evaluate the cost-
effectiveness of different school types. Overall, the weight of the evidence from past
research indicates that public schools use higher quality inputs.
Although public schools appear to use better inputs, two previous studies
conclude that in Indonesia, private schools are more effective and better-managed than

5
public schools. James et al. (1996) find that, after controlling for exiting test scores,
private elementary schools in Indonesia incur lower costs per pupil. They conclude that
private management is more efficient at achieving academic quality. A more recent study
goes further, and claims that students schooled at private secular secondary schools enjoy
a wage premium of 75 percent over their publicly schooled peers (Bedi and Garg, 2000).
However, neither study uses a plausibly exogenous source of variation to identify the
private school effect. James et al. (1996) identify the effect of school type using the
religious and demographic composition of its sub-district (kecamatan), which is assumed
to be orthogonal to schools’ per pupil spending. Bedi and Garg’s finding that private
schooling raises future adult earnings is based on the identifying assumption that an
adult’s province of birth is uncorrelated with the unexplained portion of their earnings.1
The implication of this last study, namely that private secular senior secondary
schools provide a more valuable education than public senior secondary schools, is
puzzling for two reasons. First, as noted above, public schools in Indonesia look stronger
on observed inputs and are widely perceived to be superior to secular and Muslim private
schools. Indeed, past studies such as Bedi and Garg (2000) confirm that public and
private Christian secondary schools attract observably stronger students. Second, some
public schools in urban areas screen applicants based on the score of their na tional test
following elementary school. Students at these schools benefit from a higher-scoring
peer group. The positive effect of private administration would have to outweigh these
peer effects, which appear to be important in other contexts (See Hoxby, 2000, and
Somers et al., 2003).
1 The finding in our study that selection bias is small with respect to the effect of school type on junior high school exam scores does not imply that selection bias was not present in these two studies, which used

6
MODEL
This section presents a simple model in which two countervailing sources of
selection bias may occur. Because public secondary schools appear to be superior to
private secondary schools in Indonesia, past work has focused on the potential for
positive selection of the best students into public secondary schools (Bedi and Garg,
2000). While the perceived higher quality of public schools is one source of bias, a
second source derives from wealthier households’ preference for private schools, ceteris
paribus.
Consider a two period model in which a parent selects a school in period 1. The
parent’s utility function is assumed to be concave and increasing in each period’s
consumption, and an increasing function of the student’s academic performance at the
end of period 1. The parent’s utility is also assumed to be an increasing function of non-
academic features of the school (such as its safety or proximity). The child returns a
portion of their income to the parent in period 2, which is consumed. We assume the
parent’s utility from the child’s attending school j takes the following simple functional
form:2
(1) ( ) ( ) jjjjj OAAYPYU γσκδ ++++−= 21 lnln .
different dependent variables and a smaller set of control variables. 2 The exact form of the utility function does not affect the results derived below, as long as utility is concave in consumption.

7
tY represents the household income in period t, which is exogenous with respect
to their choice of school type. Pj is the tuition of school j, and δ is the parent’s discount
rate. Aj represents the student’s academic achievement at the end of period 1, after
attending school j, which enters the parent’s utility function directly if σ is non-zero. The
household’s valuation of academic achievement is captured by σ , net of income gains
associated with that achievement. Meanwhile, jAκ represents the transfer from the child
to the parent in period two, which is assumed to be proportional to the academic ability of
the student. Finally, Oj represents other, non-academic characteristics of the school, such
as safety, religious affiliation, convenience, and discipline, that are valued by parents for
more than their contribution to academic achievement.
For simplicity, academic performance (school outcome) is assumed to be a
positive and linear function of three factors: the quality of the school (Qj), the parent’s
income in period 1 (Y1), and the degree to which parents directly value academic
performance (σ ).
(2) σbaYQA jj ++= 1 ,
We assume that parents who have higher income and value education more will
provide a household environment more conducive to learning, meaning that the
parameters a and b are positive. In addition, we assume for simplicity that σ, which
measures a parent’s taste for education, is positive and that household income Yt is
greater than tuition Pj, for all schools j.

8
Because public schools are generally considered to be superior on average to
private schools in Indonesia, we assume that pub priQ Q> . However, the set of schools
which a child can attend is typically constrained by the location of the household, and in
some cases, by the child’s score on the national test for elementary school graduates (the
Ebtanas test score). These constraints, along with other non-academic characteristics of
the school Oj, may lead parents to choose a private school even if higher quality public
schools exist. The child attends public school if the maximum utility of the set of pub lic
schools they can attend, U*pub , exceeds the maximum utility of the set of private schools
they can attend U*pri.
The difference in utilities between the best available public school and the best
available private option is:
(3) ( ) ( ) ( ) ( )*1 1 2 2ln ln ln lnpub pri pub priU Y P Y P Y A Y Aδ κ δ κ∆ = − − − + + − + +
( ) ( )pub pri pub priA A O Oσ γ− + − .
Appendix A shows that, under the assumption that Ppri > Ppub:
(4) *
0Uδ
δσ∆
> , and
(5) 1
*0
UY
δδ∆
< .
9
This model confirms the intuition a parent that places higher value on education is
more likely to send their child to public schools, which are assumed to be of higher
average quality. Meanwhile, holding other factors constant, the likelihood of attending
private school increases as the household’s wealth increases. In the U.S., where private
schools are generally considered to be higher quality, wealthier and more motivated
students select into private schools. In Indonesia, however, where in general public
schools are considered to be of higher quality, the two sources of selection bias are of
opposite sign. Thus, the direction and magnitude of bias in the OLS models is unknown,
and depends on the relative strength of unmeasured wealth and unmeasured motivation,
as well as the importance of these factors in determining students’ test score.
DATA
The primary data source for this study is the three full rounds of the Indonesia
Family Life Survey (IFLS1, IFLS2, and IFLS3) (see Frankenberg and Karoly, 1995;
Frankenberg and Thomas, 2000; Strauss et al., 2004). The first round of the survey
sampled 7,200 households in 1993; subsequent surveys attempted to re- interview these
households and households to which previous household members had relocated since
the original interview (“split-off” households). The 1993 sample was drawn from 321
randomly selected villages, spread among 13 Indonesian provinces containing 83 percent
of the country’s two hundred million people. The 321 villages were selected from the
sample frame of the 1993 SUSENAS, the national economic survey, and are located in
10
149 districts. The sample captures an impressive amount of Indonesia’s remarkable
ethnic and geographic diversity.
We analyze the national Ebtanas test scores of former junior secondary school
students. Data on test scores was collected in 1997 and 2000 from all household
members between the ages of 14 and 25 at the time of the interview. The survey asked
respondents to state their score on the test, if they took the exam, for the elementary,
junior, and senior secondary school levels. The survey also ascertained the type of school
attended at each level.
The sample consists of all students who reported, in either 1997 or 2000, taking
the junior secondary school test between 1990 and 2000. Of the 5,608 respondents that
reported taking the national junior secondary school exam between 1990 and 2000, 4,498
reported scores from both elementary and junior secondary schools. An additional 115
respondents were not included in the sample because they did not report the type or
district of the junior secondary school they attended, leaving a final sample consisting of
4,383 respondents.
This study also uses data on the presence of private schools, at both the district
and the village level, to identify the effect of school type on student’s test score. District-
level data on the presence of schools come from the 1998 round of annual census of
schools conducted by the Indonesian Ministry of Education. Eighty percent of the 42,000
secondary schools in Indonesia responded to this survey. Unfortunately, because of a
budgetary shortfall during the 1998 financial crisis, the education census did not record
detailed data on the characteristics of private schools. The only information recorded for
private schools were their private status and location. This information is used to

11
construct both the total number of junior secondary schools and the percentage of district
junior secondary schools that are public in the district.
We obtain village- level data on the percentage of schools that are private using
the 2000 IFLS, which like earlier IFLS rounds contains a complete roster of
neighborhood schools. This roster contains the schools that household members report
attending, as well as schools identified by community leaders but which are not attended
by the sample of survey households in the community. These community leaders were
not asked to provide information regarding the school type, however. Therefore, we
inferred the public or private status of schools listed on the roster, using the school
name.3
As a first step towards investigating how a student’s test score is affected by the
type of junior secondary school, Figure 1 shows students’ test scores exiting junior high
schools, smoothed against their test scores exiting elementary school, separately for
public and private junior high students. In Figure 1 and throughout the paper, students’
test scores are normalized using the scores of other students that took the national test in
the same year. The shaded regions indicate 95% confidence intervals. Conditional on
elementary test scores, students at public junior secondary schools score higher upon
exiting junior secondary school. Moreover, the difference in exiting test scores appears
to be greatest for students at the tails of the elementary test score distribution.
To further probe this initial finding, we control for other observed child and
family characteristics in a regression framework. Including control variables, however,
3 Public junior secondary schools in Indonesia are typically assigned a registration number. Therefore, any school name containing the Indonesian acronym for junior secondary school (SMP) followed by a number is designated as public. In addition, a school was also considered to be public if its name identified it as a
12
requires making a trade-off between the size of the sample and the availability of
particular household characteristics. Because test scores are provided retrospectively,
many respondents first appeared in an IFLS household several years after their graduation
from junior secondary school. For these respondents, time-varying househo ld
characteristics such as household consumption are not observed at the time they took the
test. Excluding these time-varying household characteristics may confound estimates of
the effect of junior secondary school type on test score. Therefore, we also present results
for two sub-samples. The junior secondary school sample consists of 2,733 respondents
who were interviewed within a year of their junior secondary school graduation. 4 When
this sample is used, the time-varying characteristics which are measured within a year of
taking the exam are included as control variables. The elementary school sample consists
of 1,948 students who are in the junior secondary school sample and were also
interviewed in a previous round of the survey. For these respondents, time-varying
characteristics such as household consumption are available both before and after the
student’s entry into junior secondary school. To ensure that omission of time-varying
variables does not affect the results, we present results for all three samples throughout.
public Madrassah (MTSN) or public technical school (SLTPN), or if its name contained the word “public” (negara or negeri). 4 The junior secondary sample consists of students who took the test in 1999 or 2000 and were interviewed in 2000, students who took the test between 1996 and 1998 and were interviewed in 1997, and students who took the test between 1992 and 1994 and were interviewed in 1993. The elementary school sample consists of students in the junior secondary sample that were also interviewed in a previous survey round.

13
Figure 1
-3-2
-10
12
3Jr
. Hig
h S
tand
ardi
zed
scor
e
-3 -2 -1 0 1 2 3Elementary Standardized score
Private Public45 degree line
Jr high score conditional on elementary score
Regressions using the full sample include, as control variables, a set of time-
invariant characteristics of the respondent:
• Academic achievement in elementary school: The (normalized) student’s
reported elementary school test score and its square, and whether the student
repeated a grade in elementary school.
• District characteristics: The average normalized elementary school test score
of all other students that attended school in that district, and the number of
total schools in the district.5
5 The average elementary school test score for a particular district is constructed by averaging the elementary test score of all other respondents that attended junior secondary school in the same district. For sixteen students in the full sample, no other respondent attended junior secondary school in their district, and the single student’s test score was used as the average.
14
• Family background: Parental education level, the family’s religion, and the
primary language spoken at home (as a proxy for ethnic background which is
not directly recorded).
• Location characteristics: The province in which the student attended junior
secondary school and whether the town in which the respondent lived at age
12 was a village, a small town, or a big city.
• Type of elementary school: The type of elementary school attended (public
secular, public Madrassah, private secular, private Madrassah, private Muslim
non-Madrassah, or private other)
• Student characteristics: Whether the respondent is female, and whether the
respondent worked while attending junior secondary school.
• Type of junior secondary school: Whether the junior secondary school
attended was a vocational school, and the type of junior secondary school
attended (public secular, public Madrassah, private secular, private
Madrassah, private Muslim non-Madrassah, or private other)
Regressions that use the junior secondary school sample include the following three
time-varying characteristics of the household:
• Household income/wealth: Household per capita expenditure and type of floor
in the dwelling.
• Student health: General health status (healthy, somewhat healthy, or
unhealthy).6
6 This question was not asked in 1993 and is therefore only available for half of the sample. Missing observations are grouped as a separate category.

15
The elementary school sub-sample adds the same time-varying characteristics as
the junior secondary school sub-sample, measured two to four years before the
completion of junior secondary school. 7 The means and standard errors of the full set of
covariates are presented in Appendix B.
To check the quality of the data on test scores and household characteristics, we
regressed the student’s normalized test score on the variables listed above, using the
junior secondary school sub-sample and variables. The results, which are presented in
Appendix C, are encouraging. The model explains nearly half of the total variation in
test scores, and the signs and magnitudes of the coefficients are reasonable. Academic
performance in elementary school and higher levels of parental education are associated
with higher test scores in junior secondary school. 8
DETERMINANTS OF SCHOOL TYPE
Before turning to the question of how school type affects academic performance,
we first examine the relationship between a student’s characteristics and the type of
school she chooses. While the determinants of school type are of interest in their own
right, they may also provide some guidance to the extent and nature of selection bias due
to unobserved student characteristics. Public schools, which are generally considered to
be superior to private schools in Indonesia, may attract more motivated students.
However, holding constant other characteristics of the household and schools, higher
household wealth should raise the probability that children attend private schools. To
7 For elementary school students, general health status is reported by the mother or primary caregiver.

16
examine the effect of household wealth and student academic ability on the type of
school attended, we use the junior secondary school sample to estimate a multinomial
logit regression of school type attendance. The dependent variable is an indicator of
whether the student attended public school, private secular school, private Muslim-
affiliated school, private Madrassah, or a private non-Muslim religious school. 9 There
are few students attending private non-Muslim religious schools; these schools include
Christian and Catholic private schools that are considered to be of comparable quality to
public schools.10 Therefore, we focus on the determinants of attendance at private
secular, Muslim-affiliated private schools, and Madrassahs. The entire set of household
and student characteristics listed in the data section are included as control variables, but
we report only the results from indicators of household wealth, the student’s prior
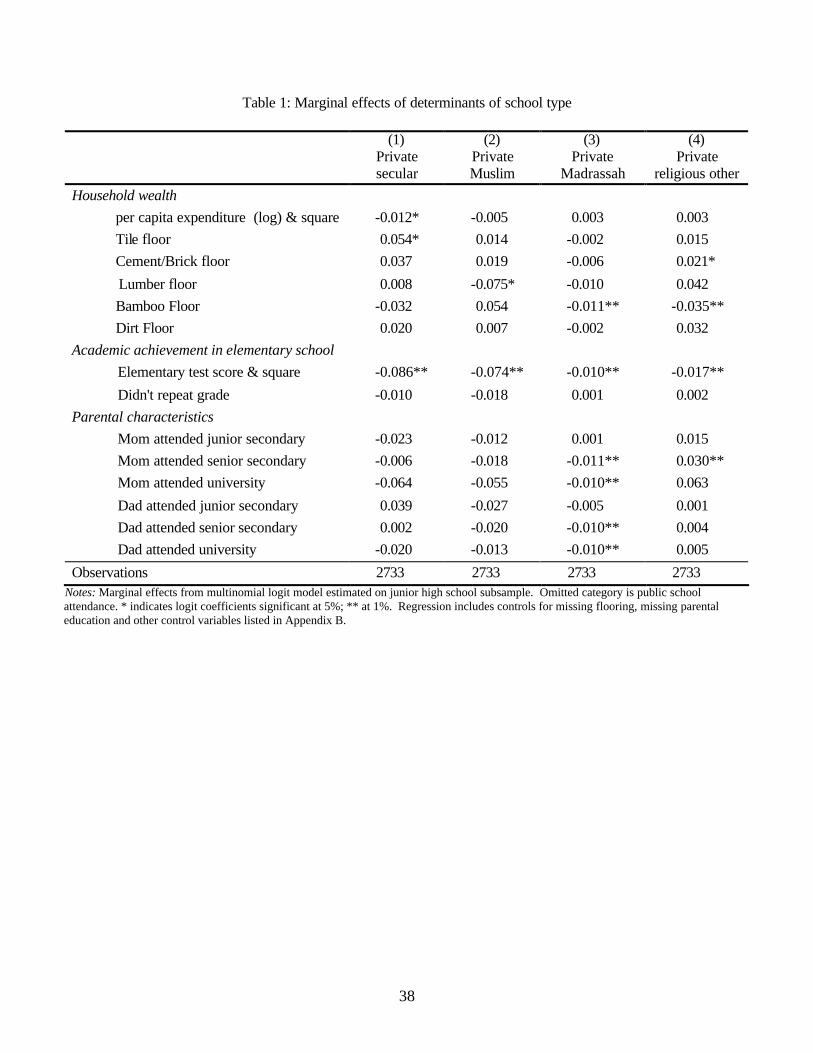
academic achievement and parental education. Table 1 reports the marginal effects of
each variable on the probability of attending a particular type of school, and whether the
variable was statistically significant in the multinomial logit model. For dummy
variables, the marginal effect is the sample average of the difference in the predicted
probabilities when the dummy variable is set to one or zero. For the test score and
consumption variables, we report the average of each observation’s marginal effects of
the variable and its square. For these variables, the significance of the variable and its
square were tested jointly.
8 The coefficients on the province dummies are as high as one standard deviation. These substantial provincial differences, which we do not attempt to explain, may be the topic of future research. 9 In this analysis, public Madrassahs are grouped with public secular schools for brevity. Only 7% of public school students attend public Madrassahs. 10 Three percent of the full sample and ten percent of the private-school attendees attend non-Muslim religious schools. Of these schools, about 60 percent of this category are Catholic schools, while the remaining 40 percent are Christian, Buddhist, or other religious affiliation. Christian schools are not restricted to Christian students. Private Catholic and Protestant secondary schools often enroll Muslim

17
The regression contains two measures of income or wealth: household per capita
consumption and the floor type of the house. After controlling for a wide variety of other
household characteristics, these indicators of income and wealth are weak determinants
of the type of junior secondary school attended. The marginal effect of log household per
capita consumption (-0.012) for private secular shows that a ten percent increase in
household per capita consumption lowers the probability of attendance relative to public
school by one tenth of a percentage point. Meanwhile, despite the theory that increased
wealth increases the probability of private school attendance ceteris-paribus, there is no
consistent pattern between the quality of the floor and the probability of attending private
secular or Muslim school.
The student’s past academic performance has a larger effect on the probability of
attending private school. An increase in the elementary school exam score of one
standard deviation lowers the probability of attending private secular school by nine
percentage points; the probability of attending private Muslim school falls by seven
percentage points, and the probability of attending a private Madrassah falls by one
percentage point. Grade repetition in elementary school also reduces in the probability of
attending a secular private school, although this effect is smaller and not statistically
significant. Likewise, parental education is generally not a strong determinant of school
type. Although the children of university-educated mothers are about 6 percentage points
less likely to attend private secular school or Muslim schools, these coefficients are not
statistically significant. Parental education is presumably correlated with student
motivation and, in results presented later, is shown to be a strong predictor of junior
students. In the data used, very few students switched schools at all, let alone switched between public and private schools, during their attendance at the junior secondary level.
18
secondary school test score. The relatively small effect of parental education suggests
that after controlling for lagged test scores, there may not be a large difference in student
motivation at different types of schools.
To sum up, household wealth has a weak, if any, discernable effect on the
household’s choice of school type. Students with higher elementary school test scores are
less likely to attend secular and Muslim private school. This confirms the widespread
impression that public schools in Indonesia tend to benefit from positive selection. If
selection on unobservable characteristics is similar to selection on observables, the effect
of selection of better students into public schools likely outweighs the selection of
wealthier students into private schools. If so, the estimated effects of public school
attendance on test scores will be biased upward. The next section turns to examining
estimates of the effect of public schooling on test scores.
THE EFFECT OF PUBLIC SCHOOLING ON TEST SCORES
Are public or private schools, on average, more effective at raising the test scores
of Indonesian junior secondary school students? To address this question, we regressed
the respondents’ normalized junior secondary test score on the control variables
described above, with school type represented by a dummy variable for public school
attendance. To conserve space, only the coefficient on school type is shown. Column one
of Table 2 indicates that public school students, in the presence of controls, score 0.19
standard deviations higher than private school students. The second specification
includes time-varying control variables measured within a year of junior high graduation,
19
which are only available for the junior secondary school sub-sample. The estimated
public school effect, which is reported in column two, increases to 0.23 standard
deviations in this specification. When time-varying variables measured around the
student’s elementary school graduation are added, the magnitude of the premium rises
slightly, to 0.27 standard deviations (Column three). The final specification (Column
four) includes family- level fixed effects, which identifies the public school effect using
siblings that attended different types of schools, and the estimated public school premium
is 0.24 standard deviations. 11 After controlling for a wide variety of student and parent
characteristics, regression estimates indicate that, on average, public school students have
test scores are 0.19 to 0.27 standard deviations higher than private schools students.
Of course, least squares estimates of the public school effect will be biased if
public school attendance is correlated with unobserved factors that determine test scores.
In the Indonesian context, the direction of this endogeneity bias is unclear in theory, as
described above. However, the correlation between observable characteristics and school
choice suggests that public schools benefit from positive selection, biasing the estimated
public school premium upward. Moreover, because parents choose schools separately for
each child within the household, partly on the basis of unobservable child characteristics,
the inclusion of family- level fixed effects does not eliminate this bias.
To address concerns regarding bias due to non-random sorting of students into
different types of schools, we estimate two-stage-least-squares models of test scores,
employing measures of the local availability of public schools as an instrument for public
school attendance. This approach has been used to estimate the effect of Catholic
11 Results of the fixed effects estimation strategy are not reported for the junior secondary school and elementary sub-samples, because there is little variation within family in the time -varying variables that are

20
schooling effect in the United States (see, for example, Neal, 1997, and Figlio and
Ludwig, 2000). The importance of availability of private schools in schooling choices
has been demonstrated in the developing country context (see, for example, Alderman et
al., 2001).
Data on the presence of public and private schools are available at both the district
and the village level. These two measures are moderately correlated, with a correlation
coefficient of 0.33. Using district- level information, we measure the percentage of
schools that are public in the district of junior high school attendance. For the sample of
students from the 321 original IFLS communities, we can measure the share of public
schools within 25 miles of the village center. This latter specification can only be
estimated on the sample of students that were interviewed in the same sub-district where
they attended junior secondary school.12
The consistency of the two stage least squares estimate is based on the critical
assumption that local private school proximity is uncorrelated with unobserved
determinants of student test scores. This assumption has been questioned in the US
context, where evidence suggests that proximity to catholic high schools is correlated
with unobserved determinants of 12th grade math and reading test scores (Altonji, Elders,
and Taber 2002). However, that conclusion is largely based on the implausibly large
differences between OLS and 2SLS estimates of the effect of Catholic schooling on
scores, which we do not find in the Indonesia data. Also, the location of American
included in these sub-samples. 12 In principle, considering only students that remained in the same sub-district that that they attended junior secondary school could cause selection bias. To probe this, we utilized the fact that student’s test scores are ranked based on their deviations from annual means, and estimated a Heckman two step model excluding the year the test was taken from the test score equation. The estimated public school premium remained essentially the same in the presence of the selection correction term, even though the years since the test was taken was strongly and positively correlated with whether the student had subsequently moved.
21
Catholic high schools is heavily influenced by historical pattern of past Catholic
migration (Hoxby, 1994), implying that the positive correlation between student
unobservables and proximity to American Catholic high schools does not generalize to
Indonesian private middle schools.
We note three additional factors that increase the plausibility of the identifying
assumption that proximity to public schools is uncorrelated with unobserved determinants
of test scores. First, the direction of bias due to endogenous school location decisions is
unknown. Second, the correlation between the public school access instruments and the
observed determinants of test scores is weak and negative. Finally, the correlation
between public school access instruments and a proxy for unobserved student motivation
is also weak, and in one case negative.
In contrast to OLS and fixed effects regressions, where selection bias likely leads
to an overestimate of the public school premium, it is not clear how the location decisions
of public and private schools will bias the estimated public school effect. If public
schools are spread uniformly throughout a population that is heterogeneous in its demand
for education, then profit-maximizing private schools will locate in areas where demand
for education, and therefore student achievement, is higher. In this case, the estimated
public school premium will be biased downward. This downward bias may be mitigated
or reversed by two factors. First, the national education department may maximize
educational achievement by locating public schools in areas with high students ability
(for an example of endogenous program placement, see Pitt et al., 1993). Second, the
estimated public school effect could be upwardly biased if private and/or Muslim schools
are more appealing to parents living in areas with undisciplined students. Concerns

22
regarding endogenous school placement are lessened to the extent that schools locate
based on characteristics of the population that are included in the model, such as average
district- level and student- level test scores. Nonetheless, theory provides no clear
guidance as to whether private schools are more common in areas with unobservably
stronger or weaker students.
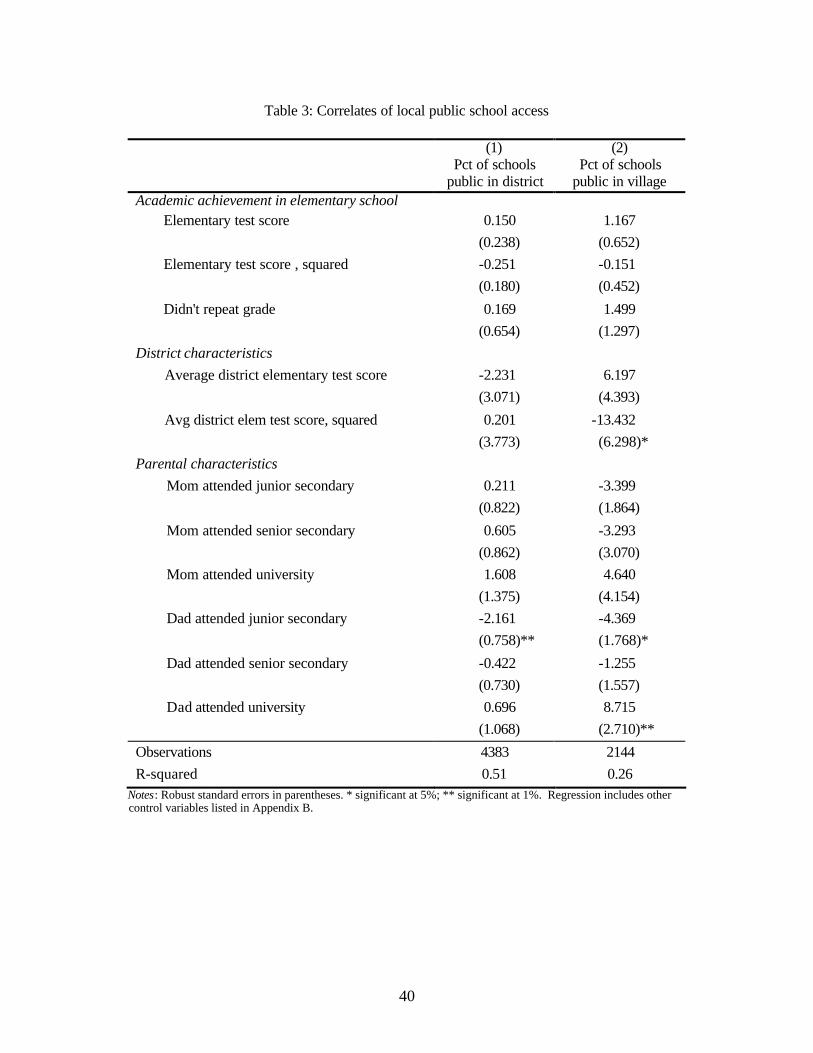
To gain some empirical insight into the location decisions of public and private
schools and possible bias in the 2SLS estimates, we regressed the district and village
measure of public school access on the all observed determinants of test scores. The
results for a subset of regression coefficients are reported in table 3. The correlation
between public school availability and observed elementary school academic
achievement is weak, and if anything, negative. The coefficients on the district
elementary test score and its square indicate that raising the district test score two
standard deviations from the mean is associated with a 3.7 point reduction in the
percentage of public schools in the district. At the village level, the negative relationship
is stronger, as raising districts with scores that are two standard deviations higher than the
mean is associated with a 30 point reduction in the percentage of public schools. The
percentage of public schools is positively, though weakly, correlated with the education
of the parents. If the weakly negative correlation between academic achievement and the
percentage of public schools extends to unobserved determinants of test scores, the two-
stage least squares estimates of the public school premium will be downwardly biased.
In the case of the village- level instruments, it may be substantially biased downwards.13
13 In addition to selection on type of school conditional on attending, there may be selection in school attendance. Since we condition on completed primary schooling (the vast majority of which is public), this pertains to students

23
Finally, we conduct an informal check to see if the mild negative correlation
between the instruments and the observed determinants of achievement extends to a
proxy for student motivation. In 1997, The IFLS asked students to report the amount of
hours they spent studying at home during junior high. Of course, home study time
partially reflects the quality of a particular school type, so this variable is omitted from
the test score regressions. However, the number of hours spent studying at home partly
reflects student motivation entering junior high school. To examine the potential for
inconsistency in the instrumental variable estimates, we reestimate the regression
reported in table 3 for students interviewed in 1997, adding a public junior high school
dummy and the number of hours spent studying at home (results not presented here). The
coefficient on study hours suggests whether, conditional on other observables and a
public school dummy, more diligent students live in areas with higher public school
availability.
The number of hours per week studying at home is weakly associated with public
school availability. When the percentage of schools that are public in the district is
regressed on all the variables in the model plus a public school dummy and study hours
outside of school, the coefficient on study hours is 0.04 and not statistically significant.
Thus, studying an additional 15 hours more per week (equal to two standard deviations)
is associated with a 0.6 percentage point increase in district public school availability.
When the percentage of pulbic schools in the village is used, the coefficient on study
hours is -0.05. Therefore, studying an additional 15 hours per week is associated with a
0.65 percentage point decline in village public school availability. Overall, these results
indicate that the availability of public schools is weakly correlated with an important,

24
albeit imperfectly measured, proxy for student motivation. This reduces the likelihood
that the local public school availability instruments are spuriously correlated with higher
test scores through unobserved student motivation.
Table 4 presents the instrumental variables results. When the district level
measure of access to private schools is used, the public school premium falls slightly to
0.19 for the full sample. The estimated premium rises to 0.31 when the junior secondary
sample is used, but falls to 0.15 in the elementary school subsample. None of the
instrumental variable estimates are statistically significant. The first stage F statistic on
these instruments ranges from 25 to 37, meaning that finite sample bias due to weak
instruments is not an important concern. 14 When the village- level presence of private
schools is used, the results are only estimated for the sub-sample of students that were
interviewed in the sub-district in which they went to junior secondary school. In
comparison to the district access instruments, the estimated public school premium stays
roughly the same in the full sample and the junior secondary sample, and rises
dramatically in the elementary school sample.15 The first stage F statistics for the village
level instrument are all above 22 in these regressions. We discount the results using
village-level instruments, because these instruments are more strongly correlated with
measures of academic achievement in Table 3, and more importantly, because the sample
excludes inter-subdistrict movers.
Taken as a whole, the results from regressions estimating the average effect of
public schools on test scores are consistent. Least squares estimates suggest a public
14 Of course, the estimates will be biased if the instruments are correlated with the test score residual. 15 The consistency between the district and village instrumental results, given the different patterns of correlation with observable academic achievement in Table 3, implies that correlations with observables does not extend to correlation with unobservable determinants of test score.

25
school premium which would raise a student’s test score 0.19 to 0.27 standard deviations.
Using district-level and village level access instruments generally results in similar
estimated effects, although the effect ranges from 0.15 to 0.41, depending on the sample
and the instrument. Because village- level access instruments were only available for a
selected subsample of non-movers, we view the estimates based on these instruments
with caution. Nonetheless, the similarity of the magnitudes of the OLS and the district-
level instrumental variable estimates suggest that in total, the endogeneity bias resulting
from parent’s choice of school type does not invalidate the qualitative conclusions drawn
from the OLS and fixed-effect estimates. Furthermore, the consistent finding of a positive
public school premium across all estimation strategies is strong evidence that public
junior secondary schools, on average, provide superior preparation for the national exam.
DIFFERENT TYPES OF PRIVATE SCHOOLS
We now turn to comparing the average effect of attending different types of
private junior secondary schools on test scores. We regressed students’ normalized score
on the junior secondary school test on an indicator of school type that distinguishes
between public Madrassah, private secular, private Madrassah, priva te other Muslim, and
non-Muslim religious schools, controlling for the student characteristics listed above.
Because the type of private school cannot be identified using the village data from the
IFLS or school census data from the Ministry of Education, instruments for this
regression were unavailable and only OLS and fixed effects results are presented. Table 5
presents these results. In the full sample, the disadvantage in test scores relative to public

26
school students is one-fourth of a standard deviation for secular private schools and
private Muslim schools, about 0.10 standard deviations for private Muslim Madrassahs,
and small and not significant for private other schools. The disadvantage is larger for the
junior secondary school and elementary school sub-samples. When family- level fixed
effects are included for the full sample, the disadvantage to private school secular and
Muslim students rises slightly to about 0.3 standard deviations. Overall, the results
suggest that there are two tiers of schools, with private secular and Muslim schools
lagging behind public schools and other private schools.
Is the positive effect of public schooling stronger for brighter students? Table 6
displays the results from an OLS regression on the full sample in which junior secondary
school type is interacted with the student’s elementary school test score quartile. For
students in the highest quintile, secular and Muslim private schooling is associated with a
-0.40 and a -0.45 reduction test scores, which is statistically significant at the 95% level.
Meanwhile, for students in the second and lower quartile, the coefficients on school type
are smaller. Some public schools in Indonesia, particularly in urban areas, screen
students based on their elementary school test score. The results suggests that, relative to
their privately schooled peers, the brightest public students benefit the most from this
sorting, while less intelligent public school students are not harmed by it.
THE IMPORTANCE OF THE ELEMENTARY SCHOOL TEST SCORE
Finally, we examine a secondary methodological question: How robust is the
baseline estimated effect of school type if the measures of elementary school
27
achievement are excluded from the model? Table 7 shows the public school premium for
each sample and methodology, with and without two variables measuring academic
performance in elementary school: the student’s elementary school test score (and its
square), and whether the student repeated a grade in elementary school. Excluding these
elementary school academic performance variables in a standard OLS regression
generally doubles the public school premium. Because elementary school performance is
strongly and positively associated with both public school attendance and subsequent
junior secondary school test performance, its omission creates substantial upward bias in
the estimated public school premium.
CONCLUSION
This paper focuses on how junior secondary school students’ choice of school
type influences their academic achievement. Students that attended public junior
secondary schools, controlling for other characteristics, have higher test scores upon
completion than those who attended private school. This finding is robust to three
different estimation strategies: OLS, family- level fixed effects, and the use of regional
measures of access to private schools as instruments for public school attendance. The
OLS estimates of the public school premium are all statistically significant and in the
range of 0.20 to 0.25 standard deviations, depending on the specification. Instrumental
variable estimates are not statistically significant, but the estimated public school
premium is generally similar; it ranges from 0.15 to 0.4 standard deviations. After
examining different types of public and private schools, two tiers of performance emerge.
28
Students in public school and non-Muslim religious private schools performed better than
students in Muslim schools and secular private schools. However, students attending
public Madrassahs performed no worse than those attending public secular schools, and
students attending private Madrassahs performed no worse than their counterparts in
private secular schools. The test score premium for public and non-Muslim religious
private schools is highest for the brightest students. Finally, not surprisingly, indicators
for achievement at the elementary school level are important covariates whose absence
from the model substantially alters the results.
This research is a first step towards understanding the effects of school type on
cognitive achievement in Indonesia. Recognizing the gaps in the existing literature, the
study assesses the returns to public junior secondary schooling in terms of test scores, in
light of the general finding that public schools use higher quality inputs. The findings
raise the interesting observation that despite lower average returns in test scores and
higher household expenditures, some parents choose to send their children to private
schools. Parents may choose private schools because public school enrollment is
rationed, because they prefer Islamic-based moral and religious instruction, or because
private schools are perceived to have other non-academic advantages. Future research
should examine the importance of these competing explanations. In addition, identifying
the specific aspects of quality that drive these higher scores will help in understanding
how and why public school students outperform their privately educated counterparts.

29
APPENDIX A
Proof that *
0Uδ
δσ∆
> , and 1
*0
UY
δδ∆
< .
The household chooses to send their child to a public school if the maximum utility from
the most desirable public school exceeds the maximum utility from the most desirable
private school. The difference in utilities between the most desirable public and most
desirable school is:
(A1) ( ) ( ) ( ) ( )*1 1 2 2ln ln ln lnpub pri
pub pri pub pri pub priU Y Y Y A Y A A A O Oδ κ δ κ σ γ∆ = − + + − + + − + − .
where
(A2) 1 1pub
pubY Y P= − ,
(A3) 1 1pri
priY Y P= − , and
(A3) 1j jA Q aY bσ= + + .
By assumption, Ppri > Ppub, which implies that 1 1pub priY Y>
Taking derivatives with respect to σ and Y1 gives:

30
(A4) ( )*pub pri
UA A b
δδ τ
δσ∆
= − + .
(A5) 1 1 1
* 1 1pub pri
Ua
Y Y Yδ
δ τδ∆
= − + .
Where τ can be written as:
(A6) 2 2
1 1
pub priY kA Y kAτ = −
+ +.
Substituting τ into (A4) and rearranging gives:
(A6) ( ) ( )( )2 2
** 1pub pri
pub pri
U bkA A
Y kA Y KAδ δ
δσ
∆ = − − + +
Equation (2) and the assumptions that a,b,σ are positive implies that:
(A7) b < Apub
This inequality, together with the assumptions that Y2 > 1, 0 < δ < 1, and A>0, implies
that:
(Α8) δbk < kA + Y2, and

31
(A9) 1 < Y2 + kApri
which means that *Uδ
δσ∆
is of the same sign as Apub – Apri, which is positive by
assumption.
Meanwhile,
1 1 1 2 2
* 1 10pub pri
pub pri
U a aY Y Y Y KA Y KA
δ δ δδ
∆= − + − < + +
Since 1 1pub priY Y> by assumption and Apub > Apri.

32
APPENDIX B
Sample Means
Academic Achievement in Junior High School Mean Standard Error
Junior high test score (normalized) 0.032 (0.029) Academic Achievement in Elementary School
Elementary test score (normalized) 0.055 (0.031) Didn't repeat grade* 0.825 (0.009)
Household wealth after Junior Secondary School Log PCE 3.306 (0.059) Tile floor* 0.338 (0.016) Cement/Brick floor* 0.364 (0.016) Lumber floor* 0.066 (0.009) Bamboo floor* 0.004 (0.001) Dirt floor* 0.089 (0.012)
District and village characteristics Average district Elementary test score 0.037 (0.023) # of schools in district 125.2 (4.208)
% of schools public in district 46.4 (0.906) % of schools public in village 55.1 (1.573) Parental Characteristics*
Mom attended junior secondary 0.149 (0.008) Mom attended senior secondary 0.126 (0.008) Mom attended university 0.031 (0.004) Dad attended junior secondary 0.164 (0.008) Dad attended senior secondary 0.205 (0.010) Dad attended university 0.064 (0.006) Christian 0.048 (0.007) Catholic 0.017 (0.003) Hindu 0.020 (0.005) Other 0.007 (0.002)
Student Characteristics* Female respondent 0.506 (0.008) Not working in junior secondary 0.932 (0.006) Somewhat healthy 0.392 (0.010) Somewhat unhealthy 0.031 (0.003) Residence at age 12: Small town 0.297 (0.015) Residence at age 12: Big city 0.139 (0.012)
Type of Elementary School* Public Madrassah 0.003 (0.001) Private Secular 0.031 (0.006) Private Muslim, not Madrassah 0.036 (0.005) Private Madrassah 0.030 (0.005) Private Other 0.028 (0.003)

33
Type of Junior Secondary School*
Vocational junior secondary 0.024 (0.003) Public Madrassah 0.043 (0.005) Private Secular 0.148 (0.010) Private Muslim, not Madrassah 0.081 (0.006)
Languages spoken at home* Indonesia 0.254 (0.015) Java 0.461 (0.019) Sunda 0.209 (0.014) Bali 0.014 (0.003) Batak 0.018 (0.004) Bugis 0.017 (0.005) Chinese 0.006 (0.002) Madura 0.051 (0.007) Sasak 0.013 (0.003) Minang 0.031 (0.006) Banjar 0.019 (0.004) Bima 0.005 (0.002) Makassar 0.007 (0.003) Nias 0.000 (0.000) Palembang 0.015 (0.005) Sumbawa 0.002 (0.001) Toraja 0.005 (0.003) Lahat 0.003 (0.002) Sumatra selatan 0.021 (0.006) Betawi 0.010 (0.002) Lampung 0.002 (0.001)
Location of Junior Secondary School* North Sumatra 0.047 (0.008) West Sumatra 0.034 (0.008) South Sumatra 0.047 (0.009) Lampung 0.041 (0.011) West Java 0.215 (0.023) Central Java 0.198 (0.024) Yogyakarta 0.036 (0.006) East Java 0.209 (0.024) Bali 0.020 (0.005) West Nusa Tenggara 0.018 (0.004) South Kalimantan 0.016 (0.004) South Sulawesi 0.032 (0.008) Other Province 0.002 (0.001)
* This is a binary variable, equal to 1 if true, else equal to 0.

34
APPENDIX C
Determinants of junior secondary school test score
Academic achievement in elementary school Elementary test score 0.44** Elementary test score, squared 0.08** Didn't repeat grade 0.23**
Household wealth after junior secondary school Log PCE after junior secondary 0.001 Log PCE after junior secondary, squared (/1000) 0.02 Tile floor -0.05 Cement/Brick floor -0.07 Lumber floor -0.25* Bamboo floor 0.05 Dirt floor -0.15
District characteristics Average district Elementary score 0.04 Average district Elementary score, squared -0.021 # of schools in district 0.001*
Parental characteristics Mom attended junior secondary -0.02 Mom attended senior secondary 0.09 Mom attended university 0.27* Dad attended junior secondary 0.08 Dad attended senior secondary 0.16** Dad attended university 0.33** Christian 0.04 Catholic 0.05 Hindu 0.21 Other 0.02
Student characteristics Female respondent -0.02 Not working in junior secondary 0.09 Somewhat healthy -0.05 Somewhat unhealthy -0.17* Residence at age 12: Small town 0.03 Residence at age 12: Big city -0.09
Type of elementary school Public Madrassah -0.15 Private Secular 0.17 Private Muslim, not Madrassah 0.20** Private Madrassah 0.21* Private Other 0.30*
Type of junior secondary school Vocational junior secondary -0.48** Public Madrassah -0.05 Private Secular -0.24** Private Muslim, not Madrassah -0.32** Private Madrassah -0.24** Private Other 0.02
35
Languages spoken at home
Indonesia 0.02 Java 0.11 Sunda 0.02 Bali 0.06 Batak -0.39** Bugis -0.04 Chinese 0.46* Madura -0.04 Sasak 0.03 Minang 0.05 Banjar 0.07 Bima 0.13 Makassar -0.77* Nias 0.000 Palembang -0.03 Sumbawa -0.26 Toraja -0.44 Lahat -0.41* Sumatra selatan -0.09 Betawi 0.11 Lampung -0.34
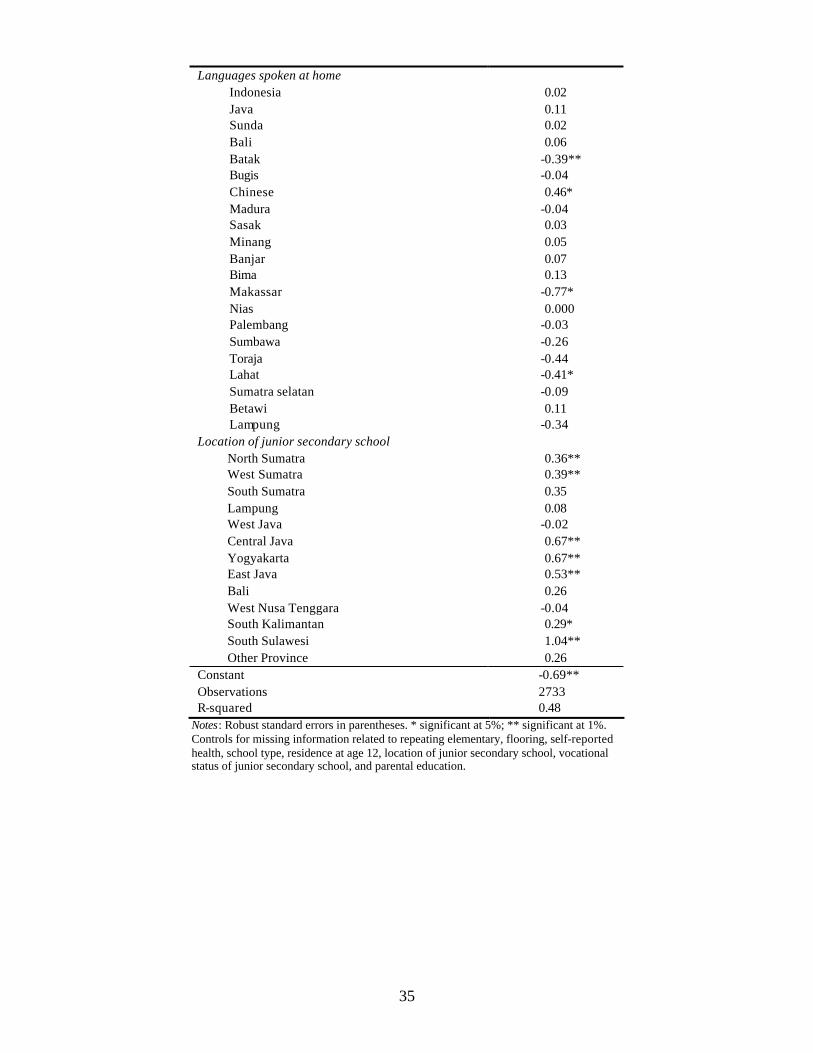
Location of junior secondary school North Sumatra 0.36** West Sumatra 0.39** South Sumatra 0.35 Lampung 0.08 West Java -0.02 Central Java 0.67** Yogyakarta 0.67** East Java 0.53** Bali 0.26 West Nusa Tenggara -0.04 South Kalimantan 0.29* South Sulawesi 1.04** Other Province 0.26
Constant -0.69** Observations 2733 R-squared 0.48
Notes: Robust standard errors in parentheses. * significant at 5%; ** significant at 1%. Controls for missing information related to repeating elementary, flooring, self-reported health, school type, residence at age 12, location of junior secondary school, vocational status of junior secondary school, and parental education.
36
REFERENCES Ahuja, Vinod and Deon Filmer. 1996. “Educational Attainment in Developing Countries,” Journal of Educational Planning and Administration 3: 229-54. Alderman, Harold, Peter Orazem, and Elizabeth Paterno. 2001. “School Quality, School Cost, and the Public/Private School Choices of Low-Income Households in Pakistan,” Journal of Human Resources 36: 304-326. Altonji, Joseph, Todd Elder, and Christopher Taber, 2002, “An Evaluation of Instrumental Variables for Estimating the Effects of Catholic Schools”, NBER working paper 9358. Angrist, Joshua, Eric Bettinger, Erik Bloom, Elizabeth King, and Michael Kremer, “Vouchers for Private Schooling in Colombia: Evidence from a Randomized Natural Experiment”, American Economic Review 92: 1535-1558 Asian Development Bank. 1998. “Financing of Education in Indonesia,” eds. Mark Bray and R. Murray Thomas. Bedi, Arjun and Ashish Garg. 2000. “The Effectiveness of Private Versus Public Schools: the Case of Indonesia,” Journal of Development Economics 61: 463-494. Cox, Donald and Emmanuel Jimenez. 1991. “The Relative Effectiveness of Private and Public Schools: Evidence from Two Developing Countries.” Journal of Development Economics 34: 99-121. Evans, William, and Robert Schwab. 1995. “Finishing High School and Starting College: Do Catholic Schools Make a Difference?” Quarterly Journal of Economics 110:947-974. Figlio, David, and Jens Ludwig, 2000, “Sex, Drugs, and Catholic Schools: Private schooling and non-market adolescent behavior”, NBER working paper 7990. Frankenberg, Elizabeth and Lynn Karoly. 1995. “The 1993 Indonesian Family Life Survey: Overview and Field Report,” Publication No. DRU-1195/1-NICHD/AID, RAND, Santa Monica, CA. Frankenberg, Elizabeth and Duncan Thomas. 2000. “The Indonesia Family Life Survey (IFLS): Study Design and Results from Waves 1 and 2,” Publication No. DRU-2238/Volume 1/NIA/NICHD, RAND, Santa Monica, CA. Glewwe, Paul. 2002. “Schools and Skills in Developing Countries: Education Policies and Socioeconomic Outcomes,” Journal of Economic Literature 40(2): 436-482. Hoxby, Caroline M, 1994. “Do Private Schools Provide Competition for Public Schools?” NBER working paper no. 4978.

37
Hoxby, Caroline M. 2000. “Peer Effects in the Classroom: Learning from Race and Gender Variation,” NBER working paper no.7867. James, Estelle, Elizabeth King, and Asep Suryahadi. 1996. "Finance, Management and Costs of Public and Private Schools in Indonesia," Economics of Education Review 15(4): 387-398. Jepson, Christopher, “The Effectiveness of Catholic Primary Schooling”, Journal of Human Resources, 38(4): 928-941. Jimenez, Emmanuel, Marlaine Lockheed, and Vicente Paqueo. 1991. “The Relative Efficiency of Private and Public Schools in Developing Countries.” The World Bank Research Observer 6(2): 205-218. Neal, Derek. 1997. “The Effects of Catholic Secondary Schooling on Educational Achievement”, Journal of Labor Economics 15(1): 98-123. Pitt, Mark, Mark Rosenzweig, and Donna Gibbons. 1993. “The Determinants and Consequences of the Placement of Government Programs in Indonesia,” World Bank Economic Review 7(3): 319-348. Pradhan, Menno. 2001. “Basic Education Outcomes During Crisis An analysis Using the 1998-2000 SUSENAS.” mimeo. Serrato, Carl and Glen Melnick. 1995. “The Indonesian Family Life Survey: Overview and Descriptive Analyses of Population, Health and Education data,” Publication No. DRU-1191-AID, RAND, Santa Monica, CA. Somers, Marie-Andree, Patrick Mcewan. and Douglas Wilms. 2003. “How Effective Are Private Schools in Latin America?” Comparative Education Review, 48(1). Strauss, John, Kathleen Beegle, Agus Dwiyanto, Yulia Herawati, Daan Pattinasarany, Elan Satriawan, Bondan Sikoki, Sukamdi, Firman Witoelar. 2004. Indonesian Living Standards: Before and After the Financial Crisis Rand Corporation, USA and Institute of Southeast Asian Studies.
38
Table 1: Marginal effects of determinants of school type
(1) (2) (3) (4) Private
secular Private Muslim
Private Madrassah
Private religious other
Household wealth per capita expenditure (log) & square -0.012* -0.005 0.003 0.003 Tile floor 0.054* 0.014 -0.002 0.015 Cement/Brick floor 0.037 0.019 -0.006 0.021*
Lumber floor 0.008 -0.075* -0.010 0.042 Bamboo Floor -0.032 0.054 -0.011** -0.035** Dirt Floor 0.020 0.007 -0.002 0.032
Academic achievement in elementary school Elementary test score & square -0.086** -0.074** -0.010** -0.017**
Didn't repeat grade -0.010 -0.018 0.001 0.002 Parental characteristics
Mom attended junior secondary -0.023 -0.012 0.001 0.015 Mom attended senior secondary -0.006 -0.018 -0.011** 0.030** Mom attended university -0.064 -0.055 -0.010** 0.063
Dad attended junior secondary 0.039 -0.027 -0.005 0.001 Dad attended senior secondary 0.002 -0.020 -0.010** 0.004 Dad attended university -0.020 -0.013 -0.010** 0.005
Observations 2733 2733 2733 2733 Notes: Marginal effects from multinomial logit model estimated on junior high school subsample. Omitted category is public school attendance. * indicates logit coefficients significant at 5%; ** at 1%. Regression includes controls for missing flooring, missing parental education and other control variables listed in Appendix B.

39
Table 2: Effect of public school attendance on junior secondary school test score
(1) (2) (3) (4)
Specification: OLS OLS OLS Family fixed effects
Sample: Full sample Junior secondary
Sample and Variables
Elementary Sample and Variables
Full sample
Attended public junior secondary school 0.191 0.229 0.268 0.247
(0.029)** (0.038)** (0.043)** (0.090)**
Observations 4383 2733 1948 883 R-squared 0.45 0.48 0.51 0.75
Notes: Robust standard errors in parentheses. * significant at 5%; ** significant at 1%. Regression includes other control variables listed in Appendix B.
40
Table 3: Correlates of local public school access
(1) (2) Pct of schools
public in district Pct of schools
public in village Academic achievement in elementary school
Elementary test score 0.150 1.167 (0.238) (0.652) Elementary test score , squared -0.251 -0.151 (0.180) (0.452)
Didn't repeat grade 0.169 1.499 (0.654) (1.297)
District characteristics Average district elementary test score -2.231 6.197 (3.071) (4.393)
Avg district elem test score, squared 0.201 -13.432 (3.773) (6.298)* Parental characteristics
Mom attended junior secondary 0.211 -3.399 (0.822) (1.864)
Mom attended senior secondary 0.605 -3.293 (0.862) (3.070) Mom attended university 1.608 4.640 (1.375) (4.154) Dad attended junior secondary -2.161 -4.369 (0.758)** (1.768)*
Dad attended senior secondary -0.422 -1.255 (0.730) (1.557) Dad attended university 0.696 8.715
(1.068) (2.710)**
Observations 4383 2144 R-squared 0.51 0.26
Notes: Robust standard errors in parentheses. * significant at 5%; ** significant at 1%. Regression includes other control variables listed in Appendix B.

41
Table 4: Effect of public school attendance on test score
(1) (2) (3) (4) (5) (6) Sample: Full sample Junior
secondary sample
Elementary school sample
Full sample Junior secondary
sample
Elementary school sample
Instrumental variables:
district % of schools public
district % of schools public
district % of schools public
village % of schools public
village % of schools public
village % of schools public
Attended public junior secondary school
0.185 0.306 0.154 0.182 0.292 0.411
(0.298) (0.328) (0.375) (0.224) (0.265) (0.291)
Observations 4383 2733 1948 2144 1529 1150 R-squared 0.45 0.48 0.51 0.41 0.44 0.47
Notes: Robust standard errors in parentheses. * significant at 5%; ** significant at 1%. Regression includes other control variables listed in Appendix B.

42
Table 5: Effect of school type on test score
(1) (2) (3) (4)
Specification: OLS OLS OLS Fixed Effects Sample: Full sample Junior secondary
sample Elementary
school sample Full sample
Public Madrassah 0.054 -0.054 -0.117 0.116 (0.075) (0.080) (0.078) (0.185) Private :
Secular -0.220 -0.236 -0.307 -0.282
(0.040)** (0.051)** (0.060)** (0.110)* Muslim -0.255 -0.322 -0.367 -0.291 (0.048)** (0.065)** (0.081)** (0.117)* Muslim Madrassah -0.104 -0.238 -0.271 -0.070 (0.060) (0.064)** (0.066)** (0.166)
Other -0.036 0.018 -0.019 0.118 (0.073) (0.097) (0.110) (0.177)
Observations 4383 2733 1948 1078 R-squared 0.45 0.48 0.52 0.75
Notes: Robust standard errors in parentheses. * significant at 5%; ** significant at 1%. Regression includes other control variables listed in Appendix B.

43
Table 6: Effect of school type by elementary school test quartile
Quartile of elementary school test score 0-25th
percentile 25th-50th
percentile 50-75th
percentile 75th-100th percentile
Public Madrassah -0.053 0.348 -0.031 0.143
(0.099) (0.171)* (0.195) (0.164) Private:
Secular -0.127 -0.056 -0.167 -0.395 (0.050)* (0.070) (0.076)* (0.181)* Muslim -0.107 -0.202 -0.139 -0.453
(0.068) (0.091)* (0.104) (0.174)** Muslim Madrassah -0.064 -0.106 0.050 -0.039 (0.085) (0.107) (0.147) (0.239) Other -0.138 0.014 0.119 0.244
(0.144) (0.198) (0.193) (0.199)
Observations 4383 R-squared 0.46
Notes: Robust standard errors in parentheses. * significant at 5%; ** significant at 1%. Regression includes other control variables listed in Appendix B.

44
Table 7: Effect of school type excluding academic achievement in elementary school
(1) (2) (3) (4) (5) (6) Sample: Full Sample Junior Secondary Sample Elementary School Sample
Specification: Excluded Included Excluded Included Excluded Included Public Madrassah -0.209 0.054 -0.326 -0.054 -0.393 -0.117 (0.082)* (0.075) (0.086)** (0.080) (0.091)** (0.078)
Private : Secular -0.584 -0.220 -0.562 -0.236 -0.659 -0.307 (0.041)** (0.040)** (0.052)** (0.051)** (0.058)** (0.060)** Muslim -0.563 -0.255 -0.612 -0.322 -0.687 -0.367 (0.052)** (0.048)** (0.071)** (0.065)** (0.086)** (0.081)**
Muslim Madrassah -0.376 -0.104 -0.506 -0.238 -0.534 -0.271 (0.062)** (0.060) (0.070)** (0.064)** (0.073)** (0.066)** Other -0.305 -0.036 -0.226 0.018 -0.232 -0.019
(0.090)** (0.073) (0.124) (0.097) (0.145) (0.110)
Observations 4383 4383 2733 2733 1948 1948 R-squared 0.30 0.45 0.34 0.48 0.38 0.52
Notes: Robust standard errors in parentheses. * significant at 5%; ** significant at 1%. Excludes/Includes indicates if elementary school test score and an indicator for grade repetition at the elementary level are in the specification. Regression includes other control variables listed in Appendix B.