THE EFFECT OF REINFORCED-EPOXY COATING ON THE … · 2017-10-13 · THE EFFECT OF REINFORCED-EPOXY...
44
THE EFFECT OF REINFORCED-EPOXY COATING ON THE BENDING MODULUS OF MICRO-CANTILEVER USING PHASE-SHIFT SHADOW MOIRÉ LIM JIUNN HSUH UNIVERSITI SAINS MALAYSIA 2012
Transcript of THE EFFECT OF REINFORCED-EPOXY COATING ON THE … · 2017-10-13 · THE EFFECT OF REINFORCED-EPOXY...
THE EFFECT OF REINFORCED-EPOXY COATING ON THE BENDING MODULUS OF MICRO-CANTILEVER USING
PHASE-SHIFT SHADOW MOIRÉ
LIM JIUNN HSUH
UNIVERSITI SAINS MALAYSIA
2012
THE EFFECT OF REINFORCED-EPOXY COATING ON THE BENDING MODULUS OF MICRO-CANTILEVER USING PHASE-SHIFT SHADOW
MOIRÉ
by
LIM JIUNN HSUH
Thesis submitted in fulfillment of the requirements for the degree of
Doctor of philosophy
December 2012

IPS/EXAM- 02(a)
UNIVERSITI SAINS MALAYSIAINSTITUT PENGAJIAN SISWAZAH
UNffEnsrn gArNs MALAYST.AINffiOFGNAMA?E SruDlB
Dekan/Deanlnstitut Pengajian SiswazahUniversiti Sains Malaysia11800 Pulau Pinang.
Pengisytiharan / Declaration
Saya isytiharkan bahawa kandungan yang dibentangkan di dalam tesis ini adalah hasil kerja sayasendiri dan telah dijalankan di Universiti Sains Malaysia kecuali dimaklumkan sebaliknya.
I declare that the contents presented in this thesis are my own work which was done at UniversitiSains Malaysia unless stated otherwise. Ihe thesis has not been previously submitted for any otherde{,ree.
Disaksikan oleh (Witnessed by):
Tandatangan Calon (Srginature of Candidate)
Nama Calon (Name of Candidate)
Ltnr SrrrilU Hsutl
No. Kad Pengenalan/No. Pasport :
lC" No/Passport No. ;
rarikh (Date), ............6.1 JY..*.t.*
Tandatangan Saksi
Nama Saksi (Name of Witness)
....S.N.k....,...f .!.'tr.h.t *.......GH.r.f.:,. C.P .J
No. Kad Pengenalan/No. Pasport :
IC. No/Passport No. :
i rarixn @ate) :............6.(1..*.2... s,L*t
I
IIs.__*_
l
l
I
I
-i l
f.tfj..'C.P$'J,
I
l: I
"l ,T-sltr 1
/ La tl.-- 1
:j'l s I ) o L o t- s ) '1 l rl? o
'J 0 7 6 I € l{
Untuk kegunaan lnstitut Pengajian SiswazahFor IPS use Only
Pengesahan Penerimaan oleh IPS : I Nama Staf: Tarikh:
KYlsab

ii
ACKNOWLEDGEMENT
I would like to express my gratitude and appreciation to my main project
supervisor Prof. Dr. Mani Maran Ratnam, for his motivation and assistance in this
project. I would like to thank for his valuable advice and supervision for this project.
His expertise and recommendation played an important role in the successful
completion of this project. Without his guidance, this project may not have been
completed on time. Besides, I would also like to express my gratitude to Assoc. Prof.
Dr. Ishak b. Hj. Abdul Azid and Assoc. Prof. Dr. D. Mutharasu, my co-supervisors
for their support, advice, motivation and help in this project.
In the meantime, I would like to thank for my parents for their immeasurable
love and support. For my wife, brother and sisters, I would like to thank for their
unlimited moral support. Finally, thank those who have helped me in this project.
iii
TABLE OF CONTENTS
Page
ACKNOWLEDGEMENT………………………………………………….……......ii
TABLE OF CONTENTS…………………………………………………………....iii
LIST OF TABLES……………………………………………………………..…….vi
LIST OF FIGURES..………………………………………………………………..vii
LIST OF ABBREVIATIONS……………………………………………………...xiii
LIST OF APPENDICES………………………..…………………………………..xiv
ABSTRAK……………………………………………..…………………………...xv
ABSTRACT……………………………………………………….........................xvii
CHAPTER 1 – INTRODUCTION
1.0 Research Background…………………………………………………….......1
1.1 Motivation of the Study………………………………………………………5
1.2 Problem Statement …………………………………………………………...6
1.3 Objectives of Study…………………………………………………………...7
1.4 Scopes of Study ………………………………………………………………7
1.5 Contributions …………………………………………………………………8
1.6 Thesis Outline………………………………………………………………...8
CHAPTER 2 – LITERATURE REVIEW
2.0 Overview……………………………………………………………………11
2.1 The Application of Optical Techniques in Deflection Measurement…….....11
2.2 The Characterization Technique for Micro-structures………………………21
2.3 The Applications of Polymer Materials in MEMS………………………….28
2.4 The Application of FEA in the Analysis of MEMS………………………...31

iv
2.5 The Effect of Coating to the Material Properties……………………………34
2.6 Chapter Summary………...…………………………………………………36
CHAPTER 3 – RESEARCH METHODOLOGY
3.0 Overview……………………………………………………………………39
3.1 Sample Preparation………………………………………………………….40
3.1.1 Miniaturized copper cantilever……………………………..……….40
3.1.2 Silicon micro-cantilever……………………………………….…….40
3.1.3 Reinforced-epoxy coated PET cantilevers……..……………………57
3.2 Experimental Setup………………………………………………………….61
3.2.1 Deflection measurement of miniaturized copper cantilever………...61
3.2.2 Deflection measurement of silicon micro-cantilever………………..63
3.2.3 Deflection measurement of reinforced-epoxy coated PET cantilever…………………………………………………………….65 3.3 Algorithm and Analysis……………………………………………………..65
3.3.1 Principle of the shadow moiré method……………………………...65
3.3.2 Phase-shifting and interferogram analysis algorithm……………….73
3.3.3 Image Enhancement Technique……………………………………..77
3.3.4 Deflection theory and determination of bending modulus…………79
3.4 Experimental Procedures……………………………………………………83
3.4.1 Determination of scaling factor in the imaging system……………..83
3.4.2 Deflection measurement of miniaturized copper cantilever………...85
3.4.3 Deflection measurement of silicon micro-cantilever………………..87
3.4.4 Deflection measurement on reinforced-epoxy coated PET cantilever……………………………………………………………89
3.5 Finite Element Analysis of Reinforced-epoxy Coated PET Cantilever…….90
3.5.1 Element selection……………………………………………………91

v
3.5.2 Modeling of reinforced-epoxy coated PET cantilevers…….…..…...98
3.6 Chapter Summary…………………………………………………………...99
CHAPTER 4 – RESULTS AND DISCUSSIONS
4.0 Overview…………………………………………………………………...101
4.1 Deflection Measurement of Miniaturized Copper Cantilever….………….101
4.1.1 Measurement accuracy…………………………………………….107
4.2 Deflection Measurement of Silicon Micro-cantilever…………..…………115
4.2.1 Image enhancement………………………………………………..117
4.2.2 Deflection measurement of silicon micro-cantilever………………120
4.2.3 The effect of using the average value of the cantilever thickness…122
4.2.4 Determination of the measurement accuracy……………………...124
4.2.5 Determination of bending modulus of cantilever material.………..135
4.2.5 Uncertainty analysis………………………………………………..139
4.3 Deflection Measurement of Reinforced-epoxy PET Micro-cantilever….…139
4.4 Modeling of Reinforced-epoxy Coated PET Cantilevers………………….146
4.5 Chapter Summary………………………………………………………….153
CHAPTER 5 – CONCLUSION AND FUTURE WORK
5.0 Overview…………………………………………………………………...155
5.1 Conclusions………………………………………………………………...155
5.2 Contribution from the Research……………………………………………157
5.3 Limitation…………………………………………………………………..158
5.4 Recommendation for Future Works………………………………………..158
REFERENCES…………………………………………………………………….160
APPENDICES LIST OF PUBLICATIONS

vi
LIST OF TABLES
Page
Table 2.1 The major features of some popular optical methods applied for displacement measurement 19 Table 2.2 The values of Young’s modulus for silicon dioxide material at micro-scale conditions 22 Table 3.1 The average value of width and thickness of the
reinforced-epoxy coated PET cantilever 60
Table 3.2 Phase and range of values according to values in the Numerator and the Denominator in expression for arctangent φ 75
Table 4.1 The bending modulus calculated from different loads and
the corresponding uncertainties 107 Table 4.2 The surface profile measured using profile projector 108 Table 4.3 The comparison among the results from optical measurement,
profile projector measurement and theoretical value of the cylinder surface profile 115
Table 4.4 The deflection of free end of the cantilever models under loading 124 Table 4.5 The actual deflection at free end before white-painted 128 Table 4.6 The actual deflection at free end after white-painted 134 Table 4.7 The difference and standard deviation of the deflection profiles
before and after painting 135 Table 4.8 The comparison of the measurement results obtained from
Alicona System and PSSM 137 Table 4.9 The bending modulus calculated from the deflection results
obtained from Alicona and PSSM method 138 Table 4.10 The bending modulus of the epoxy coated PET cantilever 145 Table 4.11 The displacement results of reinforced-epoxy coated PET
micro-cantilever with load of 0.1 N 149
vii
Table 4.12 The Gradient of the deflection curves 151
LIST OF FIGURES Page
Figure 2.1 The optical layout for optical interferometric technique 14 Figure 2.2 The Mireau interference objective technique 15 Figure 2.3 Schematic diagram of the phase shifting shadow moiré setup 18 Figure 2.4 The experimental setup for ISDG 23 Figure 2.5 Schematic of the ISDG 24 Figure 2.6 Experimental setup for optical interferometry 26 Figure 2.7 Fringe pattern on a micro beam in an accelerometer 26 Figure 3.1 Schematic of the copper cantilever with unknown bending
modulus 40 Figure 3.2 A typical design of an accelerometer. (a) The isometric view
(b) The detail dimensions of the accelerometer 41 Figure 3.3 The schematics of the steps in the fabrication process.
(a) Cross section A-A of the accelerometer. (b) The side view of the cross section A-A and a series of fabrication steps 45
Figure 3.4 Flow chat for the fabrication process of silicon micro-cantilever 47 Figure 3.5 The top and the bottom mask plotted in the negative form.
(a) Top mask. (b) Bottom mask 47 Figure 3.6 (a) The schematic diagram of the wafer and the cutting lines
(b) One of the four piece wafer after cutting 48 Figure 3.7 The Surface Optical System Filmatrics thin layer measurement
equipment 49
viii
Figure 3.8 The wafer after the wet oxidation process 50 Figure 3.9 The successful photo-resist development 50 Figure 3.10 The image of the wafer after the silicon dioxide at the open
windows is removed 51 Figure 3.11 (a) The etching process using KOH 25% at temperature 75°C.
(b) The bottom surface of the wafer after first KOH etching 52 Figure 3.12 The patterned photo-resist layer on the top surface of wafer 53 Figure 3.13 The image of the accelerometer structures after the second
etching 54 Figure 3.14 The serious over etching of the wafers.
(a) The serious over etching at the top surface of the wafer. (b) The serious over etching at the bottom surface of the wafer 54
Figure 3.15 The SEM photo for the fabricated cantilever.
(a) The top view of the cantilever. (b)The side view of the cantilever and measurement is done at the 20° tilted angle 56
Figure 3.16 The geometry analysis of the actual thickness of the cantilever
(cross-section view) 57 Figure 3.17 Sample preparation process for reinforced-epoxy coated
PET cantilever 58 Figure 3.18 The specimen prepared. (a) The PET sheet that is coated with
various reinforced-epoxy after curing. (b) Part of the specimens of reinforced-epoxy coated PET cantilever. (c) The cross-section view of the 30% graphite-epoxy coated PET cantilever 59
Figure 3.19 The experimental setup for the deflection measurement of
miniaturized copper cantilever. (a) Schematic of the copper cantilever with unknown bending modulus. (b) Image of the PSSM setup for copper cantilever deflection measurement 62
Figure 3.20 The experimental setup for the deflection measurement of
micro-cantilever 64
ix
Figure 3.21 (a) The undistorted grating with pitch p. (b) The distorted grating with the pitch p and carrying the distortion function f(x,y) 66
Figure 3.22 The infinite fringe moiré pattern formed by superimposed the
distorted grating with the undistorted grating 68 Figure 3.23 The finite fringe moiré pattern 68 Figure 3.24 Two types of grating orientations, (a) Vertical grating
(parallel to y-axis). (b) Horizontal grating (parallel to x-axis) 69 Figure 3.25 (a) Setup for shadow moiré technique. (b) The shadow moiré
pattern of a spherical surface 71 Figure 3.26 (a) Moiré pattern with 0 π phase-shifted. (b) 2/3 π phase-shifted.
(c) 4/3 π phase-shifted. (d) The phase map after applying phase-shifting algorithm. (e) The reconstructed surface profile after applying phase-unwrapping algorithm 77
Figure 3.27 The illustration of terms a, b, Imax and Imin in fringe pattern 78 Figure 3.28 The cantilever loaded with a point load at the free end 80 Figure 3.29 The schematic of the bending condition of the cantilever.
(a) The top view of the cantilever. (b) The loads applied to the cantilever (side view) 82
Figure 3.30 An image of Ronchi ruling that captured to determine the scaling
factor of the imaging system. (a) The entire image. (b) The magnified area of Ronchi ruling that consists of 10 line pairs 84
Figure 3.31 The flowchart of the various stages of the PSSM in
deflection measurement of the copper cantilever 86 Figure 3.32 The flowchart of the various stages of the PSSM in
deflection measurement of the silicon cantilever 87 Figure 3.33 Alicona imaging system. (a) The image during the measurement.
(b) The image of loading jig during experiment 89 Figure 3.34 The meshed cantilever models. (a) The cantilever model that is
meshed with SHELL91 element. (b) The cantilever model that is meshed with SOLID46 element 94

x
Figure 3.35 The displacement results. (a) The displacement result for the single layer shell element model. (b) The displacement result for the single layer solid element model 95
Figure 3.36 The displacement results. (a) The displacement result for the
double-layer shell element model. (b) The displacement result for the double-layer solid element model 97
Figure 3.37 The model of the Reinforced-epoxy coated PET
micro-cantilever 99 Figure 4.1 The 0 radian phase shifted image of the cantilever after loading 102 Figure 4.2 The result of deflection measurement of miniaturized copper
cantilever. (a) The 0 π radian phase-shifted fringe pattern. (b) The 2π/3 radian phase-shifted fringe pattern. (c) The 4π/3 radian phase-shifted fringes pattern. (d) The wrapped phase-map. (e) The unwrapped phase map. (f) The deflection profile at section A–A, B–B and C–C 104
Figure 4.3 The deflection of miniaturized copper cantilever. (a) The profile
before loading. (b) The profile after loading. (c) The comparison of the profile before and after loading. (d) The deflection profile obtained from PSSM (after subtraction) and the profile obtained from theory (E=60.65 GPa) 105
Figure 4.4 The schematic of the cylinder profile and the location of the
data points 108 Figure 4.5 The analysis area of the cylinder measured 109 Figure 4.6 The cylinder profile measurement results. (a) The 0 π
phase-shifted image. (b) The 2/3 π phase-shifted image. (c) The 4/3 π phase-shifted image. (d) The wrapped phase map. (e) The unwrapped phase (3-D representative). (f) The measured and theoretical cylinder surface profiles at the section A–A 111
Figure 4.7 (a) The measurement result from profile projector compared with theoretical value. (b) The phase-shift shadow moiré result
compared with the profile projector result. (c) The curve fitted phase-shift shadow moiré result compared with the profile projector result 113
xi
Figure 4.8 The low contrast fringe patterns of the silicon micro-cantilever after loaded with point loads. (a) Moiré fringes on the silicon cantilever after it is loaded with 0.0257N load. (b) The fringe pattern of the cantilever after loaded with 0.0368 N load 116
Figure 4.9 The intensity enhancement of poor contrast image. (a) The
histogram of the analysis area shown in Figure 4.8(a). (b) The intensity profile of section A–A in the original image. (c) The intensity profile of section A–A after contrast enhancement. (d) The intensity profile of section A–A after contrast enhancement and averaging filtered 119
Figure 4.10 The measurement results for silicon micro-cantilever using
PSSM method: (a), (b) and (c) are the original images with 0 π, 2π/3 and 4π/3 phase shifted, (d), (e) and (f) are the images from (a) to (c) after contrast enhancement, (g) the phase map, (h) the three-dimensional representative (unwrapped phase), (i) the deflection profile for section A-A before and after loading (0.0257 N), (j) the actual deflection profile for the applied loads of 0.0257 N and 0.0368 N respectively 122
Figure 4.11 (a) The image of silicon micro-cantilever before white-painted
and before loading. (b) The image of silicon micro-cantilever before white-painted and after loading 126
Figure 4.12 The surface profiles and deflection profiles measured (before
painted). (a) The surface profile of silicon cantilever before loaded. The surface profile measured after loaded with load 0.0257N. (c) The actual deflection profile obtained from subtraction of surface profiles before and after loading 127
Figure 4.13 The actual deflection profile (before painted) measured by the
load of 0.0368N 128 Figure 4.14 The image of the micro-cantilever after white painted 129 Figure 4.15 The paint thickness and the distribution of the white paint on
the surface of cross-section A-A 130 Figure 4.16 (a) The image of silicon micro-cantilever after painted and the
before loading. (b) The image of silicon micro-cantilever after painted and after loading with 0.0257N load 131
Figure 4.17 The deflection profile after white-painted. (a) The surface profile
xii
of silicon micro-cantilever before loading. (b) The surface profile measured after loading with load 0.257 N. (c) The actual deflection profile obtained from subtraction of surface profiles before and after loading 133
Figure 4.18 The actual deflection profile (after painted) for the load of
0.0358N 134 Figure 4.19 The comparison of deflection profile before and after painting.
(a) The deflection profile using the 0.0257 N load. (b) The deflection profile using the 0.0368 N load 136
Figure 4.20 (a) The analysis area of the 30% graphite-epoxy coated PET
cantilever. (b) The low contrast fringe patterns and the corresponding irregular phase-map. (c) The phase-shifted images after contrast enhancement and the corresponding phase-map before loading. (d) The phase-shifted images after contrast enhancement and the corresponding phase-map after loading 140
Figure 4.21 (a) Three-dimensional surface profile before loading. (b) The
three-dimensional deflection profile after loading. (c) The actual deflection profile after subtraction of the profiles before and after loading 142
Figure 4.22 Graph of deflection versus distance along cantilever.
(a) Two-dimensional plots of profile before loading, after loading and the actual deflection profile, (b) The comparison of the deflection profile plotted from the measurement and the theoretical 143
Figure 4.23 Comparison of the bending modulus between the
aluminum-epoxy coating and the graphite-epoxy coating on PET cantilever 145
Figure 4.24 The deflection of the 30% graphite-epoxy coated PET cantilever.
(a) The contour plot of the deflection. (b) The comparison of deflection results from experimental and FEA 148
Figure 4.25 The trends of the deflection at free end of reinforced-epoxy
coated PET micro-cantilever when the thickness of coatings increased. (a) The trends of the deflections for various types of aluminum-epoxy coatings. (b) The trends of the deflections for various types of graphite-epoxy coatings 150
xiii
Figure 4.26 The deflection gradient of the various types of reinforced-epoxy PET cantilever 152
LIST OF ABBREVIATIONS
2-D – Two-dimensional
3-D – Three-dimensional
CCD – Charge coupled device
FEA – Finite element analysis
MEMS – Micro electro-mechanical system
PET – Polyethylene terephthalate
PSSM – Phase-shift shadow moiré

xiv
LIST OF APPENDICES
Appendix A – Dimensions of the silicon accelerometer
Appendix B – The detail description of the sample preparation steps
Appendix C – The processing algorithm for deflection measurement
Appendix D – The processing algorithm for cylinder profile measurement
Appendix E – The image enhancement processing algorithm
Appendix F – The excel spreadsheets to calculate the bending modulus and uncertainty Appendix G – Analysis of deflection of micro-cantilever that has various thicknesses

xv
KESAN SALUTAN DIPERKUKUH EPOKSI TERHADAP MODULUS
LENTURAN BAGI JULUR-MIKRO DENGAN MENGGUNAKAN KAEDAH
MOIRÉ BAYANGAN ANJAKAN FASA
ABSTRAK
Dalam rekabentuk dan analisis ke atas julur-mikro PET bersalutan diperkukuh epoksi,
kegunaan nilai modulus lenturan yang tepat dalam analisis adalah penting. Nilai
modulus lenturan yang tepat juga penting untuk mengkaji kesan salutan diperkukuh
ke atas julur-mikro ini. Kajian ini bertujuan untuk menggunakan kaedah moiré
bayangan anjakan fasa (PSSM) untuk mengukur pesongan julur-mikro PET
bersalutan diperkukuh epoksi supaya modulus lenturan bahan salutan boleh
ditentukan. Pada mulanya, PSSM dibangunkan untuk mengukur pesongan julur
tembaga yang kecil untuk mengkaji kebolehan kaedah ini untuk mengukur pesongan
mikro. PSSM kemudian diubahsuai dan dibaiki dengan menggunakan teknik-teknik
pemprosesan imej untuk meningkatkan kebolehlihatan pinggir-pinggir moiré yang
tidak jelas supaya dapat digunakan untuk mengukur pesongan julur silicon-mikro.
Spesimen silikon julur-mikro telah dibentuk dengan menggunakan teknik pemesinan
permukaan-mikro. Kaedah PSSM yang lebih baik telah berjaya digunakan untuk
memproses corak pinggiran moiré yang tidak jelas dilihat dan dapat memproses data
pesongan. Kajian mengenai kesan bahan salutan diperkukuh epoksi kepada julur-
mikro PET kemudian dilakukan. Sampel telah dihasilkan dengan cara menyalut
salutan aluminium-epoksi dan salutan grafit-epoksi ke atas kepingan PET melalui
acuan. Julur-mikro spesimen kemudian dibebaskan dengan cara memotong PET
bersama-sama dengan salutannya mengikut corak acuan. Pelbagai jenis salutan
xvi
diperkukuh epoksi telah didapati mempengaruhi modulus lenturan julur-mikro PET
yang bersalutan. Modulus lenturan didapati meningkat apabila peratusan aluminium
dan grafit di dalam epoksi meningkat. Kajian kesan bahan-bahan salutan telah
diperluaskan dengan menggunakan analisis unsur terhingga (FEA). Nilai modulus
lenturan bahan-bahan salutan yang ditentukan dari kerja uji kaji telah digunakan
sebagai parameter kemasukan dalam analisis dan tebal salutan telah diubah-ubah.
Siasatan daripada FEA mencadangkan bahawa ketebalan yang sesuai untuk salutan
diperkukuh epoksi adalah kira-kira 160 μm hingga 180 μm berdasarkan pada
kenaikan keanjalan. Kerja-kerja penyelidikan ini adalah banyak tertumpu kepada
penyediaan spesimen dan penambahbaikan kaedah PSSM dengan menggunakan
teknik pemprosesan imej, serta kajian kesan salutan pada julur PET. Penyelidikan
menunjukkan bahawa kaedah PSSM yang lebih baik mampu untuk mengukur
pesongan mikro dengan kesilapan minimum dan modulus lenturan julur-mikro boleh
diubah dengan menggunakan bahan-bahan salutan yang berlainan. Tanpa mengubah
dimensi utama julur-mikro, modulus lenturan julur-mikro boleh diubah oleh bahan-
bahan salutan dan oleh itu, julur-mikro dengan sensitiviti yang berlainan boleh
dihasilkan.
xvii
THE EFFECT OF REINFORCED-EPOXY COATING ON THE BENDING
MODULUS OF MICRO-CANTILEVER USING PHASE-SHIFT SHADOW
MOIRÉ
ABSTRACT
Applying an accurate bending modulus value of the material is important in the
design and analysis of the reinforced-epoxy coated PET cantilevers. This is because
the accurate bending modulus value is important in evaluating the effect of the
various coatings onto the micro-cantilever. This research is aimed at applying the
phase-shift shadow moiré method (PSSM) for the deflection measurement of
reinforced-epoxy coated PET micro-cantilevers in order to determine the bending
modulus of the micro-cantilever material. The PSSM was initially developed to
measure the deflection of a miniaturized copper cantilever and the feasibility of the
method was studied to measure micro-deflection. The PSSM was then modified and
improved using image processing techniques to enhance the poor visibility moiré
fringes before applying it to measure the deflection of a silicon micro-cantilever. The
silicon micro-cantilever specimen was fabricated using surface micro-machining
technique. The improved PSSM method was successfully applied to process poor
visibility fringe patterns and deflection data was extracted. A study on the effect of
different coating materials in the reinforced-epoxy coated PET micro-cantilever was
then carried out. The samples were fabricated by applying the aluminum-epoxy and
graphite-epoxy coatings on PET sheets through a mold. The micro-cantilevers
specimens were then released by cutting the PET with coating according to the
patterns of the mold. The various types of the reinforced-epoxy coatings were found

xviii
to affect the bending modulus of the coated PET micro-cantilevers. The bending
modulus increased as the percentages of the aluminum and graphite reinforcement in
the epoxy increased. The study of the effect of the coating materials were extended
by using the finite element analysis (FEA). The bending modulus values of the
various types of coating materials determined from experimental work were applied
as the input parameter and the thickness of the coatings were altered. The
investigation from the FEA suggested that the optimum thickness of reinforced-
epoxy coating is about 180 μm based on the increment of the stiffness. The research
work was focused on the specimen preparation and improvement of the PSSM
method with image enhancement technique, as well as the study of the effect of the
coating on PET cantilever. The research shows that the improved PSSM method is
capable of measuring the micro-deflection with minimum error and the bending
modulus of the micro-cantilever can be altered by using different coating materials.
Without changing the major dimensions of the micro-cantilever, the bending
modulus of the composite cantilever material can be varied and therefore micro-
cantilevers with different sensitivities can be produced.
1
CHAPTER 1
INTRODUCTION
1.0 Research background
Micro-electro mechanical systems (MEMS) consist of two major
components, which are the sensing (actuating) element and the signal transduction
unit. MEMS are widely applied for various applications, such as microwave and RF
communications, optical networking, and acoustic and mechanical sensors. In the
context of mechanical sensors, MEMS sensors have been adopted by industries to
produce airbag sensors, various types of pressure sensors, AFM probe tips and
micro-engines. MEMS sensors are more versatile than the conventional sensors and,
thus, have become popular due to multiplicity, microelectronic and miniaturization
(Wang et al., 2003).
Most of the MEMS sensors contain small plates, diaphragms, bridges or
cantilevers that are either made from or coated by piezo resistive material in the size
scale of micrometers (Arivindran, 2007). These components respond to mechanical
loads, such as force and pressure, by means of out-of-plane deflection. The deflection
produces the piezo-resistive effective, thus converting the mechanical stress into
electrical signal. The conversion of mechanical stress into electrical signal is
essential to enable the integration of MEMS sensors with microelectronic circuits.
Since the out-of-plane motion of cantilever beam or diaphragm is usually
critical to MEMS sensors operation, the accurate measurement of these small
movements is essential to characterize the behavior of the sensor under load.
2
Although, significant effort has been put into the development of improved MEMS
design and fabrication processes, research of MEMS measurement and testing have
received less attention, especially the measurement of mechanical properties. For
example, in an accelerometer that deploys an air bag during a car crash, it is
fundamental importance to measure accurately the mechanical behavior and
properties of the micro beam.
In the design of MEMS sensors and actuators the design parameters such as
dimensions are dependent upon the extreme operating conditions and the mechanical
properties of the materials used. Another important design consideration is the
maximum allowable deflection of the structure such as micro-cantilever beam. The
micro-cantilever should deflect within a range to ensure safety and accuracy, thus
preventing yielding and fatigue failure. Therefore, in order to ensure the correct
design, the maximum deflection and the mechanical properties of the MEMS
structures have to be determined a priori. The above mentioned problems are usually
solved by using finite element analysis (FEA).
The predictions of the FEA depend largely on the assumptions made during
the generation and analysis of the model. Researchers tend to model the MEMS
structures such, as cantilever beams or diaphragms, using the standard value of
mechanical properties such as Young’s modulus as the FEA input parameter.
However, like many other properties, the mechanical properties of micro-structures
deviate from the bulk materials due to the small dimensions of the micro-structures
(Son et al., 2003). The standard value of Young’s modulus for the bulk material may
not be applicable to micro-system such MEMS cantilevers and diaphragms. This is
3
because the specimen size effect of the mechanical properties at micro-scale range is
critical. In some polymer-based MEMS, the micro-structures are normally reinforced
composites or multi-layer coated composites in which the mechanical properties
differ from the standard values. In such situations, the use of the standard value of
mechanical properties for FEA will lead to the wrong prediction of the deflection
under load. Therefore, the only way to determine the correct value of mechanical
properties of micro-scale structures is by conducting experiments.
Only the direct and accurate measurement can ensure the actual value of the
deflection and mechanical properties for MEMS. However, accurate measurement of
the deflection profiles of micro-structures, such as micro-cantilevers, is difficult
using conventional point-wise contact methods. This is because the probe of the
measurement device will impose additional loads on the micro-structure, thus
contributing to significant measurement errors. Optical measurement methods such
as holographic interferometry (HI), electronic speckle pattern interferometery
(ESPI), fringe projection, shadow moiré and moiré interferometry are well known as
reliable, accurate, non-contacting and non-destructive methods for measuring
surfaces. The non-contacting nature of these optical methods is an important and
essential element in the measurement of the micro-structures.
Among the optical methods, shadow moiré is a well known and widely used
measurement technique used for out-of-plane deformation measurement. This
method is preferable because the experimental setup is relatively simple compared to
other optical methods. The shadow moiré method also has an advantage over other
optical method because the measurement range and sensitivity can be easily
4
controlled. The shadow moiré technique is versatile and the phase-shifting technique
can be integrated with shadow moiré method in order to enhance the measurement
resolution.
The silicon-based materials have been widely used in the fabrication of many
mechanical structures in MEMS (Firebaugh et al., 2004). The widely accepted
application of the silicon-based materials in MEMS are mainly because the
mechanical structures can be fabricated using surface micro-machining technique
(Cho, 2009) and the silicon-based structures are easy to be integrated with electronic
circuits. With the improvement of the fabrication technology such as polymer-based
micro-machining technique (Nguyen & Huang, 2006) of the polymeric materials, it
is possible to fabricate the MEMS structures using polymer-based materials. The
significant advantages of polymer-based MEMS over the silicon-based MEMS are
that the polymers are ductile but have high impact resistance, flexible, and moreover,
the elasticity modulus can be easily altered by using fillers, reinforcement or
coatings. Some polymer-based MEMS structures are non-hazardous and non-reactive
to most of the chemicals and, thus, can be applied in many biomedical devices such
as the micro-cantilever in a micro-pump system.
The amorphous type of polyethylene terephthalate (PET) has the advantages
of high impact-resistance, lightweight and good flexibility. When fabricated in the
biaxially oriented thin film form, the PET film has a high strength-to-weight ratio
and high flexibility. As such, the PET film is often used in applications such as
flexible food packaging, thermal insulation and tape applications, such as the carrier
for magnetic tapes and backing for pressure sensitive adhesive tapes. PET has

5
relatively low elasticity modulus which is 50 to 100 times lower than that of silicon
(Nguyen & Truong, 2004). Thus, PET micro-cantilevers are more sensitive
compared with silicon. Furthermore, PET micro-cantilever can be coated with
various materials to alter the Young’s modulus.
In the fabrication of the polymer-based MEMS cantilever, the bending
modulus of the MEMS cantilevers can be altered by using the different thick-coating
materials. The major reason to alter the bending modulus of the cantilevers is to
produce the flexible micro-cantilever with different sensitivity with respect to
loading, without changing the major dimensions of the micro-cantilevers. The altered
bending modulus has to be determined from the deflection measurement in order to
facilitate the design and fabrication of MEMS. The shadow moiré method is a
promising method to be applied to measure the deflection of the micro-cantilever.
1.1 Motivation of the study
This study is motivated by the need to find an accurate measurement method
for the deflection measurement of the polymer-based MEMS micro-cantilever so that
the bending modulus of the coated PET micro-cantilever can be determined. An
accurate experimental method to measure the deflection should be developed, and
the accuracy of the measurement method has to be established.
The study on the effect of different coating material for the PET micro-
cantilever is also desired because the knowledge of altering the bending modulus of
the reinforced-epoxy coated PET micro-cantilever can facilitate in the design and

6
applications of this polymer-based MEMS. The results from the finding of the
bending modulus of the various reinforced-epoxy coated PET cantilevers provide the
actual input parameter to the FEA in the design and fabrication process. The effect of
the types and coating thickness is a desired outcome of the FEA.
1.2 Problem statements
The design and analysis of the reinforced-epoxy coated PET cantilever need
the accurate value of bending modulus. The effect of the coating materials to this
composite micro-cantilever can only be evaluated by knowing the accurate bending
modulus of the cantilever materials. The effect of the various coating materials and
thicknesses play an important role in terms of cantilever deflection. The evaluation of
the effect of the various coatings can facilitate the design and fabrication of this type
of composite micro-cantilever.
The conventional point-wise testing method such coordinate measurement
machine cannot be applied to determine the accurate bending modulus due to the
small dimensions of the micro-structure. Shadow moiré method is a promising non-
contact method to measure the deflection and the bending modulus can be calculated
from deflection results. However, the uses of the normal light source in the simple
experimental setup introduce significant errors. The fringe pattern produced from
shadow moiré needed to be improved and the phase-shifting analysis technique
needed to be to be integrated in the fringe analysis so that the accurate deflection and
bending modulus of the reinforced-epoxy coated PET micro-cantilever can be
determined.
7
1.3 Objectives of study
Based on the above mentioned motivation and problem statements, the
objectives of the study are determined as:
i. To develop a non-contact measurement technique to measure the deflection of
micro-cantilevers using phase-shift shadow moiré method (PSSM).
ii. To determine the bending modulus of the cantilever material through the
measurement of the deflection of the silicon micro-cantilever.
iii. To determine the corresponding bending modulus of the various types of
reinforced-epoxy coated PET cantilever through the measurement of the
deflection of the cantilever.
iv. To study the effect of the various coating materials and coating thickness on the
stiffness and deflection sensitivity of the coated PET cantilever through the FEA
by applying the bending modulus determined experimentally as the input
parameter.
1.4 Scopes of study
The study is limited to the following aspects:
i. The experimental setup of the shadow moiré is developed from the fundamental
theory of the shadow moiré method. The arrangement of the equipment is simple
and uses the normal visible light source.
ii. The processing algorithm to enhance the image quality and the phase-shifting
algorithm are written in the MATLAB programming language.
iii. The silicon micro-cantilever is fabricated to test the accuracy and reliability of
the developed PSSM technique by comparing the deflection measurement results

8
with the results from a commercially available equipment namely, Alicona
Imaging System.
iv. The reinforced-epoxy coating materials are aluminum-epoxy coating and
graphite-epoxy coating. These two types of coating will applied onto the PET
cantilevers to create the reinforced-epoxy PET cantilevers.
v. The models of reinforced-epoxy coated PET cantilever are created and analyzed
using the ANSYS software.
1.5 Contributions
Upon completion of this research, three major contributions are expected:
i. The development of a relatively simple measurement method to measure
micro-deflection of MEMS cantilever.
ii. The effect of various coating on PET polymer-based micro-cantilever is
figured out and the knowledge can help in the design of epoxy coated PET
micro-cantilever.
iii. The experimental results and bending modulus found can be used as input
parameter to evaluate the effect of coating and the data obtained can facilitate
the design and fabrication of reinforced-epoxy coated PET cantilevers.
1.6 Thesis outline
This thesis consists of five chapters that include the Introduction, Literature
Review, Methodology, Results and Discussions, and also Conclusions and Future
works. The first chapter presents an overview of the research. The background of the
9
problems is discussed and the objectives of the research are listed after the discussion
of the motivation of study. The contributions of this research are highlighted and the
thesis outline is included in the last sub-chapter in Chapter One.
Chapter Two in this thesis discusses the literature reviews and the works done
by other researchers regarding the research problem. The discussions in this chapter
are focused on the application of the optical techniques in deflection measurement,
especially the application of moiré method. The characterization technique used in
characterization of micro-structures, the research in polymer-based micro-cantilever,
and the application of FEA in designing micro-structures are also reviewed. A
discussion and comment on the previous works done is presented in the chapter
summery at the end of the chapter.
The detail research methodology is discussed in Chapter Three. All the major
supporting theories including the shadow moiré method, phase-shifting algorithm
and the deflection theory are thoroughly discussed. Next, the procedures of the
experimental specimens are outlined. The specimens prepared including the
miniaturized copper cantilever, the silicon micro-cantilevers and the reinforced
epoxy coated PET cantilevers. After specimen preparation, the experimental setup
for the above mentioned specimens are illustrated. The FEA pre-processing
procedure for deflection prediction is also presented in this chapter. A brief chapter
summary is included.
The experimental results and discussions are compiled in Chapter Four. The
experimental results for the copper mini-cantilever, silicon micro-cantilever and the
10
reinforced-epoxy coated PET cantilever are illustrated and discussed respectively.
The bending modulus found from the experiment of reinforced-coated PET
cantilever is applied in the FEA to simulate the deflections and evaluate the effect of
the various coatings. The conclusions are presented according to the discussions and
are compiled in Chapter Five. The contribution of the research, the limitation and the
future works are included. The possible extended research areas are suggested.

11
CHAPTER 2
LITERATURE REVIEW
2.0 Overview
This chapter presents the review of previous works done regarding the
following areas of researches:
• The application of optical techniques in deflection measurement.
• The characterization technique for micro-structures
• The application of polymer materials in MEMS
• The application of FEA in the analysis of MEMS
• The effect of coating to the material properties of MEMS structures
At the end of this chapter, a chapter summery regarding the above mentioned
literatures is presented.
2.1 The application of optical techniques in deflection measurement
Optical metrology is categorized as a non-destructive testing (NDT) and also
non-contact measurement method. The purpose of NDT is to determine whether or
not a component has a fault without causing material damage during the process of
test (Jones & Wykes, 1989). Optical techniques are suitable for MEMS measurement
since they are non-contacting and can detect surface displacement that result from
the application of small loads. According to Sciammarella (2003), the optical
techniques are based on the concept of interference of light. Loads either mechanical
or thermal are applied in such a way so that it causes the displacement of object
surface and the displacement causes the interference of wave front. The interference
12
will form a carrier of signal which is known as a fringe pattern on the object surface.
The fringe pattern is then analyzed by using manual analysis or automatic processing
technique and hence enables measurement to be made.
There are several optical methods can be applied to measure displacement of
an object surface, i.e. moiré interferometry, shadow moiré, holographic, speckle
photography, speckle interferometry, numerical correlation of speckles, speckles
shearography, fringe projection and miscellaneous (Sciammarella, 2003; Lim et al.,
2003). In general, holographic and speckle pattern interferometry methods are
suitable for both in-plane and out-of-plane strain, stress and displacement
measurements (Jones & Wykes, 1989). Moiré interferometry is sensitive to in-plane
strain, stress and displacement measurements (Kafri & Glatt, 1990). In contrast,
shadow moiré, optical interferometry and speckles shearography are more suitable
for out-of-plane displacement, deformation and surface profiling measurements
(Gasvik, 1996; Shang et al., 2000). There are many published works on the
application of optical metrology since the first invention of interferometer by
Michelson in the 1870s. However, since deflection of MEMS cantilever is the out-of-
plane displacement, the literature review below will only focus on the application of
optical methods on MEMS deflection.
Measurement of deflection can be accomplished by mean of measuring and
subtracting the surface profile for before and after displacement. Therefore, the
techniques that measure deflection or displacement are actually measurement
techniques for surface profile. Among the optical methods that can measure
deflection, the optical interferometry method has been developed separately by
13
several researchers in the past due to its high measurement accuracy. Hill et al. (2001)
applied the optical surface profiling technique to measure the deformation of a
pressure sensor. Wang et al. (2003) applied optical interferometry technique to
measure the deflection of the MEMS cantilever in an accelerometer. The methods
presented by these two researches were based on the interference of light beams of
equal path difference, which results in fringes of equal thickness.
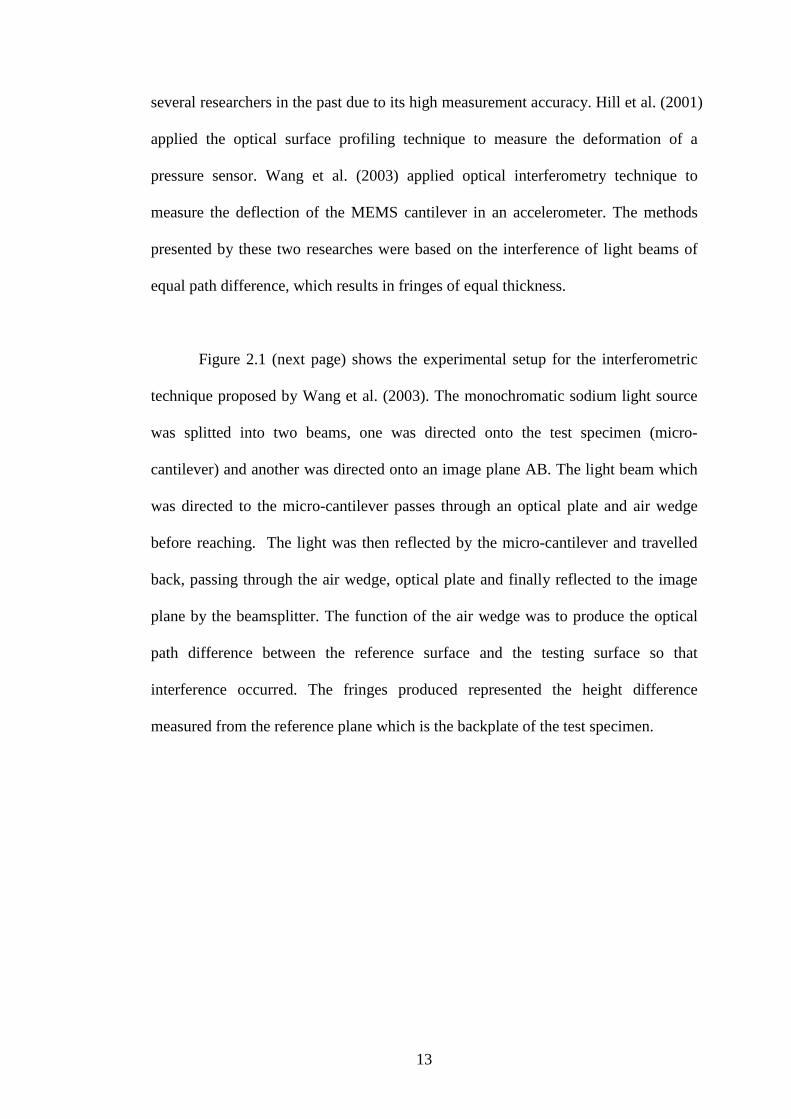
Figure 2.1 (next page) shows the experimental setup for the interferometric
technique proposed by Wang et al. (2003). The monochromatic sodium light source
was splitted into two beams, one was directed onto the test specimen (micro-
cantilever) and another was directed onto an image plane AB. The light beam which
was directed to the micro-cantilever passes through an optical plate and air wedge
before reaching. The light was then reflected by the micro-cantilever and travelled
back, passing through the air wedge, optical plate and finally reflected to the image
plane by the beamsplitter. The function of the air wedge was to produce the optical
path difference between the reference surface and the testing surface so that
interference occurred. The fringes produced represented the height difference
measured from the reference plane which is the backplate of the test specimen.

14
Figure 2.1: The optical layout for optical interferometric technique (Wang et al.,
2003).
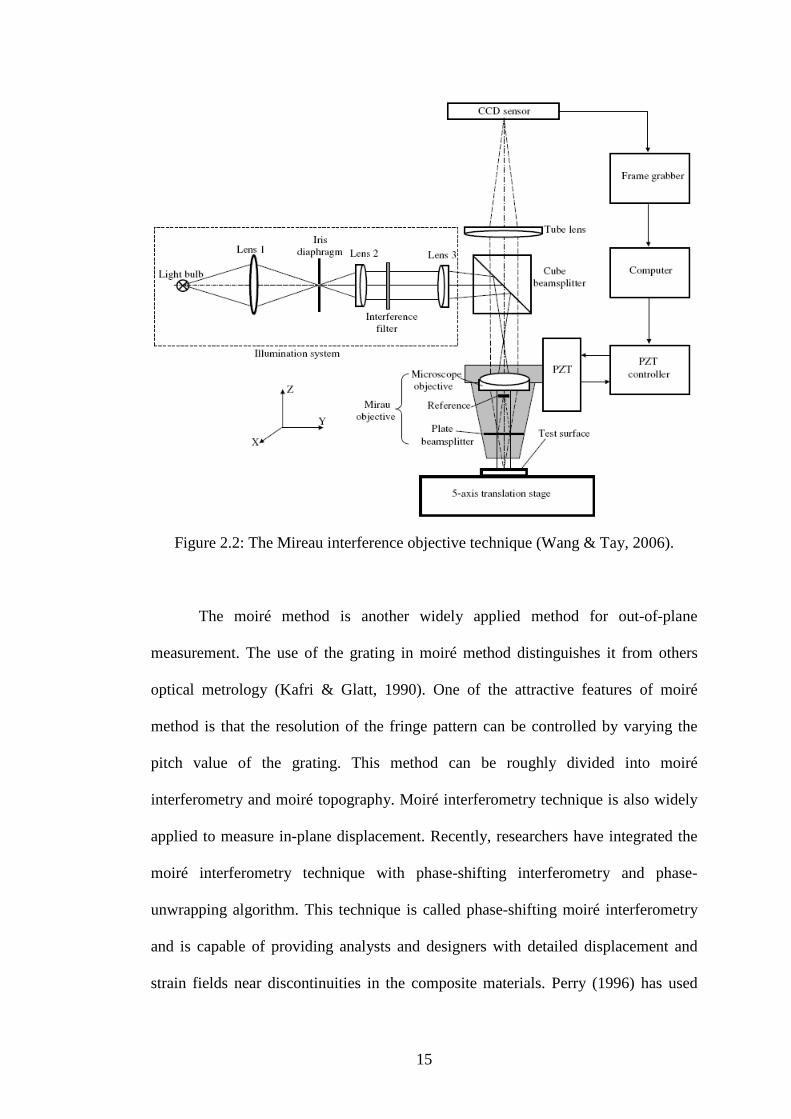
Later, Wang and Tay (2006) improved the optical interferometric technique
by introducing interference Mireau objective based on Michelson interferometer to
measure the surface contour map. The experimental technique proposed was based
on optical interferometic technique but improved by the Mireau interference
objective. Figure 2.2 (next page) shows the Mireau interference objective technique.
The Mireau interference objective consisted of an objective lens, a reference mirror
and a beamsplitter. The focal length of the objective lens and the mirror were
positioned and controlled by computerized piezoelectric device, so that the phase-
shifting can be applied. The interferometry technique proposed has high
measurement accuracy, low measurement error and flexible. However, the
limitations of this technique are that the high intensity laser light source is required
and the measurement range is limited by the wave-length of the laser.
15
Figure 2.2: The Mireau interference objective technique (Wang & Tay, 2006).
The moiré method is another widely applied method for out-of-plane
measurement. The use of the grating in moiré method distinguishes it from others
optical metrology (Kafri & Glatt, 1990). One of the attractive features of moiré
method is that the resolution of the fringe pattern can be controlled by varying the
pitch value of the grating. This method can be roughly divided into moiré
interferometry and moiré topography. Moiré interferometry technique is also widely
applied to measure in-plane displacement. Recently, researchers have integrated the
moiré interferometry technique with phase-shifting interferometry and phase-
unwrapping algorithm. This technique is called phase-shifting moiré interferometry
and is capable of providing analysts and designers with detailed displacement and
strain fields near discontinuities in the composite materials. Perry (1996) has used
16
this technique to investigate the delaminations in carbon-epoxy/epoxy composites.
He proved that this technique allows high resolution measurements of in-plane
surface displacements to be made without introducing global smoothing errors, thus
preserving the integrity of data near cracks, discontinuities and material interface.
However, the phase-shift moiré interferometry is not suitable for deflection
measurement of MEMS structures.
On the other hand, moiré topography in particular is a widely used mainly for
shape contouring of three-dimensional objects. In general moiré topography can be
classified into two main categories; that are projection moiré and shadow moiré,
according to the methods of producing moiré fringes. Moiré technique is the
technique that utilizes two gratings to generate fringes for the out-of-plane
displacement measurement and the measurement resolution can be changed by
changing the resolution of grating. Shadow moiré uses one grating as the reference
grating and the second grating is actually the shadow of the reference grating that fall
onto the object surface. Superimposing of the reference grating with its shadow will
form the shadow moiré fringes (Lim, 2003).
The difference between projection and shadow moiré is that two different
gratings are used in projection moiré. The difference of the grating can be the
difference in the geometry or resolution of the two gratings used. The reference
grating is normally projected onto the distorted specimen grating to form the moiré
fringes. The projection of the grating can be accomplished by physical projection of
grating or can be the virtually superimposing by the aid of the computer
programming. Liu & Chen (2005) applied the digital phase-shifting projection moiré
17
and the wavelet transformation method to measure the deformation of PMMA
cantilever beam.
Shadow moiré technique is only sensitive to out-of-plane displacement and is
widely applied to measure the deformation and fatigue damage of composite
materials. Degrieck et al. (2001) used the digital phase-shift shadow moiré technique
to measure micro fatigue damage in reinforcement-reinforcement composite
materials. They showed that during fatigue life of a bended specimen, damage was
growing steadily and the out-of-plane displacement profile was severely changing.
The main advantage of the technique proposed was that only one image was captured
and phase shifting was done numerically. Degrieck et al. (2001) concluded that
digital phase-shift shadow moiré technique is very efficient and can eliminate all
causes of erroneous measurements due to the miscalibration of phase-stepping
devices.
Figure 2.3 shows a schematic diagram of the phase shifting shadow moiré
setup. Chen et al. (2004) used the phase-shifting shadow moiré techniques to
measure wafer curvature and calculate the residual stress. Wafer curvatures or bows
can be achieved by analyzing the moiré fringe patterns and film stress can be
obtained. As shown in Figure 2.3, the reference grating was located above the wafer.
Shadow grating was generated on the surface of the wafer due to the presence of the
light source. The CCD camera then records the image of the fringes surface. The
reference grating is then moved by 1/3 fringe spacing by adjusting the translational
positioner. The second image is recorded. The final image was again recorded by
moving further 1/3 fringe spacing. The images were then processed by using image

18
processing technique and the surface profile can be calculated based on particular
equations. The wafer curvature was then calculated from the surface profile using
Stoney’s equation (Chen et al., 2004).
Figure 2.3: Schematic diagram of the phase shifting shadow moiré setup (Chen et al,
2004).
Shadow moiré is also popular in the warpage measurement of printed circuit
boards (PCB) (Geng et al., 2006; Wen & Ku, 2008). This technique becomes popular
in the PCB warpage measurement is because the measurement range and sensitivity
can be easily controlled by changing the resolution of the grating. High-resolution
grating produces higher measurement sensitivity. The high temperature during the
reflow process and the mechanical preload during the assemble process were
contributed to the warpage of PCB. Shadow moiré can provide the real time
monitoring of warpage and can be the powerful tool to evaluate the effect of
processing parameters to the PCB warpage.

19
The features that can produce the real time moiré fringes and the flexible
measurement range are the major advantages of shadow moiré technique. Seif et al.
(2007) made used of these feature and applied the shadow moiré laser based imaging
technique to study the delamination damage of carbon-epoxy composites after
drilling process. The hidden delamination during the drilling process was revealed
and the drilling process parameters were evaluated by shadow moiré laser based
imaging technique. The shadow moiré technique was also successfully applied in
other applications such as shape measurement (Siddiolo et al., 2008), and the
mechanical characterization applications that will be discussed in the following
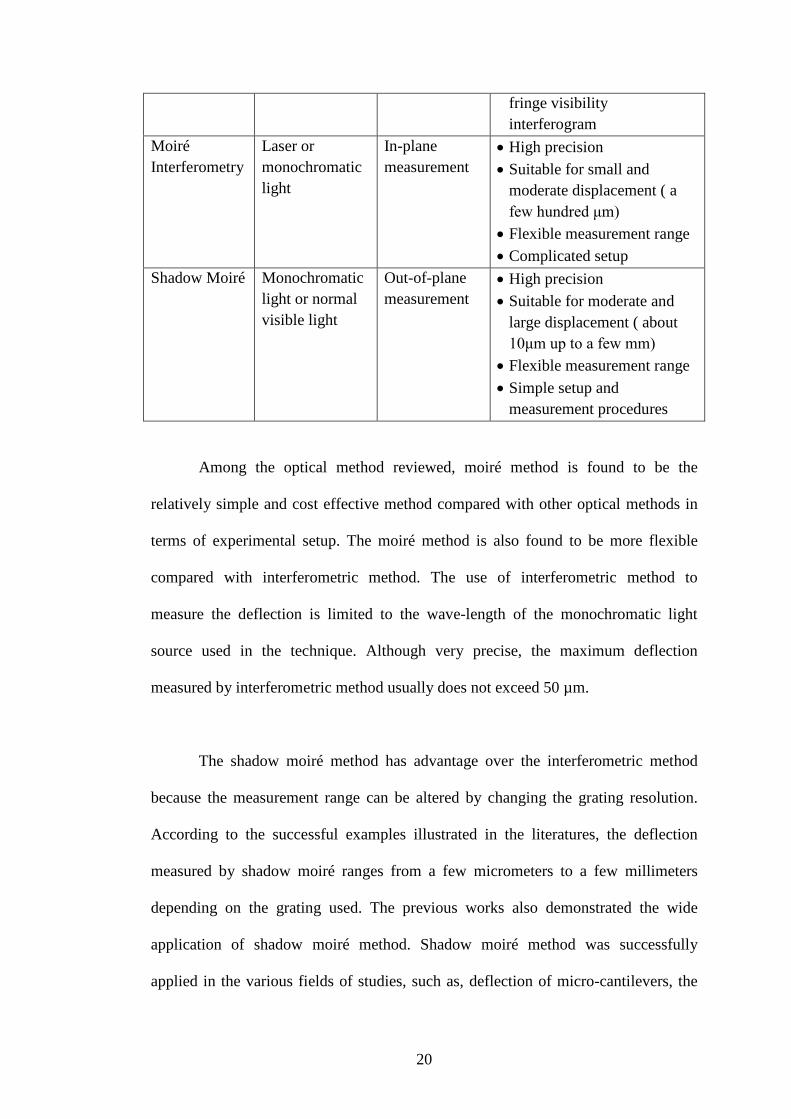
section. Table 2.1 summaries of the major features of the popular optical metrology
that are methods applied to measure displacement.
Table 2.1: The major features of some popular optical methods applied for
displacement measurement.
Optical Method
Light Source Measurement Types
Major Features
Optical Interferometry
Laser or monochromatic light
Out-of-plane measurement
• High measurement accuracy • High precision • Suitable for small
displacement (a few μm) • Fixed measurement range
Holographic
Laser
In-plane and out-of-plane measurement
• High measurement accuracy • High precision • Suitable for small
displacement (a few μm) • Fixed measurement range • Complicated setup and
measurement procedures Speckle Interferometry
Laser
In-plane measurement
• High precision • Suitable for small
displacement (a few μm) • Fixed measurement range • Produce high noise and poor
20
fringe visibility interferogram
Moiré Interferometry
Laser or monochromatic light
In-plane measurement
• High precision • Suitable for small and
moderate displacement ( a few hundred μm)
• Flexible measurement range • Complicated setup
Shadow Moiré Monochromatic light or normal visible light
Out-of-plane measurement
• High precision • Suitable for moderate and
large displacement ( about 10μm up to a few mm)
• Flexible measurement range • Simple setup and
measurement procedures
Among the optical method reviewed, moiré method is found to be the
relatively simple and cost effective method compared with other optical methods in
terms of experimental setup. The moiré method is also found to be more flexible
compared with interferometric method. The use of interferometric method to
measure the deflection is limited to the wave-length of the monochromatic light
source used in the technique. Although very precise, the maximum deflection
measured by interferometric method usually does not exceed 50 µm.
The shadow moiré method has advantage over the interferometric method
because the measurement range can be altered by changing the grating resolution.
According to the successful examples illustrated in the literatures, the deflection
measured by shadow moiré ranges from a few micrometers to a few millimeters
depending on the grating used. The previous works also demonstrated the wide
application of shadow moiré method. Shadow moiré method was successfully
applied in the various fields of studies, such as, deflection of micro-cantilevers, the
21
delamination damage after drilling process, film stress characterizations, shape
measurement, and PCB warpage detections.
The major limitation of the shadow moiré method is that the high intensity
light source is usually needed for the micro-scale measurement. The visibility of the
shadow moiré fringes, however, decreased as the resolution of the grating increased.
The use of laser in such technique is normally preferred because high-intensity light
is essential to produce a sharp shadow of the gratings, particularly for measurement
on micro-structures. The use of normal white light source for shadow moiré in
micro-deflection measurement is relatively difficult because normal light source
produces low visibility fringes. Although the measurement resolution can be
enhanced by integrating the phase-shifting technique in fringe pattern analysis, the
phase-shifting technique will produce erroneous results if the fringe contrast is too
low. Another limitation of using the normal light source is that the moiré fringes are
limited to a few fringes only. This is because the light is diffracted when passing the
grating, thus produce the poor visibility shadow. Therefore, the displacement should
be limited to a small range, in order to avoid poor visibility shadow. Most of the
previous researches used the collimated and high intensity laser light source to obtain
the acceptable visibility images and to obtain the adequate moiré fringes
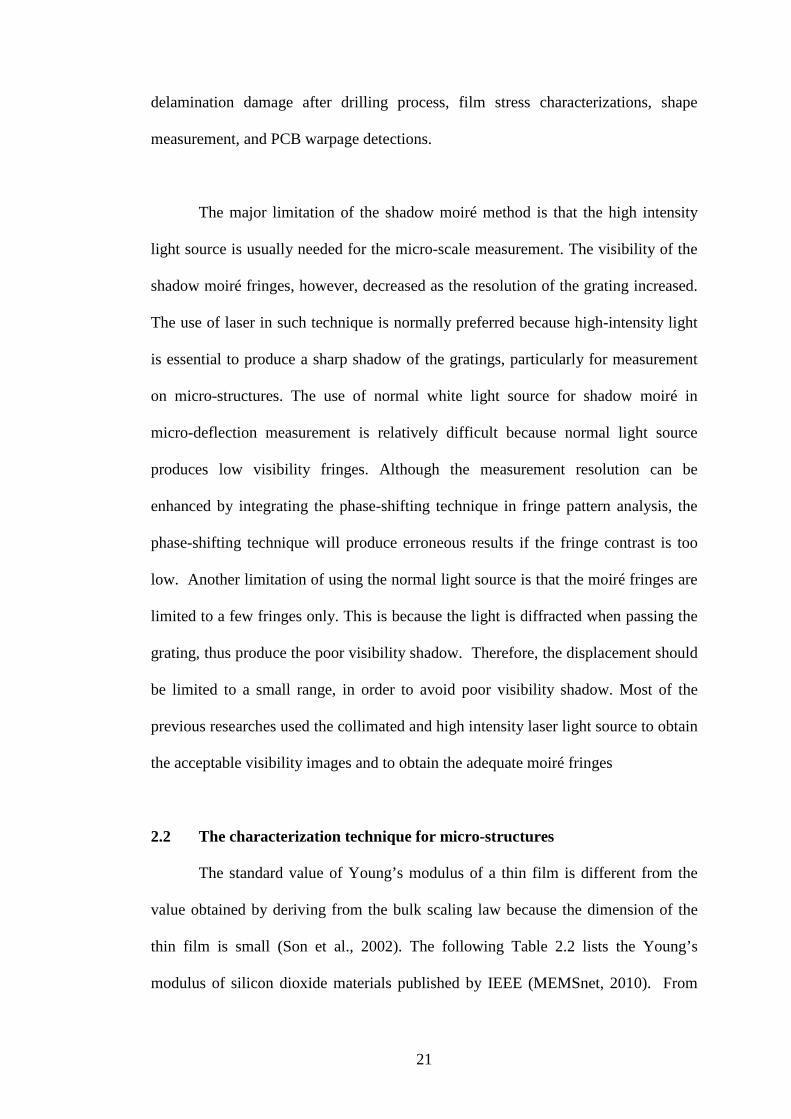
2.2 The characterization technique for micro-structures
The standard value of Young’s modulus of a thin film is different from the
value obtained by deriving from the bulk scaling law because the dimension of the
thin film is small (Son et al., 2002). The following Table 2.2 lists the Young’s
modulus of silicon dioxide materials published by IEEE (MEMSnet, 2010). From
22
Table 2.2, the value of Young’s modulus varies from 57 GPa to 92 GPa depending
on the condition and processes to prepare the material. The material properties
variation is obvious when the various thicknesses and various crystallographic
direction silicon materials are applied in the MEMs structures. Therefore,
experimental data to determine the material properties, especially the Young’
modulus, is very important when applying those properties in FEA.
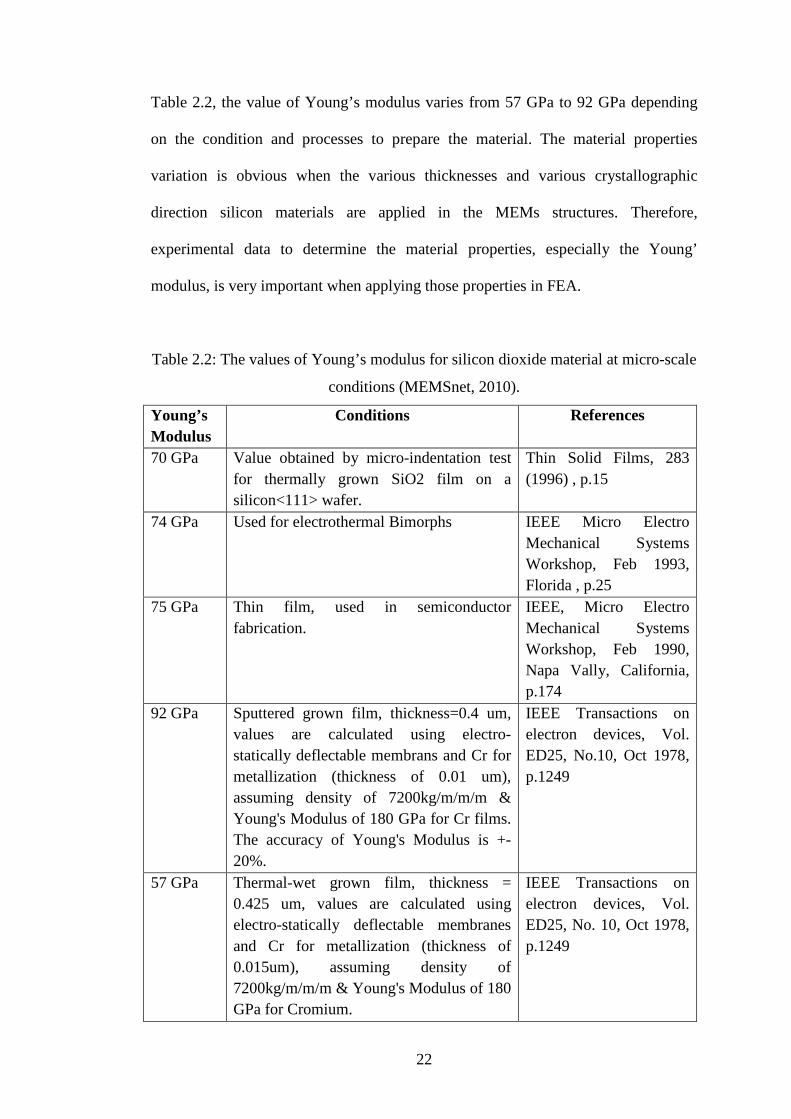
Table 2.2: The values of Young’s modulus for silicon dioxide material at micro-scale
conditions (MEMSnet, 2010).
Young’s Modulus
Conditions References
70 GPa Value obtained by micro-indentation test for thermally grown SiO2 film on a silicon<111> wafer.
Thin Solid Films, 283 (1996) , p.15
74 GPa Used for electrothermal Bimorphs IEEE Micro Electro Mechanical Systems Workshop, Feb 1993, Florida , p.25
75 GPa Thin film, used in semiconductor fabrication.
IEEE, Micro Electro Mechanical Systems Workshop, Feb 1990, Napa Vally, California, p.174
92 GPa Sputtered grown film, thickness=0.4 um, values are calculated using electro-statically deflectable membrans and Cr for metallization (thickness of 0.01 um), assuming density of 7200kg/m/m/m & Young's Modulus of 180 GPa for Cr films. The accuracy of Young's Modulus is +- 20%.
IEEE Transactions on electron devices, Vol. ED25, No.10, Oct 1978, p.1249
57 GPa Thermal-wet grown film, thickness = 0.425 um, values are calculated using electro-statically deflectable membranes and Cr for metallization (thickness of 0.015um), assuming density of 7200kg/m/m/m & Young's Modulus of 180 GPa for Cromium.
IEEE Transactions on electron devices, Vol. ED25, No. 10, Oct 1978, p.1249

23
The early effort to determine the Young’s modulus of micro-cantilever was
done by Sharpe et al. (1997). The method used was by applying a tensile test on a
two-layer polysilicon specimen of dimensions 4 mm length, 0.6 mm wide and 3.5
µm thick. Optical method, namely interferometric strain/displacement gage (ISDG),
was applied to measure the in-plane displacement. The Young’s modulus and
Poission’s ratio were then calculated using theoretical equations. Figure 2.4 shows
the experimental setup for ISDG. The specimen was griped at both ends and the
tensile load was applied by load cell that placed on piezoelectric translator. Two gold
lines were deposited on the surface of the specimen during manufacture. The gold
lines act as the strain gages and the edges of the gold lines reflect laser beam as
shown in Figure 2.5. The reflected laser light interferes with the incident laser beam
and forms the fringe pattern. The fringe pattern before and after loading were
recorded and strain was calculated based on equations. The Young’s modulus,
Poisson’s ratio and tensile strength for polysilicon were found to be 169 ± 6.15 GPa;
0.22 ± 0.011 and 1.20 ± 0.15 GPa respectively. The limitation of this method is that
the gold lines needed to be attached onto the specimen. The significant errors may be
introduced if the specimen is in micro-scale.
Figure 2.4: The experimental setup for ISDG (Sharpe et al, 1997).
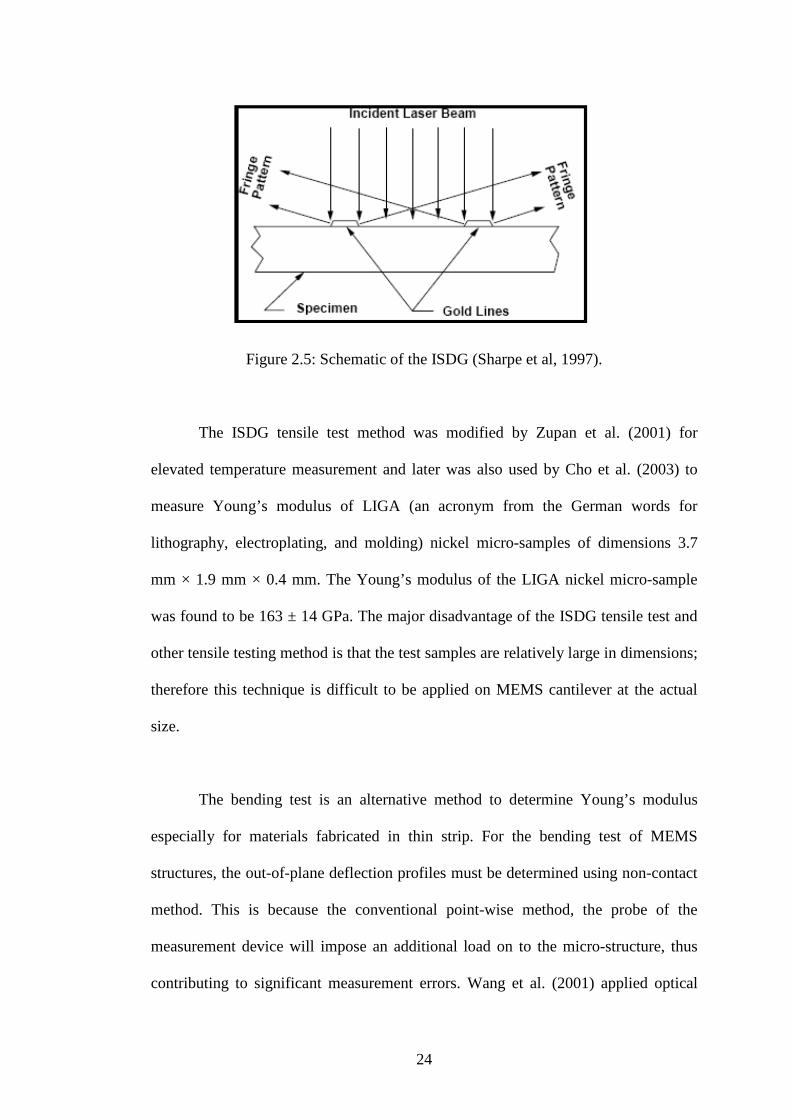
24
Figure 2.5: Schematic of the ISDG (Sharpe et al, 1997).
The ISDG tensile test method was modified by Zupan et al. (2001) for
elevated temperature measurement and later was also used by Cho et al. (2003) to
measure Young’s modulus of LIGA (an acronym from the German words for
lithography, electroplating, and molding) nickel micro-samples of dimensions 3.7
mm × 1.9 mm × 0.4 mm. The Young’s modulus of the LIGA nickel micro-sample
was found to be 163 ± 14 GPa. The major disadvantage of the ISDG tensile test and
other tensile testing method is that the test samples are relatively large in dimensions;
therefore this technique is difficult to be applied on MEMS cantilever at the actual
size.
The bending test is an alternative method to determine Young’s modulus
especially for materials fabricated in thin strip. For the bending test of MEMS
structures, the out-of-plane deflection profiles must be determined using non-contact
method. This is because the conventional point-wise method, the probe of the
measurement device will impose an additional load on to the micro-structure, thus
contributing to significant measurement errors. Wang et al. (2001) applied optical