The Effect of Music Cadence on Step Frequency in the ...
78
University of South Florida Scholar Commons Graduate eses and Dissertations Graduate School 7-9-2014 e Effect of Music Cadence on Step Frequency in the Recreational Runner Micaela A. Galosky University of South Florida, [email protected] Follow this and additional works at: hps://scholarcommons.usf.edu/etd Part of the Kinesiology Commons is esis is brought to you for free and open access by the Graduate School at Scholar Commons. It has been accepted for inclusion in Graduate eses and Dissertations by an authorized administrator of Scholar Commons. For more information, please contact [email protected]. Scholar Commons Citation Galosky, Micaela A., "e Effect of Music Cadence on Step Frequency in the Recreational Runner" (2014). Graduate eses and Dissertations. hps://scholarcommons.usf.edu/etd/5219
Transcript of The Effect of Music Cadence on Step Frequency in the ...
University of South FloridaScholar Commons
Graduate Theses and Dissertations Graduate School
7-9-2014
The Effect of Music Cadence on Step Frequency inthe Recreational RunnerMicaela A. GaloskyUniversity of South Florida, [email protected]
Follow this and additional works at: https://scholarcommons.usf.edu/etd
Part of the Kinesiology Commons
This Thesis is brought to you for free and open access by the Graduate School at Scholar Commons. It has been accepted for inclusion in GraduateTheses and Dissertations by an authorized administrator of Scholar Commons. For more information, please contact [email protected].
Scholar Commons CitationGalosky, Micaela A., "The Effect of Music Cadence on Step Frequency in the Recreational Runner" (2014). Graduate Theses andDissertations.https://scholarcommons.usf.edu/etd/5219

The Effect of Music Cadence on Step Frequency in the Recreational Runner
by
Micaela Galosky
A thesis submitted in partial fulfillment
of the requirements for the degree of
Master of Science
Department of Education and Psychological Studies
College of Education
University of South Florida
Co-Major Professor: Candi Ashley, Ph.D.
Co-Major Professor: Marcus Kilpatrick, Ph.D.
Sara Flory, Ph.D.
Date of Approval:
July 9, 2014
Keywords: Music Cadence, Step Frequency, Step Length, Running Velocity
Copyright © 2014, Micaela Galosky

i
TABLE OF CONTENTS
LIST OF TABLES
LIST OF FIGURES
ABSTRACT
CHAPTER 1: INTRODUCTION
iii
iv
v
1 Rationale 1
Problem Statement 2
Study Variables 3
Hypotheses 4
Conceptual Framework 5
Operational Definitions 6
Assumptions 7
Limitations 8
Delimitations 9
Significance 9
CHAPTER 2: LITERATURE REVIEW 11
Step Frequency, Step Length, and Running Velocity 11
Running Economy 14
Injury Prevention 14
Step Frequency and Music Tempo 15
Motivational Qualities and Psychological Influence 16
Psychological, Psychophysical, and Ergogenic Effects 20
Oxygen Consumption and Blood Lactate Concentrations 23
Recommendations for Music and Exercise 25
CHAPTER 3: METHODS 27
Participants 27
Study Incentives 27
Study Location 27
Instruments/Equipment 28
Participant Documents and Forms 28
Software Programs and the BMRI-2 29
Data Collection Equipment 30

ii
Procedures 30
Pre-Study Procedures and Forms 30
Familiarization Trial 31
Preparation of Music Conditions 31
Data Collection 33
Statistical Analysis 35
CHAPTER 4: RESULTS 37
Environmental Conditions 37
Step Frequency 37
Step Length 38
Time to Completion 38
CHAPTER 5: DISCUSSION 42
Music and Exercise Performance 43
Running Velocity 45
Music Cadence and Step Frequency 47
Design Strengths 48
Personal Selection of Music 48
Ecological Validity 49
Design Weaknesses 49
Music Cadence 49
Step Frequency 49
Previous Music History 50
Study Location 51
Practical Application 51
CHAPTER 6: REFERENCES CITED 53
APPENDICES 58
Appendix A: Medical History Questionnaire 58
Appendix B: Participant Background Survey 61
Appendix C: ACSM’s Current Comment on Pre-Event Meals 64
Appendix D: Items to Bring to the Track 66
Appendix E: Items on the BMRI-2 67
Appendix F: The BMRI-2 68
Appendix G: IRB Approval Letter 69

iii
LIST OF TABLES
Table 2.1: Relationships between Step Frequency and Step Length 13
Table 2.2: Recommendations for Music and Exercise 26
Table 3.1: Participant Characteristics 28
Table 4.1: Environmental Parameters Mean SD 39
Table 4.2: Exercise Performance Mean SD 39
Table 4.3: Exercise Performance Effect Sizes 40
iv
LIST OF FIGURES
Figure 4.1: Step Frequency 40
Figure 4.2: Step Length 41
Figure 4.3: Time to Completion 41
v
ABSTRACT
Music appears to have advantageous effects during exercise as it has been shown
to increase motivation, decrease ratings of perceived exertion (RPE), and improve
exercise performance. The improvement of running performance in particular, is the main
effect recreational runners want to focus on as many want to improve their time in road
races. Running velocity, indicated by a faster time to completion is thought to improve
with an increase in step frequency, step length, or a combination of these variables.
Currently, there is limited research that observes methods to help increase step frequency
or step length. The manipulation of music cadence may be considered an effective
training method that influences step frequency. The purpose of this study was to observe
the effect of music cadence on step frequency in the recreational runner.
A total of 30 recreational runners (15 male, 15 female) with a mean age of 31.0
5.8 (range= 20-39), a BMI of 24.0 3.3 (range= 19-32), and an estimated VO2 max of
49.6 5.4 (range= 41-60) participated in this study. Individually, runners completed four
1600-meter time trials on an outdoor track at maximal effort. The first trial was a
familiarization trial where participants ran 1600 meters with no music. Two music
conditions were then created for each runner based on their natural step frequency
obtained during the familiarization trial. The first condition represented music at natural
step cadence and the second condition represented music at increased step cadence. The

vi
next three 1600 meter time trials were randomized and included a control condition of no
music, a natural cadence music condition at the runner’s natural step frequency, and an
increased cadence music condition of 10-20 beats per minute (bpm) above the natural
cadence music condition.
Results indicated that step frequency was significantly higher during the increased
cadence music condition compared to both the natural cadence music and no music
conditions (p < 0.05). Additionally, time to completion was significantly lower in the
increased cadence music condition compared to both the natural cadence music and no
music conditions (p < 0.05). Lastly, there was no significant difference in step length
among music conditions. These results indicate that music cadence had a positive
influence on running performance as it was able to increase step frequency and improve
time to completion in a group of recreational runners. Therefore, for practical application,
recreational runners can alter music cadence to help improve running performance.

1
CHAPTER 1: INTRODUCTION
Rationale
Running has become an increasingly popular form of exercise for individuals of
all ages who intend to improve their current level of cardiovascular health and fitness.
Running USA statistics reveal that in the year 2012, there were approximately fifteen
million road race finishers compared to the year 1990 where there were approximately
five million road race finishers in the United States. The female population represented
nearly half of this number in 2012 compared to only one quarter of this number in 1990
(Yoder & Lamppa, 2012). These survey results show that overall participation in road
races from the general population has increased substantially.
The many weeks of training a runner endures prior to any registered road race are
intended to achieve an improvement in running velocity, indicated by a faster time to
completion. Running velocity is a product of step frequency and step length (Weyand,
Sternlight, Bellizi, & Wright, 2000). Hunter and colleagues (2004) propose that in order
for running velocity to improve, an increase in either step frequency or step length must
occur without a decrease in the other. There is limited research however on ways to
improve step frequency or step length, and music may be an effective method to help
increase either of these.

2
Synchronous music is defined by Karageorghis et al. (2010) as the use of a
rhythmic or a temporal aspect of music to regulate movement patterns. Currently in
research, there is evidence to suggest that synchronous music may produce ergogenic and
psychological benefits during exercise (Karageorghis & Priest, 2012). According to Terry
and colleagues (2012), music may improve performance based on the individual’s ability
to synchronize movement to the tempo or beat of a song. It is also important for music to
be motivational for the individual during exercise. The Brunel Music Rating Inventory
Questionnaire-2 (BMRI-2) is one of the psychometric instruments used in research that
assesses the extent of motivational impact that certain songs have during exercise.
Motivation is considered the extent music will inspire an individual to exercise harder
and longer (Karageorghis, Priest, Terry, Chatzisarantis, & Lane, 2006). During running,
an individual may be able to adjust their step frequency to a faster cadence of music,
resulting in improved running performance.
There is limited research that supports the relationship between step frequency,
step length, and music cadence. If a significant relationship was found, training methods
for running may be improved by manipulating music cadence to the runner’s desired step
frequency and subsequent intensity.
Problem Statement
Step frequency and step length are the two components that determine an
individual’s running velocity. Research suggests that an increase in one or both of these
components may improve running performance (Marais, Galle, & Pelayo, 2003; Hunter,
Marshall, & McNair, 2004 & Ballreich, 1976). It is very important however to observe

3
step frequency and step length closely because an inverse relationship typically exists
between the two (Hunter et al., 2004). Therefore, an increase in one may result in a
decrease in the other, resulting in decreased or unchanged performance.
A vast majority of research indicates that music plays a significant role in
improving exercise performance. According to Karageorghis and Priest (2012),
motivational music produces an ergogenic effect by increasing work capacity and
delaying the onset of fatigue. Most of this research however, uses questionnaires and
focuses on subjective ratings of personal attitudes, moods, ratings of perceived exertion
(RPE), and enjoyment (Barney, Gust, & Liguori, 2010; Karageorghis et al., 2006;
Netherly, 2002 & Seath & Thow, 1995). Ecological validity is nearly absent in the
current literature as most of this research is conducted in a laboratory setting measuring
variables such as VO2 max (Barwood et al., 2009), time to fatigue (Terry et al., 2012),
power output (Yamamoto, Ohkuwa, Itoh, Kiton, Terasawa, Tsuda, Kitagawa, & Sato,
2003), and metabolic efficiency (Bacon, Myers, & Karageorghis, 2012). There needs to
be additional field-based research on this topic in order to increase ecological validity.
This can be accomplished by taking research outside to an environment where individuals
typically exercise.
Study Variables
The independent variable in this study was music cadence represented as music
tempo in beats per minute (bpm). There were three levels of this independent variable.
These levels included a control condition of no music, a natural cadence music condition
representing the runner’s natural step cadence during a 1600-meter familiarization trial,

4
and an increased cadence music condition of 10-20 beats per minute (bpm) above the
natural cadence music condition for each song. The dependent variables in this study
were step frequency, step length, time to completion, and predicted maximal oxygen
consumption (VO2 max). Step frequency was considered the number of steps taken in one
minute by each runner. Time to completion was considered the amount of time in
minutes the runner was able to complete 1600 meters at maximal effort. Step length was
determined algebraically with the equation: step length=1600 meters / step frequency
(steps/min) x time (minutes). VO2 max was predicted with the equation: 2.5043+ (0.8400
x km/hour).
Hypotheses
Ho1: Music cadence does not have any effect on increasing step frequency in the
1600-meter run for the recreational runner. As a result, there will be no significant
difference when comparing step frequency among the three music conditions.
Ho2: Music cadence does not have any effect on improving time to completion in
the 1600-meter run for the recreational runner. As a result, there will be no significant
difference in time to completion among the three music conditions.
HA1: Music cadence will have a significant effect on increasing step frequency in
the 1600-meter run. As a result, when music cadence is increased, step frequency will
also be increased for the recreational runner.
HA2: Music cadence will have a significant effect on improving time to
completion in the 1600-meter run. As a result, when music cadence is increased, time
trials will also be improved for the recreational runner.
5
Conceptual Framework
The conceptual framework behind the effects of music on exercise performance
involves the brain’s ability to take music from an outside source, process this music, and
then generate movement that is synchronized to the music. The research of Schneider,
Askew, Abel, and Struder (2010) proposes the presence of a central pattern governor
within the brain that functions to regulate movement according to ‘extrinsic’ (music
cadence) and ‘intrinsic’ (heart rate and brain activity) rhythmicity in motor activities.
According to Schneider et al. (2010), oscillatory neurons located in the motor area of the
brain are responsible for controlling human movement. This locomotor control is
apparent during exercise and can transition with the presence of an extrinsic source
(Schneider et al. 2010).
Karageorghis et al. (2010) further elaborates Schneider’s conception of a central
pattern governor and also correlated neural activity with an external stimulus.
Karageorghis et al. (2010) describes that the central nervous system’s neurons will
synchronize the afferent stimulus of music with an efferent stimulus that goes to the
muscles for movement. Therefore, during exercise, it is considered important to
manipulate music cadence to the desired movement cadence in order to produce an
ergogenic effect (Karageorghis et al., 2010). This study assumes that the individual
would be able to adjust step frequency to the cadence of music, which would
subsequently result in improved running performance.
6
Operational Definitions
A recreational runner is defined as an individual who runs during their leisure
time to improve their current level of cardiorespiratory health and fitness, and to decrease
all-cause mortality (Brill & Macera, 1995). These runners also typically train with an
intention to improve time to completion in various distances (1600 meters and beyond).
Step frequency is defined as the amount of steps taken per minute, also known as
running cadence, turnover rate, or step rate (Hunter et al., 2004). Step frequency was
measured similarly to Daniels’ technique in counting step frequency among elite athletes
in the 1984 Olympics (Daniels, 1998). The researcher counted the number of times the
left foot hit the ground in one minute and then multiplied that number by two to account
for each foot. This measurement started at the 50-meter mark along the first straightaway
and through the curve of each lap.
Step length is defined as the distance measured in meters between the touch down
of one foot to the following touch down of the opposite foot, also known as stride length
(Hunter et al., 2004). Step length was determined algebraically after all of the data
collection was complete. This equation was: step length=1600 meters / step frequency
(steps/min) x time (minutes).
Music cadence is defined as music tempo in beats per minute (bpm)
(Karageorghis & Priest, 2012). In this study, natural cadence music was represented by
the runner’s natural step frequency during the familiarization trial where participants ran
1600 meters at maximal effort with no music. Increased cadence music was represented

7
by a 10-20 beats per minute (bpm) increase above the natural cadence music condition
for each song.
Time to completion was considered the overall time in minutes that the runner
was able to run 1600 meters at maximal effort.
The motivational quality of music was assessed by The Brunel Music Rating
Inventory Questionnairre-2 (BMRI-2). The BMRI-2 is an objective measure that rates
each song based on its ability to inspire an individual to exercise harder and longer
(Karageorghis et al., 2006). Songs with a higher score on the BMRI-2 were considered
more motivational than songs with a lower score on the BMRI-2. Songs in each playlist
were then arranged in the order of highest motivation to lowest motivation.
Assumptions
During this study, there were several assumptions that helped yield valid and
reliable results. A primary assumption was that participants were running at maximal
effort during each trial, and the presence of researchers or other individuals did not alter
running performance. A second assumption was that the natural cadence music condition
adequately reflected the natural step frequency of the runner. There was a familiarization
trial conducted prior to actual data collection in which natural step frequency was
determined. A third assumption was that the participant was running the same distance
during each trial. In order to account for this, each runner started and ended at the same
marked line on the track. Runners were also instructed to stay in the first lane through
each lap of the time trial. A fourth assumption was that the stopwatch and countdown
timers were accurate in providing the correct time for each runner. The same stopwatch

8
and countdown timer were used for each time trial. A final assumption was that songs
listed on the participant background survey were considered at least somewhat
motivational for the runner.
Limitations
An initial limitation that could not be effectively controlled for in this study
involves the environment. Since the track was outside, factors such as temperature,
humidity, barometric pressure, wind, rain, thunder, lightning, etc. may have impacted
running performance. All environmental conditions were recorded on the data collection
sheet at the time of each trial.
Another limitation involves each runner’s training schedule. During this study,
runners may have been training for road races of varying lengths that may require
different strategies in training. Training strategies may include long slow distance
training in order to build endurance for a longer race such as a marathon compared to
training to increase speed for a shorter race such as a 5K. As a result, in this study,
improvement in time to completion may be due to each runner’s specific training method
rather than the effect of music cadence. Although this cannot be controlled, a benefit of
this study was that music conditions were selected in a randomized order. This helped
limit any training effect that individual training schedules may have over a given time
period. It also decreased the advantage one music condition may have over another.
Finally, step frequency may have changed throughout the course of the 1600-
meter run as step frequency can either increase or decrease along different laps,
straightaways, and curves along an outdoor track. The natural cadence music condition

9
was supposed to reflect natural step frequency during the run. If step frequency was
increased or decreased at any point during a time trial, then the natural cadence music
condition may not have accurately represented the natural step frequency of the runner.
Delimitations
A primary delimitation in this study included the criteria for participant selection
based on the medical history questionnaire and participant background survey. Each
runner who participated in this study was cleared based on his or her medical history
questionnaire. The study’s physician reviewed this questionnaire and qualified each
runner for participation. The participant background survey was self-constructed by the
researcher with an intent to gather demographic and background information. Based on
the participant background survey, runners in this study were between the ages of 20 and
40. In addition, within the past six months, these individuals ran a minimum of three
times per week on average and were able to run 1600 meters continuously under ten
minutes. Another delimitation was based on the increased cadence music condition. In
this condition, the researcher increased the beats per minute (bpm) of each song above
what was used in the natural cadence music condition. As a result, the researcher’s
preference of music cadence may have influenced the cadence used in this condition.
Significance
Research indicates that during running, a higher step frequency and an increased
or unchanged step length may be associated with an improved running velocity (Marais
et al., 2003; Hunter et al., 2004 & Ballreich, 1976). Research also suggests that music is

10
advantageous as it can potentially increase exercise performance (Barwood et al., 2009;
Karageorghis et al., 2009; Karageorghis et al., 2012; Simpson & Karageorghis, 2006;
Terry et al., 2012; & Vlist, Bartneck, & Maueler, 2011). Music cadence is considered an
important component in music as it is used to create synchronized movement and
locomotor rhythmicity (Schneider et al., 2010). It should be considered that a faster music
cadence may result in an increased step frequency during running. If this is proven to be
true, then it can significantly impact the way recreational runners train for an event. It
would be beneficial for runners to know how to manipulate the music’s cadence to help
optimize the training effect (Karageorghis et al., 2010). Although research has been
previously conducted on music cadence, step frequency, and step length, more focus
needs to be placed in a real world setting. The vast majority of this research is basic in
that it has been observed in laboratories, thus having limited application to everyday life.
If applied research presents similar results and shows a potential ergogenic effect of
music on exercise performance, ecological validity would be increased.

11
CHAPTER 2: LITERATURE REVIEW
One of the main goals for recreational runners is to improve their time in various
road races. An improvement in time to completion, also known as running velocity, is an
important indicator of increased running performance. Research suggests that running
velocity may improve with an increase in step frequency or step length without a
significant decrease in the other (Marais et al., 2003; Hunter et al., 2004 & Ballreich,
1976). Music cadence may be able to help increase step frequency and time to
completion for a recreational runner. Other research indicates that music provides a
potential ergogenic effect in exercise performance (Karageorghis & Priest, 2012). The
research presented below describes multiple studies that have previously observed the
relationship between step frequency, step length, and running velocity; and the effect of
music on exercise performance.
Step Frequency, Step Length, and Running Velocity
Previous research has examined the relationship between step frequency, step
length, and running velocity. A study by Hunter et al. (2004) describes the inverse
relationship between step frequency and step length. The determinants of step frequency
in this study were stance time and flight time measured in meters per second (m/s).
Stance time was indicated by the amount of time the foot was in contact with the ground,

12
and flight time was indicated by the amount of time both feet were in the air. The
determinants of step length in this study were stance distance and flight distance
measured in meters. Sixteen men participated in this study and completed seven to eight
maximal effort sprints on a track located inside a laboratory. These sprints were 25
meters in length. A video camera was used to observe each participant’s body mechanics
during running along with step frequency and step length. Results revealed that at
maximal effort, an inverse relationship existed between step frequency and step length (p
< 0.01), as runners who had a longer step length had a lower step frequency and vice
versa. This may be attributed to a runner’s leg length. Hunter et al. (2004) describes a
direct relationship between leg length and step length and an inverse relationship between
leg length and step frequency. Hunter et al. (2004) also explains that step frequency is
lower in individuals who have a long legs because of the increased inertia exerted on
them during running, thus creating a longer stance time and stance distance. During this
study, runners were separated into two different groups of step length and step frequency.
Identical sprint velocity was observed from both groups, indicating that both step length
and step frequency are both related to running velocity. Therefore, it is apparent that an
increase in step frequency, step length, or both without a decrease in the other will
improve sprint velocity (Hunter et al. 2004).
Hunter, Marshall, and McNair (2005) also found that an increased step frequency
improves sprint velocity in runners. Hunter et al. (2005) explains that the acceleration
phase of a run is optimized with a smaller flight time in the air, as there is more force
exerted from the ground to increase acceleration. This is due to more ground reaction

13
force applied on the runner when step frequency is increased, resulting in faster
movement.
In contrast to the above study, Mackala (2007) observed the relationship between
step frequency, step length, and running velocity in two groups of male sprinters running
100-meters along the curve of an outside track. Every ten meters was analyzed with a
video camera. Results indicated that step length was the primary contributor to the
increase in running velocity during this study. Mackala (2007) describes this running
velocity increase as more ground being covered along the curve with a longer stride.
Although this is true, it is important to point out that step frequency remained relatively
constant throughout the 100-meter sprint. In addition, any ten-meter interval that running
velocity decreased, step frequency and step length both decreased as well. This study
provides some general insight into the relationship between step frequency and step
length. According to Ballreich (1976), there are five relationships that exist between step
frequency and step length that contribute to an improvement in running velocity for sprint
performance. These relationships are presented in Table 2.1.
Table 2.1 Relationships between Step Frequency and Step Length (Ballreich, 1976)
Step Frequency Step Length
Increases Increases
Increases Unchanged
Increases Slightly decreases
Unchanged Increases
Slightly decreases Increases

14
Running Economy
The energy output of altering step length and step frequency is also an important
consideration during running performance. A study by Hogberg (1952) found that
shortening or lengthening a runner’s stride causes an increase in oxygen consumption in
well-trained runners. A Douglas bag was used to measure oxygen consumption and it was
found that the most economical running step length was one freely chosen by the runner.
A significant finding was that the speed of running had increased with a faster step
frequency (Hogberg, 1952). In contrast, a study conducted by Cavagna, Mantovani,
Willems, & Musch (1997) observed oxygen consumption in altering step frequencies.
Results indicated that either increasing or decreasing a runner’s natural step frequency
required a higher mechanical power and energy expenditure from the runner. Therefore,
the most economical run is based on the runner’s freely chosen step frequency (Cavagna
et al., 1997).
Injury Prevention
Daniels’ Running Formula (1998) provides various training techniques for
runners competing in different events. One of the important techniques mentioned was
observing the step frequency in runners. Daniels describes that runners may have a higher
chance of injury with a slower step frequency as more time is spent in the flight phase of
running. This results in the body’s mass being displaced higher in the air, causing a
harder landing with each step, resulting in injury and joint pain. Therefore, it may be
beneficial for the runner to develop a higher step frequency (Daniels, 1998).

15
To further elaborate on injury prevention with an increased step frequency,
Heiderscheit, Chumanov, Michalski, Wille, and Ryan (2011) observed the loading
absorption on specific joints with altered step frequency during running. It was
hypothesized that when step frequency is increased, energy absorption by lower
extremity joints at the hip, knee, and ankle would decrease. Forty-five recreational
runners participated in this study and each runner had a preferred speed (2.9 ± 0.5 m/s)
and corresponding step frequency (172.6 ± 8.8 steps/minute) on a treadmill. Each
runner’s step frequency was then increased and decreased by 5% and 10% using a digital
metronome. Results indicated that during all five exercise conditions, less energy was
absorbed at the knee joint with an increased step frequency of 5-10% above runners
preferred step frequency. It was also statistically significant that hip joint absorption
decreased when step frequency was increased 10% above preferred step frequency. These
results indicate that there is an inverse relationship between step frequency and knee and
hip joint absorption during running (Heiderscheit et al., 2011).
Step Frequency and Music Tempo
Research has been conducted that observes the relationship between step frequency
and music cadence. Ahmaniemi (2007) observed the influence of both music cadence and
the motivational rating of music on step frequency during running. Eight marathon
runners rated 50 songs on motivational quality using a 1-100 Likert scale. Participants
listened to 50 personal songs they selected and rated each song based on how
motivational it was to exercise. The location of this study was on a sports field with a
350-meter running track. Participants ran around the track for 30 minutes while listening

16
to six to ten different songs on a mobile phone that also had a sensor signal to calculate
step frequency in five-second intervals. After data collection, all sessions were combined
into one dataset and each song had a motivational rating, tempo, and step frequency
coordinated with it. Results revealed that there was a significant relationship between the
motivational rating of music and step frequency. It was also discovered that there was no
significant relationship between music cadence and step frequency. These findings
suggest that musical preference has a strong influence on step frequency, and this shows
the importance of song selection in accordance to exercise (Ahmaniemi, 2007). Although
this data shows no significant relationship between step frequency and music tempo, the
sample used in this study was taken from an active marathon running group. Runners in
this group may be trained to run at a particular step frequency with less influence from
the music. Those who do not participate in active marathon training may have different
results with music tempo and step frequency.
Motivational Qualities and Psychological Influence
One of the major limitations involving research with music and exercise is how to
manipulate music to make it motivational for the individual being tested. This is because
individuals will have very different associations of music from one another, as music
tends to evoke certain feelings, thoughts, and emotions from past experiences and various
sociocultural upbringings.
The Brunel Music Rating Inventory (BMRI) is a psychometric instrument used in
research that determines the motivational quality of music. Karageorghis, Terry, and
Lane (1999) define the BMRI as a thirteen question ten point Likert scale used to assess

17
different elements of a song that can make an individual feel motivated. These elements
include: familiarity, tempo, rhythm, lyrics, association of music with sport, chart success,
association with a film or video, the artist(s), harmony, melody, simulative qualities of
music, danceability, and date of release (Karageorghis et al., 1999). The BMRI was later
redesigned as the Brunel Music Rating Inventory-2 (BMRI-2). Karageorghis et al. (2006)
explain that this was mainly due to the fact that there were errored response trends
observed in individuals completing the BMRI, as individuals tended to miscomprehend
certain musical elements. According to Karageorghis et al. (2006), the BMRI was
intended more for researchers and fitness instructors while the BMRI-2 is now more user
friendly for the recreational individual as well.
In the BMRI, motivational quality was originally defined as the extent of which
music inspires or stimulates physical activity (Karageorghis et al., 1999). In the BMRI-2,
the definition of motivational quality changed to the extent of which music will make an
individual want to exercise harder and longer (Karageorghis et al., 2006). The number of
questions in the BMRI-2 is six compared to the original BMRI of thirteen. It is also now
based on a seven point Likert scale comprised of three categories that include strongly
disagree, in-between, and strongly agree. The aim of this questionnaire was to have
individuals rate various musical elements such as rhythm, style, melody, tempo,
instruments used, and beat. According to Karageorghis et al. (2006), these terms are more
easily comprehended and may have less error in responses compared to the original
BMRI. Based on the motivational quality of music assessed with the BMRI and BMRI-2,
it strongly appears that music has an influential and motivational role in terms of
exercise.

18
The preference of music cadence may be considered a motivational aspect during
exercise. Karageorghis, Jones, and Stuart (2007) examined the motivation of exercise in
three different music conditions consisting of a medium cadence of 120-140bpm, a fast
cadence of >160, a mixed cadence, and no cadence as the control. A total of 29 men and
women were tested and each individual walked on a treadmill at 70% of their heart rate
reserve (HRR). The participants took the Intrinsic Motivation Inventory (IMI) as a
subjective measure to rate the interest or enjoyment of the experience. Intrinsic
motivation is the type of motivation individuals experience without any external
pressures or influences on them. Overall, the scores were highest in the medium and fast
conditions compared to the mixed condition and the control condition of no music. This
finding suggests that music improves intrinsic motivation with the presence of a medium
and fast cadence (Karageorghis et al., 2007).
A similar study by Priest, Karageorghis, and Sharp (2004) compared music
cadence in the form of slow (80bpm), medium (120bpm) and fast (140bpm) music in
participants exercising at 40%, 60%, and 75% heart rate reserve (HRR) on a treadmill.
Cadence preference was analyzed, and results revealed that participants had a greater
preference for a fast or medium cadence compared to a slow cadence (Priest et al., 2004).
Another study by Lim, Atkinson, Karageorghis, and Eubank (2007) also revealed that
participants preferred fast music cadence during high intensity exercise during a ten-
kilometer cycle time trial. Performance did not improve in this study across three cadence
conditions, however the overall rating of perceived exertion (RPE) was significantly
lower in the fast cadence music condition (Lim et al., 2007).

19
Barney, Gust, and Liguori (2010) investigated exercise adherence motivation
through the use of personal music players (PMP) such as iPods, mp3 players, etc. in
200 college students. In this study, the students were not physically exercising, but were
asked questions regarding usual exercise habits through a self-constructed questionnaire.
The first question asked why the personal music player was used, and if they would
exercise as frequently without it. The most popular answers to the first question were: “to
work out harder”, “exercise seems easier”, “to work out longer” and “exercise is more
fun” These responses indicate that listening to music has positive effects on motivating
performance and improving psychological state with exercise. (Barney et al, 2010).
Results showed that running was the most common mode of exercise in which PMP’s
were used followed by weight lifting. Forty percent of participants indicated they would
not work out without their PMP. It was concluded that PMP’s help college students work
out more frequently, with more intensity, and for longer durations. (Barney et al., 2010).
Vlist, Bartneck, and Maueler (2011) observed intrinsic motivation in the context
of its ability to capture attention and help individual’s focus less on distress cues during
exercise. Intrinsic motivation is considered the type of motivation that occurs when
people engage in an activity without having an external pressure or influence on them
(Vlist et al., 2011). A product called MoBeatwas developed in this study that provides
interactive music and training that encourages individuals to exercise at a particular
intensity during workouts. The system used motivational lyrics and pitches to indicate
whether intensities were reached or not. The study took 26 healthy men and women, ages
23-51 years. The protocol consisted of a five-minute warm-up followed by ten-minutes of
interval training (each interval lasting 2.5 minutes in duration with an intensity between

20
60-85% of the individual’s maximal heart rate), and a five-minute cool down on a
stationary bike. Results on internal motivation were then analyzed based on the Intrinsic
Motivation Inventory, the Attentional Focus Questionnaire, and RPE during the test. The
Attentional Focus Questionnaire determined whether individuals were able to dissociate
their attention from exercise. Other variables measured included time in the intensity
zone (percent of max heart rate), time out of the intensity zone (percent of max heart
rate), and revolutions per minute (rpms). Results indicated a significant effect on
increasing individual fun/enjoyment, perceived competence, and dissociation from
exercise. The MoBeat music system created higher intrinsic motivation for exercise based
on the lower dissociation scores obtained by the Attentional Focus Questionnaire (Vlist et
al., 2011). This study reveals that music is advantageous in the aspect of having
individuals dissociate from exercise, thus drawing their attention from the exercise itself.
It is also shown that music is able to increase intrinsic motivation for the individual.
Psychological, Psychophysical, and Ergogenic Effects
In research, it has been hypothesized that music has various psychological,
psychophysical, and ergogenic effects on individuals while exercising. According to
Karageorghis and Terry (2009), psychological effects refer to how music influences
mood, emotion, pleasure, cognition, and behavior; psychophysical effects refer to music’s
ability to decrease ratings of perceived exertion (RPE); and ergogenic effects are when
music is able to increase work output and yield higher levels of endurance, power,
productivity, and strength (Karageorghis & Terry, 2009).

21
Karageorghis et al. (2009) found greater time to fatigue in participants walking at
75% of their maximum heart rate reserve (HRR) on a treadmill. Time to fatigue was
measured with a stopwatch starting from when participants reached 75% maximal HRR,
and stopping when participants reached voluntary fatigue. There were three music
conditions used in this study that consisted of motivational music (highest score achieved
on the BMRI), outdeterous music (lowest score achieved on the BMRI), and no music.
Results indicated that time to fatigue was significantly higher in both music conditions
compared to the control condition of no music. In addition, time to fatigue was
significantly higher in the motivational music condition compared to the outdeterous
music condition. There was no significant difference in RPE among music conditions. In
this study, it was also found that the two music conditions elicited positive mood
responses to a greater extent than the control condition of no music (Karageorghis et al.,
2009).
Another study conducted by Barwood, Weston, Thelwell, and Page (2009) used
music and video intervention in association with high intensity exercise. The study used
six healthy men who performed three 15-minute maximal effort runs on a treadmill.
There were three exercise conditions consisting of a control group with no music or
video, a motivational group with preferred music selected by participants using the
BMRI, and a non-motivational group with video of public speaking from a political trial
that had no synchronous activity. Based on the BMRI, songs were selected for this study
according to the highest ratings obtained in this questionnaire. Performance was
determined by distance covered per trial. Results indicated that music enhanced running
performance, as the farthest distance covered was achieved in the motivational music

22
condition. In contrast, the video condition resulted in the least distance covered, even in
comparison to the control condition of no music and video. Barwood et al. (2009)
explains that this may be due to too many external distractions as participants were most
likely focusing on the political content of the video. There was also no synchronous
activity in this condition, meaning movement was not coordinated with any tempo or beat
(Barwood et al., 2009).
In contrast to the findings by Karageorghis et al. (2009) and Barwood et al.
(2009), there may not be a significant difference among music conditions in exercise
performance. Simpson and Karageorghis (2006) investigated synchronous music during
400-meter sprint running. Twenty men participated in the study and rated 32 songs on
motivational quality using the Brunel Music Rating Inventory-2 (BMRI-2). The highest
scoring song from the BMRI-2 represented the motivational music condition while the
lowest scoring song from the BMRI-2 represented the oudeterous music condition.
Oudeterous music in this study represented a neutral condition where music was
considered neither motivating nor demotivating. The first trial was conducted for runners
to practice the experimental task, and to obtain natural step frequency. Based on their step
frequency, runners were assigned to a specific lane for the duration of the study, and
during time trials six people ran at one time. Runners completed a 400-meter time trial on
an outdoors track under three conditions of motivational music, oudeterous music, and no
music. Three researchers measured time with a handheld stopwatch, and a video camera
was used for accurate measurement of step frequency. Results indicated that 400-meter
times were faster in the motivational and oudeterous music conditions compared to the
control condition of no music. There was however no significant difference between the

23
motivational condition and oudeterous condition in 400-meter time trials. It was
concluded that during a 400-meter sprint, the rhythmic aspect of music is what provides
an ergogenic effect, thus increasing performance regardless of its motivational quality
(Simpson & Karageorghis, 2006).
Oxygen Consumption and Blood Lactate Concentrations
Research has been conducted that observes the effect of music on physiological
parameters such as oxygen consumption and blood lactate concentrations. Smoll and
Schultz (1978) state that the synchronous music results in a reduced metabolic cost of
exercise by promoting greater neuromuscular or metabolic efficiency. A study conducted
by Bacon, Myers, and Karageorghis (2012) helps support this finding. Ten untrained
men, ages 20-22 years, completed a 12-minute exercise test on a cycle ergometer.
Participants exercised at 70% of their maximal heart rate with a pedal cadence of 65
revolutions per minute (rpms). The three music conditions included a slow asynchronous
tempo, a fast synchronous tempo, and a control condition of no music. Measurements of
VO2, heart rate, and RPE were all analyzed during this study. Results indicated that there
were no differences in heart rate or RPE among music conditions. VO2 however, was
found to be approximately 7% lower in the fast synchronous music condition compared
to the slow asynchronous condition. This finding reveals that synchronous music with a
fast tempo is advantageous over asynchronous music during submaximal exercise as it
reduces overall effort exerted by the individual (Bacon et al. 2012).
A study conducted by Terry, Karageorghis, Saha, and Auria (2012) observed the
effects of synchronous activity on high intensity exercise and blood lactate

24
concentrations. This study consisted of treadmill running among 11 elite athletes (five
women, six men). There was a motivational, neutral, and control condition, and music
was rated on the BMRI. A higher score on the BMRI had a higher motivational rating
compared to a lower score. In this study, songs were placed in the motivational category
with a score > 36, and songs were placed in the neutral category with a score between 18-
30. The control condition consisted of no music. Athletes completed a treadmill test with
a five-minute warm-up, a four-minute submaximal intensity, a five-minute break, and a
run to exhaustion at 110% of their lactate threshold. Results demonstrated that endurance
performance improved significantly as athletes ran a full minute longer with motivational
and neutral music. RPE was lower in both the motivational and neutral conditions. In
addition to improved exercise performance, lower blood lactate concentrations were also
discovered in this study. The lowest measurement of blood lactate concentrations was
found in the motivational music condition. These findings reveal that motivational and
neutral music can improve exercise performance and lower the physiological parameter
of blood lactate during exercise (Terry et al., 2011).
Yamamoto et al. (2003) conducted a study that examined the effect of listening to
slow and fast rhythm music before exercise on supramaximal cycle performance. The
study also looked at blood lactate concentrations and catecholamines epinephrine,
norepinephrine, and dopamine. Six men who regularly participated in recreational sports
at least three times per week participated in this study. The two music conditions
consisted of slow classical music and fast music. The students lay in a supine position for
20 minutes while listening to music. Afterwards, blood samples were taken and then
participants mounted the bike. After a one-minute warm-up period, the subject performed

25
a 45 second supramaximal cycle ergometer test. The resistance was set at 7.5% body
weight in kilograms and performance was determined in revolutions per minute (rpms).
Seven-milliliter blood samples were then taken post exercise. Results indicated that
music had no effect on power output during testing, however there was a significant
difference observed in epinephrine and norepinephrine concentrations. Before exercise,
epinephrine concentrations were higher after listening to the fast rhythm, and
norepinephrine levels were lower after listening to the slow rhythm. After exercise, there
was no significant effect between fast or slow music on blood lactate concentrations.
Yamamoto et al. (2003) describes the pre-exercise results as music affecting the
sympathetic activation from the adrenal medulla. The slower rhythm decreased
sympathetic activation while the faster rhythm increased sympathetic activation
(Yamamoto et al., 2003).
Recommendations for Music and Exercise
Based on the magnitude of research that showcases music’s effect on creating
positive attitudes, increasing performance, and decreasing physical exertion with
exercise, Karageorghis, Terry, Lane, Bishop, and Priest (2012) provided guidelines for
the use of music during exercise. Some of the effects of music on exercise mentioned in
this article include increasing attentional focus (Netherly, 2002), increasing work rate
(Rendi, Szabo A., & Szabo T., 2008), strength (Karageorghis et al., 2011), and improving
time to exhaustion by 15% compared to a no music control condition (Karageorghis et
al., 2009). Guidelines for the use of music and exercise are provided by Karageorghis et
al. (2012) in Table 2.2.

26
Table 2.2 Recommendations for Music and Exercise (Karageorghis et al., 2012)
1. Familiarity to the music (personal preferences)
2. Functional for the activity- rhythm mimics motor patterns involved
3. Tempo is specific to desired effects
4. Selected based on an objective measure such as the BMRI-2
5. Rhythm, melody, and harmony included for repetitive exercise tasks
6. Cadence of 125-140 for asynchronous music; Cadence synchronized to desired
movement for synchronous music
7. Lyrics are motivational
8. Used in safe situations
The vast majority of research on music and exercise indicates that music provides
individuals with psychological, psychophysical, and ergogenic effects that all contribute
to an increase in exercise performance. Therefore, it appears that synchronous music used
in the correct form can be added to an exercise session in order to improve running
performance in recreational runners. This can be accomplished by the runner’s ability to
synchronize his or her own step frequency to the music cadence of the song.
\

27
CHAPTER 3: METHODS
Participants
There were a total of 15 men and 15 women who participated in this study. These
individuals were recreational runners who participated in an organized running group that
met approximately two times per week. Over six months prior to the study, these
individuals were able to run 1600 meters continuously under ten minutes. These
participants also ran an average of 4.0 0.78 (range 3.0-6.0) days per week. Based on the
participant background survey, 37% indicated that they always listen to music, 50%
indicated that they sometimes listen to music, and 13% indicated that they did not listen
to music when training for a road race. Each runner was assigned a participant number in
order to ensure privacy during and after data collection. Please refer to Table 3.1 for
participant characteristics.
Study Incentives. Two incentives were provided to runners who participated in
this study. The first incentive was a $20.00 gift card that could be used at a local running
store in Wesley Chapel, Florida. The second incentive was a free VO2 max test to be
performed in the Health and Exercise Science Laboratory at University of South Florida.
Study Location. This study took place at a public middle school’s outdoor
track located in Tampa, Florida. This 400-meter track had an asphalt surface with start
and finish line markings.

28
Table 3.1 Participant Characteristics
Mean SD Range
Age (years) 31.0 5.8 20.0 - 39.0
Height (meters) 1.7 0.1 1.6 - 1.9
Weight (kg) 71.8 11.0 58.2 -102.3
Body Mass Index (kg/m2) 24.0 3.3 19.0 - 32.0
VO2 max (ml/kg/min) 49.6 5.4 41.0 - 60.6
Running Frequency (days/week) 4.0 0.8 3.0 - 6.0
Instrumentation/Equipment
Participant Documents and Forms. Prior to participation, runners completed a
medical history questionnaire. This questionnaire helped the researcher determine risk
status of the participant (Appendix A). The study’s physician reviewed the medical
history and qualified runners for participation in the study.
Participants also completed an informed consent document. This document
informed each runner of the research being conducted along with associated benefits and
risks that may occur. Runners signed the document if they willingly agreed to participate.
A third form runners completed was the participant background survey (Appendix
B). This survey was self-constructed by the researcher and was sent through email to
gather demographic and background information on participants.

29
Before each trial, a copy of ACSM’s Current Comment on Pre-Event Meals was
provided to runners (Appendix C). This statement gave appropriate dietary information as
well as recommendations on what to consume before an exercise-related event. Runners
were encouraged to adhere to this statement 24-hours before each time trial.
The last form provided to runners included a list of materials indicating what to
bring to the track (Appendix D). Runners were asked to wear similar clothing, shoes, and
to bring the same items for each experimental trial.
Software Programs and the BMRI-2. The software program iTuneswas used
to download motivational songs for each runner. After songs were downloaded, they
were imported into another software program, Audacity. Once in Audacity, the
researcher was able to change the cadence of each song based on the natural step
frequency obtained during each runner’s familiarization trial. After songs had been
manipulated, they were imported back into iTunes, organized into playlists, and synced
onto one portable iPod Nano. Each runner used the iPod Nanoduring time trials that
required music conditions. An armband was used to hold the iPod Nanoin place.
Once music conditions were created, each runner rated the motivational quality of
songs on their personal playlists with the Brunel Music Rating Inventory Questionnaire-2
(BMRI-2, Appendix F). A document to describe elements of music on the BMRI-2 such
as rhythm, style, melody, tempo, instruments used, and beat was provided to runners in
order to ensure appropriate understanding (Appendix E). A portable iHomedevice was
used to play songs aloud for runners while they were completing the BMRI-2.

30
Data Collection Equipment. A Meade TE688W Weather Forecasterwas
used to record accurate environmental data during the time of the study. This
environmental data included temperature, percent humidity, and barometric pressure.
A stopwatch was used to measure time to complete 1600 meters at maximal
effort. A countdown timer set to 60 seconds was used to measure step frequency for each
runner. The same stopwatch and countdown timer were used for each experimental trial.
A Polar heart rate monitor was used to assess each runner’s heart rate response
before and after exercise. Heart rate was recorded four times during each trial and
included resting heart rate taken before the warm-up, pre-exercise heart rate taken after
the warm-up, post-exercise heart rate taken immediately after the 1600-meter run, and
recovery heart rate taken approximately five minutes after cool-down. Runners wore both
the chest strap and watch, which provided accurate heart rate information during each
time trial.
Procedures
Pre-Study Procedures and Forms. Runners from the recreational running group
completed a medical history questionnaire, informed consent document, and participant
background survey. The participant background survey asked runners to list the name and
artist of 20 motivational songs that they typically listen to when training for a road race.
If runners did not listen to music during training, then they were asked to list the name
and artist of 20 motivational songs for personal enjoyment. This survey also gathered
information regarding each runner’s current running activity within the past six months.

31
Familiarization Trial. Each runner selected a convenient date and time for
participation in the familiarization trial. This trial was held at the same time of day as
experimental trials, no more than three weeks and no less than two days before data
collection. Before this trial, runners were asked to read ACSM’s Current Comment on
Pre-event Meals. Participants were strongly encouraged to follow this comment 24 hours
before their familiarization trial. At the time of the trial, runners were asked whether they
adhered to ACSM’s Current Comment, and this information was recorded on the data
collection sheet. Runners who indicated that they did not adhere to ACSM’s Current
Comment still participated in the familiarization trial.
There were two main goals of the familiarization trial. The first goal was to
acquaint runners with the experimental task. In this trial, runners completed a 1600-meter
maximal effort run with no music. The same equipment, data collection sheet, and layout
of actual research trials were implemented during this trial. The second goal of the
familiarization trial was to gather each runner’s baseline running information. This
information included natural step frequency and time to complete the 1600-meter run.
Natural step frequency was needed prior to actual data collection in order to generate the
two music conditions.
Preparation of Music Conditions. Once the research technician had gathered all
of the data from the familiarization trial, the researcher reviewed each runner’s
participant background survey that included the motivational song list. Two to five songs
from this list were downloaded from iTunesaccording to how close the music cadence
was to the natural step frequency of the runner. The number of songs downloaded was
dependent on time length of the song and was based on the runner’s time to completion
32
during the familiarization trial. It was important that the length of time in each playlist
was not shorter than the runner’s time to completion during the familiarization trial. This
was to ensure that music would not stop playing during any 1600-meter time trial.
The researcher then imported each song into Audacityand manually increased
or decreased the original cadence of the song to match the designated cadence of the two
music conditions. The first condition represented music at natural step cadence, while the
second condition represented music at increased step cadence. Increased step cadence
was represented by an increase of 10-20 beats per minute (bpm) above the natural step
cadence condition. For example, if a runner had an average step frequency of 160 steps
per minute (steps/min) during the familiarization trial, then the natural cadence music
condition would be 160 beats per minute (bpm) and the increased cadence music
condition would be between 170-180 beats per minute (bpm).
After songs were manipulated, they were then imported back into iTunesand
organized into two separate playlists. The first playlist represented music at natural step
cadence while the second playlist represented music at increased step cadence. Each
runner was provided with his or her own two playlists representing both music
conditions. These playlists were named according to the participant numbers. Songs were
then synced onto one iPod Nano.
After both playlists were created for each participant, each runner completed the
BMRI-2 (Karageorghis et al., 2006). The researcher played one full minute of each song
from both playlists on a portable iHomedevice, and runners completed the BMRI-2
while they were listening to each song being played aloud. At the time runners were
taking the BMRI-2, they were provided with a handout that defined all of the terms in

33
order to ensure appropriate understanding. These terms included rhythm, style, melody,
tempo, instrumental sound, and beat. Runners were also allowed to ask the researcher to
clarify any terms if necessary.
After each runner took the BMRI-2, the researcher reviewed the results and
reorganized songs on the runner’s playlist. Songs were placed in the order of most
motivational to least motivational. Songs with a higher score were considered more
motivational in comparison to songs with a lower score on the BMRI-2.
Data Collection. There were a total of three randomized trials during this study
that took place no less than three days and no more than five weeks apart. During each
trial, participants ran 1600 meters at maximal effort with one of the three music
conditions. One was a control condition of no music. Another was a natural cadence
music condition (playlist one). Lastly, there was an increased cadence music condition
(playlist two).
There was a minimum of two researchers present during each time trial. Before
the study began, researchers recorded the date, time, participant number, condition, and
adherence to ACSM’s Current Comment on the data collection sheet. After this was
completed, researchers instructed the runner to put the Polar heart rate monitor on and
offered assistance if necessary. Researchers then recorded the runner’s resting heart rate
after five minutes of sitting on the bleachers.
After the above information was recorded, researchers led the runner in a
standardized warm-up. This warm-up included one light jog around the track followed by
dynamic stretching. Dynamic stretches took place along the 50-meter straightaway on the
outdoor track. Stretches included high knees, butt kicks, side-shuffle, karaoke, toe

34
touches, lateral lunges, and a 50-90% effort strider run. Approximately one to two
minutes following warm-up, researchers recorded pre-exercise heart rate.
Immediately before the runner was ready to begin, he or she lined up one to two
feet behind the starting line. At this time, researchers used the Meade TE688W Weather
Forecasterto record the environmental parameters of temperature, humidity, and
barometric pressure. This information was recorded on the data collection sheet as well
as any other environmental factors such as wind, rain, thunder, lighting, etc. If a trial
was one with music, researchers would select the runner’s playlist on the iPod Nano,
have the runner select an appropriate volume, and help secure the armband on the
runner. The runner was then instructed to hit the play button before crossing the line to
start.
Once the runner was ready, the researcher responsible for timing yelled, “Ready,
set, go!” At this time, the runner completed 1600 meters (four laps around the track) in
lane one at maximal effort. Official time started when both feet crossed the starting line,
and official time ended when both feet crossed the finish line.
As the participant was running around the track, the researcher stood in the grassy
area located in the center of the track and counted step frequency. Step frequency was
measured for 60 seconds beginning at the 50-meter mark along the first straightaway and
through the curve in each lap of the time trial. This accounted for distributing step
frequency equally among straightaways and curves. The researcher used a countdown
timer set to 60 seconds and counted the number of times the left foot hit the ground in
one minute. This number was then multiplied by two in order to account for step
frequency in both feet.

35
At the end of the fourth lap, the first researcher hit stop on the stopwatch at the
time the runner had both feet cross the finish line. The researchers then recorded time in
minutes and post-exercise heart rate on the data collection sheet. After the time trial was
complete, the runner performed a light cool-down. This cool-down consisted of a light
jog around the track followed by static stretching. Static stretches focused on hamstrings,
quadriceps, calves, lower back, and shoulders. All stretches were held for 20 seconds.
Researchers then recorded recovery heart rate after cool down which was approximately
five minutes post exercise. Recovery heart rate had to be within 20 beats per minute
(bpm) of resting heart rate before the runner was allowed to leave the track.
After the data collection sheet was complete, the researcher performed an
algebraic equation in order to determine the runner’s step length during each time trial.
Step frequency, time to completion, and overall distance were the known variables in this
equation. This equation was: 1600 meters / step frequency (steps/min) x time (min). The
purpose of this calculation was to determine the relationship between step frequency, step
length, and time to completion during a 1600-meter maximal effort run.
The final calculation performed was a 1600-meter run VO2 max prediction
equation. This equation was: 2.5043+ (0.8400 x pace in km/hour). The purpose of
calculating a predicted VO2 max was to determine the level of aerobic fitness for the
recreational runner (Tokmakidis, Leger, Mercier, Peronnet, & Thibault, 1987).
Statistical Analyses
Statistical analysis was performed using the Statistical Package for Social
Sciences, Version 22.0(SPSS). Three separate one-way ANOVAs were used to assess
the difference in dependent variables (step frequency, step length, and time to completion

36
during a 1600-meter maximal effort run) among the three levels of music cadence. In
addition, three separate one-way ANOVA’s were used to assess the difference in
environmental conditions (temperature, humidity, and barometric pressure) among the
three levels of music cadence. The p-value to determine significance was set at p < 0.05.
Paired samples t-tests were then performed on any variable that showed significance (p <
0.05). Finally, after all statistical analyses was complete, effect sizes (ES) were calculated
in order to determine the strength for each music condition on step frequency, step length,
and time to completion.

37
CHAPTER 4: RESULTS
Statistical analysis was performed on each environmental condition as well as
each dependent variable. These included temperature, humidity, barometric pressure, step
frequency, step length, and time to completion. The results of this analysis are described
and represented in tables and figures below.
Environmental Conditions
This study took place in an outside environment where there was limited control
over certain factors such as temperature, humidity, and barometric pressure. A one-way
ANOVA was performed on each of these parameters in order to ensure that there was no
significant difference in the environment among music conditions. Results revealed that
within-participants, there was no significant difference (p > 0.05) in temperature,
humidity, or barometric pressure between experimental conditions. Please refer to Table
4.1.
Step Frequency
As predicted in HA1, there was some variation in step frequency among the three
music conditions. A one-way ANOVA was performed and results were significant (p <
0.05), indicating that there was a difference in step frequency among the three time trials.
Follow-up paired samples t-tests were then performed in order to determine significance

38
between each music condition. Results demonstrated that there was no significant
difference (p > 0.05; ES = 0.16) in step frequency between the no music and natural
cadence music conditions. There was however, a significant difference (p < 0.05; ES=
0.54) in step frequency between the no music and increased cadence music conditions.
There was also a significant difference (p < 0.05; ES = 0.40) in step frequency between
the natural cadence music and increased cadence music conditions. Step frequency was
significantly increased (p < 0.05) during the increased cadence music condition. Please
refer to Table 4.2, Table 4.3, and Figure 4.1.
Step Length
During this study, step length was not considered a major factor as it was assumed
that step length would either remain the same or slightly decrease as a result of the
change in step frequency. A one-way ANOVA was performed in order to determine
whether step length was significantly different among the three music conditions. Results
indicated that there was no significant difference (p > 0.05; ES range = 0.00 - 0.06) in
step length. Please refer to Table 4.2, Table 4.3, and Figure 4.2.
Time to Completion
It was hypothesized in HA2 that music cadence would have a significant effect on
improving time to completion during the 1600-meter run. A one-way ANOVA was
performed and results were significant (p < 0.05), indicating that there was a difference in
time to completion among the three time trials. Follow-up paired samples t-tests were
then performed in order to determine significance between each music condition. Results
demonstrated that there was no significant difference (p > 0.05; ES = 0.05) in time to
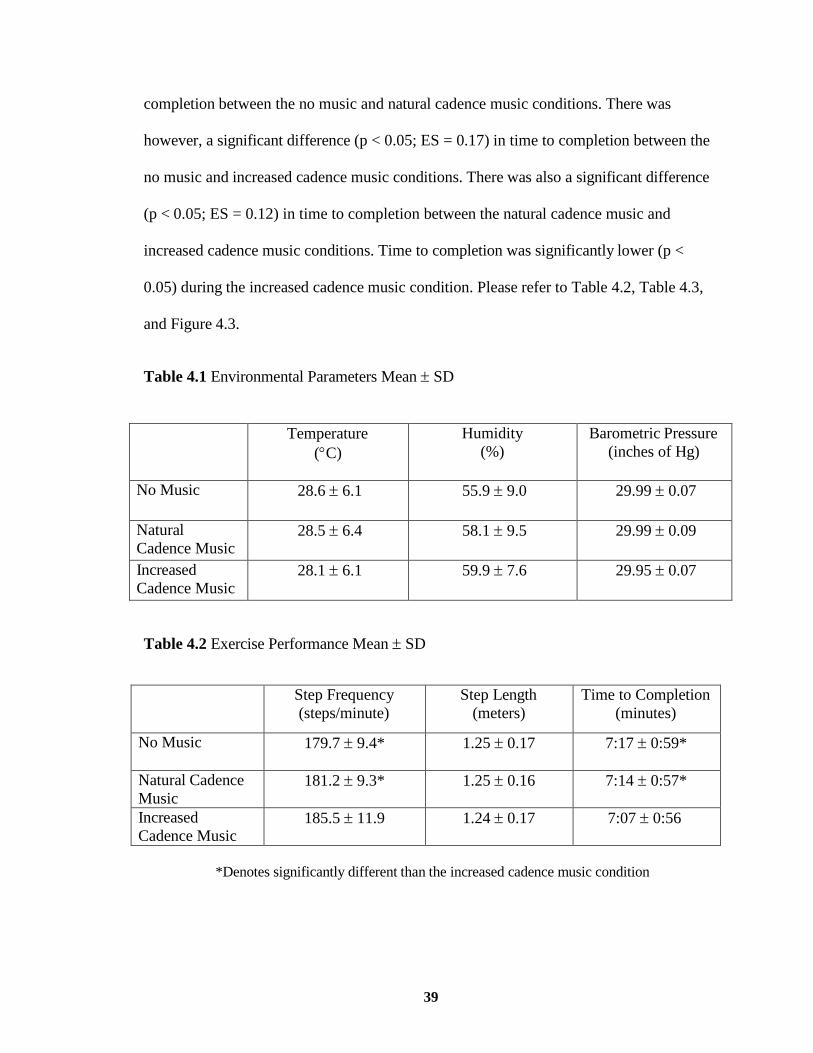
39
completion between the no music and natural cadence music conditions. There was
however, a significant difference (p < 0.05; ES = 0.17) in time to completion between the
no music and increased cadence music conditions. There was also a significant difference
(p < 0.05; ES = 0.12) in time to completion between the natural cadence music and
increased cadence music conditions. Time to completion was significantly lower (p <
0.05) during the increased cadence music condition. Please refer to Table 4.2, Table 4.3,
and Figure 4.3.
Table 4.1 Environmental Parameters Mean SD
Temperature
(C)
Humidity
(%)
Barometric Pressure
(inches of Hg)
No Music 28.6 6.1 55.9 9.0 29.99 0.07
Natural
Cadence Music 28.5 6.4 58.1 9.5 29.99 0.09
Increased
Cadence Music 28.1 6.1 59.9 7.6 29.95 0.07
Table 4.2 Exercise Performance Mean SD
Step Frequency
(steps/minute)
Step Length
(meters)
Time to Completion
(minutes)
No Music 179.7 9.4* 1.25 0.17 7:17 0:59*
Natural Cadence
Music 181.2 9.3* 1.25 0.16 7:14 0:57*
Increased
Cadence Music 185.5 11.9 1.24 0.17 7:07 0:56
*Denotes significantly different than the increased cadence music condition

40
Step Frequency
190
188
186
184
182
180
No Music
Natural Cadence Music
Increased Cadence Music
178
176
174
172
Table 4.3 Exercise Performance Effect Sizes
Step Frequency Step Length Time to Completion
No Music vs.
Natural Cadence
Music
0.16 0.00 0.05
Natural vs.
Increased Cadence
Music
0.40 0.06 0.12
No Music vs.
Increased Cadence
Music
0.54 0.06 0.17
Figure 4.1 Step Frequency
Step
s/M
inu
te

41
Step Length
1.3
1.28
1.26
1.24
1.22
No Music
Natural Cadence Music
Increased Cadence Music
1.2
1.18
1.16
Time to Completion
7.6
7.5
7.4
7.3
7.2
7.1
7
6.9
6.8
6.7
6.6
No Music
Natural Cadence Music
Increased Cadence Music
Figure 4.2 Step Length
Figure 4.3 Time to Completion
Met
ers
Min
ute
s (
Dec
imal
Fo
rm)

42
CHAPTER 5: DISCUSSION
Previous research indicates that music is motivational and can help inspire an
individual to exercise at a higher intensity and for a longer duration (Barney et al. 2010,
Karageorghis et al. 2006). Recent studies have also demonstrated that music can improve
exercise performance (Karageorghis et al., 2009, and Simpson & Karageorghis, 2006)
and decrease ratings of perceived exertion (RPE) (Lim et al., 2007, Seath & Thow, 1995).
It is unclear, however, just how music is able to produce these beneficial effects during
exercise. Research by Schneider et al. (2010) and Karageorghis et al. (2010) provide a
conceptual framework regarding the brain in terms of how music is able to positively
influence an individual during exercise. According to their theories, the brain is able to
process music that comes from an outside source and then synchronize movement that
corresponds to the music.
In terms of increasing exercise performance, running velocity is improved with an
increase in step frequency, step length, or a combination of the two (Marais et al. 2003,
Daniels, 1988; Hunter et al., 2004; & Ballreich, 1976). Currently, there is limited
research that observes methods that may help increase running velocity. Manipulating
music cadence may be considered an effective training method that may significantly
improve running performance due to its influence on step frequency. According to
Karageorghis et al (2010), it is important for music cadence to be fast enough to cause an

43
ergogenic effect. The purpose of this study was to observe the effect of music cadence on
step frequency during a 1600-meter maximal effort run in a group of recreational runners.
The main objective was to compare the difference in step frequency and time to
completion between a natural cadence music condition and an increased cadence music
condition. It was hypothesized that the increased cadence music condition may have more
of an ergogenic effect compared to both the natural cadence and no music
conditions. As a result of this research, altering music cadence may be considered an
effective training method for recreational runners as music cadence can be manipulated to
coincide with the runner’s desired step frequency and subsequent intensity. Another
purpose of this study was to increase ecological validity as this study took place in a real
world setting where runners typically exercise.
Music and Exercise Performance
Music appears to have a potential ergogenic effect as it can help improve exercise
performance. There is however, conflicting evidence in research regarding music and its
overall influence on performance. This is especially true when comparing two types of
music conditions. Results from the current study revealed that running performance was
significantly improved during the increased cadence music condition compared to the
natural cadence music and no music conditions. Similarly, Karageorghis et al. (2009)
found that endurance was significantly higher when comparing motivational music to
outdeterous music at 75% maximal heart rate reserve (HRR). Barwood et al. (2009) also
discovered that the farthest distance covered on a treadmill was in the motivational music
condition compared to a neutral video condition and a control condition of no music or

44
video. These findings suggest that one music condition may be superior to another music
condition in terms of increasing exercise performance.
In contrast to the above findings, exercise performance may not be significantly
different when comparing two music conditions. Simpson and Karageorghis (2006)
observed music conditions during a 400-meter maximal effort run. It was found that there
was a significant improvement in running velocity in both the outdeterous and
motivational music conditions compared to no music; however, no significant difference
existed between the motivational and outdeterous music conditions. Simpson and
Karageorghis (2006) explain that the rhythmic aspect of music is what facilitated this
improvement and not its overall motivational rating. Another study by Terry et al. (2012)
showed similar results as endurance performance was significantly improved in the
motivational and neutral music conditions compared to no music; and no significant
difference existed between the motivational and neutral music conditions.
The major difference between these results were that Simpson and Karageorghis
(2006) and Terry et al. (2012) compared two music conditions based on the motivational
quality on performance, whereas the current study compared two music conditions based
on the cadence of music on performance. These results contribute to existing research of
music and exercise, as an increase in music cadence was shown to help improve running
performance. Another consideration involves the overall distance completed. In Simpson
and Karageorghis’s (2006) study, the distance was 400 meters in length while the
distance in the current study was 1600 meters in length. During 400 meters, overall effort
may have been higher compared to 1600 meters as various pacing strategies become
more involved. Currently, there is limited research that observes the influence of music

45
on performance when comparing a shorter versus a longer distance. It would be
interesting to see whether results would differ if the distance covered was farther in
Simpson and Karageorghis’s (2006) study. Lastly, the study design by Simpson and
Karageorghis (2006) had six participants run at one time rather than individually. This
may have influenced runners to give more of an overall effort during time trials. In
comparison, the current study focused more on the individual aspect of training in
runners. This is an important consideration as most runners train individually and then
compete against others in road races. If this study were repeated, results may differ if
individuals ran at the same time as others. Further research should be conducted on
running performance that compares running individually to running in a group setting.
Running Velocity
Previous research has observed the relationship between step frequency and step
length. Based on this research, it is assumed that an increase in running velocity occurs
with an increase in step frequency or step length without a significant decrease in the
other (Hunter et al., 2004; & Ballreich, 1976). There are opposing views however, on
whether to focus on increasing step frequency or step length in order to improve running
velocity. Results from the current study indicate that step frequency contributes to an
improvement in running velocity, as a higher step frequency resulted in an improvement
in time to completion. Hunter et al. (2005) also discovered that step frequency was more
associated with running velocity when observing runners perform 25-meter sprints on a
track. Hunter et al. (2005) describes that the ground reaction force is the mechanism
behind the improvement in acceleration during a sprint. Daniels (1998) and Heiderscheit

46
et al. (2011) also believe that an increase in step frequency is more beneficial than step
length due to its potential to decrease the occurrence of injury.
In contrast to the above findings, Mackala (2007) found that running velocity was
increased during a 100-meter sprint when step frequency or step length was increased
during particular ten-meter intervals. Step length was found to be the main contributor to
the improvement in running velocity compared to step frequency. Cavagna et al. (1988)
also observed an increase in step length with a higher speed as participants ran across a
force plate.
A benefit of this current study is that it provides some insight into the relationship
between step frequency and step length. Results indicated that step frequency was
significantly increased and time to completion was significantly improved during the
increased cadence music condition. These results support the notion from Hunter and
colleagues (2005) that running velocity improves with an increase in step frequency. In
this study, it was shown that step length did not significantly change throughout the
course of the 1600-meter run. According to Hunter et al. (2004), there is an inverse
relationship between step frequency and step length. Therefore, an increase in one results
in a decrease in the other. Since step frequency was significantly increased and time to
completion was significantly improved, this demonstrates that step length was not
affected by music cadence to an extent that had a negative impact on running velocity.
The major difference between this study and previous research mentioned above
is the overall distance covered. Mackala, (2007), Cavagna et al. (1988), Hunter et al.
(2004), and Hunter et al. (2005) observed step frequency and step length during sprinting
tasks. The current study was more endurance-based and observed participants run 1600

47
meters in length. Therefore, it appears that an increase in step frequency and step length
without a significant decrease in the other will result in an improvement in running
velocity for both sprinting and endurance related tasks.
Music Cadence and Step Frequency
In the current study, it was hypothesized that music cadence may have a
significant influence on increasing step frequency. Results supported this hypothesis as
step frequency was significantly increased (p < 0.05) during the increased cadence music
condition. In contrast, a study by Ahmaniemi (2007) compared music cadence to music’s
overall motivational rating and step frequency on a 350-meter track. Results showed that
there was no significant relationship between step frequency and music cadence. One of
the reasons why these results differed may be due to the population being tested. The
current study tested an organized running group of recreational runners whereas
Ahmaniemi (2007) tested an active group of marathon runners. Recreational runners in
this study actively participated in weekly speed workouts and ran races of varying
distances (5K, 10K, 15K, half marathons, marathons) These runners also had different
speeds as their time to completion in the 1600-meter run ranged from 5:29 to 9:16
minutes. In Ahmaniemi (2007), it is unclear how fit these marathon runners were in terms
of speed, however training for a marathon is much different than training for races of
shorter distances. This is especially true when concerning step frequency as it is
recommended for marathon runners to train at a particular step frequency (Daniels,
1998).

48
Another consideration involves the number of participants selected. In
Ahmaniemi (2007), there were only eight runners who participated whereas the current
study had thirty. Results from Ahmaniemi (2007) may have been different if there was a
larger sample size. Finally, the methods were very different when comparing the two
studies. Ahmaniemi (2007) had participants run thirty minutes on an outdoor track where
the measurement of performance was not a factor. In comparison, the current study had
participants run a 1600-meter time trial, and time to completion was found to be
significantly improved during the increased cadence music condition. If Ahmaniemi
(2007) had a performance measure, it would be interesting to see if altering music
cadence would have improved performance in this group of marathon runners. For future
studies involving music cadence and exercise, it is important to consider the population
being tested, the overall distance covered, the number of participants chosen, and the
measurement of performance.
Design Strengths
Personal Selection of Music. One main advantage of our study was that
recreational runners were able to select 20 motivating songs according to personal
preference. Each song selected was based on how close the song’s cadence was to the
runner’s natural step frequency obtained during the familiarization trial. This helped limit
any subjectivity in song choice by the research technician who was responsible for
creating each music condition. Runners also took the BMRI-2 in order to rate the
motivational quality of music on each runner’s playlist. This ensured that music selected
was motivational for the runner.

49
Ecological Validity. Another main advantage of this study was that it took place
in a real world setting. This particular track location was familiar to this group of
recreational runners as the running group utilizes this track for speed workouts every
week. In addition, the 1600-meter run is a common distance that these runners train with
during these speed workouts.
Design Weaknesses
Music Cadence. One disadvantage of this study was that the research technician
determined the music cadence for the increased cadence music condition. This condition
was defined as an increase of 10-20 beats per minute (bpm) above the natural cadence
music condition. Therefore, not every runner was exposed to the same increase in music
cadence. The main reason for this was that when some songs were manipulated to a
certain extent beyond the original cadence, the song might seem too fast, therefore
making it difficult to keep up with the increase in music cadence. This may make music
un-motivational for runners. In this study, the BMRI-2 was a favorable questionnaire to
use in order to ensure that songs were motivational for the runner after the cadence was
manipulated. Furthermore, based on the results of this questionnaire, songs were
reorganized in each runner’s playlist in the order of most motivational to least
motivational.
Step Frequency. During this study, step frequency was measured with a
countdown timer set to 60 seconds starting at the 50-meter mark along the first
straightaway and through the curve of each lap. A major limitation in this method was
that each runner would end at a different point along the track because each runner has a

50
different speed. As a result, this causes variation in step frequency among straightaways
and curves. Although this method was successful for the majority of runners, there were a
select few where this measurement had to be altered. This was because these runners
were faster and would start the next lap when step frequency was still being measured in
the lap prior. This was considered a problem because if step frequency was measured
starting at the 50-meter mark of the first straightaway in the fourth lap, then these
individuals would have finished their time trial before the last measurement of step
frequency was obtained. In these individuals, step frequency was counted earlier in the
fourth lap starting approximately three quarters of the way through the first curve. This
ensured that the measurement of step frequency was recorded before the runner crossed
the finish line. As a result of this alteration, step frequency was not measured along the
same intervals for everyone. This study may have been improved with the use of an
accurate pedometer, or a video camera to measure step frequency.
Previous Music History. Although results in the current study demonstrated that
both step frequency and time to completion during a 1600-meter run were significantly
increased, the majority of runners indicated on their participant background survey that
they either sometimes or always did listen to music when training for a road race. In fact,
there were only four runners who indicated that they did not listen to music when training
for a road race. This may have contributed to results in this study because the majority of
runners were accustomed to using music. If this study were repeated, it would be
interesting to see what would occur if the population of recreational runners were those
who were not accustomed to listening to music. Therefore, more research needs to be
conducted on the topic of music cadence and step frequency.

51
Study Location. Another limitation in the current study involves the location of
the public, outdoor track. During this study, there were other runners, groups, and teams
using the track during time trials that may have positively or negatively influenced each
runner’s performance, as it would ultimately interfere with each runner’s pacing strategy.
For example, if there were other runners not in the study using lane one, participants
could decide to stay a particular distance from them or decide to pass them. In spite of
this, the location of the outdoor track was familiar to this group of recreational runners as
they perform speed workouts at this track every week. Therefore, it helped improve
ecological validity.
Practical Application
The results of the current study contribute to research in the realm of music and
exercise as music cadence was shown to be advantageous for recreational runners. These
findings demonstrated that the increased cadence music condition was successful in
improving time to completion in comparison to the no music condition or natural cadence
music condition. This indicates that the cadence of music is what elicited this
improvement in performance, not just music itself. Results from this study also revealed
that the influence on running speed was due to an increase in step frequency with no
effect on step length. During the increased cadence music condition, step frequency was
significantly higher compared to the other conditions. Therefore, it would seem
advantageous for music cadence to be fast enough to increase step frequency, thereby
causing an ergogenic effect.

52
Based on these results, the manipulation of music cadence can serve as an
effective training tool for recreational runners. In order to optimize running performance,
runners should first determine their natural step frequency. This can be accomplished by
counting the number of times the left foot hits the ground in one minute and then
multiplying this number by two. Once runners know their natural step frequency, they
can then select music from their personal playlists or manipulate music cadence to be
approximately 10-20 beats per minute (bpm) above their natural step frequency. There is
existing technology that makes it relatively easy for individuals to manipulate the
cadence of music. Runners could use a software program such as Audacityto increase
the cadence of music and sync songs onto their personal music player. Individuals could
also download mobile applications such as MagicProor Pace DJ. Once effective
music conditions are created, recreational runners will likely adjust their step frequency
to the increased cadence of music, therefore leading to an improvement in running
performance.
53
CHAPTER 6: REFERENCES CITED
Ahmaniemi, T. (2007). Influence of tempo and subjective rating of music in step
frequency of running. Itamerenkatu Nokia Research Center FIN-00180, 11-13.
Bacon, C. J., Myers, T. R., & Karageorghis, C.I. (2012). Effect of music-movement
synchrony on exercise oxygen consumption. The Journal of Sports Medicine and
Physical Fitness, 52(4), 359-365.
Ballreich, R. (1976). Model for estimating the influence of stride length and stride
frequency on time in sprinting events. In Biomechanics B-V (ed. P.V. Komi)
(208-212). Baltimore, MD: University Park Press.
Barney, D., Gust, A., & Liguori, G. (2010). College students' usage of personal music
players (PMP) during exercise. SD Journal of Research in Health, Physical
Education, Recreation, Sport and Dance, 7, 23-26.
Barwood, M.J., Weston, N.J., Thelwell, R., & Page, J. (2009). A motivational music and
video intervention improves high intensity exercise performance. Journal of
Sports Science and Medicine, 8, 435-442.
Brage, S., Wedderkopp, N., Franks, P.W., Anderson, L.B, & Froberg, K. (2003).
Reexamination of validity and reliability of the CSA monitor in walking and
running. Medicine and Science in Sports and Exercise, 35, 1447-1454.
Brill, P.A., & Macera, C.A. (1995). The influence of running patterns on running injuries.
The Journal of Sports Medicine, 20(6), 365-368.
Cavagna, G., Franzetti, P., Heglund, N., & Willems, P. (1988). The determinants of the
step frequency in running, trotting, and hopping in man and other vertebrates.
Journal of Physiology, 399, 81-92.
Cavagna, G., Mantovani, M., Willems, P., & Musch, G. (1997). The resonant step
frequency in human running. Pflügers Archiv, 434(6), 678-684.

54
Copeland, B.L., & Franks, B.D. (1991). Effects of types and intensities of background
music on treadmill endurance. The Journal of Sports Medicine and Physical
Fitness, 31, 100-103.
Costa, M.J., Oliveira, C., Teixeira, G., Marinho, D.A., Silva, A.J., & Barbosa, T.M.
(2011). The influence of musical cadence into aquatic jumping jacks
kinematics. Journal of Sports Science and Medicine, 10, 601-615.
Daniels, J. (1998). Daniels’ Running Formula. Champaign, IL: Human Kinetics.
Gfeller, K. (1988). Musical components and styles preferred by young adults for aerobic
fitness activities. Journal of Music Therapy, 25, 28-43.
Heiderscheit, B., Chumanov, E., Michalski, M., Wille, M., & Ryan, M. (2011). The
effects of step-rate manipulation on joint mechanics during running. National
Institute of Health, 43(2), 296-302.
Hogberg, P. (1952). How do stride length and stride frequency influence the energy
output during running? Arbeitsphysiologie, 14, 437-441.
Hunter, P.J., Marshall, N.R., & McNair, J.P. (2004). Interaction of step length and
step rate during sprint running. Medicine and Science in Sports and
Exercise, 36(2), 261-271.
Hunter, P.J., Marshall N.R., & McNair, J. (2005). Relationships between ground
reaction force impulse and kinematics of sprint running acceleration.
Journal of Applied Biomechanics, 21, 31-43.
Karageorghis, C.I., Terry, P.C., & Lane, A.M. (1999). Development and initial validation
of an instrument to assess the motivational qualities of music in exercise and
sport: the Brunel Music Rating Inventory. Journal of Sports Sciences, 17(9), 713-
724.
Karageorghis, C.I., & Terry, P.C. (1999). Criterion validity of the Brunel Music Rating
Inventory. Journal of Sports Sciences, 17, 61.
Karageorghis, C.I., Priest, D.L., Terry, P.C., Chatzisarantis, N.L., & Lane, A.M. (2006).
Redesign and initial validation of an instrument to assess the motivational
qualities of music in exercise: the Brunel Music Rating Inventory-2.
Journal of Sports Sciences, 24(8), 899-909.
Karageorghis, C.I., Jones, L., & Stuart, D.P. (2007). Psychological effects of music tempi
during exercise. International Journal of Sports Medicine, 28, 1–7.

55
Karageorghis, C.I., Mouzourides, D.A., Priest, D.L., Sasso, T.A., Morrish, D.J., &
Whalley, C.L. (2009). Psychophysical and ergogenic effects of synchronous
music during treadmill walking. The Journal of Sport & Exercise Psychology, 31,
18-36.
Karageorghis, C.I., & Terry, P.C. (2009). The psychological, psychophysical and
ergogenic effects of music in sport: A review and synthesis. In Bateman, A.J., &
Bale, J.R. (eds.) (13-36). Sporting sounds: relationships between sport and music
(13-36). London: Routeledge.
Karageorghis, C.I., Priest, D.L., Williams, L.S., Hirani, R.M., Lannon, K.M., & Bates,
B.J. (2010). Ergogenic and psychological effects of synchronous music during
circuit-type exercise. Psychology of Sport and Exercise, 11, 551-559.
Karageorghis, C.I., Jones L., Priest, D.L, Akers, R.I, Clarke, A., & Perry, J.M. (2011).
Revisiting the exercise heart rate music tempo preference relationship. Research
Quarterly for Exercise and Sport, 82, 274-284.
Karageorghis, C.I., & Priest, D.L. (2012). Music in the exercise domain: a review and
synthesis (Part II). International Review of Sport and Exercise Psychology, 5(1),
67-84.
Karageorghis, C. I., Terry, P.C., Lane, A.M., Bishop, D.T., & Priest, D.L. (2012). The
BASES Expert Statement on the use of music in exercise. Journal of Sports
Sciences, 30(9), 953-956.
Lim, H., Atkinson, G., Karageorghis, C.I., & Eubank, M.M. (2007). The effect of timing
exposure on performance, perceived exertion, and psychological affect during a
10-km cycling time trial. International Journal of Sports Medicine, 30, 1 – 8.
Mackala K., (2007). Optimization of performance through kinematic analysis of the
different phases of the 100 meters. New Studies in Athletics, 22 (2), 7-16.
Marais, Galle, & Pelayo, (2003). Cadence and Exercise: Physiological and
Biomechanical Determinants of Optimal Cadences -Practical Applications. Sports
Biomechanics, 2 (1), 103-132.
Netherly, V.M. (2002). Competition between internal and external sources of information
during exercise: Influence on RPE and the impact of the exercise load. Journal of
Sports Medicine and Physical Fitness, 42, 172-178.
North, A.C., & Hargreaves, D.J., (1997). The musical milieu: Studies of listening in
everyday life. The Psychologist, 10, 309-312.

56
Priest, D.L., Karageorghis C.I., & Sharp, N.C., (2004). The characteristics and effects of
motivational music in exercise settings: The possible influence of gender, age,
frequency of attendance, and time of attendance. Journal of Sports Medicine and
Physical Fitness, 44, 77-86.
Rendi, M., Szabo, A., & Sbazo, T. (2008). Performance enhancement with music in
rowing spring. The Sport Psychologist, 22, 175-182.
Salo, A. T., Bezodis, I.N., Batterham, A.M., & Kerwin, D.G. (2011). Elite sprinting: are
athletes individually step frequency or step length reliant? Medicine and Science
in Sports and Exercise, 43(6), 1055-1062.
Schneider, S., Askew, C.D., Abel, T., & Struder, H.K. (2010). Exercise, music, and the
brain: Is there a central pattern generator? Journal of Sports Sciences, 28(12),
1337-1343.
Seath, L., & Thow, M. (1995). The effect of music on the perception of effort and mood
during aerobic type exercise. Physiotherapy, 81, 592-596.
Simpson, S.D., & Karageorghis, C.I. (2006). The effects of synchronous music on 400-m
sprint performance. Journal of Sports Science, 24, 1095-1102.
Smoll, F.L., & Schultz, R.W. (1978). Relationships among measures of preferred tempo
and motor rhythm. Perceptual and Motor Skills, 46, 883-894.
Terry, P.C., Karageorghis, C.I., Saha, A.M., & Auria, S.D. (2012). Effects of
synchronous music on treadmill running among elite athletes. Journal of Science
and Medicine in Sport, 15, 52-57.
Thompson, W.R., Gordon, N.F., Pescatello, & Linda, S. (2009). ACSM’s guidelines for
exercise testing and prescription 8th edition. Philadelphia, PA: Lippincott
Williams & Wilkins.
Tokmakidis, S.P., Leger, L., Mercier, D., Peronnet, F., & Thibault, G. (1987). New
approaches VO2 max and endurance from running performance. Journal of Sports
Medicine, 27, 401-409.
Vlist, B.V., Bartneck, C., & Maueler, S. (2011). Mobeat using interactive music to guide
and motivate users during aerobic exercising. Journal of Applied
Psychophysiology and Biofeedback, 36, 135-145.
Weyand, P.G., Sternlight, D.B., Bellizi, M.J., & Wright, S. (2000). Faster top running
speeds are achieved with greater ground forces not faster leg movements. Journal
of Applied Physiology, 80, 1991-1999.

57
Yamamoto, T., Ohkuwa, T., Itoh, H., Kitoh, M., Terasawa, J., Tsuda, T., Kitagawa S., &
Sato, Y. (2003). Effects of pre-exercise listening to slow and fast rhythm music on
supramaximal cycle performance and selected metabolic variables. Archives of
Physiology and Biochemistry, 111(3), 211-214.
Yoder, T., & Lamppa, R. (2012). Statistics of road race finishers 1990-2011.
Retrieved June 2013 from: http://www.runningusa.org/statistics.

58
APPENDICES
Appendix A: Medical History Questionnaire
MEDICAL HISTORY QUESTIONNAIRE
Subject Study #
Name Sex Age DOB
Street
City State Zip Phone
PLEASE ANSWER ALL OF THE FOLLOWING QUESTIONS AND PROVIDE DETAILS FOR ALL "YES" ANSWERS IN THE SPACES AT THE BOTTOM OF
THE FORM. YES NO
1. Has your doctor ever said that you have a heart condition and that you should only do physical activity recommended by a doctor?
2. Has your doctor ever denied or restricted your participation in sports or exercise for any reason?
3. Do you ever feel discomfort, pressure, or pain in your chest when you do physical activity?
4. In the past month, have you had chest pain when you were not doing physical activity?
5. Do you lose your balance because of dizziness or do you ever lose consciousness?
6. Does your heart race or skip beats during exercise?
7. Has a doctor ever ordered a test for you heart? (i.e. EKG, echocardiogram)
8. Has anyone in your family died for no apparent reason or died from heart problems or sudden death before the age of 50?
9. Have you ever had to spend the night in a hospital?
10. Have you ever had surgery?
11. Please check the box next to any of the following illnesses with which you have ever been diagnosed or for which you have been treated.
High blood pressure
Elevated
cholesterol Diabetes
YES NO
Asthma Epilepsy (seizures) Kidney problems
Bladder
Problems Anemia Heart problems
Coronary artery
disease Lung problems Chronic headaches
12.
Have you ever gotten sick because of exercising in the heat? (i.e. cramps, heat exhaustion, heat stroke)
13. Have you had any other significant illnesses not listed above?
14. Do you currently have any illness?
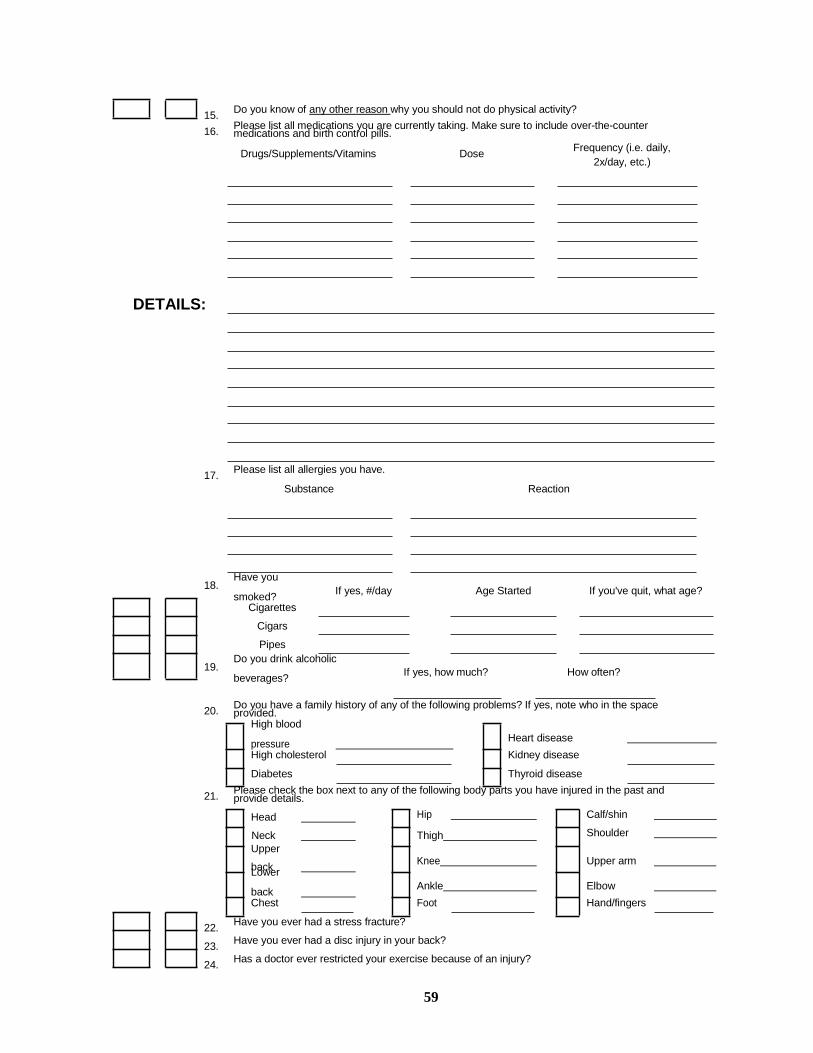
59
15. Do you know of any other reason why you should not do physical activity?
16. Please list all medications you are currently taking. Make sure to include over-the-counter medications and birth control pills.
Drugs/Supplements/Vitamins Dose Frequency (i.e. daily,
2x/day, etc.)
DETAILS:
17. Please list all allergies you have.
Substance Reaction
Have you
smoked? If yes, #/day Age Started If you've quit, what age?
Cigarettes
Cigars
Pipes
Do you drink alcoholic
beverages? If yes, how much? How often?
20. Do you have a family history of any of the following problems? If yes, note who in the space provided.
High blood
pressure Heart disease
High cholesterol Kidney disease
Diabetes Thyroid disease
21. Please check the box next to any of the following body parts you have injured in the past and provide details.
Head Hip Calf/shin
Neck Thigh Shoulder
Upper
back Knee Upper arm
Lower
back Ankle Elbow
Chest Foot Hand/fingers
22. Have you ever had a stress fracture?
23. Have you ever had a disc injury in your back?
24. Has a doctor ever restricted your exercise because of an injury?
18.
19.

60
25. Do you currently have any injuries that are bothering you?
26. Do you consider your occupation as?
27. List your regular physical activities
Activity How often do
you do it?
Sedentary (no exercise)
Inactive-occasional light activity (walking)
Active-regular light activity and/or occasional vigorous activity (heavy lifting, running, etc.)
Heavy Work-regular vigorous activity
How long do you do it?
How long ago did you start?
ADDITIONAL
DETAILS:
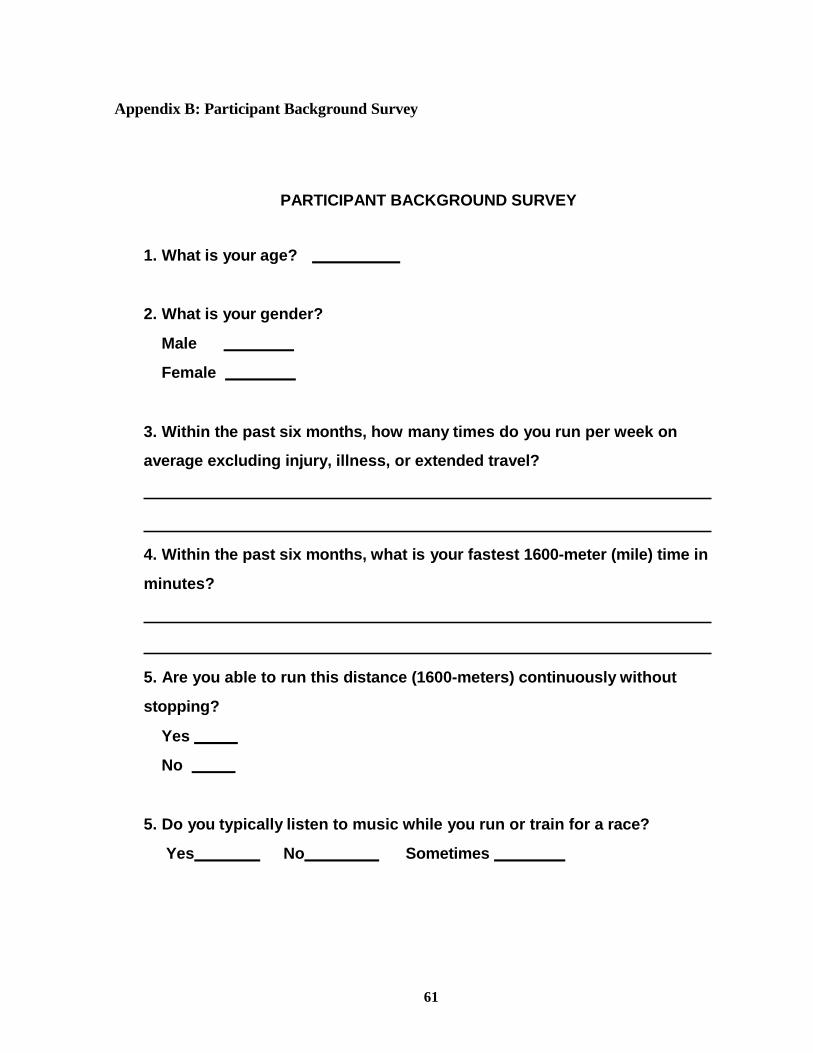
61
Appendix B: Participant Background Survey
PARTICIPANT BACKGROUND SURVEY
1. What is your age?
2. What is your gender?
Male
Female
3. Within the past six months, how many times do you run per week on
average excluding injury, illness, or extended travel?
4. Within the past six months, what is your fastest 1600-meter (mile) time in
minutes?
5. Are you able to run this distance (1600-meters) continuously without
stopping?
Yes
No
5. Do you typically listen to music while you run or train for a race?
Yes No Sometimes

62
6. Please take training runs into consideration when answering these next
two questions.
a. What day(s) of the week are most convenient for you to participate in this
research study?
b. What time of day is most convenient for you to participate in this
research study? Please include am/pm hours.

63
7. Please list the name and artist of twenty motivational songs you typically
listen to while you run. If you do not listen to music, please list the name
and artist of ten motivational songs you typically listen to for personal
enjoyment.
1.
2.
3.
4.
5.
6.
7.
8.
9.
10.
11.
12.
13.
14.
15.
16.
17.
18.
19.
20.

64
Appendix C: ACSM’s Current Comment on Pre-Event Meals
ACSM CURRENT COMMENT Pre-Event Meals
It is well established that exercise performance can be affected by diet and, in order to maintain optimal training, the body must be properly refueled with appropriate nutrients. The pre-event meal is an integral part of the complete training plan. Of course, a single pre-event meal will not compensate for a poor training diet. For this reason, the active person should routinely follow basic nutrition guidelines. It is essential that the diet contain enough calories to cover the active person’s daily energy expenditure. It is also advised that the diet be composed of a wide variety of foods to ensure adequate intake of vitamins and minerals. The training diet should be high in carbohydrate without compromising necessary protein and fat. The pre-event meal should have a definite focus on carbohydrate intake. Prioritizing carbohydrates is supported by evidence that exercise performance is typically enhanced following a high carbohydrate meal as compared to a low carbohydrate meal. Carbohydrate in the liver and muscles (glycogen) can be metabolized to provide energy for the working muscle more rapidly than fat, allowing a person to sustain a higher intensity level of exercise. Therefore, its depletion would inevitably result in a need to reduce exercise intensity or discontinue exercise. Although the body’s glycogen storage is limited, the diet should provide enough carbohydrate to maximize glycogen stores, particularly for those participating in endurance events. The basic goals of the pre-event meal are as follows: (1) prevent weakness and fatigue, whether due to low blood sugar levels or inadequate muscle glycogen stores, during the event, (2) ward off feelings of hunger yet minimize gastrointestinal distress from eating, and (3) guarantee optimal hydration. In addition, individual preferences must be considered. If a person truly believes that a specific food will improve performance, then the psychological effect of consuming that food may result in enhanced performance. The meal should consist primarily of carbohydrates and fluids, as they can be easily digested. If the meal is small (400-500 Calories), it can be consumed approximately 2-3 hours prior to an event allowing enough time for digestion and absorption. If the meal is high in fat, protein, or fiber, extra time must be allowed for digestion. Also, as the amount of food consumed increases, so will the time needed for digestion. A large meal containing appreciable amounts of protein or fat may need to be eaten 5-6 hours before competition. Carbohydrates high in fiber and gas-forming (bran products, legumes, and certain vegetables, such as onion, cabbage and cauliflower) are not recommended as they may cause intestinal discomfort. A liquid source of carbohydrate can be taken prior to the event when schedules do not allow time for meals or for those who have a sensitive stomach or experience pre-competition anxiety. Liquid meals can include sports drinks, juices, low-fat smoothies and shakes. Carbonated drinks should be avoided as they may cause stomach discomfort. Caffeinated drinks should be considered on an individual basis. For some individuals, caffeine may be ergogenic, most notably in sparing muscle glycogen and thereby prolonging fatigue during endurance events. However, for others it may cause nausea and anxiousness. In addition, an excess of caffeine can contribute to dehydration through its diuretic effect. The pre-event meal is particularly important before a morning event, since as much as 12 hours

65
or more may have passed since the last meal and liver glycogen levels could be sub-optimal. The pre-event meal could replenish glycogen stores and decrease chance of hypoglycemia (low blood sugar) and therefore, delay fatigue. Since early morning pre-event meals may need to be limited in size, it would be important to consume a substantial carbohydrate dinner the night before. Again, plenty of liquids should also be consumed to ensure maximum hydration status. Suggestions for pre-event food choices are listed below:
Morning events:
The night before, eat a high-carbohydrate meal. Early morning, eat a light breakfast or snack: cereal and non-fat milk, fresh fruit or juice, toast, bagel or English muffin, pancakes or waffles, non-fat or low-fat fruit yogurt, or a liquid pre-event meal Afternoon events:
Eat a high-carbohydrate meal both the night before and for breakfast. Follow with a light lunch: salads with low-fat dressings, turkey sandwiches with small portions of turkey, fruits, juice, low-fat crackers, high-carbohydrate nutritional bars, pretzels, rice cakes Evening events:
Eat a high-carbohydrate breakfast and lunch, followed by a light meal or snack: pasta with marinara sauce, rice with vegetables, light-cheese pizza with vegetable toppings, noodle or rice soups with crackers, baked potato, frozen yogurt No one food or group of foods works for everybody; the person may need to experiment to find which foods, and the amount of food, that works best. Food choices may vary based on the type of exercise, as well as the intensity and duration of the exercise. However, it is important to experiment with new foods during training rather than around competition. Written for the American College of Sports Medicine by Helen DeMarco, M.S., R.D.
Current Comments are official statements by the American College of Sports Medicine concerning topics of interest to the public at large.
Street Address: 401 W. Michigan St. Indianapolis, IN 46202-3233 USA
Mailing Address: P.O. Box 1440 Indianapolis IN 46206-1440 USA
Telephone: (317)-637-9200 Fax: (317)-634-7817

66
Appendix D: Items to Bring to the Track
Please bring the following items to the track for each time trial:
1. Light, comfortable running clothes. Please wear similar clothes for each
experimental trial.
2. Comfortable running shoes (preferably the same shoes you run to train in)
3. Personal headphones
4. Rehydration Beverage

67
Appendix E: Items on the BMRI-2
The following terms are musical elements you will rate on the BMRI-2. Please read the
definition of each term listed below prior to taking the questionnaire (Karageorghis et
al., 2006; Karageorghis & Terry, 2009)
1. Rhythm- The distribution of notes overtime, in which they are organized in a
specific pattern.
2. Style- The genre of music (rock, dance, hip-hop, country, etc.)
3. Melody- The tune of a piece of music that you may hum along to.
4. Tempo- The overall speed at which music is played, also known as cadence in
beats per minute.
5. Instrumental Sound- The overall sound of different instruments used together
(guitar, piano, drums, trumpet, synthesizer, etc.)
6. Beat- Repeated background sound that occurs spontaneously throughout the song.

68
Appendix F: The BMRI-2 (Karageorghis et al., 2006)
The Brunel Music Rating Inventory Questionnaire-2 (BMRI-2)
The purpose of this questionnaire is to assess the extent to which the piece of music you
are about to hear would motivate you during exercise. For our purposes, the word
‘motivate’ means music that would make you want to exercise harder and/or longer. As
you listen to the piece of music, indicate the extent of your agreement with the statements
listed below by circling one of the numbers to the right of each statement. We would like
you to provide an honest response to each statement. Give the response that best
represents your opinion and avoid dwelling for too long on any single statement.
Strongly disagree In-between Strongly agree
1 The rhythm of this music would motivate me during exercise 1 2 3 4 5 6 7
2 The style of this music (i.e. rock, dance, jazz, hip-hop, etc.)
would motivate me during exercise
1 2 3 4 5 6 7
3 The melody (tune) of this music would motivate me during
exercise
1 2 3 4 5 6 7
4 The tempo (speed) of this music would motivate me during
exercise
1 2 3 4 5 6 7
5 The sound of the instruments used (i.e. guitar, synthesizer,
saxophone, etc.) would motivate me during exercise
1 2 3 4 5 6 7
6 The beat of this music would motivate me during exercise 1 2 3 4 5 6 7

69
Appendix G: IRB Approval Letter
1/31/2014
Micaela Galosky,
School of Physical Education & Exercise Science
11711 North 50th St Apt 707
Tampa, FL 33617
RE: Expedited Approval for Initial Review
IRB#: Pro00012152
Title: The Effect of Music Cadence on Step Frequency in the Recreational Runner
Study Approval Period: 1/30/2014 to 1/30/2015
Dear Dr. Galosky:
On 1/30/2014, the Institutional Review Board (IRB) reviewed and APPROVED the above
application and all documents outlined below.
Approved Item(s):
Protocol Document(s):
Protocol
Surveys and Questionnaires:
ACSM's Current Comment- Pre-Event Meals(0.01) Medical History Questionnaire(0.03) Participant Background Survey(0.01)
Data Collection Sheet(0.01)
VO2 Max Certificate(0.01) Definition of Terms on BMRI-2(0.01)
Items to Bring(0.01)
Recruitment Materials: Recruitment Email
Consent/Assent Document(s)*:
Informed Consent.pdf

70
*Please use only the official IRB stamped informed consent/assent document(s) found under the
"Attachments" tab. Please note, these consent/assent document(s) are only valid during the approval
period indicated at the top of the form(s).
It was the determination of the IRB that your study qualified for expedited review which includes
activities that (1) present no more than minimal risk to human subjects, and (2) involve only
procedures listed in one or more of the categories outlined below. The IRB may review research
through the expedited review procedure authorized by 45CFR46.110 and 21 CFR
56.110. The research proposed in this study is categorized under the following expedited review
category:
(7) Research on individual or group characteristics or behavior (including, but not limited to,
research on perception, cognition, motivation, identity, language, communication, cultural beliefs or
practices, and social behavior) or research employing survey, interview, oral history, focus group,
program evaluation, human factors evaluation, or quality assurance methodologies.
As the principal investigator of this study, it is your responsibility to conduct this study in
accordance with IRB policies and procedures and as approved by the IRB. Any changes to the
approved research must be submitted to the IRB for review and approval by an amendment.
We appreciate your dedication to the ethical conduct of human subject research at the University of
South Florida and your continued commitment to human research protections. If you have
any questions regarding this matter, please call 813-974-5638.
Sincerely,
John Schinka, Ph.D., Chairperson
USF Institutional Review Board