The Effect Of Joint Roughness Coeffici ent On Shear...
12
266 The Effect Of Joint Roughness Coefficient On Shear Strength Of Granite Intan Nur Mardia Arifa binti Sa’ad 1 , Mohd For bin Mohd Ami 1 1 Faculty of Civil Engineering, Universiti Teknologi Malaysia, Malaysia a* [email protected] Keywords: Joint roughness, Granite, Rock Mass, Shear Strength Abstract. A natural discontinuity surface in hard rock is never as smooth as normally used in ground surface discontinuity used for determining basic friction angle. The undulations and asperities on a natural joint surface have a significant influence on its shear behaviour. Most shear strength determinations today are carried out by determining the basic friction angle and then making corrections for surface roughness. Determining a general criterion to estimate the shear strength of rough rock joints is a problem that has been investigated for many years. This study can help people to understand more about rock mass behaviour and factors that will affect the shear stren ght of the rock by understanding the Joint Roughness Coefficient (JRC). This study can help us to understand the effect of roughness on shear behaviour of joints in granite, to investigate the effect of roughness behaviour of joint under shear loading on jointed granite and also to analyse and to determine the correlation between Joint Roughness Coefficient (JRC) and shear strength of joint in granite. The relevent methodologies are first, by doing literature review related to this study through jurnals, articles, books and webs. Second thing is doing labaratory testing on granite to know the value of direct shear strength of the granite and its joint roughness coefficient (JRC). Final step is to analyse the result and determine the effect on JRC on direct shear strength of the granite. By laboratory testing, the graph shows that JRC is directly proportional to the shear strength of the rock. It can be stated that Joint Roughness Coefficient (JRC) affect the shear strength of rock that is in th is study is granite. Introduction Generally, the surface roughness is said to increase the shear strength of the surface, and this strength increase is extremely important in terms of the stability of excavations in rock. The joint roughness coefficient JRC is a number that can be estimated by comparing the appearance of a discontinuit y surface with standard profiles published by Barton and others. One of the most useful of these profile sets was published by Barton and Choubey(1977). Granite rock is often highly jointed, as such its shear strength depends on the behaviour of the prevailing joints. However, the shear behaviour of these joints is significantly affected by its surface roughness which is numerically evaluated using JRC, for assessing the shear behaviour of joints in granite. The objectives of this study are to understand the effect of roughness on shear behaviour of joints in granite, to investigate the effect of roughness behaviour of joint under shear loading on jointed granite and to analyse and to determine the correlation between Joint Roughness Coefficient (JRC) and shear strength of joint in granite. This study focus on rock types that have roughness on their surface that will affect the shear strength of the rock itself. This will help us to determine and understand better about the rough number or Joint Roughness Coefficient (JRC), basic friction angle and its effect on shear strength of granitic rock (sample rock used). Previous study Application of rockRocks of all kind are made up from an assemblage of minerals, and most of the minerals, of which the there are a vast number, have stranger names. It is sufficient that only a small number of the commonest rock-forming minerals will be introduced to aid with rock identification. The engineer i ng properties of rocks often relate to the minerals which make up the rock, and their arrangement. For civil engineering purposes, there are several other features of
Transcript of The Effect Of Joint Roughness Coeffici ent On Shear...

266
The Effect Of Joint Roughness Coefficient On Shear Strength Of Granite Intan Nur Mardia Arifa binti Sa’ad1, Mohd For bin Mohd Ami1
1Faculty of Civil Engineering, Universiti Teknologi Malaysia, Malaysia a*[email protected]
Keywords: Joint roughness, Granite, Rock Mass, Shear Strength Abstract. A natural discontinuity surface in hard rock is never as smooth as normally used in ground surface discontinuity used for determining basic friction angle. The undulations and asperities on a natural joint surface have a significant influence on its shear behaviour. Most shear strength determinations today are carried out by determining the basic friction angle and then making corrections for surface roughness. Determining a general criterion to estimate the shear strength of rough rock joints is a problem that has been investigated for many years. This study can help people to understand more about rock mass behaviour and factors that will affect the shear stren ght of the rock by understanding the Joint Roughness Coefficient (JRC). This study can help us to understand the effect of roughness on shear behaviour of joints in granite, to investigate the effect of roughness behaviour of joint under shear loading on jointed granite and also to analyse and to determine the correlation between Joint Roughness Coefficient (JRC) and shear strength of joint in granite. The relevent methodologies are first, by doing literature review related to this study through jurnals, articles, books and webs. Second thing is doing labaratory testing on granite to know the value of direct shear strength of the granite and its joint roughness coefficient (JRC). Final step is to analyse the result and determine the effect on JRC on direct shear strength of the granite. By laboratory testing, the graph shows that JRC is directly proportional to the shear strength of the rock. It can be stated that Joint Roughness Coefficient (JRC) affect the shear strength of rock that is in th is study is granite.
Introduction
Generally, the surface roughness is said to increase the shear strength of the surface, and this strength increase is extremely important in terms of the stability of excavations in rock. The joint roughness coefficient JRC is a number that can be estimated by comparing the appearance of a discontinuit y surface with standard profiles published by Barton and others. One of the most useful of these profile sets was published by Barton and Choubey(1977). Granite rock is often highly jointed, as such its shear strength depends on the behaviour of the prevailing joints. However, the shear behaviour of these joints is significantly affected by its surface roughness which is numerically evaluated using JRC, for assessing the shear behaviour of joints in granite. The objectives of this study are to understand the effect of roughness on shear behaviour of joints in granite, to investigate the effect of roughness behaviour of joint under shear loading on jointed granite and to analyse and to determine the correlation between Joint Roughness Coefficient (JRC) and shear strength of joint in granite. This study focus on rock types that have roughness on their surface that will affect the shear strength of the rock itself. This will help us to determine and understand better about the rough number or Joint Roughness Coefficient (JRC), basic friction angle and its effect on shear strength of granitic rock (sample rock used).
Previous study
Application of rockRocks of all kind are made up from an assemblage of minerals, and most of the minerals, of which the there are a vast number, have stranger names. It is sufficient that only a small number of the commonest rock-forming minerals will be introduced to aid with rock identification. The engineer i ng properties of rocks often relate to the minerals which make up the rock, and their arrangement. For civil engineering purposes, there are several other features of

267
rocks in additon to mineral content which help with identification. It is really only in igneous rock that details the of the minerology are required to accurately identify rock [5].
Basically, there are three types of rocks that are igneous rocks, metarmophic rocks and sedimentary rocks. Rocks that will use in this study is igenous rocks since granite is an igneous rock. Igneous rock forms through the cooling and solidification of magma or lava. This magma can be derived from partial melts of pre-existing rocks in either a planet's mantle or crust. Igneous rocks are largely made of silicate minerals, any rock type that has definite of minerals and determined by temperature which can be used to classify rocks. Re-melting the magmas is one of the methods to know the full range of rock types from a single magma from mantle. According to [5], there are six types of igneous rocks that are basalt, gabbro, andesite, diorite, rhyolite and granite. The chemical abundance and the rate of cooling of magma typically forms a sequence known as Bowen's reaction series. Properties of Granite. Granite is a common type of felsic intrusive igneous rock which is granular and phaneritic in texture. It is the coarsed grained plutonic rocks that is lighter in colour. Granite is the acidic igneous rock that mainly consist of feldspar, quartz, mica, and amphibole minerals. Granites can be predominantly white, pink, or gray in color, depending on their mineralogy. By definition, granite is an igneous rock with at least 20% quartz and up to 65% alkali feldspar by volume. Moreover, it isusually found in the continental plates of the Earth's crust that shows that granite is currently known only on Earth, where it forms a major part of continental crust.Rock masses contain cracks, fissures, joints, faults and bedding planes with different degrees of strengths along such weak planes.
These flaws control strength and deformational behavior. According to [3] states that one of the challenging tasks in rock mechanics is to characterize discontinuities (e.g., their apertures, roughness, properties of infill, persistency) and the mechanical behavior of jointed rock masses. Apart from the frequency of joints, the orientation of joints with respect to the loading direction and strength along these joints play significant role in the stability of rock structures that must be paid due attention. Reliable estimation of strength of jointed rock masses could guarantee economical and reasonable design for surface and sub surface structures in rock. In addition to the strength anisotropy due to joint dip, it is predicted that the variation of joints dip direction differences could impose a reduction of strength. Recently, numerous efforts have been made to investigate the effects of discontinuities on rock strength, but dip direction of joints and theireffects on rock strength were largely ignored.
Rock joints have an important influence on the deformational behavior of rock systems [6]. Joints properties such as orientation, extent, planarity, roughness and the strength of wall rock asperities influence the behaviour of rock systems. The friction angle, dilatancy and peak shear strength are affected with roughness refers to the local departures from planarity at both small andlarge scales.Joint may occur either through tensional or compressive forces. They are commonly associated with other features of tectonic deformation, but may also result from cooling of igneous rocks, or shrinkage of sediment during diagnesis. Joints also frequently occur as a result the released of stored stresses in rock which accumulate mainly during phases of tectonic compression, but also during cooling and shrinkage of igneous rocks, and compression of sedimentary rocks beneath overburden [5].
Joint deformation is a fundamental component of the performance of a discontinuous rock mass under changing stress conditions. At the relatively low stress levels encountered in near-surface excavations, the deformation of joints dominates the the elastic deflection of the intact rock. Even under the higher levels of stress associated with heavy structures, the slippage and closure of joints constitute the major part of settlement on rock [7]. Based on [5],some characteristics of joints are joint are fractures with little or no displacement, joints are closely spaced, joint frequency is a function of lithology and bed thickness, joints are often restricted to one bed and are limited in size, tension joints may have surface roughness with mirror images on the opposite face, their interlock indicating the a lack of relative movement, joints are often in parallel sets in any area and joints are usually oriented symmetrically and normal to bedding.

268
D T = a Equation 1
The slopes α are a function of lithology. More brittle rocks have more closely spaced joints than
weaker rocks. Similarly, rocks with low tensile strength show more joints than stiffer lithologies, because strain is the same along layers of different types. But higher stresses are required to achieve the same amount of strain in the stronger layers. Therefore, strong layers fracture more frequently. However, this response is particularly sensitive to local pore fluid pressure.In isotropic rocks (e.g. granite) joint spacing follows an approximately log-normal frequency (the number of joints occurring within a unit length) distribution. In anisotropic (layered) rocks, joint spacing differs according to several parameters.
Rock surface roughness used here as a generic term to describe the relief of joints, faults, bedding planes, and other geologic discontinuities can be estimated by visually comparing the calculated profiles with standard profiles or by using more quantitative measures that are ideally suited to digital outcrop models [8]. Practical measurements of rock surface roughness. Traditionally the measurements been made using methods that require direct contact with the rock (e.g. Wyllie &Norrish 1996). Although direct methods canproduce accurate and useful results, they have some significant limitations. According to Sivakugan,the roughness of a rock joint refers to the large scale surface undulations (waviness) observed over several metres and the small scale unevenness of the two sides relative to the mean plane, observed over several centimetres. Many methods have been used to characterize the surface roughness of rock joints, such as joint roughness coefficients (JRC), root mean square (RMS) value, structure function (SF) etc. The JRC value scales the joint roughness in the range from 20 (rough) to 0 (smooth) and can be determined either by tilt, push or pull tests on rock samples.
JRC is the geometrical parameter, characterizing the roughness of joint profiles [6] . Meanwhile, Zhang said that Joint Roughness Coefficient (JRC) is one of the principal parameters used to calculate the shear strength and conducting aperture of discontinuities. Typifying different joint roughness coefficients is the eight parameters that have been used to characterize numerically the roughness surface that have been measured on the ten presented profiles by Barton and Choubey.It is said that when the surface roughnessof the equation is smooth, that is mean that the rock has no roughness, and there will be no roughness coefficient too but, the shear strength will still exist and affected by the basic friction angle, Ǿb. The values of basic friction angle will give the prediction of the shear strength for the smooth surface rocks. Meanwhile on rough surface, the value of joint roughness coefficient (JRC) is measured or determined using the typical roughness profiles for JRCrange 0 – 20 cm. The irregularities or roughness of the rock surfaces is the hardest quantity to estimate.
Figure 1: Graph of shear strength versus surface roughness

269
Based on the Figure 1, we can see that the rougher the surface roughness, the shear strength of the rock would be. Meanwhile as for the planar surface with no texture or asparities, the shear strength of itself would be on basic friction angle of the joint surface . the strength would be lower than rough surface. The test used for planar surface is Tilt Test.Barton and Choubey were able to prepare the 10 typical roughness profile with these standard profiles , the JRC value can be estimated.
Figure 2: Typical roughness profiles for JRC

270
JRC = 32.2 + 32.47 log Z2 Equation 2 Based on the equation 2, Tse, Cruden and Yang found that JRC values calculated based on this
fitting function were in relatively good agreement with corresponding 10 standards profiles. They
are considered the effect of the inclination angle in their study but the scale effect is neglected.
Figure 3: Shear Strength Versus The Joint Roughness Coefficient Graph.
Based on the Figure 3 , it shows that the higher the JRC, the higher the shear strength of the rock mass.The shear strength parameters to use in stability calculations of a rock mass and or structure, in or on rock, point to the kind of shear strength test to be performed. The shear strength of rock in its maximum resistance s to to deformation by continuous shear displacement upon the action of a shear (tangential) stress , τ. Discontinuitiesoccur in all rock masses and represent pre-existing lines of weakness which to a greater or lesser extent will determine the overall behaviour of the mass [5] .Over the past four decades, many researchers and engineers studied rock joint roughness due to the fact that it has a critical influence on the shear strength of rock joints. Barton’s estimate of shear strength is about the equation that is valid at low normal stresses where shear displacement is due to sliding along the inclined surfaces. At higher normal stresses, the strength of the intact material will be exceeded and the teeth will tend to break off, resulting in a shear strength behaviour which is more closely related to the intact material strength than to the frictional characteristics of the surfaces. While Patton’s approach has the merit of being very simple, it doesnot reflect the reality that changes in shear strength with increasing normal stress are gradual rather than abrupt. Barton (1973, 1976) studied the behaviour of natural rock joints and proposed that the equation could be re-written as:
Equation 3
Barton developed his first non-linear strength criterion for rock joints (using the basic friction angle Ib) from analysis of joint strength data reported in the literature. Barton and Choubey (1977), on the basis of their direct shear test results for 130 samples of variably weathered rock joints, revised this equation.
271
Equation 4
According to Lin, (1998) shear strength usually used to cover several different concepts such as strength against pure shear, shear stress required for failure without normal stress, shear diagram on solid interface depending upon normal stress and Mohr’s stress envelope. Several methods have been developed to find the shear strength of rock such as Torsian test, Single shear test, Double shear test, and shear loaded beam with starter notches accorrding to mode II of fracture mechanics.
Determination of shear strength of a rock specimen is an important aspect in the design of structures such as rock slopes, dam foundations, tunnels, shafts, waste repositories, caverns for storage, and other purposes. Pervasive discontinuities (joints, bedding planes, shear zones, fault zones, schistosity) in a rock mass, and genesis, crystallography, texture, fabric, and other factors can cause the rock mass to behave as an anisotropic and heterogeneous discontinuum. Therefore, the precise prediction of rock mass behavior is difficult [9]. Methodology
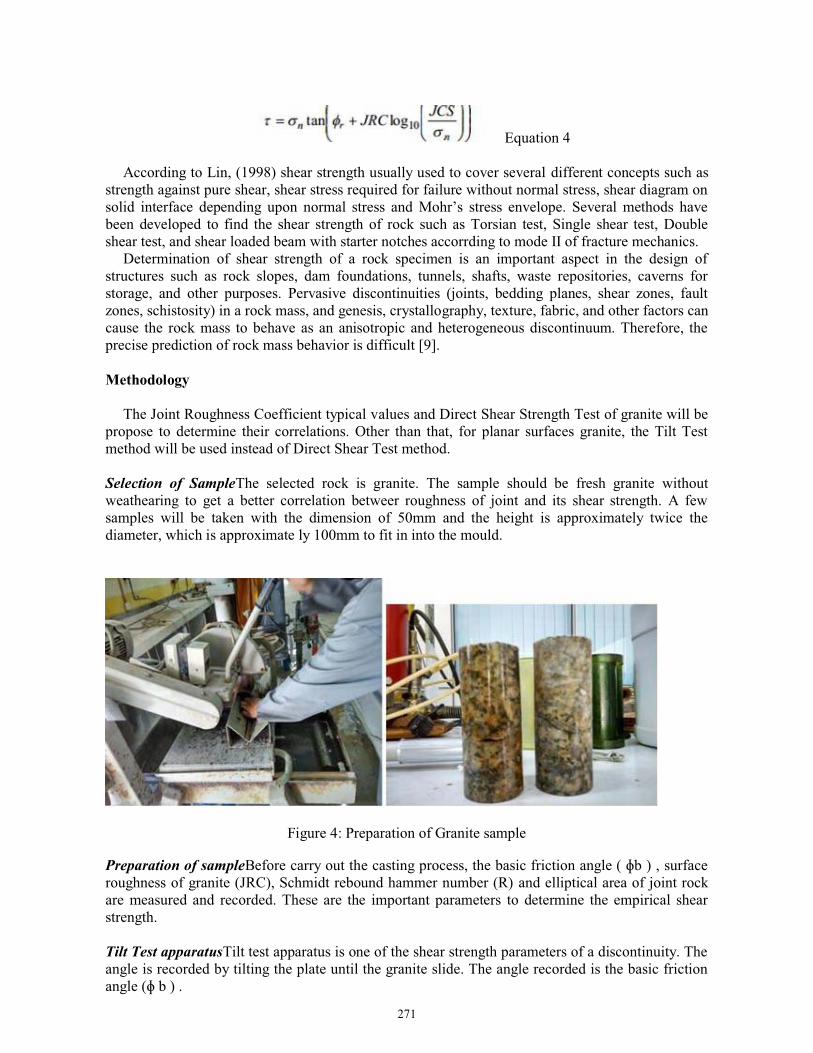
The Joint Roughness Coefficient typical values and Direct Shear Strength Test of granite will be propose to determine their correlations. Other than that, for planar surfaces granite, the Tilt Test method will be used instead of Direct Shear Test method. Selection of SampleThe selected rock is granite. The sample should be fresh granite without weathearing to get a better correlation betweer roughness of joint and its shear strength. A few samples will be taken with the dimension of 50mm and the height is approximately twice the diameter, which is approximate ly 100mm to fit in into the mould.
Figure 4: Preparation of Granite sample
Preparation of sampleBefore carry out the casting process, the basic friction angle ( ɸb ) , surface roughness of granite (JRC), Schmidt rebound hammer number (R) and elliptical area of joint rock are measured and recorded. These are the important parameters to determine the empirical shear strength. Tilt Test apparatusTilt test apparatus is one of the shear strength parameters of a discontinuity. The angle is recorded by tilting the plate until the granite slide. The angle recorded is the basic friction angle (ɸ b ) .

272
The procedure is : 1) Granite sample is placed on the horizontal table top designed to tilt. 2) The table top is slowly tilted until the granite start to slide. Further tilting of table top is stopped
and the angle of tilt is measured. 3) The measured angle of tilt is equal to the basic friction angle of the granite.
Figure 5: Tilt test apparatus
Barton Comb Profilometer. The Barton Comb Profilometer is used to sketch out the surface roughness of the granite. The procedures to obtain the surface roughness profile is : 1) A measurement of 10 cm in length of sample profiles is measured to have the same length to
the standard of JRC profiles in same scale. 2) The profiler is pressed down on the granite. 3) Profile obtained is compared to the JRC and categorize. 4) The remaining of samples will be repeating same procedures from step 1 to 3.
Figure 6: Barton Comb Profilometer Schmidt Test / Rebound Hammer Test. Rebound hammer test value is to estimate the cube compressive strength on granitic rock. According to the ASTM C 805, it is the method to determine the rebound number. It gives estimation on the normal stress that is going to be applied to rock during test. The hammer is applied perpendicularly on the surface rock joint to withstand the load without damaging the roughness profile. Each sampes to be tested for several times and then getting the average value.

273
Then, the granite is tied using wired steel to produce the joints in contact. As the joint are in contact, the casting process will be easier. The steel wire need to be cut off right after the casted sample are removed from the mould. Sometimes, if the steel wired is difficult to make the joint in contact, rubber band is used. After that, the granite samples are clamped in the mould for casting process. A layer of oil is coated onto each side of mould before casting to prevent the encapsulating material from adhering to the mould then causing difficulties when remove at dry condition. Samples will be encapsulated in concrete grout for 24 to 48 hours on each halve or whenever it is dry. Concrete grout is pour into the mould to hold the granitic rock samples to carry out the shear test. As whole casting samples cannot be moulded in one time, concrete grout is pour into each halve of the mould. Normally, each halves will takes approximately 24 - 48 hours to dry but a good test sample will takes a week to complete.
Figure 7: Schmidt Test / Rebound Hammer Test
Direct Shear TestThe core samples with joint plane is trimmed to a specific length. The length need to be at least 30mm on either side to ensure that there is sufficient length to be embedded into the cement grouting without falling the test. Direct shear test apparatus consists of two separable halves cylinder which casted amples will be inserted. To provide the vertical and horizontal pressure to the casted samples, it has a rig with vertical and horizontal loading frame. Vertical ram provides the designated normal stress which has to be constant during the test, meanwhile the horizontal ram provides horizontal shear stress to shear off the casted samples. Both vertical and horizontal pressures are monitored using pressure transducers. The displacement transducer, LVDT is used to measure the horizontal shear stress and all of them are connected to KYOWO USB-510 data logged for automated data. The casted samples are inserted into shear box. Peak pressure indicator on the shear pressure gauge is set zero. The shear surface need to be in full contact with the two halves of cylinder in the portable shear box. A designated normal stress is applied on the casted samples. Then the horizontal shear stress is applied by activating the hydraulic pump. Horizontal shear displacement is masured at maximum 20 mm for the labaratory test indicates by cylinder touching the the either side of the horizontal piston. At least ten increments are obtained. Data will be computed further analytical process. After completion of test, hydraulic rams are depressurized and disassemble the top half of the shear box. Casted sample is removed from the shear box with careful and the remaining samples are repeated with same procedures. Joint surface shear is observed and assumed minor because it occurs on small scale ( asperities ) suface roughness.

274
Figure 8: Direct Shear Test
Data analysis The analysis and calculation of JRC value and shear strength is tabulated in the table below. Graph of shear strength versus JRC is plotted to verify the relationship.
Table 1 shows the result for sample 1.
Horizontal Horizontal Load (kPa) Gross-contact Area Shear Load, Lh = Shear Stress, t = Shear Stress
displacement (mm) (m2) Ph *Ap (kN) Lh/As (kN/m2) (MPa)
0.00 0.00 0.0026848 0.0000 0.00 0.000
0.00 0.41 0.0026848 0.0008 0.31 0.000 0.00 20.40 0.0026848 0.0414 15.42 0.015 0.10 39.10 0.0026797 0.0794 29.62 0.030
1.32 112.95 0.0026175 0.2293 87.60 0.088 2.89 214.70 0.0025374 0.4358 171.76 0.172 3.80 416.80 0.0024911 0.8461 339.65 0.340
4.83 625.20 0.0024387 1.2692 520.43 0.520 6.60 725.20 0.0023487 1.4722 626.79 0.627 7.80 823.80 0.0022879 1.6723 730.94 0.731
8.88 1023.10 0.0022332 2.0769 929.99 0.930 9.67 1228.35 0.0021933 2.4936 1136.88 1.137 10.48 1428.35 0.0021525 2.8996 1347.07 1.347
11.43 1629.30 0.0021047 3.3075 1571.48 1.571 12.45 1730.10 0.0020535 3.5121 1710.29 1.710 13.38 1834.30 0.0020070 3.7236 1855.35 1.855
14.13 1939.87 0.0019695 3.9379 1999.43 1.999 14.81 2150.85 0.0019357 4.3662 2255.66 2.256 15.57 2460.65 0.0018979 4.9951 2631.89 2.632
16.26 2276.45 0.0018637 4.6212 2479.53 2.480 17.14 2144.45 0.0018203 4.3532 2391.52 2.392

275
Figure 9: Shear stress vs horizontal displacement
Table 2: data for JRC and Shear Strength for all samples 1 to 7.
Sample JRC Shear Strength (MPa)
1 10 2.632 2 10 2.563 3 6 2.300 4 7 2.437 5 5 1.867 6 8 2.464 7 4 1.713
18.10 1936.05 0.0017730 3.9302 2216.63 2.217
18.62 1732.90 0.0017475 3.5178 2013.00 2.013 18.79 1632.50 0.0017392 3.3140 1905.45 1.905 19.07 1528.35 0.0017255 3.1026 1798.05 1.798
19.08 1528.00 0.0017250 3.1018 1798.14 1.798

276
Figure 10: Shear strength vs JRC
Conclusion This research shows that the JRC affect the shear strength of granite. Throughout this study, we can say that the effect of roughness on shear behavior of joints in granite are fully understood. Through the lab test on the surface of the samples, the shear strength can be determined. Based on the data obatained by laboratory test, the relationship between surface roughness and shear strength for granite is proven. Analysis of the data showed that the higher the JRC number, the higher the shear strength of the sample granite. This has proven the teory that the higher the roughness of a rock, the higher the shear strength of it. From the graph shear strength versus JRC number, an equation has been obtained that is:
τ = 0.1389 JRC + 1.2837 Equation 5
where,
τ = shear strength
JRC = Joint Roughness Coefficient The above equation can be applied to get the shear strength of granite. References [1] Grasselli, G. (2001). Shear Strength of Rock Joints based on Quantified Surface
Description,Civil Engineering Department, EPF Lausanne, Switzerland.
[2] Reeves, M.J. (1985) . Rock surface roughness and frictional strength, Department of Geological Sciences, University of Saskatchewan, Saskatoon, Saskatchewan, Canada S7N 0WO.
[3] Guangcheng, Z. A.B., MuratKarakus, B.N., HuimingTang, A., YunfengGe, A., LuZhang, A. (2014) , A new method estimating the 2D JointRoughness Coefficient for discontinuity surfaces in rock masses , a Facult of Engineering, China University of Geosciences, Wuhan, China b School ofCivil, Environmental and Mining Engineering, University of Adelaide, Australia .
277
[4] Ildikó Buocz , Determination of rock mechanical properties from direct shear strength testresults carried out on Bátaapáti granitoid rock masses along discontinuities , BME Department ofConstruction Materials and Engineering Geology, e-mail: [email protected].
[5] John Pitts. (2007). A manual of Geology for civil Engineers, Nanyang Technological Institute, Singapore .
[6] Myer, L. R., C. F. Tsang, N. G. W. Cook, and Goodman, R. E. (1995). Fractured and jointed rock masses. Balkema, Rotterdam.
[7] Bandis, S. C., A. C. Lumsden, and Barton, N. R. (1983). "Fundamentals of rock jointdeformation." International Journal of Rock Mechanics and Mining Sciences & GeomechanicsAbstracts. 20: 6. Pergamon.
[8] Haneberg, William, C. (2008). Using close range terrestrial digital photogrammetry for 3-D rockslope modeling and discontinuity mapping in the United States. Bulletin of Engineering Geology and the Environment 67,4: 457-469.
[9] Faure, and Michel, (1999). Tectonics of the Dabieshan (eastern China) and possible exhumation mechanism of ultra high-pressure rocks.Terra Nova 11,6: 251-258.